cognitive neuropsychology diagnosing prosopagnosia ... 09 cn.pdf · cognitive neuropsychology...
TRANSCRIPT

PLEASE SCROLL DOWN FOR ARTICLE
This article was downloaded by: [McKone, Elinor]On: 22 January 2010Access details: Access Details: [subscription number 918662672]Publisher Psychology PressInforma Ltd Registered in England and Wales Registered Number: 1072954 Registered office: Mortimer House, 37-41 Mortimer Street, London W1T 3JH, UK
Cognitive NeuropsychologyPublication details, including instructions for authors and subscription information:http://www.informaworld.com/smpp/title~content=t713659042
Diagnosing prosopagnosia: Effects of ageing, sex, and participant-stimulusethnic match on the Cambridge Face Memory Test and Cambridge FacePerception TestDevin C. Bowles a; Elinor McKone a; Amy Dawel a; Bradley Duchaine b; Romina Palermo ac; LauraSchmalzl c; Davide Rivolta c; C. Ellie Wilson c; Galit Yovel d
a Australian National University, Canberra, Australia b Institute of Cognitive Neuroscience, UniversityCollege London, London, UK c Macquarie Centre for Cognitive Science (MACCS), MacquarieUniversity, Sydney, Australia d Tel Aviv University, Tel Aviv, Israel
First published on: 16 November 2009
To cite this Article Bowles, Devin C., McKone, Elinor, Dawel, Amy, Duchaine, Bradley, Palermo, Romina, Schmalzl,Laura, Rivolta, Davide, Wilson, C. Ellie and Yovel, Galit(2009) 'Diagnosing prosopagnosia: Effects of ageing, sex, andparticipant-stimulus ethnic match on the Cambridge Face Memory Test and Cambridge Face Perception Test', CognitiveNeuropsychology, 26: 5, 423 — 455, First published on: 16 November 2009 (iFirst)To link to this Article: DOI: 10.1080/02643290903343149URL: http://dx.doi.org/10.1080/02643290903343149
Full terms and conditions of use: http://www.informaworld.com/terms-and-conditions-of-access.pdf
This article may be used for research, teaching and private study purposes. Any substantial orsystematic reproduction, re-distribution, re-selling, loan or sub-licensing, systematic supply ordistribution in any form to anyone is expressly forbidden.
The publisher does not give any warranty express or implied or make any representation that the contentswill be complete or accurate or up to date. The accuracy of any instructions, formulae and drug dosesshould be independently verified with primary sources. The publisher shall not be liable for any loss,actions, claims, proceedings, demand or costs or damages whatsoever or howsoever caused arising directlyor indirectly in connection with or arising out of the use of this material.

Diagnosing prosopagnosia: Effects of ageing, sex, andparticipant –stimulus ethnic match on the Cambridge
Face Memory Test and Cambridge Face Perception Test
Devin C. Bowles1, Elinor McKone1, Amy Dawel1, Bradley Duchaine2, Romina Palermo1,3,Laura Schmalzl3, Davide Rivolta3, C. Ellie Wilson3, and Galit Yovel4
1Australian National University, Canberra, Australia; 2Institute of Cognitive Neuroscience, University College London,
London, UK; 3Macquarie Centre for Cognitive Science (MACCS), Macquarie University, Sydney, Australia;4Tel Aviv University, Tel Aviv, Israel
The Cambridge Face Memory Test (CFMT) and Cambridge Face Perception Test (CFPT) haveprovided the first theoretically strong clinical tests for prosopagnosia based on novel rather thanfamous faces. Here, we assess the extent to which norms for these tasks must take into accountageing, sex, and testing country. Data were from Australians aged 18 to 88 years (N ¼ 240 forCFMT; 128 for CFPT) and young adult Israelis (N ¼ 49 for CFMT). Participants were unselectedfor face recognition ability; most were university educated. The diagnosis cut-off for prosopagnosia (2SDs poorer than mean) was affected by age, participant–stimulus ethnic match (within Caucasians),and sex for middle-aged and older adults on the CFPT. We also report internal reliability, correlationbetween face memory and face perception, correlations with intelligence-related measures,correlation with self-report, distribution shape for the CFMT, and prevalence of developmentalprosopagnosia.
Keywords: Prosopagnosia; Face recognition; Ageing; Gender; Other-race effects; Aging.
Prosopagnosia refers to the inability to recognizeand discriminate faces. It has a well-knownacquired form, where an individual who couldpreviously recognize faces loses this ability after
stroke or other brain injury. It also has a morerecently discovered developmental or congenitalform, which can run in families, in whichindividuals with no known history of brain injury
Correspondence should be addressed to Elinor McKone, Department of Psychology, Australian National University, Canberra,
ACT 0200, Australia (E-mail: [email protected])
Supported by the following grants: Australian Research Council DP0450636 and DP0984558 to E.M., Economic and Social
Research Council RES–061–23–0400 to B.D., Australian Research Council Special Research Centre for Cognitive Science and
Cognitive Neuropsychology S0001507 for work at Macquarie Centre for Cognitive Science (MACCS), and Marie Curie IRG
046448 to G.Y. We thank Kate Crookes for assistance in manuscript preparation and Prof Evelyn Teng of the University of
Southern California for providing instructions on administering and scoring the MAT test.
# 2009 Psychology Press, an imprint of the Taylor & Francis Group, an Informa business 423http://www.psypress.com/cogneuropsychology DOI:10.1080/02643290903343149
COGNITIVE NEUROPSYCHOLOGY, 2009, 26 (5), 423–455
Downloaded By: [McKone, Elinor] At: 02:50 22 January 2010

appear never to properly develop the ability to tellfaces apart (e.g., Behrmann, Avidan, Marotta,& Kimchi, 2005; Duchaine, Germine, &Nakayama, 2007a; Schmalzl, Palermo, &Coltheart, 2008). There are no previous data onprevalence rates of developmental prosopagnosiafrom formal behavioural testing, but an estimatefrom self-report questionnaires with follow-upsemistructured interview suggested a surprisinglyhigh prevalence of 2.47% in the general population(N ¼ 687; Kennerknecht et al., 2006). Incombination with the potential for prosopagnosiato be a cause of social anxiety (Yardley,McDermott, Pisarski, Duchaine, & Nakayama,2008), or to be mistaken for other conditionsthat also manifest poor face processing (e.g.,autism spectrum disorder), it is clear that bothclinical neuropsychologists and researchers needaccess to a quick, reliable method of diagnosingprosopagnosia.
Creating a simple test to diagnose prosopagno-sia is not a straightforward task, due to a mixtureof practical and theoretical difficulties. Tests offamous face recognition are theoretically strong,in that these measure an ability similar to everydayface recognition—namely, the ability to identify aperson, in a new image, from many hundreds orthousands of possibilities. However, famous facetests are beset by practical difficulties: Peoplefamous in one testing location can be unknownin another; people famous to one age group canbe unknown to another; people famous at onetime can be merely history even 10 years later;and participants vary in the extent to whichthey have engaged with sources of famouspeople such as popular culture (e.g., film stars)or politics. Thus, although famous face testsshould always be included in a battery to diagnoseprosopagnosia, the only feasible possibility forwidely applicable off-the-shelf neuropsychologicaltests are tasks that assess memory or perceptionfor novel faces.
It is only recently that theoretically valid testsinvolving novel faces have been developed. Twotraditional neuropsychological tests have beenshown to be invalid and in particular to frequentlyfalsely diagnose individuals with prosopagnosia as
normal (Duchaine & Nakayama, 2004, 2006a).The Warrington Recognition Memory for Facestest (Warrington, 1984) allows recognition of“faces” based on clothing and distinctive hairstylesin the images. The Benton Facial Recognition test(Benton, Sivan, Hamsher, Varney, & Spreen,1983) is somewhat better in that it removesclothing and hair from the stimuli and precludesthe most obvious form of image matching byusing different face viewpoints for learningimages (front) and probe images (three-quarter).However, because this test uses simultaneouspresentation of learning and probe images withunlimited presentation duration, unusual strategiescan still support apparently “normal” accuracy offace recognition (e.g., back-and-forth matchingbased purely on eyebrows, Duchaine &Weidenfeld, 2003), and 73% of a group of 19prosopagnosics performed at normal accuracylevels on this task (Duchaine & Nakayama,2004, 2006a).
To overcome these difficulties, the CambridgeFace Memory Test (CFMT; Duchaine &Nakayama, 2006a) and Cambridge FacePerception Test (CFPT; Duchaine et al., 2007a)were developed. The CFMT requires recognitionof 6 learned faces in three stages: recognition ofthe same images; recognition of the same faces indifferent images (different viewpoint and/or light-ing); and recognition of the same faces in differentimages covered with heavy visual noise (seeFigure 1A). The CFPT requires participants, oneach trial, to order a series of faces for similarityto a target face, where the comparison stimulicomprise the target face morphed towards severaldifferent faces by varying degrees (Figure 1B).Both the CFMT and CFPT have been shown tobe able to reliably diagnose prosopagnosia—forexample, people who perform very poorly onfamous faces tests often also perform poorly onthe CFMT and CFPT—and the tasks also showanother theoretically expected laboratory phenom-enon—namely, a large face inversion effect innormal individuals (Duchaine et al., 2007a;Duchaine & Nakayama, 2006a; Duchaine, Yovel,& Nakayama, 2007b). As a result, the tests, par-ticularly the CFMT, have become widely used by
424 COGNITIVE NEUROPSYCHOLOGY, 2009, 26 (5)
BOWLES ET AL.
Downloaded By: [McKone, Elinor] At: 02:50 22 January 2010

face recognition and prosopagnosia researcherssince their publication (e.g., Bate, Haslam, Tree,& Hodgson, 2008; DeGutis, Bentin, Robertson,& D’Esposito, 2007; Herzmann, Danthiir,Schacht, Sommer, & Wilhelm, 2008; Iaria,Bogod, Fox, & Barton, 2009).
Are the original CFMT and CFPT normsappropriate for all participants?
Published control sample data on the CFMT andCFPT come primarily from young adults fromBoston in the United States of America (with
Figure 1. Tasks. A. Examples of study images and test items from the Cambridge Face Memory Test. B. Images from an item in the
Cambridge Face Perception Test. Numbers under each morph image (the frontal shots) indicate the percentage of the target face (shown at
the top in three-quarter view) in the morph. The six frontal shots are initially ordered randomly, and participants sort them based on
similarity to the target image.
COGNITIVE NEUROPSYCHOLOGY, 2009, 26 (5) 425
DIAGNOSING PROSOPAGNOSIA WITH CMFT AND CFPT
Downloaded By: [McKone, Elinor] At: 02:50 22 January 2010

smaller sample sizes available for middle-aged adultswith mixed USA and UK origin). However, broaduse of the CFMT and CFPT—that is, in other agegroups and in other countries—requires access totask norms from appropriate control samples. Thepresent article addresses the question of to whatextent the original norms can be used broadly andto what extent it is necessary to obtain control datafrom groups very closely matched on variables suchas age, sex, and/or exposure to exactly the same“diet” of face types as the potential prosopagnosic.
The first important issue concerns ageing. TheCFMT was originally created with young adultparticipants, and some data have since beenpublished for adults with a mean age up to 46years. As shown in Table 1, results suggest noage-related decline in performance from 20 to 46(Duchaine & Nakayama, 2006a; Duchaine,Yovel, Butterworth, & Nakayama, 2006;Duchaine et al., 2007b; Garrido, Duchaine, &Nakayama, 2008). There has been no systematicinvestigation of older participants, and clearly thisis needed. Studies in the cognitive psychology lit-erature often show that face memory declineswith age (e.g., Adams-Price, 1992; Bastin & Vander Linden, 2003; Lamont, Stewart-Williams, &Podd, 2005; Lindholm, 2005). In addition, theCFMT uses young adult face stimuli, and olderparticipants have poor memory for young adultfaces even when they can be better at older adultfaces (Anastasi & Rhodes, 2005; Lamont et al.,
2005). Age-related decline would also be expectedon the CFPT: Face perception declines with ageon other tasks (e.g., Grady, McIntosh, Horwitz,& Rapoport, 2000; Lott, Haegerstrom-Portnoy,Schneck, & Brabyn, 2005) including specificallycross-view matching of morphs as required by theCFPT (Habak, Wilkinson, & Wilson, 2008); theCFPT again uses young adult faces; the CFPT isa speeded task, and reaction time slows with age;and the CFPT requires use of a computer mouse,and some older participants might be less skilledat mouse usage than younger participants. Asshown in Table 1, previous studies have found avery small increase in mean CFPT error rate withage, but have tested only two groups, with meanages of 33.4 years and 46.5 years (Duchaine et al.,2007a; Garrido et al., 2008).
A second issue concerns sex differences.Predictions here are less clear. On face memorytasks, several studies report that women outper-form men, but one found this only for individualswith lower than average IQ (Herlitz & Yonker,2002), and others have found it only for women’sfaces (Lewin & Herlitz, 2002; McKelvie,Standing, St Jean, & Law, 1993) while theCFMT uses only men’s faces. In the only previousreport for the CFMT, young adult women showeda small but nonsignificant advantage over men(Duchaine & Nakayama, 2006a). Turning to theCFPT, the two previous studies containing normdata did not analyse sex effects; we are also not
Table 1. All information regarding age effects available from previous studies
Age (years) Performance
Task Article M (SD) N Mean SD Cut-off
CFMT Duchaine & Nakayama (2006a) 20.2 (1.8) 50 57.9 7.9 42.1
Garrido, Duchaine, & Nakayama (2008) 33.3 (6.4) 13 58.9 7.4 44.1
Duchaine, Yovel, & Nakayama (2007b)a 45.1 20 59.6 7.6 44.4
Duchaine, Yovel, Butterworth, & Nakayama (2006) 46.5 (7.7) 9 62.8 6.8 49.2
CFPT Garrido, Duchaine, & Nakayama (2008) 33.4 (5.5) 11 35.5 14.6 64.7
Duchaine, Germine, & Nakayama (2007a) 46.5 21 36.7 12.2 61.1
Note: CFMT ¼ Cambridge Face Memory Test. CFPT ¼ Cambridge Face Perception Test. CFMT performance in groups with
mean ages between 20 and 46 years of age, and CFPT performance in groups with mean ages between 33 and 46 years of age
(young adult samples from Boston USA, adults older than 30 years from USA and UK).aThe same control data were also used in Duchaine, Germine, and Nakayama (2007a; a typographical error in that article indicated
the sample size to be 8 rather than 20).
426 COGNITIVE NEUROPSYCHOLOGY, 2009, 26 (5)
BOWLES ET AL.
Downloaded By: [McKone, Elinor] At: 02:50 22 January 2010

aware of any studies using other face perceptiontasks that have tested sex effects.
A third issue concerns ethnic match betweenthe face stimuli and the participants. In the“other-race effect”, memory and perceptual dis-crimination is poorer for faces not of theparticipant’s race than for own-race faces. Thismeans that the CFMT and CFPT—which useCaucasian faces—will of course not be appropriateto diagnose prosopagnosia in, say, an Asian indi-vidual living in Korea, or a Masai individual inKenya. Less well recognized, however, is thatthere may very well also be effects of ethnicityeven within Caucasian faces. Consistent withthis idea, memory for Turkish and German par-ticipants looking at Turkish and German facesshows a pattern of poorer memory for the othergroup (Sporer, 1999); also, Caucasian SouthAfricans show poorer memory for US Caucasianfaces than for South African Caucasian faces(Chiroro, Tredoux, Radaelli, & Meissner, 2008).
Previous young adult norms for the CFMT andCFPT come from participants with ethnic back-ground well matched to the face stimuli: specifi-cally, all from the Boston area in the USA.However, migration patterns from Europe differfor those from Australia and the USA, and sothe typical Caucasian face in Australia is physicallyrather different from the American faces used inthe CFMT and CFPT (see details in Resultsand Discussion). Theoretically, this couldproduce poorer CFMT and CFPT performancein Australians than in Americans, via one of twopossible mechanisms. First, the participant’s“face-space” could be less than ideally tuned forrelatively unfamiliar Caucasian subtypes (cf.Valentine, 1991). Second, social outgroup categor-ization could occur, and Bernstein, Young, andHugenberg (2007) have shown that merely cate-gorizing someone as being in another personalitygroup, or as attending another university (allfaces and participants Caucasian) leads to poorermemory than that for the same faces described asingroup members. These ideas raise the possibility
that country-specific norms might be needed toensure that individuals are not misdiagnosed ashaving prosopagnosia when they do not.
The present study reports CFMT and CFPTdata obtained from the general population of edu-cated individuals unselected for face recognitionability. The primary data set was from CaucasianAustralians (and a few Caucasian NewZealanders)1 and included ages across the adultlifespan, particularly adults older than thosereported in most previous tests (i.e., older than50 years). A further data set, used only for addres-sing effects of country of origin, was from youngadult Israelis. Our interest was in describing thevariance of scores in each group as much as themean performance: This is important because adiagnosis of prosopagnosia normally is madewhen an individual’s performance falls a certainnumber of standard deviations worse than themean (typically, 2 SDs). Our initial researchquestions concerned the effect of ageing, sex, andcountry of origin (Australia vs. Israel vs.America) on diagnosis criteria. Our data alsoallowed us to provide some limited discussion ofthe effects of intelligence-related measures, toperform reliability analyses for the tasks, to askwhether simple participant self-reports accuratelyreflect real ability, to assess the extent to whichface perception and face memory are independentabilities, and to examine prevalence rates of likelyprosopagnosia in the general population usingobjective tests.
Method
Data were collated from two different laboratoriesin Australia and one in Israel and came fromseveral research projects: Data had originallybeen collected as part of studies investigatingother theoretical questions within the normalpopulation, or obtained from participants testedas controls for specific individual prosopagnosics.Most participants had been tested on theCFMT; fewer were also tested on the CFPT.
1 Ethnic background of Caucasian New Zealanders is similar to that of Caucasian Australians.
COGNITIVE NEUROPSYCHOLOGY, 2009, 26 (5) 427
DIAGNOSING PROSOPAGNOSIA WITH CMFT AND CFPT
Downloaded By: [McKone, Elinor] At: 02:50 22 January 2010
All studies involved participants performingadditional cognitive tests in addition to thosereported here.
ParticipantsAustralian samples. These participants were allCaucasian and living in Australia (95.2%) or visit-ing Australia from New Zealand (4.8%). Most hadbeen born in these countries, and all had spent themajority of their lifetime living in them. Weexcluded any participants with known history ofmajor brain injury, or other major disorderslikely to affect face recognition (e.g., 1 participantwith schizophrenia).
Testing laboratories were located in Canberra(N ¼ 192) or Sydney (N ¼ 49). All participantswere unselected as regards face recognitionability. Known relatives of previously diagnosedprosopagnosics were excluded. The extent towhich the participants represented a randomsample of the community varies across the differ-ent original research projects, labelled here asStudies 1–4. Study 1 (Bowles & McKone,Australian National University, ANU,Canberra), which tested young adults (18–30years, N ¼ 37), 55–64-year-olds (N ¼ 25), 65–74-year-olds (N ¼ 30), and 74–88-year-olds (N¼ 15), used general community recruitmentfrom churches, sporting clubs, bridge clubs, andso on and recruited undergraduate students(from the ANU) only to the extent necessary tomatch the relatively high education level of theolder participant groups. Study 2 (Dawel &McKone, ANU), which tested 80 young adults(18–32 years), recruited either from the generalundergraduate population of the ANU or from ahighly academically selected group of ANU“summer scholars” (see Results for more details).Study 3 (Palermo, Schmalzl, Rivolta, & Wilson,Macquarie Centre for Cognitive Science,MACCS, Sydney) recruited 49 participants ofvarious ages on a word-of-mouth basis as controlsfor projects involving testing known prosopagno-sics. Study 4 (Bowles & McKone, ANU) tested ahandful of extra participants in the 43–51 yearsage range (N ¼ 5) using the general proceduresof Study 1 but without testing all the tasks.
Overall, education level of the total sample washigher than that in the general Australian popu-lation: The great majority of the participants(86%) had at least some post-secondary-schooleducation.
ANU participants were paid $10 (those testedin 2006) or $12 (2007). MACCS participantseither volunteered for no financial return or werepaid $15 per hour. All participants were testedindividually in quiet rooms.
Israeli sample. For Study 5, all participants (N ¼49) were Caucasian and living in Israel. Mosthad been born in Israel. All were undergraduatepsychology students, aged 19–31 years (meanage ¼ 22), with a minimum score of 660 on theIsraeli Scholastic Aptitude Test (top 10%). Theyparticipated for course credit.
CFMT and CFPTThe CFMT and CFPT were administered onMacintosh computers following the standardinstructions (Duchaine et al., 2007a; Duchaine &Nakayama, 2006a; Duchaine et al., 2007b).Studies 1, 2, and 4 used a CRT-screen eMacwith a 16-inch monitor running Mac OS X withscreen resolution 1152 � 864, refresh rate 80 Hz,and contrast and brightness maximized.Participants sat a comfortable distance from thescreen (approximately 60 cm) in Study 1; inStudy 2, viewing distance was 90 cm (with chinrest). Study 3 used a 15-inch Macintosh PowerBook G4 running OSX, and participants wereplaced at a distance of approximately 50 cm fromthe computer screen. Study 5 used a 17-inchCRT monitor connected to a PC runningWindows XP, with a viewing distance of 45 cmcontrolled by a chin rest. (Note that face recog-nition is insensitive to changes in face stimulussize across the range created by these small differ-ences in viewing distance; Loftus & Harley, 2005;McKone, 2009.)
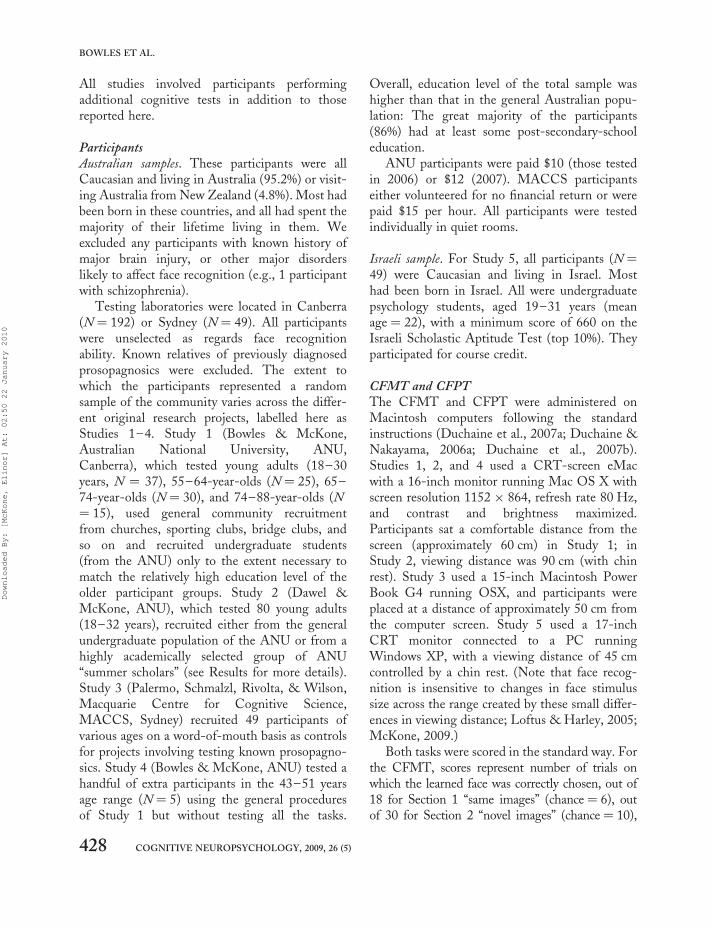
Both tasks were scored in the standard way. Forthe CFMT, scores represent number of trials onwhich the learned face was correctly chosen, out of18 for Section 1 “same images” (chance¼ 6), outof 30 for Section 2 “novel images” (chance ¼ 10),
428 COGNITIVE NEUROPSYCHOLOGY, 2009, 26 (5)
BOWLES ET AL.
Downloaded By: [McKone, Elinor] At: 02:50 22 January 2010

out of 24 for Section 3 “novel images withnoise” (chance ¼ 8), and out of 72 for the totalsummed score (chance ¼ 24). All CFMT scoresreported here (CFMT1, CFMT2, CFMT3,CFMTtotal) are for the upright version of thetest. On the CFMT, a higher score equalsbetter performance.
For the CFPT, participants sort the 6 test facesfrom most like to least like the target face. For eachtrial, the final sorted order is scored by summingthe deviations from the correct order (e.g., if aface is five places away from its proper place, itcontributes 5 to the score). Each of 8 target facesis used on two trials, one with all faces upright(CFPTupright), the other with all faces inverted(CFPTinverted). In each orientation, a perfectscore is zero, and chance is 93.3 errors. On theCFPT, a higher score equals poorer performance.
Self-rated face recognition abilityIn Studies 1 and 2, participants were asked to ratetheir ability to recognize faces in everyday life“compared to the average person”, when theywere close enough to see people clearly (0 ¼much worse than average; 5 ¼ average; 10 ¼much better than average). The experimenterspecified that this meant how well the participantrecognized faces as familiar, and did not mean howwell the participant remembered people’s names.Older participants in Study 1 were also asked torate their face recognition ability at present com-pared to when they were 30 years (0 ¼ muchworse now than when they were 30; 5 ¼ equal towhen they were 30; 10 ¼ much better now thanwhen they were 30).
Visual acuity at computer-viewing distancesAll participants were tested wearing their usualoptical correction. Participants in Study 1 wereasked to confirm that they could focus withoutseeing blur both on a finger held up at 30 cmand on the computer screen. No participantreported any difficulty with focus at these dis-tances. In Studies 2 and 4, normal visual acuity(i.e., the equivalent of 20/20 vision) was verifiedat 50 cm and 3 m using Snellen charts. In Study 3,some participants (N ¼ 5) were tested on a
contrast sensitivity test (Functional AcuityContrast Test, FACT—Vision Sciences ResearchCorporation, 2002) and had normal performance.
Mental Alternation Test (MAT)Participants in Study 1 (i.e., including themajority of participants older than 55 years)were tested on the MAT, which provides aquick and fairly reliable method of screening par-ticipants for dementia ( Jones, Teng, Folstein, &Harrison, 1993). In the MAT, participantsproduce aloud alternating numbers and letters ofthe alphabet, starting from 1 and A: that is, “1,A, 2, B, 3, C, 4, . . . ”. Progression from the lastletter or number to the next number or letter iscounted as one alternation, and participants have30 s to produce as many alternations as possible.Participants were informed of the 30-s timelimit and were encouraged to work quickly butaccurately. Consistent with previous findings(Sliwinski, 1997), MAT performance decreasedwith age, most noticeably between the youngadult group and the 55–64-year-old group.Mean number of alternations was: youngadults ¼ 31.1; 55–64-year-olds ¼ 26.8; 65–74-year-olds ¼ 25.3; 75–88-year-olds ¼ 25.1. Scoresbelow 15 are indicative of probable cognitiveimpairment (e.g., arising from age-related demen-tia, although note low scores can also arise fromother factors such as stuttering), as demonstratedvia comparison to more complete tests such asthe Mini-Mental State Examination andTrailmaking Test Part B (Billick, Siedenburg,Burgert, & Bruni-Solhkhah, 2001; Jones et al.,1993; Salib & McCarthy, 2002). Proportion ofMAT-tested participants falling below a score of15 was: young adults ¼ 2.8% (N ¼ 1); 55–64-year-olds ¼ 12.0%; 65–74-year-olds ¼ 10.3%;75–88-year-olds ¼ 13.3%.
Computer mouse testThe CFPT relies on skilled computer mouseusage. Participants in Study 1 (i.e., includingmost of the participants older than 55 years)were asked to rate their mouse skill from 1–5.They were not tested on the CFPT if they ratedthemselves as 1 (had never used a computer
COGNITIVE NEUROPSYCHOLOGY, 2009, 26 (5) 429
DIAGNOSING PROSOPAGNOSIA WITH CMFT AND CFPT
Downloaded By: [McKone, Elinor] At: 02:50 22 January 2010

mouse before) or 2 (had little experience withmouse use and were apprehensive of it).Remaining Study 1 participants were tested onthe CFPT and were also given an objectivemouse test that measured time taken to sequen-tially click 11 numbered boxes scattered aroundthe screen. As expected, mean completion timeincreased with age (young adults ¼ 13.9 s; 55–64-year-olds ¼ 18.3 s; 65–74-year-olds ¼ 21.5 s;75–88-year-olds ¼ 23.3 s).
Results and discussion
Our first set of analyses—examining the effectsof age, sex, and country of origin (and alsointelligence-related variables, which are of rel-evance to interpreting the country of origineffects)—were derived from “control” or “norm”participants. Importantly, these excluded 5 indi-viduals whose scores indicated that in factthey had probable prosopagnosia (see latersection “Prevalence of prosopagnosia in anunselected educated Australian sample” for detailedrationale).
Throughout, the CFMT scores represent accu-racy, and thus cut-off scores for prosopagnosiadiagnosis are 2 standard deviations lower thanthe mean. The CFPT scores represent error rate,and so the cut-off scores are 2 standard deviationshigher than the mean. Also note that, throughout,CFMT and CFPT scores are presented on theiroriginal scales (i.e., number correct out of 72 forCFMT; number of errors up to chance scoreof 93.3 for CFPT), rather than having beenconverted to percentages.
No effect of the different Australian sample groupsBefore proceeding to the analyses of interest, itwas important to demonstrate that there wereno differences between the three mainAustralian sample groups. This was done in twoways. First, scores for the CFMT were availablefor two sets of young adults, from Study 1 andStudy 2, and we confirmed that these twogroups did not differ in CFMT scores, on eitherthe mean (CFMTtotal score: Study 1 ¼ 54.6,Study 2 ¼ 55.3), t(113) ¼ 0.286, p ..7, or the
standard deviation (Study 1 ¼ 9.4; Study 2 ¼8.3, Levene’s test for equality of variances, F ,
1). Second, to allow comparison of all fourAustralian samples, Figure 2 shows a scatterplotof age against CFMTtotal and CFPTuprightscores with individuals (excluding the identifiedprosopagnosics) colour coded by the study inwhich they were tested. Taking into account thegeneral age trend, the individuals from the threedifferent samples overlapped nicely: In particular,it was not the case that the participants fromSydney (Study 3) had higher or lower perform-ance than the participants from Canberra(Studies 1, 2, 4).
Ageing: Australian sampleCambridge Face Memory Test. Figure 3A shows ascatterplot of age against CFMTtotal score,including all participants (aged 18–88 years).Table 2 gives group means for five age groups inwhich we had reasonable numbers of participants:young adults (18–35 years), early middle age (36–49 years), and then decades for participants in their50s, 60s, and 70s (note the 8 participants in their80s do not appear in the table). In Figure 3Aand Table 2, participants are included regardlessof Mental Alternation Test (MAT) scores. Wedid not initially remove participants with lowMAT scores because age-related decline ingeneral cognitive functioning is a typical featureof the normal population against which prosopag-nosia must be diagnosed. However, where clini-cians and researchers are testing an olderpotential prosopagnosic who clearly does notsuffer from dementia, norms derived from a popu-lation excluding individuals with MAT scores lessthan 15 may be considered more useful. Thisinformation is provided in Table 3. Results showno evidence that scores for diagnosing prosopag-nosia were affected by whether an MAT exclusionwas (Table 3) or was not (Table 2) applied(if anything, in fact, the tendency was forslightly poorer performance when participantswith poor MAT scores were excluded than inthe full sample, i.e., a trend in the reversedirection to that which would be predicted ifMAT mattered). Therefore, reported statistical
430 COGNITIVE NEUROPSYCHOLOGY, 2009, 26 (5)
BOWLES ET AL.
Downloaded By: [McKone, Elinor] At: 02:50 22 January 2010

analysis was conducted using all participants(excluding the prosopagnosics).2 All tests weretwo-tailed.
Very noticeable age-related decline was appar-ent on the CFMT. Considering CMFTtotalscores, analysis of variance (ANOVA) showed astrong difference in mean performance across thefive age groups, F(4, 223) ¼ 9.749, MSE ¼73.354, p , .001, and there was no change in var-iance: Levene’s test for equality of variances, F(4,223) ¼ 1.052, p ..3. To address when age-related decline begins, we compared the youngadult group to successively older comparisongroups. The early middle-age group (36–49years) showed no change in mean performancerelative to young adults, t(143) ¼ 0.114, p . .9.However, participants in their 50s (50–59 years)already showed significantly poorer meanperformance than young adults, t(146) ¼ 2.456,
p , .02, suggesting that age-related declinebegins at approximately 50 years of age.
We also fitted age-related curves to theCFMTtotal scores from all individuals, as shownin Figure 3A. This procedure had two aims.First, it provided further information regardingthe starting point of age-related decline. Second,it allowed us to calculate the best estimate ofprosopagnosia cut-offs: Given that there was nochange in variance of CFMTtotal scores acrossage groups (see Levene’s test above), the mostreliable method of estimating the diagnosiscut-off comes from providing a formula for theestimated mean at any given age together withan average measure of the standard deviationderived from the entire sample.
Fit results were as follows. A linear-only fitexplained significant variance (R2¼ .151, p , .001,df ¼ 234) but, importantly, a second-order
Figure 2. (A) Cambridge Face Memory Test (CFMT) and (B) Cambridge Face Perception Test (CFPT) scores from our Australian samples,
showing no apparent effect of the study in which participants were tested; in particular, taking into account the age trend, it was not the case
that participants from Sydney (Study 3) performed either better or worse than participants from Canberra (Studies 1, 2, 4). We recommend
readers view this figure in colour: please see the online issue of the Journal.
2 Statistical results with the MAT exclusion applied did not differ in any important ways from those reported.
COGNITIVE NEUROPSYCHOLOGY, 2009, 26 (5) 431
DIAGNOSING PROSOPAGNOSIA WITH CMFT AND CFPT
Downloaded By: [McKone, Elinor] At: 02:50 22 January 2010

Figure 3. (A) and (B). Scatterplots of exact age against total correct for the Cambridge Face Memory Test (CFMT, upright faces), and
Cambridge Face Perception Test (CFPT) errors for upright face trials, in the present data set. Most individuals are shown as black
circles; the 5 individuals diagnosed with prosopagnosia are shown as squares (only 4 of these were tested on the CFPT). The curve fits
show the best fitting second-order polynomial relating age to the relevant performance measure; the individuals with prosopagnosia were
excluded from the data used for fitting. (C) CFMT (upright faces) for all individuals (N ¼ 22) under 55 years previously reported as
part of norm groups (in Duchaine, Yovel, Butterworth, & Nakayama, 2006; Duchaine, Yovel, & Nakayama, 2007b; Garrido et al.,
2008), plus the mean and standard deviation (shown as filled circle and error bar) for 50 young adults with mean age 20.2 years (from
Duchaine & Nakayama, 2006a). (D) CFPT upright face trials for all individuals (N ¼ 23) under 55 years previously reported as part
of norm groups (in Duchaine, Germine, & Nakayama, 2007a; Garrido et al., 2008). In C and D, curve fits are linear because a second-
order polynomial did not improve the fit. We recommend readers view this figure in colour: please see the online issue of the Journal.
432 COGNITIVE NEUROPSYCHOLOGY, 2009, 26 (5)
BOWLES ET AL.
Downloaded By: [McKone, Elinor] At: 02:50 22 January 2010

polynomial function significantly improved the fit(R2 ¼ .184, significance of R2-change p , .005, df¼ 233). A third-order polynomial produced nofurther improvement (R2 ¼ .186; significance ofR2-change p . .5, df ¼ 232). The second-orderpolynomial fit is shown in Figure 3A. The func-tion describing the relationship between age andCFMT was:
CFMT;¼� :0056353 age2 þ :35142 age
þ 50:288
Examining this function visually in Figure 3Asuggests that CFMT total remained stable acrossearly middle age, but began to decline noticeablyat approximately 50 years of age. This is consistentwith our earlier group-based analysis. The lack ofage-related decline before late middle age is alsoconsistent with results of previous studies, whichhave presented data for groups up to mean agesof 46.5 years (see Table 1; Figure 3C also providesa scatterplot of all unique participants in the
studies summarized in Table 1 who were agedunder 55, given that some individuals had beenincluded as part of norm samples in more thanone of the original articles).
From the best fit curve, we then calculated theresidual for each participant (i.e., the differencebetween their score and the estimated score fortheir age in years). The standard deviation ofthese residuals was:
CFMT SD of residuals ¼ 8:4785
This value provides the most reliable estimate ofthe standard deviation of CFMTtotal scores andthe most reliable method of determining a cut-off score for prosopagnosia diagnosis. To do so,one takes the predicted value for a given agefrom the age-function of best fit, then calculates2 standard deviations below this predicted valueas the diagnosis cut-off. Below, we provide anexample of calculating the cut-off, and also the zscore, for an imaginary participant with an age of
Table 2. Ageing effects: Control scores for educated Australians on CFMT and CFPT with no Mental Alternation Test exclusion applied
Age group (years)
Young adult
(18–35)
Early middle age
(36–49) 50–59 60–69 70–79
N M SD N M SD N M SD N M SD N M SD
CFMT1 124 17.7 0.7 21 17.9 0.5 24 17.8 0.5 37 17.2 1.5 22 16.2 1.8
CFMT2 124 22.5 4.9 21 22.5 4.9 24 19.8 4.8 37 20.5 4.8 22 17.3 4.1
CFMT3 124 15.2 4 21 15.3 4.9 24 13.1 4.7 37 12.8 4.2 22 10.9 3.5
CFMTtotal 124 55.4 8.5 21 55.6 9.3 24 50.7 9 37 50.5 8.7 22 44.4 7
CFPTupright 36 32.4 9.4 15 36.3 13 19 43.1 11.3 31 45.7 13.4 21 57.4 15.5
CFPTinverted 36 61.4 13.2 15 66 9.9 19 68.2 13.7 31 70.2 12.1 21 79.7 12.9
CFPT inversion effect 36 29 13.2 15 29.7 14.7 19 25.2 14.3 31 24.5 15.2 21 22.3 16.2
Note: CFMT ¼ Cambridge Face Memory Test; CFPT ¼ Cambridge Face Perception Test. Control scores as a function of age
group, showing upright-face results for the CFMT (CFMT1 ¼ same images stage; CFMT2 ¼ novel images stage; CFMT3 ¼
novel images with noise stage; CFMTtotal ¼ total summed CFMT score), plus CFPT results for upright faces, inverted faces,
and the inversion effect on the CFPT (i.e., inverted minus upright). Scale range for accuracy on CFMTtotal is from chance ¼
24 to scale maximum ¼ 72; scale range for errors on CFPTupright is from scale minimum ¼ 0 to chance ¼ 93.3. For the
CFPT, a higher number equals poorer performance, so cut-offs for prosopagnosia diagnosis would be calculated as 2 standard devi-
ations above the mean. Cut-offs for individual age groups are not provided in this table because the most accurate way to calculate
the cut-off for a given age is to use the second-order polynomial fit in conjunction with the standard deviations of the residuals of
that fit (see main text for details).
COGNITIVE NEUROPSYCHOLOGY, 2009, 26 (5) 433
DIAGNOSING PROSOPAGNOSIA WITH CMFT AND CFPT
Downloaded By: [McKone, Elinor] At: 02:50 22 January 2010

54 years and a CFMT score of 37:
age ¼ 54years; actual CFMT score ¼ 37
estimated CFMTscore ¼ �:005635�542þ :3514
�54þ50:29 ¼ 52:832
diagnosis cut-off ¼ estimated CFMT score�2
�SD ¼ 52:832�2�8:4785 ¼ 35:875
z score ¼ (actual CFMT score� estimated
CFMT score)=SD
¼ (37:000�52:832)=8:4785 ¼ �1:87
NB. To obtain z score correct to 2 decimal places,it is necessary to begin with 5 significant figures inparameter estimates. This participant would not bediagnosed as prosopagnosic.
Finally, we used the curve fit and associatedstandard deviation to make concrete the impor-tance of taking into account age effects whenmaking prosopagnosia diagnoses. Table 4 indi-cates the number and percentage of the entiresample who would be diagnosed as having proso-pagnosia based on (a) performance 2 standarddeviations poorer than their own age, and (b) per-formance 2 standard deviations poorer than a 21-year-old. Results indicate that, were researchersand clinicians to ignore the ageing effects and inap-propriately use the young adult norms for all age
groups, this would have resulted in 11 older individ-uals in our sample falsely diagnosed as having proso-pagnosia (out of a total N of 112 individuals aged35–88 years tested on the CFMT), with apparentprosopagnosia rates reaching as high as 22% of thepopulation in the 70–88 years age range.
Cambridge Face Perception Test. The effects ofageing on the CFPT were even more dramaticthan those on the CFMT. Tables 2 (no MATexclusion applied) and 3 (MAT exclusionapplied) give CFPT results by age group, forupright faces, inverted faces, and the inversioneffect (i.e., difference between upright andinverted). Figure 3B shows the full scatterplot ofall participants against age, for CFPTupright.Note upright faces is the relevant orientation fordiagnosing prosopagnosia.
Comparing the five age groups, ANOVArevealed a highly significant effect of age onmean performance, F(4, 117) ¼ 15.111, MSE ¼153.295, p , .001, and there was no changein variance, Levene’s test: F(4, 117) ¼ 1.763, p .
.1. The t tests contrasting young adults to succes-sively older age groups revealed no significantchange in mean performance between youngadults and early middle age (35–49), t(49) ¼1.199, p . .2. As with the CFMT, however,even participants in their 50s (50–59) performed
Table 3. Ageing effects: Control scores for educated Australians on CFMT and CFPT with Mental Alternation Test exclusion applied
Age group (years)
Young adult
(18–35) 50–59 60–69 70–79
N M SD N M SD N M SD N M SD
CFMT1 35 17.8 0.5 10 17.8 0.6 25 17 1.7 19 15.9 1.8
CFMT2 35 22 5.3 10 18.5 4.4 25 19.6 4.9 19 17.3 4
CFMT3 35 14.9 4.6 10 12.7 3.7 25 12.2 3.9 19 10.4 3.1
CFMTtotal 35 54.8 9.5 10 49 7.3 25 48.8 8.8 19 43.6 6.4
CFPTupright 29 31.4 9.1 10 47.8 9.6 23 44.1 14.1 18 58.2 16.5
CFPTinverted 29 59.8 13.1 10 71.2 16.1 23 71.4 12.8 18 80 13.9
CFPT inversion effect 29 28.4 13.3 10 23.4 14.6 23 27.3 14.7 18 21.8 17.1
Note: CFMT ¼ Cambridge Face Memory Test; CFPT ¼ Cambridge Face Perception Test. Participants for whom the Mental
Alternation Test was not measured do not appear in this table.
434 COGNITIVE NEUROPSYCHOLOGY, 2009, 26 (5)
BOWLES ET AL.
Downloaded By: [McKone, Elinor] At: 02:50 22 January 2010

significantly more poorly (i.e., made a highernumber of CFPT errors) than young adults,t(53) ¼ 3.733, p , .001.
When curves were fitted to the scatterplot of ageagainst CFPTupright (Figure 3B), a linear-only fitexplained significant variance (R2 ¼ .334, p ,
.001, df ¼ 123) but a second-order polynomial fitwas significantly better (R2 ¼ .379, significance ofR2-change p , .005, df ¼ 122), and a third-orderpolynomial produced no further improvement(R2 ¼ .380, p . .6, df ¼ 121). The formula forthe best fitting second-order polynomial was:
CFPTupright ¼ 0:010953 age2 � :59044 age
þ 40:260
and the standard deviation of the residuals was:
CFPTupright SD of residuals ¼ 12:143:
Examining this function visually (Figure 3B) indi-cated that age-related decline in performance (i.e.,increase in the CFPT error score) had begun byage 50. Indeed, there are reasons to suggest thatperhaps decline might begin even earlier: Inaddition to Figure 3B’s suggestion of decline inearly middle age, a scatterplot of CFPT data fromprevious studies (Figure 3D; also see Table 1)shows the same tendency. Combining the scoresfrom participants in Figures 3B and 3D to increase
sample size indicated not only a significant increasein CFPT scores across the 30–55 age range (r ¼.306, N ¼ 47, p ¼ .036), but also some suggestionof an increase even across the 30–50 age range (r¼ .257, N ¼ 38, p ¼ .119). Note that earlierdecline on the CFPT than the CFMT is theoreti-cally feasible due to the fact that the CFPT is aspeeded task, and reaction time is slower even in40-year-olds than in 20-year-olds (e.g., Anstey,Dear, Christensen, & Jorm, 2005).
Regarding diagnosis cut-offs, three findingsemerged. First, the effects of ignoring age andinappropriately using young adult norms for diag-nosis would be even more detrimental for theCFPT than for the CFMT. As Table 4 shows,using 21-year-old norms for all participantswould result in 27 extra false diagnoses of proso-pagnosia (out of a total N of 89 participants inthe 35–88 years age range), and apparent proso-pagnosia rates would reach as high as 60% in the70–88 years age group.
Second, at least in this Australian sample, theCFPT is unsuitable for diagnosis in individualsover the age of approximately 80 years. Thecut-off score for diagnosis in an 85-year-oldreaches chance (cut-off ¼ 93.5, chance ¼ 93.3).Although individual scores may be poorer thanchance, such scores cannot be taken to be a mean-ingful indication of face perception ability. Also,the cut-off score at 80 years (87.4) is closeenough to chance to mean there is little room for
Table 4. Ageing effects on rates of “prosopagnosia” diagnosis
CFMT total CFPT upright
Compared to
own age
Compared to 21
yrs
Compared to
own age Compared to 21 yrs
Age group (years) N % N % N % N %
18–35 3 2.4 3 2.4 1 2.7 1 2.7
36–49 0 0 0 0 1 6.7 2 13.3
50–59 1 4.0 4 16.0 1 5.0 2 10.0
60–69 0 0 4 10.8 1 3.2 7 22.6
70þ 1 3.2 7 22.6 2 8.0 15 60.0
Note: CFMT ¼ Cambridge Face Memory Test; CFPT ¼ Cambridge Face Perception Test. For CMFT and CFPT, table shows
number of individuals (and percentage relative to number tested in each age group) defined to have prosopagnosia (performance
more than 2 SDs poorer than mean) based on their own age norm versus a 21-year-old norm.
COGNITIVE NEUROPSYCHOLOGY, 2009, 26 (5) 435
DIAGNOSING PROSOPAGNOSIA WITH CMFT AND CFPT
Downloaded By: [McKone, Elinor] At: 02:50 22 January 2010

a participant to produce a score reliably worse thancut-off. Note, however, that at 75 years the cut-off(81.9) is clearly better than chance meaning thatthe test is still useful at this age.
Third, it seems that for the CFPT (much moreso than for the CFMT), estimates of the standarddeviation of particular groups, and thus the diag-nosis cut-off for that group, are quite unreliablewith Ns of 15–36 in the control sample. This isshown in both Table 2 (present Australiansample) and Table 1 (previous studies), wherestandard deviation for the CFPT varies quitenoticeably and apparently randomly acrossgroups. This information is of practical impor-tance because currently, in the absence of largepublished norm samples covering all ages, it isnot uncommon for researchers testing a suspectedprosopagnosic to test an age-matched controlgroup of only 10–30 participants against whichdiagnosis is made, particularly where the targetindividual is not a young adult. Our results thusargue that, for the CFPT, this procedure is likelyto produce quite unreliable diagnoses, unless theparticipant is clearly very far from the cut-off(e.g., z , –3).
We now turn briefly to the CFPT results forinverted faces (CFPTinverted). As with uprightfaces, performance progressively worsened withage in a nonlinear fashion (see Table 2).Regression revealed both a linear effect of age(R2 ¼ .198, df ¼ 123, p , .001) and an improve-ment in fit with adding a quadratic component(R2 ¼ .227; R2-change ¼ .028, df ¼ 122, p ¼.036). The equation for the best fitting second-order polynomial was:
CFPTinverted ¼ :00799246 age2 � :44298 age
þ 67:506
with a standard deviation of the residuals of:
CFPTinverted SD of residuals ¼ 12:351:
Finally, the size of the inversion effect—the amountby which inverted performance was poorer thanupright—did not change with age: When
participants older than 75 years were excluded(due to mean inverted performance approachingchance), there was no linear (p ¼ .116) or non-linear (p ¼ .908) effect of age. By taking themean and standard deviation of the scores for allparticipants aged 75 or younger (N ¼ 118), wethen obtained:
CFPT inversion effect: M ¼ 26:432; SD¼ 14:414
This confirms the theoretically expected presenceof a large inversion effect on the CFPT and more-over argues that holistic processing (as is associatedwith large inversion effects for faces, e.g., forreview see Robbins & McKone, 2007) does notweaken with age.
Ageing: Implications for diagnosis. Both CFMT andCFPT were strongly affected by ageing. For theCFMT, results imply that young adult norms canbe used for diagnosing prosopagnosia only up untilapproximately 50 years of age, and that age-specificnorms are required from 50 years onwards. For theCFPT, results clearly indicate a need to use age-specific norms beyond 50 years; however, they alsosuggest some caution about using young adultnorms even for early-middle-aged participants(e.g., 35–49), given the suggestion of some smalldecline even over this age range. This implies that,for example, if only young adult norms were avail-able, and a 45-year-old participant produced a zscore relative to these norms only just outside thenormal range (e.g., z ¼ –2.1), then a diagnosis ofprosopagnosic-level performance should be con-sidered with caution.
In other findings, we also found that (a) theCFPT cannot be used to diagnose prosopagnosiain Australian individuals of 80 years or older due tofloor effects, (b) caution should be applied to inter-preting CFPT scores within several points eitherside of the notional cut-off value if a norm samplefor a group is relatively small (e.g., in the 15–30 par-ticipants range), and (c) the size of the inversioneffect on the CFPT does not change with age.
Finally, given that we found no change in var-iance with age on either the CFMT or the CFPT,our results argue that for both tasks, if resources
436 COGNITIVE NEUROPSYCHOLOGY, 2009, 26 (5)
BOWLES ET AL.
Downloaded By: [McKone, Elinor] At: 02:50 22 January 2010

are not available to test a large control sample (e.g.,50þ) of a single age group, then a reliable estimateof the standard deviation (and thus diagnosis cut-offs) can alternatively be determined from a largesample distributed across age using the curve-fitting procedures we have outlined here.
Sex: Australian sampleBefore analysing the effects of sex, we testedwhether sex interacted with ageing. Breakingthe data into the five age groups used in theprevious section, two-way ANOVAs revealedno interaction between sex and age group foreither the CFMT, F(4, 218) , 1, MSE ¼72.606, p . .9, or the CFPT, F(4, 112) ¼ 1.183,MSE ¼ 149.75, p . .3.
Cambridge Face Memory Test. In the one previousstudy reporting sex effects on norms for theCFMT, Duchaine and Nakayama (2006a) foundthat, in their sample of 50 young adults, womenshowed a small 2.5-point advantage over menin mean performance (male M ¼ 56.4, female
M ¼ 58.9). This difference was not statisticallysignificant. Also, given that the women showeda slightly larger standard deviation (male SD ¼7.3, female SD ¼ 8.3), the cut-off score forprosopagnosia was very similar for each sex(male cut-off ¼ 41.8, female cut-off ¼ 42.3).
In our sample of 124 Australian young adults(51 male and 73 female), an almost identicalpattern emerged. Young adult women showed a2.7-point advantage over men in meanCFMTtotal performance (male M ¼ 53.8,female M ¼ 56.5), a difference that onlyapproached significance, t(122) ¼ 1.414, p ¼.081. In combination with a slightly larger stan-dard deviation for females (male SD ¼ 8.0,female SD ¼ 8.9; Levene’s test for differences invariances F , 1, p . .4), there was again verylittle sex difference in diagnosis cut-off for proso-pagnosia (male cut-off ¼ 37.8, female cut-off ¼38.7) for young adults.
Figure 4A shows a scatterplot with separatesecond-order polynomial curve fit for males andfemales. The curve fit results for males (N ¼ 96)
Figure 4. (A) Cambridge Face Memory Test (CFMT) and (B) Cambridge Face Perception Test (CFPT) scores from our Australian sample
with separate curve fits for males (black) and females (red). Data from the 5 prosopagnosics were not used for the fits. We recommend readers
view this figure in colour: please see the online issue of the Journal.
COGNITIVE NEUROPSYCHOLOGY, 2009, 26 (5) 437
DIAGNOSING PROSOPAGNOSIA WITH CMFT AND CFPT
Downloaded By: [McKone, Elinor] At: 02:50 22 January 2010
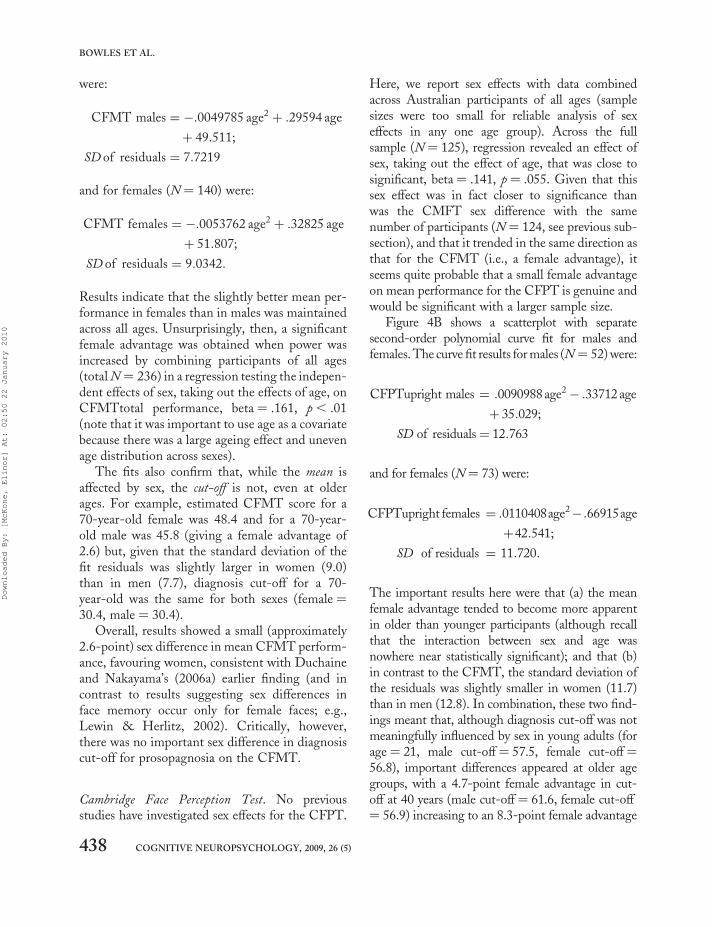
were:
CFMT males ¼ �:0049785 age2 þ :29594 age
þ 49:511;
SD of residuals ¼ 7:7219
and for females (N ¼ 140) were:
CFMT females ¼ �:0053762 age2 þ :32825 age
þ 51:807;
SD of residuals ¼ 9:0342:
Results indicate that the slightly better mean per-formance in females than in males was maintainedacross all ages. Unsurprisingly, then, a significantfemale advantage was obtained when power wasincreased by combining participants of all ages(total N ¼ 236) in a regression testing the indepen-dent effects of sex, taking out the effects of age, onCFMTtotal performance, beta ¼ .161, p , .01(note that it was important to use age as a covariatebecause there was a large ageing effect and unevenage distribution across sexes).
The fits also confirm that, while the mean isaffected by sex, the cut-off is not, even at olderages. For example, estimated CFMT score for a70-year-old female was 48.4 and for a 70-year-old male was 45.8 (giving a female advantage of2.6) but, given that the standard deviation of thefit residuals was slightly larger in women (9.0)than in men (7.7), diagnosis cut-off for a 70-year-old was the same for both sexes (female ¼30.4, male ¼ 30.4).
Overall, results showed a small (approximately2.6-point) sex difference in mean CFMT perform-ance, favouring women, consistent with Duchaineand Nakayama’s (2006a) earlier finding (and incontrast to results suggesting sex differences inface memory occur only for female faces; e.g.,Lewin & Herlitz, 2002). Critically, however,there was no important sex difference in diagnosiscut-off for prosopagnosia on the CFMT.
Cambridge Face Perception Test. No previousstudies have investigated sex effects for the CFPT.
Here, we report sex effects with data combinedacross Australian participants of all ages (samplesizes were too small for reliable analysis of sexeffects in any one age group). Across the fullsample (N ¼ 125), regression revealed an effect ofsex, taking out the effect of age, that was close tosignificant, beta¼ .141, p ¼ .055. Given that thissex effect was in fact closer to significance thanwas the CMFT sex difference with the samenumber of participants (N ¼ 124, see previous sub-section), and that it trended in the same direction asthat for the CFMT (i.e., a female advantage), itseems quite probable that a small female advantageon mean performance for the CFPT is genuine andwould be significant with a larger sample size.
Figure 4B shows a scatterplot with separatesecond-order polynomial curve fit for males andfemales. The curve fit results for males (N ¼ 52) were:
CFPTupright males ¼ :0090988 age2� :33712 age
þ 35:029;
SD of residuals¼ 12:763
and for females (N¼ 73) were:
CFPTupright females ¼ :0110408age2� :66915age
þ42:541;
SD of residuals ¼ 11:720:
The important results here were that (a) the meanfemale advantage tended to become more apparentin older than younger participants (although recallthat the interaction between sex and age wasnowhere near statistically significant); and that (b)in contrast to the CFMT, the standard deviation ofthe residuals was slightly smaller in women (11.7)than in men (12.8). In combination, these two find-ings meant that, although diagnosis cut-off was notmeaningfully influenced by sex in young adults (forage¼ 21, male cut-off ¼ 57.5, female cut-off¼56.8), important differences appeared at older agegroups, with a 4.7-point female advantage in cut-off at 40 years (male cut-off¼ 61.6, female cut-off¼ 56.9) increasing to an 8.3-point female advantage
438 COGNITIVE NEUROPSYCHOLOGY, 2009, 26 (5)
BOWLES ET AL.
Downloaded By: [McKone, Elinor] At: 02:50 22 January 2010

in cut-off at 70 years (male cut-off ¼ 81.5, femalecut-off ¼ 73.2).
Overall, our data suggested that there may well bea small mean advantage to females on the CFPT,and that diagnosis cut-off needs to take sex intoaccount in middle-aged and older participants.
Sex: Implications for diagnosis. For mean task per-formance, results demonstrate a small but consist-ent female advantage on the CFMT and suggest asimilar small female advantage being present onthe CFPT. Regarding the cut-off for prosopagno-sia diagnosis, the results differ for the two tasks.
On the CFMT, women had better mean per-formance but also tended to have slightly highervariability. Thus, although the results demonstratea small significant sex difference in face memory,they imply that, where the aim is to diagnose pro-sopagnosia on the basis of a cut-off of 2 standarddeviations poorer than the mean, sex can safelybe ignored. That is, potential prosopagnosics canbe CFMT compared to norms derived frommixed-sex samples, and there is no need todevelop control samples matched to the sex ofthe individual in question.
For the CFPT, in contrast, women’s smallmean advantage over men was combined withslightly lower variability. This produced noticeablesex differences in prosopagnosia cut-off in middle-aged and older participants. Thus, for the CFPT,it appears that, in participants who are older thanapproximately 35 years, it is necessary to usecontrol samples matched to the sex of a potentialprosopagnosic.
Measures related to general intelligence: AustraliansampleNo published studies have addressed whetherCMFT and CFPT performances are associatedwith general intelligence or interrelated constructssuch as academic ability or education level. Evenregarding other tests of face recognition, thereare no published results for the correlation
between face processing and full-scale IQ.Herlitz and Yonker (2002) found that estimatedIQ (partial Wechsler Adult Intelligence Scale–Revised, WAIS–R, score) was independent offace memory for novel faces in women (r ¼.001). There was a correlation in men (r ¼ .42),which appeared to come primarily from lower-than-average-IQ groups (i.e., 60–80 IQ and 81–100 IQ men performed more poorly than allother IQ/sex groups). Dobson and Rust (1994)reported that face memory was substantiallypoorer in teenagers with mental retardation(mean IQ ¼ 64.5) than in age-matched controls.A conference abstract has reported no associationbetween face recognition and normal-range intel-ligence assessed via the Cattell Culture Fair Test(Jeffery & Anderson, 2004). Overall, theseresults suggest that, although low IQ might beassociated with poor face memory (in men), inthe upper half of the IQ distribution (and acrossthe full IQ range in women), face memory mightbe independent of general intelligence.
In the present study, data were collected on anumber of measures that bear some relationshipto general intelligence. Although these arelimited by not measuring IQ directly, and the factthat our sample was more educated than average,they provide the first evidence of any sort regardingthe relationship between intelligence-relatedmeasures and specifically the CFMT or CFPT.They are also important for our theoreticalinterpretation of country-of-origin effects in thenext section.
Cambridge Face Memory Test. Evidence from fourdifferent measures argued that there is no associ-ation between intelligence and CFMT perform-ance within our generally well-educated sample.Regarding number of years of education,3 multipleregression of CMFTtotal against years of edu-cation, age, and sex showed no independenteffect of years of education, beta ¼ –.005, p . .9(N ¼ 231). Similarly, multiple regression of
3 Of course, education level in our sample may be only rather loosely related to intelligence, partly because many of the young
adults were only beginning university degrees, and partly because for the older groups (particularly the over-65s) university education
in Australia was less widely available than today, particularly for women.
COGNITIVE NEUROPSYCHOLOGY, 2009, 26 (5) 439
DIAGNOSING PROSOPAGNOSIA WITH CMFT AND CFPT
Downloaded By: [McKone, Elinor] At: 02:50 22 January 2010

CMFTtotal against Mental Alternation Test(MAT) score, age, and sex showed no independenteffect of MAT, beta ¼ –.028, p . .7 (N ¼ 104).And, multiple regression of CMFTtotal against averbal memory score (memory for a list of unrelatedwords, tested for participants in Study 1; seeBowles, 2007, for method), age, and sex showedno independent effect of verbal memory, beta ¼.110, p . .3 (N ¼ 103).
A final analysis compared a highly academicallyselected subset of young adults to the rest of theyoung adults. The former group were part of anANU summer scholarship programme, in whichscholars visit the ANU over the summer followingthird-year undergraduate or Honours years toundertake two months of research in an academic’slaboratory. Entry to the programme is highlycompetitive: ANU is the highest ranked universityfor research in Australia/New Zealand; studentsfrom all universities across Australia and NewZealand are eligible to apply; and successfulapplicants usually have undergraduate gradescomprising primarily High Distinctions andDistinctions and either already hold or go on tocomplete a First Class Honours degree. Thereare thus good reasons to presume that the meanIQ of this group would be noticeably higherthan that of the rest of the young adults. Table 5shows mean, standard deviation, and prosopagno-sia cut-off values for the summer scholarsand the rest of the young adults (excluding 3enrolled in PhD programmes). As can be seen,there were no differences in mean performance,t(113) ¼ 0.455, p . .6, or in variance (Levene’stest F ¼ 1.182, p . .2), or in the resulting scorebelow which prosopagnosia would be diagnosed
(37.7 for summer scholars, 37.9 for the rest ofthe young adults.
Cambridge Face Perception Test. Results suggestedthat CFPT performance may possibly have somerelationship to general intelligence, even in aneducated sample, although the evidence for this wasrather weak. For CFPTupright, a multiple regressionincluding verbal memory, age, and sex as predictorsfound a significant effect of verbal memory, beta ¼–.198, p , .05 (N ¼ 87). The effect was in the direc-tion that individuals with higher verbal memoryscores (associated with higher IQ) obtained lower(i.e., better) CFPT scores. However, similar multipleregressions produced age- and sex-independent con-tributions of years of education and MAT thatwere not even close to significant: education, beta¼ –.055, p . .4 (N ¼ 123); MAT, beta ¼ –.101,p ¼ .261 (N ¼ 88).
Note the summer scholars were not tested onthe CFPT.
Intelligence: Implications for diagnosis. It will beimportant in future studies to properly assess therelationship between full-scale IQ and CFMT/CFPT performance (and, more generally,between IQ and other measures of face proces-sing). Our present analysis here is limited by thefacts that the predictor variables investigatedwere only loose correlates of IQ; we couldaddress only mean effects of these variables,rather than effects specifically on prosopagnosiacut-off; and our sample was more educated thanthe general population.
Still, the present results are consistent withthose of previous studies (Herlitz & Yonker,2002; Jeffery & Anderson, 2004) in suggestingthat, within the upper half of the IQ distribution,face memory, which includes the CFMT, is inde-pendent of general intelligence (although againnote that we cannot rule out a relationship beingpresent in the lower half of the IQ range). Thisis information is of some practical importance,given that probably a relatively high proportionof developmental prosopagnosics reported in theliterature or currently being studied are of higherthan average education/intelligence: It is this
Table 5. Effects of intelligence-related variables
N Mean SD Cut-off
Summer scholars 33 55.73 9.04 37.65
Rest of young adults 82 54.91 8.52 37.87
Note: CFMTtotal performance for a highly academically
selected subgroup of the young adults (“summer scholars”)
and for the rest of the Australian young adults. CFMT ¼
Cambridge Face Memory Test. Cut-off: –2 standard
deviations.
440 COGNITIVE NEUROPSYCHOLOGY, 2009, 26 (5)
BOWLES ET AL.
Downloaded By: [McKone, Elinor] At: 02:50 22 January 2010

group that is more likely to seek out treatment, tobecome aware of the symptoms of prosopagnosiathrough reading newspaper articles or watchingtelevision science programmes, or to be discoveredaccidentally through mass testing of face tasks onundergraduate psychology students.
Turning to the CFPT, it is harder to rule out arelationship with intelligence even in an educatedsample, given that we found a significant associ-ation between verbal memory and the CFPT.Theoretically, an association with intelligencecould be more apparent in the CPFT than in theCFMT because the former, unlike the latter, is atime-limited task, and higher intelligence isassociated with faster general processing speed(even within the upper half of the IQ range). Interms of diagnosing prosopagnosia, the possibleintelligence effect is a finding that clinicians andresearchers might wish to keep in mind if, forexample, a client performs normally on theCFMT but would be suggested to be prosopagno-sic from CFPT results.
Country of origin (ethnic match): Australian andIsraeli samplesNo previous studies have investigated country-of-origin effects on the CFMT or CFPT. In the onlyprevious study that is directly relevant—in that itused faces from the same database as that for theCFMT and CFPT—Gilchrist and McKone(2003) found that Australian participants’memory was more strongly focused on localfeatures for the Boston-area faces than on those
for Australian faces. Possibly this occurredbecause it is local features that stand out mostobviously as unusual in other-ethnicity faces.
Cambridge Face Memory Test. To examine theeffects of country of origin, we started by comparingour Australian sample to the published USA normsfor the CFMT. We considered only our young adultgroup because previous studies of USA-based(Boston-area) samples do not include groupsmatched in age to our three older Australiangroups. Table 6 shows results. Mean CFMTtotalscores were significantly poorer for our Australianyoung adults than for the American young adultsof Duchaine and Nakayama (2006a), t(167) ¼2.41, p , .02. The 2.7-point difference in means,in combination with a somewhat larger variancefor the Australian sample (SD¼ 8.6) than for theUSA sample (SD¼ 7.9), produced a 4-point differ-ence in diagnosis cut-offs (38 vs. 42). This differenceis of strong practical importance: A total of 2.6% ofthe Australian sample fell below the AustralianCFMT cut-off, but inappropriately comparingAustralian individuals to the Duchaine andNakayama (2006a) norms gives 8.6% below thecut-off, implying 7 false diagnoses of prosopagnosiaout of 119 participants.
Results from our Israeli sample (Study 5) werequite different. In this case, both mean and diagno-sis cut-off scores for CFMTtotal were almost iden-tical to the original USA norms (see Table 6).
Cambridge Face Perception Test. There was aninsufficient number of participants available in
Table 6. Effects of participant–stimulus ethnic match
Country N
Age (years)
M (range)
Sex
(% female)
M
(/72) SD Cut-off
USA (Boston) 50 20.3 50 57.9 7.9 42
Israel 49 22.0 (18–31) 69 57.6 8.4 41
Australia/New Zealand 117 23.0 (18–32) 59 55.2 8.6 38
Germany 153 24.0 (18–35) 53 52 8.5 35
Note: Young adult CFMTtotal performance as a function of country of origin, including Australia and New Zealand (present study),
Israel (present study), Boston area in USA (Duchaine & Nakayama, 2006a), Germany (Grit Herzmann, personal communication,
June 10, 2009, based on data from study of Herzmann et al., 2008). Performance is better in the countries where participant–
stimulus ethnic match is stronger (USA, Israel) than where it is weaker (Australia, Germany). CFMT ¼ Cambridge Face
Memory Test. Cut-off: –2 standard deviations.
COGNITIVE NEUROPSYCHOLOGY, 2009, 26 (5) 441
DIAGNOSING PROSOPAGNOSIA WITH CMFT AND CFPT
Downloaded By: [McKone, Elinor] At: 02:50 22 January 2010

overlapping age groups to make it worthwhileexamining country-of-origin effects for the CFPT.
Country of origin: Theoretical interpretation. Beforewe can conclude from our CFMT results that it isnecessary to test country-matched control partici-pants for potential prosopagnosics, we must ruleout other interpretations of the difference inCFMT performance between our present sampleand previous studies. The only obvious alternativeis that the USA sample was likely to have beenparticularly high in intelligence. Duchaine andNakayama’s (2006a) young adults control partici-pants were mostly students from the Boston areaand included a high proportion of students fromHarvard University. However, we argued in theprevious section that intelligence in a generallywell-educated sample does not affect CFMT per-formance. Moreover, there is no reason to expectthat our highly academically Australian selected“summer scholars” (who would fall in the academictop 1%) would be noticeably less intelligentthan Harvard undergraduates, yet the diagnosiscut-off for this group remains 4 points poorerthan that for the USA sample.
Overall, the much more likely interpretation of thegroup differences is that they are, indeed, due tocountry of origin, and specifically that the relativelypoor performance in Australians arises from mis-match in ethnic background between the facestimuli (Boston-area students) and either the partici-pant themselves or the typical “diet” of Caucasian facesubtypes to which the participant has been exposedover the course of his or her lifetime. Several piecesof information support this interpretation.
First, demographic data indicate that there arequite different patterns of ancestry betweenAustralians and Boston-area students: These can besummarized by saying that typical CaucasianAustralians are more likely to be British orNorthern European in appearance, while typicalCaucasian Boston students are relatively more likelyto be Jewish or Southern European in appearance.In Federal Government censuses, the proportion ofresponses implying British Isles ancestry (English,Scottish, Irish, Welsh) is high in Australia (71% inCanberra, 55% in Sydney, from 2006 Australian
census) and much lower in Massachusetts (33%,from 2000 US census). The reverse is true forItalian ancestry (11.8% Massachusetts, 2.6%Canberra, 3.4% Sydney). And, the proportion ofindividuals who are Jewish is dramatically higheramongst Harvard undergraduates (approximately34% of Caucasians; data for 2000s taken fromHillel, the Journal of Blacks in Higher Education,The Harvard Crimson, and the Harvard UniversityFactbook), than amongst Australians (,0.5% ofCaucasians, 2006 census; also note proportion ofpeople with Jewish background remains very loweven amongst Australian university students).
Second, there was anecdotal evidence that atleast some Australian participants perceived themismatch in face ethnicity. Spontaneous com-ments from participants included that theCFMT/CFPT faces looked “Mediterranean”;others described them as “Middle Eastern”, and1 participant then went so far as to describethem as looking “like terrorists”.
Third, in Study 2, a separate test was includedusing Australian-photographed faces (the“Canberra faces task”, not reported here). Someparticipants in that study commented spon-taneously that the Canberra faces appeared “a lotmore normal” than the faces in the CFMT. Thisdifference in perception can only be attributed tothe ethnic background of the faces, given thatthere were no major differences in the photographformat (e.g., hair was removed from both).
Fourth, these ideas predict that participants froma country with a high Jewish (or southern European)population should show good CFMT performance,while participants from a Northern Europeancountry should, like Australians, show poor per-formance—and Table 6 indicates that this isexactly what happens. Caucasian Israeli participants(present Study 5) perform as well as the originalUSA participants. And Caucasian Germans (datakindly provided by Grit Herzmann, from study ofHerzmann et al., 2008) perform very poorly—infact, even more poorly than Australians.
Overall, results make a strong case that CFMTscores are better where there is stronger ethnicmatch between the face stimuli and participants(USA, Israel) and poorer where there is weaker
442 COGNITIVE NEUROPSYCHOLOGY, 2009, 26 (5)
BOWLES ET AL.
Downloaded By: [McKone, Elinor] At: 02:50 22 January 2010

ethnic match (Australia, Germany). Possiblemechanisms for this effect include (a) social out-group categorization, which is known to lowermemory performance for faces (Bernstein et al.,2007), and/or (b) poorer tuning of face-spacedimensions for less-familiar Caucasian subtypes(cf. Valentine, 1991). Importantly, note that toexplain our own findings it is not necessary topropose that poor face-space tuning or outgroupcategorization would apply for every Australianparticipant on every trial; our findings of a lowermean and larger standard deviation inAustralians than in Americans can be accountedfor even if these problems apply only in some cases.
Country of origin: Implications for diagnosis. Thepractical implication of the present findings isthat ethnic background of the lifetime “diet” offaces to which participants have been exposedcannot be ignored when using the CFMT to diag-nose prosopagnosia, even within Caucasians. Ourresults show that potential prosopagnosics mustbe compared to norms derived from controls whohave experienced a similar mix of faces as the proso-pagnosic, and they imply that is important todevelop CFMT norms for different countries (orregions) based on those countries’ particular pat-terns of heritage from different places in Europe.
Reliability of CFMT and CFPT and relationshipbetween tasksTwo important questions relevant to diagnosis usingthe CFMT and CFPT are reliability of the individualmeasures and the extent to which both tasks addressthe same underlying ability. Our data provide someuseful new information on these topics.
Regarding reliability of the CFMT, Duchaineand Nakayama (2006a) correlated accuracy onStage 2 of the test (novel images) with accuracy
on Stage 3 (novel images in noise; Stage 1 wasleft out of this analysis because normal participantsperform at ceiling). Their correlation, in 50 youngadults, was r ¼ .74. The present results agree:Correlation between Stage 2 and Stage 3 was r¼ .751, p , .001, N ¼ 124 in the young adults,and r ¼ .734, p , .001, N ¼ 236 in the entiresample. (The prosopagnosics were excluded fromthis analysis to allow closest comparison withDuchaine & Nakayama, who tested only nonpro-sopagnosic individuals.) Regarding the standardinternal consistency measure Cronbach’s alpha,Herzmann et al. (2008) have provided the onlyprevious report (in German participants,CFMTtotal alpha ¼ .83). In the present study,internal reliability was very good: alpha ¼ .887based on all 72 trials and all age groups (N ¼224); alpha ¼ .877 based on the 54 trials fromStages 2 and 3 combined and individuals fromall age groups (N ¼ 224); and alpha ¼ .875 basedon all 72 trials and young adults only (N ¼ 126).
Turning to the CFPT, no previous studies haveprovided any type of reliability analysis. Our resultsshowed that, for upright faces, internal reliabilitywas lower than that for the CFMT but still quitegood: Cronbach’s alpha ¼ .743 based on the entiresample (N ¼ 126); and alpha ¼ .732 for youngadults only (N ¼ 37). For inverted faces, reliabilitywas noticeably lower: alpha ¼ .500 (N ¼ 126).Presumably, the lower reliability for inverted facesreflects the fact that participants usually find it diffi-cult to perceive identity-related information ininverted faces, which would result in ratherrandom similarity ordering (except for test facesvery obviously different from the target face).4
The extent to which the CFMT and CFPT assessthe same underlying ability can be addressed by con-sidering the correlation between the two tasks, in thelight of the reliability measures. Correlation between
4 Supporting evidence for this interpretation was obtained. For each individual target face in the CFPT, we calculated the mean
error score (i.e., averaging across participants) and correlated this with the “default” error score for that face—namely, the score that
would be obtained if participants made no changes at all to the initial left–right ordering of the faces on each trial. If CFPT par-
ticipants’ perception of facial identity is reliable, we would expect the correlation to be zero; that is, starting-point ordering should not
matter. Results showed the expected independence of starting and final order for upright faces (r ¼ –.19), but there was some evi-
dence of a relationship for inverted faces (r ¼ .43), suggesting that participants to some extent tended to leave the inverted faces in
their original order.
COGNITIVE NEUROPSYCHOLOGY, 2009, 26 (5) 443
DIAGNOSING PROSOPAGNOSIA WITH CMFT AND CFPT
Downloaded By: [McKone, Elinor] At: 02:50 22 January 2010

CMFTtotal and CFPTupright was r¼ –.607, N¼124,p , .001intheentire sample, and r ¼ –.619,N¼ 36, p , .001 in young adults. (Note that the cor-relations are negative because CFMT uses accuracywhile CFPT uses errors.) This correlation washigh relative to the upper bound correlation (theproduct of the square root of the reliability scores)of r ¼ .807. Thus, results imply that the CFMTand CFPT assess abilities that are largely overlap-ping: However, the fact that the correlation is notat maximum carries the theoretical implicationthat face perception and face memory are partiallydissociable skills.
Reliability and interrelationship: Implications fordiagnosis. Internal reliability of the CFMT forupright faces meets standard requirements forclinical tests (Cronbach’s alpha . .85; Aiken,2003) where the intention is to use an individualparticipant’s score, as is the case when diagnosingprosopagnosia. Internal reliability of the CFPTfor upright faces did not achieve this criterionlevel (possibly because there are only eight trialsfor upright faces), although the test is reliableenough to be useful when reporting scores aver-aged across groups of participants and is also stillof value in diagnosing extreme single cases (i.e.,although the interpretation of a z score veryclose to the cut-off is open to question, anextreme z score such as –3 would clearly be indica-tive of prosopagnosia; also note that a small z scoresuch as –1.1 would be clearly indicative of normalperformance). External validity of the CFMT andCFPT was supported by the strong correlationbetween the two tasks (and also, of course, bythe large inversion effects shown by each taskand by the ability of the tasks to diagnose knowncases of prosopagnosia; Duchaine et al., 2007a;Duchaine & Nakayama, 2006a).
Overall, the finding that the reliability of theCFMT (.89) was higher than that of the CFPT(.74) is consistent with our earlier observations ofsomewhat unstable standard deviation estimatesfor the CFPT with small-to-medium Ns in agroup. Also, the correlation between tasks indi-cated that the two tasks do not tap identical cogni-tive functions (unsurprisingly, given that one tests
face perception, and the other face memory). Wethus suggest that there are clear advantages to con-ducting both tests, partly because reliability foreither is not perfect, and partly to test for a specificdiagnosis of prosopamnesia—that is, the ability toperceive identity-related information in novelfaces but not to store or consciously retrieve amemory record of facial information (whileshowing normal memory for other material; cf.Tippett, Miller, & Farah, 2000; Williams,Berberovic, & Mattingley, 2007).
Ability of our norms to diagnose cases of suspectedprosopagnosiaIt has previously been shown that, in US samples,the CFMT and CFPT are both able to diagnoseindividuals known to be prosopagnosic fromother information (e.g., family member recog-nition and famous face tests; Duchaine et al.,2007a; Duchaine & Nakayama, 2006a). Giventhat the present results produced rather differentnorms for Australian participants, we examinedCFMT and CFPTupright scores for a group of7 Australian individuals—not included in ourmain “unselected” sample—with suspected proso-pagnosia. All these individuals had contacted theMACCS centre because they suspected theymight have face recognition problems. All butone performed poorly at famous face recognition(Table 7). A total of 6 of the 7 also self-reportedface recognition difficulties in response to specificfocused questions, most commonly (N ¼ 5)trouble following films. All had average orabove-average IQ (Raven’s matrices). Nonescored highly (above 32) on autistic traits (scoresranged from 3–30 on the Autistic-SpectrumQuotient of Baron-Cohen, Wheelwright,Skinner, Martin, & Clubley, 2001). All hadnormal visual acuity at low contrast (FACT test)and normal colour vision (100% on Ishiharaplates).
Of these 7 suspected prosopagnosics, Table 7shows that 4 are clearly diagnosed as prosopagno-sic by the CFMT (i.e., SP_F40, SP_M53,SP_F21, and SP_M60 all have CFMTtotal zscores , –2.0), and another 2 have CFMT per-formance that is noticeably poor (z , –1.7)
444 COGNITIVE NEUROPSYCHOLOGY, 2009, 26 (5)
BOWLES ET AL.
Downloaded By: [McKone, Elinor] At: 02:50 22 January 2010

although not at below-criterion levels. This indi-cates a hit rate of at least 57% (4/7) for theCFMT, which compares favourably to a 27% hitrate for the Benton test (Duchaine & Nakayama,2004, 2006a).
Regarding the CFPT, Table 7 reveals an inter-esting pattern in which, despite a general tendencyfor the suspected prosopagnosics to score belowaverage for their age (i.e., 6/7 z scores are nega-tive), most were only slightly below average, andonly 1 individual performed at prosopagnosiclevels (SP_F40). Indeed, 5 of the 7 were impairedto clinical levels on famous face recognition and/orthe CFMT—both face memory tests—but werewell within the normal range on the CFPT, aface perception test. This suggests that it is notuncommon for prosopagnosics to manifest proso-pamnesia, meaning that affected individuals areable to represent faces successfully while they arephysically present, but are unable to retain facesin memory (or at least to access any storedmemory representations consciously, noting thatfamous face tests and the CFMT test explicitrather than implicit recognition).
Finally, we note that 1 individual in Table 7(SP_F50) is impaired only on the famous facestask, and not on either the CFMT or the CFPT.
The existence of an individual who can benormal on the CFMT and CFPT, while reportingsubstantial real-world face recognition difficultiesand performing very poorly on famous facerecognition, deserves further investigation infuture studies. It is possible that the CMFT andCFPT do not completely overcome problems ofnonface strategies contributing to performance.Alternatively, there might exist a genuine formof prosopagnosia in which an individual canperceive a face (CFPT) and retain it in memoryfor a few minutes (CFMT), but not retain itpermanently in memory (famous faces, real-world recognition).
Prevalence of prosopagnosia in an unselectededucated Australian sampleWe now return to our main sample of 241 individ-uals. Because these participants were unselectedfor face recognition ability, examining participantswhose performance was poorer than diagnosis cut-offs (.2 SDs) on the CFMT and/or CFPT allowsus to gain some information on the likely rate ofprosopagnosia in the general population of edu-cated Australians. Further, given that none ofthe participants had reported suffering a majorbrain injury (such as stroke) that would plausibly
Table 7. Diagnosing suspected prosopagnosia
Participant Age (years) Famous faces z CFMT1 CFMT2 CFMT3
CFMT CFPT
Total z Upright Up z
SP_F40 40 –2.43 16 13 8 37 –2.16 68 –2.95
SP_M53 53 –2.46 12 11 7 30 –2.72 36 0.53
SP_F21 21 –2.56 16 9 11 36 –2.26 42 –0.74
SP_M60 60 –1.04 14 10 6 30 –2.49 48 –0.03
SP_F37 37 –2.10 15 17 9 41 –1.72 46 –1.12
SP_F47 47 –4.05 17 13 9 39 –1.81 52 –1.41
SP_F50 50 –2.40 17 16 9 42 –1.39 50 –1.13
Note: CFMT/CFPT scores for Australian individuals suspected to have prosopagnosia (based on interview and/or famous face rec-
ognition), relative to Australian norms. All z scores are coded such that negative indicates scores poorer than mean. Red indicates
, 22 standard deviations. Blue indicates , –1.6 standard deviations. In the participant code: SP ¼ suspected prosopagnosic; F
¼ female; M ¼ male. Sex-specific norms are used for the CFPT (see main text). Norms for the famous face test (MACCS
Famous Face Test 2008; Wilson, Palermo, Rivolta, Williams, & Schmalzl, unpublished test) were derived from Australian
Caucasians aged 19–72 years (N ¼ 28) using the same fit-and-residual procedure as that described in the present article.
CFMT ¼ Cambridge Face Memory Test; CFPT ¼ Cambridge Face Perception Test. [To see this Table in colour, please see
the online issue of the Journal.]
COGNITIVE NEUROPSYCHOLOGY, 2009, 26 (5) 445
DIAGNOSING PROSOPAGNOSIA WITH CMFT AND CFPT
Downloaded By: [McKone, Elinor] At: 02:50 22 January 2010

to lead to acquired prosopagnosia, cases uncoveredare presumably developmental in origin.
Table 8 lists the relevant individuals. The first 5would clearly be diagnosed as probable prosopag-nosics (F21, F22, F73, M21, and M57). All theseparticipants had CFMT scores more than 2.1 stan-dard deviations poorer than the mean. Of the 5, 1(M21) demonstrated prosopamnesia—he scoredoutside the normal range on the CFMT, but wellwithin the normal range on the CFPT—whilethe other 3 of the 4 tested on the CFPT wereimpaired at both face memory and face perception(CFPT z of at least –1.9). In all 5 cases, the poorface recognition could not be attributed to generallypoor abilities: The 2 young women were both suc-cessful undergraduate students (suggesting higherthan average IQ); F21, F73, and M21 were testedon the MAT and a verbal memory test and per-formed within the normal range relative to agegroup norms (in fact, F73’s verbal memory wasnoticeably above average), and M57 had normal-range IQ on Raven’s matrices.
For 2 of these probable prosopagnosics, we con-ducted follow-up testing. In both cases, resultswere consistent with the presence of prosopagno-sia. Both were impaired on a famous faces test(F21 and M57, see Table 8). F21 was also inter-viewed and stated that she could not follow films(and neither could her father), and she reported
using nonface strategies for person recognition:For example, she said it took her some time torealize that two similar-looking people on herstudent dorm floor (two young women withsimilar body shape and blonde curly hair) were infact different individuals, after which she putdeliberate effort into learning to distinguishthem by attending to differences in informationsuch as exact degree of hair curl.
In addition to the 5 clear prosopagnosics, therewere a further two cases with somewhat ambigu-ous results (Table 8). These individuals (M61and F74) performed moderately more poorlythan the cut-off on the CFPT, and more poorlythan average but not below cut-off on theCFMT (although very close in the case of M61,with CFMT z ¼ –1.97). Given the reasons tobelieve that diagnosis reliability is greater fromthe CFMT than the CFPT (see earlier sections),these two cases may be prosopagnosic, but couldalternatively be individuals whose identity-relatedface processing is merely at the poor end of thenormal range.
Our results suggest a developmental prosopag-nosia prevalence rate of at least 2% including pro-sopamnesia. Note that we include prosopamnesiabecause, functionally, “prosopagnosia” is most use-fully defined as the inability to recognize people, anability for which face memory as well as face
Table 8. Rate of prosopagnosia in a sample unselected for face recognition ability
Participant
Age
(years)
CFMT CFPT
Word memory z MAT z Raven’s z Famous faces z Likely diagnosisTotal z Upright Up z
F21 21 36 –2.26 94 –5.07a –0.55 –1.10 N/A –2.51 prosopagnosia
F22 22 36 –2.27 N/A N/A N/A N/A N/A N/A prosopagnosia
F73 73 26 –2.34 104 –4.39 2.16 0.08 N/A N/A prosopagnosia
M21 21 37 –2.14 38 –0.44 –0.38 1.21 N/A N/A prosopagnosia
M57 57 28 –2.82 70 –1.93 N/A N/A –0.68 –3.10 prosopagnosia
M61 61 34 –1.97 76 –2.17 –1.13 0.02 N/A N/A prosopagnosia
F74 74 32 –1.58 88 –2.95 0.59 1.58 N/A N/A poor at faces?
Note: Individuals in our Australian sample (N¼241) who revealed poorer-than-cut-off performance relative to age norms on either
CFMT or CFPT. CFMT ¼ Cambridge Face Memory Test; CFPT ¼ Cambridge Face Perception Test.aAll z scores (number of standard deviations away from mean) are coded such that a negative z equals performance poorer than the
mean. Red indicates , 22 standard deviations. Blue indicates , 2 1.6 standard deviations. On the CFPT, a negative z thus cor-
responds to a raw score higher than the mean (i.e., a higher error rate). On the CFPT, sex-specific norms have been used for the
individuals aged 57–74 years. [To see this Table in colour, please see the online issue of the Journal.]
446 COGNITIVE NEUROPSYCHOLOGY, 2009, 26 (5)
BOWLES ET AL.
Downloaded By: [McKone, Elinor] At: 02:50 22 January 2010
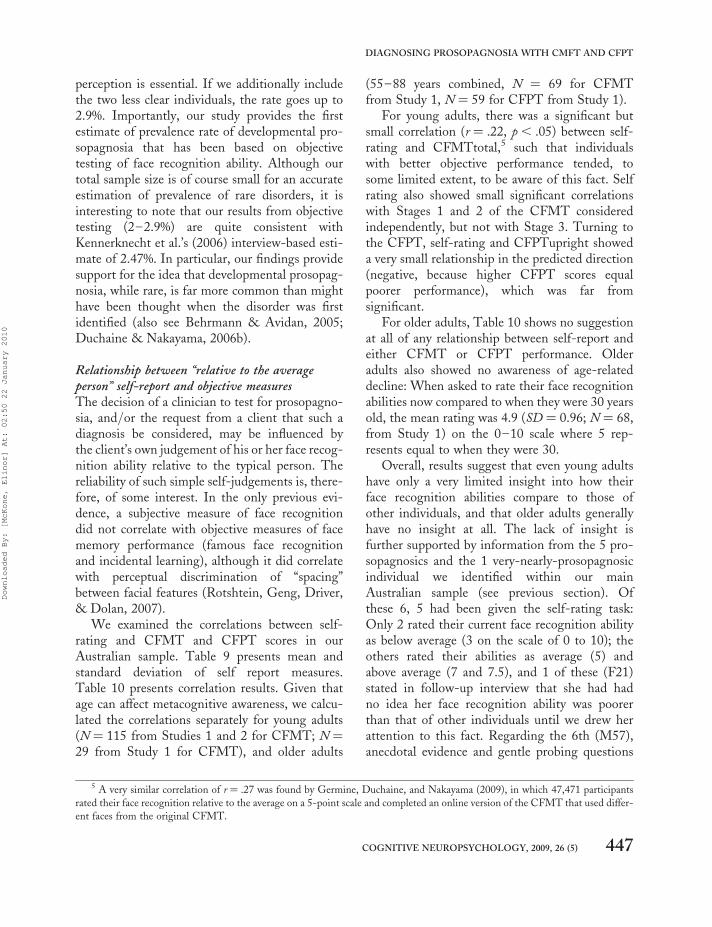
perception is essential. If we additionally includethe two less clear individuals, the rate goes up to2.9%. Importantly, our study provides the firstestimate of prevalence rate of developmental pro-sopagnosia that has been based on objectivetesting of face recognition ability. Although ourtotal sample size is of course small for an accurateestimation of prevalence of rare disorders, it isinteresting to note that our results from objectivetesting (2–2.9%) are quite consistent withKennerknecht et al.’s (2006) interview-based esti-mate of 2.47%. In particular, our findings providesupport for the idea that developmental prosopag-nosia, while rare, is far more common than mighthave been thought when the disorder was firstidentified (also see Behrmann & Avidan, 2005;Duchaine & Nakayama, 2006b).
Relationship between “relative to the averageperson” self-report and objective measuresThe decision of a clinician to test for prosopagno-sia, and/or the request from a client that such adiagnosis be considered, may be influenced bythe client’s own judgement of his or her face recog-nition ability relative to the typical person. Thereliability of such simple self-judgements is, there-fore, of some interest. In the only previous evi-dence, a subjective measure of face recognitiondid not correlate with objective measures of facememory performance (famous face recognitionand incidental learning), although it did correlatewith perceptual discrimination of “spacing”between facial features (Rotshtein, Geng, Driver,& Dolan, 2007).
We examined the correlations between self-rating and CFMT and CFPT scores in ourAustralian sample. Table 9 presents mean andstandard deviation of self report measures.Table 10 presents correlation results. Given thatage can affect metacognitive awareness, we calcu-lated the correlations separately for young adults(N ¼ 115 from Studies 1 and 2 for CFMT; N ¼29 from Study 1 for CFMT), and older adults
(55–88 years combined, N ¼ 69 for CFMTfrom Study 1, N ¼ 59 for CFPT from Study 1).
For young adults, there was a significant butsmall correlation (r ¼ .22, p , .05) between self-rating and CFMTtotal,5 such that individualswith better objective performance tended, tosome limited extent, to be aware of this fact. Selfrating also showed small significant correlationswith Stages 1 and 2 of the CFMT consideredindependently, but not with Stage 3. Turning tothe CFPT, self-rating and CFPTupright showeda very small relationship in the predicted direction(negative, because higher CFPT scores equalpoorer performance), which was far fromsignificant.
For older adults, Table 10 shows no suggestionat all of any relationship between self-report andeither CFMT or CFPT performance. Olderadults also showed no awareness of age-relateddecline: When asked to rate their face recognitionabilities now compared to when they were 30 yearsold, the mean rating was 4.9 (SD ¼ 0.96; N ¼ 68,from Study 1) on the 0–10 scale where 5 rep-resents equal to when they were 30.
Overall, results suggest that even young adultshave only a very limited insight into how theirface recognition abilities compare to those ofother individuals, and that older adults generallyhave no insight at all. The lack of insight isfurther supported by information from the 5 pro-sopagnosics and the 1 very-nearly-prosopagnosicindividual we identified within our mainAustralian sample (see previous section). Ofthese 6, 5 had been given the self-rating task:Only 2 rated their current face recognition abilityas below average (3 on the scale of 0 to 10); theothers rated their abilities as average (5) andabove average (7 and 7.5), and 1 of these (F21)stated in follow-up interview that she had hadno idea her face recognition ability was poorerthan that of other individuals until we drew herattention to this fact. Regarding the 6th (M57),anecdotal evidence and gentle probing questions
5 A very similar correlation of r ¼ .27 was found by Germine, Duchaine, and Nakayama (2009), in which 47,471 participants
rated their face recognition relative to the average on a 5-point scale and completed an online version of the CFMT that used differ-
ent faces from the original CFMT.
COGNITIVE NEUROPSYCHOLOGY, 2009, 26 (5) 447
DIAGNOSING PROSOPAGNOSIA WITH CMFT AND CFPT
Downloaded By: [McKone, Elinor] At: 02:50 22 January 2010

suggest that he is unaware that his face recognitionis not normal.
Self-report: Implications for diagnosis and for researchethics. Anecdotally, a number of different labora-tories have observed that targeted questions—such as “Do you have trouble following films?”—can be useful in indicating prosopagnosia that issubsequently confirmed objectively. (We are notaware of any such questionnaires that have beenpublished as yet.) However, the present resultsargue that simply asking people how good theyare at face recognition relative to other people isnot useful as a method of either diagnosing proso-pagnosia or ruling out such a diagnosis. Thisfinding is of practical importance, for two reasons.
First, a simple comparison-to-the-average islikely to be the idea that a member of thegeneral public would have in mind if, forexample, a clinician treating them for socialanxiety asks “How good do you think you are atface recognition? Could there be a problemthere, do you think?”. A related implication forclinical work is that clients with underlying devel-opmental prosopagnosia may well be unaware theyhave a cognitive deficit6 and so are likely to attri-bute resulting social problems they may suffer toinappropriate causes (e.g., “people don’t like me,I have an unattractive personality” or “I’m nottrying hard enough to recognize people”).
Second, for researchers, it raises a potentiallyimportant ethical issue—namely, that any testingof the CFMT/CFPT on “control” individualshas the potential to turn up individuals with extre-mely poor face recognition who are unaware of thisfact. We suggest that researchers need to plan inadvance for this possibility, for example by usingresearch consent forms that ask participants ifthey wish to be informed should they perform atprosopagnosic levels.
Distribution shape for the Cambridge Face MemoryTestWith CFMT data from a large number ofAustralian young adults unselected for facerecognition ability, a final issue we were able to
Table 9. Self-rating of face recognition ability
Age group (years)
Young adult 55–64 65–74 75þ
N M SD N M SD N M SD N M SD
Self-rating 115 6.83 1.56 25 6.84 1.31 29 6.43 1.42 15 7.23 1.69
Self-change — — — 24 5.17 1.17 29 4.74 0.95 15 4.8 0.41
Note: Ratings compared to “the average person” for all age groups (0 ¼ much worse than average; 5 ¼ average; 10 ¼ much better
than average) and, for older age groups, self-ratings of face recognition ability now compared to when the participant was 30 years
old (0 ¼ much worse now than when I was 30; 5 ¼ equal to when I was 30; 10 ¼ much better at present than when I was 30).
Table 10. Pearson correlations between self-rated face recognition
ability and objective performance on the CFMT and CFPT
Age group CFMT1 CFMT2 CFMT3 CFMTtot CFPT
Young adults .205� .258�� .123 .220� –.119
Older adults
(55–88 yrs)
– .107 .003 –.069 –.054 –.014
Note: CFMT ¼ Cambridge Face Memory Test; CFPT ¼
Cambridge Face Perception Test. Stages 1, 2, and 3 separ-
ately, plus total; CFPT (upright faces only). If individuals
with higher self-rating demonstrate better objective perform-
ance, correlations should be positive for CFMT and negative
for CFPT.�p , .05. ��p , .01, two-tailed.
6 This can also occur with congenital perceptual deficits. Even with colour blindness, a phenomenon that is very well known in
the general community (unlike prosopagnosia), affected individuals can make it to adulthood without realizing they are colour blind.
448 COGNITIVE NEUROPSYCHOLOGY, 2009, 26 (5)
BOWLES ET AL.
Downloaded By: [McKone, Elinor] At: 02:50 22 January 2010

address was the shape of the distribution of scoreson this task. Figure 5 shows a frequencydistribution for the relevant 126 young adultswho completed the CFMT (including the 3young adults discovered to be prosopagnosic,i.e., F21, F22, and M21 in Table 8). Resultsshow that the distribution is normal in shape.7
Statistical analysis revealed no significant devi-ation from normality, Kolmogorov–Smirnov ¼0.051, df ¼ 126, p ¼ .20.
A concomitant finding was that, at least withinthis sample, the scores from the individuals withprosopagnosia did not form a discrete populationon the CFMT. The histogram is unimodalrather than bimodal, and the 3 young adultsdiagnosed as prosopagnosics (F21, F22, M21)performed only incrementally poorer than thenext-poorest participants. A possible interpret-ation is that developmental prosopagnosia reflectsmerely the low end of continuous variation in facerecognition ability and not a discrete populationthat is different from the population of individuals
with normal-range ability. However, we urgecaution in drawing this conclusion, for severalreasons. First, Yovel and Duchaine (2006) foundthat, although the 14 prosopagnosics studiedwere generally only mildly outside the normalrange on the CFMT (mean z ¼ –2.5), theywere often much more dramatically so on famousface tests (mean z ¼ –6.5). Second, on theCFPT, 2 of our prosopagnosic individuals testedon that task were dramatically outside thenormal range (see Figure 3B). Third, even onthe CFMT, some developmental prosopagnosicshave been reported who perform far outside thenormal range (e.g., 2 individuals with z between–3.5 and –4.0 in Duchaine et al., 2007a).
The finding of a normal distribution also raisesthe question of whether our prevalence estimateof 2–2.9% of the population with prosopagnosiais meaningful given that, by definition, 2.28% of anormal distribution fall more than 2 standard devi-ations below the mean. In response, the relevantpoint is the breadth of the distribution revealed inFigure 5. If face recognition accuracy were closelyclustered around one value (i.e., all individualswere very similar), then certainly an individualcould be more than 2 standard deviations poorerthan the mean while still being quite good in absol-ute terms and not at all functionally prosopagnosic.However, Figure 3 shows that scores range fromperfect to not very much better than chance,meaning that individuals 2 standard deviationspoorer than the mean are performing extremelypoorly in absolute terms. This is consistent withclinical observation that individuals with CFMTperformance more than 2 standard deviationsbelow the mean do indeed have severe real-worldproblems in face recognition (e.g., Yovel &Duchaine, 2006). Indeed, Duchaine et al. (2007a)found that, in a family of 10 prosopagnosic individ-uals (7 siblings, their parents, and uncle) with amean CFMT z score of –2.8, the functional deficitswere so severe that nametags were worn at familyreunions. Overall, it seems very probable that 2–3% below criterion on the CMFT/CFPT does
Figure 5. Frequency distribution of CFMTtotal scores (upright
faces) in 126 young adults from Australia/New Zealand. The 3
individuals scoring 36 and 37 are below the cut-off for
prosopagnosia. CFMT ¼ Cambridge Face Memory Test.
7 For a report on people from the high end of the distribution, see Russell, Duchaine, and Nakayama (2009).
COGNITIVE NEUROPSYCHOLOGY, 2009, 26 (5) 449
DIAGNOSING PROSOPAGNOSIA WITH CMFT AND CFPT
Downloaded By: [McKone, Elinor] At: 02:50 22 January 2010
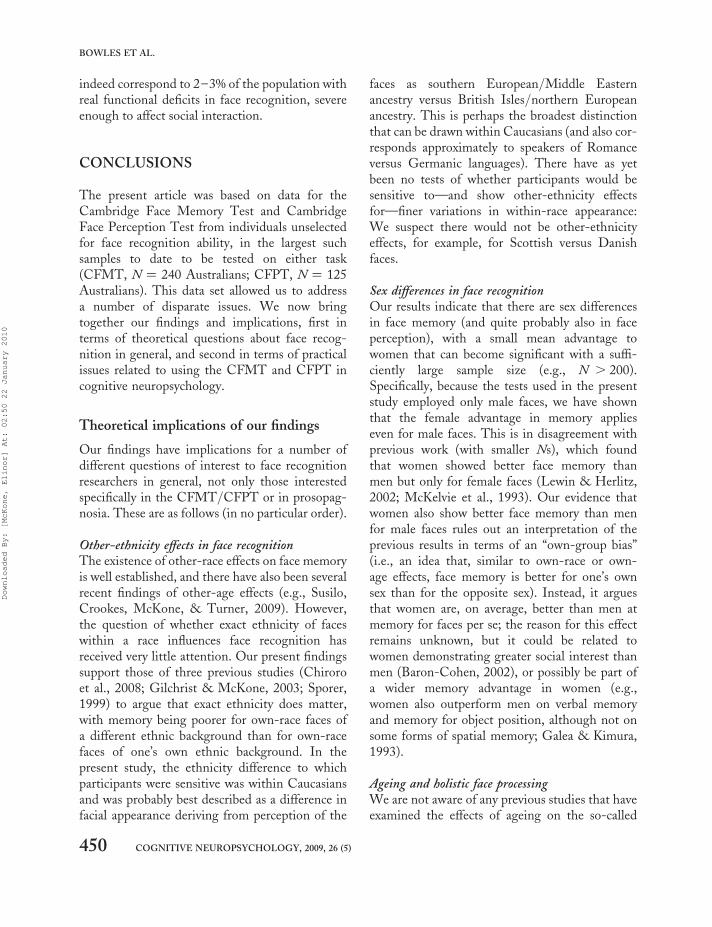
indeed correspond to 2–3% of the population withreal functional deficits in face recognition, severeenough to affect social interaction.
CONCLUSIONS
The present article was based on data for theCambridge Face Memory Test and CambridgeFace Perception Test from individuals unselectedfor face recognition ability, in the largest suchsamples to date to be tested on either task(CFMT, N ¼ 240 Australians; CFPT, N ¼ 125Australians). This data set allowed us to addressa number of disparate issues. We now bringtogether our findings and implications, first interms of theoretical questions about face recog-nition in general, and second in terms of practicalissues related to using the CFMT and CFPT incognitive neuropsychology.
Theoretical implications of our findings
Our findings have implications for a number ofdifferent questions of interest to face recognitionresearchers in general, not only those interestedspecifically in the CFMT/CFPT or in prosopag-nosia. These are as follows (in no particular order).
Other-ethnicity effects in face recognitionThe existence of other-race effects on face memoryis well established, and there have also been severalrecent findings of other-age effects (e.g., Susilo,Crookes, McKone, & Turner, 2009). However,the question of whether exact ethnicity of faceswithin a race influences face recognition hasreceived very little attention. Our present findingssupport those of three previous studies (Chiroroet al., 2008; Gilchrist & McKone, 2003; Sporer,1999) to argue that exact ethnicity does matter,with memory being poorer for own-race faces ofa different ethnic background than for own-racefaces of one’s own ethnic background. In thepresent study, the ethnicity difference to whichparticipants were sensitive was within Caucasiansand was probably best described as a difference infacial appearance deriving from perception of the
faces as southern European/Middle Easternancestry versus British Isles/northern Europeanancestry. This is perhaps the broadest distinctionthat can be drawn within Caucasians (and also cor-responds approximately to speakers of Romanceversus Germanic languages). There have as yetbeen no tests of whether participants would besensitive to—and show other-ethnicity effectsfor—finer variations in within-race appearance:We suspect there would not be other-ethnicityeffects, for example, for Scottish versus Danishfaces.
Sex differences in face recognitionOur results indicate that there are sex differencesin face memory (and quite probably also in faceperception), with a small mean advantage towomen that can become significant with a suffi-ciently large sample size (e.g., N . 200).Specifically, because the tests used in the presentstudy employed only male faces, we have shownthat the female advantage in memory applieseven for male faces. This is in disagreement withprevious work (with smaller Ns), which foundthat women showed better face memory thanmen but only for female faces (Lewin & Herlitz,2002; McKelvie et al., 1993). Our evidence thatwomen also show better face memory than menfor male faces rules out an interpretation of theprevious results in terms of an “own-group bias”(i.e., an idea that, similar to own-race or own-age effects, face memory is better for one’s ownsex than for the opposite sex). Instead, it arguesthat women are, on average, better than men atmemory for faces per se; the reason for this effectremains unknown, but it could be related towomen demonstrating greater social interest thanmen (Baron-Cohen, 2002), or possibly be part ofa wider memory advantage in women (e.g.,women also outperform men on verbal memoryand memory for object position, although not onsome forms of spatial memory; Galea & Kimura,1993).
Ageing and holistic face processingWe are not aware of any previous studies that haveexamined the effects of ageing on the so-called
450 COGNITIVE NEUROPSYCHOLOGY, 2009, 26 (5)
BOWLES ET AL.
Downloaded By: [McKone, Elinor] At: 02:50 22 January 2010

“special” aspect of face processing, variously knownas holistic or configural processing. Our resultsargue that the strength of holistic/configural pro-cessing for faces is unaffected by ageing: The effectof face inversion is associated with a lack of holisticprocessing for inverted faces (e.g., Tanaka &Farah, 1993; Yin, 1969; Young, Hellawell, &Hay, 1987), and the present finding was that theinversion effect on the CFPT does not changewith age in the 18–75-year age range. This is atheoretically important observation because itimplies that the substantial ageing-relateddecline that occurs in performance on facememory and face perception tasks does not occurbecause of any age-related decline in the abilityto process faces holistically.
Overlap of face memory and face perceptionOur results argue that face memory and faceperception are abilities that are strongly overlap-ping, although still dissociable, especially in casesof atypical development. The CFMT and theCFPT are very different tasks in structure (i.e.,the CFMT is far from being the CFPT withmerely an added memory component), and yet,across the full range of abilities, performance onthe two tasks correlated highly relative to themaximum value predicted from the individualtask reliabilities (observed correlation ¼ .61; pre-dicted maximum ¼ .81). This argues that theunderlying correlation between normal individ-uals’ face memory and face perception abilities isstrong. Interestingly, however, we also uncoveredevidence suggesting that it is quite common fordevelopmental prosopagnosics to show very poorface memory in conjunction with quite normalface perception. This implies that the neuralmechanisms supporting conscious face memoryand face perception are dissociable at least inatypical development.
Practical implications of our findings
Theoretical development in cognitive neuro-psychology—for example, in understanding thepattern of dissociable contributions to prosopag-nosia—is only as good as the tests available to
researchers. If tests of a particular cognitive func-tion are not internally reliable, or the normsagainst which a potential prosopagnosic’s abilitiesare judged are inappropriate, then theoretical con-clusions may have little validity. With respect topractical issues arising in the use of the CFMTand CFPT, the present article has contributedseveral novel and important findings. These areas follows.
Norms and ethnic match within CaucasiansFor the CFMT, our results show that norms mustbe derived from countries or regions with a stimu-lus–participant match in ethnicity similar to thatof the potential prosopagnosic. This applies evenwhere participants and faces are matched for race(i.e., all Caucasian). The present article summar-izes CFMT norms (for young adults, see Table 6)for the Boston area of the US, for Australia/New Zealand, for Israel, and for Germany. It ispossible that ethnicity-specific norms wouldalso be required for the CFPT, although this iscurrently unknown.
Norms and ageingOnce the appropriate country or region has beenselected, our results show that norms must thenbe derived from an age-appropriate sample. Forthe CFMT, young adult norms can be used forparticipants aged up to 50 years, but age-matched samples are required beyond this age.For the CFPT, age-matched samples are certainlyrequired beyond 50 years, and age-related declinequite possibly begins even earlier (e.g., by 35–40years), perhaps because of the speeded nature ofthe task. In terms of efficiently collecting normdata across all ages, our data revealed no changein variance of CFMT or CFPT across the fulladult age range (18–88 years); this implies thattesting a full age-spread of controls and usingcurve fitting and the standard deviation of theresiduals (as we have done in the present article)can be a more time-efficient way of collectingaccurate norm data for a particular country/region than attempting to test a large controlgroup for each age decade.
COGNITIVE NEUROPSYCHOLOGY, 2009, 26 (5) 451
DIAGNOSING PROSOPAGNOSIA WITH CMFT AND CFPT
Downloaded By: [McKone, Elinor] At: 02:50 22 January 2010

Sample size of control groupsFor the CFMT, our results suggest that data froma control group that is age and ethnicity matchedto a particular potential prosopagnosic shouldgive a reasonably accurate estimate of the standarddeviation (and thus the diagnosis cut-off score)with a sample size of approximately 30 controls.However, control sample sizes of 20–30 are notnearly adequate for the CFPT, given the randomdifferences in standard deviation we observedacross successive samples of this size (note thatthese presumably arise due to the rather lowerindividual-subject internal reliability for theCFPT than the CFMT; see below).
Norms and sexOnce an appropriate country and age of controlshave been determined, then sex can safely beignored for the CFMT where the aim is to diag-nose prosopagnosia based on a score 2 standarddeviations poorer than the mean: That is,because women show significantly better meanperformance but slightly larger variability thanmen, CFMT norms can be derived from mixed-sex samples. For the CFPT, in contrast, thingsare unfortunately more complicated. Our findingssuggested that, past young adulthood, a meanadvantage to women was combined with slightlysmaller variability, meaning that norms formiddle-aged and older individuals on the CFPTneed to be derived from sex-specific samples.
Norms and intelligenceIt is important that further studies properly inves-tigate the effects of intelligence. Our results forintelligence-related measures (e.g., number ofyears of education) were limited in importantways: We had no direct measure of IQ, and ourdata were obtained from a sample with atypicallyhigh education levels (86% of participants had atleast some postsecondary education). Taking ourfindings together with those of the very few pre-vious studies related to this issue, we have arguedthat intelligence probably does not affect facememory (CFMT) within the upper half of theintelligence range, although we could not ruleout it affecting the CFPT (possibly because this
is a speeded task); also, our results cast no lighton the possible effects of intelligence on eithertask in the lower half of the IQ distribution.
Internal reliability for upright facesInternal reliability scores (Cronbach’s alpha) indi-cate that the CFMT (alpha ¼ .89) is sufficientlyreliable to provide an accurate indication of anindividual’s performance score. Reliability of theCFPT (upright faces alpha ¼ .74) was lower, indi-cating that, although this task can be used foraccurate group-level comparisons, and for diag-nosing the more extreme cases of prosopagnosia,it should not be taken in isolation as an accurateindicator of probable prosopagnosia for individualswith z scores close to the cut-off value (e.g., z scoreof –2.1 or –1.9).
Internal reliability of CFPT for inverted facesThe internal reliability of the CFPT for invertedfaces (alpha ¼ .500) is too poor to provide an accu-rate indication of an individual’s performance forinverted faces, or their upright-inverted differencescore, and is best restricted to use in group-levelcomparisons.
Self-reportOur results argue that, in terms of suggesting, orruling out, a diagnosis of prosopagnosia, no prac-tical reliance should be based on a simple self-report of how a participant believes their face rec-ognition compares “to the average”. Congruently,it is possible for an individual to have developmen-tal prosopagnosia with no awareness that their facerecognition is atypical.
Prevalence of developmental prosopagnosiaFinally, we found that prevalence of developmen-tal prosopagnosia, defined by objective perform-ance, in an educated Australian populationunselected for face recognition ability, was2–2.9%.
Manuscript received 15 December 2008
Revised manuscript received 14 July 2009
Revised manuscript accepted 7 September 2009
First published online 16 November 2009
452 COGNITIVE NEUROPSYCHOLOGY, 2009, 26 (5)
BOWLES ET AL.
Downloaded By: [McKone, Elinor] At: 02:50 22 January 2010

REFERENCES
Adams-Price, C. (1992). Eyewitness memory and aging:Predictors of accuracy in recall and person recog-nition. Psychology and Aging, 7(4), 602–608.
Aiken, L. R. (2003). Psychological testing and assessment
(11th ed.). Boston, MA: Allyn and Bacon.Anastasi, J. S., & Rhodes, M. G. (2005). An own-age
bias in face recognition for children and olderadults. Psychonomic Bulletin and Review, 12(6),1043–1047.
Anstey, K., Dear, K., Christensen, H., & Jorm, A. F.(2005). Biomarkers, health, lifestyle, and demo-graphic variables as correlates of reaction time per-formance in early, middle, and late adulthood. The
Quarterly Journal of Experimental Psychology Section
A, 58(1), 5–21.Baron-Cohen, S. (2002). The extreme male brain theory
of autism. Trends in Cognitive Sciences, 6(6), 248–254.
Baron-Cohen, S., Wheelwright, S., Skinner, R.,Martin, J., & Clubley, E. (2001). The Autism-Spectrum Quotient (AQ): Evidence from Aspergersyndrome/high-functioning autism, males andfemales, scientists and mathematicians. Journal of
Autism and Developmental Disorders, 31(1), 5–17.Bastin, C., & Van der Linden, M. (2003). The contri-
bution of recollection and familiarity to recognitionmemory: A study of the effects of test format andaging. Neuropsychology, 17(1), 14–24.
Bate, S., Haslam, C., Tree, J. J., & Hodgson, T. L. (2008).Evidence of an eye movement-based memory effect incongenital prosopagnosia. Cortex, 44, 806–819.
Behrmann, M., & Avidan, G. (2005). Congenital pro-sopagnosia: Face-blind from birth. Trends in
Cognitive Sciences, 9(4), 180–187.Behrmann, M., Avidan, G., Marotta, J. J., & Kimchi, R.
(2005). Detailed exploration of face-relatedprocessing in congenital prosopagnosia: 1. Behavioralfindings. Journal of Cognitive Neuroscience, 17,1130–1149.
Benton, A. L., Sivan, A. B., Hamsher, K. D. S., Varney,N. R., & Spreen, O. (1983). Contribution to neurop-
sychological assessment. New York: Oxford UniversityPress.
Bernstein, M. J., Young, S. G., & Hugenberg, K.(2007). The cross-category effect: Mere social categ-orization is sufficient to elicit an own-group bias inface recognition. Psychological Science, 8, 706–712.
Billick, S. B., Siedenburg, E., Burgert, W., & Bruni-Solhkhah, S. M. (2001). Validation of the Mental
Alternation Test with the Mini-Mental StateExamination in geriatric psychiatric inpatients andnormal controls. Comprehensive Psychiatry, 42(3),202–205.
Bowles, D. C. (2007). Face processing through the years:
Aging and performance on two tests used to diagnose pro-
sopagnosia. Unpublished honours thesis, AustralianNational University, Canberra, Australian CapitalTerritory, Australia.
Chiroro, P. M., Tredoux, C. G., Radaelli, S., &Meissner, C. A. (2008). Recognizing faces acrosscontinents: The effect of within-race variations onthe own-race bias in face recognition. Psychonomic
Bulletin & Review, 15, 1089–1092.DeGutis, J. M., Bentin, S., Robertson, L. C., &
D’Esposito, M. (2007). Functional plasticity inventral temporal cortex following cognitive rehabili-tation of a congenital prosopagnosic. Journal of
Cognitive Neuroscience, 19(11), 1790–1802.Dobson, E., & Rust, J. O. (1994). Memory for objects
and faces by the mentally retarded and nonretarded.Journal of Psychology, 128(3), 315.
Duchaine, B. C., Germine, L., & Nakayama, K.(2007a). Family resemblance: Ten family memberswith prosopagnosia and within-class object agnosia.Cognitive Neuropsychology, 24(4), 419–430.
Duchaine, B. C., & Nakayama, K. (2004).Developmental prosopagnosia and the BentonFacial Recognition Test. Neurology, 62, 1219–1220.
Duchaine, B. C., & Nakayama, K. (2006a). TheCambridge face memory test: Results forneurologically intact individuals and an investigationof its validity using inverted face stimuli andprosopagnosic participants. Neuropsychologia, 44,576–585.
Duchaine, B. C., & Nakayama, K. (2006b).Developmental prosopagnosia: A window tocontent-specific face processing. Current Opinion in
Neurobiology, 16(2), 166–173.
Duchaine, B. C., & Weidenfeld, A. (2003). An evalu-ation of two commonly used tests of unfamiliarface recognition. Neuropsychologia, 41, 713–720.
Duchaine, B. C., Yovel, G., Butterworth, E., &Nakayama, K. (2006). Prosopagnosia as an impair-ment to face-specific mechanisms: Elimination ofthe alternative hypotheses in a developmental case.Cognitive Neuropsychology, 23(5), 714–747.
Duchaine, B. C., Yovel, G., & Nakayama, K. (2007b).No global processing deficit in the Navon task in14 developmental prosopagnosics. Social Cognitive
and Affective Neuroscience, 2(2), 104–113.
COGNITIVE NEUROPSYCHOLOGY, 2009, 26 (5) 453
DIAGNOSING PROSOPAGNOSIA WITH CMFT AND CFPT
Downloaded By: [McKone, Elinor] At: 02:50 22 January 2010

Galea, L. A. M., & Kimura, D. (1993). Sex differencesin route learning. Personality and Individual
Differences, 14, 53–65.Garrido, L., Duchaine, B. C., & Nakayama, K. (2008).
Face detection in normal and prosopagnosic individ-uals. Journal of Neuropsychology, 2(1), 119–140.
Germine, L., Duchaine, B., & Nakayama, K. (2009).Hitting your peak at age 30: Behavioral evidencefor extended development of face learning ability[Abstract]. Journal of Vision, 9, 506, 506a.
Gilchrist, A., & McKone, E. (2003). Early maturity offace processing in children: Local and relational dis-tinctiveness effects in 7-year-olds. Visual Cognition,10(7), 769–793.
Grady, C. L., McIntosh, A. R., Horwitz, B., &Rapoport, S. I. (2000). Age-related changes in theneural correlates of degraded and nondegraded faceprocessing. Cognitive Neuropsychology, 17(1–3),165–186.
Habak, C., Wilkinson, F., & Wilson, H. R. (2008). Agingdisrupts the neural transformations that link facialidentity across views. Vision Research, 48(1), 9–15.
Herlitz, A., & Yonker, J. E. (2002). Sex differences inepisodic memory: The influence of intelligence.Journal of Clinical and Experimental Neuropsychology,24(1), 107–114.
Herzmann, G., Danthiir, V., Schacht, A., Sommer, W.,& Wilhelm, O. (2008). Towards a comprehensivetest battery for face cognition: Assessment of thetasks. Behavior Research Methods, 40(3), 840–857.
Iaria, G., Bogod, N., Fox, C. J., & Barton, J. J. (2009).Developmental topographical disorientation: Caseone. Neuropsychologia, 47, 30–40.
Jeffery, L., & Anderson, M. (2004). The contributionof central and modular processes to faceperception and individual differences in intelligence[Abstract]. Australian Journal of Psychology,56(Suppl.), 119.
Jones, B. N., Teng, E. L., Folstein, M. F., & Harrison,K. S. (1993). A new bedside test of cognition forpatients with HIV infection. Annals of Internal
Medicine, 119(10), 1001–1004.Kennerknecht, I., Grueter, T., Welling, B., Wentzek,
S., Horst, J., Edwards, S., et al. (2006). First reportof prevalence of non-syndromic hereditary prosopag-nosia (HPA). American Journal of Medical Genetics
Part A, 140A, 1617–1622.Lamont, A. C., Stewart-Williams, S., & Podd, J.
(2005). Face recognition and aging: Effects oftarget age and memory load. Memory and
Cognition, 33(6), 1017–1024.
Lewin, C., & Herlitz, A. (2002). Sex differences in facerecognition: Women’s faces make the difference.Brain and Cognition, 50(1), 121–128.
Lindholm, T. (2005). Own-age biases in verbal personmemory. Memory, 13(1), 21–30.
Loftus, G. R., & Harley, E. M. (2005). Why is it easierto identify someone close than far away? Psychonomic
Bulletin and Review, 12(1), 43–65.Lott, L. A., Haegerstrom-Portnoy, G., Schneck, M. E.,
& Brabyn, J. A. (2005). Face recognition in theelderly. Optometry and Vision Science, 82(10), 874–881.
McKelvie, S. J., Standing, L., St Jean, D., & Law, J.(1993). Gender differences in recognition memoryfor faces and cars: Evidence for the interest hypoth-esis. Bulletin of the Psychonomic Society, 31(5),447–448.
McKone, E. (2009). Holistic processing for faces oper-ates over a wide range of sizes but is strongest atidentification rather than conversational distances.Vision Research, 49, 268–283.
Robbins, R., & McKone, E. (2007). No face-like pro-cessing for objects-of-expertise in three behaviouraltasks. Cognition, 103, 34–79.
Rotshtein, P., Geng, J. J., Driver, J., & Dolan, R. J.(2007). Role of features and second-order spatialrelations in face discrimination, face recognition,and individual face skills: Behavioral and functionalmagnetic resonance imaging data. Journal of
Cognitive Neuroscience, 19, 1435–1452.Russell, R., Duchaine, B. C., & Nakayama, K. (2009).
Super-recognizers: People with extraordinaryface recognition ability. Psychonomic Bulletin and
Review, 16(2), 252–257.Salib, E., & McCarthy, J. (2002). Mental Alternation
Test (MAT): A rapid and valid screening tool fordementia in primary care. International Journal of
Geriatric Psychiatry, 12, 1157–1161.Schmalzl, L., Palermo, R., & Coltheart, M. (2008).
Cognitive heterogeneity in genetically based proso-pagnosia: A family study. Journal of Neuropsychology,2(1), 99–117.
Sliwinski, M. (1997). Aging and counting speed:Evidence for processing-specific slowing. Psychology
and Aging, 12(1), 38–49.Sporer, S. L. (1999, July). The own-race bias in Germany:
Testing the contact hypothesis with Turks and Germans.Paper presented at the 4th European Conference onPsychology and Law of the U.S. Psychology-LawAssociation and the European Psychology-LawAssociation, Dublin.
454 COGNITIVE NEUROPSYCHOLOGY, 2009, 26 (5)
BOWLES ET AL.
Downloaded By: [McKone, Elinor] At: 02:50 22 January 2010

Susilo, T., Crookes, K., McKone, E., & Turner, H.(2009). The composite task reveals stronger holisticprocessing in children than adults for child faces.PLoS ONE, 4(7): e6460.
Tanaka, J. W., & Farah, M. J. (1993). Parts and wholesin face recognition. The Quarterly Journal of
Experimental Psychology, 46A(2), 225–245.Tippett, L. J., Miller, L. A., & Farah, M. J. (2000).
Prosopamnesia: A selective impairment inface learning. Cognitive Neuropsychology, 17, 241–255.
Valentine, T. (1991). A unified account of the effects ofdistinctiveness, inversion, and race in face recog-nition. The Quarterly Journal of Experimental
Psychology, 43A(2), 161–204.Vision Sciences Research Corporation. (2002).
Functional Acuity Contrast Test (FACT). Chicago,IL: Stereo Optical Company.
Warrington, E. K. (1984). Recognition Memory Test.Windsor, UK: NFER-Nelson.
Williams, M. A., Berberovic, N., & Mattingley, J. B.(2007). Abnormal fMRI adaptation to unfamiliarfaces in a case of developmental prosopamnesia.Current Biology, 17, 1259–1264.
Yardley, L., McDermott, L., Pisarski, S., Duchaine,B. C., & Nakayama, K. (2008). Psychosocial conse-quences of developmental prosopagnosia: A problemof recognition. Journal of Psychosomatic Research, 65,445–451.
Yin, R. K. (1969). Looking at upside-down faces.Journal of Experimental Psychology, 81(1), 141–145.
Young, A. W., Hellawell, D., & Hay, D. C. (1987).Configurational information in face perception.Perception, 16, 747–759.
Yovel, G., & Duchaine, B. C. (2006). Specialized faceperception mechanisms extract both part andspacing information: Evidence from developmentalprosopagnosia. Journal of Cognitive Neuroscience,18(4), 580–593.
COGNITIVE NEUROPSYCHOLOGY, 2009, 26 (5) 455
DIAGNOSING PROSOPAGNOSIA WITH CMFT AND CFPT
Downloaded By: [McKone, Elinor] At: 02:50 22 January 2010