cognitive load for configuration comprehension...
TRANSCRIPT

JOHN JR-HUNG LIN and SUNNY S. J. LIN
COGNITIVE LOAD FOR CONFIGURATION COMPREHENSIONIN COMPUTER-SUPPORTED GEOMETRY PROBLEM SOLVING:
AN EYE MOVEMENT PERSPECTIVE
Received: 17 July 2013; Accepted: 2 November 2013
ABSTRACT. The present study investigated (a) whether the perceived cognitive load wasdifferent when geometry problems with various levels of configuration comprehensionwere solved and (b) whether eye movements in comprehending geometry problemsshowed sources of cognitive loads. In the first investigation, three characteristics ofgeometry configurations involving the number of informational elements, the number ofelement interactivities and the level of mental operations were assumed to account for theincreasing difficulty. A sample of 311 9th grade students solved five geometry problemsthat required knowledge of similar triangles in a computer-supported environment. In thesecond experiment, 63 participants solved the same problems and eye movements wererecorded. The results indicated that (1) the five problems differed in pass rate and in self-reported cognitive load; (2) because the successful solvers were very swift in patternrecognition and visual integration, their fixation did not clearly show valuableinformation; (3) more attention and more time (shown by the heat maps, dwell time andfixation counts) were given to read the more difficult configurations than to theintermediate or easier configurations; and (4) in addition to number of elements andelement interactivities, the level of mental operations accounts for the major cognitiveload sources of configuration comprehension. The results derived some implications fordesign principles of geometry diagrams in secondary school mathematics textbooks.
KEY WORDS: cognitive load, configuration comprehension, eye movement, geometrydiagram, problem solving
INTRODUCTION
Background
Geometry problems in secondary textbooks usually provide a simpleinstructional text posed with a diagram. To solve a problem, a student hasto understand the text and read the diagram for familiar configurationsthat he/she has previously learned, as the familiar patterns may help theindividual connect to relevant geometry concepts from memory thatsupport making effective inferences and numerical computations, thusleading to a solution. Studies have found that configuration comprehen-sion is a source of difficulty for students (Bobis, Sweller & Cooper,1994). Unfortunately, this crucial issue for math teachers, textbook
International Journal of Science and Mathematics Education (2014) 12: 605Y627# National Science Council, Taiwan 2013

designers, students and parents has yet to be fully and carefullyinvestigated due to the lack of proper techniques (Epelboim & Suppes,2001). For example, the recent development of eye movement protocolsmade the survey of the online process of configuration comprehensionpossible. Accordingly, it appears that eye movement protocols have someevident advantages over traditional written or spoken protocols, as eyemovement protocols do not require extra effort by the participant nor is itdisruptive. Furthermore, eye movements are a genuine, integral part of thegeometry configuration comprehension process.
However, using the eye movement technique to study configurationcomprehension is not without its challenges. Among the manycommon problems inherent in this type of research, Ratwani,Trafton, & Boehm-Davis (2008) suggest that the only possibly usefulapproach to interpret eye movement data is to work within a specifictheoretical framework.
In this study, we attempt to identify the locus of these difficulties basedon the cognitive load theory (Sweller, 1988). Accordingly, we monitoredstudents’ eye movement patterns as they read and prepared to solvegeometry problems. We constructed serial problems of similar trianglesholding most sources of extraneous cognitive loads constant to reduce thecomplexity of cognitive load sources. The comparison of the pass rate andthe subjective cognitive load rating (Paas, 1992) made it possible toevaluate the extent to which problem solvers comprehended theconfiguration, while self-report confirmed the sources of the difficulties.The use of eye movements made it possible to compare on-lineconfiguration comprehension patterns for successful versus unsuccessfulproblem solvers during a realistic, complex cognitive task (Grant &Spivey, 2003; Just & Carpenter, 1985). From the perspective of eyemovement, researchers can more objectively observe learners’ cognitiveprocesses during geometry problem solving. Specifically, researchers cangain insights into the difficulties that learners perceived while problemsolving.
The Present Study
In general, the present study investigated (a) the perceived cognitive loadand pass rate of several carefully designed geometry problems, (b) whatcognitive load sources did students explicitly notice and (c) whether eyemovement patterns show sources of cognitive load in configurationcomprehension for various difficulty levels of problems and (un)success-ful levels of performance.
JOHN JR-HUNG LIN AND SUNNY S. J. LIN606

REVIEW OF LITERATURE
Cognitive Load
Cognitive load theory has been widely used to describe the load of a human’scognitive system when a task is performed (Chandler & Sweller, 1991;Sweller & Chandler, 1991). In the recent decades, the theory has been greatlyadapted as a framework for researchers to improve instructional outcomes(Paas, Renkl & Sweller, 2003). The cognitive resource of the human cognitivesystem, such as attention or working memory, is limited. Therefore, acomplex task would impose heavier loads on the system than a simpler task.Cognitive load consists of three components (Paas, Tuovinen, Tabbers &VanGerven, 2003). First, the intrinsic cognitive load is primarily caused by thenumber of elements that must be processed simultaneously and the inter-relationship between these elements (Sweller, Ayres & Kalyuga, 2011).Second, extraneous cognitive load results from unnecessary instructionaldesigns. Such a design imposes a higher extraneous cognitive load on learnersthan designs with no irrelevant materials (Park, Moreno, Seufert & Brunken,2010). The last type of cognitive load, germane cognitive load, is defined asthe load of the human cognitive system when a schema corresponding to aspecific learning task is acquired or integrated with the previous schema(Holm et al. 2009; Paas & van Merriënboer, 2006). Although all three loadsconsume cognitive resources, they have distinct impacts on learning. Forexample, the intrinsic and extraneous loads tend to hinder learning, whereasgermane loads facilitate learning (Plass, Moreno & Brünken, 2010).
Methods for Measuring Cognitive Load
Two distinct approaches, subjective and objective measures, were adopted toevaluate cognitive load in performing a task (Paas et al. 2003b). In subjectivemeasures, learners are required to report the cognitive load they perceive asthey implement a task. Due to the nature of the multidimensional construct ofcognitive load, subjective techniques usually adopt a self-reportingquestionnaire with several subscales. For instance, the NationalAeronautics and Space Administration-Task Load Index (NASA-TLX)consists of six subscales, including mental demand, physical demand,temporal demand, frustration, effort and performance, which togetherrepresent mental workload in performing a task (Hart & Staveland, 1988).In contrast, Paas (1992) designed one item with a 9-point Likert scale tomeasure the amount of effort participants invest to complete a task.
On the other hand, objective measures often use physiological techniquesto detect changes in physiological variations of cognitive load. These
COGNITIVE LOAD FOR CONFIGURATION COMPREHENSION 607
methods include heart activities (e.g. changes in heart rate), eye activities(e.g. ratio of pupillary dilations) and brain activities (e.g. electroencepha-lography) (Holm et al., 2009). Researchers use specific instruments to collectquantitative data while participants are performing a task, thus allowing thelevel of “online” cognitive loads to be estimated. An objective measureparadigm provides a precise and spontaneous way of measuring cognitiveload. Mayer (2010) suggested that eye-tracking methodology was beneficialfor gaining an understanding of the perceptual processes while learning withgraphics. In addition, eye tracking can detect where viewers fixated andwhen they fixated (Rayner, 1998). Thus, eye tracking facilitates theunderstanding of not only what the attention procedure is but also how theattention procedure progresses (Mayer, 2010).
Geometry Problem Solving
Geometry problems consistently require the presentation of a diagram that iscentral to the problem (Laborde, 2005; Larkin & Simon, 1987; Sweller,Mawer & Ward, 1983). The diagram provides a useful, readily visualizedrepresentation of the problem (Sweller et al., 1983). Cognitive loadresearchers have yet to thoroughly analyze the sources of difficulty associatedwith configuration comprehension in reading the diagrams that accompanythe geometry problems as well as when preparing to solve the problems (Just& Carpenter, 1985). Among the limited evidence, Sweller et al. (1983) foundthat geometry experts had learned a variety of geometric configurations towhich they readily apply the appropriate theorems. Most often, cognitive loadtheorists use geometry problems (such as major–minor arc, interior angle,exterior angle, right-angle triangles in a two-dimensional space with theapplication of trigonometric ratios and Pythagorean principles with thesetriangles) to examine the effects of the tasks, such as worked examples (Paas& vanMerriënboer, 1994; Schwonke, Renkl, Salden &Aleven, 2010) and thedevelopment of expertise from a mean-ends strategy toward a forwardstrategy (Sweller et al., 1983). For example, in an experiment conducted bySweller et al. (1983), a geometric diagram was presented on a visual screen.Solvers had to find a specific angle using the following theorem: Each exteriorangle of a triangle is equal to the sum of the interior opposite angles.
Eye Movement in Configuration Comprehension
The eye-tracking methodology has been applied to study online cognitiveprocessing in reading (Rayner, 1998) and problem solving (Hegarty &Just, 1993; Hegarty, Mayer & Green, 1992; Hegarty, Mayer & Monk,1995), as this methodology provides researchers a promising way to study
JOHN JR-HUNG LIN AND SUNNY S. J. LIN608

what people think when they see something, such as a text or an object(Hyona, 2010). However, this method has only recently been applied tostudy the design principles of instructional material. Mayer (2010)commented that eye-tracking methodology contributed to understandinghow a particular instructional design influences learning. Examplesinclude adopting various eye movement indicators based on eye fixationsto investigate a learner’s perceptual processing during learning (Boucheix& Lowe, 2010; Meyer, Rasch & Schnotz, 2010; Ozcelik, Arslan-Ari &Cagiltay, 2010).
With respect to configuration comprehension, Carpenter and Shah(1998) suggest two cognitive stages. These include (1) the patternrecognition stage, which leads to the encoding of a visual pattern byforming a visual chunk, and (2) the interpretive stages, which translate thepattern into its quantitative and qualitative meanings and relate thisinformation to the referents in the diagram. These processes are repeatedin a cyclical manner for each visual chunk in the diagram, with each cycleinterpreting a single chunk. A model proposed by Gillan (1995) suggeststhat there are five functional component stages when people interact withgraphs during the process of completing tasks, which include (1)searching for the spatial location of an indicator, (2) encoding the valueof the indicator, (3) performing arithmetic operations on the encodedvalues, (4) comparing the spatial relations of the indicators and (5)responding. The fourth stage in which spatial relations in a diagram mustbe identified for information integration is critical for geometric problemsolving. Furthermore, when solvers used the graphs to make comparisons,they focused on the spatial metaphor of the graph (Gillan, 1995).Therefore, different graphs influence solving processes differently, eventhough the problems applied the same theorems or properties. Todemonstrate this cyclical process, Carpenter and Shah (1998) examinedgraph readers’ transitions between regions of the diagram. Readers’fixations cycled between different regions for each of the visual chunksrepresented in the diagram, suggesting that readers cycled betweendifferent stages of processing. As diagram complexity increased (i.e. thenumber of unique visual chunks increased), the number of transitionsbetween regions of the diagram increased, suggesting that a singleprocessing cycle was required for each chunk in the diagram. Similarly,Ratwani et al. (2008) introduce two components that are needed to form acoherent representation of the graph: visual and cognitive integration.Verbal protocols and eye movement data provide strong support for bothof these components. Visual integration involved the explicit formation ofvisual clusters of information, while cognitive integration involved the
COGNITIVE LOAD FOR CONFIGURATION COMPREHENSION 609
explicit comparison of these visual clusters to the referents and werecritical to other visual clusters to form a coherent representation. Thus, thevisual clusters formed during visual integration served as objects similarto units that could then be used to reason about the graph during cognitiveintegration. In this study, we expect that when reading a geometrydiagram, readers need to identify the critical chunks of the graphic for thefixation to be placed in the informational areas. The readers must thenscan each visual chunk to form a proper spatial relation for a coherentrepresentation to connect/activate familiar configurations that werepreviously learned to make an effective inference for problem solving.
Little research has been conducted to investigate participants’ onlineconfiguration comprehension processing when solving geometry prob-lems from a cognitive load perspective. The present study used eyetracking incorporated with a subsequent writing comprehension test toinvestigate both online and offline cognitive load while reading diagramsthat accompany geometry problems. Experiment 1 explored the relation-ships between difficulty and self-reporting cognitive load, while the goalsof experiment 2 were to examine what cognitive load sources studentsexplicitly noticed/used and whether eye movement patterns show sourcesof cognitive load in comprehending geometry configurations.
EXPERIMENT 1
The properties of similarity are fundamental in learning geometry. Accordingto Competence Benchmarks S-4-15 for Grades 1–9 Curriculum Guidelinesin Taiwan, students should be able to comprehend the similarity properties oftriangles and apply the corresponding properties to solve problems and makeinferences (Ministry of Education, ROC, 2011). Similarly, the CommonCore Georgia Performance Standards (CCGPS) state that students should usecongruence and similarity criteria for triangles to solve problems and to proverelationships between geometric figures (Georgia Department of Education,USA, 2013). Considering the importance of the similarity properties andtheir ecological validity, we designed five pairs of similar triangles and askedthe participants to apply similarity properties to calculate the length of aspecific side of a triangle. To find an accurate solution, the individual mustidentify possible similar triangles and recognize the corresponding congruentangles and the corresponding sides that are of the same proportion. Thediagrams were designed to have various levels of cognitive load. After thecompletion of each task, the individual was asked to report the level ofcognitive load. The authors were interested in determining whether the self-
JOHN JR-HUNG LIN AND SUNNY S. J. LIN610
reported cognitive loads and the pass rate changes would align withdesignated levels of cognitive load in configuration comprehension.
METHOD
Participants
Given that the similarity properties of triangles were taught in grade 9 inTaiwan, we extensively conducted this research using grade 9 studentswho had just learned the similarity properties. Using the conveniencesampling method (O’Leary, 2004), 311 participants (146 males and 165females) were selected from five junior high schools in Taiwan. Allparticipants were 14 to 15 years of age. Consents were obtained fromparticipants’ parents and from the administrators of the schools, and allparticipants received a gift equivalent to approximately US $2.
Materials and Procedure
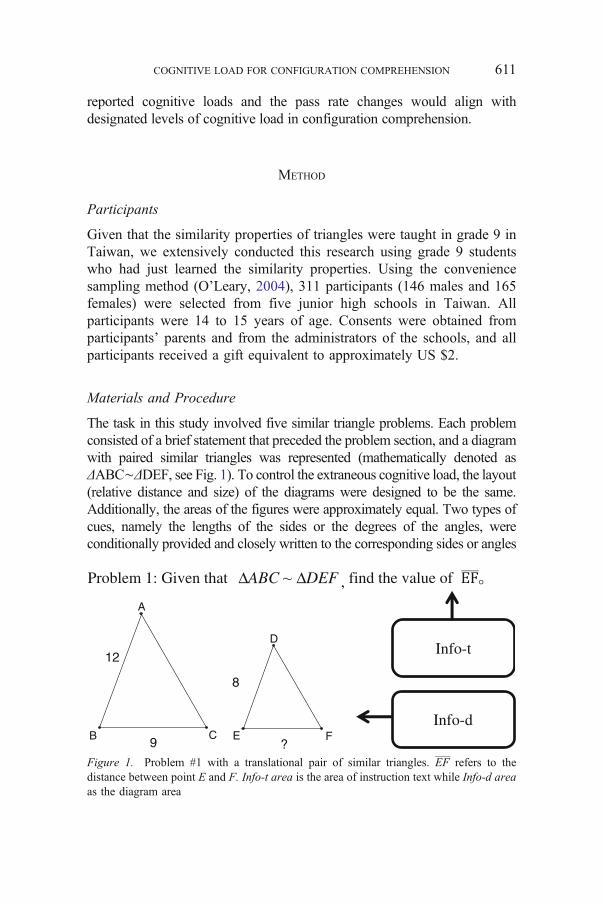
The task in this study involved five similar triangle problems. Each problemconsisted of a brief statement that preceded the problem section, and a diagramwith paired similar triangles was represented (mathematically denoted asΔABC∼ΔDEF, see Fig. 1). To control the extraneous cognitive load, the layout(relative distance and size) of the diagrams were designed to be the same.Additionally, the areas of the figures were approximately equal. Two types ofcues, namely the lengths of the sides or the degrees of the angles, wereconditionally provided and closely written to the corresponding sides or angles
Problem 1: Given that ΔABC ΔDEF , find the value of
?
8
9
12
C F
A
D
EBInfo-d
Info-t
Figure 1. Problem #1 with a translational pair of similar triangles. EF refers to thedistance between point E and F. Info-t area is the area of instruction text while Info-d areaas the diagram area
COGNITIVE LOAD FOR CONFIGURATION COMPREHENSION 611

on the appropriate diagram. To test whether the order of the five problemswould influence participants’ responses (denoted as the period effect) andwhether the preceding problem will affect the answers to the current problem(denoted as the carry-over effect), a William’s square design was used togenerate five distinct sequences of the problems (Xu, 2006). That is, in differenttime periods, each class answered the ten problems in varying sequences.Participants were required to solve for some unknown angles or sidesaccording to the similarity property of triangles. After performing thetasks, participants were required to answer the perceived cognitive loadwhile solving each problem (Paas et al. 2003b). The procedures were asfollows: (1) The homeroom teacher first announced the purposes of thestudy and the participants completed the consent form. (2) The problemsheets, with the sequence (period) of five problems randomly placed, weredistributed to all students. No cues were given in the test phase, and studentswere not allowed access to any references. (3) Students were informed thatthe maximal time to solve a problem and complete the NASA-TLXquestionnaire was 180 s. They were also told that they should write down theproblem-solving processes as clearly as possible. (4) After completing theexperiment, the results were scored by awarding one point for each correctanswer and zero points if there was no answer or there was an incorrectanswer. No partial scores were awarded.
With respect to the cognitive load, three characteristics, namely the numberof informational elements, level of element interactions and level of mentaloperations were assumed to account for the increasing difficulty. Figure 1 andthe diagram comprehension stages, as proposed by Ratwani et al. (2008), wereused to describe the above three characteristics (see Table 1).
1. The number of informational elements: An individual would processvisual integration that involves identifying a visual cluster of criticalinformation. Reading Fig. 1, one would find the four most salientinformation elements (e.g. lengths of sides of two triangles = 912, 9, 8 andEF ). The five problems were designed to have the same (four) salientinformation elements (see Fig. 2).
2. Level of mental operation: In Fig. 1, the spatial relation of the pairs ofsimilar triangles is in translation such that a simple mental operationmust be performed when the individual reads one of the triangles andthen moves to the right (or left) to find the similar second triangle forthe corresponding angles. In the other four problems, mentaloperations such as flip-over or mental rotation to compare one anglein the first triangle to the corresponding angle in the second trianglewould sometimes be required (see Table 1).
JOHN JR-HUNG LIN AND SUNNY S. J. LIN612

TABLE
1
Passrates,means
(SDs)
anddiagram
characteristics(n
=31
1)
Problem
#Pass
rate
Cl1
Cl2
Cl3
Cl4
Cl5
Cl6
Num
ber
elem
ents
Mentalop
erations
Inter-actio
nsA:B
=C:D
1.78
4.28
(4.71)
3.24
(3.62)
3.23
(3.54)
3.94
(4.15)
14.80
(6.61)
3.34
(4.12)
4Straigh
tforward
1step
simple
mapping
2.82
4.57
(5.14)
3.54
(4.22)
3.44
(3.91)
4.22
(4.48)
14.69
(6.54)
3.11
(3.91)
4Check
correspo
ndence
angels
1step
overlap
mapping
3.83
4.33
(4.84)
3.32
(3.67)
3.47
(3.97)
4.05
(4.18)
14.88
(6.43)
3.27
(3.96)
4Check
correspo
ndence
angles
1step
flip-over
mapping
4.71
4.26
(4.86)
3.33
(3.84)
3.44
(3.90)
3.87
(4.05)
14.42
(6.89)
3.10
(3.69)
4Check
correspo
ndence
angles
1step
vertical
mapping
5.58
7.36
(6.38)
5.10
(5.21)
5.42
(5.46)
6.74
(5.86)
12.24
(7.22)
4.53
(5.00)
4aNeedmentalrotatio
nto
check
correspo
ndence
angles
2step
rotatio
nmapping
total
–4.96
(5.35)
3.71
(4.21)
3.80
(4.28)
4.56
(4.72)
14.21
(6.81)
3.47
(4.19)
–
Mentaloperations
referto
thecrucialcognition
tofind
similar-triangle
pattern.For
theconfigurationpattern
ofeach
problem,please
seeFig.2
Cl1–C
l6cognitive
load
itemsof
NASA-TLX,Cl1
mentaldemand,
Cl2
physical
demand,
Cl3
temporaldemand,
Cl4
performance,Cl5
effort),Cl6
frustration
a One
beinghidd
en
COGNITIVE LOAD FOR CONFIGURATION COMPREHENSION 613

Successfully solver Unsuccessfully solver#1 ID 4063 ID 3140
#2 ID 3260 ID 4160
#3 ID 3041 ID 3120
#4 ID 3260 ID 3070
#5 ID 3130 ID 3250
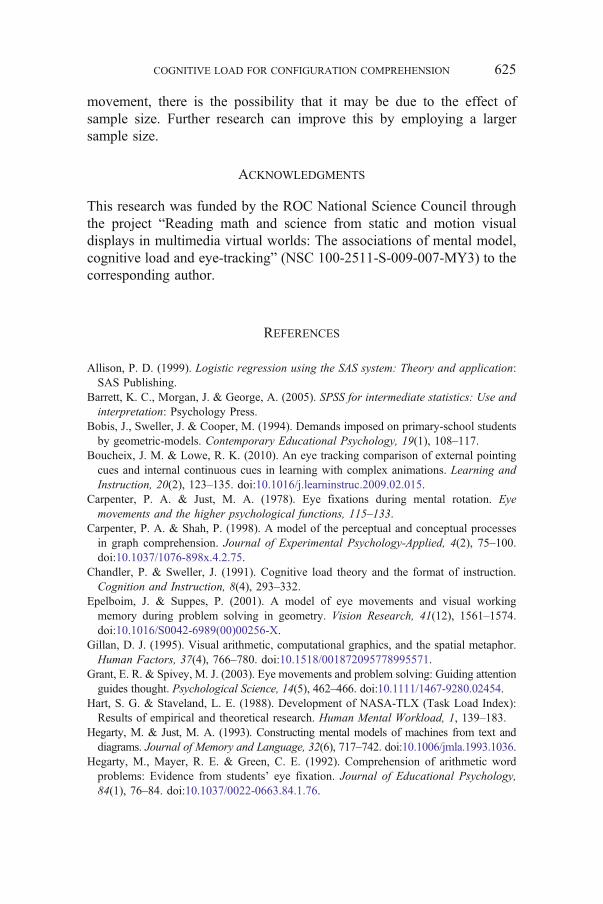
Figure 2. Heat maps of successful and unsuccessful problem solvers while solvingproblem #1 to problem #5
JOHN JR-HUNG LIN AND SUNNY S. J. LIN614

3. Level of element interactions: After stage 1, cognitive integrationwould occur involving the explicit comparison of the visual clusters toprior knowledge and the critical comparison to other visual clusters toform a coherent representation. The concept of similar triangles wouldbe retrieved, the problem solver would recall that corresponding sidesare in proportion, and they would then derive the appropriate equations(e.g. 12:8 = 9:EF for Fig. 1). This involved one interaction amongfour elements. The other four problems (see Fig. 2) were designed tohave only one equation to show the interaction of informationalelements; however, the interaction would be a simple mapping, a flip-over mapping or a rotational mapping of the corresponding sides.
Problem-Solving Sheet
The problem-solving sheet includes two sections, the instructional sectionand the problem section. The instructional section explains the proceduresof the experiment and illustrates how to complete the NASA-TLXquestionnaire using a 20-point Likert scale survey.
Background Information and Prior Knowledge Measures
All participants were required to identify their gender, their finalmathematics score for the last semester, their first monthly mathematicsexam score for the current semester and their first monthly Chinese examscore. These three scores were used to measure participants’ priorknowledge.
Cognitive Load Measure
A NASA-TLX questionnaire consisting of six items (mental demand,physical demand, temporal demand, performance, effort and frustration)was presented after each problem (Hart & Staveland, 1988).
RESULTS
Model 1: Effects of Problem, Prior Knowledge Order and Carry-Overon Pass Rate
Table 1 presents pass rates, means (standard deviations), numbers ofinformational elements, levels of mental operations and levels ofinformation interactions. To test whether the problems had different pass
COGNITIVE LOAD FOR CONFIGURATION COMPREHENSION 615

rates, we controlled two error sources: the sequencing of the problems(period) and the effect of correctly solving the previous problem on thepass rate of the next problem (carry over). A multiple logistic regressionwas also conducted (Allison, 1999). The problem, period, carry-over andprior knowledge were the predictors, and the pass rates were the response.The result revealed that the pass rate can be significantly predicted by theaforementioned four predictors, χ2 = 705.24,df = 30,N = 3,110,p G .001. Upon closer examination, the pass rates were significantlydifferent among the problems #1 to #5, χ2 = 432.07,df = 9,p G .001.With regard to prior knowledge, Math had significant effects on the passrate. For Math 1: χ2 = 26.85,df = 1,p G .001; for Math 2: χ2 = 90.02,df=2,p G .001. The scores related to exams for Chinese had nosignificant effect on the pass rate, χ2 = 1.60, df = 1,p = .201.Furthermore, the period and the carry-over effects were not significant,χ2 = 7.86,df = 9,p = .55 and χ2 = 12.24,df = 9,p = .200, respectively.
Model 2: The Predictive Effect of Various Cognitive Load Indicatorson the Pass Rate
A multiple logistic regression was conducted with the six NASA-TLXitems as the predictors and the pass rate as the response to test whether theNASA-TLX could predict the pass rates. The results revealed that thepass rate can be significantly predicted by the NASA-TLX items,χ2 = 668.83,df = 6,N = 3,110,p G .001. Furthermore, among all sixitems, the pass rate was significantly predicted by mental demand, physicaldemand, effort and frustration. The odds ratio of mental demand was .863,implying that every unit increase in the mental demand yielded a 14.8 %decrease in the odds that a participant would correctly solve the problem.
CONCLUSION
The results of study 1 suggest that the pass rates for the five similartriangle problems were not identical when controlling for prior knowl-edge, problem order and the carry-over effect. Though prior mathknowledge was a significant predictor of the pass rate for a problem,the pass rate for problem #5 was significantly lower than the pass rates forthe other four problems, which had simpler and clearer configurationpatterns of similar triangles. The low pass rate for problem #5 maysuggest that the participants had difficulties in configuration comprehen-sion, such as difficulty (1) identifying a hidden informational element for
JOHN JR-HUNG LIN AND SUNNY S. J. LIN616

a successful solution and (2) mentally rotating a triangle to form afamiliar configuration pattern of similar triangles. In addition, self-reported cognitive load supported the hypothesis that five problems haddifferent levels of perceived cognitive load. The perceived cognitive loadratings of problem #5 were the highest among the five problems. The passrate would be lower if mental demand or frustration ratings were higher
EXPERIMENT 2
Based on the five similar triangle problems examined in study 1, we usedthe eye-tracking method to compare online configuration comprehensionpatterns for successful versus unsuccessful solvers during a realistic,complex cognitive task. Specifically, we wanted to know whether eyemovement patterns show sources of cognitive load in configurationcomprehension when the participants successfully versus unsuccessfullysolve the problem.
METHOD
Participants
Experiment 2 is used to investigate whether eye movement is sensitive tothe perceived difficulty while problem solving. To reduce otherpossibilities (e.g. prior knowledge) that could result in increasing thedifficulty in performing the tasks, 63 participants (23 males and 40females), who were randomly selected from a senior high school innorthern Taiwan, participated in this study. All participants were 17 to19 years of age.
MATERIALS
All materials were controlled by a host computer that presented sevenpages of slides, namely slide1 to slide7 for convenience. Slide1 was thepractice page, slide2 was an introduction to the procedure of the ongoingtask and Slide3 to slide7 were the five problems used in experiment 1.
Apparatus
An EyeLink 1000 desktop remote eye-tracker system (SR Research Ltd.,Canada) with a sampling rate of 500 Hz and an accuracy of 0.5 degrees
COGNITIVE LOAD FOR CONFIGURATION COMPREHENSION 617

was used to record the eye movement of participants. The experimentalmaterials were implemented on an Intel duo core computer running at3.0 GHz in a windows XP service pack 2 environment and displayed on a22-inch monitor (resolution, 1,024×768; refreshing rate, 85 Hz).Participants sat in front of the monitor at a distance of 600 mm. Beforeconducting the experiment, each participant had to calibrate until gazedurations could be validated. A digital pen and a touch tablet device(Wacom Corporation, Saitama Japan) were used to input participants’written answers. The screenshots of solutions for each problem weresaved for subsequent analyses.
Measure
Eye Movement Data (On-line). To describe an entire picture of aparticipant’s visual attention and configuration comprehension of the geometrydiagrams, we analyzed the heat maps (shown in Fig. 2). In addition, wedesigned two areas of interest (AOI), the informational text (Info-t) and theinformational diagram (Info-d), to monitor eye movement behaviors of solvers.Based on previous research (Mayer, 2010; Rayner, 1998), we monitored threeeye movement indicators, dwell time (DT), fixation count (FC) and run count(RC). Dwell time is the summation of the duration across all fixations on thecurrent AOI, fixation count is defined as the number of fixations falling withinthe AOI, and run count is defined in terms of the number of times the AOI wasentered and left. The DT and FC are used to measure the time that participantsspent on the relevant areas. A longer DT ormore FC indicated that learnersmayrequire more cognitive processes for a specific area (Carpenter & Just, 1978).Both DT and FC are pervasively used in eye movement research on problem-solving (Carpenter & Just, 1978; Grant & Spivey, 2003). The RC is apromising indicator that represents the perceived difficulty associated with aspecific area. For example, Hegarty et al. (1992) proposed that some studentsrequired more re-readings of previously fixated words for difficult problems.We expected problem solvers to have higher FCs and RCs and longer DTs onthose areas they felt were especially difficult.
Perceived Difficulty Measurement (Offline). After solving each problem,the participants were required to complete the self-reporting cognitiveload questionnaire. The single item constructed by Paas (1992) adopted anine-point Likert scale that ranges from 1 (low) to 9 (high). Furthermore,responses to an open-ended question asking for the source of difficulty insolving problems were collected.
JOHN JR-HUNG LIN AND SUNNY S. J. LIN618

Procedure
First, participants were required to sit in front of a computer equippedwith a desktop eye tracker and to adjust the seat until the distancebetween the participant and the monitor was approximately 600 mm.Second, prior to the experiment, each participant was calibrated to ensurethe validity of eye movement data. Third, a slide was presented on thescreen demonstrating how to use the handwriting device, and participantswere allowed to practice on the same screen. Fourth, the definition ofsimilarity and the corresponding formula were presented on a slide andparticipants were told that these concepts should be used on subsequenttasks. Fifth, the participants began solving the problems using the tabletdevice while the eye tracker simultaneously recorded eye movements.
RESULTS
Pass Rate and Cognitive Load
A series of one-way repeated-measures ANOVAs was conducted to testwhether different problems had different pass rates. The results indicatethat the pass rates varied across problems, F(4, 53) = 29.50, p G 0.001,η2 = .69. Multiple comparisons revealed that pass rates were notsignificantly different among problems #1 and #2 or #3 and #4. In sum,problems #1 and #2 were the easiest, problems #3 and #4 weremoderately difficult and problem #5 was of the most difficult.
A multiple logistic regression was conducted with prior knowledge andthe level of cognitive load as the predictors and pass rates as the responsesto test whether problems with various cognitive loads would havedifferent pass rates after controlling for prior knowledge. The resultsrevealed that the pass rates could be significantly predicted by thecognitive loads, χ2 = 39.18, df = 1, N=285, p G .001, while nosignificant effect of prior knowledge was observed, p’s 9 .05. The oddsratio of the cognitive load was .70, indicating that for every unit ofincrease in the cognitive load rating, there was a 30 % decrease in theodds that a participant would correctly solve the problem.
Eye-Tracking Data
A series of one-way repeated-measures ANOVAs was conducted to testwhether eye movement indicators would behave differently acrossproblems. The results showed that dwell time with F(4, 53) = 19.01,
COGNITIVE LOAD FOR CONFIGURATION COMPREHENSION 619

p G .001,η2 = .59, fixation countwithF(4, 53) = 19.15, p G 0.001,η2 = .59and run count with F(4, 53) = 7.82, p G .001 were significantly differentacross problems. A post hoc comparison showed that the participants hadlonger dwell time and greater fixation count for the more difficult problems(problems #5 9 #4, #3 9 #2 and #1), and run count showed a similar effectwhere participants scanned back and forth more frequently on problems withhigher difficulty.
A series of Mann–Whitney tests was used to test whether there weredifferences between successful and unsuccessful problem solvers withrespect to eye movement indicators. The heat maps of successful solversare listed in the left column of Fig. 2, while the heat maps of theunsuccessful solvers are in the right column. We specifically selected theheat maps from various participants to demonstrate the general patterns.The red or orange spots (i.e. heat areas) represent locations where theinformation was processed for a longer time and processed more deeplyby participants, while yellow and green colors represent locations wherethe information was only minimally processed. The eye movementpatterns of unsuccessful problem solvers and the comparison betweenpatterns of successful and unsuccessful problem solvers yields interestingevidence.
We found three characteristics of unsuccessful solvers. (1) Theyscanned the whole diagram extensively. For example, in problem #1, thewhole heat areas are larger for an unsuccessful participant, ID 3140,compared with those of a successful participant, ID 4036. (2) Theyfixated lengthily at the informational areas of the triangles, such as thelength of each side (in problem #1: 12, 9, 8, EF ), which are the criticallyknown and unknown conditions. For example, in problem #1, theunsuccessful participant, ID 3140, fixed longer, with the heat mapshowing four red spots compared with the green color area of thesuccessful participant, ID 4036. (3) They looked attentively at theintersection of the triangle pairs showing red-orange colors on theinteraction area (i.e. ID 4160 in problem #2, ID 3120 in problem #3 andID 3070 in problem #4) compared with those of their successfulcounterparts.
The Relations Between Cognitive Load and Eye Movement Indicators
To investigate the extent to which cognitive loads are associated with eyemovement indicators (i.e. FC, DT and RC) on the problem area, the linearrelationships between the cognitive loads and the eye movementindicators were measured using Pearson’s correlation (Barrett, Morgan,
JOHN JR-HUNG LIN AND SUNNY S. J. LIN620

& George, 2005). Table 2 presents the results of statistical analysesincluding degrees of freedom, correlation coefficients and p values foreach problem. Correlation coefficients between cognitive loads and FCsranged between .312 and .604. Similarly, correlation coefficients betweencognitive loads and DTs ranged between .379 and .625. The resultssuggest that there is a consistent increase in FC and DT on the problemarea as the perceived cognitive load increases.
Source of Perceived Difficulty
With regard to the source of the perceived cognitive load, 37 (66.1 %)participants reported that the need to rotate the graph was their primarysource of difficulty, and 29 (51.8 %) the inactive/blur of the correspond-ing concepts was the primary source of difficulty. Other sources ofperceived difficulty were relatively low in proportion (less than 20 %each), such as unfamiliarity with the equation, inability to find knownconditions or too many unknown variables.
TABLE 2
Correlation coefficients (significant levels) between cognition and eye-movementindicators when problems were solved (n = 311)
Problem Mental operationsInteractionsA:B = C:D df FC DT RC
#1 Straightforward 1 stepsimplemapping
55 .604*** .625*** .368**
#2 Check correspondenceangles
1 stepoverlapmapping
56 .483** .467** .142
#3 Check correspondenceangles
1 step flip-overmapping
56 .483** .471** .246
#4 Check correspondenceangles
1 stepverticalmapping
57 .312* .379** .110
#5 Need mental rotation tocheck correspondenceangles
2 steprotationmapping
56 .460** .480** .130
Mental operations refer to the crucial cognition to find similar-triangle pattern. For the configurationpattern of each problem, please see Fig. 2*p G .05; **p G .01; ***p G .001
COGNITIVE LOAD FOR CONFIGURATION COMPREHENSION 621

CONCLUSION
The results indicate that more attention and more time were given toreading the more difficult configurations (problem #5) than to reading theintermediate and easier configurations (problems #3 and #4 and problems#1 and #2).
The heat maps, dwell time and fixation counts indicate that thesuccessful participants did not fixate as long as the unsuccessful ones onthe areas with crucial information (lengths of corresponding sides) foreffectively inferring and solving the problems. This comparison revealsthat our participants encoded the configuration and formed visual chunks(clusters of information), a process known as “the pattern recognitionstage”, as suggested by Carpenter and Shah (1998), or “the visualintegration stage”, as suggested by Ratwani et al. (2008). The illustrationof the successful solvers’ fixations (heat maps) did not clearly show anyevidence of this processing stage.
In addition, the eye data (run count and heat maps) also showed thatthey experienced “an interpretive stage” (Carpenter and Shah (1998) inwhich the pattern was translated into its quantitative and qualitativemeanings and this information was related to the referents found in theparticipants’ memory (prior knowledge of similar triangles). This stage isin accordance with “the cognitive integration stage”, as suggested byRatwani et al. (2008), whereby the readers formed visual clusters during aprevious visual integration stage that served as object-like units that couldthen be used to reason about the graph during cognitive integration. Bothrun counts and heat maps indicated that our participants scanned back andforth around several visual chunks (informational areas). The heat mapsof the unsuccessful problem solvers were more evident than those of thesuccessful problem solvers in demonstrating the cognitive interpretationstage in that they scanned more extensively the whole diagram andattended to the intersection of overlapping, flip-over, upside-down androtated triangles. We suggest that unsuccessful solvers have moredifficulties in forming spatial relations of visual chunks (correspondingangles and sides), translating the pattern into its quantitative andqualitative meanings and relating this information to the referents in theirmemories.
General Discussion
The present study designed five geometry problems and controlled theextraneous cognitive loads (Paas et al. 2003a). For example, the layout
JOHN JR-HUNG LIN AND SUNNY S. J. LIN622

(relative distance and size) of the diagrams were designed to be the same,and the areas of the figures were approximately equal. Two types of cues,lengths of the sides or degrees of the angles, were conditionally providedand closely written to the corresponding sides or angles on the diagrams.The participants were required to solve some unknown sides according tothe principles of similar triangles. Regarding the cognitive load (Swelleret al., 1983), three characteristics, including the number of informationalelements, the levels of element interactions and the levels of mentaloperations, were assumed to account for the increasing difficulty. In study1, we proved that problem #5 was the most difficult (lowest pass rate) andrequired the greatest amount of effort (largest cognitive load) when priorknowledge, problem order and carry-over effects were controlled. Themajor cognitive load sources in reading problem #5 were assumed to bethe configuration comprehension difficulties in which one of four knownconditions (lengths of corresponding sides in a pair of similar triangles)was hidden and the problem solvers had to rearrange the spatial relationof two similar triangles (i.e. to mentally rotate one of the triangles).
Using these five problems in study 2, we investigated what cognitiveload sources students explicitly noticed and whether eye movementpatterns revealed sources of cognitive load in configuration comprehen-sion for various difficulty levels of problems and successful levels ofperformance. The self-reported cognitive load sources included thedifficulties in viewing the diagrams to connect with the relevant concepts(fundamental properties of similar triangles and the length ratio ofcorresponding sides) and the limitations of cognitive functions tomentally manipulate the paired triangles. This result was supported bythe evidence that the participants spent more time reading the mostdifficult configurations of problem #5 than they did reading theconfigurations of the intermediate and easier problems.
With respect to configuration comprehension, the participants experi-enced three stages: (1) visual integration, (2) spatial relation identificationand (3) cognitive interpretation. Because the successful solvers were veryswift in pattern recognition and visual integration for a coherentrepresentation of similar triangles, the illustration of their fixation (heatmaps) did not clearly show evidence of the processing stages. First, thecomparison of the eye data between successful and unsuccessful problemsolvers demonstrated that in the visual integration stage, unsuccessfulproblem solvers look intensively at the areas with critical information(lengths of corresponding sides), as suggested by Carpenter and Shah(1998) and Ratwani et al. (2008). Second, because of the particulardesign, to understand some configurations (especially problem #5), the
COGNITIVE LOAD FOR CONFIGURATION COMPREHENSION 623

problem solvers must scan to organize meaningful spatial relations amongvisual chunks or information areas, which is in accordance with thespatial processing described by Gillan (1995). We assume that if thespatial relation of visual chunks is not a difficult source, the eye data maynot clearly reveal the processes involved in this stage. Finally, the visualclusters formed during the previous visual integration stage served asobject-like units that could then be used to reason about the graph duringcognitive integration. Both the run count and heat maps indicated that theparticipants scanned back and forth around several visual chunks(informational areas). The heat maps of the unsuccessful problem solverswere more evident than the successful ones in demonstrating thecognitive interpretation stage in that they scanned the whole diagrammore extensively and attended to the intersection of overlapping, flip-over, upside-down and rotated triangles.
In designing geometry diagrams, designers and teachers must be awareof the sources of the extraneous load as well as the intrinsic loads. Aneffective instructional approach is to reveal as many sources of theintrinsic load as possible. In this study, we proved that the number ofinformational elements, the level of element interactions, and the level ofmental operations are three major sources of cognitive loads inconfiguration comprehension, especially with respect to geometryproblem solving. Another cognitive load comes from the fact that readershave to experience all three stages, that is, visual integration, spatialrelation identification and cognitive interpretation. Thus, an effectiveinstructional approach could include the provision of a variety of workedexamples (Sweller et al., 1983) for beginning students. The diagrams inthe worked examples must be well designed and vary in the number ofinformational elements, in the levels of element interactions and in thelevels of mental operations. Teachers could then guide students throughthe three stages of configuration comprehension (i.e. visual integration,spatial relation identification and cognitive interpretation) using theworked examples.
Limitation
Because the aim of the present study was to investigate the relationshipbetween perceived difficulty and eye movement, to reduce otherpossibilities (e.g. low prior knowledge) that could result in increasingthe perceived difficulty in performing the tasks, students at grade 11 werechosen to participate in the second experiment. Although the statisticalresults indicate prior knowledge had no significant impact on eye
JOHN JR-HUNG LIN AND SUNNY S. J. LIN624
movement, there is the possibility that it may be due to the effect ofsample size. Further research can improve this by employing a largersample size.
ACKNOWLEDGMENTS
This research was funded by the ROC National Science Council throughthe project “Reading math and science from static and motion visualdisplays in multimedia virtual worlds: The associations of mental model,cognitive load and eye-tracking” (NSC 100-2511-S-009-007-MY3) to thecorresponding author.
REFERENCES
Allison, P. D. (1999). Logistic regression using the SAS system: Theory and application:SAS Publishing.
Barrett, K. C., Morgan, J. & George, A. (2005). SPSS for intermediate statistics: Use andinterpretation: Psychology Press.
Bobis, J., Sweller, J. & Cooper, M. (1994). Demands imposed on primary-school studentsby geometric-models. Contemporary Educational Psychology, 19(1), 108–117.
Boucheix, J. M. & Lowe, R. K. (2010). An eye tracking comparison of external pointingcues and internal continuous cues in learning with complex animations. Learning andInstruction, 20(2), 123–135. doi:10.1016/j.learninstruc.2009.02.015.
Carpenter, P. A. & Just, M. A. (1978). Eye fixations during mental rotation. Eyemovements and the higher psychological functions, 115–133.
Carpenter, P. A. & Shah, P. (1998). A model of the perceptual and conceptual processesin graph comprehension. Journal of Experimental Psychology-Applied, 4(2), 75–100.doi:10.1037/1076-898x.4.2.75.
Chandler, P. & Sweller, J. (1991). Cognitive load theory and the format of instruction.Cognition and Instruction, 8(4), 293–332.
Epelboim, J. & Suppes, P. (2001). A model of eye movements and visual workingmemory during problem solving in geometry. Vision Research, 41(12), 1561–1574.doi:10.1016/S0042-6989(00)00256-X.
Gillan, D. J. (1995). Visual arithmetic, computational graphics, and the spatial metaphor.Human Factors, 37(4), 766–780. doi:10.1518/001872095778995571.
Grant, E. R. & Spivey, M. J. (2003). Eye movements and problem solving: Guiding attentionguides thought. Psychological Science, 14(5), 462–466. doi:10.1111/1467-9280.02454.
Hart, S. G. & Staveland, L. E. (1988). Development of NASA-TLX (Task Load Index):Results of empirical and theoretical research. Human Mental Workload, 1, 139–183.
Hegarty, M. & Just, M. A. (1993). Constructing mental models of machines from text anddiagrams. Journal of Memory and Language, 32(6), 717–742. doi:10.1006/jmla.1993.1036.
Hegarty, M., Mayer, R. E. & Green, C. E. (1992). Comprehension of arithmetic wordproblems: Evidence from students’ eye fixation. Journal of Educational Psychology,84(1), 76–84. doi:10.1037/0022-0663.84.1.76.
COGNITIVE LOAD FOR CONFIGURATION COMPREHENSION 625

Hegarty, M., Mayer, R. E. & Monk, C. A. (1995). Comprehension of arithmetic wordproblems: A comparison of successful and unsuccessful problem solvers. Journal ofEducational Psychology, 87(1), 18–32. doi:10.1037/0022-0663.87.1.18.
Holm, A., Lukander, K., Korpela, J., Sallinen, M. & Muller, K. M. (2009). Estimatingbrain load from the EEG. The Scientific World Journal, 9, 639.
Hyona, J. (2010). The use of eye movements in the study of multimedia learning.Learning and Instruction, 20(2), 172–176. doi:10.1016/j.learninstruc.2009.02.013.
Just, M. A. & Carpenter, P. A. (1985). Cognitive coordinate systems: Accounts of mentalrotation and individual differences in spatial ability. Psychological Review, 92(2), 137.doi:10.1037/0033-295X.92.2.137.
Laborde, C. (2005). The hidden role of diagrams in students: Construction of meaning ingeometry. Meaning in Mathematics Education, 159–179.
Larkin, J. H. & Simon, H. A. (1987). Why a diagram is (sometimes) worth ten thousandwords. Cognitive Science, 11(1), 65–100. doi:10.1016/S0364-0213(87)80026-5.
Mayer, R. E. (2010). Unique contributions of eye-tracking research to the study oflearning with graphics. Learning and Instruction, 20(2), 167–171. doi:10.1016/j.learninstruc.2009.02.012.
Meyer, K., Rasch, T. & Schnotz, W. (2010). Effects of animation’s speed of presentationon perceptual processing and learning. Learning and Instruction, 20(2), 136–145.doi:10.1016/j.learninstruc.2009.02.016.
O’Leary, Z. (2004). The essential guide to doing research: Sage.Ozcelik, E., Arslan-Ari, I. & Cagiltay, K. (2010). Why does signaling enhance multimedialearning? Evidence from eye movements. Computers in Human Behavior, 26(1), 110–117. doi:10.1016/j.chb.2009.09.001.
Paas, F. (1992). Training strategies for attaining transfer of problem-solving skill instatistics: A cognitive-load approach. Journal of Educational Psychology, 84(4), 429–434. doi:10.1037/0022-0663.84.4.429.
Paas, F., Renkl, A. & Sweller, J. (2003a). Cognitive load theory and instructional design:Recent developments. Educational Psychologist, 38(1), 1–4.
Paas, F., Tuovinen, J. E., Tabbers, H. & Van Gerven, P. W. M. (2003b). Cognitive loadmeasurement as a means to advance cognitive load theory. Educational Psychologist,38(1), 63–71.
Paas, F. & van Merriënboer, J. J. G. (1994). Variability of worked examples and transferof geometrical problem-solving skills: A cognitive-load approach. Journal ofEducational Psychology, 86(1), 122–133. doi:10.1037/0022-0663.86.1.122.
Paas, F. & van Merriënboer, J. J. G. (2006). Optimising worked example instruction:Different ways to increase germane cognitive load. Learning and Instruction,16(2), 87–91.
Park, B., Moreno, R., Seufert, T. & Brunken, R. (2010). Does cognitive load moderate theseductive details effect? A multimedia study. Computers in Human Behavior.
Plass, J. L., Moreno, R. & Brünken, R. (2010). Cognitive load theory: CambridgeUniversity Press.
Ratwani, R. M., Trafton, J. G. & Boehm-Davis, D. A. (2008). Thinking graphically:Connecting vision and cognition during graph comprehension. Journal of ExperimentalPsychology-Applied, 14(1), 36–49. doi:10.1037/1076-898X.14.1.36.
Rayner, K. (1998). Eye movements in reading and information processing: 20 years ofresearch. Psychological Bulletin, 124(3), 372–422. doi:10.1037/0033-2909.124.3.372.
JOHN JR-HUNG LIN AND SUNNY S. J. LIN626

Schwonke, R., Renkl, A., Salden, R. & Aleven, V. (2010). Effects of different ratios ofworked solution steps and problem solving opportunities on cognitive load and learningoutcomes. Computers in Human Behavior.
Sweller, J. (1988). Cognitive load during problem solving: Effects on learning. CognitiveScience, 12(2), 257–285. doi:10.1016/0364-0213(88)90023-7.
Sweller, J. Ayres, P., & Kalyuga, S. (2011). Cognitive load theory: Springer.Sweller, J. & Chandler, P. (1991). Evidence for cognitive load theory. Cognition andInstruction, 8(4), 351–362.
Sweller, J. Mawer, R. F. & Ward, M. R. (1983). Development of expertise inmathematical problem solving. Journal of Experimental Psychology-General, 112(4),639–661. doi:10.1037/0096-3445.112.4.639.
Xu, H. (2006). Design and analysis of experiments, volume 2: Advanced experimentaldesign. Technometrics, 48(4), 571–571. doi:10.1198/tech.2006.s433.
National Chiao Tung UniversityHsin-Chu, Taiwan, Republic of ChinaE-mail: [email protected]
COGNITIVE LOAD FOR CONFIGURATION COMPREHENSION 627