coexpression of cd49b and lag-3 identifies human and mouse t regulatory type 1 cells
TRANSCRIPT

©20
13 N
atu
re A
mer
ica,
Inc.
All
rig
hts
res
erve
d.
a r t i c l e s
nature medicine advance online publication �
Tr1 cells were discovered in the peripheral blood of patients with severe combined immunodeficiency with long-term mixed chimerism after human leukocyte antigen (HLA)-mismatched fetal liver hematopoietic stem cell transplant (HSCT)1,2. Tr1 cells show strong immunosuppressive activity and are able to restore toler-ance in several immune-mediated diseases3–5. The secretion of high amounts of interleukin-10 (IL-10) and the killing of myeloid antigen-presenting cells (APCs) by granzyme B are the main mechanisms of Tr1-mediated suppression6,7. So far, specific biomarkers for Tr1 cells have not been identified, limiting their study and clinical application. Tr1 cells are distinguished from T helper type 1 (TH1), TH2 and TH17 cells by their unique cytokine profile and regulatory function. Tr1 cells secrete higher amounts of IL-10 than IL-4 and IL-17, which are the hallmark cytokines of TH2 and TH17 cells, respectively. Tr1 cells also secrete low amounts of IL-2 and, depending on the local cytokine milieu, can produce variable amounts of interferon-γ (IFN-γ), which together are the key cytokines that are characteristic of TH1 cells4. Forkhead box P3 (FOXP3) is not a marker of Tr1 cells, as its expression is low and transient after activation4. IL-10–producing Tr1 cells express inducible T cell co-stimulator (ICOS)8 and PD-1 (ref. 9), but these markers are not specific4,10. CD49b, the α2 integrin
subunit of very late activation antigen 2 (VLA-2), has been proposed as a marker for IL-10–producing T cells11; however, this protein is also expressed by human TH17 cells12. Moreover, mouse CD49b+ T cells secrete IL-10 (ref. 11) in addition to proinflammatory cytokines13. LAG-3, a CD4 homolog that binds with high affinity to MHC class II molecules, is expressed by mouse IL-10–producing CD4+ T cells14 but also by activated effector T cells15–18 and FOXP3+ regulatory T (Treg) cells19. We recently showed that human Tr1 cells express CD226 (also called DNAM-1), which is involved in the specific killing of myeloid APCs7. Overall, none of these markers has been confirmed to be selective for Tr1 cells.
Tr1 cell–based clinical approaches are limited largely by the inability to transfer a pure population of these cells. A high frequency of Tr1 cells has been correlated with a positive outcome after HSCT2,20, but the absence of suitable markers has made clinical screening for this type of Treg cell difficult. Hence, the availability of specific biomarkers of Tr1 cells would facilitate the transition of therapies targeting Tr1 cells from bench to bedside.
Here we profiled the gene expression of human Tr1 cell clones and identified CD49b and LAG-3 as being highly and stably expressed and preserved on mouse and human Tr1 cells. Coexpression of CD49b
1San Raffaele Telethon Institute for Gene Therapy (HSR-TIGET), Division of Regenerative Medicine, Stem Cells and Gene Therapy, San Raffaele Scientific Institute, Milan, Italy. 2Department of Immunobiology, School of Medicine, Yale University, New Haven, Connecticut, USA. 3I. Medizinische Klinik und Poliklinik, Universitätsklinikum Hamburg-Eppendorf, Hamburg, Germany. 4Department of Public Health and Cell Biology, Tor Vergata University, Rome, Italy. 5Bioflag, Technology Park Polaris, Pula, Italy. 6School of Life Sciences, Peking University, Beijing, China. 7Division of Experimental Medicine, University of California San Francisco, San Francisco, California, USA. 8University Centre for Statistics in the Biomedical Sciences (CUSSB), Vita-Salute San Raffaele University, Milan, Italy. 9Laboratorio di Immunogenetica e Biologia dei Trapianti, Fondazione Istituto Mediterraneo di Ematologia (IME), Policlinico Tor Vergata, Rome, Italy. 10Howard Hughes Medical Institute, Yale University School of Medicine, New Haven, Connecticut, USA. 11Vita-Salute San Raffaele University, Milan, Italy. 12These authors contributed equally to this work. 13These authors jointly directed this work. Correspondence should be addressed to M.-G.R. ([email protected]) or R.A.F. ([email protected]).
Received 16 January; accepted 27 March; published online 28 April 2013; doi:10.1038/nm.3179
Coexpression of CD49b and LAG-3 identifies human and mouse T regulatory type 1 cellsNicola Gagliani1,2,12, Chiara F Magnani1,12, Samuel Huber3,12, Monica E Gianolini1,4, Mauro Pala5, Paula Licona-Limon2, Binggege Guo6, De’Broski R Herbert7, Alessandro Bulfone5, Filippo Trentini8, Clelia Di Serio8, Rosa Bacchetta1, Marco Andreani9, Leonie Brockmann3, Silvia Gregori1,12, Richard A Flavell2,10,13 & Maria-Grazia Roncarolo1,11,13
CD4+ type 1 T regulatory (Tr1) cells are induced in the periphery and have a pivotal role in promoting and maintaining tolerance. The absence of surface markers that uniquely identify Tr1 cells has limited their study and clinical applications. By gene expression profiling of human Tr1 cell clones, we identified the surface markers CD49b and lymphocyte activation gene 3 (LAG-3) as being stably and selectively coexpressed on mouse and human Tr1 cells. We showed the specificity of these markers in mouse models of intestinal inflammation and helminth infection and in the peripheral blood of healthy volunteers. The coexpression of CD49b and LAG-3 enables the isolation of highly suppressive human Tr1 cells from in vitro anergized cultures and allows the tracking of Tr1 cells in the peripheral blood of subjects who developed tolerance after allogeneic hematopoietic stem cell transplantation. The use of these markers makes it feasible to track Tr1 cells in vivo and purify Tr1 cells for cell therapy to induce or restore tolerance in subjects with immune-mediated diseases.

©20
13 N
atu
re A
mer
ica,
Inc.
All
rig
hts
res
erve
d.
a r t i c l e s
� advance online publication nature medicine
and LAG-3 allows for the isolation of Tr1 cells and enables the puri-fication of highly suppressive human Tr1 cells from anergized T cell populations, which are currently being used in ongoing clinical trials. Notably, the use of these markers makes it feasible to track Tr1 cells in tolerant subjects.
RESULTSGene expression profile of human Tr1 cell clonesWe compared the transcriptome of human Tr1 cell clones to that of TH0 cell clones isolated from the peripheral blood of healthy donors and analyzed them at three time points: unstimulated or stimulated with monoclonal antibodies to CD3 and CD28 for 6 or 16 h. The high expres-sion of IL10 (ref. 6), GZMB (encoding granzyme B)7,20,21 and PDCD1 (encoding PD-1) (ref. 9 and Supplementary Fig. 1a), which are known to be expressed in Tr1 cells, measured in unstimulated and stimulated Tr1 cell clones validated the microarray expression data. The expres-sion profiles of Tr1 and TH0 cell clones were similar overall (Fig. 1a),
but a small number of transcripts were uniquely expressed in Tr1 cell clones (Fig. 1a). We identified 17 differentially expressed genes (DEGs) in Tr1 as compared to TH0 cell clones at all time points and identified 28 DEGs after activation (Fig. 1b,c).
Among the 17 DEGs identified in both unstimulated and stimulated Tr1 cells, we selected ITGA2 (encoding CD49b) and CD226 according to their P values and log2 fold change (log2FC) values (Supplementary Fig. 1b). As CD49b can also be expressed on effector TH cells12,13, we sought another marker that, in association with CD49b, could allow for the isolation of Tr1 cells. We selected LAG3 (Supplementary Fig. 1b), previously shown to be associated with Treg cell function15, which was highly upregulated in activated Tr1 cell clones. RT-PCR confirmed that the expression of ITGA2, CD226 and LAG3 was sig-nificantly higher in Tr1 than TH0 cell clones (P ≤ 0.005, P ≤ 0.0005; Supplementary Fig. 1c) and in Tr1-polarized cell lines, generated in vitro by activating naive CD4+ T cells in the presence of IL-10 and IFN-α and enriched for IL-10+ cells using an IL-10 secretion
assay, as compared to TH0 cell lines activated and cultured for 14 d in the absence of IL-10 and IFN-α (P ≤ 0.0005; Supplementary Fig. 1d). FACS analysis confirmed that Tr1 cell clones expressed significantly higher levels of CD49b and LAG-3 than TH0 cell clones (Fig. 1d). All T cell clones expressed CD226, but Tr1 cell clones showed higher mean fluorescence intensity (MFI) values than TH0 cell clones (Fig. 1d). Overall we identi-fied CD49b, CD226 and LAG-3 as putative markers for human Tr1 cells.
a
log 2F
C
log2FC
0 h14
14
12
12
10
10
8
8
6
6
4
4
2
2
CD226
LAG-3ITGA2
log 2F
C
log2FC
6 h14
14
12
12
10
10
8
8
6
6
4
4
2
2
CD226LAG-3
ITGA2
log 2F
C
log2FC
16 h14
14
12
12
10
10
8
8
6
6
4
4
2
2
CD226LAG-3
ITGA2
Tr1
Gene name Gene symbol Coagulation factor II (thrombin) receptor F2R Integrin, alpha 2 (CD49B, alpha 2 subunit of VLA-2 receptor) ITGA2 Protein tyrosine phosphatase, receptor type, M PTPRM Carcinoembryonic antigen-related cell adhesion molecule 1 CEACAM1 CD86 molecule CD86 Plexin B2 PLXNB2 CD226 molecule CD226 Low density lipoprotein-related protein 12 LRP12 Programmed cell death 1 PDCD1 Cytochrome b-561 CYB561 Stomatin STOM Chemokine (C-C motif) receptor 1 CCR1 Chemokine (C-C motif) receptor 4 CCR4 Ectonucleotide pyrophosphatase/phosphodiesterase 3 ENPP3 Interleukin 17 receptor B IL17RB PTPRF interacting protein, binding protein 1 (liprin beta 1) PPFIBP1 Cysteinyl leukotriene receptor 2 CYSLTR2
16 h0 h 6 h 16 h 0 h 6 h
TH0b
–2
–1
0
1
2
Gene name Adenosine A2a receptor Interleukin-1 receptor-associated kinase 2 Cathepsin B Tight junction protein 2 (zona occludens 2) A kinase (PRKA) anchor protein 5 Receptor tyrosine kinase-like orphan receptor 2 Purinergic receptor P2Y, G-protein coupled, 8 Purinergic receptor P2Y, G-protein coupled, 8 Interleukin 13 receptor, alpha 1 Inthrax toxin receptor 2 G protein-coupled receptor 56 Golgi membrane protein 1 CD244 molecule, natural killer cell receptor 2B4 Colony stimulating factor 1 (macrophage) Tumor necrosis factor (ligand) superfamily, member 9 Frizzled homolog 6 (Drosophila) Neuropilin (NRP) and tolloid (TLL)-like 2 Interleukin 1 receptor accessory protein A kinase (PRKA) anchor protein 5 Lymphocyte-activation gene 3 Smmunoglobulin-like domain containing receptor 1 Solute carrier family 26, member 4 Fer-1-like 3, myoferlin (C. elegans) Purinergic receptor P2Y, G-protein coupled, 5 Interleukin 7 receptor Protein tyrosine phosphatase type IVA, member 3 Killer cell lectin-like receptor subfamily G, member 1 Dehydrogenase/reductase (SDR family) member 3 G protein-coupled receptor 64 Lysosomal associated protein transmembrane 4 beta
Gene symbolADORA2A IRAK2 CTSB TJP2 AKAP5 ROR2 P2RY8 P2RY8 IL13RA1 ANTXR2 GPR56 GOLM1 CD244 CSF1 TNFSF9 FZD6 NETO2 IL1RAP AKAP5 LAG3 ILDR1 SLC26A4 FER1L3 P2RY5 IL7R PTP4A3 KLRG1 DHRS3 GPR64 LAPTM4B
6 h 16 h
Tr1TH0
16 h6 hc
–2
–1
0
1
2
d
0
20
40
60
Per
cent
age
ofLA
G-3
+ ce
lls
**
TH0 Tr10
2,000
4,000
6,000
8,000
CD
226
MF
I
**
TH0 Tr10
20
40
60
80
100
Per
cent
age
ofC
D49
b+ c
ells
****
TH0 Tr1
Figure 1 Identification of CD49b, LAG-3 and CD226 by gene expression profiling of human Tr1 cell clones. (a) Log2FC values determined using mRNA isolated from Tr1 and TH0 cell clones from the peripheral blood of two healthy donors that were unstimulated (0 h, n = 4 Tr1 cell clones and n = 10 TH0 cell clones) or stimulated with immobilized monoclonal antibodies to CD3 and soluble monoclonal antibodies to CD28 (6 h and 16 h, n = 4 Tr1 cell clones and n = 5 TH0 cell clones). Differential expression of 28,869 genes was investigated by whole-transcript Affymetrix chips. Shown are normalized expression values for profiles directly comparing the Tr1 and TH0 cell populations at three time points after data normalization by standard robust multichip analysis protocol and statistical analysis (Welch t test without false discovery rate correction). (b,c) Two-dimensional heatmaps of DEGs encoding membrane proteins at various time points in Tr1 as compared to TH0 cell clones. Genes in red are expressed at higher levels compared to the mean signal intensities in all experiments, genes in green are downregulated, and genes in black have signal intensities close to the mean expression level. The rows are scaled to have a mean of zero and an s.d. of one. (d) Expression of CD49b, LAG-3 and CD226 measured by flow cytometry in Tr1 and TH0 cell clones showing the percentages of CD49b+ and LAG-3+ cells and the MFI of CD226. **P ≤ 0.005, ****P < 0.0001 by Mann-Whitney test.

©20
13 N
atu
re A
mer
ica,
Inc.
All
rig
hts
res
erve
d.
a r t i c l e s
nature medicine advance online publication �
Coexpression of CD49b and LAG-3 identifies human Tr1 cellsWe next investigated the frequency and phenotype of human CD4+ T cells expressing CD49b, LAG-3 and CD226. We found a small population (2.14% ± 0.25% (mean ± s.e.m.)) of memory CD4+CD45RA− T cells coexpressing CD49b, LAG-3 (Fig. 2a) and CD226 (Supplementary Fig. 2a) in the peripheral blood of healthy donors. Of note, CD4+CD49b+LAG-3+ T cells did not express CD25 at high levels, and the expression of FOXP3 at the mRNA and protein levels was significantly (P ≤ 0.005) lower in CD4+CD49b+LAG-3+ cells than in CD25bright T cells (Supplementary Fig. 2b).
CD4+CD49b+LAG-3+ T cells that we sorted by FACS from the peripheral blood of healthy donors secreted higher amounts of IL-10 compared to CD4+CD49b−LAG-3+, CD4+CD49b+LAG-3− and CD4+CD49b−LAG-3− T cells and low amounts of IL-4 in response to polyclonal stimulation (Fig. 2b). CD4+CD49b+LAG-3+ T cells had a high IL-10–to–IL-4 ratio, which is one parameter that distinguishes Tr1 from TH2 cells6,7,20,22 (Fig. 2b and Supplementary Fig. 2c). Moreover, CD4+CD49b+LAG-3+ T cells secreted IFN-γ but not IL-17 (Fig. 2b).
Notably, CD4+CD49b+LAG-3+ T cells suppressed the proliferation of activated responder CD4+ T cells in vitro, which is a key feature of Tr1 cells, to a greater extent than the other subsets analyzed (Fig. 2c). Therefore, CD4+CD49b+LAG-3+ T cells represent a subpopulation of CD4+ memory T cells that secrete high amounts of IL-10, do not
express high levels of FOXP3 and exert suppressive activity in vitro. On the basis of these three criteria, CD4+CD49b+LAG-3+ T cells show all the previously defined characteristics of Tr1 cells4,6.
Coexpression of CD49b and LAG-3 identifies mouse Tr1 cellsWe recently showed that CD4+Foxp3−IL-10+ T (Tr1) cells with strong regulatory functions accumulate in the small intestine of mice after treatment with monoclonal antibodies to CD3 (ref. 23). Here we tested whether these mouse Tr1 cells (defined as CD4+TCRβ (T cell recep-tor β)+Foxp3red fluorescent protein (RFP)− IL-10enhanced GFP (eGFP)bright) express CD49b and LAG-3. The large majority (70% ± 5% (mean ± s.e.m.)) of CD4+IL-10eGFPbright T cells isolated from the small intestine of mice treated with antibodies to CD3 coexpressed CD49b and LAG-3 (Fig. 3a), whereas less than 13% ± 5% of CD4+IL-10− T cells were CD49b+LAG-3+ (Fig. 3a). In line with this finding, CD4+CD49b+LAG-3+ T cells isolated from the small intestine of mice treated with antibodies to CD3 contained a very high fre-quency of IL-10eGFP+ cells (Fig. 3b,c) and had high MFI values for IL-10eGFP+ (Fig. 3b) and CD226 (Supplementary Fig. 3a). These results indicate that the majority of IL-10–producing T cells are CD4+CD49b+LAG-3+ and vice versa. Accordingly, the frequencies of CD4+TCRβ+Foxp3RFP−IL-10eGFPbright and CD4+TCRβ+CD49b+LAG-3+ T cells in the small intestine showed similar kinetics after treat-ment with antibodies to CD3 (Supplementary Fig. 3b). Notably, the
c
0
20
40
60*
*
**
CD49b–
LAG-3–CD49b–
LAG-3+CD49b+
LAG-3–CD49b+
LAG-3+
Sup
pres
sion
(%
)
CD49b–LAG-3–
CD49b+LAG-3–
Suppression15%
Suppression13%
102101
86
65
43
22
0
86
65
43
22
0
103
CFSE
Cou
ntC
ount
CFSE
104 105
102101 103 104 105
CD49b–LAG-3+
CD49b+LAG-3+
Suppression13%
Suppression37%
86
65
43
22
0
86
65
43
22
0
Cou
ntC
ount
CFSE
CFSE
102101 103 104 105
102101 103 104 105
0
5
10
15
20
CD49b+
LAG-3–CD49b–
LAG-3+CD49b+
LAG-3+
Per
cent
age
amon
gC
D4+
CD
45R
A– T
cel
ls
105
104
103
102
–101
–101102 103
CD4
CD
45R
A
104 105–102
a 105
104
103
–102
–102 103 104 105
LAG
3CD49b
6,1%
90,99%
1.6
1.3
0
200
400
600
800
IL-4
(ng
ml–1
)
0
500
1,000
1,500 *
IL-1
7 (n
g m
l–1)
0
20,000
40,000
60,000 *
IFN
-γ (
ng m
l–1)
0.0020.0040.0080.0160.0310.0620.1250.2500.5001.000
log 2
IL-10:IL-17IL-10:IFN-γIL-10:IL-4
log 2
0.250
0.500
1.000
2.000
4.000
8.000
16.000
32.000
0.031
0.125
0.500
2.000
8.000
32.000
128.000
512.000
2048.000
log 2
CD49b– LAG-3–
CD49b– LAG-3+
CD49b+ LAG-3–
CD49b+ LAG-3+
0
500
1,000
1,500
2,000
2,500 ****
**
IL-1
0 (n
g m
l–1)
b
Figure 2 Coexpression of CD49b and LAG-3 identifies human Tr1 cells in vivo in healthy donors. (a) Expression of CD49b and LAG-3 (gated on CD4+CD45RA− T cells) in the blood of healthy donors. Dot plots for 1 representative donor out of a total of 23 donors are shown (top left and right), and the percentages of cells in each quadrant are indicated. The percentages of CD49b+LAG-3−, CD49b−LAG-3+ and CD49b+LAG-3+ T cells in each donor are also shown (bottom). (b) Concentrations of IL-10, IL-4, IFN-γ and IL-17 in culture supernatants of the indicated FACS-sorted T cell populations stimulated with antibodies to CD3 and CD28. Data are shown as the mean ± s.e.m. n = 9 (IL-10, IL-4 and IFN-γ) and n = 4 (IL-17). Below, the ratios of IL-10 to IL-4, IL-10 to IFN-γ and IL-10 to IL-17 in one representative donor out of nine tested for the IL-10–to–IL-4 and IL-10–to–IFN-γ ratios and out of four tested for the IL-10–to–IL-17 ratio are shown. *P ≤ 0.05, **P ≤ 0.005 by Mann-Whitney test. (c) Suppression of T cell proliferation. Filled gray histograms correspond to proliferation of activated CD4+ T cells; black and red histograms correspond to proliferation of activated CD4+ T cells co-cultured with the indicated FACS-sorted T cell populations. Shown are results from one representative experiment out of six (left) and the percentages of suppression in six independent experiments (right). CFSE, carboxyfluorescein succinimidyl ester. *P ≤ 0.05, **P ≤ 0.005 by Mann-Whitney test.
©20
13 N
atu
re A
mer
ica,
Inc.
All
rig
hts
res
erve
d.
a r t i c l e s
� advance online publication nature medicine
phenotype of the Tr1 cells was stable, as CD49b and LAG-3 were coexpressed by CD4+Foxp3−IL-10eGFPbright T cells 144 h after CD3-specific antibody treatment (Supplementary Fig. 3b).
To determine whether CD49b and LAG-3 can be used to iso-late mouse Tr1 cells, we sorted CD4+CD49b+LAG-3+ T cells by FACS and characterized them. Without in vitro re-stimulation,
28.41%
46.98%7.53%
CD49b
LAG
-3
CD4
b
IL-1
0eGF
P
19.15%
80.85%
CD49b–
LAG-3–
26.45%
73.55%
CD49b+
LAG-3–
82.58%
17.42%
CD49b+
LAG-3+
IL-1
0eGF
P
CD4
5.16%
2.58%
70.11%
22.16%
2.37%
13.93%
11.67%
72.03%
a
CD49b
30%
50%
LAG
-3
100
80
60
40
20
0
Tr1 ce
lls
CD4+ IL
-10– T
cells
Per
cent
age
of C
D49
b+LA
G-3
+
** 100
80
60
40
20
0
CD49b– LA
G-3–
CD49b+ LA
G-3–
CD49b+ LA
G-3+P
erce
ntag
e of
IL-1
0GF
P+ **
**
c2,500
2,000
1,500
1,000
500
0
CD49b– LA
G-3–
CD49b+ LA
G-3–
CD49b+ LA
G-3+
MF
I-IL
-10eG
FP
** *** *
IFN
-γ (
ng m
l–1)
IL-1
7A (
ng m
l–1)
10
8
6
4
2
0
10
8
6
4
2
0
10
8
6
4
2
0
IL-4
(ng
ml–1
)
d10
IL-1
0 (n
g m
l–1)
*** *** 8
6
4
2
0
CD49b–LAG-3–
CD49b+LAG-3–
CD49b+LAG-3+
IL-10:IL-4
log 2
32
16
8
4
2
1
0.5
0.25
0.125
IL-10:IFN-γ
log 2
32
16
8
4
2
1
0.5
0.25
0.125
IL-10:IL-17A
log 2
32
16
8
4
2
1
0.5
0.25
0.125
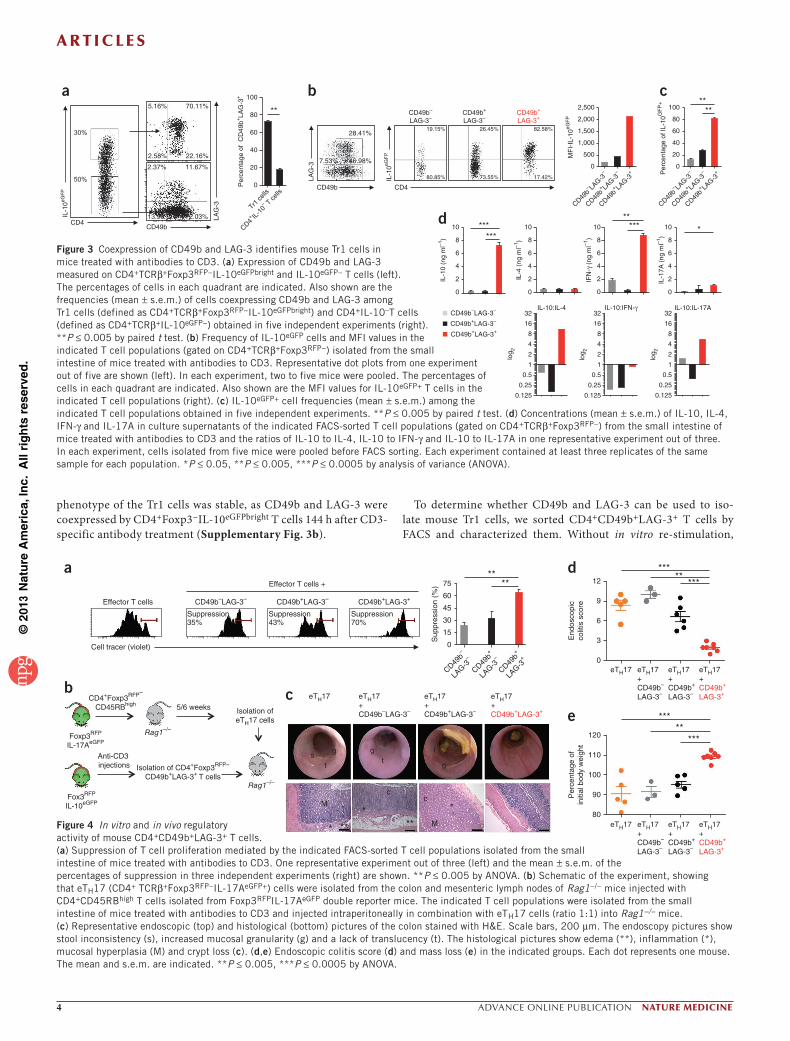
Figure 3 Coexpression of CD49b and LAG-3 identifies mouse Tr1 cells in mice treated with antibodies to CD3. (a) Expression of CD49b and LAG-3 measured on CD4+TCRβ+Foxp3RFP−IL-10eGFPbright and IL-10eGFP− T cells (left). The percentages of cells in each quadrant are indicated. Also shown are the frequencies (mean ± s.e.m.) of cells coexpressing CD49b and LAG-3 among Tr1 cells (defined as CD4+TCRβ+Foxp3RFP−IL-10eGFPbright) and CD4+IL-10–T cells (defined as CD4+TCRβ+IL-10eGFP−) obtained in five independent experiments (right). **P ≤ 0.005 by paired t test. (b) Frequency of IL-10eGFP cells and MFI values in the indicated T cell populations (gated on CD4+TCRβ+Foxp3RFP−) isolated from the small intestine of mice treated with antibodies to CD3. Representative dot plots from one experiment out of five are shown (left). In each experiment, two to five mice were pooled. The percentages of cells in each quadrant are indicated. Also shown are the MFI values for IL-10eGFP+ T cells in the indicated T cell populations (right). (c) IL-10eGFP+ cell frequencies (mean ± s.e.m.) among the indicated T cell populations obtained in five independent experiments. **P ≤ 0.005 by paired t test. (d) Concentrations (mean ± s.e.m.) of IL-10, IL-4, IFN-γ and IL-17A in culture supernatants of the indicated FACS-sorted T cell populations (gated on CD4+TCRβ+Foxp3RFP−) from the small intestine of mice treated with antibodies to CD3 and the ratios of IL-10 to IL-4, IL-10 to IFN-γ and IL-10 to IL-17A in one representative experiment out of three. In each experiment, cells isolated from five mice were pooled before FACS sorting. Each experiment contained at least three replicates of the same sample for each population. *P ≤ 0.05, **P ≤ 0.005, ***P ≤ 0.0005 by analysis of variance (ANOVA).
b
a
Cell tracer (violet)
Effector T cells
Effector T cells +
CD49b–LAG-3–
Suppression35%
CD49b+LAG-3–
Suppression43%
CD49b+LAG-3+
Suppression70%
CD49b–
LAG-3
–
CD49b+
LAG-3
–
CD49b+
LAG-3
+
75
60
45
30
15
0
Sup
pres
sion
(%
)
****
Foxp3RFP
IL-17AeGFP
CD4+Foxp3RFP–
CD45RBhigh 5/6 weeks Isolation ofeTH17 cells
Fox3RFP
IL-10eGFP
Anti-CD3 injections Isolation of CD4+Foxp3RFP–
CD49b+LAG-3+ T cellsRag1–/–
Rag1–/–
c eTH17 eTH17+CD49b–LAG-3–
eTH17+CD49b+LAG-3–
eTH17+CD49b+LAG-3+
s
s sg g
gt
M
M
cc
** ***
* *
tt
e
Per
cent
age
ofin
itial
bod
y w
eigh
t
*** **
*** 120
End
osco
pic
colit
is s
core
12
9
6
3
0
d *** **
***
eTH17 eTH17+CD49b–
LAG-3–
eTH17+CD49b+
LAG-3–
eTH17+CD49b+
LAG-3+
eTH17 eTH17+CD49b–
LAG-3–
eTH17+CD49b+
LAG-3–
eTH17+CD49b+
LAG-3+
110
100
90
80
Figure 4 In vitro and in vivo regulatory activity of mouse CD4+CD49b+LAG-3+ T cells. (a) Suppression of T cell proliferation mediated by the indicated FACS-sorted T cell populations isolated from the small intestine of mice treated with antibodies to CD3. One representative experiment out of three (left) and the mean ± s.e.m. of the percentages of suppression in three independent experiments (right) are shown. **P ≤ 0.005 by ANOVA. (b) Schematic of the experiment, showing that eTH17 (CD4+ TCRβ+Foxp3RFP−IL-17AeGFP+) cells were isolated from the colon and mesenteric lymph nodes of Rag1−/− mice injected with CD4+CD45RBhigh T cells isolated from Foxp3RFPIL-17AeGFP double reporter mice. The indicated T cell populations were isolated from the small intestine of mice treated with antibodies to CD3 and injected intraperitoneally in combination with eTH17 cells (ratio 1:1) into Rag1−/− mice. (c) Representative endoscopic (top) and histological (bottom) pictures of the colon stained with H&E. Scale bars, 200 µm. The endoscopy pictures show stool inconsistency (s), increased mucosal granularity (g) and a lack of translucency (t). The histological pictures show edema (**), inflammation (*), mucosal hyperplasia (M) and crypt loss (c). (d,e) Endoscopic colitis score (d) and mass loss (e) in the indicated groups. Each dot represents one mouse. The mean and s.e.m. are indicated. **P ≤ 0.005, ***P ≤ 0.0005 by ANOVA.
©20
13 N
atu
re A
mer
ica,
Inc.
All
rig
hts
res
erve
d.
a r t i c l e s
nature medicine advance online publication �
CD4+CD49b+LAG-3+ T cells expressed high levels of Il10 and low levels of Il4. The expression of Ifng, Il2 and Tnfa was lower in CD4+CD49b+LAG-3+ T cells than in TH1 (CD4+IFN-γ+IL-17A− ) cells. Moreover, the expression of Il17a was lower in CD4+CD49b+LAG-3+ T cells than in TH17 (CD4+IFN-γ- IL-17A+) cells (Supplementary Fig. 3c). After re-stimulation in vitro, CD4+CD49b+LAG-3+ T cells secreted higher amounts of IL-10 than IL-4, IL-17A, IL-2 and TNF-α (Fig. 3d and Supplementary Fig. 3d) and also produced IFN-γ (Fig. 3d).
CD4+CD49b+LAG-3+ T cells expressed Tbx21, Rorc and Foxp3 at sig-nificantly lower levels than did TH1 (P ≤ 0.0005), TH17 (P ≤ 0.05) and Foxp3+ Treg (P ≤ 0.0005) cells, respectively. Gata3 expression levels in CD4+CD49b+LAG-3+ T cells were similar to those in TH1 and Foxp3+ Treg cells (Supplementary Fig. 4). Despite their expression of LAG-3, CD4+CD49b+LAG-3+ T cells expressed low levels of Egr2, a transcrip-tion factor crucially involved in the development of IL-10–producing LAG-3+ Treg cells14. The expression of Ahr, a key transcription factor for IL-10 production by mouse Tr1 cells24, was significantly higher in CD4+CD49b+LAG-3+ T cells compared to the other cell subsets ana-lyzed (P ≤ 0.005 and P ≤ 0.0005; Supplementary Fig. 4).
CD4+Foxp3RFP−CD49b+LAG-3+ T cells from the small intes-tine of mice treated with antibodies to CD3 suppressed effector T cell proliferation in a dose-dependent manner in vitro (Fig. 4a
and Supplementary Fig. 5). Furthermore, using a T cell transfer model of inflammatory bowel disease (IBD) (ref. 23 and Fig. 4b), CD4+Foxp3RFP−CD49b+LAG-3+ T cells suppressed colitogenic effec-tor TH17 (eTH17) cells in vivo (Fig. 4c–e) in an IL-10–dependent manner (Supplementary Fig. 6).
We previously showed that Tr1 cells accumulated in the spleen of tolerant pancreatic islet–transplanted mice25,26. In the spleen of mice treated with antibodies to CD3, we found a population of CD4+CD49b+LAG-3+ T cells, a high proportion of which were IL-10eGFP+ (Supplementary Fig. 7a,b), that showed a Tr1 cytokine profile (Supplementary Fig. 7c) and suppressed T cell prolif-eration in vitro in a manner that was partially dependent on IL-10 (Supplementary Fig. 7d). Thus, CD4+CD49b+LAG-3+ T cells, which accumulate in the intestine and spleen of mice treated with antibodies to CD3, produce large amounts of IL-10 and have strong suppressive activity in vitro and in vivo. The coexpression of CD49b and LAG-3 on CD4+ T cells therefore identifies Tr1 cells not only in humans but also in mice.
Coexpression of CD49b and LAG-3 is specific for Tr1 cellsTo test the specificity of CD49b and LAG-3 as markers for Tr1 cells, we analyzed the expression of these markers on other TH cell subsets. We infected IL-4eGFP reporter mice with Nippostrongylus brasiliensis
CD49b
IL-4
eGF
PLA
G-3
a
3%
5%0.78%
24%
IL-1
7AeG
FP
1.3%
45%
3%3%F
oxp3
RF
P
15%
4%3%
10%
IL-1
0eGF
PLA
G-3
CD49b
2%
17%
76%3%
b
100
80
60
40
20
0
Tr1
c
T H2
T H17 T re
g
******
***
Per
cent
age
of C
D49
b+LA
G-3
+
f
CD49b–
LAG-3–
CD49b–
LAG-3+
CD49b+
LAG-3–
CD49b+
LAG-3+
Cell tracer (violet)
Resp. CD4
Resp. CD4
Resp. CD4
Resp. CD4
Resp. CD4
CD49b–LAG-3–
CD49b–LAG-3+
CD49b+LAG-3–
CD49b+LAG-3+
Sup
pres
sion
(%
)
50
40
30
20
10
0
–10
–20
***
**d
2.2%1%
12%
CD4
LAG
-3
CD49b
13.38%
86.62%
CD49b–LAG-3+
IL-1
0eGF
P
0.25%
99.75%
CD49b–LAG-3–
4.51%
95.49%
CD49b+ LAG-3–
62.17%
37.83%
CD49b+ LAG-3+
e
CD49b+LAG-3–
CD49b+LAG-3+
CD49b–LAG-3–
CD49b–LAG-3+
******
***
*
Per
cent
age
of IL
-10eG
FP
+
80
60
40
20
0
IL-1
0eGF
P M
FI
3,000
2,000
1,000
0
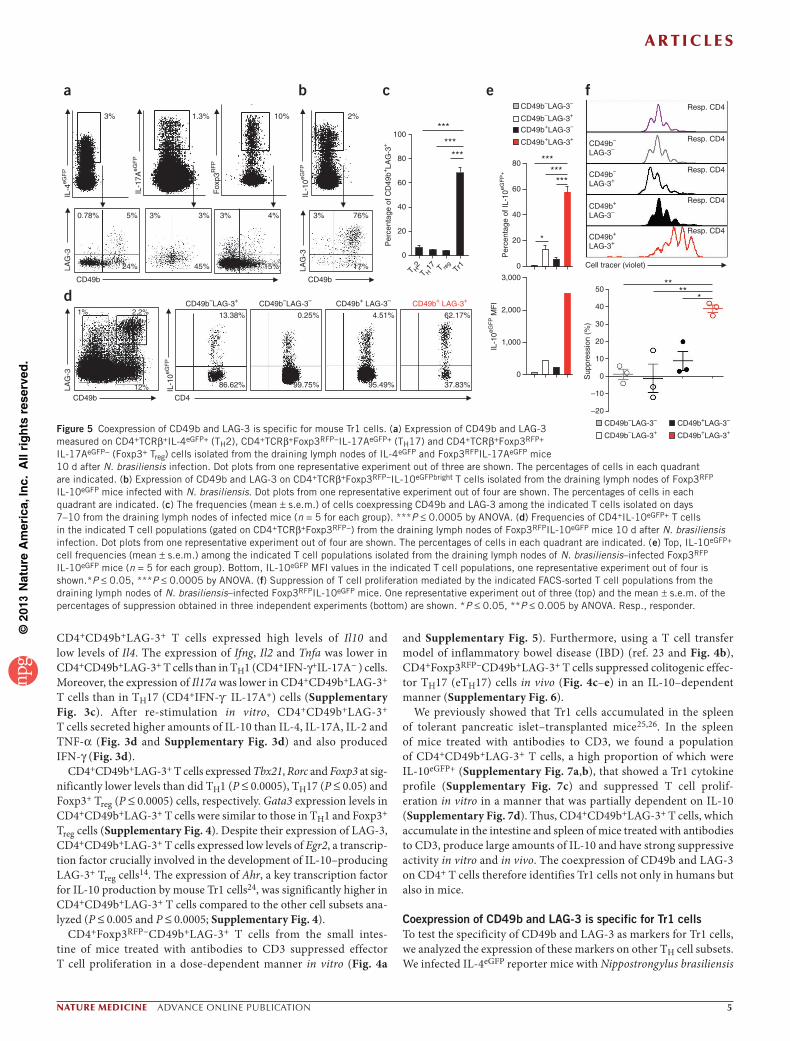
Figure 5 Coexpression of CD49b and LAG-3 is specific for mouse Tr1 cells. (a) Expression of CD49b and LAG-3 measured on CD4+TCRβ+IL-4eGFP+ (TH2), CD4+TCRβ+Foxp3RFP−IL-17AeGFP+ (TH17) and CD4+TCRβ+Foxp3RFP+ IL-17AeGFP− (Foxp3+ Treg) cells isolated from the draining lymph nodes of IL-4eGFP and Foxp3RFPIL-17AeGFP mice 10 d after N. brasiliensis infection. Dot plots from one representative experiment out of three are shown. The percentages of cells in each quadrant are indicated. (b) Expression of CD49b and LAG-3 on CD4+TCRβ+Foxp3RFP−IL-10eGFPbright T cells isolated from the draining lymph nodes of Foxp3RFP IL-10eGFP mice infected with N. brasiliensis. Dot plots from one representative experiment out of four are shown. The percentages of cells in each quadrant are indicated. (c) The frequencies (mean ± s.e.m.) of cells coexpressing CD49b and LAG-3 among the indicated T cells isolated on days 7–10 from the draining lymph nodes of infected mice (n = 5 for each group). ***P ≤ 0.0005 by ANOVA. (d) Frequencies of CD4+IL-10eGFP+ T cells in the indicated T cell populations (gated on CD4+TCRβ+Foxp3RFP−) from the draining lymph nodes of Foxp3RFPIL-10eGFP mice 10 d after N. brasiliensis infection. Dot plots from one representative experiment out of four are shown. The percentages of cells in each quadrant are indicated. (e) Top, IL-10eGFP+ cell frequencies (mean ± s.e.m.) among the indicated T cell populations isolated from the draining lymph nodes of N. brasiliensis–infected Foxp3RFP IL-10eGFP mice (n = 5 for each group). Bottom, IL-10eGFP MFI values in the indicated T cell populations, one representative experiment out of four is shown.*P ≤ 0.05, ***P ≤ 0.0005 by ANOVA. (f) Suppression of T cell proliferation mediated by the indicated FACS-sorted T cell populations from the draining lymph nodes of N. brasiliensis–infected Foxp3RFPIL-10eGFP mice. One representative experiment out of three (top) and the mean ± s.e.m. of the percentages of suppression obtained in three independent experiments (bottom) are shown. *P ≤ 0.05, **P ≤ 0.005 by ANOVA. Resp., responder.
©20
13 N
atu
re A
mer
ica,
Inc.
All
rig
hts
res
erve
d.
a r t i c l e s
� advance online publication nature medicine
(N. brasiliensis) to examine TH2 cells. In this model, the larvae enter the lung 2–3 d after subcutaneous injection, causing hemorrhage and massive inflammation (ref. 27 and Supplementary Fig. 8a,b). Within 9–10 d, the adult worms are expelled as a result of the develop-ment of a TH2-type response28,29. We found that the majority of TH2 (CD4+IL-4eGFP+) cells present in the draining lymph nodes (Fig. 5) and lungs of the infected mice (Supplementary Fig. 8c,e) did not coexpress CD49b and LAG-3.
N. brasiliensis infection also induces a strong IL-17 response in the lungs, which contributes to inflammation and tissue damage27. We found both TH17 (CD4+Foxp3RFP−IL-17AGFP+) and Foxp3+ Treg (CD4+Foxp3RFP+IL-17AGFP−) cells in N. brasiliensis–infected mice. These cells accumulated in the draining lymph nodes and lungs and did not coexpress CD49b and LAG-3 (Fig. 5a,c and Supplementary Fig. 8c,e). To further show that TH17 cells do not coexpress CD49b and LAG-3, we isolated these cells from the colon of the previously described IBD model23. Colitogenic Foxp3RFP−IL-17AeGFP+ cells, which include TH17 cells and a large proportion of IFN-γ+IL-17+ double producer cells23, and CD4+Foxp3RFP−IL-17AeGFP− T cells, which contained almost 30–40% of the IFN-γ–producing TH1 cells, expressed CD49b but not LAG-3 (Supplementary Fig. 8d,e and data not shown). Furthermore, colitogenic TH1 (Foxp3RFP−IFN-γKatushka+) cells did not coexpress CD49b and LAG-3 (Supplementary Fig. 8d,e). So unlike Tr1 cells, TH1, TH2, TH17 and Foxp3+ Treg cells do not coexpress CD49b and LAG-3 in vivo.
During the late phase of N. brasiliensis infection (day 10 after infec-tion), IL-10 production increases and contributes to the resolution of inflammation and attenuates tissue damage27, suggesting the induc-tion of Tr1 cells. We found CD4+Foxp3−IL-10+ T cells in the drain-ing lymph nodes and lung of N. brasiliensis–infected mice (Fig. 5b,c and Supplementary Fig. 8c,e). The majority of CD4+Foxp3RFP−IL-10GFPbright T cells were CD49b+LAG-3+ (Fig. 5b and Supplementary Fig. 8c). Moreover, CD4+ T cells coexpressing CD49b and LAG-3 con-tained the highest frequency of IL-10eGFP+ cells with the highest MFI value (Fig. 5d,e). CD4+CD49b+LAG-3+ T cells that we sorted by FACS from draining lymph nodes of infected mice expressed high levels of Il10 mRNA (Supplementary Fig. 9a) and suppressed the proliferation of effector CD4+ T cells in vitro (Fig. 5f). During helminth infection there is an increased production of TH2-type cytokines27, and accord-ingly we observed that CD4+CD49b+LAG-3+ T cells expressed Il4, Il13 and Gata3 mRNA at levels comparable to those in Foxp3+ Treg cells but significantly lower than those in TH2 cells. Expression of Ahr in CD4+CD49b+LAG-3+ T cells was high but not selective to these cells (Supplementary Fig. 9a).
Seven days after N. brasiliensis infection, Tr1 cells accumulated in both the lungs and draining lymph nodes (Supplementary Fig. 9b,c), which is in line with the described role of IL-10 during the resolution of infection27. The frequency of Tr1 cells (Supplementary Fig. 9b,c) decreased in infected mice over time, but CD49b and
b
f
pTr10
10
20
30
40
50
TH0P
erce
ntag
e of
CD
49b– LA
G-3
+pTr1
0
10
20
30
40
50**
Per
cent
age
ofC
D49
b+LA
G-3
+
TH0pTr10
10
20
30
40
50
Per
cent
age
ofC
D49
b+LA
G-3
–
TH0
CC PMC0
5
10
15
HD
Per
cent
age
ofC
D49
b+LA
G-3
–
CC PMC0
20
40
60 *
HD
Per
cent
age
ofC
D49
b– LAG
-3+
CC PMC0
5
10
15***
**
HD
Per
cent
age
ofC
D49
b+LA
G-3
+
a
0
10
20
30
Per
cent
age
ofC
D49
b+LA
G-3
–
T(mDC)
pTr1
(DC-1
0)0
10
20
30
Per
cent
age
ofC
D49
b– LAG
-3+
pTr1
(DC-1
0)
T(mDC)
0
10
20
30*****
Per
cent
age
ofC
D49
b+LA
G-3
+
pTr1
(DC-1
0)
T(mDC)
e
–102100102 103 104 105–102100102103 104 105
–102
103
104
105
–102
–103
103
104
1053.2% 1.9%
89,67% 5.3% 8.7%73,7%
4.6%14.2%
CD49b
LAG
-3
PMCCCc
0
0.5
1.0
1.5*
IL-1
0 (n
g m
l–1)
pTr1
CD49b+ LA
G-3+
pTr1
d
0
20
40
60
80**
pTr1 CD49b+LAG-3+ pTr1
Sup
pres
sion
(%
)
pTr1
24%
504
CSFE
Cou
nt
378
252
126
0
CD49b+LAG-3+ pTr1
CSFE
504
Cou
nt
378
252
126
0
45%
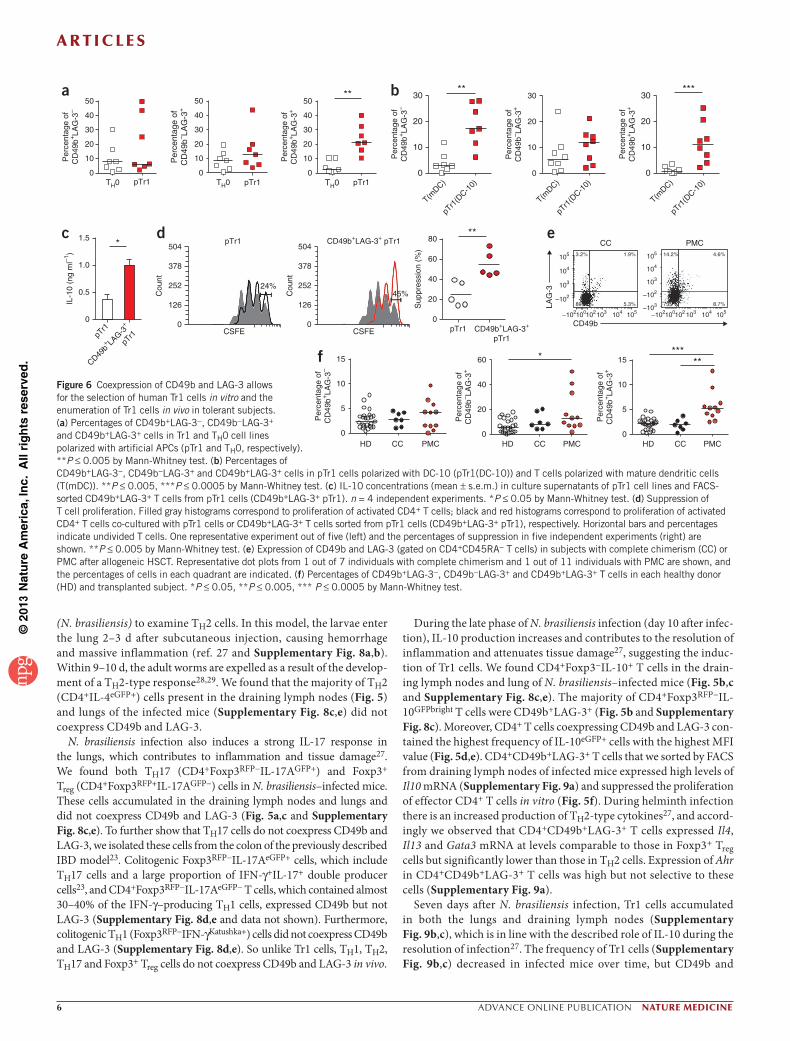
Figure 6 Coexpression of CD49b and LAG-3 allows for the selection of human Tr1 cells in vitro and the enumeration of Tr1 cells in vivo in tolerant subjects. (a) Percentages of CD49b+LAG-3−, CD49b−LAG-3+ and CD49b+LAG-3+ cells in Tr1 and TH0 cell lines polarized with artificial APCs (pTr1 and TH0, respectively). **P ≤ 0.005 by Mann-Whitney test. (b) Percentages of CD49b+LAG-3−, CD49b−LAG-3+ and CD49b+LAG-3+ cells in pTr1 cells polarized with DC-10 (pTr1(DC-10)) and T cells polarized with mature dendritic cells (T(mDC)). **P ≤ 0.005, ***P ≤ 0.0005 by Mann-Whitney test. (c) IL-10 concentrations (mean ± s.e.m.) in culture supernatants of pTr1 cell lines and FACS-sorted CD49b+LAG-3+ T cells from pTr1 cells (CD49b+LAG-3+ pTr1). n = 4 independent experiments. *P ≤ 0.05 by Mann-Whitney test. (d) Suppression of T cell proliferation. Filled gray histograms correspond to proliferation of activated CD4+ T cells; black and red histograms correspond to proliferation of activated CD4+ T cells co-cultured with pTr1 cells or CD49b+LAG-3+ T cells sorted from pTr1 cells (CD49b+LAG-3+ pTr1), respectively. Horizontal bars and percentages indicate undivided T cells. One representative experiment out of five (left) and the percentages of suppression in five independent experiments (right) are shown. **P ≤ 0.005 by Mann-Whitney test. (e) Expression of CD49b and LAG-3 (gated on CD4+CD45RA− T cells) in subjects with complete chimerism (CC) or PMC after allogeneic HSCT. Representative dot plots from 1 out of 7 individuals with complete chimerism and 1 out of 11 individuals with PMC are shown, and the percentages of cells in each quadrant are indicated. (f) Percentages of CD49b+LAG-3−, CD49b−LAG-3+ and CD49b+LAG-3+ T cells in each healthy donor (HD) and transplanted subject. *P ≤ 0.05, **P ≤ 0.005, *** P ≤ 0.0005 by Mann-Whitney test.

©20
13 N
atu
re A
mer
ica,
Inc.
All
rig
hts
res
erve
d.
a r t i c l e s
nature medicine advance online publication �
LAG-3 remained stably coexpressed by CD4+Foxp3RFP− IL-10GFPbright cells (Supplementary Fig. 9b,c).
We also confirmed the expression and stability of CD49b and LAG-3 on Tr1 cells differentiated in vitro with IL-27 and transforming growth factor-β (TGF-β). The Tr1 cells expressed Il10 and Ahr at higher levels than in vitro–differentiated TH1, TH2, TH17 and induced Treg (iTreg) cells (Supplementary Fig. 10a). Similarly to CD4+CD49b+LAG-3+ T cells from the small intestine of mice treated with antibodies to CD3, the expression of Erg2, Gata3, Rorc, Tbx21 and Foxp3 was low or undetectable in in vitro–induced Tr1 cells (Supplementary Fig. 10a). The majority of IL-27–induced Tr1 cells were CD49b+ LAG-3+ (Supplementary Fig. 10b,c), and the expression of CD49b and LAG-3 remained stable for up to 12 d in vitro on IL-10–producing Tr1 cells (Supplementary Fig. 11a,b). Notably, after in vivo transfer, Tr1 cells that maintained IL-10 expression remained CD49b+LAG-3+ for up to 13 d (Supplementary Fig. 12).
Clinical application of Tr1 cell–specific surface markersTo generate Tr1 cells in vitro for therapeutic use, we polarized human T cells in the presence of IL-10. The resulting cell population contains only a small proportion of Tr1 cells and is contaminated by a large fraction of T cells that do not produce IL-10 (ref. 30). Using previously described protocols to differentiate human Tr1 cells in vitro7,31–33, we showed that the frequency of T cells coexpressing CD49b and LAG-3 was significantly higher in Tr1-polarized cells compared to TH0 cells (Fig. 6a,b and Supplementary Fig. 13a). FACS-sorted CD49b+LAG-3+ T cells from Tr1-polarized cells secreted significantly higher amounts of IL-10 (Fig. 6c) and had higher suppressive capacity relative to the original bulk population (Fig. 6d and Supplementary Fig. 13b), indicating that CD49b and LAG-3 can be used to purify Tr1 cells from in vitro–polarized cells.
We then assessed the frequency of CD49b+LAG-3+ T cells in a cohort of subjects with β-thalassemia in whom persistent mixed chi-merism (PMC) of donor and host cells after allogeneic HSCT cor-relates with tolerance and the presence of circulating CD4+IL-10+ cells20. The number of circulating CD49b+LAG-3+ T cells was higher in the peripheral blood of subjects with PMC34,35 compared to both healthy donors and subjects with complete chimerism (Fig. 6e,f). Receiver operating characteristic (ROC) analysis confirmed that the percentage of CD49b+LAG-3+ T cells can be used to discriminate tolerant subjects from controls (healthy donors or subjects with complete chimerism) (Supplementary Fig. 14a,b). These findings demonstrate that the concomitant expression of CD49b and LAG-3 allows for the isolation of Tr1 cells from in vitro Tr1-polarized popula-tions and the tracking of Tr1 cells in vivo in tolerant subjects.
DISCUSSIONWe show that coexpression of CD49b and LAG-3 identifies human and mouse Tr1 cells. CD4+CD49b+LAG-3+ T cells secrete large amounts of IL-10, have high IL-10–to–IL-4 and IL-10–to–IL-17 ratios, express high levels of CD226, express low levels of FOXP3 and have strong IL-10–dependent suppressive activity. Concomitant expres-sion of CD49b and LAG-3 is specific for Tr1 cells, as TH1, TH2, TH17 and Foxp3+ Treg cells do not coexpress these markers. Coexpression of CD49b and LAG-3 can be used to purify human Tr1 cells from in vitro Tr1-polarized cell cultures and enables the tracking of Tr1 cells in tolerant subjects.
Expression of CD49b has been described previously on effector memory CD4+ T cells13, TH17 cells12 and IL-10–producing T cells11,36. Our data showed that CD49b is expressed on Tr1 cells but also on TH1,
TH2, TH17 and Foxp3+ Treg cells. LAG-3 is expressed on splenic T cells isolated from naive mice with regulatory function and correlates with IL-10 production14,37. However, activated T cells also express LAG-3 (refs. 15–18,38). We showed that human T cells expressing LAG-3 but not CD49b produce IL-4 and low amounts of IL-10, are highly proliferative (data not shown) and do not have substantial suppres-sive activity in vitro. Thus, the single use of CD49b or LAG-3 is not sufficient to select a pure population of functional Tr1 cells or distin-guish these cells from other TH or Treg cell subsets.
We demonstrate that the combination of CD49b and LAG-3 is sufficient to identify and select mouse and human Tr1 cells, which secrete high amounts of IL-10 and have regulatory activity in vitro and in vivo. Both CD49b and LAG-3 are stably expressed on functional Tr1 cells. CD49b is expressed by Tr1 cells irrespective of their activa-tion, whereas LAG-3 is expressed on Tr1 cells when they produce IL-10 and have suppressive activity. Coexpression of CD49b and LAG-3 distinguishes Tr1 cells from TH1, TH2 and TH17 cells during helminth infection and IBD.
The identification of Tr1 cells in patients has been limited by their ability to produce IL-10 only after in vitro re-stimulation2,39–41. Moreover, intracellular flow cytometric analysis of IL-10 expression is insensitive and highly variable according to the type of stimuli. Alternatively, T cell cloning of circulating CD4+ T cells allows the enumeration of IL-10–producing Tr1 cells in tolerant subjects2,33. Using these techniques, we previously demonstrated that high fre-quencies of IL-10–producing T cells and Tr1 cell clones in the periph-eral blood of subjects receiving allogeneic HSCT correlated with PMC and tolerance2,20. We now show that in these tolerant subjects, the frequency of CD4+CD49b+LAG-3+ T cells is increased. Although the sample size analyzed was limited, statistical analysis showed sig-nificant differences in the percentages of CD49b+LAG-3+ T cells in tolerant subjects compared to control groups. As CD49b+LAG-3+ T cells are IL-10–producing suppressor T cells, these data indi-cate that the frequency of Tr1 cells can be monitored in vivo using these markers.
Regulatory T cell–based therapies have become an attractive thera-peutic option for inducing and restoring tolerance. Several protocols to generate and expand Tr1 cells in vitro have been developed30,42, and proof-of-principle clinical trials demonstrating the safety and feasibility of Tr1 cell infusion were recently completed43,44. However, the cell preparation consisting of antigen-specific IL-10–anergized T cells generated with recombinant IL-10 or IL-10–producing tolero-genic dendritic cells (DC-10)32,45 contains a subset of contaminat-ing non-Tr1 cells, which could potentially exacerbate the pathogenic clinical condition of the patients. We now show that coexpression of CD49b and LAG-3 allows for the isolation of Tr1 cells from in vitro Tr1-polarized populations and from antigen-specific IL-10–anergized T cells, thereby rendering their clinical use safer and broadening their clinical application.
In summary, we have discovered two selective markers for Tr1 cells that are conserved in mice and humans. These markers make it possi-ble to study the in vivo localization of Tr1 cells in physiological condi-tions, as well as the role of Tr1 cells in subjects with immune-mediated diseases in which a defect in Tr1 cells has been proposed.
METhODSMethods and any associated references are available in the online version of the paper.
Note: Supplementary information is available in the online version of the paper.
©20
13 N
atu
re A
mer
ica,
Inc.
All
rig
hts
res
erve
d.
a r t i c l e s
� advance online publication nature medicine
ACkNowLEDGMENTSWe wish to thank M. Battaglia (DRI, Division of Immunology, Transplantation and Infectious Diseases, San Raffaele Scientific Institute) for helpful scientific discussions and critical revision of the manuscript and we thank L. Passerini (HSR-TIGET, Division of Regenerative Medicine, Stem Cells and Gene Therapy, San Raffaele Scientific Institute) for providing human CD25bright T cell samples. This work was supported by Telethon Foundation ‘Comitato Telethon Fondazione Onlus’ Core Grant OSR-TIGET project E2 (Rome) to S.G. and M.-G.R. N.G. was supported by an EMBO long-term postdoctoral fellowship. S.H. was supported by the ‘Jung-Stiftung’, ‘Stiftung Experimentelle Biomedizin’ and the Deutsche Forschungsgemeinschaft (DFG) (HU 1714/3-1). R.A.F. is an investigator of the Howard Hughes Medical Institute.
AUTHoR CoNTRIBUTIoNSN.G., S.H. and S.G. designed the experiments, analyzed the data and wrote the manuscript. C.F.M. prepared T cell clones for gene expression profile analysis and performed RT-PCR and FACS analyses on human T cell clones. M.E.G. performed the experiments with human samples. M.P. performed bioinformatics analysis. A.B. supervised microarrays and bioinformatics analysis. H.R.D. and P.L.-L. provided the expertise and supervised the experiments with N. brasiliensis. B.G. performed the mouse RT-PCR. L.B. performed the mouse in vitro suppression assay. F.T. performed statistical analysis on patient samples. C.D.S. supervised statistical analysis on patient samples. R.B. contributed to the selection of candidate markers. M.A. provided the clinical samples. S.G., R.A.F. and M.-G.R. coordinated and supervised the project and wrote the manuscript.
CoMPETING FINANCIAL INTERESTSThe authors declare no competing financial interests.
Reprints and permissions information is available online at http://www.nature.com/reprints/index.html.
1. Roncarolo, M.G. et al. Autoreactive T cell clones specific for class I and class II HLA antigens isolated from a human chimera. J. Exp. Med. 167, 1523–1534 (1988).
2. Bacchetta, R. et al. High levels of interleukin 10 production in vivo are associated with tolerance in SCID patients transplanted with HLA mismatched hematopoietic stem cells. J. Exp. Med. 179, 493–502 (1994).
3. Roncarolo, M.G. & Battaglia, M. Regulatory T-cell immunotherapy for tolerance to self antigens and alloantigens in humans. Nat. Rev. Immunol. 7, 585–598 (2007).
4. Roncarolo, M.G., Gregori, S., Lucarelli, B., Ciceri, F. & Bacchetta, R. Clinical tolerance in allogeneic hematopoietic stem cell transplantation. Immunol. Rev. 241, 145–163 (2011).
5. Pot, C., Apetoh, L. & Kuchroo, V.K. Type 1 regulatory T cells (Tr1) in autoimmunity. Semin. Immunol. 23, 202–208 (2011).
6. Groux, H. et al. A CD4+ T-cell subset inhibits antigen-specific T-cell responses and prevents colitis. Nature 389, 737–742 (1997).
7. Magnani, C.F. et al. Killing of myeloid APCs via HLA class I, CD2 and CD226 defines a novel mechanism of suppression by human Tr1 cells. Eur. J. Immunol. 41, 1652–1662 (2011).
8. Häringer, B., Lozza, L., Steckel, B. & Geginat, J. Identification and characterization of IL-10/IFN-γ–producing effector-like T cells with regulatory function in human blood. J. Exp. Med. 206, 1009–1017 (2009).
9. Akdis, M. et al. Immune responses in healthy and allergic individuals are characterized by a fine balance between allergen-specific T regulatory 1 and T helper 2 cells. J. Exp. Med. 199, 1567–1575 (2004).
10. Maynard, C.L. et al. Regulatory T cells expressing interleukin 10 develop from Foxp3+ and Foxp3− precursor cells in the absence of interleukin 10. Nat. Immunol. 8, 931–941 (2007).
11. Charbonnier, L.M. et al. Immature dendritic cells suppress collagen-induced arthritis by in vivo expansion of CD49b+ regulatory T cells. J. Immunol. 177, 3806–3813 (2006).
12. Boisvert, M., Chetoui, N., Gendron, S. & Aoudjit, F. α2β1 integrin is the major collagen-binding integrin expressed on human Th17 cells. Eur. J. Immunol. 40, 2710–2719 (2010).
13. Kassiotis, G., Gray, D., Kiafard, Z., Zwirner, J. & Stockinger, B. Functional specialization of memory Th cells revealed by expression of integrin CD49b. J. Immunol. 177, 968–975 (2006).
14. Okamura, T. et al. CD4+CD25−LAG3+ regulatory T cells controlled by the transcription factor Egr-2. Proc. Natl. Acad. Sci. USA 106, 13974–13979 (2009).
15. Workman, C.J. & Vignali, D.A. Negative regulation of T cell homeostasis by lymphocyte activation gene-3 (CD223). J. Immunol. 174, 688–695 (2005).
16. Bettini, M. et al. Cutting edge: accelerated autoimmune diabetes in the absence of LAG-3. J. Immunol. 187, 3493–3498 (2011).
17. Bruniquel, D., Borie, N., Hannier, S. & Triebel, F. Regulation of expression of the human lymphocyte activation gene-3 (LAG-3) molecule, a ligand for MHC class II. Immunogenetics 48, 116–124 (1998).
18. Lee, Y. et al. Induction and molecular signature of pathogenic TH17 cells. Nat. Immunol. 13, 991–999 (2012).
19. Camisaschi, C. et al. LAG-3 expression defines a subset of CD4+CD25highFoxp3+ regulatory T cells that are expanded at tumor sites. J. Immunol. 184, 6545–6551 (2010).
20. Serafini, G. et al. Type 1 regulatory T cells are associated with persistent split erythroid/lymphoid chimerism after allogeneic hematopoietic stem cell transplantation for thalassemia. Haematologica 94, 1415–1426 (2009).
21. Grossman, W.J. et al. Differential expression of granzymes A and B in human cytotoxic lymphocyte subsets and T regulatory cells. Blood 104, 2840–2848 (2004).
22. Passerini, L. et al. Functional type 1 regulatory T cells develop regardless of FOXP3 mutations in patients with IPEX syndrome. Eur. J. Immunol. 41, 1120–1131 (2011).
23. Huber, S. et al. Th17 cells express interleukin-10 receptor and are controlled by Foxp3 and Foxp3+ regulatory CD4+ T cells in an interleukin-10–dependent manner. Immunity 34, 554–565 (2011).
24. Apetoh, L. et al. The aryl hydrocarbon receptor interacts with c-Maf to promote the differentiation of type 1 regulatory T cells induced by IL-27. Nat. Immunol. 11, 854–861 (2010).
25. Battaglia, M. et al. Rapamycin and interleukin-10 treatment induces T regulatory type 1 cells that mediate antigen-specific transplantation tolerance. Diabetes 55, 40–49 (2006).
26. Gagliani, N. et al. Rapamycin combined with anti-CD45RB mAb and IL-10 or with G-CSF induces tolerance in a stringent mouse model of islet transplantation. PLoS ONE 6, e28434 (2011).
27. Chen, F. et al. An essential role for TH2-type responses in limiting acute tissue damage during experimental helminth infection. Nat. Med. 18, 260–266 (2012).
28. Wills-Karp, M. et al. Trefoil factor 2 rapidly induces interleukin 33 to promote type 2 immunity during allergic asthma and hookworm infection. J. Exp. Med. 209, 607–622 (2012).
29. Mohrs, M., Shinkai, K., Mohrs, K. & Locksley, R.M. Analysis of type 2 immunity in vivo with a bicistronic IL-4 reporter. Immunity 15, 303–311 (2001).
30. Bacchetta, R. et al. Molecular and functional characterization of alloantigen- specific anergic T-cells suitable for cell therapy. Haematologica 95, 2134–2143 (2010).
31. Levings, M.K. et al. IFN-α and IL-10 induce the differentiation of human type 1 T regulatory cells. J. Immunol. 166, 5530–5539 (2001).
32. Gregori, S. et al. Differentiation of type 1 T regulatory cells (Tr1) by tolerogenic DC-10 requires the IL-10–dependent ILT4/HLA-G pathway. Blood 116, 935–944 (2010).
33. Gregori, S., Roncarolo, M.G. & Bacchetta, R. Methods for in vitro generation of human type 1 regulatory T cells. Methods Mol. Biol. 677, 31–46 (2011).
34. Andreani, M., Testi, M., Battarra, M. & Lucarelli, G. Split chimerism between nucleated and red blood cells after bone marrow transplantation for haemoglobinopathies. Chimerism 2, 21–22 (2011).
35. Andreani, M. et al. Quantitatively different red cell/nucleated cell chimerism in patients with long-term, persistent hematopoietic mixed chimerism after bone marrow transplantation for thalassemia major or sickle cell disease. Haematologica 96, 128–133 (2011).
36. Rahmoun, M. et al. Enhanced frequency of CD18- and CD49b-expressing T cells in peripheral blood of asthmatic patients correlates with disease severity. Int. Arch. Allergy Immunol. 140, 139–149 (2006).
37. Huang, C.T. et al. Role of LAG-3 in regulatory T cells. Immunity 21, 503–513 (2004).
38. Huard, B. et al. Characterization of the major histocompatibility complex class II binding site on LAG-3 protein. Proc. Natl. Acad. Sci. USA 94, 5744–5749 (1997).
39. Meiler, F. et al. In vivo switch to IL-10–secreting T regulatory cells in high dose allergen exposure. J. Exp. Med. 205, 2887–2898 (2008).
40. Petrich de Marquesini, L.G. et al. IFN-γ and IL-10 islet-antigen–specific T cell responses in autoantibody-negative first-degree relatives of patients with type 1 diabetes. Diabetologia 53, 1451–1460 (2010).
41. Sanda, S., Roep, B.O. & von Herrath, M. Islet antigen specific IL-10+ immune responses but not CD4+CD25+FoxP3+ cells at diagnosis predict glycemic control in type 1 diabetes. Clin. Immunol. 127, 138–143 (2008).
42. Brun, V., Bastian, H., Neveu, V. & Foussat, A. Clinical grade production of IL-10 producing regulatory Tr1 lymphocytes for cell therapy of chronic inflammatory diseases. Int. Immunopharmacol. 9, 609–613 (2009).
43. Bacchetta, R. et al. Interleukin-10 anergized donor T cell infusion improves immunereconstitution without severe graft-versus-host disease after haploidentical hematopoietic stem cell transplantation. Blood 114, abstract 45 (ASH Annual Meeting Abstract) (2009).
44. Desreumaux, P. et al. Safety and efficacy of antigen-specific regulatory T-cell therapy for patients with refractory Crohn’s disease. Gastroenterology 143, 1207–1217.e2 (2012).
45. Pacciani, V. et al. Induction of anergic allergen-specific suppressor T cells using tolerogenic dendritic cells derived from children with allergies to house dust mites. J. Allergy Clin. Immunol. 125, 727–736 (2010).
©20
13 N
atu
re A
mer
ica,
Inc.
All
rig
hts
res
erve
d.
nature medicinedoi:10.1038/nm.3179
ONLINE METhODSMice. We purchased C57BL/6 mice (B6), C57BL/6 Rag1−/− mice, C57BL/6 CD45.1+ and C57BL/6 IL-4eGFP (4get) mice from The Jackson Laboratories. We crossed and generated dominant-negative IL-10R mice46, Foxp3 reporter mice47, IL-17AeGFP reporter mice48, IL-10eGFP reporter mice49 and IFN-γKatushka reporter mice (N.G., S.H. and R.A.F., unpublished data) in our laboratory. We used age- and sex-matched littermates between 8 and 12 weeks of age. Animal procedures were approved by the Institutional Animal Care and Use Committee of Yale University.
Cell isolation and purification of human cells. We obtained human peripheral blood from healthy donors after informed consent in accordance with local ethical committee approval (TIGET PERIBLOOD) and the Helsinki Declaration. We isolated peripheral blood mononuclear cells (PBMCs) by centrifugation over Lymphoprep Ficoll gradients (Fresenius Kabi Norge AS, Halden, Norway). We purified CD4+ T lymphocytes from PBMCs by negative selection using the untouched CD4+ T Cell Isolation Kit II (Miltenyi Biotec, Auburn, CA) accord-ing to the manufacturer’s instructions. We purified naive CD4+CD45RO− T lymphocytes from CD4+ T lymphocytes with CD45RO MicroBeads (Miltenyi Biotec). The proportion of CD4+CD45RO−CD45RA+ cells was consistently greater than 90%.
Isolation of human T cell clones. We obtained T cell clones from CD4+ cells by limiting dilution at 0.3 cells per well in the presence of a feeder cell mix-ture and soluble monoclonal antibodies to CD3 (1 µg/ml, OKT3, Jansen-Cilag, Raritan, NJ, USA) in X-VIVO 15 medium (BioWhittaker, Verviers, Belgium) supplemented with 5% pooled human AB serum (BioWhittaker) and 100 U/ml penicillin and streptomycin (BioWhittaker). At day 3, IL-2 (40 U/ml; Chiron, Italia, Milan, Italy) was added. We re-stimulated T cell clones every 14 d with the feeder cell mixture and soluble monoclonal antibodies to CD3 (1 µg/ml). Between stimulations with feeder cells, we expanded T cell clones with recom-binant human IL-2 (rhIL-2) (40 U/ml). Once the T cell clones had been estab-lished, we added rhIL-15 (5 ng/ml; R&D Systems, Minneapolis, MN, USA) at every change of medium as a Tr1 cell growth factor20,50. We classified the clones on the basis of their cytokine production profile51. We classified clones as Tr1 cells when the ratio between IL-10 and IL-4 was higher than 8, as previously described20,50. We tested all T cell clones in suppression of CD4+ T cell prolifera-tion to assess their regulatory activity.
T cell line differentiation. Human T cells. We differentiated human Tr1 and TH0 cell lines using mouse L cells transfected with human CD32 (hCD32), hCD80 and hCD58 supplemented with monoclonal antibodies to CD3 (100 ng/ml, OKT3, Jansen-Cilag, Raritan, NJ, USA) (artificial APCs), as previ-ously described31. Briefly, we activated CD4+CD45RO− T cells by previously plated irradiated (7,000 rad) L cells in X-VIVO 15 medium (BioWhittaker) supplemented with 5% pooled human AB serum (BioWhittaker) and 100 U/ml penicillin and streptomycin (BioWhittaker). We differentiated TH0 cell lines in the presence of rhIL-2 (100 U/ml; Chiron Italia) and rhIL-15 (1 ng/ml; R&D Systems, Minneapolis, MN, USA), whereas we polarized Tr1 cells with rhIL-10 (100 U/ml; BD Pharmingen) and rhIFN-α2b (5 ng/ml; IntronA, Schering Plough Europe, Bruxelles, Belgium). After 7 d, we re-stimulated T cells under identical conditions for an additional 7 d. At the end of the 14 d of culture, we washed, counted and analyzed the T cells for cytokine produc-tion. We purified IL-10–producing T cells by an IL-10 secretion assay (Miltenyi Biotech) according to the manufacturer’s instructions.
We differentiated DC-10 as previously described32. Briefly, we isolated CD14+ monocytes as the adherent fraction of PBMCs after incubation for 1 h in RPMI 1640 (BioWhittaker) supplemented with 10% FCS (BioWhittaker), 100 U/ml penicillin and streptomycin (Bristol-Myers Squibb) and 50 µM 2-mercaptoethanol (Bio-Rad) (DC medium) at 37 °C. After washing, we cultured adherent monocytes in 10 ng/ml rhIL-4 (R&D Systems) and 100 ng/ml recom-binant human granulocyte-macrophage colony-stimulating factor (rhGM-CSF) (R&D Systems) in DC medium in the absence (mDC) or presence (DC-10) of 10 ng/ml of rhIL-10 (BD Biosciences) for 7 d. After 5 d, the mDC group dif-ferentiated in the absence of rhIL-10 was stimulated with 1 µg/ml of lipopoly-saccharide (LPS) (Sigma-Aldrich) for an additional 2 d. To generate the DC-10 cell lines, we cultured 105 DC-10 with 106 allogeneic CD4+CD45RO– T cells
in 1 ml of X-VIVO 15 medium (BioWhittaker) supplemented with 5% pooled AB human serum (BioWhittaker) and 100 U/ml penicillin and streptomycin (Bristol-Myers Squibb). After 6 or 7 d, we added rhIL-2 (20 U/ml; Chiron Italia) and expanded the cells for an additional 7–8 d. Fourteen days after culture, we collected, washed and functionally analyzed the T cells. As a control, we used T cells differentiated with mature dendritic cells.
Mouse T cells. We activated mouse CD4+ T cells (CD4+CD62LhiCD25−) from C57BL/6 mice with plate-bound monoclonal antibodies to CD3 (2–5 µg/ml, 145-2C11) and CD28 (1–2 µg/ml, PV-1), both made in house. We differentiated TH0 cells in the presence of monoclonal antibodies to IFN-γ (clone XMG1.2, 10 µg/ml) and IL-4 (clone 11B11, 10 µg/ml); we differentiated Tr1 cells in the presence of mouse recombinant IL-27 (25 ng/ml) and TGF-β (2 ng/ml); we differentiated TH2 cells in the presence of mouse recombinant IL-4 (10 ng/ml) and antibodies to IFN-γ (10 µg/ml); we differentiated TH17 cells in the presence of mouse recombinant TGF-β (0.5 ng/ml), IL-6 (10 ng/ml), IL-23 (20 ng/ml), and antibodies to IFN-γ (10 µg/ml) and IL-4 (10 µg/ml); we differentiated TH1 cells in the presence of mouse recombinant IL-12 (10 ng/ml), IL-2 (50 u/ml) and antibodies to IL-4 (10 µg/ml); and we differentiated Foxp3+ iTreg cells in the presence of mouse recombinant TGF-β (2 ng/ml), IL-2 (50 U/ml), and antibod-ies to IFN-γ (10 µg/ml) and IL-4 (10 µg/ml). All were from R&D. After 4 d of culture, we harvested and analyzed the T cells.
RNA isolation and DNA microarray experiments. We isolated RNA from Tr1 and TH0 cell clones from two distinct healthy donors unstimulated or stimulated (6 and 16 h) with immobilized monoclonal antibodies to CD3 (10 µg/ml, OKT3, Jansen-Cilag) and soluble monoclonal antibodies to CD28 (1 µg/ml, 555725, BD Pharmingen) in complete medium at a concentration of 106 T cells per ml. We extracted total RNA with an RNeasy Mini kit (Qiagen, Hilden, Germany) according to manufacturer’s instructions. We used total RNA (100 ng) for GeneChip analysis. We carried out the preparation of terminal-labeled complementary DNA (cDNA), hybridization to the whole-transcript GeneChip Human Gene 1.0 ST Array (Affymetrix, Santa Clara, CA, USA) and scanning of the arrays according to the manufacturer’s protocols (https://www.affymetrix.com). We preprocessed raw data with the robust multichip analysis (RMA) algorithm. To detect DEGs, we performed Welch’s t test without P value correction. We considered genes differentially expressed if the gene’s expression was more than two times different with P < 0.05. We performed all these steps using R and Bioconductor (http://www.bioconductor.org/).
Real-time quantitative PCR analyses. Human samples. We extracted total RNA with the RNeasy Mini kit (Qiagen, Hilden, Germany), and we synthesized cDNA with the high-capacity cDNA Reverse Transcription kit (Applied Biosystems, Foster City, CA) according to the manufacturer’s instructions. We performed real-time analysis using ABI Prism 7500/SDS2.2.1 software. We quantified levels of mRNA using Assay on Demand quantitative RT-PCR kits (Applied Biosystems) with TaqMan Universal PCR Master Mix (Applied Biosystems). We ran samples in duplicate or triplicate, and relative expression was determined by normalizing to the expression of HPRT (hypoxanthine phosphoribosyltrans-ferase 1) and/or B2M (β2-microglobulin) in each set of samples to calculate a fold change in value and then comparing the relative amount to a calibra-tor (expression level of a pool of CD4+ T cell lines from four distinct healthy donors). We performed analyses with the qBase v1.3.5 software (Jan Hellemans & Jo Vandesompele).
Mouse samples. We extracted total RNA from cells using Trizol reagent, followed by RNA clean up using the RNeasy Kit (Qiagen). We used the High Capacity cDNA Synthesis Kit (Applied Biosystems) for synthesis of cDNA. We performed real-time PCR analysis using TaqMan Fast Universal PCR Mater Mix and TaqMan Gene Expression Assays (Applied Biosystems) on a 7500 Fast Real-time PCR system machine (Applied Biosystems). We ran samples in duplicate or triplicate, and we determined relative expression by normalizing to the expression of Hprt.
Cytokine detection. Human samples. We stimulated 0.2–0.4 × 10⁶ human T cells per ml with immobilized monoclonal antibodies to CD3 (10 µg/ml, Jansen-Cilag) and soluble monoclonal antibodies to CD28 (1 µg/ml, 555725,

©20
13 N
atu
re A
mer
ica,
Inc.
All
rig
hts
res
erve
d.
nature medicine doi:10.1038/nm.3179
BD Pharmingen) in complete medium. To measure IL-2, IL-4, IL-10, IFN-γ and IL-17 production, we harvested culture supernatants after 24 h (for IL-2 detection) or 72 h (for other cytokines) of culture and determined the amounts of the cytokines by capture ELISA according to the manufacturer’s instructions (BD Biosciences). The limits of detection were as follows: IFN-γ, 60 pg/ml; IL-10, 19 pg/ml; IL-4, 9 pg/ml; and IL-17, 30 pg/ml.
Mouse samples. We stimulated 0.3–0.5 × 10⁶ mouse T cells per ml for 72 h with immobilized monoclonal antibodies to CD3 (10 µg/ml, produced in the laboratory of R.A.F.) and soluble monoclonal antibodies to CD28 (10 µg/ml, BD Pharmingen) in complete medium. We quantified the cytokines using a Cytometric Bead Array (BD Biosciences) according to the manufacturer’s instructions.
Flow cytometry analysis. Human T cells. We stained human T cells with monoclonal antibodies to CD4 ( SK3, 1:100, BD Pharmingen), CD49b (AK7, 4:100, Biolegend, San Diego, CA, USA), LAG-3 (FAB2619P, 4:100, R&D Systems), CD226 (DW11, 1:100, Biolegend), CD45RA (MI100, 1:100, Biolegend) and CD25 (2A4, 2:100, BD Pharmingen). We performed the staining for CD49b and LAG-3 at 37 °C for 15 min. We used intracellular staining for the detection of FOXP3 (259D, 1:100, Biolegend) following the manufacturer’s instructions. We acquired samples using a BD FACSCanto flow cytometer (BD Biosciences), and we analyzed data with FCS express (De novo Software). We set quadrant markers to unstained controls.
Mouse T cells. We stained mouse T cells with monoclonal antibodies to CD4, TCRβ, CD45.1, CD45.2, CD49b (HMa2, 1:100, 103506), LAG-3 (C9B7W, 1:100, 125210) and CD226, all purchased from Biolegend. We performed the staining for CD49b and LAG-3 at 37 °C for 15 min and at room temperature for an addi-tional 15 min. For the purification of T cell populations according to the expres-sion of CD49b and LAG-3, we first enriched CD4+ T cells by magnetic-activated cell sorting beads (MACS; Miltenyi Biotec) and then further purified them with a FACSVantage (BD). The purity of the sorted cells was higher than 95%.
Suppressive functions. Human T cells. To evaluate the suppressive activity of human T cells, we stained CD4+ T cells (responder cells) with CFSE (Molecular Probes) and activated them using beads coated with antibodies to CD3, CD2 and CD28 (Treg Inspector, Miltenyi Biotec, Bergisch Gladbach, Germany) at a ratio of three beads per cell. We added suppressor cells at a ratio of 1:1. We calculated the percentage of divided responder T cells by gating on CD4+ cells, as described elsewhere52.
Mouse T cells. To determine the suppressive activity of mouse T cells, we labeled CD45.1+CD4+CD25− T cells (responder cells) with Cell Trace Violet Cell Proliferation Kit (1 µM; Invitrogen) and cultured them in 96-well flat-bottom plates (20–50 × 103 cells per well) with or without CD4+CD49b+LAG-3+Foxp3RFP−, CD4+CD49b−LAG-3+Foxp3RFP−, CD4+CD49b+LAG-3−Foxp3RFP− and CD4+CD49b−LAG-3−Foxp3RFP− T cells sorted from the different organs by FACS. The ratios between the responder and suppressor cells were 1:1, 2:1, 4:1 and 8:1, respectively. Irradiated APCs (splenocytes depleted by MACS for CD4+ and CD8+ T cells) were used as feeder cells (4 × 10⁵ cells per well). We stimulated cells with 1 µg/ml of monoclonal antibody to CD3 (2C11, 1 µg/ml, produced in the laboratory of R.A.F.). In some experiments, we performed suppression in the presence of monoclonal antibodies to IL-10Rα (50 µg/ml, 1B1, R&D). After 72 h, we analyzed the Cell Trace Violet dilution in CD45.1+CD4+ cells (responder cells) by flow cytometry. The percentage of divided responder T cells was calculated as described elsewhere52.
Endoscopic and histopathology procedures. We performed colonoscopy in a blinded fashion for colitis scoring using the Coloview system (Karl Storz, Germany)23,53. In brief, colitis scoring was based on the granularity of the mucosal surface, stool consistency, vascular pattern, translucency of the colon and number of fibrin visible (0–3 points for each). For the histology, we fixed colons in Bouin’s fixative solution and embedded them in paraffin.
Antibodies to CD3 and intestinal lymphocyte isolation. We injected mice with monoclonal antibodies to CD3 (15 µg, 145-2C11 produced in the laboratory of
R.A.F.), isotype antibody or PBS intraperitoneally two times every other day. After removal of the Peyer’s patches, we isolated intraepithelial lymphocytes (IELs) and lamina propria lymphocytes (LPLs) by incubation with 5 mM EDTA at 37 °C for 30 min (for IEL), followed by further digestion with collagenase IV and DNase at 37 °C for 1 h (for LPL). We then further separated cells with a Percoll gradient. Unless otherwise indicated, we isolated cells from the upper part of the small intes-tine (duodenum, ileum and jejunum) of mice treated with antibodies to CD3.
Parasite and infection. We recovered third-stage larvae (L3) of N. brasiliensis from coprocultures of infected rats and washed them extensively. We injected 500 parasites subcutaneously in 0.2 ml PBS at the base of the tail, as previously described54. We euthanized mice at the designated times and assessed the presence of adult worms in the intestines by inverted microscopy. We excised, minced and dispersed the whole lungs, spleens and mesenteric and mediastinal lymph nodes into single-cell suspensions. We further purified lung suspensions by centrifugation over a Ficoll gradient55.
Samples from subjects with b-thalassemia. Subjects with β-thalassemia rang-ing in age from 2 to 17 years had been transplanted from HLA-identical sibling donors at the San Raffaele Scientific Institute since 2005 or at the Fondazione Istituto Mediterraneo di Ematologia since 2004. We analyzed 11 patients who developed PMC, in which patient and donor cells coexist for longer than 2 years after transplantation, and 7 patients who developed complete chimer-ism after allogeneic HSCT. The study was approved by the Ethical Committee of the Policlinico Tor Vergata, Rome and the Ethical Committee of San Raffaele Scientific Institute, Milan. We obtained informed consent from patients accord-ing to institutional guidelines and to the Helsinki Declaration.
Statistical analyses. Average values are reported as the mean ± s.e.m. We used Mann-Whitney test, paired t tests and ANOVA to determine the statistical significance of the data. We defined significance as *P ≤ 0.05, **P ≤ 0.005, ***P ≤ 0.0005 and ****P < 0.0001. We performed statistical calculations with the Prism program 5.0 (GraphPad Software, Inc.). We quantified the accuracy of the percentages of CD49b+LAG-3+ T cells to discriminate tolerant from non-tolerant subjects by ROC analysis by means of area under the curve (AUC) measurements. To establish the best screening power of the biomarkers, we investigated the ‘best’ cutoff, which differentiates cases (tolerant subjects) from controls (healthy donors or nontolerant subjects). We chose different cutoffs and computed the corresponding sensitivity (proportion of PMC subjects we claim to be tolerant) and specificity (proportion of healthy donors or subjects with complete chimerism we claim to be controls). Empirical and smoothed ROC curves were plotted and compared to the ‘theoretical’ situation with the sensitivity and specificity equal to one. We chose the best cutoff to maximize the observed specificity and sensitivity such that the percentage of positive cells separated the best cases from controls. We performed analyses with R 2.15.2 statistical software (http://www.r-project.org).
46. Kamanaka, M. et al. Memory/effector (CD45RBlo) CD4 T cells are controlled directly by IL-10 and cause IL-22–dependent intestinal pathology. J. Exp. Med. 208, 1027–1040 (2011).
47. Wan, Y.Y. & Flavell, R.A. Identifying Foxp3-expressing suppressor T cells with a bicistronic reporter. Proc. Natl. Acad. Sci. USA 102, 5126–5131 (2005).
48. Esplugues, E. et al. Control of TH17 cells occurs in the small intestine. Nature 475, 514–518 (2011).
49. Kamanaka, M. et al. Expression of interleukin-10 in intestinal lymphocytes detected by an interleukin-10 reporter knockin tiger mouse. Immunity 25, 941–952 (2006).
50. Bacchetta, R. et al. Growth and expansion of human T regulatory type 1 cells are independent from TCR activation but require exogenous cytokines. Eur. J. Immunol. 32, 2237–2245 (2002).
51. Romagnani, S. Lymphokine production by human T cells in disease states. Annu. Rev. Immunol. 12, 227–257 (1994).
52. Lyons, A.B. & Parish, C.R. Determination of lymphocyte division by flow cytometry. J. Immunol. Methods 171, 131–137 (1994).
53. Becker, D. et al. Robust Salmonella metabolism limits possibilities for new antimicrobials. Nature 440, 303–307 (2006).
54. Fowell, D.J. & Locksley, R.M. Leishmania major infection of inbred mice: unmasking genetic determinants of infectious diseases. Bioessays 21, 510–518 (1999).
55. Brown, D.R. et al. β2-microglobulin-dependent NK1.1+ T cells are not essential for T helper cell 2 immune responses. J. Exp. Med. 184, 1295–1304 (1996).