code-ten - final report - transport research and...
TRANSCRIPT

CODE-TEN FINAL REPORT 1
CODE-TEN FINAL REPORT
The DECODE Method: Theory and Application
Editors
Liana Giorgi
Annuradha Tandon
Contributors
Annuradha Tandon & Liana Giorgi (ICCR)
Georg-Dietrich Jansen and Peter Tabor (PLANCO)
Claus Rehfeld, Jakob Kronbak and Steen Leleur (DTU)
Christian Reynaud , Vesselin Siarov & Damien Mathieu (INRETS)
Jose Viegas & Patricia Figueira (CESUR)
Jukka Räsanen and Juha Tervonen (VTT)
Chiara Borgnolo and Enrico Pastori (TRT)
Alan Pearman, John Nellthorp, Paul Timms and Simon Shepherd (I.T.S)
Emily Bulman & Marga Macian-Fillat (Halcrow)

CODE-TEN FINAL REPORT 2
Executive Summary
The dawn of the 21st century will witness an expanding European Union with the CEEC countries and the Baltic States as new members. Transport emerges to be one of the key areas for integrating the accession countries. The transport networks will have strong influences on trade development, social and cultural integration, and regional development. Currently with several gaps in the transport system of the Central and Eastern Countries, it is still unclear how the European transport network landscape will develop.
To initiate the closing of the gaps in CEEC/CIS, the TINA process has identified several networks across these countries. To aid the CEEC/CIS to complete these networks, the ISPA fund has been set up with an outlay of 1040 million Euro a year for the environment and transport sectors. The amount of financial investment needed significantly exceeds this amount and also that which national governments are prepared and able to invest into transport infrastructure. Thus a prioritisation of projects has to be undertaken. Classically ‘economic evaluations’ are supposed to be the critical factor in deciding whether and when a project should be realised. But with uncertainties related to socio-economic development, integration and the political environments surrounding transport, a strategic assessment method is needed to prioritise projects.
CODE-TEN attempts to answer all these uncertainties by developing a strategic assessment method to prioritise projects. The DECODE method takes into account the uncertainties by forming various scenarios under which these networks will develop. The main precondition for the use of the scenario approach is to identify the factors or dimensions that are likely to have a major impact on future developments in transport. These are three: external socio-economic developments; policy developments and infrastructure developments. How things develop along these dimensions will influence not only the amount of traffic but also the extent of environmental pollution and/or the extent of connectivity in Europe.
Assessment of the network development is necessary not only at the project but also at the programme and policy level. This calls for both a macro level as well as a micro level analysis. Besides this the impacts of the network development have to be measured at both the national/global level and at the regional level. The presence of many actors and stakeholders for deciding the developments makes the assessment of network developments very complex.

CODE-TEN FINAL REPORT 3
The DECODE Method
The DECODE method developed in the framework of the CODE-TEN project is complementary to the evaluation methods currently in use for the second-level prioritisation of projects along the trans-European projects.
The study area in DECODE is not the project but rather the so-called corridor development alternative which comprises three elements:
?? The network in five different variants for the year 2015:
- A do-nothing variant which foresees no new infrastructure is constructed;
- An ‘all road’ variant which assumes that only the road projects identified during the first-level prioritisation process are realised;
- An ‘all rail’ which assumes that only the rail projects identified during the first-level prioritisation process are realised;
- A ‘priority road’ variant which considers from among the road projects identified during the first-level prioritisation process only those that are prioritised by the accession countries during the second-level prioritisation process;
- A ‘regional network’ variant which assumes that only those road and rail projects prioritised by the accession countries during the second-level prioritisation process but which also meet positive boundary conditions are realised.
?? The socio-economic and integration scenarios (quantified in terms of GDP, employment, export, motorisation and population):
- Renaissance scenario. This scenario is characterised by high growth and fast integration. It assumes that by 2010 most, if not all, of the new accession countries would have joined the EU and that those which do not will be well integrated in the European political and economic space. In other words, a ‘virtuous circle’ will develop facilitating growth and integration, both economic and political. The maximum growth rate under this scenario is seven per cent, the minimum four per cent. Countries more likely to display the maximum growth rates are Hungary and Poland, countries displaying the minimum Bulgaria and Romania.
- Dilution scenario. This scenario is characterised by high growth and slow integration. Under this scenario reforms will be successful and Europe becomes a free trade zone with extended co-operation agreements driven by market rules and competition as well as globalisation with a strong

CODE-TEN FINAL REPORT 4
influence of new information technologies and multi-nationals. The European Union as an entity with shared political and organisational structures however weakens, thus interventions for cohesion or structural changes are limited. Countries which are slower in implementing liberalisation will be slower in achieving a sustained growth rate.
- Solidarity scenario. This scenario is characterised by low growth albeit fast integration. The accession process is slower, yet it definitely goes ahead despite comparatively low economic growth rates in both Western and Eastern Europe; in other words integration is driven by foreign policy and security considerations which at the same time point to the strengthening of the political dimension of the European Union. Structural and cohesion funds become the main vehicle for integration – the volume of financial aid is similar to that transferred to former European peripheral countries or less developed regions. Sectoral policies, including transport, become increasingly subjected to regional development considerations.
- Fragmentation scenario. This scenario is characterised by low growth and slow or no integration. It assumes likewise a long transition process but also limited support for the accession countries. This also means that Europe loses some of its substance for actual EU Member States. Individual countries will tend to orient themselves towards regional markets. Regions neighbouring the European Union will have the most to gain. Economic reforms continue to be implemented albeit at a slower rate, convergence is realised only in the long run.
?? The policy scenarios (quantified in terms of transport costs):
- Market approach with infrastructure investment. This scenario is characterised by an emphasis on liberalisation and deregulation and on increasing cross-border or international traffic. It also places an emphasis on infrastructure development. As the free market principles are favoured, road pricing for external costs and restricting road traffic are given a lower emphasis. This scenario assumes that the market will decide the kind of projects to be funded, whereby road takes priority.
- Management approach with infrastructure investment. This scenario lays emphasis on the management of supply and demand hence on regulation or management rather than deregulation, which is in fact what distinguishes this scenario from the previous one. Other goals are the promotion of intermodality and interoperability and the structural goals of increasing accessibility and promoting regional development. Infrastructure development is still considered a means to achieve these goals. Rail projects or a network approach are more likely to be prioritised under this scenario.

CODE-TEN FINAL REPORT 5
- Market approach with an emphasis on decoupling. This scenario shares a number of features with the first one above with a greater emphasis on deregulation. It however does not place such a strong emphasis on infrastructure development and considers this also as being guided by the market. Instead it is in favour of measures promoting interoperability.
- Management approach with emphasis on decoupling. In this scenario emphasis is placed on decoupling with the specific objective of promoting environmental sustainability, hence the strategic importance assigned to the application of envi ronmental regulation and the restriction of local traffic. Overcoming structural deficiencies, hence promoting regional development, is still thought of as important, however not at the expense of environmental damage, hence also the absence of increasing accessibility as a significant goal.
The corridor development alternatives are then assessed against specific group of indicators: direct transport impacts, including vehicle operating cost savings and time savings; environmental and safety impacts; acces sibility impacts. An overall assessment is subsequently provided using two approaches: the goal achievement matrix and a combination of cost-benefit / multi-criteria analysis.
Strategic assessment results
The assessment in CODE-TEN focused on the following corridor development alternatives:
Under the renaissance scenario:
- All infrastructure variants – ‘all road’, ‘all rail’, ‘network approach’ and ‘priority road’ – set against the do-nothing variant;
Under all external socio-economic scenarios:
- A comparison between the ‘priority road’ and ‘network approach’ set against the do-nothing variants in each case.
The results of the cost-benefit / multi-criteria analysis can be summarised as follows:
?? Under the renaissance scenario of high growth and fast integration, the ‘all road’ solution is generally inferior, except in terms of accessibility. The ‘all rail’ approach offers the greatest benefits in terms of safety improvement, air pollution reduction and demographic accessibility – it is also cheaper than the ‘network’ approach by about 20 per cent, but slightly inferior in

CODE-TEN FINAL REPORT 6
terms of vehicle operating costs and time savings, noise reduction and economic accessibility.
?? The ‘network’ approach outperforms the ‘priority road’ approach under all external scenarios on almost all indicators – the sole exception is demographic accessibility under conditions of high growth and fast integration.
?? The ‘priority road’ approach would have adverse consequences for European transport users overall in terms of vehicle operating costs and time, whatever the growth and integration scenarios.
?? Overall accessibility gains under all external scenarios and infrastructure variants are either insignificant or quite small. This however hides the fact that at a more spatially disaggregate level, there is a mixed pattern of gains and losses: in general there are significant accessibility gains close to the corridors with new infrastructure, but significant accessibility losses in adjacent countries which experience traffic growth and hence slower traffic speeds.
The results of the goal achievement matrix analysis that allows to assess how well each specified corridor development alternative is with respect to the policies from which it was developed can be summarised as follows:
?? Under the favourable conditions of the renaissance scenario, the results of the goal achievement matrix approach confirm those of the cost-benefit / multi -criteria analysis: the ‘network’ approach performs very well with respect to its underlying transport policy which gives particular emphasis to intermodality, regional development, accessibility and safety; so does the ‘all rail’ solution. By contrast, the ‘all road’ and ‘priority road’ strategies present more negative and heterogeneous results also with reference to their underlying transport policy.
?? When comparing the impacts for the accession countries separately from those for the EU countries, the most significant difference between these two groups is that while the CEEC present positive scores under all possible corridor development alternatives, the EU shows negative results for the ‘priority road’ solution under the renaissance, dilution and solidarity scenarios.
?? For EU countries, the ‘network’ approach always performs better than the road alternatives. Regarding CEEC, the same is true, with the exception of the fragmentation scenario where the ‘priority road’ solution performs better than the ‘network’ approach.
?? Under most external scenarios, the CEEC find road-based strategies moderately beneficial, whereas Western Europe finds them detrimental.

CODE-TEN FINAL REPORT 7
This can be attributed both to the impacts experienced amongst the two groups, with Western Europe suffering particularly from the negative effects of increased road transport, but also the different policy focuses of the two sides.
?? Looking at the results from the national perspective confirms the robustness of the ‘network’ solution. This means that diversification of the investment in different types of infrastructure would appear to have greater success in achieving national transport policy objectives.
?? The policy areas of ‘increasing cross-border traffic (harmonisation’, ‘intermodality’ and ‘regional development’ explain the better scoring of the ‘network’ approach as compared to the ‘priority road’ solution under different socio-economic and integration scenarios.
The results suggest that if CTP objectives, in particular with reference to sustainable mobility, are to be taken seriously and if subsidiarity is understood to target the integration of both Community and national interests then it is important to support multimodal solutions, albeit paying close attention to positive boundary conditions, hence intermodality as well as patterns of inter-regional co-operation. Such a strategy can guarantee that even under not so favourable conditions in terms of economic growth or even integration, the impacts of transport infrastructure investment are positive both for the local residents and local economies as well as for Europe as a whole.

CODE-TEN FINAL REPORT 8
1 Introduction
The dawn of the 21st century will witness an expanding European Union with the CEEC countries and the Baltic States as new members. Transport is one of the key areas for integrating the accession countries. There are plans to extend the TEN to the East and upgrade the quality of the infrastructure to that of the EU. The amount of financial investment required for this purpose is significant and long-term.
The strategic assessment of this ambitious infrastructure programme is of vital importance, not solely because it involves a large amount of public expenditures; also because the direct and indirect impacts on Central, Eastern and Western Europe will be substantial and not necessarily entirely positive.
The context of uncertainty, characteristic of the process of transition – with reference to both economic recovery and political reforms – but also of the European project of integration, necessitates a scenario-led approach in strategic assessment. The main precondition for the use of the scenario approach is to identify the factors or dimensions that are likely to have a major impact on future developments in transport. These are three: external socio-economic developments; policy developments and infrastructure developments.
Assessment of the network development is necessary not only at the project but also at the programme and policy level. This calls for both a macro- and a micro-level analysis. Besides this the impacts of the network development have to be measured at both the national/global level and at the regional level. The presence of many stakeholders makes the assessment of network developments all the more complex.
The DECODE method developed by the CODE-TEN project seeks to address these challenges. The DECODE method is a strategic assessment method developed for infrastructure programmes and applied to corridor developments. Subject to modifications it is a method which can be applied more generally to major policy initiatives.
This Final Report of the CODE-TEN project documents the theory and application of the DECODE method.
Volume I, the main report, is organised in four chapters: Chapter 2 defines the terms of reference of the CODE-TEN project and more generally of policy assessment. Chapter 3 describes the DECODE method and its various components in detail. Chapter 4 presents the results of the application of the DECODE method on the corridor development programme to the East and puts forward some research and policy recommendations.
CODE-TEN FINAL REPORT 9
Volume II of the Final Report includes all the quantified information produced by the CODE-TEN project – both the input and output data – in a series of tabulations, figures and maps.
The CODE-TEN DSS (Decision Support System) presents the elements of the DECODE method and the results of the demonstration example in computerised form on CD-ROM and is an integral part of this Final Report. So is the digitalised network description and traffic flows / assignments which form part of the CODE-TEN Transport Information Management System (TIMS). The reports on both of these tools are annexed to this Final Report.

CODE-TEN FINAL REPORT 10
2 Terms of reference
The objective of CODE-TEN is to “apply the scenario approach to the study of TEN developments and the extensions to the CEEC/CIS, paying particular attention to the marginal long-term effects and, in particular, the spatial distribution of environmental impacts and socio-economic impacts” (Work Programme, 4th Framework Programme, 3rd Call, Task Description). The main output of CODE-TEN is the development of a comprehensive policy-assessment methodology and accompanying decision-assistance tools.
With reference to this general goal, this chapter defines the terms to be used throughout this report, namely: public policy; policy process; policy analysis; impact assessment; scenarios; strategic assessment; the notion of corridor and that of corridor development alternative.
2.1 Public policy
How public policy is defined has varied over time depending on the role assigned to the market in society: in other words the role of public policy is differently defined under utilitarianism and laissez-faire, liberalism and neo-liberalism (cf. Parsons, 1995). In any case, a policy is thought to comprise a set of options (measures or tools) for resolving problems. The objectives of a specific policy as much as the tools and measures selected to reach those objectives are frequently defined in the course of implementation of a policy. This has led a number of policy analysts to view a policy as comprising not alone a set of objectives, proposals and measures but also as the activity or process as such of policy-making (cf. Hogwood and Gunn, 1984).
2.2 Policy process
The standard or ‘stagist’ model for the policy process represents a heuristic device “with which we can explore public policy” (Parsons, 1995, p.80). Different scholars tend to label differently the various stages, but this is of secondary importance. Overall, there is agreement that the policy process runs the following cycle (adopted from Parsons, 1995, p.80; see also Deliverable 4, TENASSESS, 1998).

CODE-TEN FINAL REPORT 11
There have been some serious criticisms to this ‘stagist’ model of the policy process, especially to the fact that it suggests that change is only possible under specific circumstances or ‘windows of opportunity’. Sabatier (1991), for instance, argues that it is not possible to consider the stages as being so distinct. Ollivier-Trigalo and Rui (Deliverable 3, TENASSESS, 1998) argue the same for the implementation of major transport projects. Nevertheless, it would still appear possible to keep to this model as a heuristic device provided one builds into the analysis also an understanding of networks and system of actors.
2.3 Policy analysis
Policy analysis can be considered as running across a continuum as follows
Problem
Problem definition
Alternatives (solutions)
Evaluation of options
Selection of policy option
Implementation
Evaluation

CODE-TEN FINAL REPORT 12
Policy Policy Monitoring Information Policy Determination content evaluation for policy advocacy
Policy assessment often refers to evaluation and monitoring. When applied to monitoring it necessitates knowledge of the policy determination and policy content, hence it is closely related to analysis of policy.
The DECODE method is a method for the analysis of policy, whereby it can also be applied to planning. Good practice planning is the step following assessment, i.e. it corresponds to ‘analysis for policy’ in the above figure. Ideally, it relies on the results of the assessment exercise. This is not always the case in practice – hence policy advocacy.
2.4 Impact assessment
Rossi and Freeman (1993) define impact assessment as “evaluation of whether and to what extent a programme / plan / policy causes changes in the desired direction among a target population”. Impact assessment is one important, albeit not the sole, aspect of policy assessment.
This definition of impact assessment follows a rather positivistic understanding of policy success and failure: a policy is measured by its results, in particular in relation to its objectives. A more general, albeit also more exploratory, definition of the term impact assessment would not include any reference to the ‘desired direction’ and instead talk of an “evaluation of whether and to what extent a programme, plan or policy causes changes ... among a target population”.
The implications of this definition are that any impact assessment exercise needs to establish:
?? a typology of outcomes or net effects, corresponding to the objectives;
1 2 3 4 5
Analysis of policy
Policy assessment
Analysis for policy

CODE-TEN FINAL REPORT 13
?? a typology of criteria, each corresponding to one type of outcome or net effect;
?? a typology of the ‘target population’ or of the ‘social groups’ on which impacts ought to be studied.
There are various strategies for impact assessment. The most frequently used are: design strategies for isolating effects of extraneous factors for partial coverage programmes in the form of randomised experiments or quasi experiments; design strategies for full-coverage programmes in the form of simple before and after studies, cross-sectional or panel studies and time-series analyses; judgemental approaches; and pooling evaluations in the form of meta-analysis.
Once impact assessment has been carried out, the question arises on how to combine impacts to arrive at an overall score or evaluation result. The methods most commonly used for this purpose are:
?? Cost-benefit analyses display the relationship between project costs and outcomes, with both costs and outcomes expressed in a common numeraire, typically in monetary terms, as value is defined in relation to the ‘willingness to pay’. CBA makes use of shadow prices to estimate the value of resources or outcomes for individual and, subsequently, social welfare. The assumptions underlying the estimation of shadow prices are at the heart of cost-benefit analysis. Weights are primarily used to correct for non-optimal distributions; policy weights are used (albeit less frequently) for assessing the differential importance attached to objectives or for determining whether and how to add impact scores. The method of valuation of non-market items, like environmental resources, is one major area of debate among CBA experts.
?? Cost-effectiveness analyses are often used as an alternative or a supplement to cost-benefit analysis when it is not possible to obtain any indicator of how individuals valuate a specific outcome in monetary terms. In cost-effectiveness analysis no explicit money values are attached to benefits; only costs are monetised. The objective is to show how a given level of benefit can be achieved at the minimum cost, or to show how the maximum level of benefit can be achieved at some given level of cost. Thus the efficacy of a programme or initiative in achieving its goals is assessed in relation to the monetary value of the resources invested into the former.
?? Multi-criteria analyses. Like cost-benefit analysis, multi -criteria analysis starts from the premise that there are both positive and negative impacts. Unlike cost-benefit analysis, multi-criteria analysis does not assign a common unit of measurement to all impact types as it considers social welfare to be more than the sum of individual welfares and value, more generally, to comprise more than the ‘willingness to pay’. Most multi-criteria

CODE-TEN FINAL REPORT 14
analyses methodologies recognise the importance of CBA but consider it as more applicable to commercial appraisal / business appraisals. MCA makes little use of weights derived from survey data on consumers’ ‘willingness to pay’, market data on consumer behaviour or income distribution data. The weights used in MCA are established using a judgemental approach on the basis of time series observations or the pooling of evaluations.
Impact assessment is an integral, albeit variable, part of the DECODE method. Chapter 3 reports on the methods currently employed for the measurement of economic, accessibility and environmental impacts of major infrastructure investments at network level. With regards the aggregation of impacts, DECODE uses two methods, both entailing elements of multi-criteria and cost-benefit analysis. These are also described in chapter 3.
2.5 Scenarios
Scenarios represent a tool used by policy analysts to address the factor of uncertainty. Piers and Sienstra (1999) note that scenarios have different functions but basically they help ‘reduce complexity’ and in that facilitate discussions about future development. ‘They are not predictions, but rather tools for a structured communication about uncertain factors’ (p.4).
How the future image is structured and what it entails differs across approaches. Typically there are two main issues to be addressed: first, the scope of the scenario (i.e. whether it covers one particular dimension alone or whether it provides a more comprehensive image of the future by considering the interaction between related variables); and second whether it will built on forecasts or backcasts.
The DECODE method uses scenarios that combine information on both external and internal factors to the transport system and based on forecasts.
2.6 Strategic policy assessment
Strategic policy assessment is policy analysis which focuses on policies, plans or programmes rather on specific projects. It is also an approach which seeks to combine tools and perspectives rather than relying on one particular methodological approach.
Strategic policy assessment was first developed in the environmental field where it came to be known under the name of ‘strategic environmental

CODE-TEN FINAL REPORT 15
assessment’ (SEA). SEA represents a development of ‘environmental impact assessment’ (EIA) to address specific strategic questions that cannot be addressed at project level or through an agglomeration or aggregation of the results of numerous project-specific EIAs.
The approach taken in CODE-TEN could be said to represent one of the first attempts to carry out a strategic policy assessment in the field of transport (STA). The distinction between STA as proposed in CODE-TEN and SEA is solely one of degree or emphasis: environmental impacts are only one relevant aspect in STA, but the main (albeit not sole) issue of concern in SEA.
Table 1, adapted from a similar one in Zech et al. (1997) outlines the differences between strategic policy assessment (in the field of transport) and project appraisal.
2.7 Corridor
The corridor is a policy programme or plan which aims at the overcoming of structural gaps in the extended European space with reference to the transport system but also regional development – hence at the increase of cohesion – through, primarily, investment in multi-modal infrastructure networks. The policy programme ‘corridor’ as launched by the Helsinki and Crete Conferences of European Ministers of Transport and elaborated by the TINA (Transport Infrastructure Needs Assessment) process under the auspices of the General Directorates for Transport and External Relations is the subject of the policy analysis in CODE-TEN.
There are various elements to the notion of corridor that justify strategic assessment and the use of scenarios:
?? Any one corridor transcends more than one country, is multi-modal in profile and comprises several small scale projects and an elaborated phasing plan.
?? Together the Helsinki corridors comprise the backbone of a network to cover Eastern Europe as an extension of the Trans-European networks in the West – the impacts of any one corridor are heavily dependent on the developments along other corridors.
?? The countries which the corridors transcend are transition countries which only gradually will be integrated into the European Union and which economically as much as politically lag behind their West European neighbours. These differences are relevant for assessing implementation plans as well as for the interpretation of impacts.

CODE-TEN FINAL REPORT 16
2.8 Corridor development alternative
A corridor development alternative is a term especially coined for DECODE and strategic transport assessment. A corridor development alternative represents an image of the infrastructure network under specified socio-economic and policy scenarios.
Given that the future infrastructure network can come in different variants by reason of the variability in infrastructure strategies at national and European level – also in connection to the phasing of individual projects – and considering different images of the future with respect to socio-economic and policy trajectories, it becomes clear that there is always a plurality of corridor development alternatives to consider.
In strategic assessment it is the corridor development alternative which is under study – the latter is the lens through which the corridor policy programme is examined.

CODE-TEN FINAL REPORT 17
Table 1. Comparison of project appraisal and strategic (policy) assessment
Project Appraisal Strategic Policy Assessment
Concerned with individual projects Concerned with policies, plans or programmes
Objective
Optimisation of single project with the goal of maximising benefits and minimising negative externalities and/or costs.
Decision on routing or location of the project and details of project implementation
Appraisal of a programme or plan with the objective of ‘optimising’ transport system solutions.
Identification of general strategies
Alternatives under Examination
Route options of the project, including ‘null variant’ Transport system solution variants established under consideration of perspectives of different actors and/or existing or planned measures.
Frame of Reference (for impact assessment)
Detailed impact assessment at local level. Analysis of regional and global effects, as well as of indirect, long-term and additive effects on the transport system.
Emphasis on multi-criteria analysis
Output
Quantitative analysis and output Strategic recommendations about transport system.
Source: Adapted from Zech et al. (1997).

CODE-TEN FINAL REPORT 18
3 The DECODE Method for Strategic Assessment
3.1 The context of evaluation
The objective of strategic assessment when applied to infrastructure investment programmes is to assess strategies, rather than specific projects, in the context of more general policy and socio-economic developments.
Two questions arise in this connection:
?? First, how to analytically combine information on strategic elements, i.e. infrastructure, socio-economic trends and policy to describe aggregate influences on the transport system;
?? Second, what series of assessment exercises to undertake and how to combine information on impacts at the network level.
With reference to the first question: In the practice of the policy process the specification of an infrastructure strategy is not independent from more general policy and socio-economic developments. For example, the decision to build a highway will not only take into account the transport demand in a particular region but will also consider the existence or not of pricing regimes as well as the actual and potential pressure of environmental groups opposing the construction of highways because of their negative environmental impacts. The forecast of transport volumes used to justify the need for building a highway has to take into account macro-economic developments in the home country as well as in neighbouring countries; as well as the long-term competitive position of the road in relation to other modes of transport which, in turn, is determined – at least in part – by fuel prices and transport costs which are dependent, among others, on more general developments regarding duties as well as on technological changes.
For the purposes of assessment, i.e. for analytical purposes, it is useful to keep the different steps distinct, whereby this does not preclude that connections are made between the different levels at different stages. One way to do this in a systematic way is through the use of scenarios.
With reference to the second question: Transport planning has to consider four separate, albeit interrelated, questions (cf. Leleur et al., 1998, CODE-TEN Deliverable 1), namely:
?? Is the project worth the money?
?? Can it be further improved in technical terms?

CODE-TEN FINAL REPORT 19
?? Does it have a good chance to be agreed upon and decided insofar as it meets more general transport policy objectives?
?? Does it have a good chance of being implemented in that it faces few barriers to realisation?
At the level of project assessment it is possible to consider these questions in any sequence or even in parallel. Ultimately insofar as the questions are interrelated the answers given to any influence the answers to the others. For instance, if the project is ‘worth the money’ but does not meet policy objectives it might have to be redesigned to meet the latter which in turn might increase or decrease its chance of realisation. Alternatively a project which meets policy objectives and faces no major barriers to implementation in terms of public acceptability might not be ‘worth the money’, thus also not possible to finance, unless further improved in technical terms.
The planning context is far more complex in the case of corridor assessment or more generally at the level of infrastructure programme evaluation: there is a plurality of national policy contexts to consider; consequently also a plurality of actors and potential barriers; and not least several projects each of a different size and time scale of implementation. Furthermore, the long-term scale of realisation of corridor infrastructure introduces an element of uncertainty that needs to be considered. Thus, it is wiser to impose a certain order on the ‘tests’ to be undertaken. In strategic assessment, we would contend, it is better to first address the question of political / policy suitability prior to proceeding to examine the economic efficiency or effectiveness of the project in question or its long-term indirect impacts.
3.2 Guiding principles
The DECODE method is based on the following principles:
1. The frame of reference is the full network;
2. There is no single infrastructure strategy but rather a plurality of these;
3. The infrastructure strategies are defined with reference to the full network and considering the actual national policy environments and stakeholder interests;
4. There is no single scenario to describe future developments in the policy field and socio-economic trends but rather a set of likely trajectories or future images which logically combine socio-economic forecasts with policy environments at the aggregate;

CODE-TEN FINAL REPORT 20
5. The unit of evaluation or impact assessment is comprised by the infrastructure strategy as presently evolving set against the images of the future.
6. Impact assessment tools have to be refined to (a) account for the geographical scope of the network and (b) allow for the assessment of spatial distribution.
The DECODE method combines top-down and bottom-up approaches. The top-down approach is used to describe potential future developments in the policy field at the interface with socio-economic trends. The bottom-up approach is used to examine each single infrastructure project that forms part of the infrastructure investment programme and, in turn, to establish infrastructure strategies.
3.3 Methodological steps
The above principles determine the steps of the DECODE method as follows:
1. The first step is to obtain (if already available) or establish (if not available) a geographical information system on the network under consideration which distinguishes actual from future technical parameters for the various links;
2. The second step is to specify the socio-economic scenarios as well as the policy options for the future and the ways in which the latter will influence developments in the transport sector (in particular cost structures, modal split etc.)
3. The third step is to define the infrastructure strategies for the whole network on the basis of information on actual policy developments in various countries and barriers to implementation, i.e. factors that determine prioritisation and phasing.
4. The fourth step is to examine the consistency between infrastructure strategies and scenarios with the objective of filtering out those (corridor) development alternatives that appear more likely (under our present state of knowledge).
5. The fifth step is to measure the impacts on each of the selected (corridor) development alternatives. This in turn implies:

CODE-TEN FINAL REPORT 21
a) making traffic flow estimations and assignments for each (corridor) development alternative as most impact measurement tools in transport use traffic flows for the estimation of impacts;
b) measuring impacts paying attention to the spatial distributional effects;
c) making informed judgements on the advantages and disadvantages of each (corridor) development alternative and where possible combining impacts to arrive at an overall score.
6. The sixth step is to use the results to arrive at policy-relevant recommendations. This can take various forms depending on the objective of the policy-owner.
a) to select one (corridor) development alternative – either the one with the highest overall score or the one with the highest positive scores on dimensions of particular relevance. In this case what the strategic assessment can additionally provide is an indication of the risk factors or alternatively of the external conditions that would have to be met for any particular (corridor) development alternative to display these positive impacts;
b) to select through sensitivity analysis those projects that are the most influential across (corridor) development alternatives in terms of positive impacts and submit these to more detailed project appraisal;
c) to map detailed infrastructure strategy plans at national level (for instance for accession countries) that are consistent with European developments;
d) to use the results of the spatial distribution of impacts to guide rules of financing or the sharing of costs.
In the remaining of this chapter we elaborate on each of these steps separately.
3.4 Transport information management system
The important first step in any strategic assessment exercise is to ensure the availability of information on the technical parameters of the network (actual and planned) and of general background socio-economic indicators on the countries and regions of the network.
The Transport Information Management System (TIMS) developed in the framework of the CODE-TEN project is designed as a system for the greater

CODE-TEN FINAL REPORT 22
European area and includes CEEC/CIS. It provides information at regional or national level on the following subjects:
?? Institutional, legal and political subjects per country,
?? demographic and socio-economic subjects per region/country,
?? foreign trade and employment per region/country,
?? regional transport networks
?? transport demand and organisation per country and
?? transport cost (commercial and resource costs) per country
The TIMS includes real data where available and estimated data otherwise (albeit accordingly flagged). Estimations were necessary where data was available at the national level but not at the regional level (as with car ownership) or where data was available for link types but not for each specific link (as with average daily traffic or percentage of freight traffic to total traffic).
Political and policy data. For each country, the TIMS reports on the institutions responsible for transport, the legal framework to organise transport performance, policy relevant actors and the national transport policy objectives (status 1997).
Regional subdivision. The TIMS segments Europe into about 500 regions following the European standard NUTS classification. The NUTS II level was chosen as the minimum size for regions. Wherever applicable the NUTS III level is taken into account. In some countries deviations from this standard were made in order to accommodate for the lack of the NUTS classification system (as in the CEEC/CIS) or for allowing the inclusion of information from other sources other than EUROSTAT (for instance Germany is divided into one hundred and twelve so called traffic regions following the German Transport Statistics).
Each region is represented by one centre which is connected to the network. These connections are manifold but mode-specific. A clear identification number is assigned to each individual region. For further assessment each region has a centroid - the main city of a region. This main city need not necessarily be the largest city or need not be at the centre of a region.
Socio-economic data: The socio economic regional data set provides a basis for the estimation of traffic volumes and gives information about social disparities. It includes population data, GDP, as well as employment and unemployment rates. The data set also includes forecasts for the years 2005, 2010, 2015 and 2030 – these were estimated on the basis of the information provided by the scenarios (see section that follows) and are available both at national and regional levels.

CODE-TEN FINAL REPORT 23
Information is also provided on land use and elevation which gives an overview of the settlement structure on the surface and the geographical circumstances. The component on land use contains surface, elevation, cities and airports.
Traffic data. The following data are provided at the national level mostly for the year 1995: number of accidents, number of injuries and number of deaths by road; number of cars and lorries; annual fuel sales in litres; and the (national) exports and imports structured according to the nine standard international trade classification (SITC) groups. Projections concerning car ownership and total import and export until the year 2030 are provided at the national level.
As traffic flows are not normally found in statistics the TIMS does not include information on traffic flows on each link. However it does provide the user with the necessary information, e.g. demographic data, regional employment structures (by sectors) and GDP, for making relevant estimations. Traffic flows can be calculated by transport models on the basis of the socio-economic data in combination with network information.
Network organisation. Networks are developed and presented on a mode specific basis. For each mode, the network contains links and nodes. Nodes are harbours, railway stations, road/highway inte rchanges or geographically relevant points. Links are connections between two nodes (road, highway, railway line or inland waterway). All modes use the same numbering system. The node number clearly identifies the region to which a node belongs. Links are determined by the node numbers of the nodes the link connects.
Every region is represented by a centroid which reflects the site within the network where interregional traffic originating in the region is fed into the network and where all traffic destined to this region ends. The centroids are connected to the network by virtual links – these are not actual network components but entail information on the average access time in the area and the corresponding modes.
The network contains further virtual links to permit transfer from one transport mode to another. Multimodal traffic chains can be considered. Mode transfer is possible at ports and at railway stations, and insofar as freight is concerned, depends on the type of goods being transported.
Network data. The road network contains about 6000 links and 4000 nodes. The rail network contains approximately 3000 links and 2000 nodes. The inland waterway network contains about 500 links and 400 nodes. All tables describe the present as well as the future situation. The information provided by virtual links enables the intermodal use of the network.
Transport cost. The TIMS provides basic costs per transportation mode and country. These are related to performance indicators such as cost per km

CODE-TEN FINAL REPORT 24
and/or cost per hour, as well as to technical features like distance, speed and capacity. Together with performance features the effective transport cost of vehicles operating between an origin O and a destination D can be estimated. The costs of intermodal transfer of passenger and goods are provided through the virtual links.
Commercial/behavioural cost reflect the perceived total cost to be paid per trip. Resource costs reflect the consumption of resources, which will be necessary to achieve a certain goal or to realise selected projects and to measure real consumption.
The CODE-TEN TIMS is designed for use with Windows 95/98 and Windows NT 4.0. It makes use of HTML documents and thus has to be started with an appropriate HTML browser. To produce this documentation, Netscape Communicator version 4.5 for Windows NT was used. The TIMS contains information compiled in MS Excel, MS Winword and Mapinfo.
The structure of the TIMS is described in detail in Deliverable 2 of CODE-TEN. The most up-to-date version including the traffic flow estimations and assignments (see section on traffic flows) is a part of this Final Report in the form of a CD-ROM and accompanying documentation.
3.5 Scenarios
A scenario is a set of hypothesis that describes the ‘image’ of the transport system. The main influencing factors on the transport system are the socio-economic environment of transport, the spatial aspects of the latter and the transport policy context. GDP emerges to be the most important socio-economic variable. Transport policy has both a short term and a long term effect on the transport supply variables (prices and costs of transport, development of network etc.). In fact it is both an internal scenario where it determines the development of the infrastructure variants and also an external scenario where it affects the secondary impact of infrastructure development on costs.
A complicating factor when developing scenarios for the extended European space, i.e. including the CEEC countries and the CIS, is that there are still many uncertainties concerning the transition and integration processes. For EU countries it is possible to adopt a trend scenario as the reference scenario since the element of uncertainty involved is lower.

CODE-TEN FINAL REPORT 25
Scenarios for Western Europe
The economic situation is characterised largely by the GDP growth rate. The existence of time series data in conjunction with the current relatively stable economic context allows us to define trend hypotheses of GDP for EU countries. An average 2,5 per cent growth hypothesis was taken as reference for the EU GDP.
Scenarios for Eastern Europe
The recent situation in the CEEC countries, characterised by oscillating production and transport demand patterns, makes it difficult to define a reference scenario. The lack of consistent data complicates the problem even further. Various trajectories are possible. In order to better specify these, certain assumptions need to be made in particular regarding socio-economic development and the integration process.
Socio-economic development
Over the past few years the general economic evolution shows a confirmed recovery of economic growth in all the CEEC. Nevertheless there remains a lot of uncertainty about the evolution of the GDP. In order to cover a range of possible trajectories two main hypotheses are proposed: a high growth (optimistic) scenario and a low growth (pessimistic) scenario for GDP.
In our study we have used a range between 2.5% and 7% for the high and low hypotheses. The high hypothesis was constructed considering that transition will imply a strong push towards the homogenisation of European economy. This will be accentuated by the existence of cohesion policies helping the new accession countries and/or the countries in the pre-accession stage to catch-up and integrate more rapidly. Poland which engaged quickly in the economic transition is an example of high growth – a 7% growth is expected till 2003. Other countries would progressively fall in line with this growth with the help of cohesion policies although at a lower pace. The CEEC will also gain from European integration facilitating the opening of all markets in Europe, the free traffic of freight and travellers and the suppression of border controls. But growth could also result from a strong domestic demand by local companies or from a surplus in the trade balance because of competi tive advantages due to lower salaries and higher education. Another positive effect could come from the desire of companies all over the world to return to Europe where risks seem more controlled after the ‘Asia crisis’. Thus a foreign direct investment flow towards this region can be expected.
In the low hypothesis , the structural reforms are not firmly established and transition takes more time than expected. Concerning macro-economic

CODE-TEN FINAL REPORT 26
balances, either the restrictive budgetary policies lead to a decrease of domestic demand or the domestic supply cannot meet demand and the countries have to import which is a detriment to the trade balance. Growth under this scenario is expected to drop to about 2%.
Within this 2 to 7 per cent bracket, growth trajectories can be drawn for each CEEC country according to progress already made towards economic and institutional reforms.
In this study a high and low GDP rate of growth was defined for each of the countries up to 2030. It is thus possible to obtain 2005 (short term), 2015 (medium term) and 2030 (long term) hypotheses for GDP.
Extrapolation for the forecasts are made under the assumption that growth rates gradually converge towards the average rates of the European Union. Due to many uncertainties, the time frame for the convergence cannot be calculated accurately. One reason for this is the lack of knowledge about the volume of the informal third economy, the role of which is significantly more important in the CEEC and CIS than in the EU countries.
All these considerations raise the question of the speed of integration and convergence. When looking at the evolution of the GDP index, the countries

CODE-TEN FINAL REPORT 27
can be classified in three groups as regards their speed recovery and rate of growth. These are:
?? Group I – Poland, Hungary, Czech Republic and Slovenia
?? Group II – Slovak Republic, Latvia, Lithuania, Estonia
?? Group III – Bulgaria and Romania
GDP is the most discriminatory variable for charting socio-economic development as it correlates highly with many other variables that are important for mapping the transport system, namely demography, motorisation rates (which in turn can be used to determine mobility), trade, employment and sector development. The qualification of the above variables requires in addition the consideration of some other trends or issues. We consider these briefly below.
Demographic projections. For some years since 1993, there has been a demographic decrease in CEEC. In 2020, the East European population will be 123 million inhabitants and will represent 25% of the ‘Greater Europe’ as against 24% in 1997 (cf. trend analyses of the World Bank, EUROSTAT and the U.S. department of commerce). Migration, both external and internal, have a strong influence on demography. It also needs to be kept in mind that there is a large variation in demographic patterns between and within countries.
Motorisation. The motorisation rate is both an external and an internal variable of the transport system. When considering the influence of external factors the motorisation rate can be treated as a derived variable and estimated with an independent model calibrated with socio-economic data. For the purpose of this study motorisation rates were estimated on the basis of projections of the present rates through GDP and population estimates using a logistic model. Population density was used to disaggregate motorisation rates at the regional level. The logistic growth model assumes that motorization grows (Mi) at an exponential rate until it reaches the saturation limit level (S). From that point onwards the rate of motorisation growth begins to decline till it reaches zero. Consequently the growth rate observed in the EU countries at the 2015 horizon has an average rate of 16%, while in the CEEC it varies from 12% to 40% (according to the demographic and the GDP growth).
International trade. Corridor assessment has to include projections on international trade considering the international significance of major infrastructure programmes. An important share of the traffic on corridors will be international traffic for medium and long distances.
In an expanding trade context the economies of many CEEC are likely to be open as these are for the most part small countries – this has also been the case with the Benelux. (Even though the cross-border interregional exchanges dropped significantly in the first decade following transition, this is not a trend that is expected to hold as this reflected the radical transition from a demand

CODE-TEN FINAL REPORT 28
economy under the hegemony of the former Soviet-Union to an open economy oriented primarily towards the West).
CEEC countries are very open economies although their GDP per capita is fairly low. Therefore the same magnitude can be taken for the increase of the import/GDP and export/GDP ratios as for the EU countries. A certain symmetry of development can be noted between the new member states of the EU and future entrants into the EU. The comparable evolution of elasticity and rate of opening of the economy between these two kinds of countries enables scenarios of foreign trade evolution of the CEEC. The ‘regional trade’ ( that is trade between Visegrad countries and with the CIS) also creates transit flows.
Employment. The liberalisation of the market in the CEEC (in conjunction with the decrease of state subsidies) will in the short term increase the unemployment rate. In the medium to long-term however a recovery can be expected. This will follow the rate of growth of the service sector.
Sector analysis. Since the beginning of the nineties, the structure of production in the EU and the CEEC seems to be converging. This is shown by the detailed analysis of foreign trade per type of product. Competitive differentiation develops within branches at a detailed level of specification of the products and the quality of the product itself is often the criterion of market segmentation. New national private companies try to adapt to the market and find their own niches. International companies are also investing in the CEEC thus progressively including them in a multinational network. The shares of foreign investments in CEEC reflect this change: Hungary, Poland and the Czech Republic attract together 80 per cent of all foreign direct investment.
Integration
The CEEC entered an economic transition phase at the beginning of the nineties. Several countries have in the meantime entered the pre-accession phase which involves institutional development and the approximation of their legislation to that of the European Union. Both are expected to have major impacts on the economic structures and on performance.
The political objective of integrating the CEEC into the European Union within a relatively short period of some years must also be taken into account and included in the scenarios. According to the Agenda 2000, the adoption of the Acquis Communautaire prior to accession permits a balance between rights and obligations. The accession agenda will depend on the progress achieved by each candidate country with regard to the adoption, implementation and effective application of the Acquis Communaiture. But the accession agenda will also depend on the political choices made by the Community concerning its future and its own institutions. In other words, a balance is being sought

CODE-TEN FINAL REPORT 29
between the ‘widening’ and the ‘deepening’ of the European project of integration.
It remains difficult to fix a date for the accession of new members. A close relation between the institutional and geographical aspects of integration can be expected. First to accede would be those countries that are within kilometres from the eastern borders of the EU and thus close to the main economic centres.
Under the quick integration scenario six countries, namely Poland, Hungary, the Czech Republic, Slovenia, Estonia and Slovakia would accede into the European Union in 2002, the remaining four – Lithuania, Latvia, Bulgaria and Romania – five years later. Under the slow integration scenario, the aforementioned six countries would only accede in 2005, the rest not before 2010.
EU membership will significantly change the position of an acceding country, offering opportunities to expand its market but also submitting it to more severe competition. More specifically it will allow new Member States to benefit from the structural and cohesion funds which will represent an important part of public subsidies. Their economies will consequently benefit from an external boost of one per cent or more of the expected average growth of GDP.
Foreign investment is concentrated in a few areas; so are economically productive or high-tech industries and the educated labour force. This leaves many rural areas and old industrial centres in a spiral of decline. Subsequently traffic tends to concentrate around a few rapidly developing urban centres and border regions.
EU enlargement will change the regional balance of Europe. As shown by several studies commissioned by DG Transport, there is a concentration of European activity in a geographical zone which extends from southern Britain to northern Italy through Benelux, Germany, part of France and Austria. Within this ‘Blue Banana’ zone, there is a move towards the southern regions in Germany but also at the Mediterranean coast. With the accession of the CEEC in the European Union many East European cities will be included in this development. In other words, the barycentre of the European economy will move towards the East. Some south western regions of Europe already fear the risk of increased marginalisation and have asked for improved links with Central Europe.
Billion
CODE-TEN FINAL REPORT 30
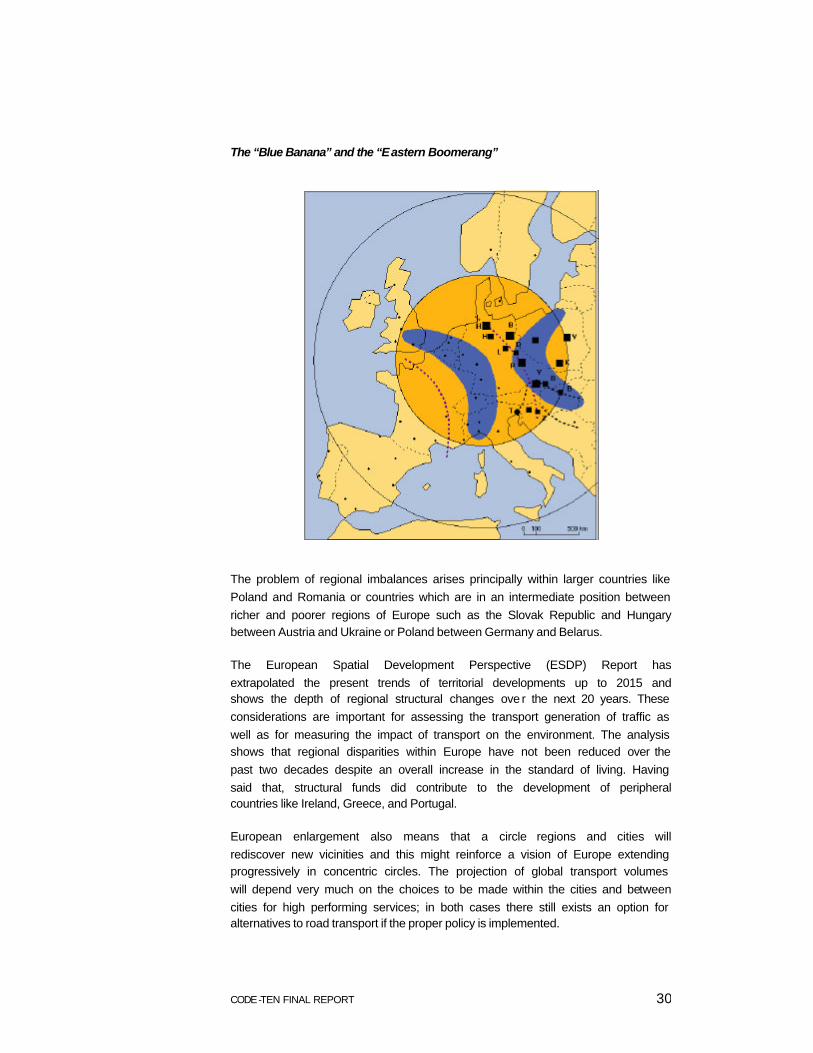
The “Blue Banana” and the “Eastern Boomerang”
The problem of regional imbalances arises principally within larger countries like Poland and Romania or countries which are in an intermediate position between richer and poorer regions of Europe such as the Slovak Republic and Hungary between Austria and Ukraine or Poland between Germany and Belarus.
The European Spatial Development Perspective (ESDP) Report has extrapolated the present trends of territorial developments up to 2015 and shows the depth of regional structural changes ove r the next 20 years. These considerations are important for assessing the transport generation of traffic as well as for measuring the impact of transport on the environment. The analysis shows that regional disparities within Europe have not been reduced over the past two decades despite an overall increase in the standard of living. Having said that, structural funds did contribute to the development of peripheral countries like Ireland, Greece, and Portugal.
European enlargement also means that a circle regions and cities will rediscover new vicinities and this might reinforce a vision of Europe extending progressively in concentric circles. The projection of global transport volumes will depend very much on the choices to be made within the cities and between cities for high performing services; in both cases there still exists an option for alternatives to road transport if the proper policy is implemented.

CODE-TEN FINAL REPORT 31
Combined socio-economic and integration scenarios It is proposed to frame the socio-economic environment using a few assumptions: for the EU countries the ‘reference’ trend scenario; for the CEEC the combined socio-economic and integration scenarios. We define four external scenarios by combining the two socio-economic scenarios and the two integration scenarios:
“European Renaissance” (R). This scenario is characterised by high growth and fast integration. It assumes that by 2010 most, if not all, of the new accession countries would have joined the EU and that those which do not will be well integrated in the European political and economic space. In other words, a ‘virtuous circle’ will develop facilitating growth and integration, both economic and political. The maximum growth rate under this scenario is seven per cent, the minimum four per cent. Countries more likely to display the maximum growth rates are Hungary and Poland, countries displaying the minimum Bulgaria and Romania.
Even if this is the most optimistic of the four external scenarios, it at the same time is not impossible to achieve if one considers the historical trajectory of integration with reference to Ireland, Portugal, Spain and Greece, where difficulties of integration were overcome more easily than was feared initially.
The prerequisite for such a scenario would be that reforms are promptly implemented: liberalisation and market competition but also structural changes in production and adaptation of the institutional framework – legal, financial, and administrative.
High growth and fast integration under these conditions will lead to a significant increase of foreign trade: the CEEC are likely to have an average level of trade growth with Western Europe of 10% within a decade from the date of integration, a 20% average growth 15 years after integration to finally stabilise with a growth of around 10% per decade.
How soon will the CEEC converge with the EU countries? Under this scenario it is assumed that there will be a rapid structural adaptation, thanks to a strong economic growth which puts in place the basis for structural reform. Integration from 2005 onwards will produce a good economic foundation for the region and this will assure a fast convergence. Countries such as Slovenia and the Czech Republic will be part of the first wave of an enlarged Europe. This can be explained by a strong will to restructure on the one hand, and by the geographical proximity of Germany for the Czech Republic and Austria and the North of Italy for Slovenia.
It is clear that there will be differences among countries in terms of the time horizons. This could also stem from the fact that in some countries reforms might take more time to implement or resistances are stronger. Poland, Estonia

CODE-TEN FINAL REPORT 32
and Hungary can likewise be counted among the countries most likely to be integrated first. Under this scenario, Lithuania, Latvia, Slovakia and Croatia will follow and integration will be competed with Romania, Bulgaria, FYROM, Yugoslavia and Bosnia.
“European Dilution” (D). This scenario is characterised by high growth and slow integration. Under this scenario reforms will be successful and Europe becomes a free trade zone with extended co-operation agreements driven by market rules and competition as well as globalisation with a strong influence of new information technologies and multi-nationals.
The European Union as an entity with shared political and organisational structures however weakens, thus interventions for cohesion or structural changes are limited. Countries which are slower in implementing liberalisation will be slower in achieving a sustained growth rate. In other words, this scenario would correspond more to a situation where European organisation is not very different from that of other economic zones across the world.
Countries with stable trade exchanges and high levels of foreign investment will display a comparative advantage. Western Europe will be the main beneficiary under this scenario. The share of western European exports will grow by 15% on average fifteen years after integration.
Re-structuring policies will weaken in scope and will tend to follow adjustment rather than cohesion principles. Regional convergence will occur but be less extensive.
“European solidarity” (S). This scenario is characterised by low growth albeit fast integration. The accession process is slower, yet it definitely goes ahead despite comparatively low economic growth in Eastern Europe and conservative growth rates for Western Europe. In other words integration is driven by foreign policy and security considerations which at the same time point to the strengthening of the political dimension of the European Union.
Structural and cohesion funds become the main vehicle for integration – the volume of financial aid is similar to that transferred to former European peripheral countries or less developed regions. Sectoral policies (including European sectoral policies) become increasingly subjected to regional development considerations. The same applies to transport.
Countries will re-orient themselves on known markets (regional markets) and potentially strong markets (European markets), and this will be to the detriment of the world market. In this scenario, the structural funds of the EU finance the productive investments which generate an increase of trade between Western and Eastern Europe. European integration is thus confirmed as a national priority and this guides also the allocation of pre-accession funds.

CODE-TEN FINAL REPORT 33
Beginning 2005, the EU will reinforce efforts for integration. The effects of convergence resulting from different programmes will produce a certain spatial homogenisation despite slower growth rates.
“European Fragmentation” (F). This scenario is characterised by low growth and slow or no integration. It assumes likewise a long transition process but also limited support for the accession countries. This also means that Europe loses some of its substance for actual EU Member States.
Individual countries will tend to orient themselves towards regional markets. Regions neighbouring the European Union will have the most to gain. For the more remote countries, regional links would be reinforced: the Baltic zone, Black Sea, Eastern Europe, Eastern Mediterranean. Europe will thus be multi -polar with regional markets developing their own specifications.
Economic reforms continue to be implemented albeit at a slower rate, convergence is realised only in the long run. With the exception of Slovenia no country will attain the average European GDP.
Transport policy scenarios
The White Paper on the Future Development of the Common Transport Policy sets three main overarching goals for CTP, namely economic growth, cohesion and sustainability. Analytically it identifies the following policy areas as of particular relevance for promoting the above goals:
?? Development of the transport system (including external dimension); ?? Integration of the transport system; ?? Environmental protection and sustainability; ?? Safety; ?? Market access and structure; ?? Fair and efficient pricing; ?? Social dimension.
In turn the above policy areas can be formalised in more specific policy objectives each tied to measures of performance. Two main transport policy framework strategies can be outlined in relation to the three generic (i.e. not only transport specific) objectives of economic growth, cohesion and environmental sustainability and with refe rence to the afore-mentioned specific transport policy objectives.
?? The first transport policy framework scenario could be named ‘market regulation’. According to this emphasis will be placed on harmonisation and integration across EU countries as well as on liberalisation with regards the transport system as such. It is hypothesised (by the assumed policy owner)

CODE-TEN FINAL REPORT 34
that such a policy development will meet all three goals of economic growth, cohesion and environmental sustainability.
?? According to the second transport policy framework scenario, emphasis is placed on the operating systems, namely, interoperability and accessibility with public management for demand and supply. The overall goal under this scenario is to promote cohesion, i.e. emphasis is placed on the structural dimension.
Considering the emphasis or not of transport infrastructure investment in either of the two strategies, it is possible to arrive at four transport policy scenarios:
A) “Market approach with infrastructure investment”. This is characterised by an emphasis on liberalisation and deregulation and on increasing cross-border or international traffic. It also places an emphasis on infrastructure development. As it is a market approach, road pricing for external costs and restricting road traffic are given a lower emphasis. This scenario assumes that the market will decide on the kind of projects to be funded, whereby road takes priority.
B) “Management approach with infrastructure investment”. This scenario lays emphasis on the management of supply and demand hence also the emphasis on regulation or management rather than deregulation. Other goals are the promotion of intermodality and interoperability and the structural goals of increasing accessibility and promoting regional development. In frastructure development is still considered a means to achieve these goals. Under this policy scenario rail projects and/or multimodal solutions are favoured.
C) “Market approach with an emphasis on decoupling”. This scenario shares a number of features with (A) with a greater emphasis on deregulation. It however does not place such a strong emphasis on infrastructure development and considers this also as being guided by the market. Instead it is in favour of measures promoting interoperability.
D) “Management approach with emphasis on decoupling”. In this scenario emphasis is placed on decoupling with the specific objective of promoting environmental sustainability, hence the strategic importance assigned to the application of environmental regulation and the restriction of local traffic. Overcoming structural deficiencies, hence promoting regional development, is still thought of as important, however not at the expense of environmental damage (hence also the absence of accessibility as a significant goal).
These four policy scenarios can be used to describe most national transport policies within the EU and beyond. There is hardly any country which completely fits into any of the above ‘ideal’ type policy scenarios. Most countries

CODE-TEN FINAL REPORT 35
and the Common Transport Policy (CTP) are to be found ‘in between’ two ideal-type scenarios – at present typically transport policy scenarios (A) and (B). It is in fact this ‘in between’ locality which often explains the contradictions inherent in transport policies both at the strategic level and at the level of project implementation.
Most of the CEEC will follow the same three-fold strategy that is currently being followed in the Member States regarding the harmonisation of national transport policies and CTP. The three phases are: liberalisation, re-organisation and decentralisation.
The liberalisation phase includes the reorganisation of the road markets, including the change of legislation on market access – both domestic and international – transport price regulation, national competition rules, and the regulations on emissions and pollution. During this phase, national transport policies are more likely to approximate policy scenario (A) and in that tend to emphasise the following among transport policy goals: next to liberalisation and deregulation, increasing cross-border traffic, the development of pricing schemes for internal costs; the promotion of interoperability; and the application of the minimum standards of environmental legislation. Most of the EU countries have already completed this first phase of liberalisation. Liberalisation is also well advanced in most of the CEEC but it is unlikely to be completed prior to 2005 in Hungary, Czech Republic, Poland, Slovenia and Estonia and 2010 in the rest.
The second phase will primarily deal with the re-organisation of rail transport, in particular the separation of infrastructure from operations. This is still underway in the majority of EU Member States. Some of the CEEC have already embarked on the re-organisation of their railways, however this phase is not expected to be completed prior to 2010-2015. The countries entering into the re-organisation phase are likely to have national policies that approximate policy scenario (B) and lay greater emphasis on pricing for external costs, accessibility, intermodality, regional development and on policies that restrict local road traffic and reduce accidents.
The third phase of decentralisation concerns all economic sectors and all modes of transport. In general in most EU countries this phase is not completed as yet. As for the CEEC it has just begun. Whether complete decentralisation will succeed and what this will mean for the optimal balancing of transport policy objectives entailed in policy scenarios (A) and (B) remains unclear.

CODE-TEN FINAL REPORT 36
3.6 Infrastructure strategies
When establishing infrastructure strategies at the network level it is important to remember that even if the network transcends national boundaries, national interests continue to play a dominant role. The DECODE method for establishing infrastructure strategies bears this into account. It represents a simulation of the decision process at national level.
Infrastructure strategies at the network level are established in three consecutive steps:
1. The various projects under consideration in each country are first examined for their degree of policy performance or suitability: how congruent are they with national policy strategy and the national transport policy goals?
2. The second step is to establish for each project under cons ideration in each country the degree of its adaptability which in turn is defined by the likelihood of its implementation, in turn a function of the barriers it is likely to face.
3. The third step is to combine information on policy performance and adaptability to identify priority projects in each country and thereafter at the network level.
Suitability
The objective of the suitability test is to examine the extent to which a certain project or programme is in line with the national policy objectives in the field of transport from the point of view of the policy-owner.
The single and/or homogeneous policy-owner in any decision context is, of course, an abstract and analytical construction. For the purpose of the suitability test in DECODE, the policy-owner is defined as that set of actors which influences significantly the agenda setting in national transport policy, the point of reference being policy documents or key discourse texts.
The suitability test employed in DECODE follows the principles of the TENASSESS Policy Assessment Model PAM (Deliverable 4, TENASSESS, 1998). Each project is assessed against a comprehensive list of policy objectives which have been previously weighted to reflect the importance attached to each by the national policy-owner. The policy weights are assigned on the basis of expert interviews with relevant actors of the national transport policy community.

CODE-TEN FINAL REPORT 37
?? Apply environmental legislation: This policy objective refers to the CTP objective
of reducing the transport specific negative environmental impacts in order to meet
the environmental standards proposed by the European Commission and/or the Kyoto conference which a number of countries formally adopted, or at least to effect
an improvement in current trends.
?? Promote pricing schemes (w ith particular emphasis on road pricing) for the purpose of covering internal costs (maintenance, upgrading, increasing state budget
etc.)
?? Promote pricing schemes (with particular emphasis on road pricing) for the purpose of internalising external costs (costs related to congestion and negative
environmental impacts).
?? Promote intermodality, i.e. changing the existing modal split in favour of rail or waterways.
?? Promote interoperability relates to the goal of improving the interoperability of the
rail system to promote international services.
?? Promote accessibility of peripheral regions within the country
?? Promote regional development. This is a goal often considered in conjunction to
accessibility but in some cases also as a distinct goal in terms of regional planning (for instance decentralised centres or logistic terminals etc.)
?? Increase cross-border or international traffic (in relation to total traffic) which, in
turn, is an indicator for increasing harmonisation and the economic benefits accruing from transport.
?? Decrease local (or short-distance) road traffic. In many countries local road
traffic is what primarily accounts for the uneven modal split between road and rail but also for congestion. This policy goal is in many contexts considered additionally
w hen examining major transport infrastructure investments that primarily relate to
international traffic.
?? Reduce accidents. The promotion of safety is one of the most important policy
goals in the field of transport (with reference to both the reduction of fatalities and
that of injuries).
?? Liberalisation and Privatisation. This policy goal relates to measures for
ameliorating free access to the transport market (both with regards operation and
investment).
?? Deregulation as a policy goal refers to the gradual withdrawal of the state from the
management of major transport operations and of the transport sector more
generally. Deregulation need not go together with liberalisation. In fact in a number of countries which experimented with deregulation there are increasing calls for re-
regulation or controlled deregulation both of which assume a role of the state in the
transport sector, even if a revised one.

CODE-TEN FINAL REPORT 38
?? Infrastructure investment. An emphasis on infrastructure investment goes often in
line with the explicit policy goal to improve or enlarge the existing transport network
(road or rail) and in so doing to reduce the cost of travel to the user in terms of time.
The question to answer for each specific project is: Can the project as currently proposed (i.e. considering its technical specifications) and from the view of the policy-owner be thought to contribute to the fulfilment of policy goal X? If yes, the project is given an unweighted score of +5; if the answer is no the project is given an unweighted score of –5. If the policy objective X is not relevant for the project in question, the latter is given a score 0. It should here be noted that the scale applied to the valuation of projects at this stage and for the purpose of the suitability test is a nominal one, unlike in the full-fledged version of the TENASSESS PAM.
The scores are multiplied by the weight for each policy area to provide the score on that policy area. The total project score calculated by adding the individual weighted scores per policy objective and dividing by the sum of the weights represents how ‘suitable’ each major project along a corridor is with reference to the national transport policy.
The total corridor score calculated by adding the individual weighted scores of each project along the corridor by the possible maximum weighted score on that policy goal represents how ‘suitable’ the corridor programme (i.e. comprising all projects) is with reference to the national transport policy.
Adaptability
The still dominant paradigm in policy analysis – at least with reference to transport evaluation – relies on the technocratic utilitarian view which assumes that it is possible, through the use of the right tools, to measure needs, benefits and costs which, in turn, can provide the basis for achieving an optimal solution (Parsons, 1995, p.105). Sociology nevertheless teaches us that it is as important to understand the discourses within which problems are defined and debated and, ultimately, constructed (cf. also Ollivier-Trigalo and Rui, 1998, Deliverable 3, TENASSESS). In other words, if we work on the assumption of communicative rationality rather than rational choice, then we must recognise that the decision process is open with a number of actors having stakes and each with their own discourses.
The adaptability test builds on the logic underlying the TENASSESS Barrier Model (Deliverable 6, TENASSESS, 1998), in turn an application of the decision-tree approach in systems analysis (cf. Lasswell, 1960; Carley, 1980).
The objective of the adaptability test in the DECODE method is to identify barriers to the implementation of transport projects, thus to establish the degree of ‘adaptability’ of any particular project with regards outside pressures. Earlier

CODE-TEN FINAL REPORT 39
research has shown that there is a small set of such barriers in the practice of the implementation of transport policy: there are barriers relating to socio-economic assessment; environmental assessment; the division of competencies with particular reference to regional responsibilities; technical standard harmonisation and financial acceptability.
Analytically, the application of the adaptability test involves first, charting all the projects according to their phase of implementation (conceptual, planning, decision, implementation); and second, identifying for each whether any of the afore-mentioned types of barriers are being faced or are likely to occur in the near future.
Combination of suitability and adaptability scores at national level
High suitability scores indicate congruence with national transport policy objectives. High adaptability scores indicate many barriers to implementation.
?? Projects with a high suitability score and a low adaptability score are likely to be implemented without major delay and with no change in their design.
?? Projects with high suitability and adaptability scores are most likely to require a re-design, thus a delay in their implementation is very likely. Such projects, experience shows, are often ‘key’ projects in the sense that whether and how they are realised influences the network and the transport system more generally. Their ‘key’ character in part explains the many barriers or conflicts they face, i.e. their high adaptability scores.
?? Projects with low suitability and adaptability scores are difficult to judge regarding their chance or not of realisation. Given their ‘low’ national profile their low adaptability might simply indicate little national interest in them. Such projects often get funded in situations where other key projects as described above do not get through.
?? Projects with low suitability and high adaptability scores are the least likely to be implemented.
Network variants
The aggregation of the above information at the corridor level throws light on cross-border conditions and the consistency as such of the corridor programmes across different countries. For instance, if a corridor is planned as a multi-modal long-distance link, yet some countries favour road whilst others favour rail, then in an environment of financial insecurity this constitutes what we would call a negative boundary condition which can determine not only

CODE-TEN FINAL REPORT 40
whether the ‘corridor’ as such materialises but also the medium - and long-term effects of network development.
In DECODE we distinguish between five network variants for 2015:
- A do-nothing variant which foresees no new infrastructure is constructed;
- An ‘all road’ variant which assumes that only the road projects prioritised at the national level are realised;
- An ‘all rail’ which assumes that only the rail projects prioritised at the national level are realised;
- A ‘priority road’ variant which considers from among the road projects identified by the countries in question as fitting the corridor plans only those that are prioritised by the accession countries insofar as they are considered suitable from the national transport policy perspective;
- A ‘regional network’ variant which assumes that only those road and rail projects prioritised by the accession countries but which also meet positive boundary conditions are realised.
3.7 Corridor Development alternatives
The study area in DECODE is not the project but rather the so-called corridor development alternative which comprises three elements:
?? The network in five different variants for the year 2015 – to reiterate, the five different variants or infrastructure strategies are the ‘all road’, the ‘all rail’, the ‘priority road’, the ‘network’ and the ‘do-nothing’ solutions;
?? The socio-economic and integration scenarios – to reiterate, these are the ‘renaissance’, ‘dilution’, ‘solidarity’ a nd ‘fragmentation’ scenarios;
?? The policy scenarios – to reiterate, there are four policy scenarios: market approach with infrastructure investment; management approach with infrastructure investment; market approach with emphasis on decoupling; and management approach with emphasis on decoupling.
The network variants are specified in the CODE-TEN Transport Information Management System which includes the technical specifications of all network components, actual and for the year 2015. The socio-economic and integration scenarios are quantified in terms of GDP, employment, export, motorisation and population; the transport policy scenarios are quantified in terms of transport costs.

CODE-TEN FINAL REPORT 41
The specification of infrastructure strategies as outlined in the previous section is an example of a micro-level or bottom -up analysis. The specification of scenarios on the other hand follows a top-down approach. The interface between the two delineates the corridor development alternatives.
In theory it is possible to envisage all external scenarios under all possible policy scenarios and in turn for all infrastructure strategies. The number of possible permutations depends on the number of infrastructure strategies defined. For the five infrastructure strategies specified in DECODE, the number of possible permutations is
5 (infrastructure strategies) X 4 (external scenarios) X 4 (policy scenarios) = 80
Given that external developments are not independent from policy developments and also not from infrastructure strategies, it is possible to reduce the number of possible permutations down to a smaller number of more realistic options.
There is inevitably simplification involved in this approach which begins already with the definition of scenarios as categories or ‘ideal types’ rather than as continua. However this simplification is necessary to keep analytical categories separate.
Table 2 displays the (corridor) development alternatives selected for study in CODE-TEN and incorporated in the DECODE method.
Under the renaissance scenario, we look at all network variants – ‘all road’, ‘all rail’, ‘network approach’ and ‘priority road’ – set against the do-nothing variant:
?? ‘All road’ in a policy context favouring the market approach with emphasis on infrastructure investment (CDA1): This corridor development alternative describes a scenario of high growth and quick integration favouring liberalisation and deregulation, under which road projects are prioritised in view of the emphasis on public-private partnerships on the one hand and the national interests on the other and considering that the rail infrastructure already in place in the CEEC/CIS while not state-of-the-art is operative.
?? ‘All rail’ in a policy context favouring the transport management approach with emphasis on infrastructure investment (CDA2): The external conditions under this corridor development alternative are the same as for the previous one, i.e. high growth and quick integration. However, unlike in the previous case the policy trend is different. Instead of favouring a laissez faire approach, intermodality and interoperability are at the forefront. Whilst intermodality does not explicitly favour one mode over another, the

CODE-TEN FINAL REPORT 42
comparative weaker competitive position of the rail leads to its favouring in terms of infrastructure investment.
?? ‘Network solution’ in a policy context favouring transport management with emphasis on infrastructure investment (CDA3): This corridor development alternative is the same as the previous one insofar as external conditions are concerned: Europe experiences a period of high growth; enlargement proceeds at a fast pace. In terms of transport policy the emphasis is likewise on intermodality, however, in conjunction with network development. This leads the policy owner to prioritise those priority projects in rail or road which are characterised by positive boundary conditions and which promote inter-regional co-operation.
?? ‘Priority road’ in a policy context favouring the market approach with less emphasis on infrastructure investment (CDA 11): The external and policy conditions are here the same as for CDA1, but with more caution as to the volume of transport infrastructure investments. This could occur where transport would compete with other sectors for public investment.
?? ‘Do nothing’ in a policy context favouring the market approach but with no prioritisation of infrastructure investment (CDA4): This corridor development alternative presents the yardstick against which the impacts of all previous CDAs under the renaissance scenario are assessed.
Under all external scenarios we compare the ‘priority road’ and ‘network approach’ set against the do-nothing variants in each case. The relevant corridor development alternatives under the renaissance external scenario (CDA3, CDA11 and CDA4) were described above. Below we describe the remaining.
?? ‘Network solution’ under the dilution external scenario and in a policy context favouring the transport management approach with emphasis on infrastructure investment (CDA12): This scenario describes the situation where the enlargement process is slowed down (despite good economic data) but not abandoned. Assuming in addition that intermodality would guide transport policy developments, it could be envisaged that only those priority projects (rail and road) would be funded that are characterised by positive boundary conditions and are thought to promote inter-regional co-operation. In this way the greater Europe idea would remain alive.
?? ‘Road priority’ under the dilution external scenario and in a policy context favouring the market approach with emphasis on infrastructure investment (CDA5). Under this scenario the European project experiences serious barriers insofar as enlargement is concerned. Thus despite high growth, including in Central and Eastern Europe, integration only proceeds slowly. As a result the European Union loses in terms of authority and a common

CODE-TEN FINAL REPORT 43
transport policy is slower to materialise. Under this scenario the various accession countries would be more likely to follow their own priorities in terms of infrastructure investment, thus funding primarily road projects.
?? ‘Network solution’ under the solidarity scenario in a policy context favouring the transport management approach with emphasis on infrastructure investment (CDA7). The solidarity scenario for external developments assumes that despite the slowing down in terms of growth, enlargement proceeds at full pace in order to avoid further decline. This scenario for external development would be consistent with a transport policy that favours intermodality through networks. In terms of infrastructure strategy, this would lead to the financing of those priority projects (rail and road) that are characterised by positive boundary conditions and which would appear to promote inter-regional co-operation.
?? ‘Road priority’ under the solidarity scenario in a policy context favouring the market approach with emphasis on infrastructure investment (CDA13). This corridor development alternative describes the situation where enlargement proceeds despite low economic growth in both East and West and where transport policy is oriented towards road infrastructure investment since the latter is considered the fastest way to promote trade and subsequently economic growth. Insofar as the budgets are quite restricted due to the low economic growth, only the top priority road projects can be financed.
?? ‘Network solution’ under the fragmentation scenario in a policy context favouring the transport management approach and infrastructure investment (CDA14). This is the optimistic view of the fragmentation scenario. Despite low economic growth and the break-down of the integration process, inter-regional co-operation is not abandoned but rather promoted, partly through investment in cross-boundary priority projects (rail or road).
?? ‘Road priority’ under the fragmentation scenario in a policy context favouring laissez -faire and minimum investments (CDA9). Under the fragmentation scenario the European project of integration is practically arrested. Slow growth in both the East and West, coupled with political unrest in various countries and growing opposition to the centre leads to the abandonment of enlargement plans and to a serious crisis of the Union as it now stands. Under these conditions, national priorities would tend to take the upper hand, leading in the majority of the accession countries to a road only infrastructure strategy. The lack of funds would however limit the number of projects funded.
?? The ‘do-nothing’ corridor development alternatives under the different external scenarios correspond to CDA6, CDA8 and CDA10.

CODE-TEN FINAL REPORT 44
Table 2. Corridor Development Alternatives in DECODE
Strategy Policy Scenario Renaissance Dilution Solidarity Fragmentation
All road TPSA CDA 1
All rail TPSB CDA 2
Network TPS B CDA 3 CDA 12 CDA 7 CDA 14
Road priority TPSA CDA 11 CDA 5 CDA 13 CDA 9
Do-nothing TPSC CDA 4 CDA 6 CDA 8 CDA 10

CODE-TEN FINAL REPORT 45
3.8 Impact assessment
Traffic flows
The first step of impact assessment is to make traffic flow estimations and assignments for each (corridor) development alternative filtered through the previous step. In DECODE traffic flows were estimated for freight – the freight traffic flow estimations were then used to estimate total traffic volumes, i.e. including passenger transport.
The calculation and assignment of traffic flows used the forecasts on population, GDP, employment at national and regional level, as well as those on car ownership at national level under each of the four external scenarios; as well as the forecasted transport costs under different policy scenarios. Traffic assignments were made for the five network variants described in the previous section, i.e. the ‘do-nothing’, ‘all road’, ‘all rail’, ‘priority road’, and ‘network’ solutions. The base year network included the links at their present state (including those with termination date 1999).
In the following pages we outline the input data used and main assumptions made for the estimation of traffic flows. These are described in more detail in the PLANCO report on the CODE-TEN TIMS which forms part of this Final Report as a separate document. The reader is also referred to Volume II of this report for the relevant tabulations.
Freight classification. Five classes of goods were distinguished according to their affinity to time: high value goods; medium value goods; solid low value goods; liquid low value goods and other goods. The classification was based on the SITC Rev. 2 commodity group listings. The high value goods were assumed to be transported mostly in containers, low value goods as solid or liquid bulk, medium value goods and other goods as general cargo.
Trade OD Matrix. Freight transport demand was derived from international and domestic trade. The first step to construct the trade OD matrix covers the international trade. The matrix consists of 31 rows and columns, 28 of them representing countries, the remaining three rows/columns are used for overseas port zones: Port Zone 1 covers North America; Port Zone 2 Central and South America; and Port Zone 3 Asia and Oceania.
The values in the OD matrix are taken from the OECD international trade database. For an OD pair with OECD reporting countries on both sides, the value reported by the importing country was used. In OD pairs with only one OECD reporting country, both import and export values were used. OD pairs for

CODE-TEN FINAL REPORT 46
which no information was provided from either partner country were omitted. The OECD reporting countries covered by the TIMS are: Austria, Belgium-Luxembourg, Denmark, France, Germany, Greece, Finland, Ireland, Italy, Netherlands, Portugal, Spain, Sweden, Great Britain, Norway, Switzerland, Poland, Czech Republic, and Hungary. The remaining countries (non-reporters) are: Russian Federation, Estonia, Latvia, Lithuania, Slovakia, Romania, Bulgaria, Slovenia, and other former Yugoslavia.
In order to facilitate further calculation, the following country groups were formed:
?? The first group consists of the EU countries plus those countries for which similar growth is expected, i.e. Norway and Switzerland.
?? The second group consists of the Czech Republic, Estonia, Hungary, Poland and Slovenia as well as Bulgaria, Latvia, Lithuania, Romania, and Slovakia.
?? Albania, Belarus, Moldova, Russian Federation, Ukraine, and the republics of the former Yugoslavia form the third group.
Regional subdivision of foreign trade. In order to subdivide foreign trade to regions, regional weighting factors were applied. To obtain these factors, a regression analysis was carried out. This analysis provides a formula based on the socio-economic indicators GDP, employment, and population.
The 1993 total transport volumes for 85 German regions were compared with the socio-economic data per region. For each of the above mentioned commodity classes, optimal factors for the following equations were calculated:
Pi,c = fpPop,c*Popi+fpEma,c*Ema,i+fpEmi,c*Em i,i+fpEms,c*Ems,i+fpGDP,c*GDPi
Ai,c = faPop,c*Popi+fpEma,c*Ema,i+faEmi,c*Em i,i+faEms,c*Ems,i+faGDP,c*GDPi
where
Pi,c total production in region i, class c Ai,c total attraction in region i, class c Popi population in region i Ema,i employment in region i, agricultural sector Em i,i employment in region i, industrial sector Ems,i employment in region i, services sector GDP i Gross domestic product in region i fpPop,c factor to be applied to population (for production, class c) fpEma,c factor to be applied to employment agriculture (for production, class c) fpEmi,c factor to be applied to employment industry (for production, class c) fpEms,c factor to be applied to employment services (for production, class c) fpGDP,c factor to be applied to GDP (for production, class c) faPop,c factor to be applied to population (for attraction, class c) faEma,c factor to be applied to employment agriculture (for attraction, class c) faEmi,c factor to be applied to employment industry (for attraction, class c) faEms,c factor to be applied to employment services (for attraction, class c)

CODE-TEN FINAL REPORT 47
faGDP,c factor to be applied to GDP (for attraction, class c)
For liquid bulk only certain regions were allowed to ‘produce’ goods. The relative shares of the total production/attraction of the origin and destination factors where then used to regionalize the OD matrix.
Domestic trade. The domestic trade was calculated as the difference between total trade and international trade. The total trade per region was calculated by applying the formula described in the previous section for the socio-economic data. The domestic trade from and to a region was estimated as the difference between the total trade and the international trade. The regional subdivision uses the same procedure as applied for the international trade. In addition, a gravity model was used.
The domestic trade flows are estimated in the form of an OD matrix using factors proportional to the combination of the share of the production, the share of the attraction as well as the distance between origin and destination. The trade OD matrix is iteratively corrected with respect to the fixed row and column totals.
Foreign trade forecast. The foreign trade forecast was done by applying growth factors to the 1995 OD matrix estimated on the basis of the socio-economic scenarios. The OD matrix was then balanced in an iterative manner to take into account all the provided information. OD pairs with one partner being a CEEC country for which information was missing were obtained as a result of the iterative process.
Cost data. Cost data for 1995 were available for EU countries. These were split into fixed and variable costs. For the EU, average cost data were calculated. In order to calculate cost data for non-EU countries, mode specific cost factors for the base year were applied. For estimating the cost development between 1995 and 2015 the growth rates as provided by the external scenarios were applied to the 1995 cost data.
The inter-modal transport network. In order to be used with the inter modal traffic assignment tool, the TIMS network had to be slightly modified. These modifications included: the adding of port zones for overseas shipping; additional intermodal changes; the adding of sea links; changing the link classification (unique abbreviations); assumptions on the link capacities; and assumptions on the commodity traffic free flow speed.
The number of inter modal changes had to be increased by allowing mode changes. A total of 926 inter modal links were added: 348 road-rail; 279 road-inland; and 243 rail-inland.
In order to allow for transport from and to overseas regions, so-called port zones were added: one for North America; one for Central and South America;

CODE-TEN FINAL REPORT 48
and one for Asia and Oceania. These port zones were connected to various ports. In turn these ports were connected by a series of short-sea shipping links.
For road links, capacity was estimated on the basis of the average annual daily traffic (AADT). Thus for 1A roads with 3 or more lanes per direction the average daily traffic capacity was estimated at 130,000 vehicles; for 1A roads with 2 lanes per direction, at 100,000 vehicles; for 1B roads with 2 or more lanes per direction, at 90,000 vehicles; for 1B roads with 1 lane per direction at 70,000 vehicles; for IL roads at 60,000 vehicles and for 1S roads at 45,000 vehicles.
For the road mode, the total capacity is for both commodity and passenger traffic. Thus a certain amount of the maximum AADT is assumed to be used for passenger traffic. The rest of the capacity, multiplied by the working days per year and an average load of 13.6 tons per truck, is available for the commodity traffic. These capacities include the total freight traffic except for short haulage freight transports ( max. distance 50 KM per direction).
For rail links, the capacity per train is assumed to be 200000 tons/train on average (average load of 600 tons per train, 280 operating days per year, and an additional capacity reserve of 18 percent, that can be activated on demand). This information combined with the number of trains was used to estimate the annual commodity traffic capacity.
On inland waterways of river type, no capacity constraints were assumed. On channels and regulated rivers, the capacity is a function of the maximum draught and is determined by the capacity of the locks. On intermodal links, zone connectors and sea links no capacity constraints were used.
Commodity traffic free flow speed. The average free flow speeds for commodity traffic ranges from 50 km/h in 1S roads to 90 km/h in 1A roads with 2 or more lanes per direction.
Traffic assignments
Traffic assignments were undertaken for each corridor development alternative to estimate freight transport flows per link. For each development alternative, the inter modal network was established anew using the respective transport cost and the respective interregional trade flows.
The assignment tool used performs simultaneous mode and route choice using the User Equilibrium (UE) method. Apart from assigning trade flows, the assignment tool provides the following link-specific input parameters: the cost for transporting a ton of freight, the maximum capacity; existing capacity utilisation; and function parameters for a delay function.

CODE-TEN FINAL REPORT 49
The trade flows are assigned in the following order: first solid bulk (low value goods, solid); second, liquid bulk (low value goods, liquid); third, general cargo (medium value goods and other goods); and last, containerised cargo (high value goods). The reason for this assignment sequence is the different affinity of the commodity classes to time: containerised goods are the most time-sensitive goods, whereas low value goods are the least sensitive to time changes.
As the capacity is expressed as capacity left for freight traffic, the capacity utilisation for the first step (before the first freight ton is assigned) is always zero. In subsequent steps, the total volumes assigned during the previous steps are used to describe the existing capacity utilisation.
In order to reflect congestion in the network, a capacity utilisation factor f is applied to the cost per link; the formula used in the assignment tool uses two parameters, ? and b as follows:
f = 1+ a ? (volume/capacity) b
where a and b vary according to mode.
Typology of impacts and target areas
What impacts are to be estimated depends on the geographical level of coverage and objective of the analysis. The DECODE method does not categorically specify the impacts that should be calculated, but has impact assessment as an integral part of the methodology for strategic policy assessment.
For the purpose of strategic assessment, indirect long-term effects are of particular relevance. In other words, strategic assessment prioritises the measurement of strategic environmental and accessibility impacts next to direct impacts.
Table 3 displays the performance indicators used for the impacts under consideration in DECODE.

CODE-TEN FINAL REPORT 50
Table 3. Performance Indicators in DECODE
Category Impacts Indicator(s) Spatial Disaggn Investment Cost Total investment cost of do-something CDA relative to the do-nothing scenario,
millions of euro, 1995 prices and values Country
VOC Savings Change in total resource VOCs on the network, for freight, in the CDA relative to the do-nothing scenario – cons iders time savings for freight only millions of euro, 1995 prices and values
EU, CEEC I/II/III
Direct
Safety Change in fatalities on the network in the CDA relative to the do-nothing scenario, fatalities per annum
Country
Noise Change in a single proxy score for total noise, across exposed areas, across modes km2 under 55dB(A)
Country
Local Air Pollution Change in area influenced by high CO concentration Km2 under 8 mg/m3 (8 hour average)
Country
Regional Air Pollution
Change in NOx emitted, unweighted tonnes per annum
Country
Environmental
Global Air Pollution
Change in CO2 emitted, unweighted tonnes per annum
Country
Land Take Financial cost of land take should be included in Investment Costs. Additional external social cost over and above noise and air pollution (ie. severance; visual intrusion; etc) proxied very roughly by Land Take. Km2
Country Indirect
Accessibility (Economic)
Change in GDP within 12, 28, 44hrs travel time %
Country
Accessibility (Demographic)
Change in population within 4, 9, 12hrs travel time %
Country

CODE-TEN FINAL REPORT 51
3.9 Assessment Methods
Economic assessment
The objective of the economic assessment is to calculate the direct transport impacts of the various corridor development alternatives. These impacts are measured as time savings for freight transport and as costs savings with reference to vehicle operating costs.
Time savings
For the purpose of identifying and assessing time dependent direct transport impacts the following approach was used:
?? Variations in transport services in terms of time savings were measured on the basis of information available on the network’s standard and capacity;
?? The estimation of time savings was subsequently based on the traffic assignments and forecasted modal distribution for the year 2015, and included delay parameters;
?? Associated variations in the value of time for freight were estimated only for the short term, i.e. on the basis of the variation in working capital.
The time savings and the tonnes carried on each corridor development alternative were calculated on the basis of the traffic assignments. The latter were used to estimate the total amount of time (hours per year) spent by different types of commodities before and after completion of alternative investment schemes on road and rail networks . The order of magnitude of variations in transport time was estimated on the basis of the free flow speed associated with each link and taking into account variations in average time as a function of the level of traffic.
The following assumptions were made:
?? For road links the average time was adjusted by calculating a simplified capacity constraint function to take into account congestion phenomena.

CODE-TEN FINAL REPORT 52
Cost factor as function of capacity use
0
2
4
6
8
10
0 0.1 0.2 0.3 0.4 0.5 0.6 0.7 0.8 0.9 1 1.1 1.2 1.3 1.4 1.5
volume/capacity
cost factor
Road+IWW Rail Others
?? To avoid indeterminate results, rail capacity cost factors were mitigated by means of introducing an upper limit of 4.
?? The total time (tonnes hours) was estimated by multiplying the average time spent on each link by the traffic volume per transport mode and type of goods.
?? Transported goods represent national and international trade at a ratio of 36 to 64 per cent. Trade with the accession countries (to and/or from) represents 10 per cent of the total traffic volume.
The value of time savings for freight were calculated for different type of goods, namely for liquid bulk (chemicals), solid bulk (coal and non-perishable agricultural products), general cargo (machinery, semi-finished manufactured goods), and unitised freight.
Variations in working capital as a result of shorter transport times can be considered a bottom rock indicator relative to the value that manufactures may appoint to better/faster transport as a pre-condition to reorganise production and customer servicing. The opportunity costs of any hour saved or spent was estimated by charging an interest rate of 5% on the value of each tonne in a given commodity group.
Vehicle operating costs
The time depending variations in vehicle operating costs were estimated in terms of the productivity of drivers and fleet for both road haulage and rail transport. The value of time of transported goods was estimated in terms of

CODE-TEN FINAL REPORT 53
variations in working capital for different categories of freight. Prior to this, yearly number of traffic units had to be estimated.
Yearly number of traffic units. The international traffic estimated by the traffic assignment model and expressed in tonnes was converted into yearly numbers of traffic units in vehicles per type of freight and per transport mode. The following additional assumptions had to be made in this connection: first, for road haulage the occupancy rates of vehicles was fixed at 13,6 tonnes per lorry; second, occupancy rates in trains were estimated as 60 per cent of the train capacity estimated at 600 tonnes per train.
Below we describe the basis of assessment of input variables for the estimation of road vehicle operating costs:
Productivity in road haulage. The basis to estimate parameters for productivity of road haulage was made available from an in-depth analysis to benchmark performances of a sample of 316 companies in five countries in the EU in the years immediately following the deregulation of road haulage (Kearney, 1989 on behalf of CONFETRA, the association of main road hauliers in Italy). The report prepared by NEA on behalf of DGXV - Effectiveness of measures to complete the internal market: Road Freight transport (NEA, 1996) was used to check the above parameters and to take 1987 - 1995 variations in productivity and costs into account.
Alignment in productivity/organisational practices of eastern and western companies was assumed to take place as a result of the adoption of EU regulation for driving hours. Convergence in productivity was further assumed to produce a gradual alignment of wages up to the 1996 level in the EU.
Drivers’ productivity in road transport. Average working hours for the year 2015 were based on the Commission’s proposal to limit drivers’ working hours to a maximum of 60 hours per week or an average of 48 hours per week estimated anew every four months. It was thus estimated that the average driving hours per year per driver would amount to 2,200.
The regional matrix used in the traffic model to forecast traffic in the year 2015 was used to estimate the composition of national and international traffic in order to broadly take into account different lengths of haul, and therefore driving conditions. For national transport the driver/lorry ratio was assumed to be 1, for international transport 1,5. As a result, the average number of drivers per vehicle was assumed as equal to 1,3.
Wages. An average annual salary of 23.000 EURO in 1996 was used, net of social charges and fiscal charges/compensations. The social charges were assumed to be the main reason behind differences in unit labour costs in different European countries (cf. Kearney, 1989). The salary was calculated on
CODE-TEN FINAL REPORT 54
the basis of the average of three main road haulage industries in the EU - Germany, France and Holland. (Kearney, op. cit. adjusted with NEA, 1996). This remuneration was considered a reasonable threshold also for self-employed drivers.
Costs of lorries. On the basis of commercial sources, the purchasing costs (at 1996 prices) for lorries were estimated at 75000 EURO for a truck, and 23000 EURO for a semi-trailer. Technical life was assumed to be 6 and 10 years respectively.
Time related variations in numbers of drivers and fleet. Given the traffic associated to each corridor development alternative in the year 2015, variations in the required number of drivers was estimated as a function of average speed (km/hour) other things being equal in the number of driving hours (2.200 per year). The corresponding number of lorries was estimated under the assumed drivers/lorry ratio of 1.3
Variation in costs. For capital costs, annual depreciation costs were accounted for on the basis a technical life of 6 and 10 years for tucks and semi-tailers respectively. In order to estimate time related cost variations as distinct from faster depreciation incurred because of increased annual mileage, the yearly amortisation rate of a truck was calculated on ½ of the purchasing cost.
With regards the estimation of rail vehicle operating costs, the assessment of input variables was as follows:
Rail productivity. For the estimation of the productivity of railways the main source was the report European Railways Performances Indicators - A Benchmarking Test prepared by Deloitte & Touch Consulting for DG Transport (D&T, 1997). Purchasing costs of rolling stock were taken from Orders of Magnitude of Costs in the Railways Sector (Ecole Polytechnique Fédérale de Lausanne, EPF, 1996). The Rail Performance Database of the World Bank Survey, published in the 1999 Rail Business Report (Railway Gazette International), was also taken into account.
An increase in productivity was assumed to follow as a result of the increase of the competitive advantage of rail over geographically broader markets. This also considered the suppression of custom controls at border crossings by the year 2015 as well as the removal of the requirements to change crew and locomotives at the borders. In the absence of past experiences on the efficient operation of rail freight undertakings at pan-European scale, these assumptions were implemented using plain technical functions linking variations in productivity of rolling stock to variations in average speed. The estimated increase in productivity is quite substantial relative to the present performances of major national rail companies in the EU, however it is close to that reported in

CODE-TEN FINAL REPORT 55
1996 by the most efficient among them, namely SJ of Sweden. Productivity and wages of train drivers were selected accordingly.
Type and cost of rolling cost. 3.930.000 EURO was considered an indicative order of magnitude for the purchasing price in 1995/96 of an electric locomotive in the range from 4, 5 to 6 MW (EFT, 1996). 98230 EURO was considered the indicative price for a European UIC standard bogie wagon (or similar including equipment for combined transport) of a maximum axe load of 20 or 22,5 tonnes (EFT, 1996). Consistently with average capacity in the BTM (600 tonnes per train) a train is made of one locomotive and 21 wagons.
Technical life of rolling stock. With reference to a technical life of 4.200.000 km, technical functions are displayed below that link variations in performances of an electric locomotive as a function of average speed.
Km Hours Years
21 100.000 202.000 42 25 120.000 168.000 35 29 140.000 144.000 30 33 160.000 125.000 26 42 200.000 100.000 21
For wagons, a flat duration of technical life was assumed up to 35 years. For both locomotives and wagons, a 90% ratio of the number of units available to the traffic departments were assumed to remain in good condition (EFT, 1996).
Number and cost of rolling stock. The number of locomotives needed under each corridor development alternative were estimated by dividing the corresponding amount of train km per average speed (km per hour) and multiplying per 1,1 to take into account their actual availability. Corresponding wagons were estimated in a standard train formation: 1 locomotive and 21 wagons. The depreciation costs of locomotives were estimated by dividing the purchasing cost by the number of years in technical life corresponding to the average speed of freight trains.
Train drivers. The value assumed for crew productivity (train km/drivers) is 1500 driving hours per year. At 26 km/hour this corresponds to forty thousand km per year. This value is close to what was reported to UIC in 1996 by SJ Sweden for all trains (freight and passengers) net of shunting units and marshalling drivers. In the same year, the respective ratio in Italy (FS) was fifteen thousand; and between twenty-five and thirty thousand in Spain (RENFE), France (SNCF) and Britain (BR). In the absence of separate information for passenger and freight trains, the higher productivity of SJ was largely explained with a significantly higher proportion (40%) of freight train km over total train km (D&T, 1996).

CODE-TEN FINAL REPORT 56
The number of drivers necessary to operate the number of freight trains estimated for each corridor development alternative were calculated on the basis of a crew made of two drivers and one escort per train.
An average net salary of 30000 EURO per year was assumed as indicative of the range analysed by D&T (1996) for all employees at different national railways: 37000 Euro at SNCF, 35.000 at FS; 32000 at SJ and 28000 at both BR and RENFE.
Environment
Network development has a direct and indirect effect on the environment. The indicators used differ depending on the dimension under measurement. In strategic assessment the emphasis is placed on measuring the spatial distribution of environmental impacts.
The environmental impacts of corridor developments are dispersed and varied. This makes their intensity or perceived cost/benefit different at different geographic locations. The spatial domain over which the impact can occur can lead to different conclusions. Local level analysis will focus on a pre-defined buffer zone along the network. The impacts on communities and natural resources within this buffer area will be calculated and quantified according to local geographic and demographic characteristics. Certain impacts affect people or groups within and outside the local area but they cannot be realistically apportioned to different areas. Acid rain and biodiversity are examples of such impacts which should be quantified at the national level. Finally, impacts such as carbon dioxide, acidification and biodiversity may be felt globally or across national boundaries. They may be experienced at the local level as well, but severity at the local level may be insignificant compared to the severity at the global level. Accordingly they should be quantified at the international level.
Minimum data requirements are transport volumes and trip/link lengths (vehicle mileage) by modes, average speed by modes, vehicle type distribution and type of energy used.
Climate change can also be assessed with reference to the expected levels for CO2 emissions. If the amount of travel by each mode is known, emissions from each mode can be evaluated by simply multiplying the total-vehicle km by mode specific emission factors and aggregating the emissions together. This can be compared with the threshold value based on the assumption that emissions are spread over time and space. The unit used is tons/year.
Acidification can be estimated in terms of gross changes of NOx emissions resulting from corridor developments. Thus one indicator is considered sufficient

CODE-TEN FINAL REPORT 57
for representing all contributing factors, i.e. emissions of sulphur oxide, nitrogen oxide emissions and emissions caused by the production and distribution of fuels or energy. The unit used is tons/year.
Estimating air quality impacts has to be undertaken at three levels: at first, the emissions generated by development projects have to be estimated; then the resulting concentrations of pollution have to be estimated; finally it is necessary to compare the pollution to ambient air quality standards. The principal air pollutants at the local level are SOx, NOx, VOC, CO, particulates and Pb. CO was chosen to represent all these pollutants as a substitute value.
Noise assessment is made by using uniform noise limits and corrections for all countries. Area (km2) under 55 dB(A) Leq noise is considered as an indicator of this impact. Thus, a zone alongside a road or railway axis is specified, where noise limits are exceeded.
Due to the large scale of the assessment, all impacts included in environmental assessment manuals could not be covered.1 For the assessment of the corridor development alternatives we focused on the following indicators:
?? CO2 and Nox emissions (tons/year)
?? Noise (area under 55 dbA) and land take for road and railway links
?? CO emissions (area with CO concentration over threshold) for road links.
The impacts on nature and biodiversity were not assessed due to the limited availability of data.
Noise distribution and CO concentration are evaluated at the local level, but the area of influence is aggregated to the NUTS II or equivalent regions as represented in the CODE-TEN TIMS.
As the transport model used for the estimation of traffic flows and their assignment did not provide all the relevant details, the following general assumptions had to be made:
?? Changes of freight transport volumes are proportional to changes of total transport volumes;
?? The renewal rate of vehicle fleet should be different under different scenarios, but under our study a blanket assumption was used;
1 For a more detailed overview of strategic environmental assessment, see VTT (1999), The Spatial Distribution of Environmental Impacts (CODE-TEN, Deliverable 6).

CODE-TEN FINAL REPORT 58
?? Shares of diesel, electric and high speed trains are unknown, therefore the same split was used on similar links
The most significant ‘educated guesses’ are reported below. Local traffic and airborne transport data were not available, and it was not possible to evaluate the impacts of waterborne transport with the existing data set. The biggest shortcoming was the fact that there was no data available on passenger transport and that this had to be imputed on the basis of the estimated freight flows (see also discussion on accessibility).
1. The distribution between cars, buses and trucks was thought to be the following: 85% of traffic on all the links consists of cars, 2% of buses and 13% of trucks.
2. The average load weight of a truck is 13,6 t – this was used to calculate the yearly number of trucks and subsequently the numbers of cars and busses.
3. There are 256 ‘active’ freight flow days in a year
4. The distribution of different emission classes (ECE vehicles, CEEC/CIS-vehicles, and future low emission vehicles) will vary between the scenarios. In the forecasted situation the shares were thought to be the following:
EU-countries CEEC/CIS (+Norway, Switzerland):
Cars and vans: 70 % ECE 60 % ECE 30 % low emission 15 % low emission
Buses: 65 % ECE 80 % ECE 35 % low emission 10 % low emission Trucks, no trailer: 70 % ECE 75 % ECE 30 % low emission 25 % low emission Trucks, trailer: 60 % ECE 75% ECE 40 % low emission 25 % low emission
5. The distribution of fuel and diesel powered vehicles in all the links was thought to be the following: 15 % cars, 90 % busses and 60 % trucks run with diesel
6. In the EU area all busses and trucks were treated as diesel powered
7. The risks of road traffic are based on the figures of today;
8. The traffic flow of the eight busiest hours is 52 % of the total traffic per day on all the links.

CODE-TEN FINAL REPORT 59
For the estimation of impacts, the Strategic Environmental and Safety Assessment Model SESAM was used. SESAM screens through all relevant aspects of environmental assessment and groups impacts by spatial levels (global/regional/local) and by incidence groups (global/community/natural resources) in order to provide a system atic overview. The impacts are presented as quantities or descriptions and, where possible, compared to relevant environmental threshold or objectives. SESAM is an open-ended framework for comparing rough impact information with strategic environmental objectives.
Safety
The methodology used for estimating safety impacts is based on the single risk method. This method is based on one risk/vehicle type. The variables between each mode are exposure variables (passenger kms or tonne kms, vehicle kms, passenger/vehicle or tonne/vehicle ratios) and risk variables. The unit of measurement is fatalities per year. For the assessment of the corridor development alternatives this indicator was measured for all modes except air.
With reference to traffic flows and their assignments, the same assumptions were made as for environmental impact assessment (see previous section). For the purpose of quantification of impacts the SESAM model was likewise used as this was developed both for environmental and safety impacts.
Accessibility
Accessibility determines the locational advantage of a region relative to all the other regions and therefore translates into a major factor for social and economic development. Accessibility in its most simplified form implies that regions with better access to locations of input materials and markets will, ceteris paribus, be more productive, more competitive and hence more successful than more remote and isolated regions (c.f. Linneker, 1997).
Accessibility indicators can be defined both with reference to regional transport infrastructure and with reference to infrastructure outside, albeit affecting, the region in question. A complex accessibility indicator takes into account the connectivity of transport networks by distinguishing between the network itself, i.e. its nodes and links and the activities or opportunities that can be reached by it. Accessibility could consist of two functions, one representing the activities or opportunities to be reached and one representing the effort, time, dis tance or cost needed to reach them.

CODE-TEN FINAL REPORT 60
Accessibility can be measured by either a micro- or a macro-level of analysis. A micro-level analysis focuses on relatively small economic areas, such as cities or regions and tries to associate transport infrastructure development with changes in local economic indicators such as regional employment and output. It focuses mainly on the reaction of economic units, like firms and households located in a given region, to specific transport infrastructure investments. A macro-level analysis, on the other hand, focuses on the effect of capital stock level on the output and factor productivity of the entire economy. Micro-level analysis is more suitable for the assessment of network impacts.
It is important to distinguish betw een accessibility gains or losses related to individuals and accessibility gains or losses related to firms. We use the term demographic accessibility to refer to the former type of impacts; and the term economic accessibility to refer to the latter. In both cases it is important to determine a time threshold against which changes will be measured.
Demographic accessibility describes the degree of peripherality of any particular region measured in terms of the number of people or population that can be reached within a specified time limit; economic accessibility measures the potential economic gains through the reduction in transport costs with reference to imports and exports. Whilst demographic accessibility applies to passenger transport, economic accessibility is a useful indicator for freight transport. Together they can represent transformations that changes in transportation endowments induce.
Both indicators express the number of ‘partners’ that can be reached (from each basis region) in a pre-specified travel time threshold associated with the 24-hour cycle of human activity.
For demographic accessibility the population (inhabitants) living in each region within reach is used as the weight of each partner region, whereas for economical accessibility the gross domestic product (expressed in monetary units) is used instead.
??
?Nj
jkD PTQ
,1)( , if ti,j ? Ti,j ? ? ?
??
Njjk
E GDPTQ,1
, if ti,j ? Tk
where:
QTk is the indicator of demographic and economic accessibility, respectively; Tk is the pre-specified travel time threshold; i is the basis region; j are the destinations reached; ti,j is the travel time; Pj is the total existing population of destination j. GDP j is the gross domestic product of target destinations j.

CODE-TEN FINAL REPORT 61
The accessibility indicators were estimated for the whole of Europe and at the regional level of disaggregation. The data included in the CODE-TEN TIMS was used. However considering the differing data quality across countries, a series of imputations or estimations had to be undertaken. The following should be noted:2
1. Cities instead of NUTS II regions were chosen as origin and end destinations in terms of accessibility indicators; subsequently, it was assumed that first, the majority of the population of each region is located in the cities; and second, that the amount of population outside the cities is spread over the countryside as a ‘blanket’ of uniform density within that NUTS II region.
2. Various travel time thresholds (in the range of 4 to 12 hours for passengers and in the range of 12 to 44 for freight) were considered for different type of journeys (1 to 3 day trips). For passengers a minimum of 3 useful hours at the destination for one day journeys was considered and of 4 to 5 hours for 2 day journeys. For freight, the maximum number of driving hours (9 hours per day) was used for the road, whereas the full 24 hours were used for the rail, discounting time losses for loading and unloading, as well as for intermediate stoppages at high traffic junctions.
3. Estimations on the speed of travel in road transport were made on the basis of available information on speed limitations for private cars on the network links. These estimations used speed-flow curves which consider speed degradation as flows and/or capacity decreases. For freight transport, i.e. the estimation of the real speeds of light and heavy good vehicles a ‘decay function’ concerning average slope and road type were additionally considered.
4. The estimation of speed of travel on rail was based on the available information on speed limitations (for passenger and commodity trains respectively) and made use likewise of a ‘decay function’ derived from the relation between the number of trains actually running and the number of passengers (or freight carried) per train.
5. For the estimation of real speed, traffic volumes at the base year and the year 2015 were additionally used. These had to be corrected in two ways:
a) first, total traffic volumes had to be derived for the base year to account for passenger transport – this was done by calculating the growth factor
2 For a more detailed overview of the theory in the measurement of accessibility and the existing literature on the subject, see CESUR (1999), Spatial and socio-economic impacts (CODE-TEN, Deliverable 5).

CODE-TEN FINAL REPORT 62
of freight between the base year and 2015 (for each corridor development alternative) and applying this to estimate total traffic volumes in the base years;
b) second, for about 5 per cent of all network links no traffic volume was available (i.e. also not freight flows) – for these cases traffic volumes were estimated with reference to the region of the link: for each road network link without direct estimates of freight flows in the base year and for 2015 the growth factor for the region to which the link belonged (systematised in octants) was used as proxy.
6. In order to minimise inconsistencies deriving from incomplete data sets, upper and lower bounds on changes in speed and by default also on traffic volumes were imposed. On the upper bound, it was assumed that if traffic volume were to grow very strongly (for instance, by 400%), the very low speed resulting from application of the speed-flow curves would not be realistic, since drivers would divert to other roads and apply pressure on governments to increase speed on that link or build another road. Therefore, speed deterioration from trade flow growth had to be limited. On the lower bound, it was assumed that since a large part of the traffic is local and intra-regional, it would not be heavily affected by reductions of interregional trade flows, therefore speed gains had likewise to be limited.
Different values of the upper bound for traffic growth were defined for the various corridor development alternatives, depending on their underlying assumptions of policy and economic evolution. For the lower bound a uniform value of 65% of base-year traffic volume was adopted. For the upper bound the values differed by corridor development alternative: under the scenarios of higher investm ent in road infrastructure a lower risk of speed deterioration could be derived and thus a lower value for the upper bound of trade flow growth could be set.
7. Accessibility indices for different corridor development alternatives for the reference year 2015 were corrected to control for different levels of actual interaction albeit with identical accessibility indices at the base year. Given the non-availability of inter-regional OD matrices, the ‘mass’ of each (target) city composed by its total traffic volumes was used instead.
8. Finally, once accessibility indices were calculated, extreme values which could be clearly attributed to the incompleteness of the data set were removed from the ‘valid’ set subjected to the calculation of statistical indices.

CODE-TEN FINAL REPORT 63
3.10 Aggregation of impacts
Impacts can be aggregated at the European level, corridor level, corridor development alternative level or at the national level. As outlined in chapter 2 the standard methods for combining impacts are cost-benefit, cost-effectiveness and multi -criteria analyses.
DECODE uses two methods for the purpose of aggregation of impacts: first, the EUNET method which combines cost-benefit and multi-criteria analysis and second, the TENASSESS PAM method which applies the goal achievement matrix.
CBA/MCA EUNET method
The objectives of the EUNET CBA / MCA approach are:
?? to bring the various indicators together in an overall assessment of each corridor development alternative, both in absolute terms (i.e. what are the implications of pursuing CDA X) and relative to a do-nothing scenario, using cost-benefit and multi-criteria analysis;
?? to present and comment upon this assessment at different levels of spatial aggregation (i.e. total impact {all Europe}; E. Europe / W. Europe; impact by country);
?? to generate a ranking of the corridor development alternatives based on the assessment results and to comment on the implications of alternative approaches to developing the TENs, including infrastructure and tax/pricing policy combinations, in the light of this;
?? to test the sensitivity of this ranking (and the robustness of particular policies) to changes in external forces, including European economic growth rates and differing speeds of integration between the EU and CEEC - by comparing the Renaissance, Dilution, Solidarity and Fragmentation scenarios;
?? to further test the sensitivity of this ranking to changes in the assumptions made during the assessment – for instance, how might the rankings change if passenger transport was included in the estimation of direct transport impacts? Or, how might the rankings be affected by the use of different values for CO2 and other environmental pollutants?

CODE-TEN FINAL REPORT 64
Assessment framework
The assessment framework broadly follows the model of EUNET (Nellthorp, Bristow and Mackie, 1998). Where possible the impacts of each corridor development alternative are monetised and included within a cost-benefit analysis. This is not always possible because some impacts are heterogeneous and do not lend themselves to monetary valuation (e.g. environmental effects of land take) and other impacts are not monetised as a matter of convention (e.g. accessibility, which would risk serious double-counting with time savings). Therefore some impacts are measured in quantitative terms but not monetised. Monetised and non-monetised impacts are then brought together within an overall assessment framework. A weighting exercise using methods found in the MCA literature is then used to produce an overall ranking of the corridor development alternatives.
Set of impacts a nd performance indicators
One of the fundamental principles of project appraisal is that all significant impacts should be included, to whomever they accrue (see Pearce and Nash, 1997, p.1). In practice, the word ‘significant’ is crucial, because it is usually beyond the resources of the exercise to measure, with any reasonable degree of accuracy, every single minor effect of adopting a particular project or policy. Instead, a view is usually taken about the set of impacts which are likely to be significant, and it is these on which attention is focused.
In selecting a set of impacts for the current exercise, we take as a template the long list of potential impacts identified in EUNET. At the same time, we are limited by the scope of the data. In total, it seems that a set containing ten impacts is feasible. These ten impacts span the three impact groups ‘direct transport impacts’, ‘environmental impacts’ and ‘indirect socio-economic impacts’. They also arguably comprise a useful subset containing some of the most significant potential impacts.
Since a number of potential impacts are clearly going to be omitted, it is worth raising the ‘packaging’ issue. In the final stages of this work, trade-offs will be explored between the various impacts of each corridor development alternatives – the environment vs. economic efficiency for example. Suppose this trade-off is made more concrete by comparing various combinations of NOx emissions and time savings. Both in willingness-to-pay surveys and in MCA weight generation processes, there is a tendency for the participant to imagine a change in a package of related variables rather than a change in one variable in isolation – for instance, on overall change in local air pollution rather than a change in NOx alone. This could influence the weight attributed to NOx in the MCA and is something to be aware of.

CODE-TEN FINAL REPORT 65
Another important issue to consider is that of double counting. The best way to avoid double-counting is to use a very narrow definition of costs and benefits, which is however not the approach taken in DECODE or in any strategic assessment method. Indeed in this decision context, it is almost guaranteed that there is some double-counting. The question thus becomes, is the amount of duplication sufficiently serious to jeopardise the value of the assessment as a whole, relative to the best viable alternative approach to decision support? In DECODE impacts have been defined so as to minimise the likelihood of reflecting the same basic social cost or benefit twice or more under different headings. However the method allows to also apply sensitivity testing to explore the ranking of options and their robustness, if say there is concern about the correct policy weight for reasons of double-counting.
Performance indicators for direct transport impacts include: investment costs, vehicle operating costs, revenue, time savings, and safety; for environmental impacts, noise local air pollution, global air pollution and land-take; and for indirect socio-economic impacts, output and strategic mobility.
Levels of analysis
Disaggregate descriptive analysis. This compares the values of performance indicators on an individual basis across all corridor development alternatives. This was undertaken at three spatial levels – total impact (whole Europe), Western Europe and Eastern Europe.
Aggregate analysis. This combines the performance indicators for each corridor development alternative, to come up with one indicator. The EUNET approach was taken for the aggregate analysis which was presented at three levels of spatial aggregation – whole corridor development alternative, East vs. Western Europe and by country.
Sensitivity analysis. This examines to what extent corridor development alternative rankings change when the socio-economic (EUNET CBA/MCA) weights change.
Assumptions regarding monetary values
For many of the impacts being valued, we are not in a position to reliably identify from empirical research what, if any, differences there are between values in different countries or different regions within countries. Therefore we use a common European value set for safety, noise, local air pollution and global air pollution.
Monetary values for environmental effects are available from a wide range of studies in Europe and elsewhere. In order to ensure that the values adopted are transferable between situations as far as possible, they are drawn from the findings of two recent meta-analyses: the EC EUNET research (Nellthorp,

CODE-TEN FINAL REPORT 66
Bristow and Mackie, 1998) and from the ECMT’s 1998 report on external costs entitled Efficient Transport for Europe.
The common values are based on weighted averages of country specific values (weighted by the relevant populations). Where values existed only for a few countries, values were scaled from those countries to a European average in line with other values available at both levels.
Goal achievement matrix TENASSESS PAM method
In the context of impact aggregation the goal achievement matrix represents a form of multi-criteria analysis where impact types are closely related to policy objectives and where weights are constructed as policy weights to reflect the policy owner’s valuation of outcomes. It allows the carrying out of a sensitivity analysis to examine how the overall score of a programme changes if alternative views to those of the dominant policy-owner are adopted.
The model is being adapted from the PAM (Policy Assessment Model), developed as part of the TENASSESS project.3 PAM was developed for application on specific transport initiatives, particularly TEN schemes, in a member state. In contrast, the application described here is of assessment of strategic development alternatives, with a particular emphasis on Central and Eastern Europe.
The reader will recall that the TENASSESS PAM also provided the basis for the elaboration of the ‘suitability’ test for the identification of priority projects at national level. The application of the TENASSESS PAM for the aggregation of impacts is different from the ‘suitability’ test in two ways: first, it represents the use of the model as such and not of its principles; second, it is applied at the strategic and not the project level.
Assessment framework
The PAM assesses the extent to which projects contribute to the achievement of policy objectives in thirteen different policy areas:
?? Apply environmental legislation ?? Pricing: internal (“user pays”) ?? Pricing: external (internalising externalities) ?? Intermodality ?? Interoperability
3 The details of the measures of performance are given in the Assessment Methodology Report, project TENASSESS, Halcrow Fox 1998.

CODE-TEN FINAL REPORT 67
?? Accessibility ?? Regional development ?? Increase cross-border traffic ?? Restrict local road traffic ?? Reduce accidents ?? Liberalisation and privatisation ?? Deregulation ?? Infrastructure investment to reduce the cost of travel
The PAM presents these objectives so that any progress towards or away from them resulting from a transport initiative can be measured. It does this through explicitly linking impacts with objectives. In order to do this, objectives need to be operationally defined, such that degrees of success or failure can be measured from identified impacts. The key of this is the identification of explicit points of success and failure for each policy area. Once the ‘end points’ have been identified, an explicit mathematical relationship is defined that traces the path between failure and success. These relationships are termed ‘measures of performance’. In most instances, a linear relationship has been defined but there is no reason, in principle, why other mathematical forms – such as an ‘all or nothing’ approach where anything but total success is viewed as total failure-cannot be used.
Project impacts are then assessed and scaled as to whether they further progress towards the successful achievement of an area of policy, or contribute towards failure. This is achieved by specifying the end points of the measure of performance as –5 and +5. The impacts of a particular project is given a score with respect to each policy area somewhere between these two delimiting values, dependant upon whether the impacts are in line with policy objectives (a positive score) or in conflict with them ( a negative score).
A weighting system is also built into the PAM. The weighting system applies a weight to each policy area to reflect their comparative importance.
The final score for each policy area is the product of value score and its weight. These are summed across all policy areas to produce a final global score. The weights have been set so that the final scores fall in the range –100 to +100.
It is important to note that individual final scores are not, in themselves, the main output of the PAM. Indeed, the PAM is not designed to generate a single figure summary of the worthiness of a project. Rather, the PAM is an analytical tool, designed to test a variety of options, refinements and weights in order to generate a measure of the overall worthiness and robustness of a transport initiative. The PAM allows the user to explore, not only which option is optimal, but also why it performs better or worse than others.
CODE-TEN FINAL REPORT 68
Implications for strategic assessment
The TENASSESS PAM has been designed to be flexible in its application and its principles can readily be applied to strategic impacts. However a number of changes to the details of the model were needed:
?? to reflect the increased number of policy interests at stake and
?? to increase the flexibility of data requirements.
The transport policy areas are designed to be generic so that they can be combined with reasonable success to reflect the different interested parties being considered. It has been found that the addition of further interest-specific policy areas can sometimes be beneficial. An example of this is a strong requirement to proceed with a national motorway programme, for which very specific targets may be given. However such interest-specific policy areas are not possible to incorporate in strategic assessment because of the sheer number of interested parties being considered.
When developing measures of performance on the project level, maximum and minimum scores are chosen to be appropriate to achievement of the policy from the perspective of the country, or other interests, being represented. In strategic assessment, scores that are uniform across countries are a necessary simplification to this. The range of scores is set to reflect the range of values for the associated impact that can result from different transport initiatives.
In some cases, the impacts are not measurable in the particular circumstance of data availability in the corridor assessment demonstration example. The manipulation of data is described in more detail in the next section. In some circumstances, proxy impact measurements have been used, which have sought to retain the principles of the measure of performance. For others, success or failure of the development alternative cannot be determined in certain strategic assessments as conditions are not sufficiently specified. In particular, the pricing form of the transport infrastructure is not defined and therefore certain impacts are not determined. The results of the analysis cannot therefore be considered robust; however they can be used for indicative and illustrative purposes.
Measures of performance have also been adjusted to be consistent with the impact measurements used in DECODE, with respect to socio-economic and environmental indicators.
Measures of achievement of policy
This section describes the measures of performance used with respect to each policy area. In many cases it has been possible to use measures developed in the TENASSESS project. In others, further elaboration was needed. In some,

CODE-TEN FINAL REPORT 69
the measures would ordinarily be practical for strategic assessment but are not feasible in the particular context of data availability.
Funding Context. The measures of performance have been designed so that more intensive investment has larger scores. Larger, positive, scores should be interpreted as being ‘better’ than smaller scores, in that they reflect a larger move towards the achievement of transport policy, in the same way that a larger NPV indicates better performance in cost benefit analysis. However, in the context of significant constraint on public finances, the best value for money should also be considered. The analogy for this in cost benefit analysis is the cost benefit ratio. Therefore the scores should not be viewed in isolation, but in tandem with the associated investment cost that each development alternative demands.
Apply environmental legislation. The associated measure of performance is based on the environmental impact analysis, which is a separate output of the strategic assessment. It is a function of the derived environm ental indicators (excluding the safety indicator), namely emissions of carbon dioxide, carbon monoxide, nitrogen oxides, noise emissions and land take. The separate indicators are combined, using standard weights based on monetary value. Benchmarks of ‘bes t performing’ and ‘worst performing’ transport initiatives are used to standardise the score within the required ranges.
Internal pricing. This policy area corresponds to the goal of promoting new transport schemes that are able to be self-financing. The measure of performance is based on the financial internal rate of return (IRR) of a development.
It considers construction costs and users’ revenue. The revenue may come from tolls, public transport fares and user charges, but not from general taxation.
A minimum internal rate of return is defined. This will normally be based on the appropriate cost of borrowing with a certain risk premium, and is typically between 12% and 20% per annum. Transport programmes that result in an IRR of the minimum required are given a score of zero. Transport developments that result in an IRR of double the minimum, that are the only source of user charges in the study area, are given a score of 5. Transport programmes that result in an IRR of zero, that are the only source of user charges in the study area, are given a score of –5.
The measure takes into account not only the extent to which the development satisfies the ‘user pays’ principle, but also the size of the development in proportion to the study area. This second factor is important and is a feature of all the performance measures.

CODE-TEN FINAL REPORT 70
For the purpose of assessment of corridors, revenues associated with each development alternative have been specified in general terms only. It has not been possible to isolate payment between users and non-users of the new infrastructure facilities. Instead proxy measures were used, based on available indicators from the traffic assessment model and impact assessment. The synthesised measure reflects the ability of schemes to generate revenue, should the appropriate pricing mechanism be put in place. The measure is based on the value of the goods carried that use the enhanced infrastructure, relative to the construction cost of the infrastructure. It is not a robust measure because it does not value the willingness to pay for the infrastructure, which is highly dependent on the quality of available alternatives. However the measure is infrastructure-specific, and so is genuinely targeting users. In general we can say that there is large uncertainty associated with this policy area at strategic level unless the principles of the form of transport pricing (user-specific or general) are made explicit.
Internalising external costs. The measure of performance was devised in TENASSESS. It measures the extent to which the price paid by users reflects the marginal social cost of the transport, including the cost of externalities. The ratio of price to cost are measured for the different transport modes available. If the transport initiative results in the distortions becoming more balanced across modes – which would mean that the behaviour of transport users becomes more socially efficient – then the score is positive.
The main externalities to consider are: marginal wear and tear of infrastructure, operating expenditure for public transport, external congestion and accidents, and environmental impacts. In order to apply the measure of performance, it would ordinarily be necessary to know the marginal price of transport and the marginal costs in monetary terms for each mode.
Whilst the data requirements for this measure are onerous, the policy area has limited relevance for transport initiatives that do not incorporate changes in transport pricing. Transport programmes for which transport pricing is integral to the strategy would be expected to consider this issue in more detail, so that suitable data would be available for those instances.
Some simple approximations to the measure of performance could be considered also. For example, uncongested inter-urban car travel in the EU typically experiences prices not dissimilar to marginal cost. On congested untolled roads, the marginal price is significantly lower than marginal social cost. For public transport, the passengers’ transport fares should be approximately equal to the vehicle’s operating cost. If they exceeds this, particularly for rail, then an improvement in efficiency would be expected from appropriate increases in marginal road vehicle pricing (cf. PETS and CAPRI reports 1999).

CODE-TEN FINAL REPORT 71
The infrastructure development alternatives being considered do not specify the form of pricing. In particular they do not specify whether it is related to marginal use or is a flat rate. Given this ambiguity, there is no clear impact on the attainment of this policy. Consequently we allocate all the countries a neutral score in this transport policy area.
Promote intermodality relates to the goal of changing the existing modal split away from road transport. The degree of achievement of this objective is measured using the ratio of the number of tonnes km transported by road compared to the number of tonnes transported by other modes.
Promote interoperability relates to the goal of improving the interoperability of national rail systems to promote international rail services. The technical interoperability of systems is primarily a function of the rolling stock used and the signalling; at a more basic level, tracks must be of the same gauge. This is a new policy area.
To take into account the size of the development in the study area, the score should be proportional to the percentage of the length of network upgraded compared to the total length of the network potentially operational for trans-national rail services. Negative scores can result from failure to invest in interoperable systems: they are worse than ‘do-nothing’ because the opportunity to enhance interoperability has been postponed.
In the development alternatives being considered, it is clear that the pan-European network will be extended with interoperability as a key objective, though rolling stock purchase is not part of the scenarios. The scores have been synthesised with this in mind.
Improve accessibility. The measure of performance of this policy area has been harmonised with the demographic accessibility indicators developed and implemented as part of DECODE, which are designed to estimate the accessibility improvements for the populations living in each region and each country. The demographic accessibility estimates have been standardised to obtain scores ranging between 5 and –5, with no change representing a zero score.
Improve regional development. As improved connections is one of the factors that contributes to economic prosperity, the measurement of the degree of success in this transport policy area is based in the economic accessibility indicators developed and implemented as part of DECODE.
Increase cross-border or international traffic. The measure used is the ratio between the increase in cross-border traffic volumes relative to overall traffic volumes. In order to be able to estimate this phenomenon, the generation of traffic must be estimated, otherwise the ratio in growth is, by definition, one.

CODE-TEN FINAL REPORT 72
This can either be achieved by explicitly modelling certain kinds of traffic generation, or by deriving growth in demand by considering change in transport cost and applying elasticities. In a typical transport model one of the two would ordinarily be possible.
As neither option is available here, and other methods have not proved satisfactory, the results have instead been synthesised. As the infrastructure developments are specifically designed to promote a pan-European network, the scores for the development alternatives have been set to be high.
Decrease local road traffic. The impact measured is change in road use, for example vehicle km. Benchmarks of ‘best performing’ and ‘worst performing’ transport initiatives are used to standardise the score within the required ranges.
Reduce accidents. The measure of performance is based on the safety indicator and impacts being used in DECODE. Benchmarks of ‘best performing’ and ‘worst performing’ transport initiatives are used to standardise the score within the required ranges.
Liberalisation and privatisation. Proposals for transport initiatives that do not specify the operating environment or source of finance of the investment do not have a direct influence on this area. In transport programmes suitable for infrastructure development, the sources of finance are unlikely to have been confirmed, as the detailed planning of projects is still remote. However it is certainly the case that liberalisation and privatisation are greatly facilitated if the capital investment or the operations are financially viable, as this allows private investors and operators to become involved with much less participation, or complexity of contract, with the state. The most appropriate measure of performance in the context of infrastructure development is based on the financial profitability of the projects.
In this study, transport charges associated with each development alternative were specified in general terms only, and it is not possible to isolate revenue that would accrue to infrastructure operators as distinct from general taxation. Instead a proxy measure has been used, based on the monetarised economic benefits of the schemes and the associated construction costs. It is not a robust measure because economic benefits can differ widely from financial benefits, even with a pricing policy to maximise revenue. In general we can say that there is large uncertainty associated with this policy area at strategic level unless the principles of the form of transport pricing are made explicit.
Support deregulation. Transport initiatives concerned with transport pricing or infrastructure improvements do not influence this area, whereas clearly many reorganisation of transport operations do. We consider that the assumptions
CODE-TEN FINAL REPORT 73
underlying each development alternative to be neutral with respect to this policy area.
Infrastructure investment to reduce the cost of travel. The measure of the degree of accomplishment of this goal is the computation of time savings in each of the countries in relation to the capital investment.
Output
The results will be displayed spatially, measuring the success of each corridor development alternative relative to policy for each country in the CEEC.
The results will be:
?? A single score for a matrix of {each country} x {each corridor development alternative}.
?? The results display the impacts of the corridor development alternative spatially, as they differentiate between country, and results for different corridor development alternatives within the same policy environments can be compared.
?? An extension to the analysis is an examination of the results relative to current national transport policies.


CODE-TEN FINAL REPORT 75
4 The Strategic Assessment Results
The DECODE method has been applied to the Helsinki corridor development plans, i.e. the extension of the TEN towards the CEEC/CIS. Prior to presenting the results of the demonstration, it is important to give some background information on this major transport development programme.
4.1 Drawing the maps
The TINA (Transport Infrastructure Needs Assessment) consultation process initiated by the Directorates General for Transport and for External Relations to assess the infrastructure needs in the accession countries became a main vehicle for the establishment of not alone European but also national priorities in these countries.
Most accession countries have in the meantime elaborated national transport policy and infrastructure plans. These are to a large part dominated by the trans-European corridors. In this respect the development of transport infrastructure in Eastern Europe already now follows a different course from that in Western Europe.
Within the European Union the TEN were elaborated to cover an already existing and for the most part advanced ‘mosaic’ of national transport networks, and the list of priority projects concerned the bottlenecks or missing links. In Eastern Europe the transport networks and systems are underdeveloped – the extension of the TEN is no longer alone about bottlenecks, but rather, more comprehensively, about the development as such of transport infrastructure of would-be member States of the European Union.
This broad scope of the corridor programmes has three major implications:
?? first, the realisation of the infrastructure plans will take a considerable time to complete;
?? second, it will require a major financial investment, including from national budgets.
Even under optimistic scenarios about economic growth in accession countries and the percentage of government expenditures committed to transport infrastructure – 1,5 per cent according to TINA – the corridors cannot be completed prior to 2015.
Following from the above, the third major implication is that
CODE-TEN FINAL REPORT 76
?? phasing will be unavoidable and this implies a second-level prioritisation – it is worth here to recall that all projects are in a sense priority projects considering that they form part of the trans-European networks, thus the term ‘second-level’ prioritisation.
4.2 The pitfalls of prioritisation
How to decide on this second-level prioritisation is a policy problem which is fundamentally more complex than that of deciding on the corridor maps as such, i.e. the first-level prioritisation.
The traditional approach to project evaluation would suggest the use of primarily socio-economic assessment in the form of a cost-benefit analysis in conjunction with financial appraisal where the study area is defined very stringently to cover single projects. Local environmental impacts and cross-sectoral impacts (like effects on employment or regional policy) could be addressed separately to ‘refine’ policy decisions based on economic and efficiency criteria.
This approach, whilst possibly perfectly applicable to the assessment of projects that target missing links on an already well developed transport network (as in the majority cases of the TEN priority projects in the West), is potentially problematic for the purpose of the second-level prioritisation concerning the extension of the TEN to the CEEC if it is the only evaluation method used:
Considering that all projects are ‘priority’ projects as they all belong to the trans-European networks the application of this traditional approach would imply carrying it out for each single project in order to obtain comparative socio-economic assessment estimations: the objective is, in other words, not alone to estimate the socio-economic ‘value’ of the project with reference to the do- minimum or do-nothing scenario but also its value with reference to all other projects.
Besides it being particularly resource-intensive, this exercise is also likely to face methodological problems by reason of the difficulties in defining the study area in a stringent way given that the transport network in Eastern Europe is not as developed as that in the West. In the context of an under-developed network, the impacts of any particular project on the network and vice-versa are more likely to be geographically dispersed and diffuse.
Finally, not least important is that this approach assumes that the decision-making is rational, linear, and more importantly insofar as the European Union is concerned, consistent across national borders. This is far from being the case.

CODE-TEN FINAL REPORT 77
In the context of the co-financing procedures that characterise the pre-accession phase – through the regional funds, for transport in particular ISPA – the accession countries are expected to carry out the socio-economic analyses and financial appraisals of the TINA projects for which they wish to obtain co-financing or full financing. ISPA will in turn evaluate these project proposals and also consider Community objectives prior to reaching a decision.
These procedures leave little room for strategic assessment. Common objectives were only taken into account when ‘drawing’ the corridor maps, and considered primarily the necessities of long-distance travel. CTP objectives with regards the environment, social cohesion or intermodality are only taken into account at the local level. In the absence of common tools for evaluation but also of common input data for estimations, the adoption of the traditional approach to evaluation as the sole evaluation method is ironically quite likely to increase the incidence of political decision devoid of scientific content.
4.3 Subsidiarity and national priorities
Subsidiarity is a key, albeit difficult, issue for the process of European integration. European action is legitimate in areas where there is added value to be gained from such action. The extension of the TEN towards the East is undoubtedly one such area: the trans -European corridors will facilitate long-distance travel and thus contribute to the cohesion of the extended European Union; furthermore, they will contribute to economic development and can thus be regarded as a main vehicle for integration and in that security and co-operation.
The existence of a European added value however does not preclude national interests. Thus in the case of the trans -European corridors to the East despite the fact as we saw that the TINA process influenced to a great extent the national transport infrastructure plans of the accession countries, when it comes to the second-level prioritisation or the phasing of the projects national interests play a significant role. The procedures adopted by the Commission for co-financing are likely to reconfirm this trend.
We have argued above in favour of a strategic assessment to accompany these procedures. This does not mean not taking into account national interests. It does however imply considering these against the Community objectives and in an integrated approach, i.e. not alone bilaterally but in a the multilateral context. For the purposes of strategic assessment applied to infrastructure investment programmes it more specifically means paying attention to the ‘boundary conditions’ i.e. the extent to which projects are compatible with interregional transport networks and more generally the policies of neighbouring countries, East and West.

CODE-TEN FINAL REPORT 78
A brief outline of these national interests per corridor will illustrate that there are several negative boundary conditions present in the actual definition of the corridor development plans:
Re (corridor I – Helsinki-Warsaw): Due to the differential emphasis placed on rail and road development by Estonia and Latvia on the one hand and by Lithuania and Poland on the other, a problematic boundary condition might arise. This, in turn, suggests that there are two possibly competing areas of influence also in relation to the ports: one comprising Poland, Lithuania and Russia in relation to Kaliningrad favouring rail and the corridor branch IA through Belarus, with Gdansk dominating as a port; the other comprising Estonia and Latvia in relation to Moscow and Finland and favouring the Estonian and Riga ports. Future developments will depend on first, the Russian strategy regarding the opening towards the North; and second, the scope of regional co-operation between the three Baltic States. Otherwise, the environment is emerging as a problem in relation to socio-economic concerns over competition in Latvia and Lithuania.
Re (corridor II – Berlin-Moscow): In Poland the road links are prioritised over the rail links. However, only the western part of the road connection (i.e. from the German border to Warsaw) is cleared regarding implementation, whereby barriers are expected with reference to the Warsaw section; the situation is less clear regarding the eastern part, mainly due to problems of financing. For Belarus the rail links would appear to be of slightly higher priority, whereas for Russia the reconstruction of the highway (and especially of the bridges) along corridor II is the project of highest national priority.
Re (corridor IV – Dresden-Thessaloniki/Plovdiv): Corridor IV presents a number of competing priorities between countries as well as between rail and road. The Czech Republic wants to improve in particular the conditions for cross-border road traffic with Germany, thus prioritises the western road parts of the corridor over the eastern and southern road and rail segments – the location of the Plzen bypass is the sole barrier to the completion of these links.
Slovakia is primarily concerned with the construction of the Petrzalka-Parndorf railway line towards Austria which will speed up the traffic between Vienna and Bratislava and enable the re-routing by rail of high goods vehicles from Devinska-Nova Ves to the Marchegg border crossing. This is in line with Austrian priorities towards the Slovakian border.
In Hungary where both the rail and road connections to the west, i.e. to Austria, are of reasonable standard, the project with the highest suitability scores concerns the upgrading of the rail infrastructure and railway stations on the Budapest – Kelebia line towards the south for connecting to Corridor X. The prioritisation of this project suggests that subject to the change of the political situation in Serbia, it could well be that the ‘national’ interests of Hungary insofar

CODE-TEN FINAL REPORT 79
as international connections are concerned shift away from Corridor IV (east connections) to corridor X (south connections).
In Romania the road projects on the western part of the country, i.e. between Nadlac-Bucharest-Constanta are prioritised by reason of the importance attached to the Constanza port for the Romanian transport system. The same is the case with the upgrading of the rail connection between Curtici-Bucharest-Constanta. However considering the sub-optimal situation of the road network in Romania more generally, the road connections are prioritised over the rail connections. The same is true for Bulgaria where in particular the Southern connections to Greece and Turkey and those to Yugoslavia are prioritised.
It is important to keep in mind with regards both Bulgaria and Romania and Corridor IV that the possible opening of Corridor X would place these two countries in direct competition in terms of channelling the traffic to the east through to the ports in the Black Sea Region, whereby this is also very much dependent on the scope for development of the Black Sea Region and the Aegean for international shipping. Competition has already emerged concerned the location of the 2 nd bridge across the Danube.
All Greek projects are in the process of implementation despite the fact that there still reigns uncertainty as to what boundary conditions these would be facing in the North. As in the case of Corridor X (see below) this can only be understood by appreciating, first, that Greece can claim funding through the Community Cohesion Support Funds which especially seek to promote development in peripheral regions, which is what the Northern part of Greece is; and second the national interest of Greece in developing its northern frontier: the significance of the corridor IV for Greece can be better understood if it is recognised that all relevant projects feed into the Via Egnatia that connects the western and eastern part of Greece in the North from Thessaloniki to Igoumenitsa.
Re (corridor V – Venice-Kiev): The corridor V preference lie with construction and upgrading of motorways and not so much the development of the rail infrastructure. The exception is Slovakia which is in particular interested in further developing its rail connections to Belarus in relation to Corridor V and Hungary concerning the Budapest-Cegled-Szolnok link to Yugoslavia.
Corridor V like corridor I is likely to face negative boundary conditions at least in terms of phasing or timing; this is only partly the result of the competition between ports, and in particular Triest, Koper and Raijeka. Clearly how corridor V develops will depend on the extent to which these three ports collaborate or compete but also, perhaps more importantly, on whether they will be feeding points for the North (i.e. along corridor X and/or VI) or for the East (i.e. along corridor V). Whilst this will very much depend on the economic performance of

CODE-TEN FINAL REPORT 80
the NIS, it at the same time is likely to influence the modal options for corridor V.
Re (corridor VII – Danube): The overcom ing of the technical barriers affecting the Danube waterway will be what ultimately determines the scope for development of Corridor VII. Technical barriers in conjunction with environmental concerns have practically stopped infrastructure developments along this corridor over several years.
Re (corridor IX – Copenhagen-Moscow): Corridor IX is perhaps the one corridor which more than any other is explicitly used to promote national or bilateral cross-border interests: for Denmark it provides the opportunity to legitimise and subsequently proceed to realise land connections with Sweden on the one hand (the Øresund Fixed Link is close to completion) and Germany on the other (the Fixed Femer Belt is still in the planning stage) despite strong opposition from the population related to environmental issues. Similar is the case in Sweden with regards the Malmo city tunnel and the upgrading of the railway to Stockholm.
In Finland priority is given to the railway upgrading of the route from Helsinki to the Russian border (and the alternative to Lahti) and the road reconstruction in the same direction. Also for Russia the improvement of the cross-border connections to Finland are considered important; but also the upgrading of the railway infrastructure around St. Petersburg.
Re (corridor X – Salzburg-Thessaloniki): In Austria the expected increase of traffic from both the East and the South in relation to corridors IV and X have led to a reassertion of the importance of key railway links between South and East, whereby there is no agreement as to the primary location of this. Railway links with reference to corridor X are also considered a priority in Slovenia and Croatia, however their realisation is expected to face delays, in Croatia despite the absence of any major barriers. Both countries instead place an emphasis on the re-construction of the motorways, Slovenia is already well advanced with its implementation.
For Hungary and Bulgaria corridor X provides an opportunity to ameliorate the road and rail links to Yugoslavia. For Yugoslavia both rail and road projects to Hungary on the one hand and Yugoslavia on the other are important.
Any developments along corridor X are largely dependent on the stabilisation of the situation in the Balkans following the Kosovo crisis.
CODE-TEN FINAL REPORT 81
4.4 Modal priorities and regional alliances
All corridors are multimodal in character. CTP places an emphasis on railway development; for most of the East European countries (but also for the South European countries) the enlargement of the road network is instead granted priority by reason of the poor conditions of the roads in the East and the South as compared to the railways. Still there is a significant national variation in strategy that cautions against generalisations. The emerging picture is not necessarily one of conflicting interests, rather one of differing regional alliances.
The Central European regional network with north-eastern Austria, western Slovakia, the south of the Czech Republic, and Western Hungary at the core. In this region there are positive boundary conditions for the development of the rail network; how this develops will influence developments on Corridor VI towards Poland; developments on Corridor X in the south in relation to the provision of an alternative route to the Alpine corridor (Italy, Switzerland, Austria, Germany) in the west; and developments on Corridor V towards Russia in competition with Corridor II in the same direction in the north.
The Baltic Sea regional network at the cross-roads between corridors I, II and IX. As we saw in discussing the priority projects in the Baltic countries, there is a clear orientation of all Baltic States to their respective ports. On the other hand, whilst Estonia and Latvia emphasise road developments, Lithuania and Poland are more keen on railway developments.
The Balkan regional network comprises Bulgaria, Hungary, Yugoslavia and to a lesser extent Romania but by default also Croatia and Slovenia. Subject to the resolution of ongoing conflicts in Yugoslavia this could become another strong regional network in competition or co-operation with the afore-mentioned Central European one. Whether rail or road will dominate this network remains still unclear.
In Poland and Russia regional networks are more likely to develop at first within each country. The recent regional administrative reform in Poland suggests the promotion of the idea of decentralised centres which could suggest also a further prioritisation towards connecting these among themselves and/or with the regions surrounding them. In Russia the development of the St. Petersburg region will influence developments along both corridors I and IX.
Rail would appear to have the best chances for development within regional networks. Road is prioritised with reference to connecting these. Thus we may talk of the centrifugal character of rail development as opposed to the petrifugal character of road development plans.

CODE-TEN FINAL REPORT 82
4.5 Towards which corridor development alternative?
The aim of the impact assessment is to help in drawing comparative conclusions that will outline the winners and losers under different strategies. To reiterate, the assessment in CODE-TEN focused on the following corridor development alternatives:
Under the renaissance scenario:
All infrastructure variants – ‘all road’, ‘all rail’, ‘network approach’ and ‘priority road’ – set against the do-nothing variant.
Under all external scenarios:
A comparison between the ‘priority road’ and ‘network approach’ set against the do-nothing variants in each case.
We report first on the indirect and long-term impacts, i.e. accessibility gains or losses and environmental impacts. Thereafter we report on the aggregate analysis which incorporates the results of the economic assessment of direct transport impacts.
Winners and losers in terms of accessibility
This assessment aims at analysing the accessibility gains for various regions under different infrastructure strategies. The gains are calculated for different external scenarios in comparison to their respective do-nothing infrastructure strategy. The accessibility changes have been calculated at two levels – with reference to population (demographic accessibility), and with reference to GDP (economic accessibility). The time thresholds considered were 4h, 9h and 12h for demographic accessibility; and 12h, 28h and 44h for economic accessibility.
Below we report on the results of the economic accessibility for the 12h threshold. No major significant findings could be observed with regards demographic accessibility, except for the neighbouring regions to major infrastructure investments. Insofar as the time threshold is concerned, we report only on the 12h one as this is the one which displayed the most significant impacts.
The economic accessibility measures shows the gain in accessibility for freight transport. It is expressed in terms of the number of regions that can be reached by freight transport within a specified time period, in this case 12 hours.

CODE-TEN FINAL REPORT 83
Accessibility gains were calculated with reference to the respective do-nothing scenario in the year 2015. We first compare the winners and losers for different network variants under the renaissance scenario; and then the winners and losers for the ‘network solution’ under different external scenarios.
The general finding can be summarised as follows: Under all external scenarios barring the renaissance scenario the network strategy gives the maximum number of winners in terms of regions with a 10 per cent accessibility gain or more.
Impact of different network variants under renaissance scenario
If the optimistic renaissance external scenario – high growth and fast integration – is assumed up to the year 2015, then the ‘all road’ variant delivers the best average accessibility gains and also the highest variance of these changes. The number of regions with accessibility gains above 10 per cent amount to 128. This compares to 67, and 34 under the ‘network’ and ‘all rail’ approaches respectively. The ‘all road’ variant is also the one displaying the lowest number of regions with accessibility losses: only 18 as compared to 32 and 65 under the ‘network’ and ‘all rail’ variants respectively.
Looking at the results from the national perspective, we find that the ‘network’ and ‘all road’ variants produce similar statistical indicators. The maps that follow (map 1 to map 8) outline the winners and losers for different corridor development alternatives under the Renaissance scenario at the national level as well as at the regional level.

CODE-TEN FINAL REPORT 84
National Average Ratio ‘All road’/’Do-nothing’ (map 1)
The implementation of an ‘all road’ strategy shows that very few countries report losses in accessibility and most of them report significant gains. The comparison of this strategy with the ‘do-nothing’ yardstick shows additionally the following:
?? Countries displaying accessibility losses (in the order of 1 to 6 per cent) are Great Britain and Ireland in Northern Europe and Spain, Italy and Greece from Southern Europe.
?? Countries with small accessibility gains up to 6 per cent are France, Germany, Austria, Czech Republic, Turkey, FYROM, Moldavia and Scotland.
?? Countries with gains between 6 and 14 per cent are Russia, Finland, Poland, Ukraine, Romania and Portugal.
?? Countries with gains between 14 and 29 per cent are Belarus, Slovakia, Hungary, Yugoslavia, Croatia, Bulgaria, Switzerland, Norway and Sweden.
?? The countries showing the strongest increases of between 29 to 114 per cent are Bosnia, Estonia, Latvia and Lithuania.
Regional Ratio ‘All road’/’Do-nothing’ (map 2)
The same comparison at the regional level shows the following as winners and losers.
?? The highest decrease of accessibility (37 per cent) is observed for northern regions of Great Britain. This can be explained by the growth of traffic volumes in some links and corresponding speed reduction.
?? Small losses (between 1 to 8 per cent) are observed for some regions in Great Britain, Spain, France, Greece and Russia.
?? Most European regions display losses or gains that are below 8%.
?? There are few regions with gains between 8 and 28 per cent, namely, in Portugal, Romania, Austria, Slovakia, Croatia, Yugoslavia, Ukraine, Belarus and Russia.
?? There are some regions with increases between 29 and 67 per cent, namely regions in Scotland, Hungary, Norway, Sweden, Croatia, Bosnia, Belarus and Lithuania.
?? Regions with accessibility gains above 67 per cent are a few scattered regions in Russia, Belarus, Latvia and Lithuania.

CODE-TEN FINAL REPORT 85

CODE-TEN FINAL REPORT 86

CODE-TEN FINAL REPORT 87
National Average Ratio ‘All rail’/’Do-nothing’ (map 3)
The implementation of an all rail strategy shows the following as winners and losers at the national level:
?? Turkey shows a significant loss in accessibility (63 per cent). This is due to the decrease of link speeds resulting from the implementation of the ‘all rail’ strategy in conjunction with the increase of congestion on roads in Turkey due to increase of traffic.
?? Above 7 per cent gains are recorded for Great Britain, Russia, Albania, Slovenia, Austria and Czech Republic.
?? Small decreases (between 3 and 7 per cent) are observed in Spain, Germany, Poland and Sweden.
?? Some countries (France, Italy, Slovakia, Romania and Greece) display rather small decreases (under 3 per cent) or remain roughly unchanged. Small gains (up to 3,5 per cent) are observed in Portugal, Finland, Hungary and Bosnia.
?? More significant gains (between 3,5 and 26 per cent) are observed in Norway, Scotland, Belarus, Bulgaria, Belarus, Estonia, Latvia and Lihuania.
Regional Ratio ‘All rail’ / ‘Do-nothing’ (map 4)
At the regional level, the implementation of the same strategy has the following effects:
?? The maximum loss of above 27 per cent are recorded for a few scattered regions: Madrid, Albania, one region in Norway and some in Russia and UK.
?? Some regions in Spain, France, Russia, Great Britain, Germany and Poland record losses between 11 and 27 per cent;
?? Central European regions display small losses between 1 and 11 per cent.
?? Peripheral regions in Portugal, Great Britain and the Scandinavian countries display no changes or gains up to 20 per cent. Also within this range are some regions in the NIS, the Baltic States and the Balkan region.
?? Significant gains (between 20 and 75 per cent) are recorded by a few scattered regions in Latvia, Lithuania, Belarus, Poland, Bulgaria, Croatia, Norway and Scotland.

CODE-TEN FINAL REPORT 88

CODE-TEN FINAL REPORT 89

CODE-TEN FINAL REPORT 90
National Average Ratio ‘Network’/’Do-nothing’ (map 5)
The implementation of the network strategy under the Renaissance scenario shows the following as winners and losers on a national basis in comparison to the do-nothing strategy.
?? The countries showing losses between 4 and 15 per cent are Spain, Albania, Great Britain, Ukraine and Austria.
?? Countries experiencing no or very low impacts (i.e. losses by no more than 4 per cent) are the Central European countries, Greece, Italy and Ireland.
?? Countries with rather small increases (under 6 per cent) are Portugal, France, Scotland, Romania, Turkey, Slovakia and Hungary.
?? Countries with increases between 5 and 11 per cent are Sweden, Finland, Russia, Belarus and Switzerland.
?? Most of the peripheral countries show the strongest gains (up to 78 per cent) – Norway, Estonia, Latvia, Lithuania,Yugoslavia, Bosnia, Croatia and Slovenia.
Regional Ratio ‘Network’/’Do-nothing’ (map 6)
An analysis of the regional ratios for the ‘network’ variant under the renaissance scenario leads to the following conclusions:
?? There are only five regions with significant losses in accessibility (i.e. between 23 and 40 per cent).
?? Most European regions show losses under 4 per cent or gains under 6,5 per cent.
?? Few regions display gains between 7 and 30 per cent: one region in Portugal, and a relevant number of regions located in France, Switzerland, Italy, Yugoslavia, Slovenia, Bosnia, Croatia, Slovakia, Hungary, Poland, Germany, Denmark, Norway, Sweden, Finland, Russia, Belarus, Lithuania and Russia.
?? The strongest gains (between 30 and 162 per cent) are oberved for the peripheral regions, a small number of regions in Belarus, Lithuania, Latvia, Russia, Bulgaria, Norway and Scotland.

CODE-TEN FINAL REPORT 91

CODE-TEN FINAL REPORT 92

CODE-TEN FINAL REPORT 93
National Average Ratio ‘Priority road’/’Do-nothing’ (map 7)
The ‘priority road’ variant shows the following results at the national level:
?? The countries that witness losses (between 7 and 14 per cent) are Spain, Great Britain, Austria, Czech Republic and Turkey.
?? Countries with rather small losses (between 2,3 and 7 per cent) are Germany, Denmark and Italy.
?? A significant number of countries (Portugal, France, Ireland, Scotland, Sweden, Poland, Slovakia, Hungary, Slovenia, Ukraine and Greece) display neither losses nor gains in accessibility.
?? Moderate gains (between 5,3 and 26 per cent) are observed in Norway, Finland, Russia, Belarus, Romania, and Bulgaria; high gains (up to 99 per cent) only in Latvia and Lithuania.
Regional Ratio ‘Priority road’/’Do-nothing’ (map 8)
At the regional level, the ‘priority road’ variant shows the following impacts:
?? Regions displaying significant losses (between 28 and 48 per cent) are regions in Spain, Russia and Great Britain, however they are few in number.
?? Likewise very few regions display moderate losses (between 6 and 28 per cent); these are regions in Spain, France, Denmark, Great Britain, Germany, Poland, Austria and Turkey.
?? Most European regions display very small losses (under 6 per cent) or gains (under 7 per cent).
?? Moderate gains (between 8 and 49 per cent) are observed in one region in Portugal and one in Great Britain, three in France, and in several regions in Finland, Norway, Russia, Belarus, Lithuania, Poland, Romania, and Bulgaria.
?? The strongest gains (between 48 and 156 per cent) are recorded by a small number of regions in Belarus, Lithuania, Latvia, Russia and Norway.

CODE-TEN FINAL REPORT 94

CODE-TEN FINAL REPORT 95

CODE-TEN FINAL REPORT 96
Comparing ‘ network’ approach under different external scenarios
The following table compares the accessibility gains under different external scenarios for the network infrastructure strategy:
Table 4. Comparison of accessibility gains – network infrastructure strategy
Scenario Infrastructure strategy with maximum accessibility gains
Number of regions with gains above 10% in comparison to the do-nothing scenario
Renaissance Network 67
Dilution Network 278
Solidarity Network 229
Fragmentation Network 87
What can be concluded from the above table is that the ‘network’ solution is quite robust insofar as it produces a significant number of winners under all external scenarios.
Renaissance Scenario National Average Ratio (map 9)
Under the renaissance scenario, the ‘network’ variant displays the following impacts in terms of accessibility gains and losses.
?? Small loses (between 4 and 15 per cent) are recorded in Spain, Albania, Great Britain, Ukraine and Austria.
?? Countries with no changes or insignificant losses (below 4 per cent) are the Central European countries, Greece, Italy and Ireland.
?? Countries with rather small gains (under 6 per cent) are Portugal, France, Scotland, Romania, Turkey, Slovakia and Hungary.
?? Countries with moderate gains between 5 and 11 per cent are Sweden, Finland, Russia, Belarus and Switzerland. Significant gains (up to 78 per cent) are recorded in Norway Norway, Estonia, Latvia, Lithuania,Yugoslavia, Bosnia, Croatia and Slovenia.
Dilution Scenario National Average Ratio (map 10)
The ‘network’ infrastructure strategy produces the largest positive impacts under the dilution scenario. Gains are recorded by almost all countries: ?? Most countries display gains between 6 to 23 per cent. Only Ukraine,
Greece, Scotland and Estonia record smaller gains.

CODE-TEN FINAL REPORT 97
?? Significant gains (between 23 and 43 per cent) are recorded in Great Britain, Lithuania, Poland, Switzerland, Austria, Croatia, Bosnia and Yugoslavia. Only Denmark displays higher gains (up to 54 per cent).
Solidarity Scenario National Average Ratio (map 11)
Under the solidarity scenario, a comparison of the network approach with the do-nothing infrastructure strategy lead us to the following conclusions:
?? The smallest increases (between 2 and 5 per cent) are in Ukraine and Greece.
?? Most European countries display gains above 5 and below 13 per cent.
?? Moderate gains (between 13 and 20 per cent) are recorded in Great Britain, Sweden, Czech Republic, Hungary, Bulgaria, Russia and Belarus; gains between 21 and 30 per cent in Ireland, Norway, Switzerland, Austria, Slovakia, Croatia and Estonia.
?? Strongest gains (up to 71 per cent) were recorded in Denmark, Latvia, Lithiania, Poland, Yugoslavia and Bosnia.
Fragmentation Scenario National Average Ratio (map 12)
The ‘network’ infrastructure strategy performs the least well under the fragmentation scenario, however far from bad.
?? Countries with no or very small losses (under 4 per cent) in accessibility are Ireland, Scotland, Belgium, Austria and Greece.
?? Most European countries display rather small gains (between 1 and 4 per cent).
?? Moderate gains (between 4 and 11 per cent) are recorded in Denmark, Norway, Sweden, Ukraine, Turkey, Czech Republic, Hungary and Switzerland. More significant gains (between 11 and 25 per cent) are found in Finland, Poland, Romania, Bulgaria and Bosnia.
?? Strongest gains (up to 66 per cent) were found in Russia, Estonia, Latvia, Lithiania, Yugoslavia and Croatia.

CODE-TEN FINAL REPORT 98

CODE-TEN FINAL REPORT 99

CODE-TEN FINAL REPORT 100

CODE-TEN FINAL REPORT 101

CODE-TEN FINAL REPORT 102
Environmental and safety impacts
This section documents the results of the environmental and safety impact assessment. Analytically, the assessment covered the following indicators:
?? Carbon monoxide ?? Noise ?? Safety ?? Land take ?? Carbon dioxide ?? Nitrogen Oxide
We compare the results of the different infrastructure variants under the renaissance scenario and for the ‘network’ variant under the four external scenarios.
Environmental impacts under renaissance scenario
The following table summarises the environmental impacts for the different infrastructure variants and separately for the EU 15 (plus Norway and Switzerland) and for the C EEC / CIS.
Table 5. Environmental impacts under renaissance scenario
Renaissance CO Noise safety land take CO2 NOx (%, compared to do-nothing)
All-road EU + NO & CH 20,8 -0,1 21,2 0,2 25,6 23,5 CEEC + CIS 18,8 2,1 -8,9 3,2 0,7 -0,1 Total* 20,1 0,7 -6,7 1,1 17,3 11,0 All-rail EU + NO & CH -18,6 2,1 -13,6 0,0 -19,5 -17,4 CEEC + CIS -27,6 3,8 -41,5 0,0 -36,8 -36,2 Total* -21,7 2,8 -39,4 0,0 -25,3 -27,3 Network-approach EU + NO & CH -20,7 2,8 -13,9 0,0 -18,1 -21,3 CEEC + CIS -9,4 4,2 -32,5 2,8 -25,3 -25,7 Total* -16,9 3,3 -31,1 0,8 -20,6 -23,6 Road-priority EU + NO & CH 18,4 -1,4 23,7 0,0 27,1 25,0 CEEC + CIS 17,4 0,2 -1,4 2,8 4,1 3,0 Total* 18,1 -0,7 0,5 0,8 19,4 13,4 *Total as a weighted average Under the renaissance scenario, both the network strategy and the ‘all rail’ strategy give greener environmental results.

CODE-TEN FINAL REPORT 103
In the EU strong economic growth generating international long distance travel and freight transport produce high emission levels and a lower level of safety. Local air pollution increases as well as noise exposure, land take and global pollution.
In the CEEC, on the other hand, the road safety improves as the current quality and level of infrastructure is poor. In fact any kind of improvements in infrastructure in the CEEC will lead not only to an improvement in the safety benefits but also only to a minor increase in carbon dioxide and nitrogen oxide emissions. This is the case even with the road prioritising policies. However carbon monoxide increases both in the EU as well as in the CEEC and the CIS countries.
On the whole the rail strategy appears to be the best with the maximum reductions in carbon monoxide, safety, carbon dioxide and nitrogen oxide. However as far as impacts on noise are concerned, the road priority development alternative gives the most green results.
The following tables throw light on the winners and losers at the national level for each infrastructure variant

CODE-TEN FINAL REPORT 104
Table 6. Comparison of the Renaissance All-road variant with the do-nothing (%)
CDA1 CO Noise Safety Land take CO2 NOxAT 33,6 2,1 22,6 0,8 27,3 22,9BE -0,3 1,2 11,1 0,0 10,1 10,2DE 22,2 -0,9 24,0 0,1 37,6 33,8DK 12,1 1,0 9,9 0,0 8,9 6,9ES 31,6 1,3 52,0 0,3 47,4 42,7FI 4,1 1,8 10,3 -0,4 18,3 16,0FR 34,8 -5,8 24,1 0,2 30,6 26,5GR -25,7 -2,0 5,4 1,1 -1,4 -2,7IE 71,1 31,3 85,7 0,0 85,7 85,7IT 2,0 -2,6 2,3 0,0 3,6 2,3LU -1,0 -2,3 -13,7 0,0 3,3 2,0NL 16,2 9,3 32,3 0,0 39,9 40,2PT -6,5 12,7 24,1 2,0 39,9 37,2SE 9,1 2,9 38,9 1,0 28,7 25,7UK 86,1 2,7 19,3 0,0 23,3 23,7NO 18,6 4,1 19,2 0,0 18,1 17,0CH 23,1 4,0 45,8 0,0 83,4 78,5Albania 0,0 0,6 17,8 0,0 17,8 17,8Baltic countries 6,6 0,5 -14,1 2,5 -7,5 -8,1Bulgaria -3,0 -0,7 -13,1 1,9 -4,1 -4,4Czech Republik + Slovakia27,9 2,4 14,6 0,9 19,4 18,6Hungary 33,0 3,3 -10,0 3,7 4,8 2,7Poland 31,9 3,6 -7,7 3,4 6,0 5,3Romania 9,4 9,9 -15,5 2,3 -4,1 -4,9Russia 26,0 0,3 -8,0 6,3 1,5 0,5Former Yugoslavia 7,9 -0,6 -8,8 2,3 -4,3 -5,6Turkey 24,5 29,0 110,0 0,0 110,0 110,0totals 20,1 0,7 -6,7 1,1 17,3 11,0
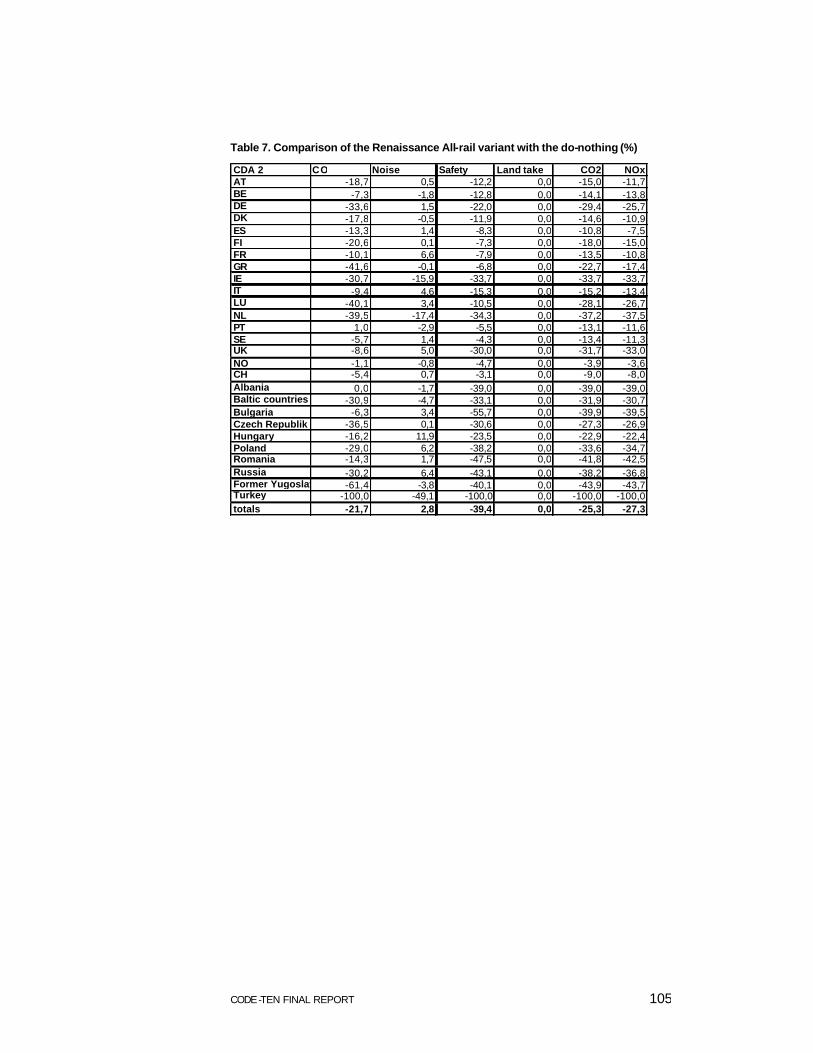
CODE-TEN FINAL REPORT 105
Table 7. Comparison of the Renaissance All-rail variant with the do-nothing (%)
CDA 2 CO Noise Safety Land take CO2 NOxAT -18,7 0,5 -12,2 0,0 -15,0 -11,7BE -7,3 -1,8 -12,8 0,0 -14,1 -13,8DE -33,6 1,5 -22,0 0,0 -29,4 -25,7DK -17,8 -0,5 -11,9 0,0 -14,6 -10,9ES -13,3 1,4 -8,3 0,0 -10,8 -7,5FI -20,6 0,1 -7,3 0,0 -18,0 -15,0FR -10,1 6,6 -7,9 0,0 -13,5 -10,8GR -41,6 -0,1 -6,8 0,0 -22,7 -17,4IE -30,7 -15,9 -33,7 0,0 -33,7 -33,7IT -9,4 4,6 -15,3 0,0 -15,2 -13,4LU -40,1 3,4 -10,5 0,0 -28,1 -26,7NL -39,5 -17,4 -34,3 0,0 -37,2 -37,5PT 1,0 -2,9 -5,5 0,0 -13,1 -11,6SE -5,7 1,4 -4,3 0,0 -13,4 -11,3UK -8,6 5,0 -30,0 0,0 -31,7 -33,0NO -1,1 -0,8 -4,7 0,0 -3,9 -3,6CH -5,4 0,7 -3,1 0,0 -9,0 -8,0Albania 0,0 -1,7 -39,0 0,0 -39,0 -39,0Baltic countries -30,9 -4,7 -33,1 0,0 -31,9 -30,7Bulgaria -6,3 3,4 -55,7 0,0 -39,9 -39,5Czech Republik + Slovakia-36,5 0,1 -30,6 0,0 -27,3 -26,9Hungary -16,2 11,9 -23,5 0,0 -22,9 -22,4Poland -29,0 6,2 -38,2 0,0 -33,6 -34,7Romania -14,3 1,7 -47,5 0,0 -41,8 -42,5Russia -30,2 6,4 -43,1 0,0 -38,2 -36,8Former Yugoslavia -61,4 -3,8 -40,1 0,0 -43,9 -43,7Turkey -100,0 -49,1 -100,0 0,0 -100,0 -100,0totals -21,7 2,8 -39,4 0,0 -25,3 -27,3

CODE-TEN FINAL REPORT 106
Table 8. Comparison of the Renaissance Network variant with the do-nothing (%)
CDA3 CO Noise Safety Land take CO2 NOxAustria -13,6 2,0 -1,2 0,0 -8,0 -4,8Belgium -10,2 -9,3 -30,5 0,0 -32,0 -31,6Germany -33,1 2,7 -22,2 0,1 -28,8 -25,5Denmark -29,0 -0,6 -13,3 0,0 -15,2 -11,4Spain -15,9 0,2 -27,8 0,0 -23,7 -19,9Finland -15,0 1,4 -2,4 0,2 -12,2 -10,3France -21,2 8,6 -18,3 0,0 -29,0 -25,4Greece -30,3 -2,7 -9,3 0,0 -21,7 -15,7Ireland -35,7 -18,8 -39,0 0,0 -39,0 -39,0Italy -4,5 9,0 14,5 0,0 19,1 -8,6Luxemburg -40,2 -6,2 -16,0 0,0 -30,0 -28,4the Netherlands-38,8 -17,3 -32,6 0,0 -35,9 -36,2Portugal -41,2 -6,1 -22,8 0,0 -46,2 -42,6Sweden -5,0 0,9 -3,6 0,0 -13,1 -11,5UK -6,4 3,0 -28,1 0,0 -28,8 -30,0Norway -1,5 -1,4 -6,0 0,0 -5,0 -4,6Switzerland -5,5 0,4 -4,7 0,0 -11,5 -10,4Albania 0,0 -1,7 -37,8 0,0 -37,8 -37,8Baltic countries-24,6 6,3 -35,5 1,2 -32,0 -29,8Bulgaria -9,3 -0,6 -28,3 1,9 -17,9 -17,6Czech Republik + Slovakia-26,1 -0,2 -31,2 0,8 -26,7 -26,8Hungary -17,3 7,3 -27,6 1,2 -28,3 -28,0Poland -8,7 4,8 -39,2 2,6 -30,0 -31,5Romania 0,0 -3,1 -30,7 2,3 -22,3 -22,6Russia 1,2 7,8 -31,7 6,3 -23,0 -23,7Former Yugoslavia-23,9 -5,6 -28,5 2,3 -27,6 -28,4Turkey -100,0 -4,6 -14,1 0,0 -14,1 -14,1totals -16,9 3,3 -31,1 0,8 -20,5 -23,6

CODE-TEN FINAL REPORT 107
Table 9. Comparison of the Renaissance road priority variant with do-nothing (%)
CDA11 CO Noise Safety Land take CO2 NOxAustria 23,7 0,8 20,2 0,0 22,5 18,2Belgium 5,2 1,5 14,5 0,0 12,4 12,5Germany 24,4 -1,1 24,9 0,1 37,5 33,6Denmark 13,1 1,4 9,8 0,0 8,7 6,6Spain 32,1 1,4 54,1 0,0 48,2 43,5Finland 9,2 2,5 5,3 0,2 9,6 8,1France 34,6 -10,3 30,8 0,0 36,6 31,9Greece -24,5 -1,1 6,6 0,0 -0,2 -1,5Ireland 74,5 32,6 90,0 0,0 90,0 90,0Italy 10,9 -4,1 9,1 0,0 9,4 8,1Luxemburg -0,5 -1,7 -12,7 0,0 5,5 4,1the Netherlands 11,3 14,5 23,8 0,0 31,7 31,8Portugal 2,1 10,6 25,0 0,0 39,9 37,3Sweden 10,4 2,2 19,2 0,0 24,3 22,7UK 9,6 5,4 29,7 0,0 29,7 30,7Norway 6,9 -0,4 7,2 0,0 7,6 6,8Switzerland 23,9 4,5 49,8 0,0 92,3 86,8Albania 0,0 0,8 21,0 0,0 21,0 21,0Baltic countries -5,5 -13,3 -16,4 1,2 -14,5 -15,5Bulgaria -1,9 0,2 -8,1 1,9 -2,2 -3,2Czech Republik + Slovakia26,5 1,1 12,3 0,8 16,6 15,8Hungary 13,2 0,7 3,9 1,2 5,8 5,9Poland 27,5 0,7 -0,2 2,6 9,1 8,5Romania 7,6 17,1 -20,2 2,3 -7,9 -9,0Russia 34,0 -1,7 3,1 6,3 12,5 10,6Former Yugoslavia 11,5 -1,9 -10,0 2,3 -5,4 -6,4Turkey 24,0 28,1 106,0 0,0 106,0 106,0totals 18,1 -0,7 0,5 0,8 19,4 13,4

CODE-TEN FINAL REPORT 108
Comparing ‘network’ approach under different external scenarios
The second scale of comparison is the network infrastructure strategy under various external scenarios – Renaissance, Dilution, Solidarity and Fragmentation. The Renaissance external scenario has the most green results. The global carbon monoxide results show the maximum decrease – the same is true for the regional impacts of carbon dioxide and nitrogen oxide. The fragmentation scenario shows the worst results with increases in carbon monoxide, carbon dioxide and nitrogen oxide.
The detailed results are presented in the following table.
Table 10. Environmental impacts of network infrastructure strategy
Network infrastructure
CO Noise Safety land take CO2 NOx
(%, compared to do-nothing) Renaissance EU + NO & CH -20,7 2,8 -13,9 0,0 -18,1 -21,3 CEEC + CIS -9,4 4,2 -32,5 2,8 -25,3 -25,7 Total* -16,9 3,3 -31,1 0,8 -20,6 -23,6 Dilution EU + NO & CH -20,4 -1,7 -15,1 0,0 -21,8 -19,7 CEEC + CIS -5,5 3,1 -31,3 2,8 -23,2 -23,6 Total* -15,2 0,1 -24,0 0,8 -22,2 -21,6 Solidarity EU + NO & CH -13,7 1,7 -11,8 0,0 -14,7 -13,6 CEEC + CIS 3,1 0,7 -14,2 2,8 -8,3 -19,3 Total* -8,2 1,3 -14,0 0,8 -12,7 -11,9 Fragmentation EU + NO & CH 2,8 -1,4 34,3 0,0 43,9 39,8 CEEC + CIS -0,1 -0,4 -18,0 2,8 -5,3 -8,0 Total* 20,3 -1,1 -15,2 0,8 24,2 11,2 *Total as a weighted average
Disaggregate descriptive analysis
Table 11 presents the impacts of the ten do-something corridor development alternatives in relation to the corresponding do-nothing scenario. The impacts are in raw quantity terms - no attempt has been made to monetise safety or environmental effects at this stage. With reference to investment costs, these have been scheduled over time and the corresponding benefits have likewise been calculated to reflect when the investment is assumed to have been made.

CODE-TEN FINAL REPORT 109
Table 11
Impacts of the 10 Do-Something CDAs
Investment Vehicle Operating Safety Noise Local Air Global Air Land Take Accessibility AccessibilityCosts Cost and Time Pollution Pollution (Econonomic) (Demographic)
Savings
km2
million euro million euro fatalities under 55dB(A) tonnes of NOX tonnes of CO2 km2
per annum (2015)
Compared with CDA 1 32 852 - 14 146 - 1 752 169 281 240 85 326 352 111 1.042 1.025do-nothing CDA 2 24 087 10 708 - 12 856 579 - 481 569 -100 927 463 0 0.971 0.995CDA 4 CDA 3 30 811 11 494 - 11 645 689 - 472 046 -88 123 083 65 0.997 0.962
CDA 11 16 426 - 14 378 - 840 98 278 141 84 946 588 89 0.992 0.988
Compared with CDA 12 30 811 11 940 - 6 858 - 93 - 374 647 -91 682 107 65 1.181 1.052do-nothing CDA 5 16 426 - 11 581 5 555 - 788 414 876 103 073 431 65 1.012 0.992CDA 6
Compared with CDA 7 30 811 7 663 - 4 921 264 - 175 549 -40 471 459 65 1.161 1.025do-nothing CDA 13 16 426 - 6 498 3 947 - 315 427 356 116 260 312 65 0.973 0.984CDA 8
Compared with CDA 14 30 811 15 113 - 5 115 258 - 32 954 405 627 65 1.054 1.017do-nothing CDA 9 16 426 - 11 366 3 947 - 315 394 405 127 197 512 65 0.986 0.993CDA 10
These results are for the Total Impact (EU+CEEC)
ratio of index in do-somethingto index in do-minimum
CODE-TEN FINAL REPORT 110
All the results are illustrative. The underlying modelling exercise can be regarded as a broad-brush attempt to predict outcomes and the assessment process has required further assumptions. Nevertheless, we believe that the results are sufficiently realistic to justify their use as an aid to policy debate.
The table can be read in at least the following two ways - either to compare the performance of a do-something corridor development alternative with the corresponding do-nothing, or to compare alternative do-something corridor development alternatives with each other. These are taken in turn.
Performance of a ‘do-something’ CDA vs. ‘do-nothing’
To begin with, consider CDA3, which assumes a ‘network’ approach to infrastructure improvement and an external scenario of ‘renaissance’ (i.e. fast European integration and high economic growth). This is an example of a corridor development alternative which performs relatively well on many of the performance indicators, compared with the corresponding do-nothing.
Investment costs. CDA3 has investment costs of approximately 30bn EURO. This is a very rough estimate of the costs, because the corridor development alternative is specified only in general terms. No allowance has been included for the costs of implementing any transport policy changes - these are unknown. Infrastructure costs for the Network Approach are assumed to consist of 50 per cent (by value) of all road projects, rail projects and projects on other modes.
VOCs and Time. In 2015, implementing CDA3 is predicted to yield vehicle operating costs and time savings of approximately 11.5bn EURO for transport users. At first sight, this may appear high relative to the investment costs of 30bn EURO, however there are a number of mitigating factors:
?? real values of vehicle operating costs and travel time savings increase with real incomes over time - the 1995 equivalent of 11.5bn EURO of savings in 2015 may be in the region of 8 -10bn EURO;
?? cost and time savings from new infrastructure typically grow over time as a consequence of traffic growth and rising congestion (in particular as compared to the ‘do nothing’ corridor development alternative). A realistic 1995 estimate of annual benefits may therefore be closer to 5bn EURO;
?? finally, as we pointed out above, the investment cost estimate is only for infrastructure costs, whereas the benefits are the consequence of the infrastructure changes and transport policy changes.
Considering these factors, the forecast vehicle operating cost and time benefits for the year 2015 do seem proportionate, given the stated investment cost.
Safety. CDA3 has significant benefits in terms of reducing fatal casualties. Approximately 11500 fatalities would be saved in the year 2015, which is

CODE-TEN FINAL REPORT 111
equivalent to double Poland’s annual total, or ten times Austria’s. It is worth bearing in mind that these figures relate only to road accidents. In principle, CDAs which are designed to shift a proportion of traffic to rail may lead to an increase in rail accidents. However, new rail infrastructure is likely to be safer than old, so the overall balance of advantage and disadvantage could point either way.
Noise. In CDA3, approximately 690km2 of land area experiences a reduction in noise levels from above to below the 55db(A) threshold. This is a net figure, so some areas may experience noise increases, whilst others (>690km 2) experience decreases. The overall noise improvement is likely to be a consequence of: traffic being concentrated on new routes; and modal shifts towards rail.
Air Pollution. CDA3 leads to significant reductions in NOx and CO2 emissions Europe-wide. Again, this appears plausible as a consequence of mode shift towards less polluting modes and an increased proportion of road traffic using modern routes with better flow characteristics than old single carriageway roads passing frequently through towns and villages. To get a handle on the meaning of these quantities (tonnes of NOx, tonnes of CO2) for human health and the environment, the CBA values applied in the next section may be helpful.
Land Take. Land take of CDA3 is approximately 65km2. This may lead to local impacts on ecology, heritage and the amenity of the land for human use which have not been modelled.
Accessibility. CDA3 is not alone in leading, on the GDP-based and population-based measures, to an overall reduction in accessibility. Given that CDA3 involves substantial expenditure on new and improved transport infrastructure, this result requires some explanation.
The way accessibility is measured is to estimate the value of GDP (or the size of resident population) accessible within a certain journey time from a particular point. For GDP, the journey is assumed to be a freight journey and the time threshold is 12 hours. For population, the journey is assumed to be a passenger journey and a 4 hour threshold is adopted. Then, to calculate the accessibility change for a particular region, the accessibility measure with the ‘do-something’ CDA is compared with the accessibility measure in the ‘do-nothing’ CDA. This gives a value of 1.0 for no change, >1 for accessibility improvement and <1 for accessibility reduction.
Accessibility is measured for each country. By taking a population-weighted average of countries’ accessibility measures, an overall European accessibility indicator has been calculated for the overall assessment.

CODE-TEN FINAL REPORT 112
The fact that the overall accessibility measure <1 for CDA3 (and others) hides the fact that at a more spatially disaggregate level, there is a mixed pattern of gains and losses. In general, there are significant accessibility gains close to the corridors with new infrastructure, but significant accessibility losses in adjacent countries which experience traffic growth and hence slower traffic speeds. Thus a side effect of the additional traffic induced by the policy and projects is to lower accessibility in those parts of the network that have not been improved. Bearing in mind that many western countries’ transport systems operate near to capacity at present, it is not surprising that improvements in Central and Eastern Europe could lead to substantial accessibility reductions in the west.
Of course, the numbers are approximate, and it would be wrong to claim that with absolute certainty that CDAs would reduce intra-European accessibility overall. However, we believe the analysis raises an interesting issue.
Comparisons between the ‘do-something’ CDAs
CDA3 (Renaissance, Network Approach) is one of the more successful ‘do-something’ corridor development alternative in terms of its performance against the indicators in the table above. It is noticeable that the ‘network approach’ out-performs the equivalent ‘priority road’ CDAs under all external scenarios on almost all indicators (the sole exception being demographic accessibility under CDA3, which is poorer than under ‘priority roads’ CDA11). Thus the comparisons CDA3 vs. CDA11, CDA12 vs. CDA5, CDA7 vs. CDA13 and CDA14 vs. CD9 all favour the network approach.
In fact, according to this analysis, the ‘priority road’ approach would have adverse consequences for European transport users overall in terms of vehicle operating costs and time, whatever the growth and integration scenarios.
In the Renaissance scenario (high economic growth, fast European integration) a wider range of ‘do-something’ corridor development alternatives was compared: ‘all road’ (CDA1); ‘all rail’ (CDA2); ‘network approach’ (CDA3) and ‘priority road’ (CDA11). It is noticeable from the results that:
?? the ‘all road’ scenario performed better than the ‘priority road’ scenario in terms of vehicle operating costs / time, safety, noise and accessibility, although not air pollution (local or global);
?? this was at the expense of increased investment costs for ‘all road’.
Comparing ‘all road’ (CDA1) with the ‘network approach’ (CDA3) it became clear that ‘all road’ is generally inferior, except in terms of accessibility. It is interesting that CDA1 offers higher accessibility yet inferior vehicle operating cost and time savings. This probably reflects methodological differences between the two streams of analysis - one is a network benefit calculation, while the other is a policy-led attractiveness measure.

CODE-TEN FINAL REPORT 113
Finally, CDA2 ‘all rail’ appears to offer the greatest benefits in terms of safety improvement, air pollution reduction and demographic accessibility. It is also cheaper than the ‘network approach’ (by an estimated 20%). However, it is slightly inferior in terms of VOC and time savings, noise reduction and GDP accessibility.
Monetary Valuation
Monetary valuation forms the second step towards an overall assessment and ranking of the CDAs in the style of EUNET. As already indicated in the previous chapter, monetary values for safety, noise, local air pollution and global air pollution were taken from state -of-the-art review sources including ExternE (Bickel et al, 1997), ECMT (1995) and EUNET (Nellthorp, Mackie and Bristow, 1998), and were applied to the quantity data in the disaggregate descriptive analysis.

CODE-TEN FINAL REPORT 114
Table 12
Indicative Costs and Benefits based onImpacts of the 10 Do-Something CDAs NON-CBA IMPACTS
Investment Vehicle Operating Safety Noise Local Air Global Air Land Take Accessibility AccessibilityCosts Cost and Time Pollution Pollution (Econonomic) (Demographic)
Savings
million euro million euro million euro million euro million euro million euro km 2
Compared with CDA 1 32 852 - 14 146 2 172 6 - 2 081 - 6 826 111 1.042 1.025do-nothing CDA 2 24 087 10 708 15 938 22 3 564 8 074 0 0.971 0.995CDA 4 CDA 3 30 811 11 494 14 437 26 3 493 7 050 65 0.997 0.962
CDA 11 16 426 - 14 378 1 042 4 - 2 058 - 6 796 89 0.992 0.988
Compared with CDA 12 30 811 11 940 8 503 - 3 2 772 7 335 65 1.181 1.052do-nothing CDA 5 16 426 - 11 581 - 6 887 - 29 - 3 070 - 8 246 65 1.012 0.992CDA 6
Compared with CDA 7 30 811 7 663 6 101 10 1 299 3 238 65 1.161 1.025do-nothing CDA 13 16 426 - 6 498 - 4 894 - 12 - 3 162 - 9 301 65 0.973 0.984CDA 8
Compared with CDA 14 30 811 15 113 6 342 10 244 - 32 65 1.054 1.017do-nothing CDA 9 16 426 - 11 366 - 4 894 - 12 - 2 919 - 10 176 65 0.986 0.993CDA 10
These results are for the Total Impact (EU+CEEC).With the exception of Investment Costs, all positive entries indicate benefits and negative entries indicate disbenefits.
ratio of index in do-somethingto index in do-minimum
per annum (2015) per annum (2015)

CODE-TEN FINAL REPORT 115
Table 12 reports the results of applying the central estimate (mean) monetary values from the literature. This gives a guide to the pattern of benefits and disbenefits in one future year, 2015, although again it should be emphasised that the results are illustrative. The relative importance of vehicle operating cost and time savings, safety, noise and air pollution effects can now be seen. Noise effects are clearly insignificant. Local air pollution is a small but significant impact of the various corridor development alternatives. However, the annual costs and benefits are dominated by vehicle operating cost and time savings as well as global air pollution impacts, both of which can be in a positive or negative direction depending on the corridor development alternative.
Three impacts were excluded from this step in the process. Environmental effects of land take are heterogeneous and do not lend themselves to monetary valuation, whilst accessibility was not monetised, in line with conventional practice in transport economics.
One characteristic of the environmental values adopted here is that they have wide confidence intervals. The confidence limits are known, however, and this information was used to conduct a sensitivity analyses, examining the effect of assuming high or low environmental values, rather than the mean. The high values correspond to the upper 95% confidence limit; the low values to the lower 95% conifdence limit. Tables 13 and 14 give the results of these tests. In summary, it appears that the annual costs and benefits may be swamped by the local and global air pollution impacts if the upper bound values are correct. However, with the low values in place, the environmental effects appear insignificant.

CODE-TEN FINAL REPORT 116
Table 13
Indicative Costs and BenefitsHIGH ENVIRONMENTAL VALUES NON-CBA IMPACTS
Investment Vehicle Operating Safety Noise Local Air Global Air Land Take Accessibility AccessibilityCosts Cost and Time Pollution Pollution (Econonomic) (Demographic)
Savings
million euro million euro million euro million euro million euro million euro km 2
Compared with CDA 1 32 852 - 14 146 2 172 157 - 52 029 - 552 915 111 1.042 1.025do-nothing CDA 2 24 087 10 708 15 938 540 89 090 654 010 0 0.971 0.995CDA 4 CDA 3 30 811 11 494 14 437 642 87 329 571 038 65 0.997 0.962
CDA 11 16 426 - 14 378 1 042 91 - 51 456 - 550 454 89 0.992 0.988
Compared with CDA 12 30 811 11 940 8 503 - 87 69 310 594 100 65 1.181 1.052do-nothing CDA 5 16 426 - 11 581 - 6 887 - 735 - 76 752 - 667 916 65 1.012 0.992CDA 6
Compared with CDA 7 30 811 7 663 6 101 247 32 477 262 255 65 1.161 1.025do-nothing CDA 13 16 426 - 6 498 - 4 894 - 294 - 79 061 - 753 367 65 0.973 0.984CDA 8
Compared with CDA 14 30 811 15 113 6 342 240 6 097 - 2 628 65 1.054 1.017do-nothing CDA 9 16 426 - 11 366 - 4 894 - 294 - 72 965 - 824 240 65 0.986 0.993CDA 10
These results are for the Total Impact (EU+CEEC).With the exception of Investment Costs, all positive entries indicate benefits and negative entries indicate disbenefits.
ratio of index in do-somethingto index in do-minimum
per annum (2015) per annum (2015)

CODE-TEN FINAL REPORT 117
Table 14
Indicative Costs and BenefitsLOW ENVIRONMENTAL VALUES NON-CBA IMPACTS
Investment Vehicle Operating Safety Noise Local Air Global Air Land Take Accessibility AccessibilityCosts Cost and Time Pollution Pollution (Econonomic) (Demographic)
Savings
million euro million euro million euro million euro million euro million euro km 2
Compared with CDA 1 32 852 - 14 146 2 172 0.08 - 83 - 84 111 1.042 1.025do-nothing CDA 2 24 087 10 708 15 938 0.26 143 100 0 0.971 0.995CDA 4 CDA 3 30 811 11 494 14 437 0.31 140 87 65 0.997 0.962
CDA 11 16 426 - 14 378 1 042 0.04 - 82 - 84 89 0.992 0.988
Compared with CDA 12 30 811 11 940 8 503 -0.04 111 91 65 1.181 1.052do-nothing CDA 5 16 426 - 11 581 - 6 887 -0.35 - 123 - 102 65 1.012 0.992CDA 6
Compared with CDA 7 30 811 7 663 6 101 0.12 52 40 65 1.161 1.025do-nothing CDA 13 16 426 - 6 498 - 4 894 -0.14 - 126 - 115 65 0.973 0.984CDA 8
Compared with CDA 14 30 811 15 113 6 342 0.12 10 0 65 1.054 1.017do-nothing CDA 9 16 426 - 11 366 - 4 894 -0.14 - 117 - 126 65 0.986 0.993CDA 10
These results are for the Total Impact (EU+CEEC).With the exception of Investment Costs, all positive entries indicate benefits and negative entries indicate disbenefits.
ratio of index in do-somethingto index in do-minimum
per annum (2015) per annum (2015)

CODE-TEN FINAL REPORT 118
An illustrative cost-benefit analysis
The previous two steps have maintained a disaggregate perspective on the various impacts of the CODE-TEN CDAs. If one corridor development alternative dominated another on all performance indicators, it could be confidently said to be better. However, that type of dominance did not emerge: different CDAs appear to have different combinations of advantages and disadvantages.
In order to provide an overall comparison between corridor development alternatives, a rationale is needed to aggregate the various impacts into an overall indicator of performance, which can be estimated for each ‘do-something’ CDA. The first of two aggregation steps (and the third step in the process overall) is to construct an illustrative cost-benefit analysis (CBA), aggregating the various monetised impacts. This requires a number of additional assumptions, including for example the assumption of a discount rate (6% is used); an appraisal period (1999 to 2039) and investment profiles (taken from TINA documentation). In general, the CBA conforms to the method set out in detail in EUNET Deliverables D9 and D16 (Nellthorp, Mackie and Bristow, 1998; Grant-Muller et al., 1999).
The following table provides the indicative CBA results for the assessment of the corridor development alternatives – mean values for environmental effects are assumed
Table 15. CBA Results (1)
CDA NPV, million EURO Rank (1=best) Renaissance 1 -190417 7 2 264702 1 3 244188 2 11 -183926 6 Dilution 5 199473 3 7 -241107 10 Solidarity 7 107560 5 13 -195492 8 Fragmentation 14 134548 4 9 -237863 9 *assuming mean values for environmental effects
Table 15 gives the results of the illustrative CBA in the form of a summary Net Present Value (NPV) for each corridor development alternative and a ranking of the 10 alternative ‘do-something’ alternatives. It is apparent that if the

CODE-TEN FINAL REPORT 119
Renaissance scenario were to become a reality, the ‘all rail’ and ‘network’ approach options could be expected to perform best overall, within the confines of the CBA. Furthermore, whatever the external scenario, the ‘network’ approach gives a better overall cost-benefit performance than ‘priority road’. However, 5 of the 10 corridor development alternatives do not achieve a positive NPV at 6% discount. It is also worth bearing in mind that each CDA comprises infrastructure changes and transport policy changes, and the latter may impose additional costs which have not yet been estimated.
In order to check the sensitivity of the findings, the next table shows the results of repeating the aggregate cost-benefit analysis for the high and low environmental values. It is interesting that whilst there are some changes in ranking, the same two infrastructure options (‘all rail’ followed by ‘network’ approach) emerge as the best.
Table 16. CBA results (2) High vs. Low environmental values
CDA Ranking (1 = best) High environmental values Low environmental values Renaissance 1 7 8 2 1 1 3 3 2 11 6 7 Dilution 12 2 4 5 8 10 Solidarity 7 4 5 13 9 6 Fragmentation 14 5 3 9 10 9 Note: High and Low correspond to the upper and lower 95% confidence limits on the values for noise, local air pollution and global air pollution
An Overall Assessment: MCA/CBA
In the final section, the CBA results are extended by merging CBA and a simple linear additive multicriteria evaluation model. As with the data used previously, it is felt that the analysis is realistic and the outcome of the analysis is plausible. However, the policy weights, while defensible, have not been derived from interaction with individuals with responsibility for policy formulation. Thus the overall weights and the resulting ranking of corridor development alternatives must be seen as purely illustrative.

CODE-TEN FINAL REPORT 120
Derivation of the weights. The set of impacts used in the present application of DECODE are effectively a sub-set of those recommended by EUNET for its project-level analysis. This stems in part from the much larger physical and financial scale of the CODE-TEN options and in part from the need to make some simplifications in the process of modelling traffic flows and other key data items.
Since the set of impacts to be incorporated in the assessment is not identical to the EUNET impacts, it was decided not to apply the EUNET computer package to evaluate CDAs in CODE-TEN, but to undertake a separate analysis which is directly equivalent to the CBA/MCA in EUNET, but which uses simple ‘pricing out’ (Keeney and Raiffa, 1976) to establish the relative weights given to non-monetised impacts. While this affects the aggregate numerical MCA scores received by corridor development alternatives, it yields identical results in terms of their ranking. Weights were established on the basis of expert judgement of people with substantial experience of transport project appraisal.
In terms of land take, the analysis is relatively straightforward, in that the view was taken that each unit of land take (km2) had the same marginal impact, irrespective of the overall impact. In other words, the overall effect of land take is simply proportional to the amount (in km 2) of land take recorded against each corridor development alternative. The judgement reached was that each unit of land take should attract a weight of 0.125 relative to a weight of 1.0 attached to a million EURO of CBA impact.
For accessibility, the issue is less straightforward. A number of assumptions have been made. First, the same weight has been applied to both economic and demographic accessibility changes. This is essentially for simplicity of analysis in this preliminary application of the methodology. However, it is worth noting that, in this data set, correlation between scores on the two types of accessibility measure is quite strong, so that it is unlikely that differential weighting of the two accessibility measures would itself have a significant impact on CDA ranking. Secondly, it has also been assumed that gains and losses in accessibility are treated equally. This is certainly open to debate. It is not necessarily the case that society would evaluate a decline from existing accessibility levels of a given percentage the same as an equal percentage rise in accessibility.
Most importantly, however, it is important to note that accessibility is assessed as a percentage change from a base-line, not as an absolute gain or loss. This is different from all other impacts in this evaluation and introduces a non-linearity into an otherwise linear model. To deal with what could otherwise be a potential distortion, what is necessary here is to convert the measured percentage change in accessibility onto a linear scale using a simple (non-linear) mathematical transformation curve. This is standard practice within decision analysis (see, e.g., Goodwin and Wright, 1998) where non-linearities
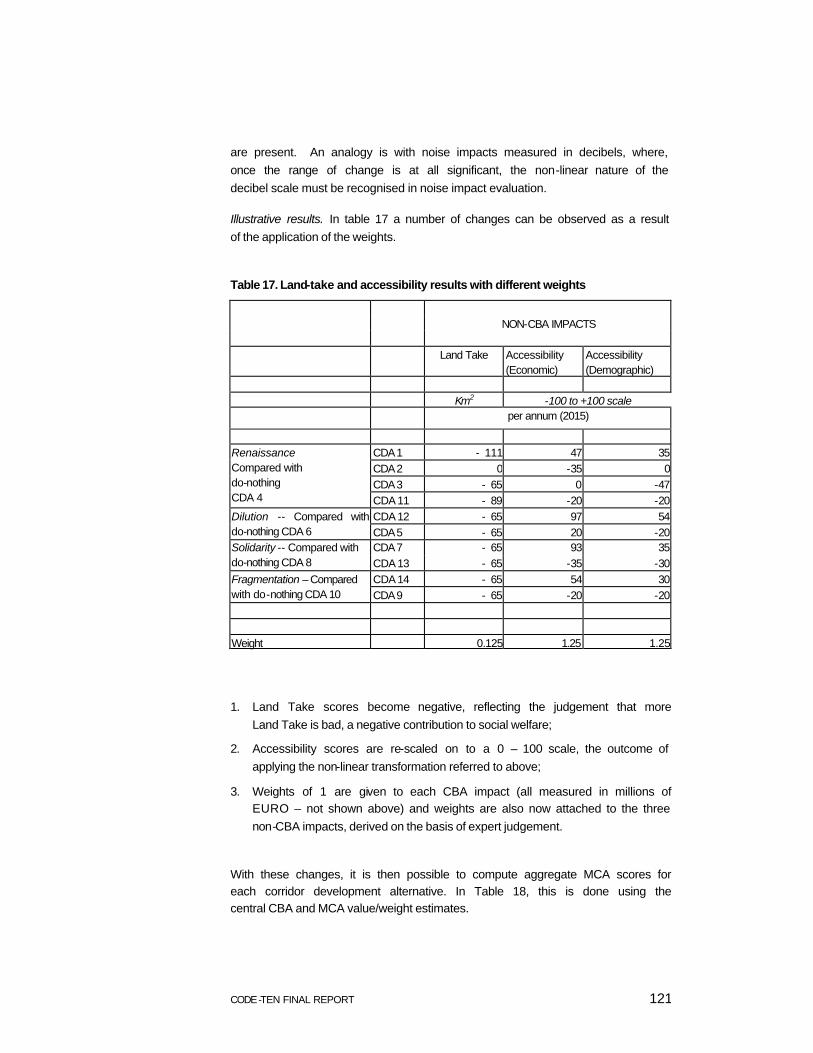
CODE-TEN FINAL REPORT 121
are present. An analogy is with noise impacts measured in decibels, where, once the range of change is at all significant, the non-linear nature of the decibel scale must be recognised in noise impact evaluation.
Illustrative results. In table 17 a number of changes can be observed as a result of the application of the weights.
Table 17. Land-take and accessibility results with different weights
NON-CBA IMPACTS Land Take Accessibility
(Economic) Accessibility (Demographic)
Km2 -100 to +100 scale per annum (2015)
CDA 1 - 111 47 35 CDA 2 0 -35 0 CDA 3 - 65 0 -47
Renaissance Compared with do-nothing CDA 4 CDA 11 - 89 -20 -20
CDA 12 - 65 97 54 Dilution -- Compared with do-nothing CDA 6 CDA 5 - 65 20 -20
CDA 7 - 65 93 35 Solidarity -- Compared with do-nothing CDA 8 CDA 13 - 65 -35 -30
CDA 14 - 65 54 30 Fragmentation – Compared with do-nothing CDA 10 CDA 9 - 65 -20 -20
Weight 0.125 1.25 1.25
1. Land Take scores become negative, reflecting the judgement that more Land Take is bad, a negative contribution to social welfare;
2. Accessibility scores are re-scaled on to a 0 – 100 scale, the outcome of applying the non-linear transformation referred to above;
3. Weights of 1 are given to each CBA impact (all measured in millions of EURO – not shown above) and weights are also now attached to the three non-CBA impacts, derived on the basis of expert judgement.
With these changes, it is then possible to compute aggregate MCA scores for each corridor development alternative. In Table 18, this is done using the central CBA and MCA value/weight estimates.

CODE-TEN FINAL REPORT 122
Table 18. Aggregate MCA scores
CDA Rank (1 = best) Renaissance 1 7 2 1 3 2 11 6 Dilution 12 3 5 10 Solidarity 7 5 13 8 Fragmentation 14 4 9 9 Note: assumes mean values and weights
A number of observations can be made. First, the influence of land take on the overall ranking of corridor development alternatives is minimal, given the quantities involved and the weight attached to land take. Secondly, with the weights currently attached to accessibility, its influence, too, is limited. The ranking of corridor development alternatives is identical to that in the pure CBA assessment. However, accessibility is a particularly difficult item to evaluate and would, in a full implementation of DECODE, be subject to much deeper analysis than has been applied here. Very crudely, the weighting used assumes that a 20% gain in accessibility across Europe is seen as worth achieving as long as the cost is only about 100 extra fatalities, again over the network as a whole.
Comparisons between abstract notions like accessibility and the reality of a human being losing his or her life are never easy or comfortable. However, if not explicit, they are inevitably implicit in every major transport investment or policy choice. It is thus important to explore the sensitivity of the judgements made about the relative desirability of accessibility gains and losses to changes in the value given to them. The following tables repeat the previous analysis, but using weights 10 and 100 times those used initially.

CODE-TEN FINAL REPORT 123
Table 19. Overall Assessment with 10x Accessibility Weights
CDA Rank (1 = best) Renaissance 1 6 2 1 3 2 11 7 Dilution 12 3 5 9 Solidarity 7 5 13 8 Fragmentation 14 4 9 10 Table 20. Overall Assessment with 100x Accessibility Weights
CDA Rank (1 = best) Renaissance 1 6 2 2 3 5 11 7 Dilution 12 1 5 8 Solidarity 7 3 13 9 Fragmentation 14 4 9 10
As can be seen, the 10-fold increase makes some differences to the ranking. In particular, the rankings of ‘all road’ and ‘priority road’ are reversed - if greater weight is placed on the accessibility criterion, the slimmer ‘priority road’ approach is preferred. We would speculate that this is because the accessibility measure is more sensitive to induced traffic and congestion than the vehicle operating cost and time savings measure.
The 100-fold increase changes the ranking of ‘all rail’ under the renaissance scenario from 1 to 2 for the first time. Instead, the ‘network’ approach under the dilution scenario becomes the best-performing corridor development alternative.

CODE-TEN FINAL REPORT 124
Thus in principle, giving a greater policy weight to accessibility improvements certainly does change the view on the relative attractiveness of some of the corridor development alternatives. However, even with the 100 times accessibility weights in place, the ranking of the ‘network’ and ‘priority road’ approaches for any external scenario remains the same.
Therefore to conclude, subject to the range of assumptions and simplifications alluded to throughout this chapter, the analysis suggests that a decision to choose the ‘network’ approach over the ‘priority road’ approach is likely to be robust to a wide range of possible environmental values and policy weights. Under the renaissance external scenario, the ‘all rail’ solution appears even more attractive, but there is no guarantee that the renaissance scenario will arise - in its absence, the relative overall performance of ‘all rail’ is unknown.
Measurement of impacts against policy goals
The results of the PAM are analysed in aggregate form, i.e. with a weighted sum of the scores across all policy areas. These aggregated scores have been estimated for each of the corridor development alternatives.
Different weightings of policy areas have been developed to reflect different interested parties. The analysis of results has been made relative to two groups of policy perspective.
The first are the transport policy scenarios. These can be seen as policy scenarios of the future from the perspective of the European Community, and have been used to determine some of the specifications associated with each development alternative.
The second are the current national policy perspectives of the stakeholder countries. They are used to indicate the acceptability of transport initiatives to the countries concerned.
The impacts have been aggregated and measured with respect to each country, and results are produced at the country level. This is appropriate because some of the interested parties are national governments who are assumed primarily to be interested in impacts in their own country. The transport policy scenarios may be taken to represent alternative future policies of the Community, but analysis with respect to a transport policy scenario at the level of the member state, including future members, is also of interest.
Not all countries have been considered in the analysis. The countries included represent part of at leas t one of the corridors being considered, and have transport networks that are sufficiently well defined to produce realistic traffic routing alternatives.
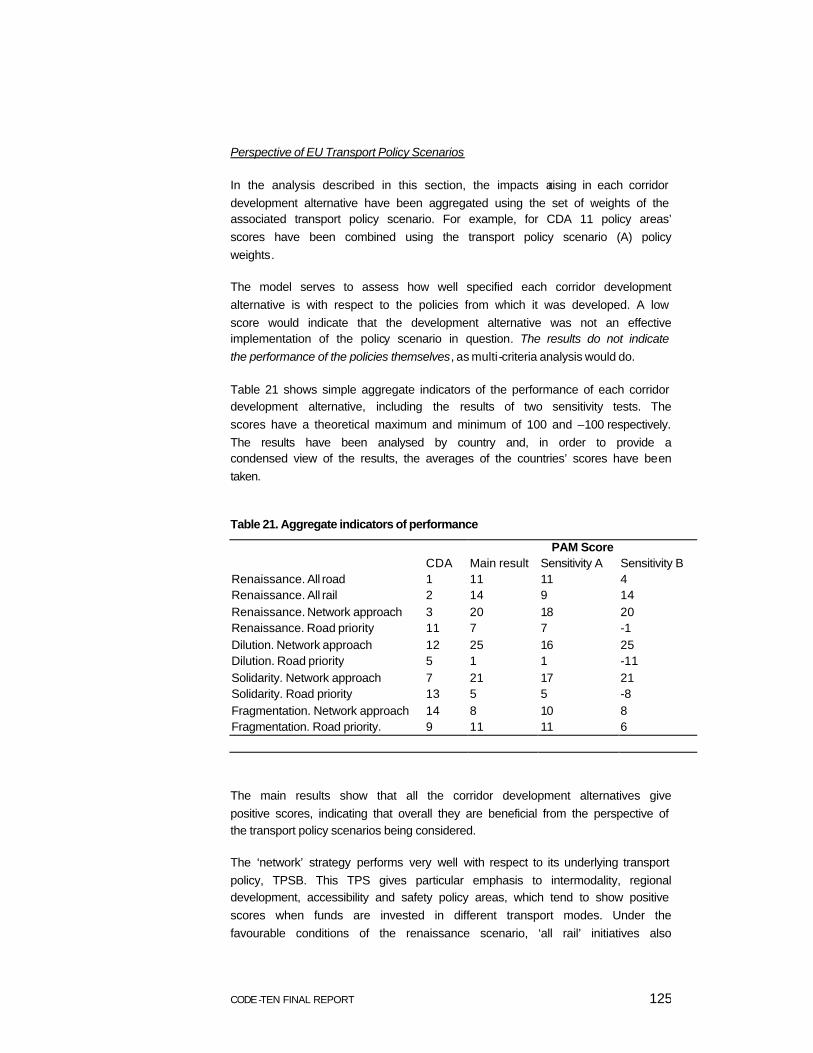
CODE-TEN FINAL REPORT 125
Perspective of EU Transport Policy Scenarios
In the analysis described in this section, the impacts arising in each corridor development alternative have been aggregated using the set of weights of the associated transport policy scenario. For example, for CDA 11 policy areas’ scores have been combined using the transport policy scenario (A) policy weights.
The model serves to assess how well specified each corridor development alternative is with respect to the policies from which it was developed. A low score would indicate that the development alternative was not an effective implementation of the policy scenario in question. The results do not indicate the performance of the policies themselves, as multi -criteria analysis would do.
Table 21 shows simple aggregate indicators of the performance of each corridor development alternative, including the results of two sensitivity tests. The scores have a theoretical maximum and minimum of 100 and –100 respectively. The results have been analysed by country and, in order to provide a condensed view of the results, the averages of the countries’ scores have been taken.
Table 21. Aggregate indicators of performance
PAM Score CDA Main result Sensitivity A Sensitivity B Renaissance. All road 1 11 11 4 Renaissance. All rail 2 14 9 14 Renaissance. Network approach 3 20 18 20 Renaissance. Road priority 11 7 7 -1 Dilution. Network approach 12 25 16 25 Dilution. Road priority 5 1 1 -11 Solidarity. Network approach 7 21 17 21 Solidarity. Road priority 13 5 5 -8 Fragmentation. Network approach 14 8 10 8 Fragmentation. Road priority. 9 11 11 6
The main results show that all the corridor development alternatives give positive scores, indicating that overall they are beneficial from the perspective of the transport policy scenarios being considered.
The ‘network’ strategy performs very well with respect to its underlying transport policy, TPSB. This TPS gives particular emphasis to intermodality, regional development, accessibility and safety policy areas, which tend to show positive scores when funds are invested in different transport modes. Under the favourable conditions of the renaissance scenario, ‘all rail’ initiatives also
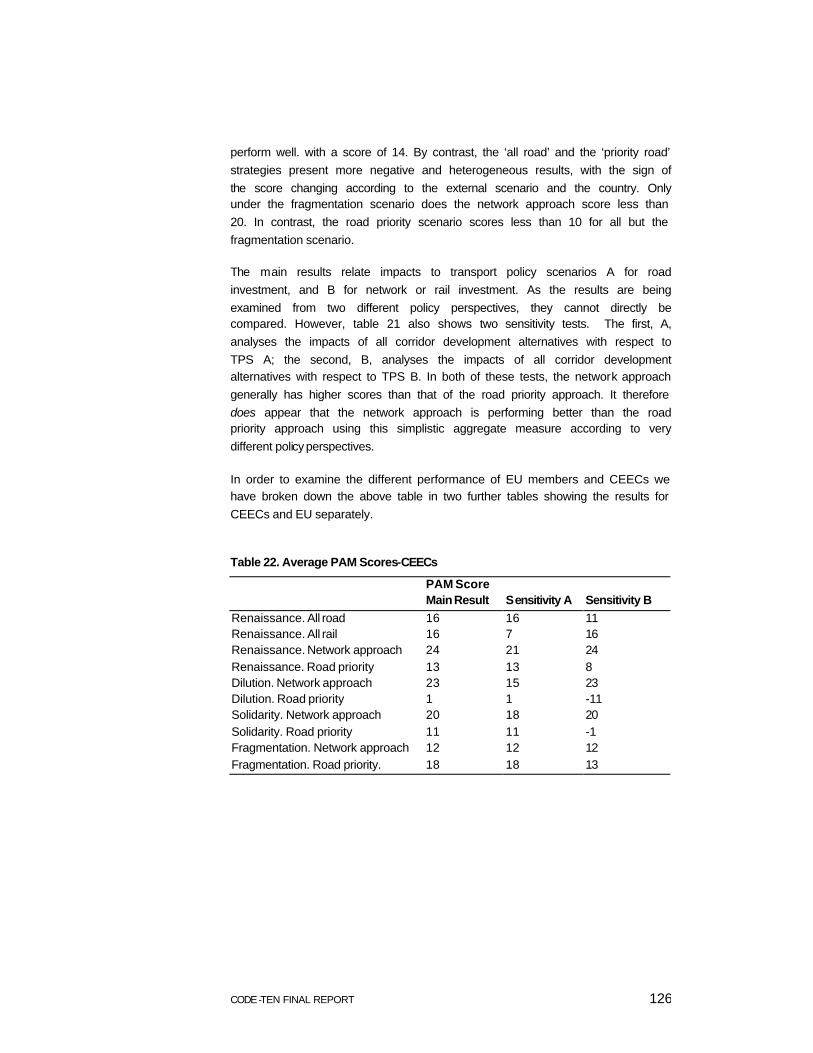
CODE-TEN FINAL REPORT 126
perform well. with a score of 14. By contrast, the ‘all road’ and the ‘priority road’ strategies present more negative and heterogeneous results, with the sign of the score changing according to the external scenario and the country. Only under the fragmentation scenario does the network approach score less than 20. In contrast, the road priority scenario scores less than 10 for all but the fragmentation scenario.
The main results relate impacts to transport policy scenarios A for road investment, and B for network or rail investment. As the results are being examined from two different policy perspectives, they cannot directly be compared. However, table 21 also shows two sensitivity tests. The first, A, analyses the impacts of all corridor development alternatives with respect to TPS A; the second, B, analyses the impacts of all corridor development alternatives with respect to TPS B. In both of these tests, the network approach generally has higher scores than that of the road priority approach. It therefore does appear that the network approach is performing better than the road priority approach using this simplistic aggregate measure according to very different policy perspectives.
In order to examine the different performance of EU members and CEECs we have broken down the above table in two further tables showing the results for CEECs and EU separately.
Table 22. Average PAM Scores-CEECs
PAM Score Main Result Sensitivity A Sensitivity B
Renaissance. All road 16 16 11 Renaissance. All rail 16 7 16 Renaissance. Network approach 24 21 24 Renaissance. Road priority 13 13 8 Dilution. Network approach 23 15 23 Dilution. Road priority 1 1 -11 Solidarity. Network approach 20 18 20 Solidarity. Road priority 11 11 -1 Fragmentation. Network approach 12 12 12 Fragmentation. Road priority. 18 18 13

CODE-TEN FINAL REPORT 127
Table 23. Average PAM Scores-EU
PAM Score Main Result Sensitivity A Sensitivity B
Renaissance. All road 4 4 -6 Renaissance. All rail 11 11 11 Renaissance. Network approach 16 13 16 Renaissance. Road priority -2 -2 -14 Dilution. Network approach 27 17 27 Dilution. Road priority -1 -1 -12 Solidarity. Network approach 22 15 22 Solidarity. Road priority -4 -4 -18 Fragmentation. Network approach 3 7 3 Fragmentation. Road priority. 0 0 -5
The most significant difference between these two groups of countries is that while CEECs present positive scores under all the possible corridor development alternatives, EU shows negative results for CDAs 11, 5 and 13. These three CDAs correspond to the ‘priority road’ approach under the Renaissance, Dilution and Solidarity external scenarios. Consequently, only under the fragmentation scenario does the road approach seem to be a viable alternative for EU countries.
CEEC average scores tend to be higher than EU average scores. The only exceptions are CDAs 12 and 7 – both network approach CDAs. In these cases the EU average score is slightly higher than the CEEC score.
For EU countries, the network approach always performs better than the road alternatives. Regarding CEECs, the same is true, with the exception of the fragmentation scenario where road priority performs better than the network approach.
The results follow a similar pattern to the one described above when the sensitivity test A is carried out. Regarding sensitivity test B, CEECs present negative average scores in two cases – CDAs 5 and 13 – which correspond to the ‘priority road’ approach under the dilution and solidarity scenarios. EU countries present negative scores for CDAs 1, 11, 5 and 13. CDA 1, which represents the ‘all-road’ approach under the renaissance scenario, was positive in the general case.
Figures 1-4 shows a breakdown of the different policy areas for the network approach and road priority approach under different external scenarios. The scores are weighted according to TPS B and TPS A respectively. The network approach tends to do relatively well in many of the policy areas. It performs less well with respect to internal pricing and, in some cases, infrastructure investment. The road priority approach is in conflict with many policies, including those related to the environment, reducing road transport and

CODE-TEN FINAL REPORT 128
transport safety. However, in TPS A, these are policies that have low priority and hence low weighted scores.
Both infrastructure scenarios perform well with respect to increasing cross-border traffic, but whilst TPS A considers the policy area to be of high priority, TPS B does not. Hence a large scores is gained for this policy area with respect to road CDAs only. TPSA puts more emphasis on policy areas concerning the financial viability of the projects. The scores in this area tend to be low: experience in the CEEC, for example toll roads in Hungary, has shown that currently many infrastructure schemes require large public sector investment without much expectation of financial return. The financial performance of the developments is also not clearly defined, meaning that the associated scores are subject to higher uncertainty.
In summary, these results suggest that the network approach performs well from the perspective of TPS type B, though this by no means implies that it performs optimally. From the perspective of a TPS typ e A, an infrastructure strategy that concerns exclusively road transport is not advised, and a substantive revision to the infrastructure strategy is merited.

CODE-TEN FINAL REPORT 129

CODE-TEN FINAL REPORT 130

CODE-TEN FINAL REPORT 131

CODE-TEN FINAL REPORT 132

CODE-TEN FINAL REPORT 133
National Policy Perspectives
The results presented in this section are derived from the application of the National Transport Policy weights to the different scores obtained from the measurement of the impacts. These weights were determined by examining the priority of the different policy areas in the national transport policies of European countries.
These results seek to reflect the acceptability of each CDA for each national government. Each CDA can be compared with each other, as the same policy perspectives are used in each case. They can be viewed together with the results of the previous section to infer the difference in attitude of different policy perspectives: those of national governments and future EU policy. Very different performance between these two areas would suggest very different policy perspectives, which should in any case be revealed by comparison of the weights given to each policy area.
The results for this assessment are shown in the following ten maps (maps 13 to 22). The scores have been colour coded. In each case the theoretical maximum and minimum scores are +100 and –100 respectively. As explained earlier, only countries central to the corridors and network specification have been included.
In common with the findings in the previous section, it is clear that the network approach performs better in most of the external scenarios. This means that diversification of the investment in different types of infrastructure would appear to have greater success in achieving national transport policy objectives. It is also the case that rail investment, CDA2, performs well in the Renaissance scenario. These findings are perhaps counter-intuitive: road transport it is typically thought to have substantially larger economic benefits, which is an important consideration in almost any transport policy, even though it has some greater detrimental effects also. The success of the rail mode in this analysis has been discussed elsewhere, and some points are made here also.
The BTM model shows rail to be highly successful, and strategies with rail investment reveal a large modal shift from road to rail, in contrast to observed recent trends. These findings should be reviewed and treated with caution.
Road priority investments are forecast to produce extensive congestion relative to their respective do nothing cases. This is particularly the case in western Europe with many severe negative impacts being identified. The extent of this phenomenon should be viewed critically in view of the shortcomings of the traffic flow and assignment model. Nevertheless, this is also not an unlikely outcome: Investment in some road schemes encourages greater overall use of the road system. Failure to invest in railways leads to decreasing rail service quality and therefore loss of business from rail, which shifts to road, thereby

CODE-TEN FINAL REPORT 134
worsening congestion. Even if the new roads help cut congestion in their immediate vicinity, the greater road dependence of the countries’ transport demand may lead to significantly worse congestion on other parts of the road network and so to more congestion overall.

CODE-TEN FINAL REPORT 135

CODE-TEN FINAL REPORT 136

CODE-TEN FINAL REPORT 137

CODE-TEN FINAL REPORT 138

CODE-TEN FINAL REPORT 139

CODE-TEN FINAL REPORT 140

CODE-TEN FINAL REPORT 141

CODE-TEN FINAL REPORT 142

CODE-TEN FINAL REPORT 143

CODE-TEN FINAL REPORT 144

CODE-TEN FINAL REPORT 145
Another interesting pattern revealed by the analysis is the difference in results between the CEEC and the EU member states represented for the road-based strategies. The differences noted between tables 22 and 23 are similar to noticeable patterns in this analysis. Under most external scenarios (CDA1, 9, 11, 13; the exception is CDA 5) the CEEC find road-based strategies moderately beneficial, whereas western Europe finds them detrimental. This can be attributed both to the impacts experience amongst the two groups, with western Europe suffering particularly from the negative effects of increased road transport, but also the different policy focuses of the two sides. The CEEC transport policy areas tend to be more akin to TPS A, which is more sympathetic to a road based approach than other policy scenarios.
As might be expected, the network approach is at its most robust for the high growth scenarios. It is only in the fragmentation scenario, of low growth and low integration, that the benefits begin to appear more marginal. In contrast, a road based approach is poor under all scenarios, though detailed analysis of the results suggest that it performs best in the scenario of fragmentation.
For some of the scenarios particular countries perform rather differently from their neighbours:
Austrian national transport policy is interpreted to be similar to TPS B. However the opportunities for transport to divert to new road investment in other countries under the road priority scenarios means that, in some cases (cf. CDA 1, 3, 11, 14), it is sympathetic to a road based approach.
The complement to the above observation is that the Czech Republic – an alternative transport route to that of Austria – as well as Slovakia are less in favour of road based strategies than many of the other CEEC (cf. CDA 1, 5, 11, 13).
Though Italy’s and Spain’s national policies are interpreted to be close to that of TPS A, which is more sympathetic to road infrastructure, they have low scores in many of its priority areas. Instead the critical factors are intermodality, the environment and safety. Hence they tend to favour more public transport investment under some external scenarios.
Romania and Bulgaria have similar score to that of Italy and also favour policies that are typically associated with road transport. However better performance of rail in some cases is partly attributed to the superior performance of rail relative to road with respect to safety – one of the highest priority policy areas.
Slovenia shows rather different patterns to the rest of the CEEC and achieves high scores for road priority scenarios. A combination of higher income forecasts and higher traffic forecasts mean that such schemes are found to

CODE-TEN FINAL REPORT 146
perform relatively well financially, which is perceived as being a priority consideration for the national government.
In summary, most CEEC tend to find the infrastructure strategies fairly acceptable, regardless of the infrastructure strategy and under most external circumstances. Only in the Dilution scenario, is the network approach strategy the key to the achievement of the policy goals achievement and the road priority strategy does not perform well.
In contrast, EU countries seem to perform in a very different way depending on the infrastructure strategy adopted. The road priority strategy generally brings about negative score across countries and external scenarios. The network approach is successful in most of the cases.
4.6 Summary of findings
The results of the cost-benefit / multi -criteria analysis can be summarised as follows:
?? Under the renaissance scenario of high growth and fast integration, the ‘all road’ solution is generally inferior, except in terms of accessibility. The ‘all rail’ approach offers the greatest benefits in terms of safety improvement, air pollution reduction and demographic accessibility – it is also cheaper than the ‘network’ approach by about 20 per cent, but slightly inferior in terms of vehicle operating costs and time savings, noise reduction and economic accessibility.
?? The ‘network’ approach outperforms the ‘priority road’ approach under all external scenarios on almost all indicators – the sole exception is demographic accessibility under conditions of high growth and fast integration.
?? The ‘priority road’ approach would have adverse consequences for European transport users overall in terms of vehicle operating costs and time, whatever the growth and integration scenarios.
?? Overall accessibility gains under all external scenarios and infrastructure variants are either insignificant or quite small. This however hides the fact that at a more spatially disaggregate level, there is a mixed pattern of gains and losses: in general there are significant accessibility gains close to the corridors with new infrastructure, but significant accessibility losses in adjacent countries which experience traffic growth and hence slower traffic speeds.

CODE-TEN FINAL REPORT 147
The results of the goal achievement matrix analysis that allow to assess how well each specified corridor development alternative is with respect to the policies from which it was developed can be summarised as follows:
?? Under the favourable conditions of the renaissance scenario, the results of the goal achievement matrix approach confirm those of the cost-benefit / multi-criteria analysis: the ‘netw ork’ approach performs very well with respect to its underlying transport policy which gives particular emphasis to intermodality, regional development, accessibility and safety; so does the ‘all rail’ solution. By contrast, the ‘all road’ and ‘priority road’ strategies present more negative and heterogeneous results also with reference to their underlying transport policy.
?? When comparing the impacts for the accession countries separately from those for the EU countries, the most significant difference betw een these two groups is that while the CEEC present positive scores under all possible corridor development alternatives, the EU shows negative results for the ‘priority road’ solution under the renaissance, dilution and solidarity scenarios.
?? For EU countries, the ‘network’ approach always performs better than the road alternatives. Regarding CEEC, the same is true, with the exception of the fragmentation scenario where the ‘priority road’ solution performs better than the ‘network’ approach.
?? Under most external scenarios, the CEEC find road-based strategies moderately beneficial, whereas Western Europe finds them detrimental. This can be attributed both to the impacts experienced amongst the two groups, with Western Europe suffering particularly from the negative effects of increased road transport, but also the different policy focuses of the two sides.
?? Looking at the results from the national perspective confirms the robustness of the ‘network’ solution. This means that diversification of the investment in different types of infrastructure would appear to have greater success in achieving national transport policy objectives.
?? The policy areas of ‘increasing cross-border traffic (harmonisation’, ‘intermodality’ and ‘regional development’ explain the better scoring of the ‘network’ approach as compared to the ‘priority road’ solution under different socio-economic and integration scenarios.

CODE-TEN FINAL REPORT 148
4.7 Recommendations
Policy recommendations
The second-level prioritisation of projects belonging to the trans -European corridors in the East is only now about to begin. In CODE-TEN and through expert interviews with the actors concerned we sought to identify those projects that are more likely to be submitted for co-financing to the ISPA Fund.
Whilst acknowledging the importance of project-specific assessment results for evaluation we have suggested that it is important prior to taking any final decision to submit the whole set of projects being proposed to strategic assessment. The DECODE method elaborated in CODE-TEN is one method for carrying out this analysis.
The results suggest that if CTP objectives, in particular with reference to sustainable mobility, are to be taken seriously and if subsidiarity is understood to target the integration of both Community and national interests then it is important indeed to support multimodal solutions, albeit paying close attention to positive boundary conditions, hence intermodality as well as patterns of inter-regional co-operation. Such a strategy can guarantee that even under not so favourable conditions in terms of economic growth or even integration, the impacts of transport infrastructure investment are positive both for the local residents and local economies as well as for Europe as a whole.
Research recommendations
The DECODE method is a strategic policy assessment tool. It is scenario-led and uses systems analysis to combine information on socio-economic developments, policy developments and infrastructure strategies to formulate various strategies for corridor policy programmes.
The estimation of impacts is an integral part of the DECODE method. However, the choice of tools used for traffic assignment, impact assessment and combination of impacts are independent of the DECODE method.
This is one area which would specially benefit from further research – to develop dynamic tools for impact assessment, in particular for the measurement of network effects and with better methods for dealing with missing or incomplete data sets.
To this end it is also necessary to create a transport information system, regularly updated, to cover the extended European space, i.e. both actual and would-be members of the EU as well as neighbouring countries.

CODE-TEN FINAL REPORT 149
Finally, another area deserving further research concerns the valuation of outcomes and resources particularly in the context of sustainable development and sustainable mobility.
CODE-TEN FINAL REPORT 150
Bibliography
Banister, D. and Berechman, J. (eds.) (1993), Transport in a Unified Europe, Amsterdam, North-Holland
Banister, D (ed.) (1995), Transport and Urban Development, London, E&FN Spon
Banister, D. and Lichfield, N. (1995), ‘The Key Issues in Transport and Urban Development’, in Banister, D. (ed.), Transport and Urban Development, London, E&FN Spon
Banister, D. (ed.) (1998), Transport Policy and the Environment, London, E&FN Spon
Button, K. (1993), Transport, the Environment and Economic Policy, London, Edward Elgar
European Commission (1992), The future development of the common transport policy - A global approach to the construction of a Community framework for sustainable mobility, COM(92) 494, Brussels
European Commission (1993), European Transport Policy in the 90s, Brussels
European Commission (1993), The future development of the common transport policy. A global approach to the construction of a community framework for sustainable mobility. Bulletin of the European Communities, Supplement 3/93
European Commission (1994), Strategic Environmental Assessment – Existing Methodology, Brussels, EC
European Commission (1995), The Common Transport Policy Action Programme 1995-2000, Brussels
European Commission (1995), The Trans-European transport network; transforming patchwork into a network, Brussels
European Commission (1995), ‘Amended proposal for a European Parliament and Council Decision on the Community guidelines for the development of the trans-European transport network’, Official Journal C97, Vol.38
European Commission (1995), Towards Fair and Efficient Pricing in Transport - Green Paper, Brussels, COM(95)-691
European Commission (1995), The Citizens’ Network – Fulfilling the Potential of Public Passenger Transport, Brussels, European Commission, COM(95) 601.

CODE-TEN FINAL REPORT 151
European Commission (1996), Strategies for the Revitalisation of the European Railway Companies - White Paper, Brussels COM(96)-421
European Commission (1997), Case Studies on Strategic Environmental Assessment; Final Report: Volumes 1 & 2 , Brussels, EC
European Commission / ISPRA (1997), A Study to Develop and Implement an Overall Strategy for EIA/SEA Research in the EU, Brussels, EC
European Commission (1998), Communication from the Commission: Developing the Citizens’ Network: Why Good Local and Regional Passenger Transport is Important and How the European Commission is Helping to Bring it About, Brussels, European Commission, COM (98) 431 final.
European Commission (1999), Commission Communication to the Council, European Parliament, Economic and Social Committee and Committee of the Regions: The Common Transport Policy; Sustainable Mobility: Perspectives for the Future, European Commission.
European Com mission (1999), PHARE – Transport Infrastructure Needs and Assessment, TINA Secretariat
European Conference of Ministers of Transport (ECMT) (1998), Efficient Transport for Europe: Policies for Internalisation of External Costs. OECD, Paris.
Glaister, S. et al (1998), Transport Policy in Britain, London, MacMillian Press Ltd.
Goodwin, P. and Wright, G. (1998), Decision Analysis for Management Judgment, 2nd. edition, Wiley
Hogwood, B. W. and Dunn, L. A. (1984), Policy Analysis for the Real World, Oxford, Oxford University Press.
Keeney, R.L. and Raiffa, H. (1976), Decisions with Multiple Objectives, Wiley.
Layard, R. and Glaister, S. (Edited) (1996), Cost-Benefit Analysis, Cambridge University Press
Linneker, B. (1997), Transport Infrastructure and Regional Economic Development in Europe: A Review of Theoretical and Methodological Approaches. Report to the SASI project. TRP 133. Sheffield, Department of Town and Regional Planning.
Nellthorp J., Mackie P.J. and Bristow A.L. (1998), Measurement and valuation of the impacts of transport initiatives, Deliverable D9, (Restricted), EUNET

CODE-TEN FINAL REPORT 152
Project - Socio Economic and Spatial Impacts of Transport (Contract: ST-96-SC.037), Institute for Transport Studies, University of Leeds.
Ney, S. (1998), ‘Understanding Accessibility’, Paper presented at the TENASSESS Final Conference, forthcoming as publication
Olson David L. (1996), Decision Aids for Selection Problems, New York, Springer
Parsons, W. (1995), Public Policy: An Introduction to the Theory and Practice of Policy Analysis, Aldershot, Edward Elgar
Pearce, D.W. and Nash, C.A. (1981), The social appraisal of projects: a text in cost-benefit analysis, London: Macmillan.
Rossi, P.H and Freeman, H.E. (1993), Evaluation : A Systematic Approach, California, SAGE
Rus G. de, Nach C. (ed) (1996), Recent Developments in Transport Economics, Hants, Avebury
Sugden, R. and Williams, A. (1978), The Principles of Practical Cost-Benefit Analysis, Oxford University Press
TENASSESS Deliverable R(3), Comparative Report Case Studies: The Im plementation of European Transport Projects, 1997
TENASSESS Deliverable R(4) – Volumes 1 & 2, Volume 1: The TENASSESS Policy Assessment Methodology (PAM); Volume 2: Demonstration Case Studies [The Amsterdam Ring Road; the Twente -Mitteland Waterway; the TGV Nord; the IC5/IC2 Toll Motorway Portugal; the Igoumenitsa Volos/Lamia Motorway Greece; the Decin-Praha-Breclav Rail Upgrade Czech Republic], 1997
TENASSESS Deliverable R(6) – Volumes 1 & 2, Volume 1: The TENASSESS Barrier Model; Volume 2: Demonstration Case Studies & Amendments to the Barrier Model [Road Pricing in Austria; Harmonisation of Weights; The Femer Belt; the TGV Aquitaine; the Athens Airport], 1998 & 1999
Turro Mateu (1999), Going Trans-European: Planning & Financing transport networks for Europe, Amsterdam, Pergamon
Wallace, H. and Wallace, W. (1996), Policy Making in the European Union, New York, Oxford University Press

CODE-TEN FINAL REPORT 153
Annex I. CODE-TEN Main Deliverables & Working Papers
Main Deliverables
CODE-TEN Deliverable P (1), Baseline Methodology, 1998
CODE-TEN Deliverable R(2), Transport Information System , 1998
CODE-TEN Deliverable P(3), Volume 1: TEN Enlargements: The Corridor Development Plans – comparative case studies, 1999;
CODE-TEN Deliverable P(3), Volume 2: Project Database, 1999;
CODE-TEN Deliverable P(3), Volume 3: Case studies – Corridor I, Corridor II, Corridor IV, Corridor V, Corridor VII, Corridor IX, Corridor X; Meditteranean Short Sea shipping; Lisbon-Madrid-Paris corridor; 1998.
CODE-TEN Deliverable P(4), Scenarios and Infrastructure Development, 1999
CODE-TEN Deliverable P(5), Assessment of Spatial and Socio-Economic Impacts, 1999
CODE-TEN Deliverable P(6), Spatial Distribution of Environment & Safety Impacts, 1999
CODE-TEN Deliverable P(8), Decision Support System, 2000
CODE-TEN Deliverable P(9), Scientific Report Code-Ten : The DECODE method for Strategic Transport Assessment, 2000
CODE-TEN Deliverable P(10), Policy Report Code-Ten: The Trans-European Corridors, Policy Recommendations, 2000
Working Papers
CODE-TEN Working Paper (1), National Transport Policy Bulgaria, 1998
CODE-TEN Working Paper (2), National Transport Policy Romania, 1998
CODE-TEN Working Paper (3), National Transport Policy Hungary, 1998
CODE-TEN Working Paper (4), National Transport Policy Poland, 1998
CODE-TEN FINAL REPORT 154
CODE-TEN Working Paper (5), National Transport Policy Baltics, 1998
CODE-TEN Working Paper (6), National Transport Policy Russia, 1998
CODE-TEN Working Paper (7), National Transport Policy Finland, 1998
CODE-TEN Working Paper (8), Quantifying Scenarios, 1999
CODE-TEN Working Paper (9), Transport Information Management System, 1999
CODE-TEN Working Paper (10), Case Study: Corridor I: Via Baltica, 1999
CODE-TEN Working Paper (11), Case Study: Corridor II: BERLIN-WARSAW-MINSK-MOSCOW, 1999
CODE-TEN Working Paper (12), Cas e Study : Corridor IV: DRESEDEN/NÜRNBERG - PRAGUE - VIENNA/BRATISLAVA - GYOR - BUDAPEST - ARAD - CONSTANTA/CRAIOVA - SOFIA - THESSALONIKI/PLOVDIC – ISTANBUL, 1999
CODE-TEN working Paper (12), Case Study : Corridor V: VENICE - TRIEST - KOPER - LJUBLJANA - BUDAPEST - UZGOROD – KIEV , 1999
CODE-TEN Working Paper (13), Case Study : Corridor VII: The DANUBE Waterway, 1999
CODE-TEN Working Paper (14), Case Study : Corridor IX: Study COPENHAGEN - MALMÖ - STOCKHOLM - HELSINKI - ST. PETERSBURG – MOSCOW, 1999
CODE-TEN Working Paper (15), Case Study : Corridor X: SALZBURG - LJUBLJANA - ZAGREB - BEOGRAD - NIS - SKOPJE – THESSALONIKI, 1999
CODE-TEN Working Paper (16), Case Study : Mediterranean Short-sea Shipping, 1999
CODE-TEN Working Paper (17), Case Study: Lisbon-Madrid-Paris, 1999

CODE-TEN FINAL REPORT 155
ANNEX II: Summaries of the case studies
Corridor I: Via Baltica (Prepared by VTT, The University of Gdansk, TTU, SCCTP) The Via Baltica project was formally organised in February 1990. The overseeing committee is formed by the Ministers of Transport and Communications of all the Baltic countries supported by the Polish and Finish Ministries. This multi-modal corridor, both road and rail as well as a sea link, passes through the countries of Finland, Estonia, Latvia, Lithuania, Poland, and Kaliningrad (the branch to Gdansk). Corridor I together with corridor IX and corridor VI define the north-south axes of network development with regards Eastern Europe.
The goal with regard to sustainable transportation in the Baltic Sea region consists of two components:
?? To retain transport’s ability to serve the economic and social development of the Baltic Sea region;
?? To protect human health and the environment, in particular the sensitive ecosystems of the region, including those of forests and lakes and of the Baltic Sea itself, and to minimise the consumption of non-renewable resources and the use of land for transportation purposes.
In all the countries affected by Corridor I and especially the three Baltic States and Poland what drives the corridor development plans are the policy goals of increasing accessibility, increasing cross-border traffic and promoting regional development.
In Estonia and Latvia all proposed road projects display high project scores on the suitability scale. Rail projects score moderately. The opposite is the case in Lithuania and Poland. The main barrier of implementation is in all cases the financing issue, and conflicts remain regarding the setting of technical standards. The environment is emerging as a problem in relation to socio-economic concerns over competition in Latvia and Lithuania.
Due to the differential emphasis placed on rail and road development by Estonia and Latvia on the one hand and by Lithuania and Poland on the other, a problematic boundary condition might arise in terms of timing for the corridor development. This, in turn, suggests that there are two possibly competing areas of influence also in relation to the ports: one comprising Poland, Lithuania and Russia in relation to Kaliningrad favouring rail and the corridor branch IA through Belarus, with Gdansk dominating as a port; the other comprising

CODE-TEN FINAL REPORT 156
Estonia and Latvia in relation to Moscow and Finland and favouring the Estonian and Riga ports. Future developments will depend on first, the Russian strategy regarding the opening towards the North; and second, the scope of regional co-operation between the three Baltic States.
Corridor II: Berlin-Warsaw-Minsk-Moscow (Prepared by PLANCO, The University of Gdansk, SCCTP)
Corridor II goes through Germany, Poland, Belarus and Russia and has a total length of 1830 km. The corridor II development is mainly driven by the objective of promoting international traffic (i.e. increasing cross-border trade). In Russia and Belarus the twin objectives of increasing accessibility and regional development are likewise important levers, also with respect to bilateral co-operation.
In Poland the road links display higher positive scores than the rail projects on the suitability scale. However, only the western part of the road connection (i.e. from the German border to Warsaw) is cleared regarding implementation; the situation is less clear regarding the eastern part, mainly due to problems of financing. The completion of the Western road link of corridor II in Poland is also likely to be delayed due to barriers being faced with regards the small section around Warsaw: these barriers are of socio-economic, environmental and financial nature.
In Belarus both the road and rail links (from the Polish border through Minsk to the Russian border) display high positive scores, the rail link higher than those of the road link. The main problem in both these cases is the financial one. For Russia the reconstruction of the highway (and especially of the bridges) along corridor II is the project of highest national priority. The problem here again is a financial one.
Corridor IV : Dresden/Nürenberg - Prague - Vienna/Bratislava - Gyor - Budapest- Arad - Constanta/Craiova - Sofia - Thessaloniki/Plovdiv - Istanbul (Prepared by ICCR, KTI, INCERTRANS, CTC-Engineering, Systema, PLANCO)
Corridor IV, which can be seen as the backbone of the future Trans -European Transport network, consists of more than 3285 km of road and railways. It is one of the most important east-west corridors, passing over from Germany to Greece, via Prague (Czech Republic), Bratislava (Slovak Republic)/Vienna (Austria), Budapest (Hungary), Arad (Romania), Sofia (Bulgaria) with a branch to the Black Sea at Constanta.
CODE-TEN FINAL REPORT 157
It is a high priority corridor in most of the Central and eastern European countries. The current network shows that the northern regions have a well developed infrastructure but as we move southwards the number of infrastructure projects increase. However among the CEEC, the Hungarian network boasts of a well developed road network. The rail network along the entire corridor is well developed but upgrading works are needed. The motorway network is partially under construction and partially ‘on-hold’ due to the limited availability of funds.
Out of the 58 projects identified along the corridor, 12 are expected to be completed by the year 2000. Nearly 60 percent of the projects are expected to be completed by the year 2010. Only 7 projects are planned to be completed between 2010 and 2015. However this will depend on the availability of funds.
In the Czech Republic, the project with the highest suitability is the construction of the Plzen bypass. This is both a national as well as an international priority. The construction of the bypass is expected to reduce local traffic and congestion thus displaying a positive environmental impact. Other projects with the highest score are the construction of the motorways, D8 and D5. The motorways are expected to ameliorate the cross border traffic flowing between Germany and Prague. At present the greatest concentration of traffic flows is focused on the international corridors.
In Slovakia the project with the highest suitability score is the one involving construction of the Petrzalka-Parndorf line towards Austria. The main aim of this project is to speed up the traffic between Vienna and Bratislava; to enable the re-routing by rail of high goods vehicles (HGVs) from Devinska-Nova Ves – Marchegg border crossing; to construct a freight terminal at Bratislava. The project meets the objective of increasing intermodality and accessibility.
The Slovak priorities regarding Corridor IV fit the Austrian ones. In Austria too, the project with the highest suitability score concerns the upgrading of the railway line to Slovakia. In the first stage the railway line between Bruck a.d.Leitha-Parndorf-Petrzalka is being built as single-track connection till the year 2005. This will be upgraded to a double-track connection by the year 2015. This is likely to increase intermodality and interoperability besides increasing accessibility and leading to the regional development of the areas in Burgenland. Burgenland is the only objective 1 region in Austria.
In Hungary the most suitable project would appear to be the one concerning the upgrading of the rail infrastructure and railway stations on the Budapest – Kelebia line towards the south for connecting to Corridor X.
All the road projects between Nadlac-Bucharest-Constanta have a high suitability score. These projects meet the objectives of promoting interoperability, accessibility regional development, applying environmental

CODE-TEN FINAL REPORT 158
legislation and increasing cross border traffic. The improvement in road infrastructure should lead to a shift of traffic from rail and waterways to road and also an abs olute increase in traffic on road. The new and upgraded motorways will facilitate the pricing policies using toll systems, thus meeting the national objective of promoting schemes for internalising external costs.
High scores can also be observed in Bulgaria. Amongst the project scores, the highest scores are for the rail projects involving rail construction and upgrading of the various sections: Vidin-Mezdra; Sofia-Svilengrad; Sofia-North Iliantsi. These projects meet the national objectives of increasing cross border traffic and reducing accidents that have the highest weight in the national policy objectives.
What is important to note regarding both Bulgaria and Romania is that in both these countries the corridor ‘visions’ offer the opportunity to strategically conceptualise and hopefully implement major infrastructure investment plans covering their whole territory. The state of the transport network in these countries, especially of the road network, is poor that it would seem that any proposal for improvement can be classified as a priority as it would fundamentally contribute to the quality of life of the own population. Therefore, it would seem appropriate in the interim period to prioritise projects in these two countries by weighing heavier criteria like population density, urbanisation patterns and job creation. It is also important to keep in mind that the possible opening of Corridor X would place these two countries in direct competition in terms of channelling the traffic to the east through to the ports in the Black Sea Region, whereby this is also very much dependent on the scope for development of the Black Sea Region and the Aegean for international shipping. Competition has already emerged concerned the location of the 2nd bridge across the Danube.
All Greek projects display high suitability scores and most are in the process of implementation despite the fact that there still reigns uncertainty as to what boundary conditions these would be facing in the North. As in the case of Corridor X this can only be understood by appreciating, first, that Greece can claim funding through the Community Cohesion Support Funds which especially seek to promote development in peripheral regions, which is what the Northern part of Greece is; and second the national interest of Greece in developing its northern frontier: the significance of the corridor IV for Greece can be better understood if it is recognised that all relevant projects feed into the Via Egnatia that connects the western and eastern part of Greece in the North from Thessaloniki to Igoumenitsa.
CODE-TEN FINAL REPORT 159
Corridor V: Venice - Triest - Koper - Ljubljana - Budapest - Uzgorod - Kiev (prepared by TRT, KTI, CTC -Engineering, ICCR)
The corridor V combined with corridor III in Ukraine is the longest corridor from the south-east to the north-west of Europe. The main route of the corridor V with its branches crosses seven countries – Italy, Slovenia, Croatia, Hungary, Slovakia, Ukraine and Bosnia. The 1600 km long corridor follows the route Trieste-Ljubljana-Budapest-L’vov-Kiev. It is a multimodal corridor with a road and rail network along with ports. The starting points of the corridor are the Italian ports of Venice and Trieste and the Slovenian port of Koper. From there it continues towards Hungary, Slovakia and Ukraine. Once in Ukraine the route leads through Lvov to Kiev. Besides the main route there are three branches. The first branch connects the Adriatic Port of Rijeka in Slovenia with Budapest through Zagreb. The second branch runs from Uzgorod in Hungary towards Kosice in Slovakia and then onto Zilina and Bratislava. This branch forms the largest corridor in Slovakia. The third branch is a connection from Bosnia-Herzegovina, connecting Bosnia to the Croatian port of Ploce.
The importance of the corridor is outlined by the fact that it is expected to speed-up the economic transformation for Slovenia, Hungary and Slovakia. In fact the Hungary-Ukraine connection is expected to invert the sharp decline in COMECON countries after 1989. Further the strategy to improve the Northern Adriatic ports and the land port of Zahony (the high capacity terminal at the Hungarian-Ukranian border) is considered an important asset to develop long distance, rail-based transport chains to connect markets in Southern Europe with those in CIS. The importance of the corridor is enhanced by its connections with the corridor V crosses corridor IV and corridor X.
The most environmentally conscious countries are Slovenia and Croatia. Both Hungary and Italy with regional imbalances have higher weights attached to accessibility and regional development. In Italy there is a tough policy debate ongoing on whether to adopt or not the relevant directives of the EU regarding liberalisation, privatisation and deregulation.
The corridor V preference lie with construction and upgrading of motorways and not so much as development of the rail infrastructure. The cost estimate for the completion of the main road route was 3491 MECU as per the Essen council in 1994.
In Slovenia, the development of the motorway across corridor V in the South is undoubtedly of highest priority. The adaptability test shows that barring the construction of the motorway between Ankaran and Kozina, these projects do not face any conflicts or barriers. In Hungary higher scores are attributed to the railway project involving upgrading works along Budapest-Cegled-Szolnok, however this project is facing financial barriers; of the road projects, the one

CODE-TEN FINAL REPORT 160
displaying the highest priority is the road development plan for the link to Croatia (less so that to Slovenia) and that to the East, the latter mainly in terms of accessibility concerns. Finally Slovakia is keen on the further development of the rail connection to Belarus.
Corridor V like corridor I is likely to face negative boundary conditions at least in terms of phasing or timing; this is only partly the result of the competition between ports, and in particular Triest, Koper and Raijeka. Clearly how corridor V develops will depend on the extent to which these three ports collaborate or compete but also, perhaps more importantly, on whether they will be feeding points for the North (i.e. along corridor X and/or VI) or for the East (i.e. along corridor V). Whilst this will very much depend on the economic performance of the NIS, it at the same time is likely to influence the modal options for corridor V.
Corridor VII: The Danube Waterway (Prepared by PLANCO, KTI, CTC -Engineering, INCERTRANS, ICCR)
The corridor VII or the Danube corridor as the name suggests runs along the Danube river passing through 11 countries – Germany, Austria, Slovakia, Hungary, Croatia, Yugoslavia, Romania, Bulgaria, Moldova and Ukraine. Currently it is not the most favoured mode of transportation but has the potential of becoming an environmentally-friendly transport corridor on a North west-South east axis. Besides the Danube river, the corridor is accompanied by a rail and road network which to a great extent overlaps with that of Corridor IV.
The Danube waterway navigable over 2300 km forms the backbone of the corridor. Since the opening of the Main-Danube channel in 1992 traffic has increased on the Danube, though its use for transport is hindered by some bottlenecks and problems. Only 8 percent of the Danube’s capacity is actually used for transportation. The main problems are the following:
?? The available channel depth is far lower than the reference 2.5m plus keel clearance. This problem is by far the most important parameter hindering the economical use of the river for inland navigation with bottlenecks along the whole river length.
?? The changing water level along the Danube, where high as well as low levels present problems to navigation of major vessels;
?? The big number of locks that lead to slowing of speed;
?? Low bridges restrict the potential for container traffic;

CODE-TEN FINAL REPORT 161
?? The available channel width compared to a basic width of 100m. This problem is magnified in Hungary and Slovakia where the width is less.
?? The air draft (free height under bridges and cables) is critical especially in the vicinity of Budapest where a number of low historical bridges are located. However, similar problems exist in Germany and Austria, and the available air drafts allow most vessels to pass except container vessels stacked with three layers of containers during the high water period.
Even though the Danube is being presented as an environmentally-friendly mode of transport, it is mainly environmental concerns that hinder the removal of these bottlenecks. Additionally, for the Danube to achieve a competitive edge, it would be necessary to further develop the supporting infrastructure in terms of terminals and river ports; as well as to effect, ideally, an alliance with rail.
The countries along the corridor give high emphasis to increasing cross border traffic and promoting intermodality. This is further highlighted by the fact that the projects with the highest scores are the ones relating to development of ports or combined terminals —specifically in Györ and Nagyteteny in Hungary, and Constantza in Romania.
The overcoming of the technical barriers affecting the Danube waterway will be what ultimately determines the scope for development of Corridor VII. Technical barriers in conjunction with environmental concerns have practically stopped infrastructure developments along this corridor over several years.
Corridor IX: Copenhagen - Malmö - Stockholm - Helsinki - St. Petersburg - Moscow (Prepared by IFP, University of Gothenburg, VTT, SCTTP)
Corridor IX is made up of two parts. Its western part stretches from Copenhagen to Mall, Stockholm and Helsinki; its eastern part from Helsinki to St. Petersburg and from there on to Moscow. In addition to the land-based transport networks there is substantial short-sea shipping within and in competition with the land-based corridor. Insofar as the western part of the corridor is concerned, this is considered as the ‘natural continuation of the fixed road / rail link between Denmark and Sweden’ (CEC, 1995, p.151), i.e. the Øresund Link. In this part, developments will be greatly influenced by the possible construction of a fixed link between Germany and Denmark across the Femer Belt. The Eastern part of the corridor onto Moscow is one of the future priority extensions to the CIS. This connection is furthermore of particular interest for Finland and the Baltic States in relation to Corridor I.

CODE-TEN FINAL REPORT 162
Increasing cross-border traffic is the policy area with highest scores in Denmark insofar as corridor IX development plans are concerned. The project with the highest suitability score is the railway connection from the southern Danish islands to Copenhagen, insofar as this would be a bottleneck were international traffic to increase, but also because this project would contribute to the increase of the accessibility of peripheral regions and also regional deve lopment.
The Fixed Femer Belt project (being planned) and the Øresund Fixed Link (close to completion), both multimodal, are two projects of strategic significance as they would make the current ferry connections, which are considered inefficient, obsolete. However, these are also the projects which display negative suitability scores, i.e. would appear not to ‘fit’ the Danish transport policy objectives in a comprehensive manner. In fact, both these projects are exemplary of the contradictions inherent in national and European transport policies: from the economic development and transport efficiency perspective these projects can be deemed as suitable as they would facilitate cross-border traffic as well as contribute to regional development and the increase of accessibility; from the sustainability perspective, they are associated with far less positive benefits as the road links are expected to be bad for safety and for environmental protection.
In Sweden, the policy area with the highest corridor score is safety, followed by intermodality. Projects with highest scores are the Malmo city tunnel, and the upgrading of the railway to Stockholm, especially the middle part (also because of regional aspects). The latter are however also the projects with highest adaptability scores, i.e. barriers, due to environmental and inter-regional competition.
In Finland, of highest importance with regards corridor IX are the policy areas safety, regional development and accessibility and intermodality. Projects with high suitability scores are the railway upgrading of the route from Helsinki to the Russian border (and the alternative to Lahti) and the road reconstruction in the same direction. None of these projects is currently facing serious barriers that could delay implementation, yet there is a potential for these to arise, especially with reference to financing and environmental concerns (especially around cities, hence the case of the Hamina bypass).
Finally, in Russia, areas driving corridor IX activity are increasing cross-border traffic, intermodality and interoperability. Projects with highest scores are the upgrading of the railway connections, especially around St. Petersburg and at the border with Finland. The upgrading of the connection between Finland and St. Petersburg to a high-speed line faces serious barriers primarily in relation to financing. Many projects display high scores, including most motorway re-construction projects. Of lowest suitability are the sea and air projects. Barriers are mainly of financial nature.

CODE-TEN FINAL REPORT 163
Corridor X: Salzburg - Ljubljana - Zagreb - Beograd - NIS - Skopje – Thessaloniki (Prepared by INRETS; CTC -Engineering, KTI, ICCR)
Corridor X is the most recent to come on the map of the TEN extensions to Eastern Europe. Unlike other corridors, it was only placed on the agenda of the Helsinki Conference of European Transport Ministers in 1997. The main route runs from Austria (Salzburg) towards Slovenia, through Croatia, Yugoslavia and Macedonia to Bulgaria and onto Greece. It is connected to other corridors through four branches: branch A permits a connection with the Austrian network, specifically Wels in the direction of Linz through Graz; branch B permits a connection with Corridor IV in the north at the border with Hungary in the South (Szeged) extending through Croatia and Bosnia-Herzegovina towards the port of Bar of Yugoslavia in the South; branch C connects corridor X to corridors IV and VIII in Bulgaria in the South-East direction from Sofia towards Turkey; and branch D traces a connection between corridor X and the Greek network, specifically the Via Egnatia, through FYROM and Albania.
The section passing through Yugoslavia has not been updated since the war in our report.
In Austria, practically all road projects display low suitability scores, nevertheless it is unlikely that they are not implemented considering that they concern mainly upgrading works agreed upon with the relevant authorities long time ago. The projects with the highest scores are the rail projects, which is not surprising considering the Austrian prioritisation of rail over road projects in the actual infrastructure investment plans and in transport policy. Among the rail projects, those with the highest scores are the Semmering tunnel and the Süd-Ost Spange, the two competing projects for effecting a connection between the south and the east. Both these projects face however many barriers involving also the various regions in opposing positions, hence delays can be expected.
In Slovenia, what seems to be driving the corridor X investment plans are the twin goals of regional development and increasing accessibility, but also the desire to decrease local traffic. Most of the motorways are planned as toll highways. The project with the highest score is the completion of the motorway on the main corridor X line, however this is facing environmental barriers. The two railway projects concerning the construction of double tracks on the corridor X and XA lines also score comparatively high on the suitability test, however the latter faces barriers in the field of division of competencies. The completion of the motorway through Maribor to the Austrian border (Branch XA) is the most controversial of the projects, displaying both a low suitability and high adaptability score.
Regional development and interconnectivity is what drives the corridor X development plans in Croatia. Other policy areas displaying high corridor scores

CODE-TEN FINAL REPORT 164
are increasing cross-border traffic. Projects scoring highest on the suitability scale are the rail projects by reason of the official adherence to the goals of intermodality, interoperability and positive environmental management. However, none of these projects are expected to commence before the year 2005 and the reason is not the existence of barriers. What this shows is the actual emphasis placed on the motorway construction programme. Of the road projects, the one displaying the highest suitability score is the construction of the motorway section in the East between Zagreb and the Yugoslav border. This connection was the busiest prior to the War and most important for regional co-operation.
In Hungary, the main objective of the corridor X projects would appear to be increasing cross-border traffic and especially the connection to Yugoslavia. Increasing accessibility, increasing cross-border traffic and in this connection promoting regional development are the policy areas that dominate the corridor X programme in Yugoslavia. The projects displaying the highest suitability scores are both the rail and road projects planned to re-establish connections to Hungary on the one hand and Bulgaria on the other. The major problem these are facing are financial in nature, but technical barriers also play a major role. Before the situation in Kosovo is settled no major investments can be expected.
In Bulgaria the policy areas of particular significance for proposals concerning corridor X are the same as for Yugoslavia: increasing cross-border traffic, improving accessibility and promoting regional development. The project with the highest score is the one concerning the electrification and upgrading of the Kalotina Sofia railway line, which is however also the project facing most barriers—Bulgaria does not consider going ahead with this project before the situation in the Balkans has stabilised and Yugoslavia seriously proceeds with finalisation of its part of this corridor link. The same is true of the motorway in the same direction. By implication this tends to shift attention towards the corridor IV connections to Romania on the one hand and to Turkey on the other and in this connection to the Sofia Intermodal Terminal.
In FYROM what drives the corridor developments are increasing cross-border traffic, accessibility and promoting regional development. Both the road and rail projects display high suitability scores. For all the main barrier to implementation is the lack of funds.
In Greece, the policy areas of most significance in relation to corridor X are improving accessibility, increasing cross-border traffic and promoting regional development. Most projects score high on the suitability scale, the highest scores are displayed by the Via Egnatia project, the freight village and port rail link for Thessaloniki and the link to FYROM by road. What this suggests is that for Greece Corridor X offers the possibility to strengthen the position of the Northern frontier, not only with reference to Thessaloniki but also for the connection between the west and eastern coasts. The decision to go ahead

CODE-TEN FINAL REPORT 165
with many of these projects despite the unclear situation at the other side of the border (which could also be observed in relation to corridor IV) underlines their national and regional character. Nevertheless, this will also create boundary conditions for the northern neighbours. Whether the Via Egnatia is finally constructed or not will very much influence the profile of corridor X in the future.
Mediterranean Short Sea Shipping (Prepared by Systema, CTC -Engineering, INCERTRANS, INRETS, TRT)
The corridor described as the Mediterranean short sea shipping was included in order to appreciate the role of ports in short-sea shipping. Short sea shipping is understood to cover all sea transport in the region (including the Black Sea), which does not require ocean-crossing voyage.
The increase in importance of the short sea shipping was owed mainly to three factors – to political developments; to economic growth, which results in ever, more bottlenecks in land transport modes and the increasing demand for transport services; and to natural advantages over transport modes as being the most cost effective with regard to investments/capacity, environmental friendliness, energy efficiency, effectiveness for development of peripheral areas and the natural infrastructure.
?? The main routes, serving especially freight flows, in the Mediterranean and the Black Sea, are:
?? The Gibraltar-Suez,
?? The Gibraltar-Black Sea,
?? The Black Sea-Suez and
?? The Adriatic-Suez axis
The most important amongst these is the Gibraltar-Black Sea axis. This main route plays an important role in the planning for the expansion of the EU towards the CEEC/CIS linking major ports of the south of Europe with the Black Sea. The countries that we are looking under this corridor are Greece, Bulgaria, Romania, Portugal, France and Italy.
Most of the countries are undertaking projects to improve their ports infrastructure to attract more trade. In Greece there are two projects planned along the Gibralata-Black Sea axis. One is the construction of the new Port of Alexandroupolis and the second is the construction of the International Freight Village in Chios. In Bulgaria there are plans to upgrade and construct new ports or terminals. In Romania the most of projects deal with the most important port
CODE-TEN FINAL REPORT 166
of Constantza. This project is important for the corridor VII too as this connects with the Danube. In France, the two projects deal with the modernisation of the port Marseille- Mediterranean.
The enlargement of TEN in the West: the case of Lisbon-Paris link (Prepared by INRETS, CESUR)
The entry of Spain and Portugal in the European Union in the mid-eighties was associated with major transport development plans for both these countries in order to increase accessibility. In both these countries, like currently in Eastern Europe, the emphasis was placed on the expansion of the motorway network, with funds becoming available from the European Regional Development – later Cohesion – Fund and the European Investment Bank. Thus in Portugal, for instance, the motorway network tripled in size between 1986 and 1994 and car ownership doubled.
The expansion of the motorway network went hand in hand with economic development, but brought along congestion problems around cities especially and environmental degradation. A series of rail development projects came gradually to be formulated, including for high-speed links, yet the lack of funds in conjunction with the continuing support of industry for road development has meant that progress in this area has tended to stall.
In terms of international links, the major barrier to effecting fast connections to Central and Northern Europe remains the Pyrenean mountains: the best route to reach the French border from Lisbon still is through Madrid and is more than 1,100 km long; from there on, the distance to Paris is 900 km, i.e. the total distance amounts to 2,000 km, which is more than the distance between Paris and Rome, Paris and Vienna, Paris and Budapest, Paris and Prague or Paris and Copenhagen and approximately identical to the distance between Paris and Warsaw.
This is also why the development plans for the Lisbon-Paris corridor – which retraces in many respects the route proposed for the Maghreb-Péninsule-Ibérique-France connection by the Committee of Ministers of Interior of the European Commission and the United Nations – considers two alternative options for traversing the Pyrenean mountains, namely, the Atlantic axis connecting Lisbon and Paris-Lille through Irun and Bordeau and the Mediterranean axis extending from Dijon-Lyon in France towards La Jonquera and Barcelona and Valencia in Spain, with a branch from Barcelona to Lisbon.
The establishment of both these connections would grant better consistency to the current connections between the South-West of Europe, i.e. Spain and Portugal and Northern Europe. This is especially the case for the rail links which currently lack a network unity. They would additionally enable a better
CODE-TEN FINAL REPORT 167
connection between the relevant ports in the area, especially Marseilles in France, Barcelona in Spain on the Mediterranean axis and Nantes and Bordeau in France, Bilbao and Vigo in Spain and Lisbon and Setubal in Portugal on the Atlantic axis. They could also potentially offer alternatives to the currently heavily used air routes, especially for passenger transport.
The barriers faced for network development are not alone physical or financial in nature. Another problem relates to phasing or timing considering that in both Spain and Portugal, road development projects still tend to be considered priority from the national perspective; yet another has to do with competition between regions, especially in Spain with reference to Catalunia and the Basque Country in opposition to the central government in Madrid.

CODE-TEN FINAL REPORT 168
Annex III: Volume 2 -- Table of Contents
Volume 2 of the CODE-TEN Final Report includes all tabulations and specific technical details relating to Volume 1. Volume 2 can be obtained through the ICCR, the project co-ordinator, by contacting Annuradha Tandon at [email protected]
The table of contents of Volume 2 is as follows:
1. Transport Information System 2. Assessment of Freight Traffic
Foreign Trade Forecast Cost Development 1995 to 2015 Results of Freight Traffic Assignment
3. Projects Under Infrastructure Strategies ‘All Road’ Infrastructure Strategy ‘All Rail’ Infrastructure Strategy ‘Road Priority’ Infrastructure Strategy ‘Regional Network’ Infrastructure Strategy ‘Do-nothing’ Infrastructure Strategy
4. Direct Transport Impacts Variations of Direct Transport Costs by Country and Mode Net Variations of Direct Transport Impacts in Year 2015 Renaissance Scenario: Comparison of Assessment Results Dilution Scenario: Comparison of Assessment Results Solidarity Scenario: Comparison of Assessment Results Fragmentation Scenario: Comparison of Assessment Results
5. Economic Accessibility Impacts Comparison under the Renaissance Scenario Comparison under the Dilution Scenario Comparison under the Solidarity Scenario Comparison under the Fragmentation Scenario
6. Assessment of Environmental Impacts Comparison under the Renaissance Scenario Comparison under the Dilution Scenario Comparison under the Solidarity Scenario Comparison under the Fragmentation Scenario
7. Quantification of Scenarios

CODE-TEN FINAL REPORT 169
Table of Contents
EXECUTIVE SUMMARY 2
THE DECODE METHOD 3 STRATEGIC ASSESSMENT R ESULTS 5
1 INTRODUCTION 8
2 TERMS OF REFERENCE 10
2.1 PUBLIC POLICY 10 2.2 POLICY PROCESS 10 2.3 POLICY ANALYSIS 11 2.4 IMPACT ASSESSMENT 12 2.5 SCENARIOS 14 2.6 STRATEGIC POLICY ASSESSMENT 14 2.7 CORRIDOR 15 2.8 CORRIDOR DEVELOPMENT ALTERNATIVE 16
3 THE DECODE METHOD FOR STRATEGIC ASSESSMENT 18
3.1 THE CONTEXT OF EVALUATION 18 3.2 GUIDING PRINCIPLES 19 3.3 METHODOLOGICAL STEPS 20 3.4 TRANSPORT INFORMATION MANAGEMENT SYSTEM 21 3.5 SCENARIOS 24 3.6 INFRASTRUCTURE STRATEGIES 36 3.7 CORRIDOR DEVELOPMENT ALTERNATIV ES 40 3.8 IMPACT ASSESSMENT 45 3.9 ASSESSMENT METHODS 51 3.10 AGGREGATION OF IMPACTS 63
4 THE STRATEGIC ASSESSMENT RESULTS 75
4.1 DRAWING THE MAPS 75 4.2 THE PITFALLS OF PRIORITISATION 76 4.3 SUBSIDIARITY AND NATI ONAL PRIORITIES 77 4.4 MODAL PRIORITIES AND REGIONAL ALLIANCES 81 4.5 TOWARDS WHICH CORRIDO R DEVELOPMENT ALTERNATIVE? 82 4.6 SUMMARY OF FINDINGS 146

CODE-TEN FINAL REPORT 170
4.7 R ECOMMENDATIONS 148
BIBLIOGRAPHY 150
ANNEX I. CODE-TEN MAIN DELIVERABLES & WORKING PAPERS 153
MAIN DELIVERABLES 153 WORKING PAPERS 153
ANNEX II: SUMMARIES OF THE CASE STUDIES 155
CORRIDOR I: VIA BALTICA 155 CORRIDOR II: B ERLIN-WARSAW -MINSK-MOSCOW 156 CORRIDOR IV : DRESDEN /NÜRENBERG - PRAGUE - VIENNA/BRATISLAVA - GYOR - BUDAPEST- ARAD - CONSTANTA /CRAIOVA - SO FIA - THESSALONIKI/PLOVDIV - ISTANBUL 156 CORRIDOR V: VENICE - TRIEST - KOPER - LJUB LJANA - BUDAPEST - UZGOROD - KIEV 159 CORRIDOR VII: THE DANUBE WATERWAY 160 CORRIDOR IX: COPENHAGEN - MALMÖ - STOCKHOLM - HELSINKI - ST. PETERSBURG - MOSCOW 161 CORRIDOR X: SALZBURG - LJUBLJANA - ZAGREB - BEOGRAD - NIS - SKOPJE – THESSALONIKI 163 MEDITERRANEAN SHORT SEA SHIPPING 165 THE ENLARGEMENT OF TEN IN THE WEST: THE CASE OF LISBON-PARIS LINK 166
ANNEX III: VOLUME 2 -- TABLE OF CONTENTS 168