cocoa handbook - world bank
TRANSCRIPT

12895
Cocoa Handbook
Commodities and Export Projections DivisionEconomic Analysis and Projections Department


lanuary 1982
COCOA: TECHNICAL CONVERSION FACTORS /a
(percent)
Net Cocoa Beans Yield of Pod 30.0 - 40.0
Paste Yield of Cocoa Beans 80.0 /b
Powder Yield of Cocoa Beans 7.0 lb
Butter Yield of Cocoa Paste 45.0 - 55.0
Fermented Dry Yield of Non-Fermented Cocoa(including pulp):
Melon-Shaped 44
Amazonian 38
/a The factors are those shown for Ghana.
lb FAO estimate.
Source: FAO, Technical Conversion Factors for Agricultural Commodities, Rome,1972.


January 1982
TABLE OF CONTENTS
Chapter Page No
1. INTRODUCTION ................................................ I - I
II. THY. PRODUCT .... .............. .. * * * * *...*. .aaa**............. II - 1
A. Physical Characteristics .......................-...... I - 1B. Methods of Cultivation, Harvesting and Processing .... II - 1
Cultivation .......... 00 . 4......a a4 a.s0 ... aa II - IYields .................... a.a.a......... IT - 1Rarvesting ...................................... II - 3Processing of Cocoa ...... ......... .............. II - 5Blending and Cocoa Substitutes .......... ........... II - 5
C. Different End-Uses of Processed Cocoa ............... ti - 5
References ........................ .-. ................ II - 6
Ill. PRODUCTION ......... .... 9.* ................... ** III - I
A. Geographical Distribution ................... III - IB. Price Elasticities of Supply ........... a............. III - 3
References ........ a........................ a ......... III - 5
IV. CONSUMPTION . a. aa....aa.a...aaaa........a...................... IV -
A. Geographical Distribution ... ................ . IV-B. Income and Price Elasticities of Demand .............. IV - 3C. Market Structure .... a ................................aiv - 3
References .................................... a .... a. IV - 8
V. TRADE a...aa..aa..aaa..aa..aa..a...aaa.aaa......aa.......................... V - I
A. Major Exporters and Importers ......... ............. V - 1B. Marketing and Distribution ............aaa..........a. V - 3C. International Prices ..... ................................ V - 3
References ............................................ V - 8
VI. SPECIAL ISSUES ..... ................. a a........................ V - 1
A. Government Involvement and International CocoaAgreements a a .......................................... VI - 1
B. Existing Tariffs and Non-Tariff Barriers (NTBs) ...... VT - 2
References . ........................................... VI - 6

January 198S
LIST OF TABLES
Tables Page No.
II-B1 Estimated Cocoa Yield by Age of Tree in Togo .... ......... II - 2
II-B2 Projection of Expected Cocoa Yield by Type and Age of
Cocoa ................................................. II - 4
III-Al World Cocoa Production by Main Countries .... ............. III - 2
III-B1 Price Elasticity of Cocoa Supply with Respect to Producer
Price ................................................. III - 4
IV-Al World Apparent Consumption, by Main Regions .. ............ IV - 2
IV-Bl Income and Price Elasticities of Demand Estimated by the
ICCO for Some Major Consuming Countries ............... IV - 4
IV-B2 Income and Price Elasticities of Demand for Cocoa .... .... TV - 5
IV-Cl Operations of Multi-Product and Multi-National Corporationin the Cocoa Industry ............. ................ IV - 7
V-Al Net Export of cocoa Beans and Processed Cocoa by Major
Producing Countries ...... ................... V - 2
V-A2 Total Imports of Beans and Processed Cocoa ................ V - 4
V-Cl Cocoa Prices ............................................. V - 6
VI-Bl Structure of Tariff Protection in Selected Industrialized
Countries on Cocoa Beans and Processed Product .. ...... VI - 4
VI-B2 Processed Cocoa Products in Major Industrial Markets -Imports and Pre- and Post-Tokyo Round Tariff
Barriers .............................................. VI - 5
Figure
V-Cl Real World Cocoa Prices and Stocks ....................... V - 7

January 1982 1-_
I. INTRODUCTION
Cocoa is grown exclusively in developing countries. Five major
producing countries--Brazil, Ivory Coast, Ghana, Nigeria and Cameroon--account
for close to 80 percent of the total world production. Most of the cocoa
grown in developing countries is exported as beans or in semi-processed
forms. The share of semi-processed forms in total exports has been increasing
in recent years especially in Brazil, Ecuador and Ivory Coast.
Main consuming regions of cocoa are North America, Western Europe and
Centrally Planned Economies of Eastern Europe and USSR; they together account
for over 80 percent of the world consumption. Due to the low income
elasticities of cocoa products and the slow economic growth rates experienced
in the major cocoa consuming countries since the mid-1970s, world cocoa
consumption has been stagnant recently. In the 19809, the secular trend of
world consumption growth, that is the growth rate arising from population and
economic growth, is expected to be about 2 percent per annum.
Because of its low short-term price elasticities of supply and
demand, world prices of cocoa have. fluctuated widely and in a cyclical
manner. Low world production and high world prices in the latter half of the
1970s have resulted in substantial plantings in many cocoa producing countries
which have contributed to considerable production increases recently, and
production is likely to increase even further. The oversupply of cocoa beans,
resulting in increased world stocks for the past four years is expected to
continue until the mid-1980s.
A new International Cocoa Agreement (ICCO), aimed at stabilizing
world cocoa prices, came into effect in August 1981. The economic tnstrument
which will be used to stabilize prices is a buffer stock scheme. In 1981 and
1982 the Buffer Stock Manager of ICCO is expected to buy a substantial
quantity of cocoa beans to protect the floor price of USel10/lb. So far,
prices have stayed below that level due to insufficient purchases by the
Buffer Stock Manager and increasing oversupply.


January 1982 II - I
II. THE PRODUCT
A. Physical Characteristics
Cocoa is an evergreen tree which grows best in the tropics. Depend-
ing on the variety and its general environment, the plant can grow to a height
of between 20 and 40 feet. In practice, the trees are not allowed to reach
such heights since farmers prune them to facilitate picking. The main
varieties of the cocoa tree include Amazon and Amelonado.
Flowers, which can be present at all times, appear in abundance twice
a year on the trunk and limbs of the tree. The flowers grow to about 0.25
inches in height and breadth and have no aroma; they can be pink, white,
yellow or bright red according to the specie. Soon after flowering, fruits
develop into small elliptical pods, maturing within four to six months to a
length of 6-10 inches and a width of 3.4 inches at the center. Each pod
yields 20 - 40 seeds (cocoa beans) arranged around a longitudinal axis, and
these seeds are covered with a sweet-sour tasting white mucilagenous pulp.
The beans are dicotyledonous, oval shaped, and about 1-1.5 inches long.
B. Methods of Cultivation, Harvesting and Processing
Cultivation: Most of the world's cocoa is grown on small farms, two
to five acres in size. Plantings, from seeds, seedlings, or cuttings, are
spaced at intervals anywhere from 5 - 15 feet. Cocoa tends to flourish at
altitudes of 100 - 1,000 feet above sea level, in areas where temperatures do
not range below 65°F or much above 850 - 900°. Rainfall requirements depend
upon the frequency and distribution of rain and soil retention, the minimum
rainfall being 40 inches per year with good distribution and may be, under
some circumstances, as much as 200 inches per year. Successful cultivation
also requires deep, well-drained soil which is porous and rich in humus. In
addition, some effort is needed, to combat diseases and insects and provision
must be made for protection from strong winds (by using higher tree canopies),
weeding, and a small amount of pruning.
Yields: With modest application of proven cultivation techniques andif most of the basic requirements of cultivation are met, a two to four-fold
increase in yield is possible. Traditional varieties of cocoa trees start
yielding cocoa beans about five years after planting. The hybrid variety has
a gestation period of about three years (Table II-B1). Yields increase with
time and reach a peak at around 11 years for the traditional varieties and

January 1982 II - 2
Table II-8l: ESTIMATED COCOA YIELD BY AGE OF TREE IN TOGO
(kg/ha)
Year after Planting Hybrid Type Estitated YieLd /a
4 Amazon X Amelonado 30
5 100
6 300
7 500
8 600
9 750
10 750
la Yields may vary depending on clithatic and soil conditions as well as onthe degree of adherence to generally accepted husbandry practices.
Se-irce: TBRD, Report No. 2408 - TO, June 4. 1979.

January 1982 II - 3
at around 7 for hybrid varieties. With proper maintenance, yields do not
decline for up to 20 to 25 years. 1/ Table II-B2 shows expected typical
yields by type and age of cocoa. 2/
The growth and yield of cocoa trees are frequently affected adversely
by certain diseases. The most commonly destructive diseases of the cocoa tree
are black pod and swollen shoot. Black pod is caused by a fungus
(Phytophthora) spreading rapidly on the pods under conditions of excessive
rain and humidity, insufficient sunshine, and temperatures below 700F.
Control requires timely treatment with sprays of copper salts and constant
removal of infected pods. Swollen shoot is caused by viruses eluding
permanent identification through mutation of sufficient scope that a plant
immune to a specific form is vulnerable to the mutation. The only effective
measure is to cut out and destroy trees affected by this disease.
Other harmful fungus diseases are witches' broom, monilia, and
ceratocystis, found in the Americas and West Indies. Many different insects
cause vegetative and crop damage to cocoa, but the most important commercially
is the capsid family, found primarily in West Africa, where the major portion
of the world crop is grown. Capsids attack the tree canopy, quickly
destroying substantial portions of an oncoming crop if not controlled by
diligent spraying with insecticides.
Rarvesting: Cocoa can be harvested all year, but the bulk of the
crop is gathered in the two flush seasons occurring from October to February
and from May to August. The ripe pods are cut from the trees and split open
with machetes. The beans, removed from the pods with their surrounding pulp,
are accumulated in leaf-covered heaps, in leaf-lined holes dug in the ground,
or in large shallow boxes having perforated bottoms to provide for drainage.
The pulp of common grades (Forastero) is often allowed to ferment for
five to seven days while that of the more distinctively flavored grades
(Criollo) ferment for one to three days. Frequent turning during fermentation
dissipates excess heat and provide uniformity of fermentation. In the course
of fermentation, the juicy sweatings of the pulp are drained away, the germ in
l/ IBRD, "Analysis of the World Cocoa Market," November 1981.
2/ Source: ICCO, PCA/2/2/Add.l, October 1978.

Januarv 19R2 I 4
Table II-2*: PROJECTION OF EXPECTED COCOA YIELD BY TYPE AND AGE OF w IOA
(kg per hectsre)
Traditional HybridYear -3razil 'Ghanat Ivoary,.Coast, Nigeris Brazil Ghana Ivory Coast 'N1gerla-
1 0 0 0 0 0 0 0 0
2 0 0 0 0 20 W/' . 0 0
3 0 0 0 0 200 0 150 0
4 0 0 0 0. 400 50 300 50
5 0 50 '60k 50 700 200 SOO 200
6 0 100 90 100 900 400 800 400
7 100 150 120 200 -1,100 600, 1,000 600
8 200 250 170 400 1,300 800 1,000 800
9 300 350 290 500 1,300 800 1,000 900
10 500 425 4,00 540 1,300 80 1,000 -
11 700 425 425 540 1,300 800 - -
12 700 425 - lb 540 1,300 8oo - -
13 700 345 - 540 1,300 - - -
14 700 200 540 1,300 - - -
1S 550 150 - 540 - - - -
* Data rearranged from lndividual-country tables-from the.-source below.
la Yield from old cocoa trees on land being reheVe-d by Mtrrlalba -method. Renewed covers 30 percentof total land -planted in any one year.
/b Dash implies projection not avillable.
Source: \CCO, 'Survey of the CuBrrent World&Cocoa Economy-with Projections up to 1985," PCA/2/2, 29September .1978.

January 1982 II - 5
the seed is killed by heat, and flavor begins to develop. Feruentation als.,
enables the beans to become plump and full of moisture and makes their
interior develop a reddish-brown color and a heavy, sharp fragrance. The
fermented beans are sun-dried or kiln-dried to reduce about 6 percent of their
moisture content and then bagged for shipment.
Processing of Cocoa: One of the first activities in the processing
chain is to pass cocoa beans through cleaners to remove contaminants. The
cleaned beans are then fed to roasters to reduce moisture content, lower
acidity, deepen color and to enhance flavor. The roasted beans are shelled
and subsequently passed through huskers to separate the shells, husks, and
germs from the nibs (broken pieces of kernels). The roasted nibs are fed into
heated disc crushers for grinding. The grinding process breaks the cell walls
of the nibs, producing a liquor mass consisting of approximately 55 percent
fatty matter. The liquor, or paste, is passed through cooling tunnels and it
solidifies into liquor blocks or kibbled liquor. 1/
Blending and Cocoa Substitutes. At one time it was the general
practice for chocolate manufacturers to blend different grades of cocoa--."fine
flavor" and "ordinary". 2/ The distinction of these two types of cocoa is not
necessarily considered to imply quality differences. Fine flavor cocoas used
to command a premium price, but they are now being sold at almost the same
price as ordinary cocoa. The availability of cocoa substitutes has made it
possible to manufacture chocolate products without the addition of fine flavor
cocoa.
C. Different End-Uses of Processed Cocoa
Cocoa is consumed in various forms. in addition to chocolate bars,
cocoa liquor is used in the production of cocoa butter and powder. Butter is
mainly used in the manufacture. of chocolate and certain sweets. It is also
used in the pharmaceutical and perfumery industry.
Cocoa powders are produced by pulverizing cocoa cakes, made by sub-
jecting'the chiocolate liquor of about 53 to 56 percent cocoa butter content to
hydraulic pressing to remove a predetermined amount of cocoa butter. Cocoa
1/ For more details on the processing of cocoa, see IBRD/CommonwealthSecretariat, "The Economics of Industrial Processing of Cocoa," July 1981.
2/ Ibid.
January 1982 II - 6
powder is used for confectioner's coatings, as well as in cakes, cake mixes,
chocolate milk, other beverages and ice cream. Cocoa is also consumed in the
form of cocoa drinks.
The various forms of cocoa products are available in consumer-sized
packages and in large bulk sizes for use by food manufacturers and
confectioners.

January 19P2 II - 7
REFERENCES
1. FAO, Technical Conversion Factors for Agricultural Commodities, Rome,1972.
2. IBRD, "Analysis of the World Cocoa Market," November 1981.
3. , Coffee, Tea, Cocoa: Market Prospects and Development Lending,1977.
4. m Report No. 2408-TO, June 4, 1979.
5. IBRD/Commonwealth Secretariat, "The Economics of Industrial Processing ofCocoa," July 1981.
6. ICCO, Report PCA/2/2, 29 September 1978.


January 1982 III - I
III. PRODUCTION
A. Geographical DLstribution
World cocoa production since World War II shows a cyclical behaviorwhich cinsists of 7 to 11 years of increasing production followed by aprolonged period of decline in output. This pattern of cocoa production, bochat country level and in aggregate, is illustrated by Table III-Al. Stagnantproduction until 1957 was followed by sharp increases during the period 1957-64. World production stagnated after 1964 until the late 1970s. The highlevel of world production reached in 1964/65 of 1,508,000 tons was notsurpasseJ until 1972/73. With increasing real prices in the late 1970s, worldproduction started to increase again in 1979 and reached record levels of1,620,000 and 1,638,000 tons in 1979/80 and 1980/81 respectively. 1/
World production of cocoa is concentrated in a few tropicalcountries. Brazil, Cameroon, Ghana, Ivory Coast and Nigeria accounted forabout 77 percent of total world production in. 1979/80. In the past,production growth rates in these countries differed significantly. As aresult of these differences, Ghana and Nigeria--the two largest producers ofcocoa in 1970/71, with world production shares of 25 percent and 21 percentrespectively--held only 16 percent and 9 percent of the total by 1980/81,while Brazil and Ivory Coast increased their shares from 12 percent to 22percent and 12 percent to 24 percent respectively during the same period.Meanwhile, Malaysia is becoming an important producer of cocoa with its 1980output of 37,250 tons expected to rise by 8 percent in 1981 2/ and further inthe 1980s.
There are notable differences in the production growth rates of themajor cocoa producing countries (Table III-Al). Such divergence is mainlyassociated with variations in movements of real producer prices. Several
1/ IBRD, November 1981, op. cit., p. IT-3.
2/ "World Commodity Report," 11 November 1981.

L4
Table 11I-Al: WORLD PRODUCTION Bt KAIN COUNTRIES
OD
Actual Estimate Forecast Crowth Rates /a1946 1957 1964 1971 1976 1978 1979 1980 1946-57 957-64 1964-76 1976-80
------ (percent per annu- )-
azil 105 164 119 18' . 314 294 367 4.6 -6.6 .2* 9.7*
mdnican Republic 32 36 33 25 30 33 27 27 1.6 0.5 0.1 -3.1
lombia 8 18 17 21 29 31 30 35 4.5* -0.3 4.4* 4.2
uador 16 31 48 61 72 90 98 75 6.4* 4.3* 3.7* 3.6
ary Coast 36 46 148 180 230 312 373 390 5.6* 15.9' 5.6* 13.4'
ana 195 210 566 392 320 250 290 270 0.2 13.2* -2.0* -2.6
geria 113 82 298 308 165 137 169 149 0.4 14.8 -1.8 -3.9
imerooa 35 65 91 112 82 106 124 112 4.4' 5.7* 1.3 7.9
hera 66 134 188 218 177 207 215 215 4.9* 4.3* 0.1 4.7*
)RLD 623 786 1,508 1,499 1,339 1,480 1,620 1,638 2.6* 7.8* 0.8 4.9*
Significant at 95 percent level.
I Crowth rates were calculated by regression anaLysis.
)urce: GIll and Duffue.
Hi

January 1982 III - 3
studies have shown that real producer prices critically affect the profit-
ability of production and are, therefore, the main determinant of output
growth. 1/
World production of cocoa is generally expected to continue to
increase--probably to about 2,000,000 tons by 1985--because of the rise in the
production of Brazil, Ivory Coast and Malaysia.
B. Price Elasticities of Supply
Cocoa is a tree crop and as such producers of cocoa beans adjust with
some lags to changes in producer prices. This is in sharp contrast to annual
crops where producers can adjust almost instantly to emerging price signals.
Hence, available estimates of price elasticities of supply are generally low.
Estimated price elasticities of supply for the major cocoa producing
countries are shown on Table III-Bl. These estimates are roughly of the same
magnitudes as those estimated by Bateman 2/ for Ghana and Behrman 3/ for
-Ghana, Nigeria, Ivory Coast, Cameroon and Brazil. Their estimates ranged
between .06 and .18 in the short run. However, in the IBRD study (from which
Table III-Bl originates), 4/ prices begin to affect supply with a one-year
lag, while in the Bateman model, between 8 and 12 years elapse before the
price feeds back. Precise comparison of available estimates is difficult
because of differences in the data samples used.
The long-run elasticities are fairly high, particularly for those
countries where there is considerable scope for expanding acreage. Even so,
it would appear that at the aggregate world level, nearly 10 years elapses
before 65 percent of the price effect on production is felt. 5/
1/ See T. Akiyama, "Analysis of Medium-Term Outlook of the World CocoaMarket," June 1981, and IBRD, November 1981, op. cit., p. 11-2.
2/ M.S. Bateman, "Aggregate and Regional Supply Functions for Ghanian Cocoa,"Journal of Farm Economics, May 1965.
3/ J.R. Behrman, "Monopolistic Cocoa Pricing," American Journal of Agri-cultural Economics, August 1968.
4/ IBRD, November 1981, 2o. cit., p. II-3.
5/ Ibid.

January. 1982 III - 4
Table III-BI: PRICE ELASTICITY OF COCOA SUPPLYWITH RESPECT TO PRODUCER PRICE
Shore Run la Medium Term lb Long Run /c
Ghana .18* .11 .126*
Nigeria .099* .105 .113
Ivory Coast .259* .32* .59*
Brazil .103** .39 .54
Cameroon .095* .32* .59*
Ecuador .103** .39 .54
Papua New Guinea .103** .39 .54
ROW .022* .159 .207
World .138 .24 .42
* Significant at 95 percent.** Significant at 99 percent.
/a Current and 1 year lag.
/b Response after 6 years.
/c Steady-state long-run elasticities including feedback from acreageresponse. Based on simulation after 9 years.
Source: IBRD, EPDCE.

January 1982 III - 5
R efrences
1. Adams, F.r. and J.R. Behrman, Seven Models of International CommodityMarkets, University of Pennsylvania, Philadelphia, December 1974.
2. Aki':ama, T., "Anaysis of Medium-Term Outlook of the World Cocoa Market,"
June 1981.
3. Batinan, M.S., "Aggregate and Regional Supply Functions for GhanaianCocoa," Journal of Farm Economics, May 1965.
4. Beh-man, J-.R., "Monopolistic Cocoa Pricing," American Journal of Agri-cultural Economics, August 1968.
5. FAO, Production Yearbook(s).
6. Gill and Duffus, "Cocoa Statistics," (various issues).
7. "World Commodity Report," November 11, 1981.


Janudry 19&2 V-
IV. CONSUMPTION
A. Geographical Distribueion
World apparent consumption 1/ of cocoa grew at an average annual
rate of about 3.6 percent between 1961 and 1970. For the period 1970-7h,
world consumption declined by 0.1 percent per annum. Stagnant world supply
and ensuing high prices, together with slow growth of the world economy since
1974, have largely determined this trend. Global demand reached its peak in
1972/73 at 1,603 thousand metric tons; it declined to 1,371 thousand metric
tons in 1978 (Table TV-Al). When world supply increased and prices fell in
1980/81, demand growth was hindered by unfavorable income conditions in the
major consuming countries.
The major cocoa consuming regions are Western Europe, North America,
the Centrally Planned Economies (CPEs) of Eastern Europe and the USSR (see
Table tV-Al). They together account for over 80 percent of world cocoa
consumption. Consumption growth within Western Europe and North America has
been stagnant for the last ten years. In the CPEs, growth in consumption
showed a rapid increase until 1976, after which time it declined sharply due
to the high prices that prevailed in the international market. 2/ The
consumption of cocoa is concentrated in countries with high per capita
incomes. In 1961 the Western industrialized countries consumed 83 percent of
the total. tn 1978 their share was stilll71 percent. The CPEs have shown the
major gain over this period with their share growing from 8 percent in 1961 to
16 percent in 1978.
Consumption of cocoa is very low in the producing countries. Most of
the cocoa produced is exported. Nevertheless, processed cocoa products in the
form of cocoa beverages, ice cream, etc., are being importd into these and
other developing countries.
1/ Apparent consumption as used and shown on the table here refers togrindings plus the net imports of cocoa products (cocoa butter, cocoapowder, cocoa paste and cake).
2/ Higher prices tend to influence negatively availabilities to domesticconsumers through foreign exchange constraints imposed by the planning

ri
Table IV-Al: WORLD APPARENT CONSUKPTION, BY MAIN REGIONS
Growth Rate1961 1965 1970 1975 1976 1977 1978 1961-78 1961-70 1970-78
-- (~i'OCO ot)---- … ~ ---- (percent per annum)----
North America 341 386 394 347 406 363 371 0.5 2.0 -1.7
Western Europe 442 561 540 543 549 539 538 0.9 2.2 -0.6
Other IndustrialixedCountries 48 76 77 88 87 76 64 1.6 4.7 -1.9
Centrally Planned Economies 84 162 207 330 313 237 221 6.6 10.7 1.4
Latin America 101 116 111 125 129 115 122 0.9 0.9 0.9
Other DevelopingCountries 11 19 20 28 26 29 26 5.5 7,4 2.1
WORLD TOTAL /a 1,000 1,297 1,354 1,429 1,516 1,423 1,371 1.9 3.6 -0.1
/a World grindings do not necessarily equal regional totals due to the different sources of data used forgrindings and cocoa product trade.
Source: Crinding. are from Gill and Duffus, Cocoa Statistics, vhile cocoa product data are from the FAO TradeTapes.

January 1982 IV - 3
B. Income and P'tce Tlasticities of Demand
Estimates of income and price elasticities of demand from different
studies 1/ point to the fact that the demand for cocoa is very inelastic with
respect to both income and price. Table IV-Bl shows ICCO estimates of income
and price elasticities of cocoa demand for selected industrialized countries.
In a recent World Bank study, 2/ world income elasticity of demand
was est:mated to be 0.55 while world short-term and long-term price
elasticit ies were -0.16 and -0.30 respectively. A comparison with other
estimates indicated that this short-term world price elasticity is similar to
the short-term elasticity of -0.18 reported in the ICCO study in 1978. 3/ The
aggregate long-term price elasticity of -0.30 is also close to the estimate of
-0.28 obtained by Behrman 4/ and is only slightly lower than the estimate of
-0.34 by Goreaux. 5/ In the IBRD study, estimates of income and price
elasticities were also made for six economic regions and these are shown on
Table IV-B2. 6/
Regions with high income are observed to have low price elasticities
of demand, compared to regions with lower income. The exception is Latin
America, which is a major cocoa producing region.
C. Market Structure
The Marketing Boards, as well as private and cooperative trading
establishments in bean producing countries, market their products mainly
through a handful of private dealers or other intermediaries in London, Paris-
and New York. In the trade with socialist countries cocoa is partly sold
1/ ICCO, Survey of the Current World Cocoa Economy with Projections up to1985, September 1978; J.R. Behrman, 1968, op. cit., p. 12, and L.M.Goreaux, Price Stabilization Policies in World Markets for PrimaryCommodities: An Application to Cocoa, February 1975.
2/ T. Akiyama, June 1981, 2p. cit., p. III-3.
3/ See 1/.
4/ See 1/.
5/ See 1/.
6/ Income per capita and deflated world cocoa prices are the main variablesused to exolain oer canita consumntion in thtqp rpoit'-na

January 1982 IV - 4
Table IV-Bl: INCOME AND PRICE ELASTICITIES OF DEMAND ESTIMATED BYTHE ICCO FOR SOME MAJOR CONSUMING COUNTRIES
Country Price Time Lag /a Elasticities at 1973 Level(months) Price
Income 1st Lag /a 2nd Lag /a
Germany 6;18 0.37 -0.14 -0.09
France 9 0.47 -0.09
Italy 6 0.55 -0.06
Netherlands 6 0.23 -0.23
Sweden 6 0.39 -0.23
Switzerland 9 0.30 -0.13
United Kingdom 6;18 0.32 -0.12 -0.19
United States 6 0.36 -0.14
Japan 9;21 0.52 0.37 -0.22
Australia 9;21 0.28 -0.11 -0.17
,a The ICCO Indicator p' defla? oy the -i., was . d..... .i'' r
different countripg %- a..- .. e, in e2tl- ^ - r.-deflated prices with -ab c' 6 and 18 monthb ar l 4;ed while for France, aprice with lag o' 9 m-ath. is used.
Source: Excerpts from Appendix Table XIV, ICCO, Study of Cocoa Productitn andConsumption Capacity, ugust 1975.

,anuary t982 IV - 5
Table IV-B2: INCOME AND PRICE ELASTICITIES OF DEMAND FOR COCOA
Price Income /aCurrent Lagged Total Current Long-Term
North America -0.120** -0.107* -0.227 0.3416** -
Western Europe -0.135** -0.075* -0.210 0.354** -
Other IndustrializedCountries -0.235** -0.452** -0.687 0.110 -
Centrally PlannedEconomies -0.269** -0.847 0.240 /c 0.756 Ic
Latin America /b -0.105* -0.105 0.229** -
Other DevelopingCountries -0.333* -0.197 0.530 1.536**
** Significant at 99 percent level.* Significant at 95 percent level.
/a The long-term income effect was found to be significant only for the CPEcountries.
/b The demand equation using consumption per capita did not produce goodresults. Results shown here are for total consumption.
/c Specification of the equation is such that the income elasticity declineswith income. The figure given here is for year 1980.
Source: IBRD, "Analysis of the World Cocoa Market," November 1981.

January 1982 IV - 6
under bilateral trade and payments arrangements with trading organizations in
those countries. Irrespective of spatial differences, all cocoa is virtually
sold with reference to prices set in the terminal markets. The three major
term4nal markets, London, Paris and New York, constitute the world futures
market.
The market for processed products is far more complex. It is
complicated by the nature and organization of the cocoa products industry. A
distinct feature of that industry is the small number of companies engaged in
the processing of cocoa and manufacture of products. The degree of downstream
integration and ownership can be ascertained from the information given in
Table IV-Cl below. The degree of control exercised by these companies spreads
beyond their geo-political boundaries. The degree of control is either
exercised directly by means of operating enterprises elsewhere or indirectly
through the provision of technology and marketing facilities. 1/ The twelve
companies shown in the table (IV-Cl) account for 80 percent of the total
production of cocoa products. It is conceivable that since these companies
'maintain a substantial. market, it may induce monopsonistic buying and
transfer pricing in the case of subsidiaries and collaborating industrial-
ists". 2/-
1/ IBRD/Commonwealth Secretariat, o. cit. p. II-5.
2/ Ibid.

January 1ss i9 - ;
Table IV-Cl: OPERATIONS OF 4ULTIPROWUCT AYD MULTI-NATIONAL CORPORATIONI1 THE _OCOA MIUSTRY
Countries in WhichParenc or S.Lbsidiar? Principal Croup ofParent Company CoapanLSs Overate Products Processed
Neste.e, S.A. 13 countries in Ves'ern Europe Cocoa products, bever(Switzerland) Unitad Scaces, anacla, AustralLa, agee, milk products,New Zealant.. Sotth .frica and soups. infant foods,12 developing c untries frozen foods.
Cad3uLv 6 countries in bestern Europe, Cocoa products, confec-S:hwerpese %td., k st-.al a, 'fev ealirid, South tionerv, biscuits and,UK) Atri.:a, Cat.ra, Ind:..., Nigeria, cakes, tea, coffee, softKenyta, .arJ..ca, Rhod.sia, drinks, jams and otherGCana auid :.vrbiat food processing.
Rershey Foods Utniced States, Canada, Maxico, Cocoa products conven-Corp. (USA) 3razil. ience foods, biscuits,sacaroni, etc.
Rowntree- 7 countries in Westerr Europe, rCcoa products, choco-.Mackintosh Canada, Australia, South Africa late and sugar confec-(UK) Ltd. and New Zealand. tionery grocery pro-ducts.
Interfood, S.A. 8 countries in 'Aestern Europe, Cocoa products, choco-(Switzerland) Argentina, USA and Canada, late and sugar confec-Ivory Coast. tion-ry, biscuits and
cakes, beverages.
MarS :nc., United States and 7 councries Cocoa products, choco-(USA) In Wescern !urope. late and sugar confec-tionery.
W.R. Grace a Co. Uniced States and 4 countries Cocoa products, choco-(USA) in Wescern Europe, Canada, lace confectionery,Singapore. chemicals, plastics,
pet roleu.
General Foods United States, Canada Cocoa products, choco-Corp. (USA) late, beverages, frozenfoods, cereals, etc.
Jnited Biscuits UK, Canada and Australia. iscuits, cakes, crisps(Holdings) and nuts.
Ltd., (UI)
Cacao Barry, France, Italy, Ivory Coast, Cocoa products, choco-S.A. (France) Cameroon, Canada, Unired late confectionery.States.
Unilever 'Jestern _urope, owns Sensdorp, Cocoa oroducts and alargest factory for production large number of otherof cocoa products in Geranv. co-odittes.
Gill 6 Duffus UK, Brazil, Ghana, US, Canada Cocoa products, world-sLcd., (UK) largest dealer in cocoa.
Source: Adapted from UNCTAD paper Mfarkeeing and Ostcribution System forCocoa, tD/S/C.1, 64, 9 January 1975.

January 1982 Iv - e
References
1. Adams, F.G. and J.R. Behrman, Seven Models of International Commodity
Markets, University of Pennsylvania, Philadelphia, 1974.
2. Gill and Duffus, "Cocoa Statistics" (various issues).
3. Goreaux, L.M., Price Stabilization Policies and World Markets for Primary
Commodities: An Application to Cocoa, February 1975.
4. IBRDICommonwealth Secretariat, "The Economics of Industrial Processing of
Cocoa," July 1981.
5. ICCO, Survey of the Current World Cocoa Economy with Projections up to
1985, September 1978.
6. , Study of Cocoa Production and Consumption Capacity, August

January I'M v- I
V. TRADE
A. Major Exporters and Im3orters
Most of the cocoa producel is exporteo Largely to inc strlalizec and
CPE countries where the bu!k of processing operations akes placte. The pro-
ducing countries consumt -ily a 'ery small portitn o-: tl r c'c , ou"put
Between 1961 and 1965, eyp- rts consisted mainly of cocoa beans but since the
late 19609, the proportion of cocoa products in total exports has been
increasing (Table V-Al). This is particularly so with reipect co axports of
Brazil, Ecuador and Ivory Coast. Whereas North America imported only 19
percent of all its cocoa in processed form in 1961, the corresponding figure
in 1978 was 49 percent.
As with production, the volume of exports by Brazil and Ivory Coast
increased sharply in recent years while that of Nigeria and Ghana declined.
The development in the last few years to grind an increasing quantity of cocoa
beans in producing countries is probably related in large part to the rising
labor costs in industrialized countries, giving the developing country
producers a comparative advantage in the processing of cocoa. This situation
has made it. profitable for large confectionary firms to process cocoa in
producing countries. 1/ Such a development has meant a slight reduction of
exports of cocoa beans to the traditional export markets. Consequently,
negative rates of growth of bean export are observed for most of the cocoa
exporting countries between 1970 and 1978 (Table V-Al). Another factor which
has affected South American and African production of cocoa products has been
the removal of protection by the United States and by the European Community
under the Lome Convention which began in 1975 (cocoa beans were already free
of duty under the Generalized System of Preferences).
Imports: Two economic regions--the industrialized countries and the
CPEs--have been the traditional importers of cocoa beans and cocoa products.
Together, they account for about 80 percent of total imports.
In the industrialized countries, the leading importers are the United
States, Germany, the United Kingdom and the Netherlands. For the US, the rate
1/ ICCO, Study of Cocoa Production and Consumption Capacity, (ICC/5/8),August 1975, p. 67.

Table V-Al: NET EXPORT Of COCOA BEANS A I PROCESSED COCOA BY MAJOR PRODUCING COUNTRIES
I JOO at)
Growth Rates /a ICountry/Regions 1961 1965 117) 1975 1976 1977 1978 1961-78 1961-70 1970-78
. .
----(percent per annum)--
BrazilCocoa Beans 104 93 120 177 129 108 134 3.5 5.2 2.3Cocoa Products 37 27 48 80 85 94 III 5.3 4.1 9.2
Total 141 120 168 257 214 202 245 5.2 4.9 4.9
EcuadorCocoa Beans 33 39 36 38 22 20 17 -1.8 3.3 -11.7Cocoa Products 0 0.2 5 19 33 45 54 /b - 32.5Total 33 39 41 57 55 65 71 T.-i 4.6 5.6
Ivory CoastCocoa Beans 89 126 143 170 195 158 244 4.6 3.5 4.9Cocoa Products 0 12 37 51 49 41 56 - 5.0 5.0
Total 89 138 180 221 244 199 300 6.0 6.8 4.9
NigeriaCocoa Beans 187 310 196 195 223 165 180 -0.4 0.4 -3.3Cocoa Product. 0 0 25 25 15 20 12 - - -4,9Total 187 310 221 220 238 185 192 0.5 2.0 -3.4
GhanaCocoa Beans 41Z 502 367 322 328 250 207 -2.8 -3.1 -6.0Cocoa Products 7 55 45 49 50 48 38 4.5 15.0 -3.3Total 419 557 412 371 378 298 169 -2.2 -1.7 -5.6
CameroonCocoa Beans 66 78 72 72 69 63 62 -0.1 0.7 -3.9Cocoa Producto 4 8 21 26 22 23 29 5.5 10.7 2.2Total 70 86 93 97 91 76 91 1.1 -2.4 -2.3
TOTAL ALL COUNTRIES 939 1,247 1.115 1,223 1,220 1,025 1,068 0.7 3.5 -0.5
/a Calculated by regression.71F Implies no signiflcant trend.
Sources: PAO Trade Yearbooks; and Gill and Duffus.

Januarv 1982 V -3.
of growth of imports averaged 1.3 percent per annum between 1961 and 1970, but
it declined to 0.3 percent per annum during the last decade. Corresponding
figures for Metherlands were 1.6 percent and 1.4 percent during the periods in
question. The growth rate of imports for UK remained almost unchanged at
about 0.3 percent per annum. Grwyth in cocoa imports has been relatively
si4nificant .in Germany wv-ere thve !.6 percent annual growth rate during 1961-
19?9 increased to 3.1 percent per annum between 1970-1978 (Table V-A2).
The USSR is a major importer of cocoa among the CPEs of Eastern
Europe. Like many other traditional importers, its rate of growth of imports
has been declining substantially in the last few years.
B. Marketing and Distribution
Manufacturers of cocoa products and processors purchase most of their
bean requirements through brokers and dealers who in turn buy on the terminal
market. Rence, the importers, brokers and dealers guide the supplies of cocoa
from the exporter to the processor of beans and manufacturers of end products.
Several of the companies (Table TV-Cl) that manufacture cocoa
products also have their own distribution and retail chains. Some of the
companies act merely as marketing and distributing outlets for the manufac-
turers. Thus, in West Africa, "most processors sell their products forward on
two month contracts to dealers and brokers in London" 1/ for further distri-
bution.
C. International Prices
Cocoa prices tend to fluctuate widely in international markets in
response to supply fluctuations. Since demand is relatively stable even in
the face of substantial price fluctuations, stocks also fluctuate a great
deal.
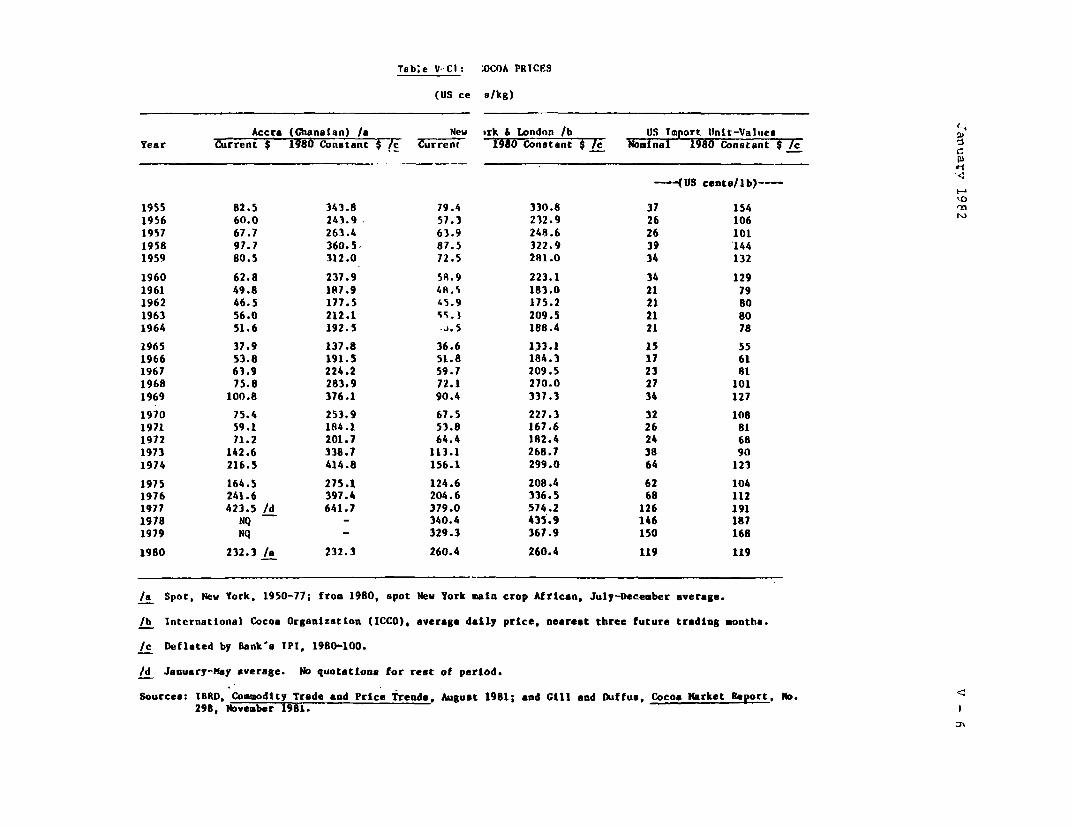
In the 1957-64 period, sharply increasing supply (and hence stocks)
was accompanied by a fall in real prices (Table V-Cl). Similarly, in the
1964-76 period, stagnant production and an appreciable decline in stocks
generatd rapid increases in real prices. From 1976 until the present,
declines in real prices have again been brought about by increasing production
and rising stocks. The inverse relationship between stocks and prices is
illustrated with Figure V-Cl below.
1/ IBRD/Commonwealth Secretariat, op. cit. p. 11-5.

January 1982 4
Table V-AV TOTAL IMPOlTS 0 SZAtMS AND PROCESSO COCOA
Acua1 Cwrowth Itels6l 1965 1970 197I 1976 1977 1973 l961-78 1961-70 -37g5
(-000 mi) - (parcmnt per 4num)-
bath Amrisc'Cocoa sgies 356 374 294 239 241 172 211 (2.9) (1.0) (3.)Cocoa ftodoat: 84 85 116 133 170 174 206 6.6 3.3 96Total 442 441 410 372 A11 346 415 (0.4) (0.8) 0.1
Vatted stacnCocoa leans 342 353 277 228 229 161 19 (3.u) (2.1) (3.7)Cocos eod t 75 64 90 110 145 150 160 5.0 1.8 8.0Toell 417 417 367 338 374 311 376 (0.5) (1.3) 0.3
Western blropCocoa lei S07 574 51.4 536 541 514 54l 0.4 0.1 0.4Cocoa Products 95 127 178 242 238 251 258 5.7 6.5 4.2Tocal 602 701 669 778 779 765 799 1.6 1.4 1.7
Guamm ,Cocoa baa 125 164 123 161 149 150 159 1.4 - 2.7Cocoa Poducts 7 13 26 33 32 39 42 10.5 14.9 4.Total 131 176 153 194 181 189 201 2.4 1.6 3.1
Coabaages rn 5 63 40 38 43 41 45 (1.5) (3.8) 1.3Cocoa Prtoduct 6 13 29 53 54 58 60 13.6 17.1 0.4Total U 76 69 91 97 99 105 2.7 0.6 4.8
Vatted KiugdinCoca& Bem 8 s 80 79 73 81 70 79 (0.5) (0.9) -Coca Prodocts 7 4 46 56 50 54 52 1.9 2.6 0.9?egal 123 124 127 129 13. 124 131 0.4 0.3 0.4
Cocoa aname 36 42 42 29 35 26 30 (1.0) 1.6 (3.7)Cocoa 8rodmtJ 0.3 0.7 2 7 9 10 11 2242 20.9 20.9Tocel 36.3 42.7 44 36 44 36 41 31.4 1.9 (0.8)
RetherlaudeCocoa baum 109 lis 116 11 123 129 128 0.9 0.6 1.1Cocoe Profdta 10 13 23 37 31 29 29 6.1 8.7 2.6Total U9 121 139 155 154 15e 157 1.6 1.6 1.4
Cocoa leas 2 25 35 29 33 30 22 14.6 33.1 (5.0)Cocoa Pretdes 6 l6 13 18 18 16 14 4.8 8.0 0.8
.?T0c1 0 31 48 47 5. 46 36 8.7 19.6 (3.2)
Othbr lnduatriallsiCocoa lease 23 21 24 25 24 23 21 (0.5) Of.4 (1.3tCocoa Producte Li3 2 23 33 28 24 24 3.5 5.9 0.8Total 36 45 47 58 52 47 A5 1.3 2.7 (0.5)
bslep ig Couatwee (bt t.)Cocoa 3.9* 24 47 43 39 43 38 31 1.4 6.0 (3.6)Cocoa Produces 7 11 l6 21 24 26 24 7.1 8.6 (4.6)Total 31 58 59 60 67 64 35 3.2 6.7 (0.8)
Centrally P1and tboose_leCocOa Bon 6s 172 184 297 264 192 210 6.6 10.8 1.3Cocoa-ou to 3 2 4 5 6 11 22 11.7 2.9 20.9total 69 174 18 302 270 203 232 7.0 10.5 2.4
Settet DaobCocoa s.ea 16 8S 100 156 134 73 103 10.9 20.1 0.3Cocoa Producte 3 7 12 33 30 i1 10 6.9 14.9 (2.0)Total 19 95 112 169 164 92 113 10.4 19.4 0.1
Sources: ?AO Trade Yeerbooksa *GIl cnd OaftNe *cu lCCO.

January 1982 v - 5
An important factor in the world cocoa market is the Tilternational
Cocoa Agreement which came into effect on August 1, 1981. The Agreement
Incorporates a buffer stock scheme aimed at reducing price fluctuations (see
Section VI-A).
The world indicator price series, shown here for New York and London
(Table V-Cl) is that adopted by the International Cocoa Agreement. 1/ It is
used in place of the former 'Accra, Spot New York' series because that price
series has been sporadically quoted since late September 1977.
1/ The International Cocoa Organization (ICCO) calculates cocoa prices dailyby averaging the London and New York Stock Exchanges' nearest three active
Tab;e V--Cl: OCOA PRICES
(US ce slkg)
Accra (Ghanatan) /a New irk & Landon /b US Import lUnit-ValuesYear Current $ 1980 Constant $ Ic Current 1980 Constant $ IC Nominal 1980 Constant $ /c
---(US cents/lb)---
1955 82.5 343.8 79.4 330.8 37 1541956 60.0 243.9 57.3 232.9 26 1061957 67.7 263.4 63.9 248.6 26 1011958 97.7 360.5 87.5 322.9 39 1441959 80.5 312.0 72.5 281.0 34 132
1960 62.8 237.9 SR.9 223.1 34 1291961 49.8 187.9 48.% 183.0 21 791962 46.5 177.5 !.5.9 175.2 21 801963 56.0 212.1 *5.) 209.5 21 801964 51.6 192.5 .j.5 188.4 21 78
1965 37.9 137.8 36.6 133.1 15 551966 53.8 191.5 51.8 184.3 17 611967 63.9 224.2 59.7 209.5 23 811968 75.8 283.9 72.1 270.0 27 1011969 100.8 376.1 90.4 337.3 34 127
1970 75.4 253.9 67.5 227.3 32 1081971 59.1 184.1 53.8 167.6 26 811972 71.2 201.7 64.4 182.4 24 681973 142.6 338.7 113.1 268.7 38 901974 216.5 414.8 156.1 299.0 64 123
1975 164.5 275.1 124.6 208.4 62 1041976 241.6 397.4 204.6 336.5 68 1121977 423.5 /d 641.7 379.0 574.2 126 1911978 NQ - 340.4 435.9 146 1871979 NQ - 329.3 367.9 150 168
1980 232.3 /a 232.3 260.4 260.4 119 119
/a Spot, New York, 1950-77; from 1980, spot Nev York main crop African, July-December average.
/b International Cocoa Organization (ICCO), average daily price, nearest three future trading months.
/c Deflated by Bankas IPI, 1980-100.
/d January-May average. No quotatlons for reat of period.
Sourcea: IBRD, Commodity Trade and Price Trends, Auguat 1981; and Gill and Duffue, Cocoa Market Report, No.298, November 1981.

January 1982 V -7
Figure V-Cl: REAL WORLD COCOA PRIC!Z/a AMD STOCKS
1000.0-
8.0.0
World *tock]_("a Left scale)-A
4a. a
2M0.0
2ao0t\ r t~~~~~~~~~~~~~~~~~(US$fb
Real cocoa pricis(sea right scal.)-- |
502, '54 W eb58 80 2 34 Sa B 70 72 74 715 ; 8-
* SA Imnart u ni valu* daflatad bv the Bankts T.P2. (1978'1OC)

January 1982
v - 8
References
1. FAO, Trade Yearbook (various issues).
2. Gill & Duffus, Cocoa Market Report, No. 298, November 1981.
3. IBRD, "Analysis of the World Cocoa Market," November 1981.
4. , Commodity Trade and Price Trends, August 1981.
5. IBRD/Commonwealth Secretariat, "The Economics of Industrial
Processing of
Cocoa," July 1981.
January 1982 VI - I
VI. SPECIAL ISSUES
A. Government Involvement and International Cocoa Agreements
A major feature of the trade in cocoa is the degree of involvement by
governments of both the producing and importing countries. As with many other
primary commodities, state purchasing and/or marketing authorities tend to
dominate the picture. International agreements have become an important
vehicle for dealing with fluctuating cocoa (commodity) prices as well as for
settling other problems and governments have had, at different occasions, to
decide whether or not to become a party to a given commodity agreement.
The New International Cocoa Agreement. The first International Cocoa
Agreement went into effect on October 1, 1973 for a period of three years. It
was, aimed at reducing wide price fluctuations, stabilizing export revenues,
and ensuring adequate supplies of cocoa. The main instruments to be used
under the Agreement to achieve these objectives were export quotas and buffer
stock scheme. A second agreement, which was basically a continuation of the
first, came into effect on October 1, 1976, for another three years. It was
extended in October 1979 but expired on May 1980.
During the period when the Agreements were in force, the inter-
national cocoa price did not fall below the agreed prices. Thus, the measures
envisaged by the Agreement were not put to test.
Before and after the Agreement expired in March 1980, considerable
efforts were made to establish a new agreement, which eventually came into
force on August 1, 1981. Producing countries accounting for 72 percent of
world production and consuming countries accounting for 61 percent of world
consumption have now joined the Agreement. Rowever, the biggest producing
country, the Ivory Coast and several important consuming countries such as the
United States, Japan and Australia have not joined the new Agreement.
In terms of instruments, the main differences between the previous
and current agreement is that the latter has only the buffer stock scheme as
the sole instrument for supporting and stabilizing prices. The export quota
system was omitted because coordination between the two instruments was
thought to be extremely difficult. The buffer stock scheme, which has its
maximum capacity set at 250,000 tons of cocoa beans equivalent, is to tnter-
vene in the market to keep prices within the bounds established under the
terms of the-Agreement. The lower and upper intervention prices are presently

January 1982 VI - 2
IJSclIO/lb and US150/lb, respectively, ii terms of the ICCO indicator price,
which is calculated by taking the average of daily quotations for cocoa beans
of the netsrest three active futures trading months in the New York Cocoa
Exchange and In the London Cocoa Terminal Market. In order to finance buffer
stock operations, the buffer stock account will receive transfers of approx-
imately US$230 million from the buffer stock account of the previous agreement
and regular revenues in the forrm of contributions charged on either cocoa
exports or imports to the members of the Agreement, at the rate of 2¢ for each
pound of c)coa bean equivalent traded. The Buffer Stock Manager also has the
capactty to borrow funds and to raise the levy, subject to the consent of
members of the Agreement.
In each cocoa seasona the highest authority of the International
Cocoa Organization (ICCO), the ICCO Council, is to review the price range and
determine if revisions are needed. In conducting this review, the Council is
to take into consideration the trend of cocoa prices, consumption, production,
stocks, and the Influence on cocoa prices of changes in the world economic
situation and monetary system. It is stipulated in the Agreement that if con-
secutive purchases (sales) of 100,000 tons take place, the price will be
revised downwards (upward) by 4cJ/lb, and if as additional 75,000 tons of con-
secutive purchases (sales) occur, the floor (ceiling) price is to be lowered
(raised) by another 4cIlb. 1/
B. Existing Tariffs and Non-Tariff Barriers (lTB's)
Tariff and non-tariff barriers may restrict the flow of increased
quantities of exports to some markets in the industrialized couutries. Unlike
non-tariff barriers, tariff barriers are easy to identify and can be easily
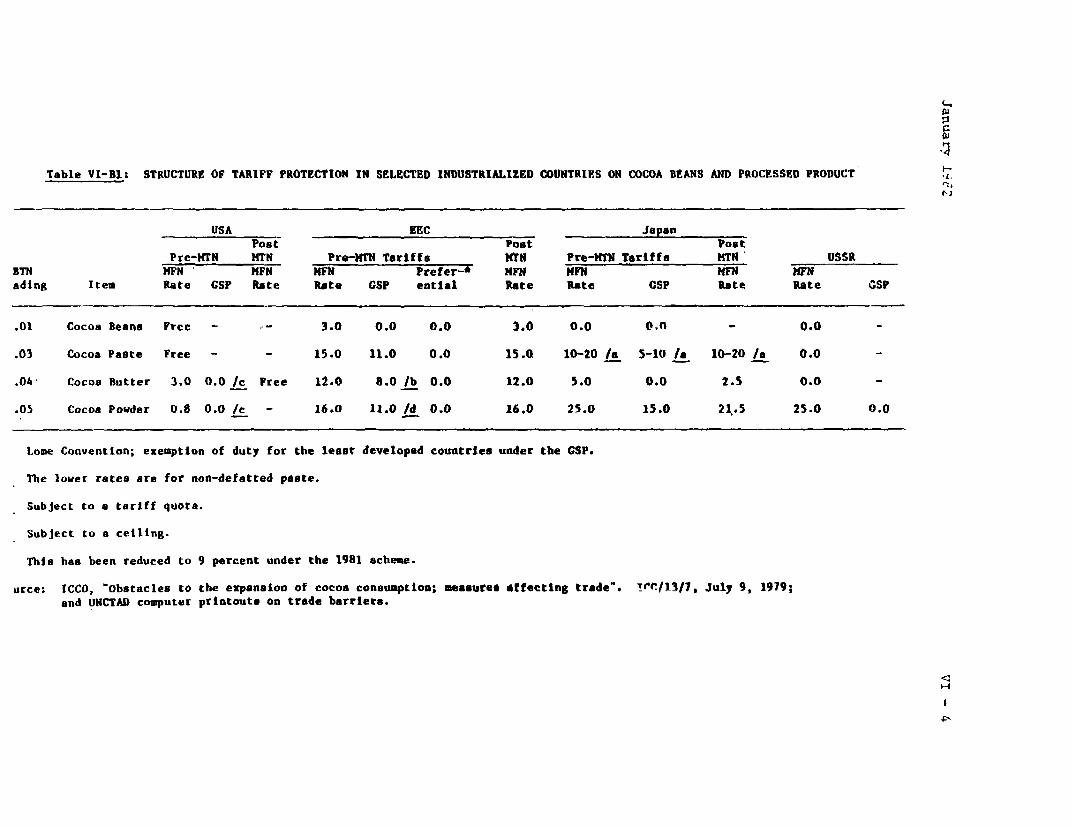
quantified. Table VI-El shows the nominal rates cf protection (as measured by
the nominal tariff rates) given to the processing industries in these
countr$es. Much of the cocoa products trade is either free or faces
relatively small nominal t3riffs in the two major consuming centers of the
world. Exports from the ACP states (including all the African cocoa
producers) are completely duty free as a result of concessions granted under
the Lome Convention. Under the REC's GS? the developing countries falling
outside the AC? group have also been given duty-free entry for their processed
exports to the EEC, though none of these are significant cocoa producers. For

January 1982 VI - 3
all other developing countries the three processed products--paste, butter and
powder--face duties of 11, 8 and 11 percent respectively, having been given
only partial duty reductions (roughly one-third of the MFN tariff) under the
EEC's GSP. In the case of cocoa butter this concession is in theory
restricted to a tariff quota of 21,600 tons (in 1980) beyond which all imports
must pay the full MFN tariff. In practice, however, total imports from GSP
beneficiaries have remained well below this level. In the US all imports of
cocoa paste are duty-free, while for butter and powder the MFN tariff rates
are very low at only 3.0 and 0.8 percent respectively, and even these will be
reduced to zero following the Tokyo Round tariff cuts. GSP suppliers have
enjoyed zero duties on both products since 1976, and this may explain the
impressive record of developing countries, particularly Latin America, imports
in the US market. It should be noted, however, that if imports of butter or
powder from a single country in any year exceed $25 mn (in 1976) l/ or 50
percent of US imports of that product, whichever is the lower, they must pay
the full MFN duty the following year. In 1979 imports of both butter and
powder from the Ivory Coast and Brazil exceeded this ceiling. 2/
Other indicators of tariff barriers on various processed cocoa
products in Canada, the EEC, Japan, Sweden and United States are shown on
Table VI-B2.
1/ This figure is increased annually in relation to their GNP.
L4
Table Vl-Bl: STRUCTURE OF TARIFF PROTECTION IN SELECTED INDUSTRIALIZED OOUNTRIES ON COCOA BEANS AND PROCFSSED PRODUCT
USA EEC _a_tJapan _Pos t Poet Post
Pre-MTN MTN Pre-MMN Tariffs MtN Pre-MTN Tariffs WTN USSRBTN MHFN PN MHFN Prefer-* HFN HVFNP MM ?FNading Item Rate CSP Rate Re CSP ential Rate Rate CSP Rate Rate GSP
.01 Cocoa Beans Free - - 3.0 0.0 0.0 3.0 0.0 0. - 0.0°
.03 Cocoa Paste Free - - 15.0 11.0 0.0 15.0 10-20 /a 5-10 Ia 10-20 /a 0.0 -
.04 Cocoa Butter 3.0 0.0 /c Free 12.0 8.0 /b 0.0 12.0 5.0 0.0 2.5 0.0 -
.05 Cocoa Powder 0.8 0.0 /c - 16.0 11.0 /d 0.0 16.0 25.0 15.0 21,.5 25.0 0.0
tome Convention; exemption of duty for the least developed countries under the GSP.
The lower rates are for non-defatted paste.
Subject to a tariff quota.
Subject to a ceiling.
This has been reduced to 9 percent under the 1981 scheme.
urce: ICCO, 'Obstacles to the expansion of cocoa consumption; measures effecting trade'. jtr/13/1, July 9, 1979;and UNCTAD computer printouts on trade barriers.
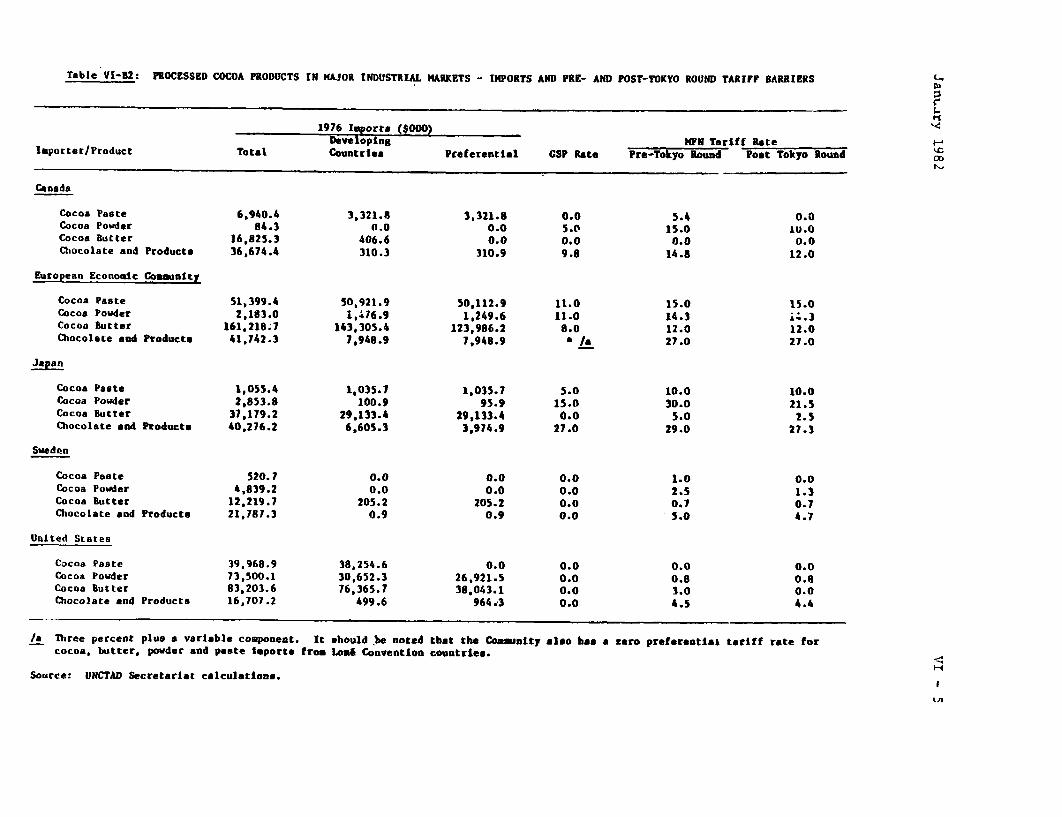
Table VI-I2: PROCESSED COCOA PRODUCTS IN HAJOR INDUSTRIAL MARKETS - IMPORTS AND PRE- AND POST-TOKYO ROUND TARIFF BARRIERS
1976 I1 orta ($000)Developing MFN Tariff Rate
Importer/Product Total Countries Preferential CSP Rate Pre-Tokyo Round Post Tokyo Round
Canada
Cocoa Paste 6,940.4 3,321.8 3,321.8 0.0 5.4 0.0Cocoa Powder 84.3 f.0 0.0 5.0 15.0 1U.0Cocoa Butter 16,825.3 406.6 0.0 0.0 0.0 0.0Chocolate and Products 36,674.4 310.3 310.9 9.8 14.8 12.0
European Economic Comaunity
Cocoa Paste 51,399.4 50,921.9 50,112.9 11.0 15.0 15.0Cocoa Powder 2,183.0 1,;76.9 1,249.6 11.0 14.3 i; 3Cocoa Butter 161.21817 143.305.4 123,986.2 8.0 12.0 12.0Chocolate and Products 41,742.3 7,948.9 7,948.9 a 27.0 27.0
apan
Cocoa Paste 1,055.4 1,035.7 1,035.7 5.0 10.0 10.0Cocoa Powder 2,853.8 100.9 95.9 15.0 30.0 21.5Cocoa Butter 37,179.2 29,133.4 29,133.4 0.0 5.0 2.5Chocolate an4 Producta 40,276.2 6,605.3 3,974.9 27.0 29.0 27.3
Sweden
Cocoa Paste 520.7 0.0 0.0 0.0 1.0 0.0Cocoa Powder 4,839.2 0.0 0.0 0.0 2.5 1.3Cocoa Butter 12,219.7 205.2 205.2 0.0 0.7 0.7Chocolate and Products 21,787.3 0.9 0.9 0.0 5.0 4.7
United States
Cocoa Paste 39,968.9 38,254.6 0.0 0.0 0.0 0.0Cocoa Powder 73,500.1 30,652.3 26,921.5 0.0 0.8 0.8Cocoa Butter 83,203.6 76,365.7 38,043.1 0.0 3.0 0.0Chocolate and Products 16,707.2 499.6 964.3 0.0 4.5 4.4
/a Three percent plus a variable component. It should be noted that the Coamanity also has a zero preferentlat tariff rate forcocoa, butter, powder and paste Imports froo Loa6 Convention countries.
Source: UNCTAD Secretariat calculations.

January 1982 VI - 6
References
1. IBRD, "Analysis of the World Cocoa Market," November 198;.
2. _, "International Cocoa Agreement: An Assessment," Commodity
Paper No. 19 (2/76).
3. UNCTAD, International Cocoa Agreement 1980, TD/COCOA.6.
4. , The Processing Before Export of Cocoa: Areas for Inter-
national Cooperation, 1981, TD/B/Cl/PSCf 18.