coastal sediment dynamics by l.c. van rijn; …€¦ · wave action.a special category of coastal...
TRANSCRIPT

1
COASTAL SEDIMENT DYNAMICS by L.C. van Rijn; www.leovanrijn-sediment.com
1. Introduction Nearly all coastal states have to deal with the problem of coastal erosion. Coastal erosion and accretion have always existed and these processes have contributed to the shaping of the present coastlines. However, coastal erosion now is largely intensified due to human activities. Presently, the total coastal area (including houses and buildings) lost in Europe due to marine erosion is estimated to be about 15 km2 per year. The annual cost of mitigation measures is estimated to be about 3 billion euros per year (EUROSION Study, European Commission, 2004). Although engineering projects are aimed at solving the erosion problems, it has long been known that these projects can also contribute to creating problems at other nearby locations (side effects). Dramatic examples of side effects are presented by Douglas et al. (The amount of sand removed from America’s beaches by engineering works, Coastal Sediments, 2003), who state that about 1 billion m3 (109 m3) of sand is removed from the beaches of America by engineering works during the past century. This note describes:
• types of coasts and sediments; • morphological features; • sediment transport processes; • coastal sediment cells and budgets; • erosion and variability of sand and gravel coasts.
2. Coasts and sediments 2.1 Types of coasts Coasts bordering the seas and oceans consist of large masses of terrigenous sediments eroded from the continents and deposited on the beach, shoreface and shelf. Estimates are that the continents are weared down at a rate of about 3 mm per 100 years. Sediments are delivered to the sea by rivers (roughly 1 to 10 km3 per year; 90% of total input), by glaciers (polar region), by wind, by volcanic action, by wave-induced cliff/dune erosion and by biogenic production. Sediments of the shoreface and shelf can be transported to the deep oceans via submarine canyons incised into the continental margin and via turbidity currents and gravity currents over the shelf edge. Short-term deposition rates near coastlines can be as high as 10 m per year in regions with large river input (Yellow River). Redistribution of sediments over the sea and ocean floor takes place by waves and currents. The Shelves covering 5% of the Earth's surface, can be seen as the submerged parts of the continents. Shelves are not so deep; the average depth for the Atlantic Shelves is about 130 m. Wide and sandy/silty shelves are present on passive margins; narrow and rocky shelves are present on active margins. All continental shelves have a base of sediments deposited during periods of fluctuating sea level in the Pleistocene with the shoreline migrating over large horizontal distances. The present coastline and surrounding coastal configuration are determined largely by the postglacial rise of the sea level. On a geological scale many coastal areas are simply drowned portions of a subaerial landscape or exposed portions of the seafloor on which the position of the coastline is the result of land uplift or subsidence or of a rise or fall of the sea level. Lowland systems are particularly susceptible to drowning as sea level rises, producing estuaries that interrupt otherwise regular coastlines. Mountain ridge crests or hill summits create peninsulas or islands separated by drowned former valleys. Above sea level all land is exposed to erosive forces by rain, wind, flow of water etc. Rivers deposit their loads of sediment (silt, sand and mud) near outlets at the sea, which are then shaped into deltas and sandy beach

2
type landforms. Mud will be trapped by vegetation in low- energy environments to form extensive coastal salt marshes or tropical mangrove swamps. Muddy and sandy materials may also move alongshore by tide and wave action.A special category of coastal landform types is that created by biogenic deposits of shallow marine animals such as corals forming reefs that fringe or protect the coastline from wave- induced erosion. Beach material may exhibit a wide range of variation in size, from fine mud and silt to pebbles and boulders; extremes are beaches consisting of regular granite spheres of 1 to 2 m in diameter as present along some parts of the coast of Russia (Murmansk) and Iceland. Beaches consisting of mixtures of fine and coarse materials are marked by zonation due to selective transport processes (sorting). Beaches also vary in the type of materials: mud, quartz sand, gypsum, carbonate (shell) and coral materials. Based on sediment composition of the beach material, the following classification can be made: mud coasts, sand coasts (quartz, coral sand), gravel/shingle coasts, rock and cliff coasts. About 5% to 10% of the world's coasts consists of muddy coasts; about 10% to 15% consists of sandy coasts and about 75% to 85% consists of rock, cliff and gravel-type coasts. Based on typical coastal features (phemenological or morphological), another classification can be made: barrier island coasts, delta coasts, dune coasts, cliff coasts, coral reef coasts, mangrove coasts, marsh grass coasts, etc. Based on river discharge (water and sediment), wave climate and relative strength of tide- induced (tidal range TR) and wave-induced forces (H = annual mean nearshore wave height H), the following classification may also be given:
• riverine-dominated coasts, • wave energy-dominated coasts (TR/H= 0.5 to 1), • tide energy-dominated coasts (TR/H > 3), • mixed energy coasts (TR/H = 1 to 3).
Rock and cliff coasts are high and steep-faced coasts (reflective-type coasts) without a noticeable beach in front of it and consisting of consolidated and unconsolidated materials of arbitrary mechanical strength, ranging from granite and basalt to sandstone and mudstone of different origin. A characteristic feature of many rock coasts is the presence of a shore platform at the base of the cliff, being a relatively flat erosional rock bench (within the intertidal zone) with a marked drop at its seaward edge. Shore platforms can be overlain by thick layers of coarse sand and gravel deposits (from mountain rivers/streams) along accumulation coasts. Rock and cliff coasts are typical along glaciated coasts north of the glacial limit. These coasts are characterised by diversity such as rugged mountainous areas with exposed bedrock cliffs, headlands, embayments with pocket beaches, islands, drumlins, fjords, river-fan deltas (outwash of mountain streams) and estuaries. Bedrock and coarse materials (gravel, cobbles and boulders) accumulated in glacial and paraglacial deposits are typical shore materials. Subtropical coastlines are often characterised by coastal outcrops of carbonate-cemented sediments (drying of excess water) in the form of rather irregular beachrocks. Gravel or shingle coasts are coasts consisting of gravel (2 to 64 mm), pebbles and cobbles (64 to 256 mm) and are generally known as coarse clastic beaches. Gravel coasts can be found in many mid- and high-latitude parts (formerly glaciated) of the world. These areas extend from beyond the limits of the last major ice advances to the present day ice caps and include much of the coasts of northwestern Europe, eastern North America and the far north Pacific coasts. Generally, these coastlines are intricate and irregular, characterised by headland and cliff formations. The variety of depositional forms includes: gravel barriers and beaches, barrier spits, bay-head barriers and transverse lag shoals. Gravel beaches are also found along unconsolidated cliff-type coasts (mixtures of silt, sand and gravel) eroded by wave attack and along tectonic coasts where steep streams deliver coarse material to the shore.

3
Sand coasts are wave-dominated depositional coasts (sediment grains ranging from 0.063 to 2 mm). The sand accumulations are deposited through processes of wave action and wave-induced currents, rather than through tide-induced or wind-induced currents. Generally, sand coasts are open coasts exposed to wind-generated waves and may vary from flat, low-energy, straight coastal beach plains to steep, high-energy sediment-deficient, irregular bay-headland coasts. Sand beaches may be bordered by cliffs, bluffs and rocks. The most basic morphological elements of flat wave-dominated coasts are dunes (supratidal), beaches, beach barriers, barrier spits and barrier islands. Most of the sandy beach plains have been formed a few thousand's years ago, when sea level rise slowed down. Mud coasts are coasts, consisting of predominantly inorganic sediment of median size less than 63 micron (0.063 mm) and are also known as chenier or chenier plain coasts. Cheniers are longshore ridges at the upper edge of the cross-shore (muddy) bed profile. These types of coasts can be found throughout the world from tropical to subarctic regions. The development of chenier formation is stimulated along progradational (depositional) shorelines, where mud accretion is temporarily interrupted. Prevalence of marine processes over fluvial processes (reduced supply) is most favourable for chenier formation (weakly erosive conditions). The fine muddy sediments predominantly originate from terrestrial sources (soil erosion) carried downstream by rivers (Amazon River in Brazil, Huanghe and Yangtze Rivers in China), but the fines may also come from cliff erosion or from vulcanic action (Indonesian Archipelago). Mud can be transported along the shore over thousands of kilometres (Guyana coast, western coast of India). The greatest concentrations of mud are found in Asian countries such as China, India, Malaysia, Thailand and Korea. Mud coasts usually are backed by coastal wetlands, either salt marshes or mangrove swamps. Typical characteristics of open mud coasts are: the presence of gentle shoreface slopes (1 to 500/2000), the brown-coloured coastal water and the absence of large breaking waves. Incoming waves are attenuated by soft muds (visco-elastic behaviour dissipating wave energy), often to such a degree that the waves never reach the shoreline. This soft mud is generally known as fluid mud. Most fluid muds occur as intertidal flats and subtidal mudbanks or mudshoals. 2.2 Types of sediments Most marine sediments are derived from the weathering of rock on land by the action of wind, water and ice under the influence of temperature, pressure and chemical reactions. The types of sediments that can be distinguished, are:
• lithogenous; sediments (quartz and clay minerals) entering the sea as discrete particles (boulders, stones, gravel, sand, silt and clay);
• hydrogenous; sediments that are formed by precipitation from seawater (salt-type sediments, manganese nodules);
• biogenous; sediments that are formed by organisms (coral and shell sands). Many beaches and shorefaces consist of quartz materials. Heavy minerals are sometimes found as concentrated deposits within the beach or shoreface and may be eroded and become exposed during storm events. Some beaches in volcanic areas consist of materials from volcanic sources. Well-known examples are the black sand beaches of Hawai and Iceland. Beaches may also consist of materials from biogenic nature like carbonates (white sands) from coral reef sources. Carbonates (like oolites) can also be formed by direct precipitation from seawater saturated with calcium carbonate. Shells and shell fragments are found on many beaches, especially in the tropics. Often, they are concentrated on the beach by wind and wave action. Numerous organisms can transform sediment particles into more solid material, producing protective erosion-resistant bottom layers. Beaches formerly consisting of loose materials have been changed into resistant rocky material by cementation.

4
2.3 Morphological features along coasts Both small-scale and large-scale morphological features can be distinguished in coastal regimes and are related to depositional and erosional processes acting along the coast under the influence of wave and currents. Small-scale features are beach forms such as beach cusps, breaker bars, rip channels, sand waves. Large-scale features are shoreline forms like beach plains, headlands, bays, tombolos, spits and forelands. Longer period sea level fluctuations (neap-spring cycle) play a key role in berm and ridge formation. Berms and ridges can also be formed by welding of nearshore bars. Swash bars are the uppermost bars (of asymmetrical shape) in the swash zone between the high and low water line. The crest of the swash bar is situated near the high water line and is for- med/maintained by swash processes landward of the plunge point of breaking waves up to the limit of the swash. Berms are terraces on the beach just above the uppermost swash level landward of the high water line and are formed by swash processes. Beach ridges are linear mounted-shaped ridges roughly parallel to the shoreline that survive during fairweather conditions but generally disappear during storm events. Beach ridges are semi-permanent wave- built features formed at, or slightly above, the high tide level at the limit of the swash zone. Subtidal breaker bars covered by wave-induced ripples in the crest regions and by current- related asymmetric mega-ripples in the trough regions are the dominant morphological features in the surf zone. The ripples may be washed away during strongly plunging breaking wave conditions (storm events), characteristic of the flat bed sheet-flow regime. Breaker bars with their crests parallel to the shoreline are found in zones with spilling and plunging breaking waves. The basic generic mechanism is the generation of net onshore- directed wave-related transport seaward of the breaker zone and net offshore-directed current- related transport (undertow) in the breaker zone. Other morphological processes on larger scales are the formation of barrier spits and baymouth spits, the formation of headland spits (winged headlands), the formation of barrier islands, the formation of salients, cuspate forelands and tombolos (protruding into the sea) in the shadow zone of offshore islands, structures, shoals, etc. Most of these large-scale depositional forms are mobile, showing a net annual migration or a cyclic pattern of erosion and deposition. Sand ridges and banks are the largest sedimentary features (width of order of 1 km and length of order of 10 km) that can be found in the middle and lower shoreface zone. Their parallel spacing is of the order of the width. Generally, these features consist of medium coarse sand and are large sources of sediment. Sand banks and ridges are quite stable features with smaller sand waves and ripples migrating over the bed surface in regions where the current velocities are large enough to generate particle motion. Ripples usually are the dominant type of small- scale bed forms in the lower and middle shoreface zone. Both symmetric wave-induced ripples and asymmetric current-induced ripples may be generated depending on the relative strength of the wave and current motion. As the current component gains in strength, the ripples become more asymmetric and larger in height and length (mega-ripples), especially in case of an opposing current. Mudbanks are subtidal depositional features that occur along muddy coasts, producing a band of sediment-laden water due to the action of currents and waves. Turbid waters are abundantly present over shoals and banks of fluid mud, where depths are smallest and wave action can erode sediments.

5
3. Sediment transport processes 3.1 Bed load and suspended load Sand transport in a coastal environment generally occurs under the combined influence of a variety of hydrodynamic processes such as winds, waves and currents. Figure 3.1 gives a schematic representation of sand transport mechanisms along a cross-shore bed profile of a straight sandy coast.
Figure 3.1 Sand transport mechanisms along cross-shore profile Top: cross-shore distribution of wave heights Middle: cross-shore distribution of longshore current Bottom: sand transport processes along cross-shore profile Sand can be transported by wind-, wave-, tide- and density-driven currents (current-related or advective transport), by the oscillatory water motion itself (wave-related or oscillating transport), caused by the deformation of short waves under the influence of decreasing water depth (wave asymmetry), or by a combination of currents and short waves. The waves generally act as sediment stirring agents; the sediments are then transported by the mean current. Suspension of sediments can be caused by ripple-related vortices, see Figure 3.2. The suspended load transport becomes increasingly important with increasing strength of the tide- and wind-driven mean current, due to the turbulence-related mixing capacity of the mean current (shearing in boundary layer). By this mechanism the sediments are mixed up from the bed-load layer to the upper layers of the flow. Low-frequency waves interacting with short waves may also contribute to the sediment transport process. Wind-blown sand represents a further basic transport process in the beach-dune zone. In friction-dominated deeper water outside the breaker (surf) zone the transport process is generally concen-trated in a layer close to the sea bed; bed-load transport (bed form migration) and suspended transport may be equally important. Bed load type transport dominates in areas where the mean currents are relatively weak in comparison with the wave motion (small ratio of depth-averaged velocity and peak orbital velocity).

6
In the surf zone of sandy beaches the transport is generally dominated by waves through wave breaking and the associated wave-induced currents in the longshore and cross-shore directions. The longshore transport in the surf zone is also known as the longshore drift. The breaking process together with the near-bed wave-induced oscillatory water motion can bring relatively large quantities of sand into suspension (stirring) which is then transported as suspended load by net (wave-cycle averaged) currents such as tide-, wind- and density (salinity)-driven currents. The concentrations are generally maximum near the plunging point and decrease sharply on both sides of this location. Examples of sand concentration profiles in non-breaking and breaking wave conditions are shown in Figure 3.3. The sand transport processes induced by (non-breaking) waves in the lower rippled bed regime (Figure 3.2), are:
• strong vortex motions over steep ripples yielding concentrated suspension clouds moving upward, forward and backward in the water column; spatial sediment concentration variability is relatively large;
• phase differences between the velocity peaks and the concentration peaks are prominent, which may result in net offshore-directed sand transport under shoaling swell waves (see Figure 3.2);
• suspended sand transport processes generally are dominant. The sand transport processes induced by (breaking) waves in the upper plane bed regime (Figure 3.2), are:
• generation of a high-concentration layer (sheet flow layer) in direct contact with the bed (0-1 cm); • phase differences between the velocity peaks and the concentration peaks are generally small, but become
important for fine sediment (<0.2 mm) and strongly asymmetric wave motion, which may result in net sand transport against the wave-current direction at certain levels in the oscillatory boundary layer;
• sediment concentrations above the sheet flow layer are generally relatively small (except in the presence of strong wave-induced currents);
• bed-load transport is generally dominant in non-breaking waves without external currents; suspended transport is generally dominant in breaking wave conditions with external currents.
Figure 3.2 Transport processes in asymmetric wave motion over plane and rippled bed Left: plane bed; Right: rippled bed

7
Figure 3.3 Time-averaged sand concentration profiles in oscillatory flow 3.2 Current-related and wave-related transport components The net sand transport rate at each point above the bed can be decomposed into current-related and wave-related parts (Van Rijn, 1993). The current-related or advective sediment transport is defined as the movement of sediment particles stirred up by the wave-current motion and carried by the time-averaged (mean) current velocities (longshore currents, rip currents, undertow currents). The current velocities and the sediment concentrations are both affected by the wave motion. It is known that the wave motion reduces the current velocities near the bed (wave-current interaction). In addition, the wave motion strongly increases the near-bed concentrations due to its stirring action (large bed-shear stresses due to the near-bed wave orbital motion). Another important parameter is the angle between the wave and current direction; an oblique current may have the effect of increasing or decreasing the forward (and also the backward) orbital velocity. On sandy beaches, the current-related transport rate is often dominated by suspended sediments, and this is especially so for the longshore component of the sediment transport. The wave-related or oscillating sediment transport is defined as the transport of sediment particles by the oscillating fluid components (high- and low-frequency motion). The wave-related transport is generally dominated by bed-load transport, but the oscillating suspended load transport may also make an important contribution in the near-bed region. On sandy beaches, the cross-shore component of sediment transport is generally dominated by wave-related transport during conditions with non-breaking waves. The depth-integrated suspended transport components can be obtained by integration of the local fluxes over the water depth. The total net sand transport rate can be obtained by summation of the bed-load and suspend load transport. The net transport components induced by non-breaking waves along a straight coast, are:
• onshore-directed wave-related transport due to asymmetry of the near-bed orbital velocities with relatively large onshore peak velocities under the wave crests and relatively small offshore peak velocities under the wave troughs;
• onshore-directed current-related transport due to the generation of a quasi-steady onshore-directed weak current in the wave boundary layer; net offshore-directed current may be generated in strongly asymmetric wave motion over a steep slope; bed ripples may also have a directional effect on the mean current;
• offshore-directed wave-related transport due to the generation of bound long waves associated with variations of the radiation stresses under irregular wave groups (peak velocities and concentrations are out of phase).

8
The net transport components induced by breaking waves along a straight coast, are: • onshore-directed wave-related transport due to asymmetric wave motion; • offshore-directed current-related transport due to the generation of a net return current (undertow) in the
near-bed layers balancing the onshore mass flux between the wave crest and trough; • wave-related transport rates due to the generation of low-frequency wave motion (bound long waves and
free waves may be generated, but the direction of net transport rate is highly uncertain); • offshore-directed current-related transport due to the generation of meso-scale circulation cells with local
offshore rip currents; • longshore transport due to cross-shore gradients in radiation stress.
3.3 Longshore sediment transport The most widely used formula for longshore transport (LT) is the CERC equation (Shore Protection Manual, US Army Corps of Engineers, 1984). This method is based on the principle that the longshore transport rate (LT, incl. bed load and suspended load) is proportional to longshore wave power P per unit length of beach; LT=K P, with K=calibration coefficient. The CERC formula has been calibrated using field data from sand beaches. The CERC formula does not account for particle size and beach slope. It is only valid for sandy conditions. The effects of particle diameter and bed slope have been studied systematically by Kamphuis (1991), resulting in a more refined equation for longshore sediment transport. The Kamphuis formula is valid for sand beaches, but is most likely not valid for gravel and shingle beaches. The Kamphuis formula was found to give the best agreement between computed and measured transport rates based on the work of Schoonees and Theron (1993, 1996). Recently Mil-Homens et al. (2013) have made a re-evaluation of the Kamphuis formula based on an extensive set of 250 data points. Most of the data points are in the sand range (<0.6 mm) and low transport range (mild wave conditions). Based on the work of Van Rijn (2014), the longshore transport of sand, gravel and shingle (in the range of 0.1 to 100 mm) can be computed by (see Tool: LITTORAL.xls): Qt,mass= 0.00018 ρs g0.5 (tanβ)0.4 (d50)-0.6 (Hs,br)3.1 sin(2θbr) with: Qt= total longshore sediment transport (in kg/s), ρs =sediment density (kg/m3), d50= median grain size (m), Hs,br= significant wave height at breakerline (m), θbr = wave angle at breakerline, g= acceleration of gravity (m/s2), tanβ= slope of beach/surf zone. The inner surf zone slope should be used for sand beaches (< 2 mm) and the beach slope for shingle (2 to 50 mm).
Assuming a straight uniform coast with parallel depth contours, the water depth at the breakerline can be estimated from: hbr= [(Hs,o
2 co cosθo)/(α γ2 g0.5)]0.4. The wave incidence angle at the breakerline (θbr) can be determined from: sinθbr=(cbr/co) sinθo. with: Hs,o = significant wave height at deep water; hbr= water depth at breakerline; co, cbr = wave propagation speed at deep water and at breakerline; θo, θbr = wave incidence angle (to shore normal) at deep water and at breakerline; γ = Hs,br/hbr= breaking coefficient = 0.6 to 0.8; α = 1.8= calibration coefficient; Lo = wave length in deep water (ho), co= Lo/Tp, Tp= peak wave period. Example: Sand coast; ho=20 m (water depth deep water), Hs,o= 3 m, Tp= 10 s, θo= 30 degrees. The wave breaking coefficient is: γ= 0.6. The sediment size is d50= 0.0003 m. The surf zone slope is tanβ= 0.02. Results: Lo=121.2 m (wave length in water depth of 20 m), co= Lo/Tp= 12.1 m/s, hbr=4.65 m (water depth at breakerline), Hbr=2,79 m, θbr= 15,7 degrees, sin(2θbr)= 0.52. The computed longshore transport rate is Qt= 507 kg/s.

9
4. Coastal sediment cells and budgets 4.1 Cell processes Many coasts consist of relatively straight and flat (low-gradient) beaches. These simple, flat beach coasts may differ greatly from the originally submerged coasts. The most basic coastal form is an indented coast (bay-headland coast or embayed coast) resulting from subsidence or from submergence due to sea level rise and which has not been modified by marine processes (waves and currents). Wave attack on an indented bay-headland type of coast will result in concentration of wave energy on the headlands (due to refraction) and reduction of wave energy in the bays, which may lead to headland erosion and bay deposition, if these coastal forms consist of erodible material. Longshore currents accelerating along headlands and decelerating in the bay area will enhance headland erosion and bay deposition. Thus, headlands are cut back and bays are filled up. In case of uneven resistance against erosion, the 'softer' headlands will erode more rapidly and the more erosion-resistant headlands remain present as promontories along the coast. When a coast is very irregular with large bays and pronounced headlands; the evolution of each bay will be indepen-dent of that of adjacent bays, because the sediment can not easily pass the headlands (each bay is a closed cell). If the headlands are equally erosive, the coastline will be straightened. This can be demonstrated by considering an undulating sandy shoreline under wave attack from a constant direction, see Figure 4.1. The longshore transport depends on the angle between the nearshore wave crest (based on refraction) and the coastline. The longshore transport rate is maximum on the downdrift flank of the protruding headland resulting in erosion on the updrift flank and accretion on the downdrift flank and coastal straightening on the long term. Figure 4.1 Coastal straightening by longshore transport gradients On larger spatial scales this process, dominated by littoral drift, will continue until the coastline consists of a series of smooth beach curves (arcs with curvatures between 1 and 100 km, depending on wave climate and erodibility). The end points of the arcs may be associated with old, more erosion-resistant headlands, with outlets and deltas of rivers, with ebb deltas of tidal inlets or with man-made structures. The dominant waves will turn the beaches to face the direction of the dominant wave approach by moving sediment to the downwave end of the arc resulting in a (hollow) arc-type coast. The formation of smooth arc-type barrier beaches is the most basic element of coastal straightening and is the ultimate stage of wave-dominated coastal evolution.

10
Headlands present along a sandy shoreline act as natural groynes and compartmentalize the shoreline into sediment cells. One large isolated headland usually causes an embayment to form on its downdrift shoreline. A series of two or more headlands spaced closely generally causes the formation of embayments that are semi-circular in shape. Headlands with broad faces block significant amounts of wave energy sheltering the beaches in the lee zone. The most important characteristics of headlands are: convergence points for wave energy; obstruction to longshore tide- and wind-induced currents, convergence of currents; large-scale circulation zones downstream of headland; obstruction to littoral drift; fixation points for seaward rip currents promoting offshore transport; fixation points for spit formation and shoals originating from headland erosion. A sandy coast between two erosion-resistant points (headlands or groynes) will readjust its orientation to arrive at a beachface as much as possible perpendicular to the main wave direction. Sand will be eroded at the updrift end of the beach and carried to the downdrift end of the beach. This process is known as bay or cell development. A crenulate-shaped bay or cell formed under oblique incident waves is stable (static or dynamic equilibrium), if the littoral transport is zero (on average) or constant everywhere along the beach. Storm waves or swell waves from one dominant direction are the most effective agents in bay formation. A stable bay consists of three parts: an almost circular section behind the upcoast headland, a logarithmic-spiral curve, and a nearly tangential straight beach segment at the downcoast end. The upcoast headland is the point at which diffraction takes place. Whatever the initial form of a relatively soft erodible coast, the ultimate equilibrium coast of sandy materials should be one of simple wide curves (arcs) and relative straightness. Small-scale morphological features developing along these smooth beaches are: berms, terraces, scarps, beach cusps, sand waves, parallel/transverse bars and rip channels. Straight beaches may be interrupted by outlets of small isolated rivers. 4.2 Cell scales The coastal zone can be considered as a morphodynamic system consisting of various subzones (cells or compartments,) each with its own spatial and temporal scale. In each subzone the morphology is driven by water and sediment motions, based on energy input from the incoming wind, waves and currents. Gradients in sediment transport result in morphological changes/fluctuations, which in turn influence the water motion in a continuous cycle. The characteristic morphological scales in the sandy coastal zone range from suspension events, ripples to large-scale features. In a dynamic coastal system there is almost instantaneous equilibrium between processes on the smaller scales (bed forms like ripples). On the larger scales (bars, ridges and banks) there is quasi-equilibrium, because the large-scale features are continuously adjusting to changing hydrodynamic conditions (bar growth, migration and degeneration). The temporal scale of the large-scale morphological features generally is considerably larger than that of the water motion, which implies that the effects of water motion and morphological changes can be decoupled (quasi-steady approach). Cells and compartments can be distinguished both in cross-shore and in longshore direction. In cross-shore direction the coastal system between the shore and the shelf may be subdivided in the following zones (cells):
• upper shoreface: surf zone with breaker bars between waterline and -8 m depth contour with mean bottom slopes varying between 1 to 50 and 1 to 200; reef zone along small-scale tropical islands;
• middle shoreface: zone between -8 m and -20 m depth contours with mean bottom slopes varying between 1 to 200 and 1 to 1000; sand ridges may be present;
• lower shoreface: zone between -20 m contour and the shelf with mean bottom slope of about 1 to 1000 and lower; sand ridges and sand banks may be present; the transport rates are relatively small and hence the response time of the morphology is generally slow (passive behaviour).
These cross-shore zones of coastal cells are linked by sediment transport processes. In the lower and middle shoreface zones the (bed load) transport rates are relatively small and hence the response time of the
11
morphology is generally slow (passive behaviour). In the surf zone the transport rates are relatively large and the response time of the morphology is faster, almost on the scale of the events (active behaviour). In alongshore direction the following zones (cells) can be distinguished:
• micro cells with small-scale fluctuating changes due to stochastic and deterministic longshore variations of beach cusps and swash bars etc. (0 to 1 km; 0 to 1 year);
• meso cells with meso-scale cyclic changes due to the cyclic behaviour of morphological features such as sand banks, sand waves and rip channels (1 to 10 km, 1 to 10 years); meso-scale decaying adjustment of the coastline to a new equilibrium, often induced by man-made structures, may also occur (1 to 10 km, 1 to 10 years);
• large-scale littoral cells separated by inlets, headlands and structures with slow large-scale changes due to natural phenomena (migrating tidal inlets, spiral bays formed under conditions of persistent, oblique swell and spit cells maintained by counteracting waves and currents); large-scale adjustment to new equilibrium due to man-made structures may also occur (10 to 100 km; 10 to 100 years).
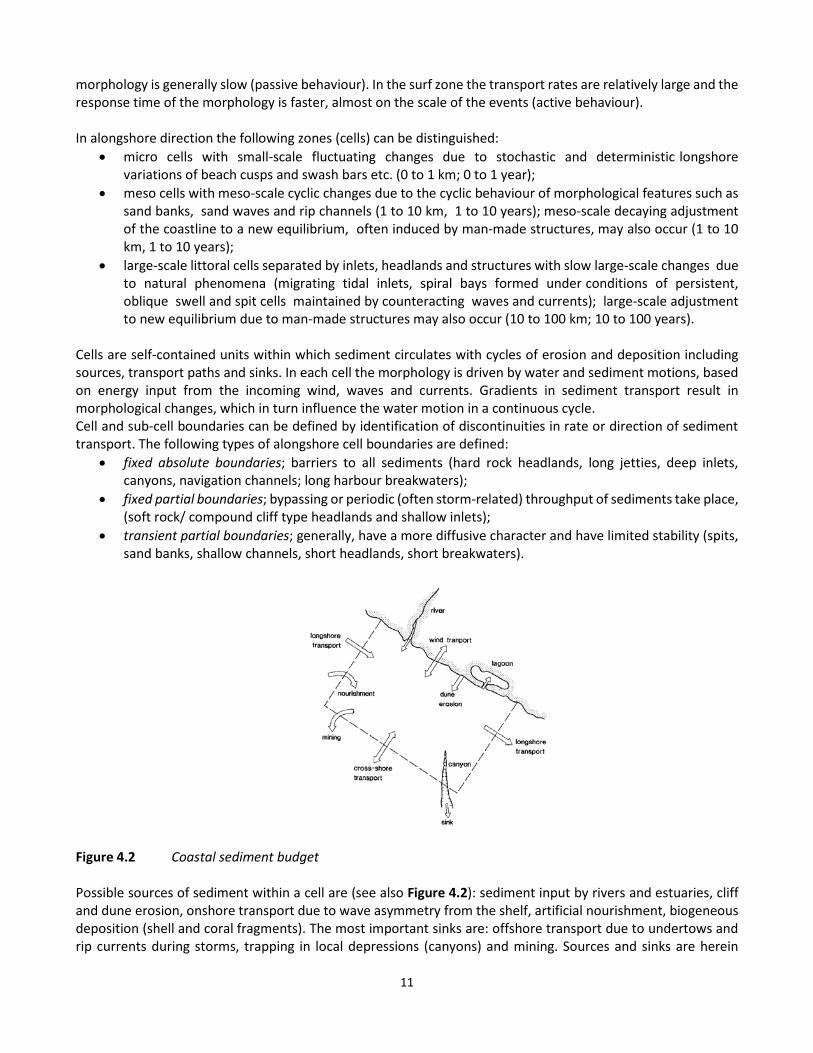
Cells are self-contained units within which sediment circulates with cycles of erosion and deposition including sources, transport paths and sinks. In each cell the morphology is driven by water and sediment motions, based on energy input from the incoming wind, waves and currents. Gradients in sediment transport result in morphological changes, which in turn influence the water motion in a continuous cycle. Cell and sub-cell boundaries can be defined by identification of discontinuities in rate or direction of sediment transport. The following types of alongshore cell boundaries are defined:
• fixed absolute boundaries; barriers to all sediments (hard rock headlands, long jetties, deep inlets, canyons, navigation channels; long harbour breakwaters);
• fixed partial boundaries; bypassing or periodic (often storm-related) throughput of sediments take place, (soft rock/ compound cliff type headlands and shallow inlets);
• transient partial boundaries; generally, have a more diffusive character and have limited stability (spits, sand banks, shallow channels, short headlands, short breakwaters).
Figure 4.2 Coastal sediment budget Possible sources of sediment within a cell are (see also Figure 4.2): sediment input by rivers and estuaries, cliff and dune erosion, onshore transport due to wave asymmetry from the shelf, artificial nourishment, biogeneous deposition (shell and coral fragments). The most important sinks are: offshore transport due to undertows and rip currents during storms, trapping in local depressions (canyons) and mining. Sources and sinks are herein

12
identified as phenomena of an irreversible nature; a sediment particle eroded from a cliff system cannot return to this system and a particle deposited in a canyon is a permanent loss for the coastal zone. Besides sources and sinks, stores or accumulations can be distinquished. Stores can be sand/gravel bars and banks migrating or resting in the coastal system. Sediment particles may be stored for a certain period in these features, but later the sediments may be mobilised again to take part in the transport process. The analysis of the sand budget (mass balance of inputs and outputs) for a predefined cell gives insight in the relative importance of the various sediment sources and losses. Sediment transport estimates across the cell boundaries are important in assessing the morphological development of coastal cells. Net longshore transport rates may be estimated from depositional forms near (man-made) obstructions like groynes, breakwaters, submerged offshore breakwaters, headlands or from sediments accumulated in depositional forms like spits, tombolos, etc. Contributions in cross-shore direction (on-offshore transport) usually are neglected. An excellent example of coastal sediment budget analysis is the Coastal Regional Sediment Management Plan of California, USA (www.dbw.ca.gov/csmw). 4.3 Effect of sea level rise Coastal evolution and hence coastal sediment budgets are strongly related to long term sea level rise (relative to the land). Shoreline response to relative sea level rise can be broadly divided into two main categories (Van Rijn 1998):
• erosional transgression; • depositional regression.
Erosional transgression refers to a net landward movement of the shoreline in the case of rising relative sea level. The well-known concept relating shoreline recession to water level rise is the geometric shift concept of Bruun (1962, 1988), which is based on the idea that the (dynamic) equilibrium profile of the beach and surf zone moves upward and landward in response to sea level rise (Bruun-rule; see Figure 4.3). Using this concept, the required annual input of sediment to the nearshore zone is equal to the area (m2) of the nearshore zone times the annual rate (m/year) of relative sea level rise. Assuming that relative sea level rise is 2 mm/year and that the width of the nearshore zone is in the range of 1 to 10 km, the required sediment supply to the nearshore zone per unit length of shoreline is about 2 to 20 m3/m/year to keep up with sea level rise. This volume of sediment will be eroded from the coast, if nothing is being done. This type of coastal erosion can be prevented (compensated) by coastal nourishment of the same amount (2 to 20 m3/m/year). Examples of eroding coasts due to sea level rise are: Mississippi delta coast (USA); Egypt coast. Depositional regression refers to seaward shoreline evolution by the formation of a series of beach and dune ridges due to abundant sediment supply by longshore and onshore transport processes exceeding the erosional effects associated with relative sea level rise. Examples are: geological development of Holland coast (5000 years BC to 1000 years AC; see Mulder et al., 2008) and South-East Australian coast.
Figure 4.3 Coastal recession due to of sea level rise
Sea level rise
Initial sea level
Initial bottom profile
New bottom profile
Shoreline recession

13
5. Erosion and variability of sand coasts 5.1 Coastal erosion processes Coastal erosion strongly depends on the type of coast (exposure, wave climate, sediment composition). Erosion of the coastline may be caused by:
• episodic storm-induced erosion of beach and dune zone (full or partial recovery may occur during post-storm conditions); in case of full recovery the beach and dune zone are stable and no measures are required;
• gradual, but systematic increase of the net sand transport due to curvature of coastline (gradients of longshore sand transport), or due to continuous cliff erosion of unconsolidated materials and/or due to spatial changes in wave climate, tidal currents or sediment composition;
• obstruction of the longshore transport due to the presence of natural barriers (headland, island, shoal, inlet, etc.) or artificial barriers (harbour breakwater, long groyne, land reclamation, artificial beaches for recreational purposes, etc.); sediment is accumulated on the updrift side and sediment is eroded on the downdrift side; some part of the sediment may eventually bypass the barrier;
• fluctuations or reductions in river sediment supply downdrift of river mouth; • continuous offshore-directed transport due to presence of nearby deep channels or canyons trapping
sediments; due to presence of headlands or man-made structures producing offshore-directed rip currents; due to increasing water level (lakes) causing continuous dune erosion;
• presence of nearby tidal inlet connected to back-barrier basin trapping sediments; • mining/dredging of sand; • erosion of spit heads and island heads due to inlet currents plus waves; spits are often instable and
continuously changing their form; spits can be eroded rapidly if the supply of sand is interrupted by an updrift barrier; the net annual longshore transport rate updrift of an inlet may increase significantly towards the inlet due to increasing tidal velocities and due to reduced wave heights from opposite directions (in the lee of ebb shoals for opposite waves).
Factors favouring coastal erosion are:
• exposure: wave and current attack will be concentrated on headlands, capes and other protruding coastal forms (promontories); wave exposure is low for annual mean significant wave height at edge of surf zone (say, depth of 6 m) Hs<0.75 m; moderate for Hs between 0.75 and 1.5 m; and high for Hs>1.5 m;
• high tides (spring tide), storm surge levels and storm intensity: flooding, wave overtopping and breaching may occur;
• persistent oblique wave attack; wave-induced currents increase with increasing wave angle; net littoral drift will be relatively large in case of one dominant wave direction;
• unconsolidated sediments: low sandy coasts can be relatively easily eroded; bluffs, cliffs and rock-type coasts are more erosion resistant;
• absence of nearshore bars/banks/shoals; relief is important for offshore dissipation of energy (wave breaking);
• presence of nearby sinks; trapping of sediment by inlets, back-barrier basins (lagoons), ebb shoals, offshore sand banks, harbour basins, deep navigation channels, offshore canyons, etc.
5.2 Coastal variability Coastal variability is not the same as coastal erosion, the latter defined as the permanent loss of sand from the system. Variability is the oscillating behaviour around a positive or negative trend line (see Figure 5.1).

14
Basically, morhodynamic behaviour can be expressed as: • fluctuations around a stable dynamic equilibrium state; • gradual transition to a new equilibrium state: • sudden stepwise change to a new equilibrium state due to catastrophic events such as: hurricanes,
typhoons, tsunamis, volcanic eruption, (exceedance of threshold values). Fluctuations (variability) are acceptable as long as the overall system remains unaltered; stable resistant systems show little response to external forces; resilient systems can be altered relatively easily, but they will also quickly return to the equilibrium state. This can be seen as negative feedback, because the system is selfregulating (damping) in response to perturbations. Unstable systems change to a new equilibrium state after disturbance. This can be seen as positive feedback leading to growth and magnification Shoreline erosion and shoreline management requires a workable definition of the shoreline position. Often, it is defined as the low or high water line during calm conditions. This definition may give rather variable results that strongly depend on the beach morphology. Therefore, it can be better defined as the line obtained by volumetric integration of the intertidal beach zone or the vertical zone between the dune foot line at about +3 m above MSL and the -3 m line. Shoreline variations/fluctuations can be determined by using filtering methods and trend/peri-odicity analysis. Maintaining the shoreline at a certain position (“holding the line”) requires the determination of the basal shoreline at a pre-selected year. Preferably, historical data (say 10 to 20 years) should be available to determine the basal line by regression over this period to eliminate variations. Shoreline variations (LW-line, HW-line, dunefoot-line) generally are variations around a systematic trendline (chronic erosion or deposition; see Figure 5.1); the trendline may be caused by natural (autonomous) processes or related to man-made structures. Several time scales can be identified (Stive et al., 2002):
• long-term variations (centuries): changes in relative sea level; climate changes in tidal range and wave heights, availability of sediment; long-term shoreline changes are in the range of 100 to 1000 m/century (1 to 10 m/yr);
• medium-term variations (years, decades): changes in wave climate and hence in wave-current conditions, migration of tidal channels and flats, sand bank migration, migration of inlets, closure of inlets, effects of coastal structures; shoreline changes can be up to 500 m over a period of 10 years (50 m/yr) near tidal inlets (attachment and detachment of shoals and banks); shoreline changes due to migrating sand waves (length of 1000 to 2000 m; longshore migration rates of 50 to 200 m/yr) or other rhythmic features along an open coast are in the range of 10 to 100 m over 10 years;
• short term fluctuations (seasons; days to months): bar migration, sand wave migration, rip channels, beach fills, effects of coastal structures; the maximum local shoreline changes on the storm time scale (days) and on the seasonal time scale (summer-winter response) of the open shoreline are generally in the range of 1 to 50 m (5 m for Duck beach, USA; 10 m for Ogata beach, Japan; 20 m for Ajigaura, Japan; Stive et al., 2002).
Figure 5.1 Shoreline position as function of time
Shoreline position
Time
Trend
Oscillation period
Oscillation length scale
15
Shoreline variations due to natural forcings are manifest at all time scales; shoreline variations due to human forcings typically operate at decadal and centennial time scales. Often, the oscillating component of the shoreline change (expressed in m/day) is much larger than the long-term change of the trendline. Spectral analysis (Stive et al., 2002) of time series over a period of about 10 years for three typical ocean-fronted beaches (Duck, USA; Ogata, Japan and Ajigaura, Japan) shows pronounced peaks corresponding to a 1-year cycle indicating the effects of seasonal (summer-winter) changes. Higher frequencies are also present in the data sets associated with the typical return period of storm events. Peaks at lower frequencies (2 to 4 years) are also present, most probably associated with migrating sand waves. List et al. (2003) have found that the regionally-averaged beach slope becomes a few degrees (maximum 3o) flatter (classic berm-bar profile response) during storm events for three sites along the east coast of the USA. Profile recovery (steepening) occurs during post-storm conditions. These locations were defined as short-term reversible hotspots (STRH). The maximum local shoreline change (erosion) over a coastal stretch of 70 km during pre-storm to storm conditions over 3 to 5 days was about 20 m; the maximum local shoreline change (accretion) during storm to post-storm conditions was also about 20 m. However, this type of symmetrical response did not always occur because many exceptions (non-STRH) were observed along the three sites with either no slope response or even a steepening response during storms (List et al., 2003). 5.3 Dune and beach erosion Dune and soft cliff erosion erosion are mainly caused by hydrodynamic and soil-related processes during major storm events with surge levels above the dune foot level. The basic mechanisms are: • erosion and undercutting from swash uprush during initial stages; • erosion and undercutting by the impact of breaking waves at increasing surge levels in combination with high
tide levels; • wave overtopping (water surface lower than crest) and wave overwashing (water surface higher than dune
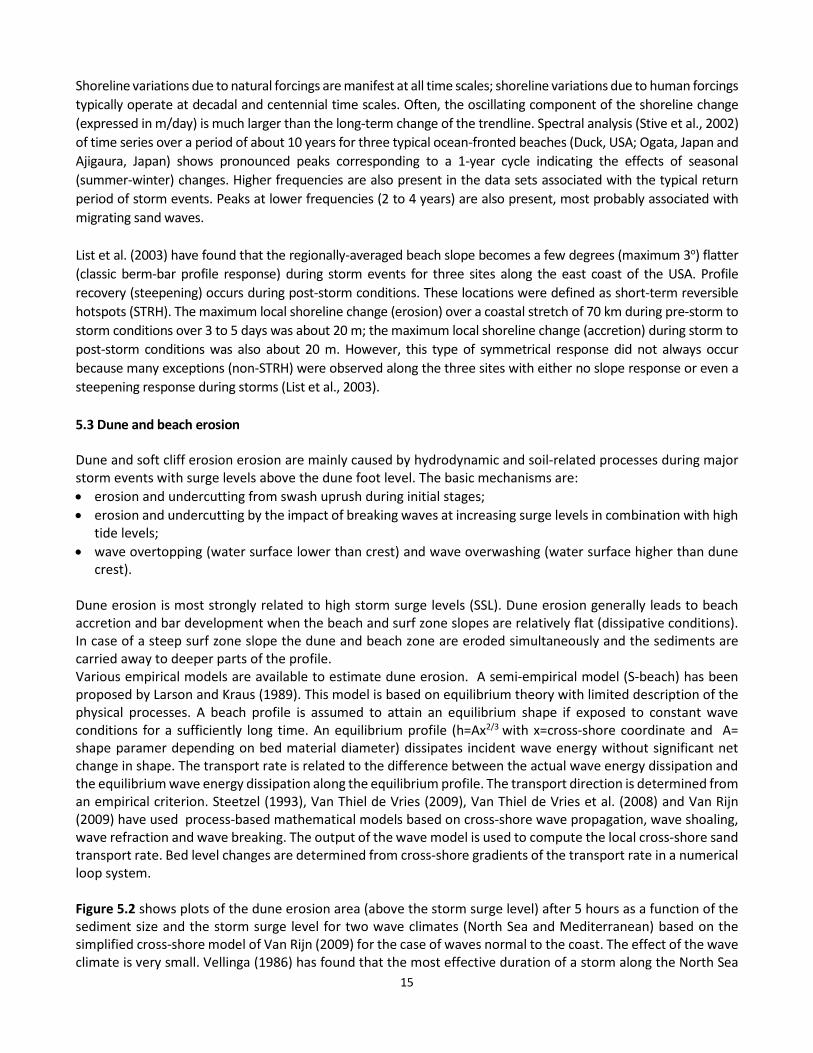
crest). Dune erosion is most strongly related to high storm surge levels (SSL). Dune erosion generally leads to beach accretion and bar development when the beach and surf zone slopes are relatively flat (dissipative conditions). In case of a steep surf zone slope the dune and beach zone are eroded simultaneously and the sediments are carried away to deeper parts of the profile. Various empirical models are available to estimate dune erosion. A semi-empirical model (S-beach) has been proposed by Larson and Kraus (1989). This model is based on equilibrium theory with limited description of the physical processes. A beach profile is assumed to attain an equilibrium shape if exposed to constant wave conditions for a sufficiently long time. An equilibrium profile (h=Ax2/3 with x=cross-shore coordinate and A= shape paramer depending on bed material diameter) dissipates incident wave energy without significant net change in shape. The transport rate is related to the difference between the actual wave energy dissipation and the equilibrium wave energy dissipation along the equilibrium profile. The transport direction is determined from an empirical criterion. Steetzel (1993), Van Thiel de Vries (2009), Van Thiel de Vries et al. (2008) and Van Rijn (2009) have used process-based mathematical models based on cross-shore wave propagation, wave shoaling, wave refraction and wave breaking. The output of the wave model is used to compute the local cross-shore sand transport rate. Bed level changes are determined from cross-shore gradients of the transport rate in a numerical loop system. Figure 5.2 shows plots of the dune erosion area (above the storm surge level) after 5 hours as a function of the sediment size and the storm surge level for two wave climates (North Sea and Mediterranean) based on the simplified cross-shore model of Van Rijn (2009) for the case of waves normal to the coast. The effect of the wave climate is very small. Vellinga (1986) has found that the most effective duration of a storm along the North Sea
16
coast is about 5 hours. The significant offshore wave height in the North Sea is assumed to vary between 4 and 8 m for surge levels between 1 and 5 m above mean sea level (MSL). Dune erosion after 5 hours is largest for relatively fine sediments (0.15 mm) and reduces rapidly for coarser sediments. Dune erosion of gravel (1 mm) is only 15% of that of fine sand (0.15 mm). The shoreline recession (E) due to dune erosion can be estimated from E=A/h with A= dune erosion area above storm surge level SSL and h= dune height above the storm surge level. Figure 5.2 shows dune recession values (axis on right side of plot) based on a dune height of 10 m above SSL. Dune recession values are twice as large for dune height of 5 m. Figure 5.2 Dune erosion after 5 hours during a storm event as function of sediment size and storm surge level for
two wave climates: North Sea (upper) and Mediterranean (lower); dune recession based on dune height of 10 m above SSL
0
50
100
150
200
250
300
350
0 0.5 1 1.5 2 2.5 3 3.5 4 4.5 5Storm surge level above MSL (m)
Dune
ero
sion
are
a ab
ove
SSL
(m3/
m)
0
5
10
15
20
25
30
35
Dune
rece
ssio
n (m
)
d50=0.15 mmd50=0.2 mmd50=0.25 mmd50=0.3 mmd50=0.4 mmd50=0.5 mmd50=1 mm
Hs,o= 4 to 8 mTp=7 to 12 s
0
20
40
60
80
100
120
140
0 0.5 1 1.5 2 2.5 3Storm surge level above MSL (m)
Dune
ero
sion
are
a ab
ove
SSL
(m3/
m)
0
2
4
6
8
10
12
14
Dune
rece
ssio
n (m
)
d50=0.15 mmd50=0.2 mmd50=0.25 mmd50=0.3 mmd50=0.4 mmd50=0.5 mmd50=1 mm
Hs,o=3 to 6 mTp=6 to 10 s

17
Two examples are given: • Holland sand coast (The Netherlands) along North Sea; dune crest at +10 m above MSL;
- maximum surge level SSL during extreme storms (including tide) above MSL ≅ 5 m; - sand diameter ≅ 0.2 mm; - offshore significant wave height ≅ 7 m; - dune erosion volume above SSL ≅ 200 m3/m (recession ≅ 200/10 ≅ 20 m); Figure 5.2.
• Tropical island coast; barrier crest at +3 m above MSL; - maximum surge level SSL (tide, wind and wave setup) above MSL ≅ 2 m; - offshore significant wave height= 4 m; - sand diameter ≅ 0.2 mm; - dune erosion volume above SSL ≅ 35 m3/m (recession ≅ 35/3 ≅ 12 m); Figure 5.2.
Dune erosion is very much related to extreme events with high surge levels including tidal effects. Extreme storms have a large return period. For example, a North Sea storm with a surge level of 5 m above mean sea level has, on average, a return period of about 10,000 years (so once in 10,000 years), but it can happen tomorrow. The return period of a surge level of only 2 m is 1 year; so, once every year. The computed dune erosion values after 5 hours are of the order of 20 m3/m for a surge level of 1 m and up to 300 m3/m for a large surge level of 5 m, see Figure 5.2. To withstand an extreme event with a surge level of 5 m above mean sea level, the dune row fronting the sea should have a minimum width of the order of 50 m. In ‘normal’ conditions with two or three events per year with surge levels between 1 and 2 m per year, the total annual dune erosion may be as large as 50 m3/m/year locally along the sandy North Sea coasts. Most of the eroded dune sand will be deposited on the beach from where it can be returned to the dune front by wind-induced forces or carried away by cross-shore and longshore currents. Dune accretion at the dune front due to wind effects is of the order of 10 to 20 m3/m/year (Van der Wal, 2004) and is generally not sufficient to compensate dune erosion on the annual time scale by natural processes. Thus, dune erosion generally leads to a permanent loss of sand which can only be compensated by artificial nourishment (dune restoration). Beach erosion during minor storm events with surge levels below 1 m and offshore waves up to 4 m is of the order of 10 to 20 m3/m per event (5 to 10 hours or so). Beach build-up during daily fairweather waves is of the order of 1 to 2 m3/m/day (Van Rijn, 1998). Thus, beach erosion can easily be compensated by natural processes on the time scale of weeks to months depending on the type of post storm wave climate (North Sea or Mediterranean). 6. Erosion of gravel/shingle coasts Beaches consisting of gravel or shingle (2 to 64 mm), pebbles and cobbles (64 to 256 mm) are generally known as coarse clastic beaches and can be found in many mid- and high-latitude parts (formerly glaciated) of the world (England, Iceland, Canada, etc.). The term shingle is most commonly identified with the coarse beaches of southern England. A review of coarse clastic beaches is given by Carter and Orford (1993). A typical gravel/shingle beach can be seen as a layer of gravel material sloping up against a cliff. A gravel barrier can be seen as a dike of gravel material. Swash-aligned barriers (migrating landwards through rollover by overwashing) and longshore drift-aligned barriers are distinguished. Typical profiles are shown in Figure 6.1. Gravel beaches are also found along unconsolidated cliff-type coasts eroded by wave attack (like Mediterranean coasts) and along tectonic coasts where steep streams deliver coarse material to the shore. Some of these beaches have a large proportion of sand intermixed with gravel, especially in the foreshore zone just beneath the mean water line. In regimes with dominating gravel populations, the sand becomes a subsidiary interstitial component. In regimes with a relatively large tidal range the back beach may consist of gravel ridges fronted by a low-tide terrace of sand (exposed at low tide). These types of beaches have less appeal for recreational activities, but they are rather efficient (high dissipation of energy through high permeability) for coastal protection.

18
Figure 6.1 Typical cross-shore profile of gravel beach slope The transport pathways of gravel/shingle have been studied extensively by tracer experiments. Most studies have been qualitative rather than quantitative because of low recovery rates (5% or even less). A wide range of tracers has been used: original beach material coated with dye or paint, labelled with radio-active isotopes, pebbles of a distinctive geological composition from other sites, artificial pebbles (aluminium, plastic filled with metal, etc.). Gravel on beaches is moved almost exclusively by wave action (asymmetric wave motion); tidal or other currents are not effective in moving gravel/shingle material. The coarse particles move up the beach to the run-up limit by strong bores (uprush) and move down the beach close to the line of the steepest beach slope by the backwash (less strong due to percolation) plus gravity, resulting in a saw-tooth movement. Waves of long periods on steep beaches can produce peak swash velocities up to 3 m/s. The alongshore transport path of individual clasts (20 to 40 mm) may be as large as 1000 m per day during periods with storm waves. To prevent the longitudinal spreading of coarse materials often small-scale timber groynes are used. Generally, the upper beach consists of gravel/shingle material, while the lower beach consists of sandy material. Gravel particles in shoaling and breaking waves generally move as bed load towards the beach during low wave conditions. As the near-bed peak orbital velocity in the onshore direction is greater than the offshore-directed value, the particles will experience a net onshore-directed movement during each wave cycle. The finer grains may go into suspension as a result of the turbulence produced by the breaking waves and may be transported to the lower part of the beach zone depending on the strength of the undertow. Gravel/shingle transport mainly takes place in the swash and wave runup zones. The swash zone is the zone which is intermittently wet and dry showing relatively large velocities during the uprush and backwash phases of the saw-tooth swash wave cycle due to bore propagation and bore collapse, often in combination with low-frequency oscillations which generally grow in amplitude towards the shoreline. It is a particularly complex zone of the nearshore where short and long waves, tides, sediments and groundwater flow (infiltration/percolation) all play an important role. Long waves are generated by the release of bound long waves in the surf zone due to the breaking of short waves and by cross-shore variations of the short wave breakpoints (surf beat). The role of percolation is especially important on steep, coarse-grained beaches leading to beach accumulation and steepening as a result of the diminished sediment carrying capacity of the reduced backwash volume of water and velocity, following percolation into the coarse-grained bed. These effects will lead to a landward bias (asymmetry) in swash transport depending on grain size. The swash zone is the most dynamic part of the nearshore zone of vital importance for the behaviour of gravel/shingle barriers. Many experiments on the erosion of gravel/shingle beaches under irregular wave attack have been performed in large-scale wave flumes. Figure 6.2 shows an experiment in the GWK flume in Hannover, Germany by López

19
et al. (2006). The shingle material has d50 of approximately 0.02 m. The initial slope of the beach is about 1 to 8. As can be observed, there is a gradual development of a triangular bar with a maximum height of about 2 m (about 2Hs,toe) just beyond the still water line after 12000 waves (or 57100 s). The total accretion area is about 10 m3/m. The onshore transport of shingle passing the water line is about 10/57100= 0.0000175 m2/s or about 15 m3/m/day at an offshore wave height of about Hm,o= 1 m.
Figure 6.2 Experimental results of gravel/shingle beach (d50= 0.02 m), GWK, Hannover, Germany Barrier recession rates up to 4 m per year have been observed (Nicholls and Webber, 1988) at Hurst beach, Christchurch Bay, England. Most of the recession did occur during autumn and winter months. The barrier behaviour was influenced by saltmarsh deposits (peat, mud) exposed and eroded on the foreshore. This subsoil material leads to relatively rapid settlement due to the weight of the gravel barrier reducing the crest level of the barrier. Differential settlement of the subsoil can lead to local depressions and increased overwashing. Bradbury and Powell (1990) give an example of barrier rollover and lowering at Hurst Spit, England (crest between 2 and 4 m above HW; crest width of 3 to 10 m). Large-scale overwashing of the spit occurred in December 1989, resulting in crest lowering (about 1.5 m) along a beach length of 800 m. The beach (16 mm gravel/shingle) was moved back by about 30 to 40 m in a single storm event.
0
1
2
3
4
5
6
7
8
225 230 235 240 245 250 255 260 265 270 275 280 285 290 295 300Cross-shore distance (m)
Heig
ht a
bove
flum
e bo
ttm (m
)
Initial bed profilemeasured profile after Test 1 (3000 waves; Hmo= 0.52 m, Tp= 3.2 s)Measured profile after Test 2 (2000 waves; Hmo= 0.91 m; Tp= 4.1 s)Measured profile after Test 3 (2000 waves; Hmo= 1.07 m; Tp= 4.3 s)Measured profile after Test 4 (3000 waves; Hmo= 0.95 m; Tp= 5.1 s)Measured profile after Test 5 (2000 waves: Hmo= 1.02 m; Tp= 7.7.s)
SWL
20
7. References Bradbury, A.P. and Powell, K.A., 1990. The short term profile response of shingle spits to storm wave action, p.
2694-2707 Proc. 22nd ICCE, Delft, The Netherlands Bruun, P., 1962. Sea-level rise as a cause of shore erosion. Journal of Waterways and Harbours Divisions, ASCE, Vol.
88, p. 117-130 Bruun, P., 1988. The Bruun rule of erosion by sea-level rise. Journal of Coastal Research, Vol. 4, No. 4, p. 627-648 Carter, R.W.G. and Orford, J.D., 1993. The morphodynamics of coarse clastic beaches and barriers: a short and
long term perspective. Journal of Coastal Research, SI 15, p. 158-179. EUROSION, 2004. A guide to coastal erosion management practices in Europe. Contract B4-
3301/2001/329175/MAR/B3. Prepared by Rijkswaterstaat/RIKZ, The Haque, The Netherlands Kamphuis, J.W. 1991. Alongshore sediment transport rate. Journal of Waterway, Port, Coastal and Ocean
Engineering, Vol. 117, 624-640 Larson, M. and Kraus, N.C., 1989. S-beach: numerical model simulating storm-induced beach change. Report 1,
Technical Report CERC-89-9. US Army Engineer Waterways Experiment Station, Vicksburg, USA Mil-Homens, J., Ranasinghe, R., Van Thiel de Vries, J.S.M. and Stive, M.J.F., 2013. Re-evaluation and improve-
ment of three commonly used bulk longshore sediment transport formulas. Coastal Eng. 75, 29-39 Muldr, J.P.M., Van der Spek, A.J.F. and Van der Meulen, M.J., 2008. Coastal zones and climate change : a sediment
perspective on adaptation. 31st ICCE, Hamburg, Germany Nichols, R.J. and Webber, N.B., 1988. Characteristics of shingle beaches with reference to Christchurch Bay, South
England, p. 1922-1936, Proc. 21st ICCE, Malaga, Spain List, J., Farris, A.S. and Sullivan, C., 2003. Large-scale response of foreshore slope to storm events. Coastal
Sediments, Florida, USA López de San Román-Blanco, B., Coates, T., Holmes, P., Chadwick, A., Bradbury, A., Baldock, T., Pedrozo Acuña, A., Lawrence, J. and Grune, J., 2006. Large scale experiments on gravel and mixed beaches. Coastal Engineering, 53, p. 349 -362 Schoonees, J.S. and Theron, A.K., 1993. Review of the field-data base for longshore sediment transport.
Coastal Engineering, Vol. 19, 1-25 Schoonees, J.S. and Theron, A.K., 1996. Improvement of the most accurate longshore transport formula. 25th
ICCE Orlando, USA Shore Protection Manual, 1984. CERC, Waterways Experiment Station, Vicksburg, USA Steetzel, H., 1993. Cross-shore transport during storm surges. Doctoral Thesis, Delft University of Technology,
Delft, The Netherlands Stive, M.J.F. et al. 2002. Variability of shore and shoreline evolution, p. 211-235. Coastal Engineering, 47 Van der Wal, D., 2004. Beach-dune interactions in nourishment areas along the Dutch coast. Journal of Coastal
Research, Vol. 20, No. 1, p. 317-325 Van Rijn, L.C., 1993. Principles of Sediment transport in Rivers, Estuaries and Coastal Sea. Aqua Publications, The
Netherlands (www.aquapublications.nl) Van Rijn, L.C., 1998. Principles of Coastal Morphology. Aqua Publications, The Netherlands (aquapublications.nl) Van Rijn, L.C., 2014. A simple general expression for longshore transport of sand, gravel and shingle. Coastal
Engineering, Vol. 90, 23-39 Van Thiel de Vries, J.S.M., 2009. Dune erosion during storms. Doctoral Thesis, Civil Engineering Department,
Delft University of Technology, Delft, The Netherlands Van Thiel de Vries, J.S.M., Van de Graaff, J., Raubenheimer, B., Reniers, A.J.H.M. and Stive, M.J.F., 2006.
Modeling inner surf hydrodynamics during storm surges. Proc. 30th ICCE, San Diego, USA, p. 896-908 Vellinga, P., 1986. Beach and dune erosion during storm surges. Doctoral Thesis, Delft University of Technology,
Delft, The Netherlands (Publication 372, Delft Hydraulics)