coastal erosion monitoring and advice on response
TRANSCRIPT
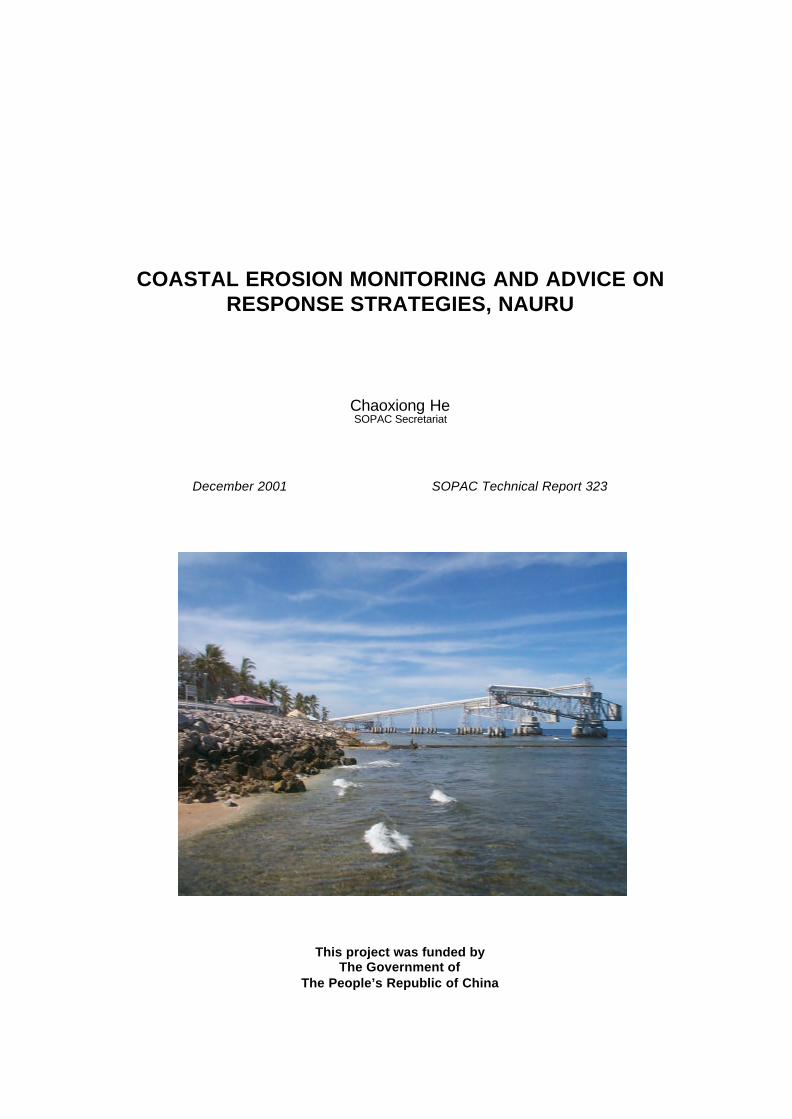
COASTAL EROSION MONITORING AND ADVICE ON RESPONSE STRATEGIES, NAURU
Chaoxiong He SOPAC Secretariat
December 2001 SOPAC Technical Report 323
This project was funded by The Government of
The People’s Republic of China
[SOPAC Technical Report 323 – Chaoxiong He]
[2]
SOPAC Library Cataloguing-In-Publication Data He, C. 2000. Coastal erosion monitoring and advise on response strategies, Nauru. (SOPAC Technical Report 323). 23 p.; 20 figs. ISSN: 1605-4377 1. Coastal erosion 2. Beach profiles 3. Coastal structures 4. Nauru
I. He, C. II. Title III. Series
[SOPAC Technical Report 323 – Chaoxiong He]
[3]
TABLE OF CONTENTS
Page
1 EXECUTIVE SUMMARY..........................................................................................................5 2 ACKNOWLEDGEMENTS.........................................................................................................6 3 INTRODUCTION......................................................................................................................7 3.1 Background and objectives ...............................................................................................7 3.2 The study area...................................................................................................................8 3.3 This study ............................................................................................................................ 4 PHYSICAL SETTING 4.1 Geological setting and evolution .......................................................................................8 4.2 Coastal and reef geomorphology ......................................................................................8 5 CLIMATE AND OCEANOGRAPHY ......................................................................................10 5.1 Wind.................................................................................................................................10 5.2 Tide and water level ........................................................................................................10 5.3 Wave climate...................................................................................................................11 6 RESULTS .............................................................................................................................12 6.1 Beach profiling for long-term monitoring .........................................................................12 6.2 Problem sites identified .................................................................................................13 6.2.1 Yaren area.............................................................................................................13 6.2.2 Gabab Channel .....................................................................................................14 6.2.3 Anibare Bay...........................................................................................................16 6.2.4 Others....................................................................................................................19 7 CONCLUSIONS AND RECOMMENDATIONS 7.1 Conclusion.......................................................................................................................21 7.2 Recommendations...........................................................................................................21 8 REFERENCES .......................................................................................................................22
[SOPAC Technical Report 323 – Chaoxiong He]
[4]
LIST OF FIGURES
Figure Page
1 Nauru Location Map ..........................................................................................................7
2 Map showing location and geological setting of Nauru ....................................................9
3 Aerial photography shows the coastal and reef geomorphology of Nauru .....................9
4 3D image of Nauru from bathymetric data....................................................................... 9
5 Vertical view of Nauru. Note the sharp offshore slopes ...................................................9
6 Nauru annual wind rose .................................................................................................11
7 Beach-profile locations around Nauru ...........................................................................12
8 Aerial photograph showing Yaren area .........................................................................13
9 Aerial photograph showing Nauru national airport runway extension............................13
10 Undercut seawall in Yaren area .....................................................................................13
11 Aerial photograph showing Gabab Channel.................................................................. 14
12 Limestone boulder structure to protect sand loss at Gabab Channel ...........................15
13 Limestone boulder structure at Gabab Channel ............................................................15
14 Anibare Bay and Anibare Channel..................................................................................15
15 Beach at Anibare Bay .....................................................................................................16
16 Harbor construction in Anibare Bay ................................................................................17
17 Beach rock exposure at the left site of the new harbor construction .............................18
18 Beach rock exposure at the left site of the new harbor construction .............................18
19 Aerial photograph showing the Anibare Channel in 1992 ..............................................19
20 Collapsing retaining wall at the coast adjacent to NPC Head Office .............................20
21 Scouring at base of retaining wall at NPC boat harbor ..................................................20
[SOPAC Technical Report 323 – Chaoxiong He]
[5]
1. EXECUTIVE SUMMARY A Japanese-funded boat harbor is under construction in Anibare on Nauru. A post-construction evaluation and assistance for monitoring of possible environmental effects was proposed. The government of Nauru requested the South Pacific Applied Geoscience Commission (SOPAC) to undertake the project entitled Coastal Erosion Monitoring and Advise on Response Strategies. The project’s objectives were to examine Nauru’s coast and area with identify areas with coastal erosion; to collect information on countermeasures to be proposed at state level; and to establish a shoreline monitoring system for long-term observation as one part of a baseline data set. The field reconnaissance survey for this project was conducted from 9 to 28 March 2000. During this period, the coastal landforms around Nauru Island were examined, and 17 beach profiles around the coast were put in place for long-term beach-change monitoring. These beach profiles were coordinated with the local datum and tied to permanent fixtures. Each site was documented photographically and the control points were created and plotted on a MapInfo GIS using aerial photography and a map backdrop. The following conclusions and recommendations result from this study: • The factors responsible for shoreline erosion can be divided into two major categories,
natural and human-induced. The natural causes identified for significant and continuous erosion on Nauru are sea, wave and tide surges, which are controlled by the equatorial monsoon climate; the human-induced processes result from inappropriate man-made structures and sand mining on the beach.
• As a highly developed small island with the highest population density in the South Pacific, Nauru is under significant anthropological stress. Field reconnaissance showed severe erosion on the shoreline adjacent to the newly built harbor in Anibare; that the airport runway extension has resulted in erosion of a section of the shoreline close to the extension; that sand mining at Gabab Channel has contributed to shoreline erosion and recession at this site; and that a lot of seawalls around the whole island were undercut.
• It is still too early to assess quantitatively the environmental impact of the newly built harbor
in Anibare on the adjacent shoreline; continued observation and monitoring is recommended. The site visit revealed that there has been sand lost from the adjacent beaches and exposure of base-rock. The newly built harbor will cause changes in the coastal circulation around Anibare Bay. How the changes will affect the coastal system is still unknown.
• The sediment distribution and movement on the Nauru coast is dominated mainly by the
coastal hydrodynamic regime driven by easterly tradewinds which prevail during the period March to October. Better-sorted, finer sands are deposited in the western sections of Nauru coast which is leeward of the easterly tradewinds, while other sections of the Nauru coast are characterized by deposits of coarser sand and coral rubble.
• More attention needs to be given by the government sectors and local communities to
coastal erosion issues in Nauru. Immediate measures are required to be taken to react to the problems identified in this report. Among the problem sites mentioned in this report, except for Anibare Bay, a continuous beach observation and monitoring program is required, and repair works need to be considered for other areas to mitigate further damage.
• On a small island with high population stress, even a small change on the coast can be
significant. A code of practice for coastal structure design and engineering is needed to emphasize environmental impact assessment (EIA) which should precede any construction activity. Every EIA should include all boundary conditions, such as meteorology, oceanography, sedimentation, coastal dynamics, and bio-ecology, as well as possible anthropological effects.
[SOPAC Technical Report 323 – Chaoxiong He]
[6]
• Sand mining on beaches should be immediately controlled or phased out to avoid further
beach erosion and recession. • According to the IPCC projection, the sea level will rise 0.3 m to 0.95 m, with a best-guess
scenario of 0.5 m, by the year 2100. As almost all of its residents and infrastructure are located in a narrow coastal strip with an elevation between 1.5 and 5.5 m above mean sea level (3 to 7 m above chart datum), or 0.5 m to 4.5 m above HHWL, Nauru is vulnerable to the future sea-level rise. Recent SOPAC studies have indicated that land will be lost and some infrastructure will be under threat by overtopping and inundation during extreme events at present sea level. An assessment of vulnerability to accelerated sea-level rise, even to climate change, is necessary for Nauru.
• For long-term monitoring of shoreline stability, beach profiles established around Nauru
should be re-surveyed periodically, at least on a yearly basis, if not more often, and immediately after extreme events.
2. ACKNOWLEDGEMENTS The funding for this project was provided by the Government of the People’s Republic of China. The work was carried out in collaboration with the Nauru Government. Particular assistance was received from both Department of Island Development & Industry (IDI) of Nauru Government and Nauru Fisheries and Marine Resources Authority (NFMRA). The coordination assistance and arrangement of logistic support during the field-work period by Tyrone Deiye, A/Director of Projects Department of Industry & Economic Development, Republic of Nauru, is highly appreciated; Special thanks go to Peter Jacob, Acting Chief Executive Office of MFMRA, for his introductory trip around Nauru; Land Survey Department of NPC provided benchmark information; Permission to use the wind and tide data by the National Tidal Facility (NTF) is acknowledged; Review and comments on the draft of this report were given by Robert Smith, Marine Geophysicist of SOPAC and Peter Rodda of Fiji Mineral Resources Department; and Quan Chung from SOPAC and Pene Agadio, Environment Officer from IDI, provided the field assistance.
[SOPAC Technical Report 323 – Chaoxiong He]
[7]
3. INTRODUCTION 3.1 Background and objectives A Japanese-funded boat harbor is under construction in Anibare on Nauru. A post-construction evaluation and assistance for monitoring of possible environmental effects was proposed. The government of Nauru requested the South Pacific Applied Geoscience Commission (SOPAC) to undertake the project entitled Coastal Erosion Monitoring and Advise on Response Strategies. The project’s objectives were: 1. to examine Nauru’s coast and area with identify areas with coastal erosion; 2. to establish a shoreline monitoring system for long-term observation as one part of a baseline
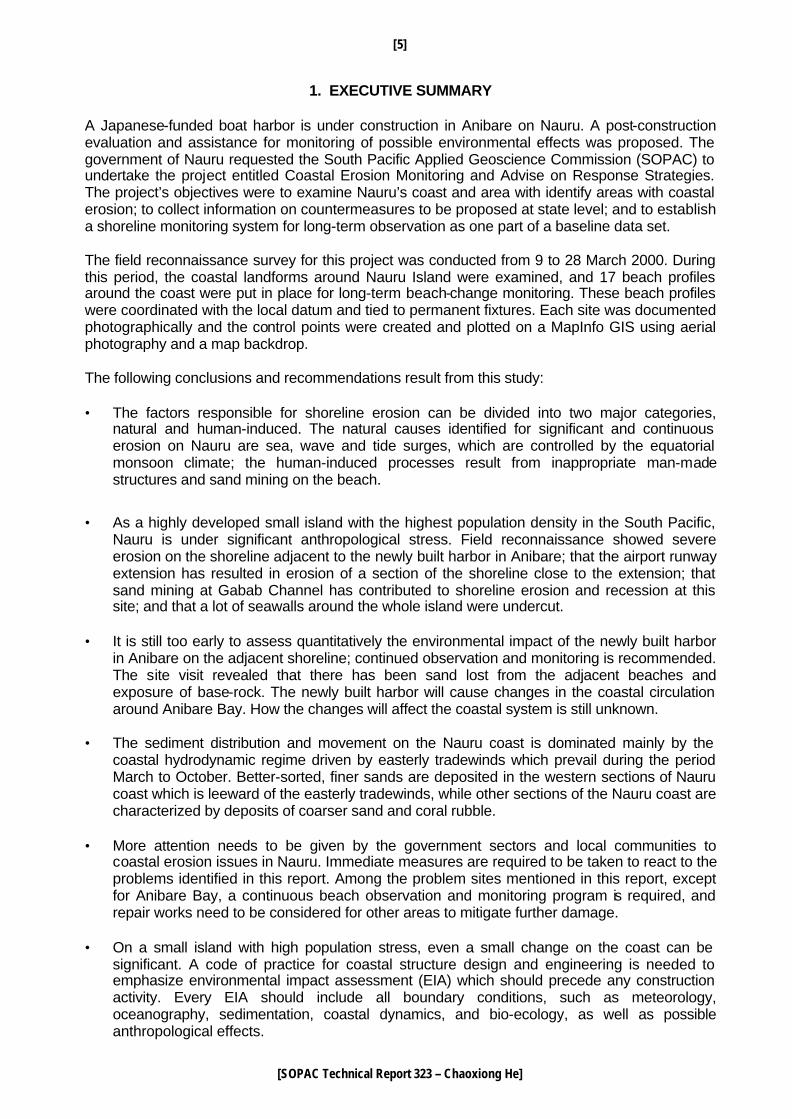
data set; and 3. to collect information on countermeasures to be proposed at state level. 3.2 The study area Nauru is a single raised coral island located in the central Pacific Ocean at 0o32’S, 166o56’E. It has a land area of 22 km2 with population of 10 000 (Figure 1). Nauru’s population density was 545 people/km2 in the Year 2000 and this high placed it at the top in terms of population density in the South Pacific. The economy of the country revolves around phosphate mining that has lasted for about 90 years. Figure 1. Nauru Location Map (Magellan Geographix, 2000).
[SOPAC Technical Report 323 – Chaoxiong He]
[8]
3.3 This study This study was designed to document coastal erosion and establish monitoring profiles for a data set for Nauru. Assessment was focused on the areas with high population density, development scenarios and important infrastructure facilities. The study included coastal dynamics, coastal circulation, sedimentation and sediment transportation, and documentation of damage to local facilities and infrastructure. Wind and tide data were downloaded from the website of the National Tidal Facility (NTF) at Flinders University in South Australia. Beach profiles were surveyed using the Sokkia set 2C Total Station. A hand-held Global Positioning System (GPS) unit was used to record the latitude and longitude of the control points of every beach profile, and an electronic compass was used to determine the bearing of the profile. Every beach profile was coordinated to the local datum and tied to a permanent structure. Each site was documented photographically and the control points were tabulated and plotted on a MapInfo GIS based on aerial photography.
4. PHYSICAL SETTING 4.1 Geological setting and evolution Nauru is underlain by a volcanic seamount that rises 4300 m from the ocean floor at the southern end of the Nauru Basin, an ocean basin 4-5 km deep that extends from the Marshall and Gilbert Islands in the northeast to the Ontong Java Plateau in the southwest (Figure 2). According to Jacobson et al. (1997), the volcanic pedestal of Nauru was constructed by seafloor eruption of basalt produced by rupture of the Pacific Plate and/or transit of the Samoan hotspot in the period from mid-Eocene to Oligocene, followed by uplift, the volcano experienced subaerial ersional truncation and the carbonate platform grew as the volcano subsided in the period from Oligocene to Pleistocene. The carbonate platform was exposed as the Pacific Plate passed over the thermal anomaly in the upper mantle in the Pleistocene. Continuing exposure increased with low sea level during glacial periods; karstification started while the island was emergent. A coral atoll subsequently developed on this raise volcanic seamount after final emergence, after the Oligocene and then today’s island was produced. 4.2 Coastal and reef geomorphology The present coastline of Nauru is characterized by a narrow coral reef crest, and reef flat and beach of coarse sand and sandy coral rubble, with a narrow coastal terrace (Figure 3). The reef flat has tide-pools and coral pinnacles. As described by Jacobson et al. (1997), the coastal terrace surrounding the island is up to 400 m wide and lies a few meters above sea level; peripheral to the coastal terrace is a fringing reef which extends up to 300 m offshore with an outer slope dipping 34o into deep water (Figure 5). The arcuate eastern coastline of Nauru represents a large submarine slide that occurred in the Holocene and produced Anibare Bay (Figure 3 and 4).

[SOPAC Technical Report 323 – Chaoxiong He]
[9]
Figure 3
Figure 4
Figure 5
BELOW: Figure 3. Aerial photography shows the coastal and reef geomorphology of Nauru. (Data resource: Nauru Government). Figure 4. 3D image of Nauru from bathymetric data. Note the submarine landslide that produced Anibare bay in the Holocene (Data source: SOPAC database). Figure 5. Vertical view of Nauru. Note the sharp offshore slopes. (Data source: SOPAC database)
RIGHT: Figure 2. Map showing location and geological setting of Nauru (Minister and Jordan, 1978).
[SOPAC Technical Report 323 – Chaoxiong He]
[10]
As a result of its small circumference and deep nearshore water, Nauru has a sharp and steep offshore slope gradient. This steep ocean slope, combined with a narrow reef crest and back reef (of less than 250 m wide), causes the island to be affected by the true ocean processes, with almost no alteration and transformation of wave processes between the open Pacific Ocean, the reef and the land-sea interface (Maharaj, 2001).
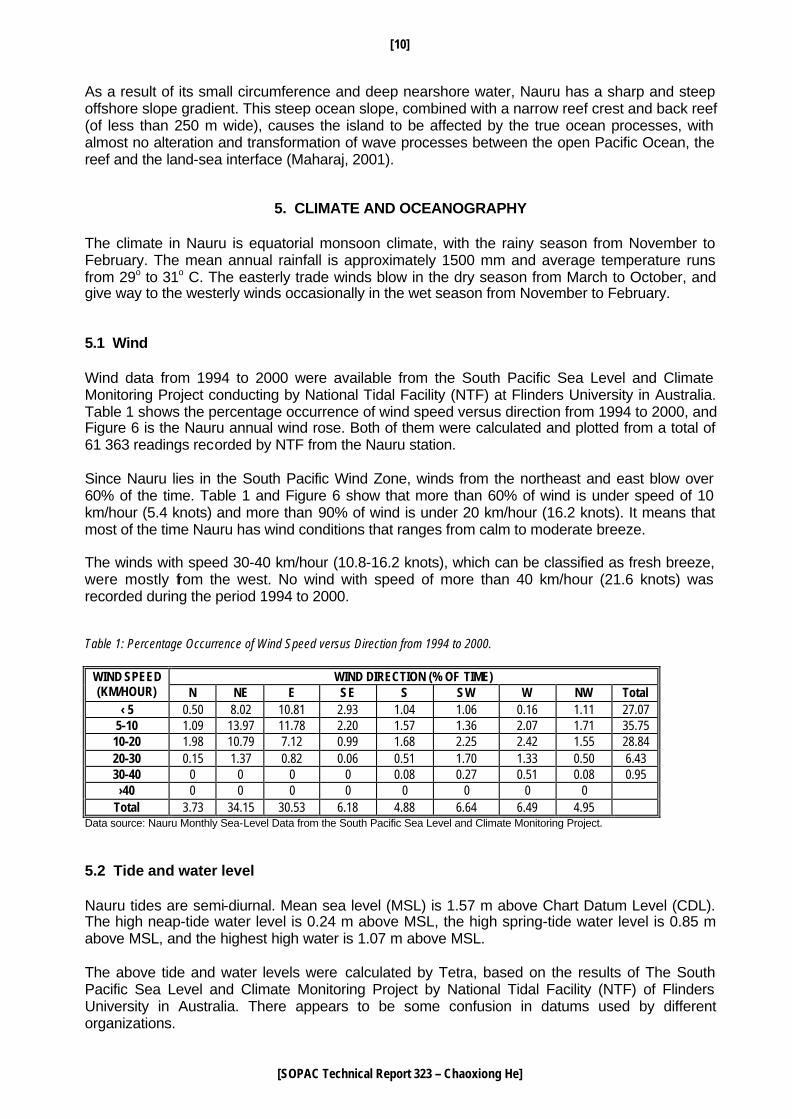
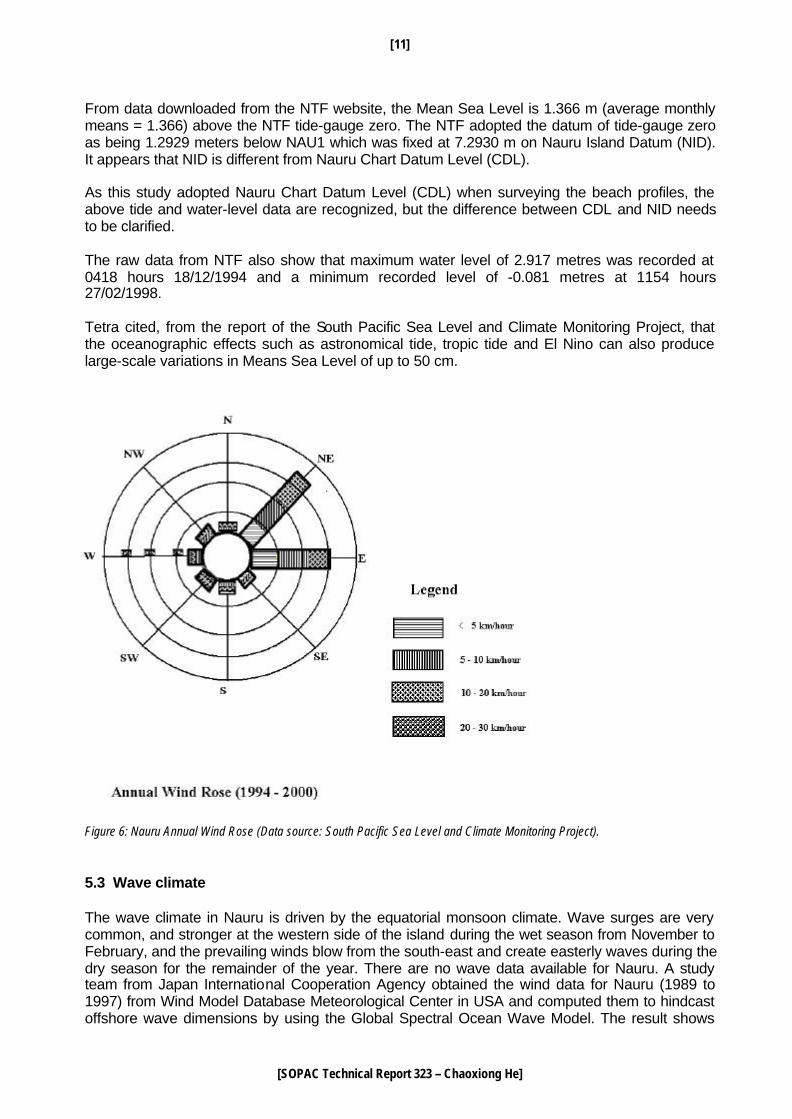
5. CLIMATE AND OCEANOGRAPHY The climate in Nauru is equatorial monsoon climate, with the rainy season from November to February. The mean annual rainfall is approximately 1500 mm and average temperature runs from 29o to 31o C. The easterly trade winds blow in the dry season from March to October, and give way to the westerly winds occasionally in the wet season from November to February. 5.1 Wind Wind data from 1994 to 2000 were available from the South Pacific Sea Level and Climate Monitoring Project conducting by National Tidal Facility (NTF) at Flinders University in Australia. Table 1 shows the percentage occurrence of wind speed versus direction from 1994 to 2000, and Figure 6 is the Nauru annual wind rose. Both of them were calculated and plotted from a total of 61 363 readings recorded by NTF from the Nauru station. Since Nauru lies in the South Pacific Wind Zone, winds from the northeast and east blow over 60% of the time. Table 1 and Figure 6 show that more than 60% of wind is under speed of 10 km/hour (5.4 knots) and more than 90% of wind is under 20 km/hour (16.2 knots). It means that most of the time Nauru has wind conditions that ranges from calm to moderate breeze. The winds with speed 30-40 km/hour (10.8-16.2 knots), which can be classified as fresh breeze, were mostly from the west. No wind with speed of more than 40 km/hour (21.6 knots) was recorded during the period 1994 to 2000. Table 1: Percentage Occurrence of Wind Speed versus Direction from 1994 to 2000.
WIND DIRECTION (% OF TIME) WIND SPEED (KM/HOUR) N NE E SE S SW W NW Total
‹ 5 0.50 8.02 10.81 2.93 1.04 1.06 0.16 1.11 27.07 5-10 1.09 13.97 11.78 2.20 1.57 1.36 2.07 1.71 35.75
10-20 1.98 10.79 7.12 0.99 1.68 2.25 2.42 1.55 28.84 20-30 0.15 1.37 0.82 0.06 0.51 1.70 1.33 0.50 6.43 30-40 0 0 0 0 0.08 0.27 0.51 0.08 0.95
›40 0 0 0 0 0 0 0 0 Total 3.73 34.15 30.53 6.18 4.88 6.64 6.49 4.95
Data source: Nauru Monthly Sea-Level Data from the South Pacific Sea Level and Climate Monitoring Project. 5.2 Tide and water level Nauru tides are semi-diurnal. Mean sea level (MSL) is 1.57 m above Chart Datum Level (CDL). The high neap-tide water level is 0.24 m above MSL, the high spring-tide water level is 0.85 m above MSL, and the highest high water is 1.07 m above MSL. The above tide and water levels were calculated by Tetra, based on the results of The South Pacific Sea Level and Climate Monitoring Project by National Tidal Facility (NTF) of Flinders University in Australia. There appears to be some confusion in datums used by different organizations.
[SOPAC Technical Report 323 – Chaoxiong He]
[11]
From data downloaded from the NTF website, the Mean Sea Level is 1.366 m (average monthly means = 1.366) above the NTF tide-gauge zero. The NTF adopted the datum of tide-gauge zero as being 1.2929 meters below NAU1 which was fixed at 7.2930 m on Nauru Island Datum (NID). It appears that NID is different from Nauru Chart Datum Level (CDL). As this study adopted Nauru Chart Datum Level (CDL) when surveying the beach profiles, the above tide and water-level data are recognized, but the difference between CDL and NID needs to be clarified. The raw data from NTF also show that maximum water level of 2.917 metres was recorded at 0418 hours 18/12/1994 and a minimum recorded level of -0.081 metres at 1154 hours 27/02/1998. Tetra cited, from the report of the South Pacific Sea Level and Climate Monitoring Project, that the oceanographic effects such as astronomical tide, tropic tide and El Nino can also produce large-scale variations in Means Sea Level of up to 50 cm. Figure 6: Nauru Annual Wind Rose (Data source: South Pacific Sea Level and Climate Monitoring Project). 5.3 Wave climate The wave climate in Nauru is driven by the equatorial monsoon climate. Wave surges are very common, and stronger at the western side of the island during the wet season from November to February, and the prevailing winds blow from the south-east and create easterly waves during the dry season for the remainder of the year. There are no wave data available for Nauru. A study team from Japan International Cooperation Agency obtained the wind data for Nauru (1989 to 1997) from Wind Model Database Meteorological Center in USA and computed them to hindcast offshore wave dimensions by using the Global Spectral Ocean Wave Model. The result shows
[SOPAC Technical Report 323 – Chaoxiong He]
[12]
that the wave directions predominate from north-northeast to southeast, about 89% of all of the time, and waves 1 m or less in height account for about 90%. The influence of large waves generated by typhoons or cyclones is very small. Maharaj (2001) reported that the average wave height can be 2.5 m and even 3 m during extreme high-water spring tides. In summary, Nauru experiences the offshore deep-water wave conditions as following: 1. Tradewind waves – Prevalent from March to November. 2. South Pacific swell: Most prevalent from April to October. 3. North Pacific swell: Most prevalent from October to March. 4. West wave surge: Most prevalent from November to March.
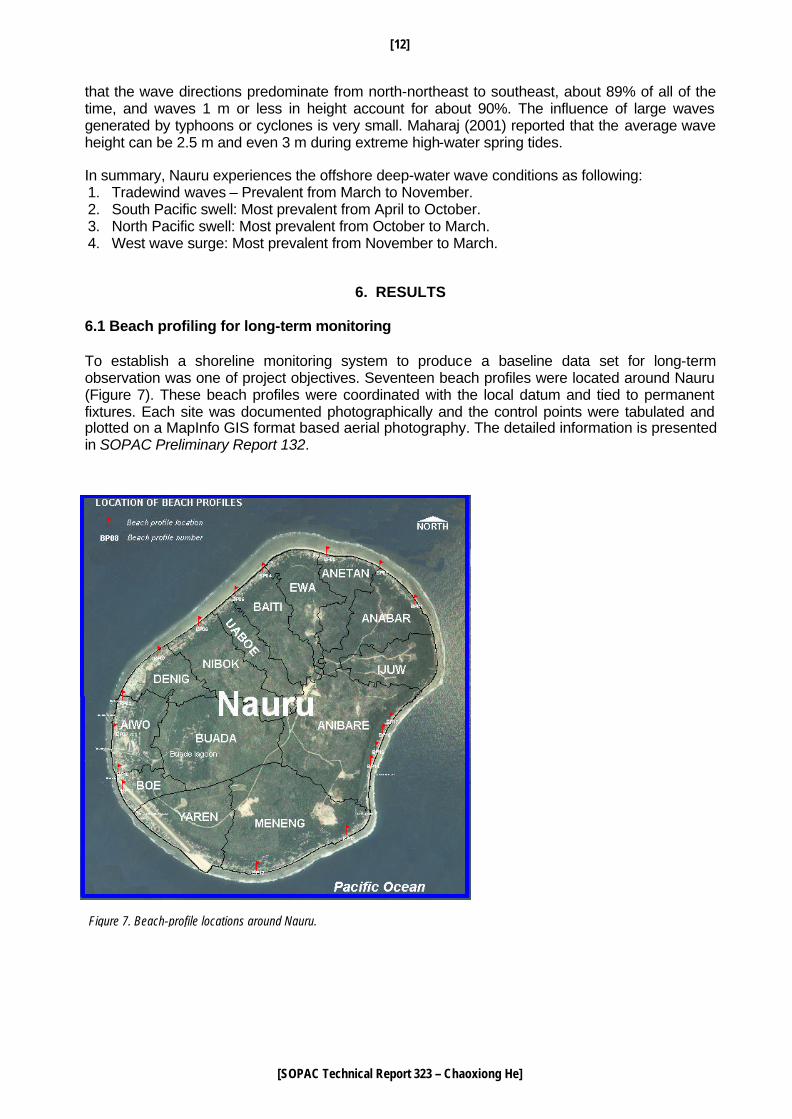
6. RESULTS 6.1 Beach profiling for long-term monitoring To establish a shoreline monitoring system to produce a baseline data set for long-term observation was one of project objectives. Seventeen beach profiles were located around Nauru (Figure 7). These beach profiles were coordinated with the local datum and tied to permanent fixtures. Each site was documented photographically and the control points were tabulated and plotted on a MapInfo GIS format based aerial photography. The detailed information is presented in SOPAC Preliminary Report 132.
Figure 7. Beach-profile locations around Nauru.
[SOPAC Technical Report 323 – Chaoxiong He]
[13]
The sediment distribution around Nauru was recorded during the beach profiling. It was found that better-sorted, finer sands are deposited in the western section of Nauru’s coast, in the lee of the easterly tradewinds, while other areas are characterized by deposits of coarser sand and coral rubble.
6.2 Problem sites identified
6.2.1 Yaren Area
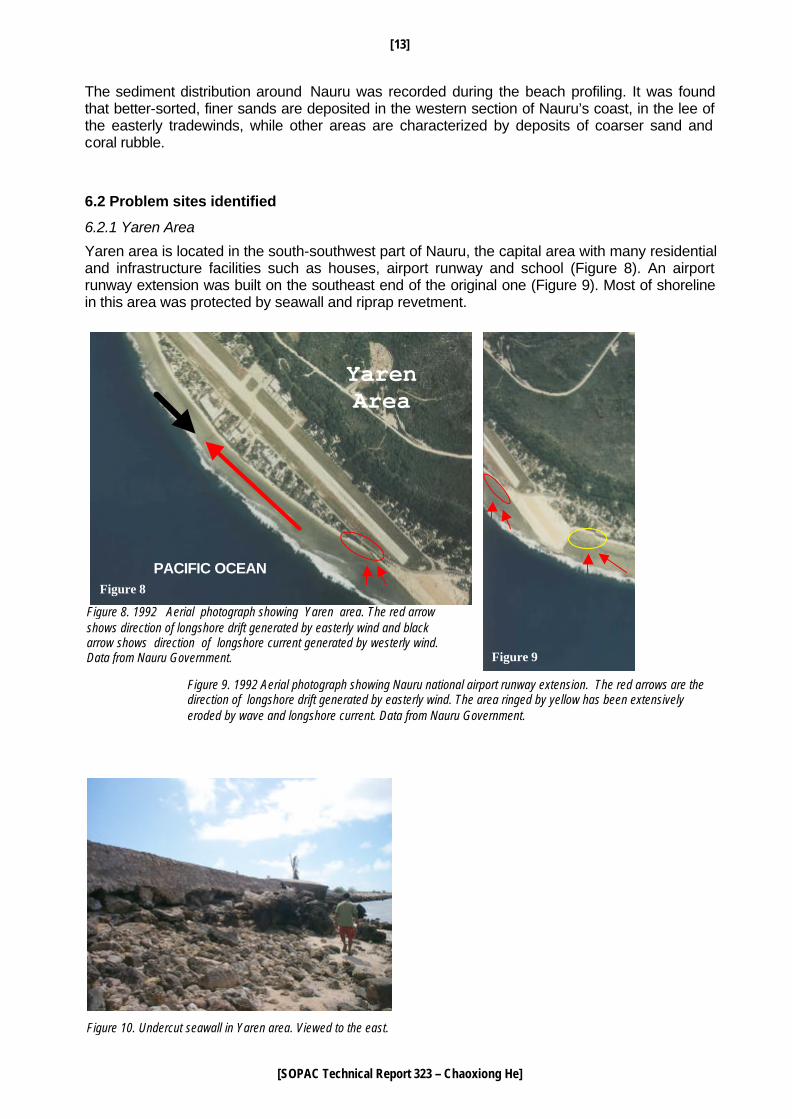
Yaren area is located in the south-southwest part of Nauru, the capital area with many residential and infrastructure facilities such as houses, airport runway and school (Figure 8). An airport runway extension was built on the southeast end of the original one (Figure 9). Most of shoreline in this area was protected by seawall and riprap revetment.
Yaren Area
PACIFIC OCEAN
Figure 8
Figure 9
Figure 10. Undercut seawall in Yaren area. Viewed to the east.
Figure 8. 1992 Aerial photograph showing Yaren area. The red arrow shows direction of longshore drift generated by easterly wind and black arrow shows direction of longshore current generated by westerly wind. Data from Nauru Government.
Figure 9. 1992 Aerial photograph showing Nauru national airport runway extension. The red arrows are the direction of longshore drift generated by easterly wind. The area ringed by yellow has been extensively eroded by wave and longshore current. Data from Nauru Government.
[SOPAC Technical Report 323 – Chaoxiong He]
[14]
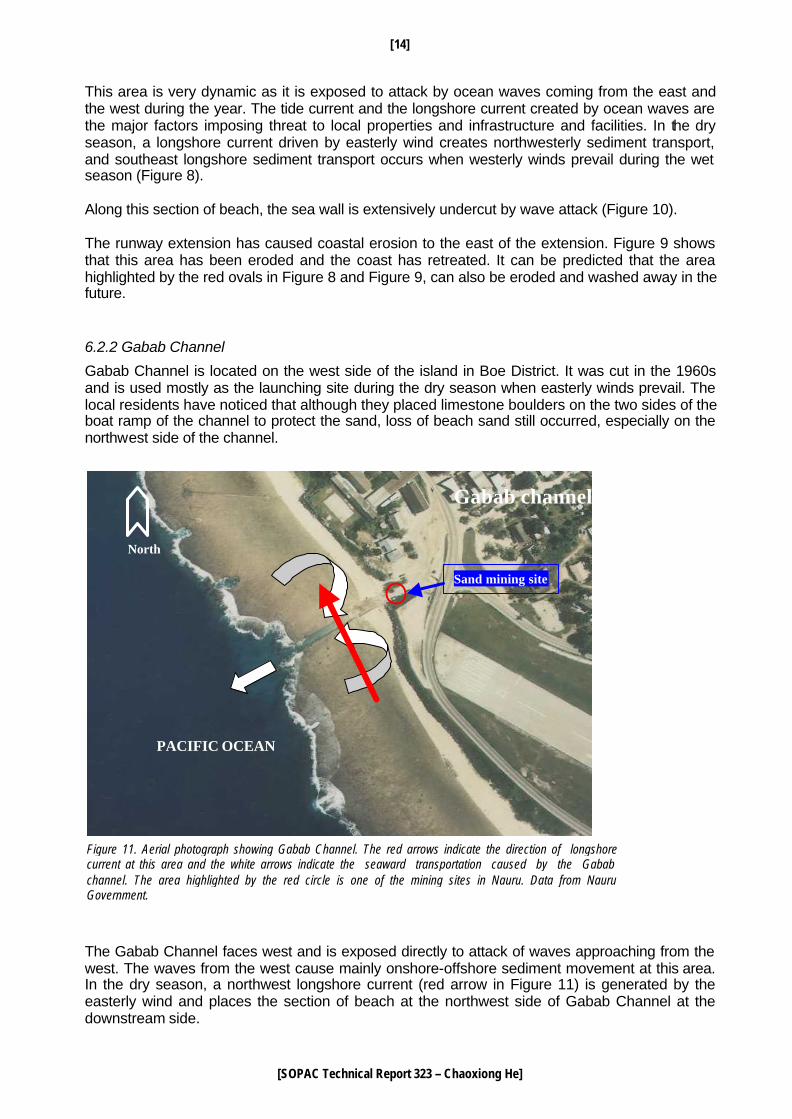
This area is very dynamic as it is exposed to attack by ocean waves coming from the east and the west during the year. The tide current and the longshore current created by ocean waves are the major factors imposing threat to local properties and infrastructure and facilities. In the dry season, a longshore current driven by easterly wind creates northwesterly sediment transport, and southeast longshore sediment transport occurs when westerly winds prevail during the wet season (Figure 8). Along this section of beach, the sea wall is extensively undercut by wave attack (Figure 10). The runway extension has caused coastal erosion to the east of the extension. Figure 9 shows that this area has been eroded and the coast has retreated. It can be predicted that the area highlighted by the red ovals in Figure 8 and Figure 9, can also be eroded and washed away in the future. 6.2.2 Gabab Channel
Gabab Channel is located on the west side of the island in Boe District. It was cut in the 1960s and is used mostly as the launching site during the dry season when easterly winds prevail. The local residents have noticed that although they placed limestone boulders on the two sides of the boat ramp of the channel to protect the sand, loss of beach sand still occurred, especially on the northwest side of the channel.
The Gabab Channel faces west and is exposed directly to attack of waves approaching from the west. The waves from the west cause mainly onshore-offshore sediment movement at this area. In the dry season, a northwest longshore current (red arrow in Figure 11) is generated by the easterly wind and places the section of beach at the northwest side of Gabab Channel at the downstream side.
PACIFIC OCEAN
Gabab channel
Sand mining site
Figure 11. Aerial photograph showing Gabab Channel. The red arrows indicate the direction of longshore current at this area and the white arrows indicate the seaward transportation caused by the Gabab channel. The area highlighted by the red circle is one of the mining sites in Nauru. Data from Nauru Government.
North
[SOPAC Technical Report 323 – Chaoxiong He]
[15]
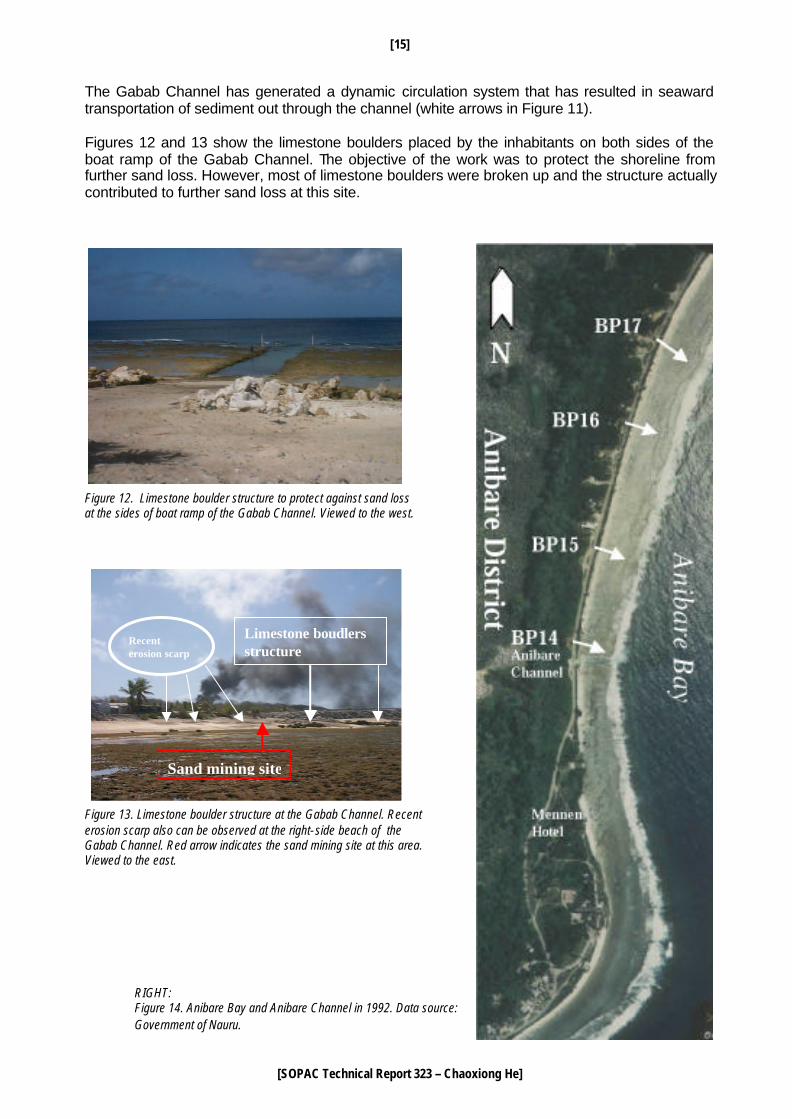
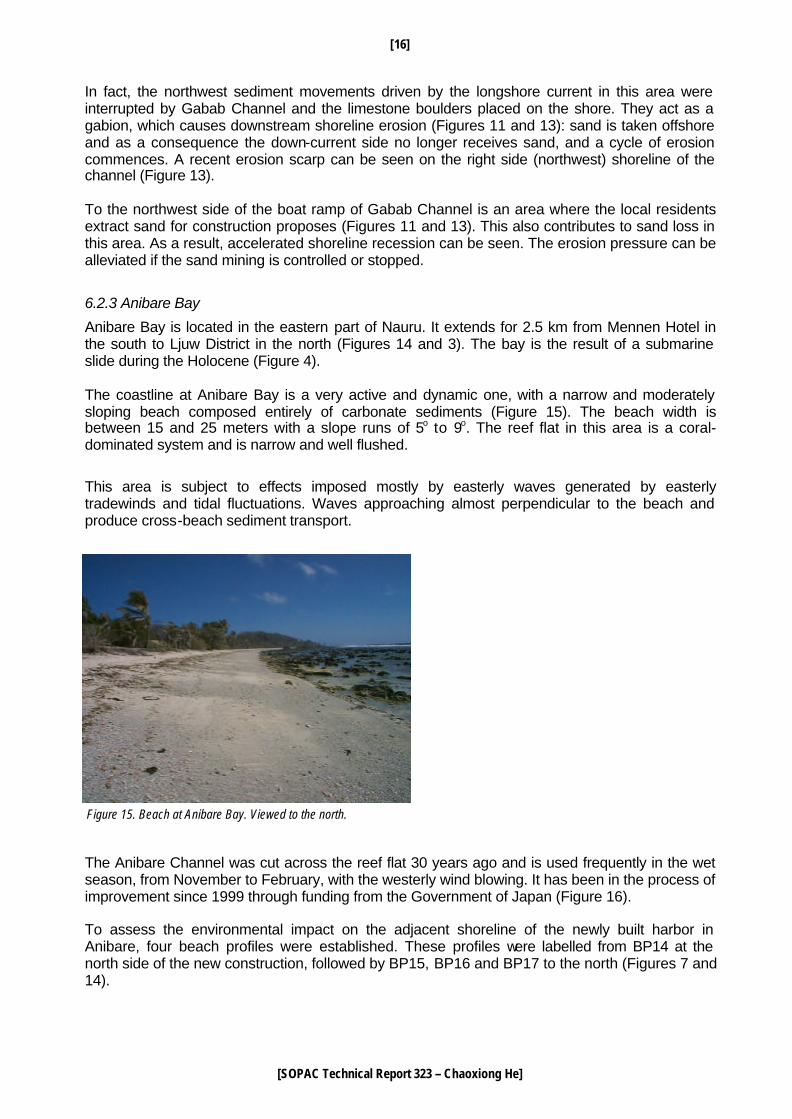
The Gabab Channel has generated a dynamic circulation system that has resulted in seaward transportation of sediment out through the channel (white arrows in Figure 11). Figures 12 and 13 show the limestone boulders placed by the inhabitants on both sides of the boat ramp of the Gabab Channel. The objective of the work was to protect the shoreline from further sand loss. However, most of limestone boulders were broken up and the structure actually contributed to further sand loss at this site.
Figure 12. Limestone boulder structure to protect against sand loss at the sides of boat ramp of the Gabab Channel. Viewed to the west.
Figure 13. Limestone boulder structure at the Gabab Channel. Recent erosion scarp also can be observed at the right- side beach of the Gabab Channel. Red arrow indicates the sand mining site at this area. Viewed to the east.
Sand mining site
Limestone boudlersstructure
Recenterosion scarp
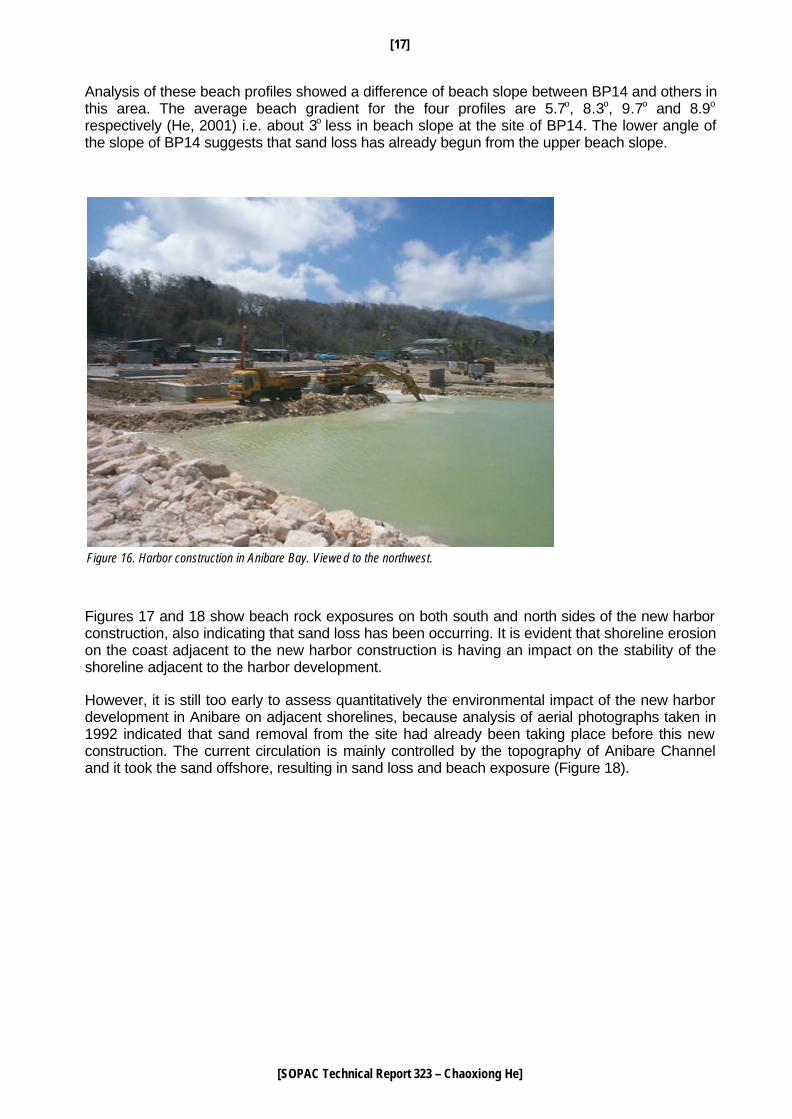
RIGHT: Figure 14. Anibare Bay and Anibare Channel in 1992. Data source: Government of Nauru.
[SOPAC Technical Report 323 – Chaoxiong He]
[16]
In fact, the northwest sediment movements driven by the longshore current in this area were interrupted by Gabab Channel and the limestone boulders placed on the shore. They act as a gabion, which causes downstream shoreline erosion (Figures 11 and 13): sand is taken offshore and as a consequence the down-current side no longer receives sand, and a cycle of erosion commences. A recent erosion scarp can be seen on the right side (northwest) shoreline of the channel (Figure 13). To the northwest side of the boat ramp of Gabab Channel is an area where the local residents extract sand for construction proposes (Figures 11 and 13). This also contributes to sand loss in this area. As a result, accelerated shoreline recession can be seen. The erosion pressure can be alleviated if the sand mining is controlled or stopped.
6.2.3 Anibare Bay
Anibare Bay is located in the eastern part of Nauru. It extends for 2.5 km from Mennen Hotel in the south to Ljuw District in the north (Figures 14 and 3). The bay is the result of a submarine slide during the Holocene (Figure 4). The coastline at Anibare Bay is a very active and dynamic one, with a narrow and moderately sloping beach composed entirely of carbonate sediments (Figure 15). The beach width is between 15 and 25 meters with a slope runs of 5o to 9o. The reef flat in this area is a coral- dominated system and is narrow and well flushed.
This area is subject to effects imposed mostly by easterly waves generated by easterly tradewinds and tidal fluctuations. Waves approaching almost perpendicular to the beach and produce cross-beach sediment transport.
The Anibare Channel was cut across the reef flat 30 years ago and is used frequently in the wet season, from November to February, with the westerly wind blowing. It has been in the process of improvement since 1999 through funding from the Government of Japan (Figure 16). To assess the environmental impact on the adjacent shoreline of the newly built harbor in Anibare, four beach profiles were established. These profiles were labelled from BP14 at the north side of the new construction, followed by BP15, BP16 and BP17 to the north (Figures 7 and 14).
Figure 15. Beach at Anibare Bay. Viewed to the north.
BP14 BP16 BP17 N
[SOPAC Technical Report 323 – Chaoxiong He]
[17]
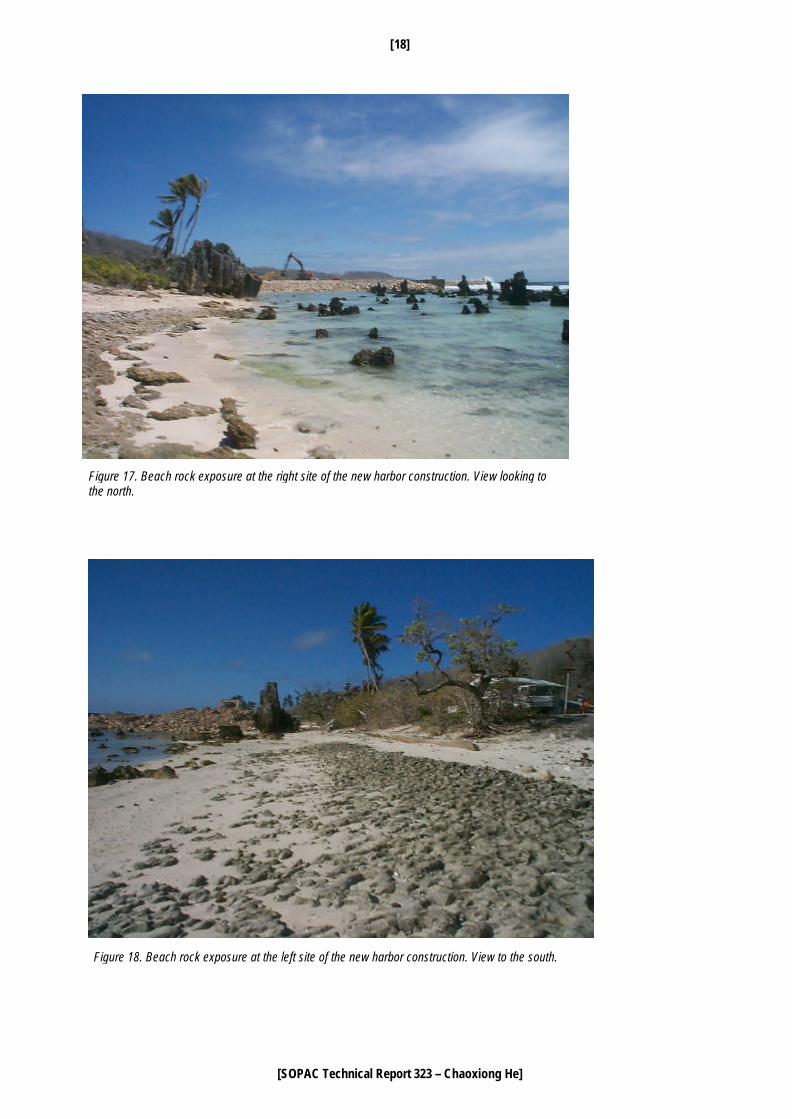
Analysis of these beach profiles showed a difference of beach slope between BP14 and others in this area. The average beach gradient for the four profiles are 5.7o, 8.3o, 9.7o and 8.9o respectively (He, 2001) i.e. about 3o less in beach slope at the site of BP14. The lower angle of the slope of BP14 suggests that sand loss has already begun from the upper beach slope. Figures 17 and 18 show beach rock exposures on both south and north sides of the new harbor construction, also indicating that sand loss has been occurring. It is evident that shoreline erosion on the coast adjacent to the new harbor construction is having an impact on the stability of the shoreline adjacent to the harbor development. However, it is still too early to assess quantitatively the environmental impact of the new harbor development in Anibare on adjacent shorelines, because analysis of aerial photographs taken in 1992 indicated that sand removal from the site had already been taking place before this new construction. The current circulation is mainly controlled by the topography of Anibare Channel and it took the sand offshore, resulting in sand loss and beach exposure (Figure 18).
Figure 16. Harbor construction in Anibare Bay. Viewed to the northwest.
[SOPAC Technical Report 323 – Chaoxiong He]
[18]
Figure 17. Beach rock exposure at the right site of the new harbor construction. View looking to the north.
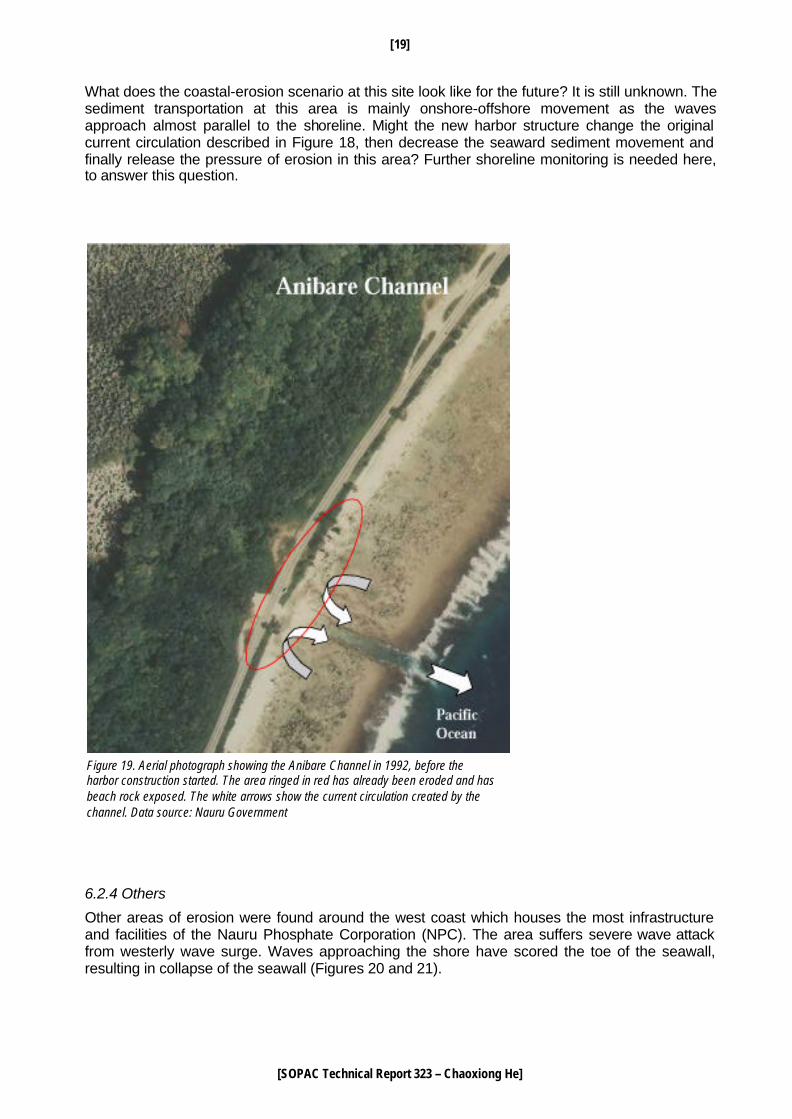
Figure 18. Beach rock exposure at the left site of the new harbor construction. View to the south.
[SOPAC Technical Report 323 – Chaoxiong He]
[19]
What does the coastal-erosion scenario at this site look like for the future? It is still unknown. The sediment transportation at this area is mainly onshore-offshore movement as the waves approach almost parallel to the shoreline. Might the new harbor structure change the original current circulation described in Figure 18, then decrease the seaward sediment movement and finally release the pressure of erosion in this area? Further shoreline monitoring is needed here, to answer this question.
6.2.4 Others
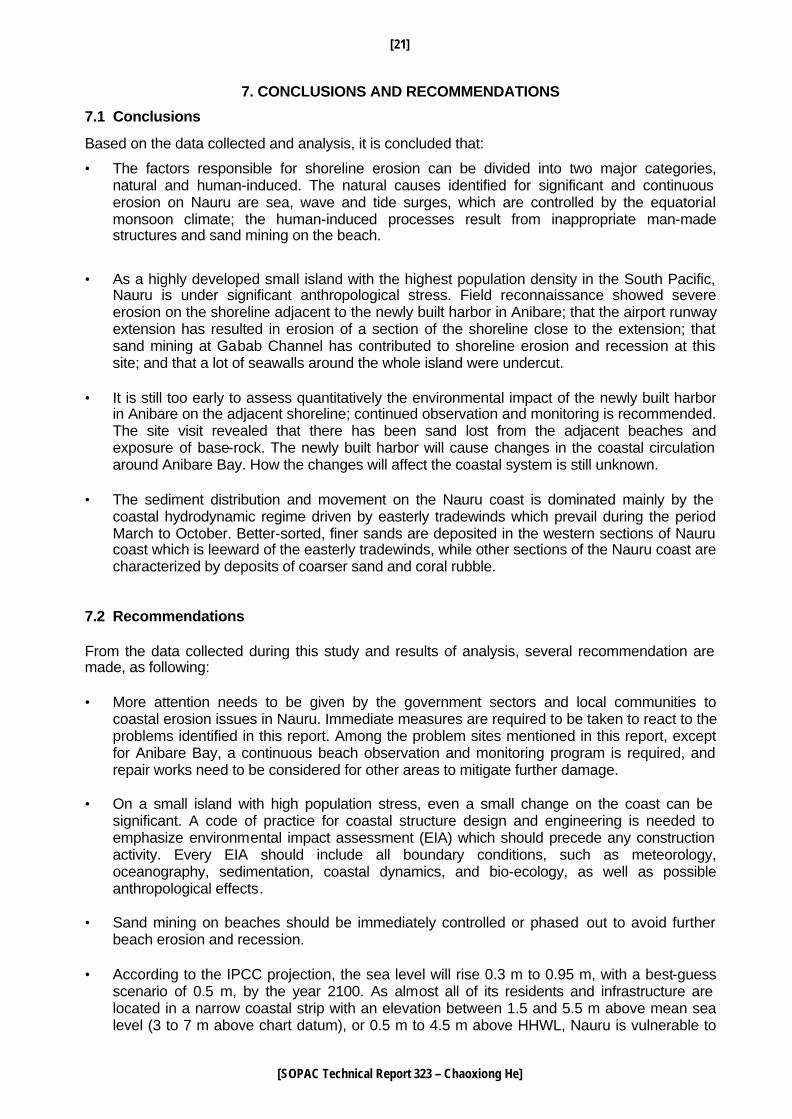
Other areas of erosion were found around the west coast which houses the most infrastructure and facilities of the Nauru Phosphate Corporation (NPC). The area suffers severe wave attack from westerly wave surge. Waves approaching the shore have scored the toe of the seawall, resulting in collapse of the seawall (Figures 20 and 21).
Pacific Ocean
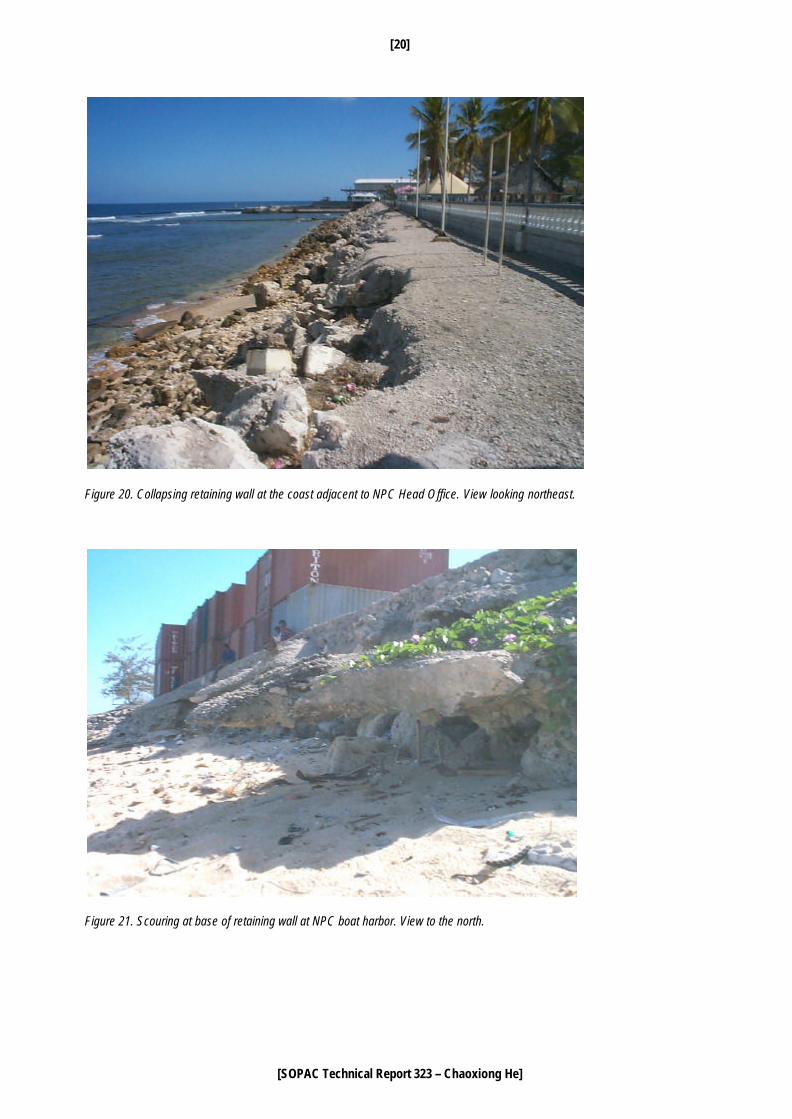
Figure 19. Aerial photograph showing the Anibare Channel in 1992, before the harbor construction started. The area ringed in red has already been eroded and has beach rock exposed. The white arrows show the current circulation created by the channel. Data source: Nauru Government
[SOPAC Technical Report 323 – Chaoxiong He]
[20]
Figure 20. Collapsing retaining wall at the coast adjacent to NPC Head Office. View looking northeast.
Figure 21. Scouring at base of retaining wall at NPC boat harbor. View to the north.
[SOPAC Technical Report 323 – Chaoxiong He]
[21]
7. CONCLUSIONS AND RECOMMENDATIONS
7.1 Conclusions
Based on the data collected and analysis, it is concluded that:
• The factors responsible for shoreline erosion can be divided into two major categories, natural and human-induced. The natural causes identified for significant and continuous erosion on Nauru are sea, wave and tide surges, which are controlled by the equatorial monsoon climate; the human-induced processes result from inappropriate man-made structures and sand mining on the beach.
• As a highly developed small island with the highest population density in the South Pacific, Nauru is under significant anthropological stress. Field reconnaissance showed severe erosion on the shoreline adjacent to the newly built harbor in Anibare; that the airport runway extension has resulted in erosion of a section of the shoreline close to the extension; that sand mining at Gabab Channel has contributed to shoreline erosion and recession at this site; and that a lot of seawalls around the whole island were undercut.
• It is still too early to assess quantitatively the environmental impact of the newly built harbor
in Anibare on the adjacent shoreline; continued observation and monitoring is recommended. The site visit revealed that there has been sand lost from the adjacent beaches and exposure of base-rock. The newly built harbor will cause changes in the coastal circulation around Anibare Bay. How the changes will affect the coastal system is still unknown.
• The sediment distribution and movement on the Nauru coast is dominated mainly by the
coastal hydrodynamic regime driven by easterly tradewinds which prevail during the period March to October. Better-sorted, finer sands are deposited in the western sections of Nauru coast which is leeward of the easterly tradewinds, while other sections of the Nauru coast are characterized by deposits of coarser sand and coral rubble.
7.2 Recommendations From the data collected during this study and results of analysis, several recommendation are made, as following: • More attention needs to be given by the government sectors and local communities to
coastal erosion issues in Nauru. Immediate measures are required to be taken to react to the problems identified in this report. Among the problem sites mentioned in this report, except for Anibare Bay, a continuous beach observation and monitoring program is required, and repair works need to be considered for other areas to mitigate further damage.
• On a small island with high population stress, even a small change on the coast can be
significant. A code of practice for coastal structure design and engineering is needed to emphasize environmental impact assessment (EIA) which should precede any construction activity. Every EIA should include all boundary conditions, such as meteorology, oceanography, sedimentation, coastal dynamics, and bio-ecology, as well as possible anthropological effects.
• Sand mining on beaches should be immediately controlled or phased out to avoid further
beach erosion and recession. • According to the IPCC projection, the sea level will rise 0.3 m to 0.95 m, with a best-guess
scenario of 0.5 m, by the year 2100. As almost all of its residents and infrastructure are located in a narrow coastal strip with an elevation between 1.5 and 5.5 m above mean sea level (3 to 7 m above chart datum), or 0.5 m to 4.5 m above HHWL, Nauru is vulnerable to
[SOPAC Technical Report 323 – Chaoxiong He]
[22]
the future sea-level rise. Recent SOPAC studies have indicated that land will be lost and some infrastructure will be under threat by overtopping and inundation during extreme events at present sea level. An assessment of vulnerability to accelerated sea-level rise, even to climate change, is necessary for Nauru.
• For long-term monitoring of shoreline stability, beach profiles established around Nauru
should be re-surveyed periodically, at least on a yearly basis, if not more often, and immediately after extreme events.
REFERENCES He C. 2001. Measure of Nauru Beach Profiles. SOPAC Preliminary Report 132. Hill, P.J. and Jacobson, G. 1989. Structure and evolution of Nauru Island, Central Pacific Ocean. Australian
Journal of earth Science (1989) 36, 365-381. Jacobson G., Hill, P.J. and Ghassemi, F. 1997. Geology and Hydrogeology of Nauru Island. In: H. L.
Vacher and T. Quinn (eds.), Geology and Hydrology of Carbonate Islands. Developments in Sedimentology. Elsevier, Amsterdam. Pp. 707-742.
Magellan Geographix. 2000. www.maps.com. Maharaj, R. J. 2001 Assessment of coastal engineering and environmental impacts of a boat harbour
facility, Anibare bay, Republic of Nauru (RON). SOPAC Preliminary Report 127. Minster, J. B. and Jordan, T. H. 1978. Present-date plate motions. Journal of Geophysical Research, 83,
5331-5354. Tetra Co., LTD, Japan International Cooperation Agency 1998. Basic Design Study Report on the Project
Improvement of Community Boat Harbor in the Republic of Nauru.