coastal community-based protocols and guidelines for
TRANSCRIPT

M.Sc Systems Science Ilghelich Nadimi
Page | 1
University of Ottawa
Faculty of Graduate and Post-Doctoral Studies
Master’s Program in Systems Science
Coastal Community-based Protocols and Guidelines
for Adaptation Planning
By:
ILGHELICH NADIMI
Thesis Supervisor: Professor.Daniel E. Lane
Telfer School of Management
University of Ottawa
© Ilghelich Nadimi, Ottawa, Canada, 2012

M.Sc Systems Science Ilghelich Nadimi
Page | 2
Abstract
According to the Intergovernmental Panel on Climate Change report , “Adaptation to climate
change is defined as, an adjustment in natural or human systems in response to actual or
expected climatic stimuli or their effects, which moderates harm or exploits beneficial
opportunities” (IPCC 2007). Adaptation is required due to the increase in the number of
natural disasters and extreme changes in environmental conditions in coastal areas that are a
function of sea level rise, floods, extreme heat, drought, and coastal storm surge from severe
storms. To reduce the impacts of climate change risks in the future, coastal communities
through local government initiatives are compelled to develop and implement grass roots
community plans.
This study is part of an International Community-University Research Alliance (ICURA),
“C-Change” that aims to develop community-based adaptation protocols based on best
practices and through the evaluation of the scientific method of problem solving designed to
help coastal communities be sustainable and to protect their local coastal environments. To
this end, the thesis reviews the international development and application of adaptive
strategies related to climate change and evaluates these global strategies for identification of
best practices and application to coastal communities.
The objective of this research is to design and develop improved C-Change community
adaptation frameworks by analyzing the applications of international protocols and local
action plans with respect to the scientific method and of problem solving through using AHP
(Analytic hierarchy process) as a tool, and by choosing best practices to provide guidelines
for communities’ climate adaptation plans for the C-Change ICURA coastal communities
in Canada.
Keywords: Climate change, coastal communities, adaptation planning, planning protocols,
Canada and the Caribbean.

M.Sc Systems Science Ilghelich Nadimi
Page | 3
Table of Contents
Abstract …………………….…………………......................................................2
1 Introduction ........................................................................................................... 10
1.1 Background and Motivation ........................................................................... 10
1.2 Problem Definition ......................................................................................... 11
1.3 Research questions and objectives ................................................................. 12
1.4 Organization of thesis..................................................................................... 13
2 Literature Review .................................................................................................. 15
2.1 Global Adaptation Protocols .......................................................................... 15
2.2 Case studies .................................................................................................... 39
2.3 The Scientific Method of Problem Solving.................................................... 58
2.4 The Analytic hierarchy process (AHP) .......................................................... 61
2.5 Summary of literature review ......................................................................... 64
3 Methodology .......................................................................................................... 65
3.1 Research Process ............................................................................................ 65
3.2 Scientific Method of Problem Solving ........................................................... 66
3.3 Phase 1: Evaluating Adaptation Protocols by AHP ....................................... 69
3.4 Phase 2: Application of scientific methods to C-Change communities ......... 71
3.5 Phase 3: Development of Community Guidelines for adaptation .................. 72
3.6 Summary of the Chapter ................................................................................ 73
4 Analysis and Results .............................................................................................. 74
4.1 Preparation of the AHP Weighted Hierarchy ................................................. 75
4.2 Phase1. Evaluation of International protocols for managing adaptation ....... 83
4.3 Identification of ‘best practices’ ..................................................................... 91
4.4 Phase 2 - Application of scientific methods on C-Change communities ....... 93
4.4.1 Isle Madame, Nova Scotia ........................................................................ 94
4.4.2 Gibsons, British Columbia ........................................................................ 95
4.4.3 Iqaluit, Nunavut ........................................................................................ 97
4.4.4 Charlottetown, Prince Edward Island ....................................................... 99
4.4.5 Community result analysis ..................................................................... 100
M.Sc Systems Science Ilghelich Nadimi
Page | 4
4.5 Gap analysis of the ranked C-Change Canada communities ....................... 105
5 Community Action plan and Adaptation Guideline ............................................ 107
5.1 General Guideline and Action Plan Frameworks ......................................... 109
5.2 Assignment of Responsibilities .................................................................... 112
5.3 Family Emergency Plan ............................................................................... 120
5.4 Conceptual Action plan website output ....................................................... 123
6 Conclusions and Recommendations .................................................................... 131
6.1 Conclusions .................................................................................................. 131
6.2 Recommendations for Future Research ....................................................... 134
Bibliography .............................................................................................................. 136
Appendices ................................................................................................................. 146
Appendix A. Scientific Method of Problem Solving AHP Hierarchy Pairwise
Comparison Inputs and Criteria and Subcriteria Weights .................................................. 146
Appendix B. Data Grid Utility Function ............................................................... 151
Appendix C. Protocol’s Data Grids....................................................................... 153
Appendix D. Protocol’s AHP output ..................................................................... 157
Appendix E. Communities Data Grid’s ................................................................. 162
Appendix F. C-Change Communities AHP output. ............................................... 166

M.Sc Systems Science Ilghelich Nadimi
Page | 5
List of Tables
Table 2.1: CCP Milestones. Source: (Binder 2007; CCP Australia 2009) .............................. 18
Table 2.2: FCM Milestones Source: (FCM, 2011) .................................................................. 21
Table 2.3: UNDP-APF Framework. Sources: (UNDP 2008; UNDP-APF 2012) ................... 28
Table 2.4: Summary of Adaptation Protocols description ....................................................... 38
Table 2.5: Case Studies Summary ........................................................................................... 57
Table 2.6: Saaty’s AHP Rating Scale. Source: (Lee, Yoon et al. 2007) .................................. 63
Table 4.1: Pairwise Comparison the relative importance with respect to: Goal. Source: Expert
Choice 2004. ............................................................................................................................ 76
Table 4.2: Comparison the relative importance with respect to Problem Identification (Expert
Choice 2004). ........................................................................................................................... 77
Table 4.3: Comparison the relative importance with respect to Criterion Data (Expert Choice
2004). ....................................................................................................................................... 78
Table 4.4: Comparison the relative importance with respect to Modeling (Expert Choice
2004). ....................................................................................................................................... 78
Table 4.5: Comparison the relative importance with respect to Testing (Expert Choice 2004).
.................................................................................................................................................. 79
Table 4.6: Comparison the relative importance with respect to Monitoring (Expert Choice
2004). ....................................................................................................................................... 80
Table 4.7: Comparison the relative importance with respect to Implementation (Expert
Choice 2004). ........................................................................................................................... 80
Table 4.8: Data Grid scores (protocols). Source: (Expert Choice 2004) ................................. 84
Table 4.9: Communities Data Grid score. Source: (Expert Choice 2004) ............................ 100
Table 5.1: Mayor’s responsibilities (Source: Corporation of the Town of Mattawa 2008) .. 113
Table 5.2: Responsibilities of the Municipal Control Group (Source: Corporation of the Town
of Mattawa 2008) ................................................................................................................... 115
Table 5.3: Police force’s responsibilities (Corporation of the Town of Mattawa 2008) ....... 116
Table 5.4: Fire department’s responsibilities (Corporation of the Town of Mattawa 2008) . 117
M.Sc Systems Science Ilghelich Nadimi
Page | 6
Table 5.5: Ambulance and health services responsibilities (Corporation of the Town of
Mattawa 2008) ....................................................................................................................... 118
Table 5.6: Community services responsibilities (Corporation of the Town of Mattawa 2008)
................................................................................................................................................ 119
Table 5.7: 72 hour plan for families, Source: (Public Safety and Emergency Prepardness
Canada 2011) ......................................................................................................................... 120
Table A.1: Pairwise Comparison the relative importance with respect to: Goal…….…….146
Table A.2: Comparison the relative importance with respect to Problem Identification….147
Table A.3: Comparison the relative importance with respect to Criterion Data………...…147
Table A.4: Comparison the relative importance with respect to Modeling………………..147
Table A.5: Comparison the relative importance with respect to Testing……………..……148
Table A.6: Comparison the relative importance with respect to Monitoring……….….….148
Table A.7: Comparison the relative importance with respect to Implementation…….…...148
Table C.1: Data Grid scores (Protocols)…………………………………………………...153
Table C.2: Data Grid scores (Protocols)……………………………………………..….…154
Table C.3: Data Grid scores (Protocols)………………………………..………….….…...154
Table C.4: Data Grid scores (Protocols)………………………………….………….……155
Table C.5: Data Grid scores (Protocols)……………………………….…………….……155
Table C.6: Data Grid scores (Protocols)…………………………………………….…….156
Table E.1: Data Grid scores (Communities)…………………………….……..…...……..162
Table E.2: Data Grid scores (Communities)…………………………….……..…..……..163
Table E.3: Data Grid scores (Communities)…………………………….………....……..163
Table E.4: Data Grid scores (Communities)…………………………………..…..……..164
Table E.5: Data Grid scores (Communities)……………………………………………..164
Table E.6: Data Grid scores (Communities)……………………………………….…….165
Table F.1: Communities final AHP overall scores ………………………………………167

M.Sc Systems Science Ilghelich Nadimi
Page | 7
List of Figures
Figure 2-1: CARE’s Framework for CBA (Dazé, Ambrose et al. 2009) ................................ 24
Figure 2-2: C-Change Research Process Map. Source: (International Community-University
Research Alliance (ICURA) 2007). ......................................................................................... 34
Figure 2-3: Map of Canada, Source: (EmbassyWorld.com Inc 2012) .................................... 40
Figure 2-4: Aerial Photo of the Greater Vancouver Regional District (GVRD). (Source:
Google Map, 2012) .................................................................................................................. 41
Figure 2-5: Aerial Photo of the Toronto (Source: Google Map, 2012) ................................... 44
Figure 2-6: Aerial Photo of the Halifax Regional municipality .............................................. 45
Figure 2-7: Halifax Harbour Water Level Flood Impacts from Scenario 2C. ......................... 47
Figure 2-8: Aerial Photo of Edmonton (Source: Google Map, 2012) ..................................... 48
Figure 2-9: Aerial Photo of Sudbury (Source: Google Map, 2012) ........................................ 50
Figure 2-10: Aerial Photo of Dawson Creek. (Source: Google Map, 2012) ........................... 52
Figure 2-11: The Management Science Process (Taylor 2001) ............................................... 59
Figure 2-12: Structure of hierarchical Structure of AHP model, Source: (Lee, Yoon et al.
2007) ........................................................................................................................................ 62
Figure 3-1: Steps of the Scientific Method of Problem Solving based on Figure 2.11 (Taylor
2001) ........................................................................................................................................ 68
Figure 3-2: Tree view- Expert Choice output. Source: (Expert Choice 2004) ........................ 69
Figure 3-3: Detail AHP hierarchy model for the Scientific Method of Problem Solving
formulation. Source: (Expert Choice 2004) ............................................................................. 70
Figure 4-1: Detail AHP hierarchy model for the Scientific Method of Problem Solving
formulation with assigned weight. (Source: Expert Choice 2004) .......................................... 82
Figure 4-2: Main Criteria’s final scores. Source: (Expert Choice 2004) ................................. 83
Figure 4-3: Utility Curve ......................................................................................................... 86
Figure 4-4: International Protocols final AHP overall scores. (Source: Expert Choice 2004) 87
Figure 4-5: Weighted head to head Protocols Comparison. Source: (Expert Choice 2004) ... 88
M.Sc Systems Science Ilghelich Nadimi
Page | 8
Figure 4-6: Protocol’s comparison, Source: (Expert Choice 2004) ......................................... 89
Figure 4-7: Aerial Photo of the Town of Isle Madame (Source: Google Map, 2012) ............. 94
Figure 4-8: Aerial Photo of the Town of Gibsons (Source: Google Map, 2012) .................... 95
Figure 4-9: Aerial Photo of the Town of Iqaluit (Source: Google Map, 2012) ....................... 97
Figure 4-10: Aerial Photo of the Town of Charlottetown (Source: Google Map, 2012) ......... 99
Figure 4-11: Alternative Community comparison. Source: (Expert Choice 2004) .............. 102
Figure 4-12: Weighted head to head Communities comparison. Source: (Expert Choice 2004)
................................................................................................................................................ 103
Figure 4-13: Communities detailed comparison. Source: (Expert Choice 2004) .................. 104
Figure 4-14: Weighted head to head comparison between Isle Madame and Iqaluit ............ 106
Figure 5-1: Action plan Organization chart Source: (New Brunswick Emergency Measures
Organization 2001) (Public Safety and Emergency Prepardness Canada 2011) ................... 111
Figure 5-2: Database homepage............................................................................................. 124
Figure 5-3: Database homepage- Issues ................................................................................ 125
Figure 5-4: Database homepage-Organizations ..................................................................... 126
Figure 5-5: Database homepage-responsibilities ................................................................... 127
Figure 5-6: Database homepage-criteria ................................................................................ 128
Figure 5-7: Database homepage-Action plan ........................................................................ 129
Figure 5-8: Database homepage-modifications ..................................................................... 130
Figure A.1: Detail AHP hierarchy model for the Scientific Method of Problem Solving
formulation…………………………….……………………………………………………149
Figure A.2: Main Criteria’s final scores………………………….…………………………150
Figure B.1: Data Grid output curves………………………………..………………………152
Figure D.1: International Protocols final AHP overall scores ……….…………………….157
Figure D.2: Synthesis with respect to: Goal…………………………………………….… 158
Figure D.3: Weighted head to head Protocols Comparison (ICLEI and Care)…………….158
Figure D.4: Weighted head to head Protocols Comparison (ICLEI and EU)………….…..159
M.Sc Systems Science Ilghelich Nadimi
Page | 9
Figure D.5: Weighted head to head Protocols Comparison (ICLEI and FCM)…………...159
Figure D.6: Weighted head to head Protocols Comparison (ICLEI and UNDP)…………..160
Figure D.7: Protocol’s comparison……………………………………………...………….161
Figure F.1: Communities final AHP overall scores……………………………..……...... 166
Figure F.2: Weighted head to head Communities Comparison (Isle Madame and
Gibsons)…………………………………………………………………………………..…167
Figure F.3: Weighted head to head Communities Comparison (Isle Madame and
Iqaluit)………………………………………………………………………………………168
Figure F.4: Weighted head to head Communities Comparison (Isle Madame and
Charlottetown)……………….……………………………………………………………..168
Figure F.5: Communities Comparison …………………..…………………………………169

M.Sc Systems Science Ilghelich Nadimi
Page | 10
1 Introduction
This document presents research in the Master’s Program in Systems Science of the
University of Ottawa, in the form of a thesis in partial fulfillment of M.Sc. degree in Systems
Science.
1.1 Background and Motivation
Global climate change has recently become one of the biggest concerns of world leaders. As
discussed in Bali (COP13, 2007) and Kyoto (COP3, 1997) (UNFCC, 1998), governments
under UN (United Nations) supervision agreed on developing a “road map” to secure the
world against future climate change (Carpenter 2008). The agreements in these conferences
provide direction to government to work more on protecting communities in their countries
against climate change through activities like developing local action plans. Events such as
the Boxing Day tsunami in Southeast Asia in 2004 and again in the Indian Ocean in 2006,
and the Great Sea of Japan earthquake and tsunami in March 2011 are just some of recent
examples among natural disasters happening all over the world. These events have cost
thousands of lives and caused enormous social and economic repercussions (Thompson
2011).
In this situation, adaptation is a required process to manage the society at the individual,
community, and country levels to develop resilience and capacity against the potential
ravages of climate change. The concept of adaptation is not new. People always adapt to
changes in their lives and the environment around them due to a variety of threats such as
global warming, sea-level rise, hurricanes, and tornados (Schiermeier 2011). Nevertheless,
policymakers require tools and adaptation protocols applied at the local level as a guide to
make decisions about their communities’ future adaptation plans utilizing available data and
forecasting methods. In a more specific view of the Canadian perspective, negative impacts
arising from recent severe storms such as Hurricane Gabrielle (2001), Hurricane Igor (2010),
and sea level rise, storm surge, and hot weather are felt at all levels of Canadian society.
M.Sc Systems Science Ilghelich Nadimi
Page | 11
These natural disasters have affected communities socially and economically (Dorland, Tol
and Palutikof 1999).
Under these evolving circumstances, developing community based adaptation frameworks
requires policymakers to make clear steps in line with the community’s specific priorities to
simplify implementation and make them more effective.
In recent years, Canadian communities have developed several strategies to reduce the
negative impacts of extreme climate changes effectively (Richardson 2010). It follows that
organizations in different parts of the world are developing plans for climate change
adaptation. These include groups such as ICLEI (Local Governments for Sustainability), and
Cooperative for Assistance and Relief Everywhere, Inc. (CARE), in order to help
communities play the essential role of planning, implementing, monitoring and evaluating
current action plans and improving the milestones for the application of general adaptation
plans.
1.2 Problem Definition
In the Natural Resources Canada 2004 adaptation report (Warren 2004), climate change
impacts have been identified in different regions of Canada. To reduce the negative impacts
of climate change and take advantage of new opportunities, Canadians must adapt themselves
to the evolving situation. Climate change adaptation provides new opportunities for
municipalities to prepare their communities against negative climate change impacts in the
future, and use it to reduce costs and damages resulting from the changing coastal climate.
Canadian communities are familiar with the concept of adaptation and are beginning to
recognize the impacts of climate change on their society. For example, communities have
been developing local action plans relevant to their community’s specific vulnerabilities. In
Alberta, for instance, provincial government support for the Municipal Climate Change
Action Plan (MCCAP) program has been assisting communities to develop local action plans
in all municipalities toward reducing Greenhouse Gas (GHG) emissions, improving recycling
and reuse, and increasing overall the level of community sustainability (MCCAC, 2009).
M.Sc Systems Science Ilghelich Nadimi
Page | 12
However, as a result of the changing natural environment and the increasing rate of climate
hazards, coastal communities in particular face new challenges that require specific strategy
development through understanding of their local and regional environmental changes and
vulnerability in the future (FCM 2009). Coastal communities in particular have to consider
factors’ in developing future strategies such as the nature of climate change in their area, the
considerations of climate sensitivity in their region, and society’s capacity to adapt to the
climate change.
Analyzing coastal communities in Canada with their wide range of different geographical,
ecological and economic distributions, shows that for each single community in different
parts of the country, the needs are to examine specific concerns and factors (Bruce et al.
2006).
1.3 Research questions and objectives
Based on the problem motivation and problem definition presented above, this research
addresses the following focused questions:
1. What are the common adaptation protocols in place globally and applied locally to
assist and direct communities to adapt to pending climate change?
2. How can community climate change adaptation protocols applied to coastal areas be
effectively evaluated?
3. What is an efficient and effective framework for coastal communities to adapt with
specific interest in the C-Change Canadian communities?
4. What are the community-based adaptation guidelines that can be identified for the C-
Change Canadian coastal communities toward the development of community Action
Plans?

M.Sc Systems Science Ilghelich Nadimi
Page | 13
In this study protocols are designed for managing community adaptation through the
combination of useful steps of current global protocols, and exhibited and evidence-based
best practices with applied emphasis to selected communities in Canada and the Caribbean
region.
To respond to the research questions, the following objectives are designed for this study:
1. Identify the suite of specific protocol and adaptation processes currently in place
through known international initiatives and local cases studies.
2. Define and apply the scientific method of problem solving as the multicriteria
framework to compare and evaluate adaptation processes for international initiatives.
3. Apply the adaptation framework to determine best practices and gaps for coastal
communities through current protocols, and communities’ vulnerabilities.
4. Detail the key components and guidelines of coastal communities’ climate change
action plans including identifying roles and responsibilities, and operational activities
of community members from best practices of evidenced-based examples.
1.4 Organization of thesis
The structure of this thesis document to follow is:
Chapter 2 – Literature review: review of different adaptation protocols, action plans, and
their applications are presented including identification of the strengths and weaknesses of
these processes.
Chapter 3 – Methodology: presentation of the adaptation evaluation procedure of the
protocols and case studies through the framework of the scientific method of problem solving
and identification of the multi-criteria structure for evaluating an ideal adaptation protocol to
assist the coastal communities.
M.Sc Systems Science Ilghelich Nadimi
Page | 14
Chapter 4 – Analysis and Results: this Chapter presents the results of the evaluation methods
applied to: (i) the suite of global adaptation protocols; and (ii) the C-Change selected coastal
communities in Canada and includes recognition of best practices and characteristics of
effective coastal community adaptation planning.
Chapter 5 – Community Action Plan and Guidelines: develops the plan for communities to
enhance community preparedness against climate change. This chapter discusses responsible
community organizations, and their duties and responsibilities, and household plans (72
hours) for the community, and presents the online action plan database demo for
communities.
Chapter 6 – The final Chapter provides considerations for future research, critical analysis
and limitations of the current research, and suggestions for further studies are highlighted.
The thesis also provides fully referenced documents in the detailed bibliography of the
relevant literature and for community-based adaptation planning, as well as a complete list of
appendices containing the complete evaluation data and results of the analyses.
M.Sc Systems Science Ilghelich Nadimi
Page | 15
2 Literature Review
This chapter presents and discusses the relevant published literature on adaptation protocols
and relevant case studies in Communities Adaptation Planning. Section 2.1 introduces the
global adaptation protocols, in which their specific processes are described and analyzed in
detail.
In Section 2.2, related case studies together with applied action plans and methods to cope
with climate change, as well as communities’ specific vulnerabilities as a result of
environmental issues are provided. Section 2.3 presents the literature related to the evaluation
framework based on the scientific method of problem solving. Finally, Section 2.4 discusses
methods for multi-criteria decision making and specifically, the Analytic Hierarchy Process
(AHP).
In summary, this chapter discusses:
2.1. Global Adaptation Protocols
2.2. Case studies in adaptation
2.3. Scientific methods of problem solving
2.4. Multicriteria decision making (AHP)
2.1 Global Adaptation Protocols
In this section we discuss the important global protocols currently being used by local
communities around the world, accompanied by a step-by-step analysis of each protocol in
order to discover their developmental processes. All the analysis performed in this section
will be in relation to the versatility of coastal communities’ needs and concerns, especially in
regard to Canadian communities’ vulnerability and climate impact. The global protocols
reviewed include: (1) ICLEI; (2) FCM-PCP; (3) CARE; (4) UNDP; (5) ECCP; and (6) C-
Change all defined in further detail below.

M.Sc Systems Science Ilghelich Nadimi
Page | 16
2.1.1 ICLEI - Local Governments for Sustainability
ICLEI, the “International Council for Local Environmental Initiatives” was founded in 1990
(ICLEI, 2008). ICLEI, in collaboration with national and regional local government
organizations, commits to support local government to run sustainable environmental
development. The Council was established when more than 200 local governments from 43
countries assembled at the World Congress of Local Governments for a Sustainable Future,
in the United Nations in New York in 1990 (Jackson, et al. 2008).
The aim of ICLEI is to provide technical consulting, training, and information services to
support local governments in the local implementation of sustainable development. The main
principle of ICLEI is that locally designed initiatives can provide an effective and cost-
efficient way to achieve sustainability objectives on local, national and international
scales. For reaching the goals of ICLEI, its Board developed a solid vision and mission for
the organization. ICLEI’s vision is to become:
“A growing association of local governments focused on sustainable development
with worldwide presence, which has challenging positions, whose voice is heard, and
which is attractive to be a member of, work for and partner with”;
“Be a powerful and flexible movement of local governments working together in
networks for performance, supported by campaigns and strategic alliances”;
“Be an effective sustainability and environmental agency demonstrating creativity
and excellence in developing advanced solutions and program design and execution”.
(ICLEI 2008)
Furthermore, ICLEI’s mission is to build and serve a worldwide movement of local
governments to achieve tangible improvement in global sustainability with a special focus on
environmental conditions through cumulative local actions (ICLEI 2008).
ICLEI assists communities to achieve their GHG reduction plan through implementing the
CCP’s (Cities for Climate Protection) five milestones, these five milestones present a method
M.Sc Systems Science Ilghelich Nadimi
Page | 17
for calculating GHG emissions, measuring and reporting emissions, and developing future
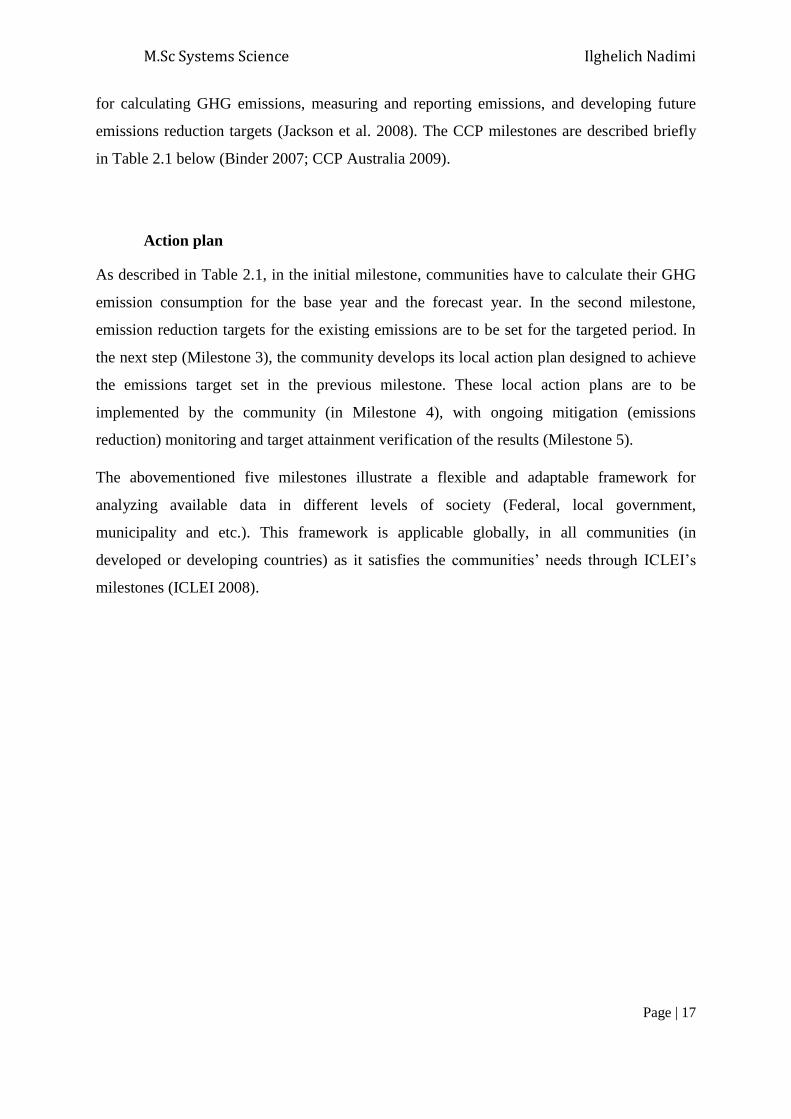
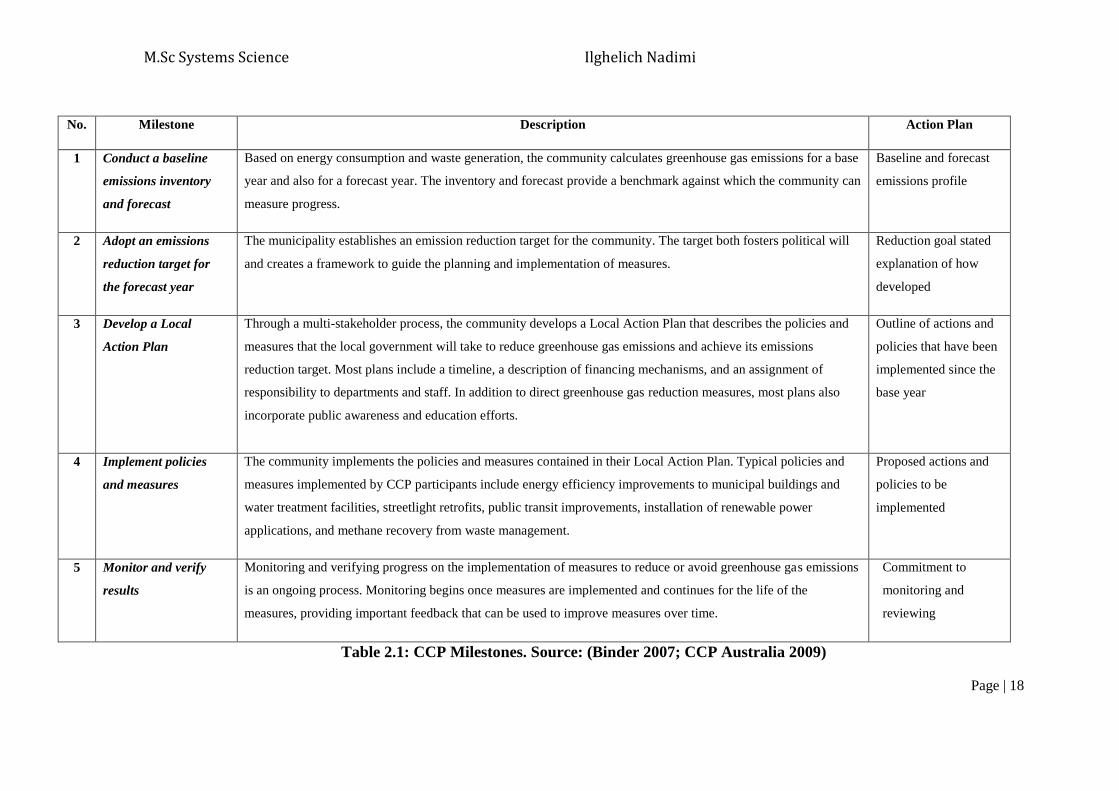
emissions reduction targets (Jackson et al. 2008). The CCP milestones are described briefly
in Table 2.1 below (Binder 2007; CCP Australia 2009).
Action plan
As described in Table 2.1, in the initial milestone, communities have to calculate their GHG
emission consumption for the base year and the forecast year. In the second milestone,
emission reduction targets for the existing emissions are to be set for the targeted period. In
the next step (Milestone 3), the community develops its local action plan designed to achieve
the emissions target set in the previous milestone. These local action plans are to be
implemented by the community (in Milestone 4), with ongoing mitigation (emissions
reduction) monitoring and target attainment verification of the results (Milestone 5).
The abovementioned five milestones illustrate a flexible and adaptable framework for
analyzing available data in different levels of society (Federal, local government,
municipality and etc.). This framework is applicable globally, in all communities (in
developed or developing countries) as it satisfies the communities’ needs through ICLEI’s
milestones (ICLEI 2008).
M.Sc Systems Science Ilghelich Nadimi
Page | 18
No. Milestone Description Action Plan
1 Conduct a baseline
emissions inventory
and forecast
Based on energy consumption and waste generation, the community calculates greenhouse gas emissions for a base
year and also for a forecast year. The inventory and forecast provide a benchmark against which the community can
measure progress.
Baseline and forecast
emissions profile
2 Adopt an emissions
reduction target for
the forecast year
The municipality establishes an emission reduction target for the community. The target both fosters political will
and creates a framework to guide the planning and implementation of measures.
Reduction goal stated
explanation of how
developed
3 Develop a Local
Action Plan
Through a multi-stakeholder process, the community develops a Local Action Plan that describes the policies and
measures that the local government will take to reduce greenhouse gas emissions and achieve its emissions
reduction target. Most plans include a timeline, a description of financing mechanisms, and an assignment of
responsibility to departments and staff. In addition to direct greenhouse gas reduction measures, most plans also
incorporate public awareness and education efforts.
Outline of actions and
policies that have been
implemented since the
base year
4 Implement policies
and measures
The community implements the policies and measures contained in their Local Action Plan. Typical policies and
measures implemented by CCP participants include energy efficiency improvements to municipal buildings and
water treatment facilities, streetlight retrofits, public transit improvements, installation of renewable power
applications, and methane recovery from waste management.
Proposed actions and
policies to be
implemented
5 Monitor and verify
results
Monitoring and verifying progress on the implementation of measures to reduce or avoid greenhouse gas emissions
is an ongoing process. Monitoring begins once measures are implemented and continues for the life of the
measures, providing important feedback that can be used to improve measures over time.
Commitment to
monitoring and
reviewing
Table 2.1: CCP Milestones. Source: (Binder 2007; CCP Australia 2009)
M.Sc Systems Science Ilghelich Nadimi
Page | 19
2.1.2 FCM-PCP
The Partners for Climate Protection (PCP) program is a network of Canadian municipal
governments which are committed to reducing greenhouse gases and taking actions towards
adapting to climate change (FCM 2009).
The PCP program is the Canadian component of ICLEI’s global CCP network, which
involves more than 900 communities around the world. PCP is in fact a partnership between
the Federation of Canadian Municipalities (FCM) and the ICLEI – Local Governments for
Sustainability.
PCP is based on the five milestone framework designed by the Cities for Climate Protection
(CCP) campaign described above which is used to guide municipalities to reduce greenhouse
gas emissions (FCM 2011). As mentioned above, these milestones have several benefits for
communities, which include saving cost through increasing energy efficiency, developing
local renewable energy sources, as well as creating new job opportunities through developing
new markets for renewable energy technologies.

M.Sc Systems Science Ilghelich Nadimi
Page | 20
To achieve these benefits PCP developed its own five milestones as follows:
No. Milestone Description Action plan
1 Creating a greenhouse gas
emissions inventory and forecast
A greenhouse gas inventory brings together data on community and municipal energy
use and solid waste generation in order to estimate greenhouse gas (GHG) emissions in a
given year. The forecast projects future emissions based on assumptions about
population, economic growth and fuel mix.
Start a community-wide composting
program, and launch an awareness
program on water conservation.
2 Setting an emissions reductions
target
An emissions reduction target is established. The target is normally set, following the
development of an emissions inventory and forecast or after the quantification of existing
emissions reduction measures.
Use financial incentives to help residents
reduce waste, and promote energy
efficiency in the industrial sector
3 Develop local action plan A Local Action Plan (LAP) is a strategic document that outlines how the municipality
will achieve its greenhouse gas (GHG) emissions reduction target. The LAP covers
municipal operations and the community. Municipal governments first develop and
implement a plan for municipal operations. In doing so, they demonstrate leadership and
provide a positive example for the community.
Create incentives for using public transit,
and Use bylaws and development approval
incentives to increase building standards
and land use mix
4 Implementing the local action
plan or a set of activities
The following items are key to the structure put in place for the implementation process:
Staffing and communications
Financing and budgeting
Project timeline
Stakeholder engagement
Support and encourage energy efficiency
initiatives in the residential and private
sectors, Develop and maintain
infrastructure friendly to pedestrians and
bicycles

M.Sc Systems Science Ilghelich Nadimi
Page | 21
5 Monitor the progress and report
the results
Monitoring the results of the actions planned for in Milestone 3 and implemented in
Milestone 4 determine whether:
Reduction measures are producing the anticipated results; and
Emissions reduction targets will be met.
If actions are not producing the anticipated results or targets will not be met, the data
collected provide information needed to evaluate and adjust activities.
Support community garden initiatives or
urban agriculture using surplus land or by
developing green roofs, Initiate commuter
challenges to reduce vehicle use
Table 2.2: FCM Milestones Source: (FCM, 2011)

M.Sc Systems Science Ilghelich Nadimi
Page | 22
Since FCM-PCP is the Canadian component of ICLEI’s CCP, FCM applied the CCP’s
milestones (1 through 5) for developing PCP’s milestones for reducing GHG emission in
Canadian communities.
Therefore, in the first step, the GHG emission inventory (household and corporate) is created
and forecast projections made together with profiling the community’s economic situation,
population, and fuel consumption. In the next step, the GHG emission reduction targets are
set, and are followed by developing a local community action plan. In Milestone 4, the
developed local action plan is implemented. During and after the implementation, the process
is monitored and results reported regularly for further analysis (FCM 2011).
2.1.3 CARE (Cooperative for Assistance and Relief Everywhere)
CARE is one of the world’s largest private international humanitarian organizations (CARE
International 2010). The main objective of CARE is to fight global poverty through helping
people in poor communities. CARE programs are designed to improve basic education,
prevent the spread of disease, increase access to clean water and sanitation, and protect
natural resources in poor communities around the world to help people rebuild their lives
(CARE International 2010).
In order to achieve the organization’s goals, a clear vision and mission are defined which give
CARE a unique guideline for developing future operating plans. The Vision of the
organization is:
“To seek a world of hope, tolerance and social justice, where poverty has
been overcome and people live in dignity and security. CARE International
will be a global force and a partner of choice within a worldwide movement
dedicated to ending poverty.” (Caldwell 2002)

M.Sc Systems Science Ilghelich Nadimi
Page | 23
CARE’s Mission is:
“To serve individuals and families in the poorest communities in the world,
and drawing strength from global diversity, resources and experience. They
promote innovative solutions and are advocates for global responsibility.”
(Caldwell 2002)
Along with their main objective of protecting the poor communities around the world, CARE
has developed a Community-Based Adaption plan (the CBA). The CBA presents a range of
main factors which should take place in different levels to run the adaptation plan effectively.
These factors are related to four inter-related strategies as follows:
1. Promotion of climate-resilient livelihood strategies; like diversification of
livelihoods, both within and outside of agriculture, and income generating
strategies (CARE International 2010)
2. Disaster risk reduction strategies to reduce the impact of hazards on vulnerable
households;
3. Capacity development for local civil society and governmental institutions; and
4. Advocacy and social mobilization to address the underlying causes of
vulnerability (CARE International 2010).
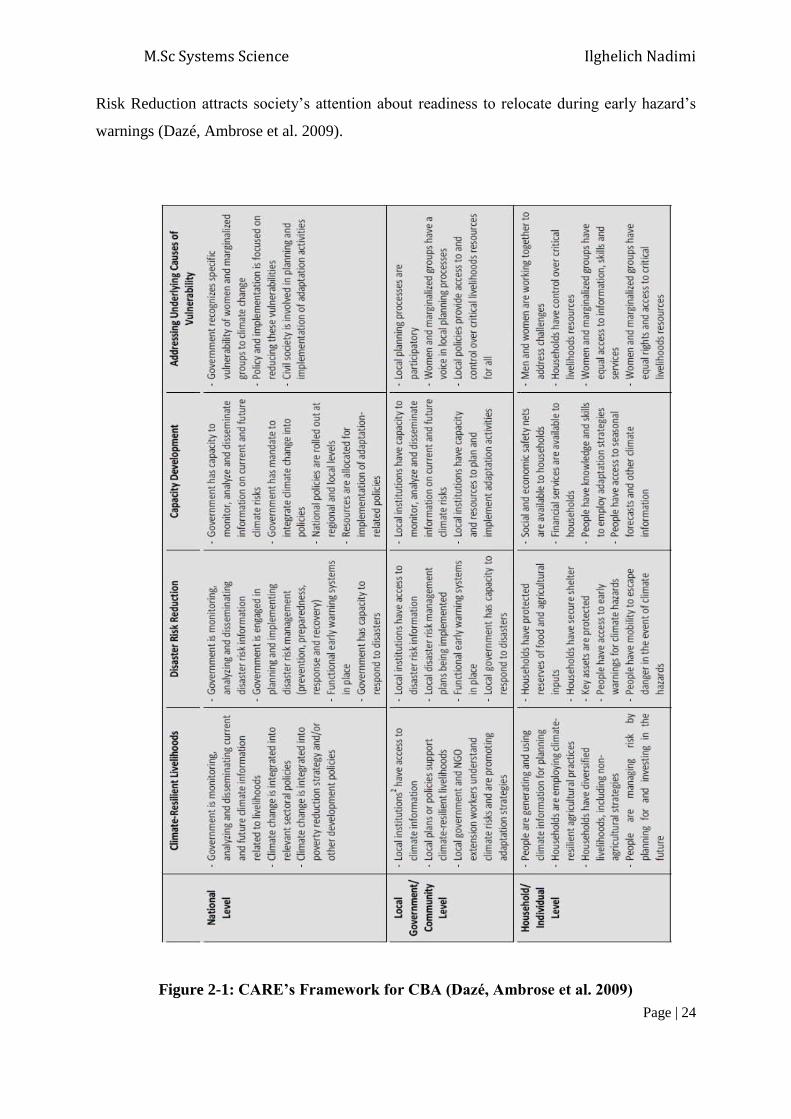
Since CARE’s objective is to develop frameworks to help communities in all different levels
(household, local, federal and international), CARE introduced the following framework
presented in Figure 2.1 (CARE International 2010). Unlike ICLEI and FCM which are
community-based, CARE’s adaptation process is more people-centered. The focus of the
CBA is mainly on monitoring and evaluating the adaptive capacity of target populations
rather than fixed factors and milestones for all projects (Caldwell 2002).
In order to cover the broader society, the CARE framework is developed in three different
levels of community namely: National, Local, and Household. In all three discussed levels of
the community, CARE’s main concentrations are: (i) Climate-Resilient Livelihoods; (ii)
Disaster Risk Reduction; (iii) Capacity Development; and (iv) Addressing Underlying Causes
of Vulnerability. As explained in Figure 2.1, responsibilities and issues related to each of
these factors are defined in all three levels. For instance, at the National level, Climate-
Resilient Livelihoods relate to governments’ responsibilities for analyzing and monitoring
current and future climate information (Caldwell 2002). At the Household level, Disaster
M.Sc Systems Science Ilghelich Nadimi
Page | 24
Risk Reduction attracts society’s attention about readiness to relocate during early hazard’s
warnings (Dazé, Ambrose et al. 2009).
Figure 2-1: CARE’s Framework for CBA (Dazé, Ambrose et al. 2009)
M.Sc Systems Science Ilghelich Nadimi
Page | 25
2.1.4 UNDP (United Nations Development Program)
The United Nations organization has developed a global network called “The United Nations
Development Program (UNDP)”, to support the changing and connecting community
development process in communities around the world with the aim of exchanging the
knowledge, experience and resources toward raising society’s quality of life (United Nations
Development Programme 2012).
Climate change adaptation is one of the UNDP’s missions to secure the organization’s goals
and to reduce climate change impacts. The UNDP developed its adaptation program through
principles similar to those for developing economic sustainability and livelihoods in the face
of climate change, especially in developing countries (United Nations Development
Programme 2012).
Since climate change adaptation is part of the mission of the UNDP, the organization has
developed an adaptation policy framework named “UNDP-GEF” (Global Environment
Facility) through the following four principles:
2 “Identify development priorities;
3 Determine current and future climate risks and projected impacts on development;
4 Identify and design adaptation opportunities; and
5 Implement and integrate climate change risks into ongoing processes and practices,
including monitoring and evaluation.” (UNDP-GEF 2012)
The Vision of the UNDP adaptation policy is defined as follows:
“Climate change requires us to “do development better”. Greater progress
is needed to develop national capacity to support cross-sectoral policy
processes as the foundation for sustainable adaptation in coming decades.
But better development is only part of the challenge – we must also “do
development differently”. To reduce climate change risks, systemic changes
to planning and practice are therefore crucial” (UNDP 2007).

M.Sc Systems Science Ilghelich Nadimi
Page | 26
In order to deliver its expertise and knowledge to local communities, the UNDP has
developed an Adaptation Policy Framework (APF) on behalf of the Global Environment
Facility (GEF). The APF connects the climate change issue to development sustainability and
environmental factors. The APF is developed around the following four main principals:
1. “Adaptation to short-term climate variability and extreme events serves as a
starting point for reducing vulnerability to longer-term climate change;
2. Adaptation policies and measures are assessed in a developmental context;
3. Adaptation occurs at different levels in society including the local level; and
4. Adaptation strategy and the process by which it is implemented are equally
important.” (UNDP-APF 2012)
The defined process of the APF can help communities develop their adaptation project and
action plans in all scales including the local and national levels (Droesch et al 2008). Table
2.3, presents the milestones, description and action plan components of the UNDP’s APF.
The APF (Adaptation Policy Framework) works as a link between climate change adaptation,
sustainable development and environmental issues. It is structured in the following steps of
Table 2.3.

M.Sc Systems Science Ilghelich Nadimi
Page | 27
No Milestone Description Action Plan
1 Scoping & Designing an
Adaptation Project
Clarify objectives and scope of the policy, plan, or project;
Establish a stakeholder process;
Review available information on vulnerability and adaptation;
Outline the policy, plan, or project
Promote tighter linkages from assessment, upstream policy
and institutional change activities to investment and financing
of solutions
2 Assessing Current
Vulnerability of
Development Objectives to
Climate
Assess current climate risks and impacts (relevant to the policy,
plan or project);
Establish current socio-economic conditions;
Assess current vulnerability of the relevant system;
Assess current adaptive capacity/adaptation;
Assess current policies related to climate risk and vulnerability
and policy needs.
Complement efforts at the national level by facilitating action
at the provincial, municipal and community levels.
Balance the emphasis placed on adaptation and mitigation
3
Assessing Future Climate
Change Risks to the
Development Objective
Identify relevant climate variables and assess trends
Assess socio-economic trends Assess trends in natural resources
and environment, including anthropogenic drivers of
environmental stresses;
Assess barriers to adaptation to climate risks and opportunities
for adaptation.
Diversify the funding sources that countries can access and
enable them to effectively combine and sequence the different
sources

M.Sc Systems Science Ilghelich Nadimi
Page | 28
4 Formulating an
Adaptation Strategy
Synthesize previous steps, studies and existing adaptation
options;
Identify policy, plan or project options for adaptation,
characterize costs, benefits, and barriers of each;
Prioritize and select policy, plan or project options for
adaptation; Formulate an adaptation strategy;
Broaden public-private partnerships with the private sector,
and engage new actors
5 Continuing the
Adaptation Process
through Monitoring and
Evaluation
Incorporate adaptation policies and measures into development
plans; Implement the adaptation strategy and institutionalize
follow-up; Review, monitor and evaluate effectiveness of
policies and measures;
Mainstream Climate Change into core development processes,
reaching out to non-environment sectors
Table 2.3: UNDP-APF Framework. Sources: (UNDP 2008; UNDP-APF 2012)
M.Sc Systems Science Ilghelich Nadimi
Page | 29
The UNDP’s APF framework is applied comparably to the other protocols discussed
previously (ICLEI, FCM, and CARE). The APF milestones start with designing the
adaptation project, in terms of the community and clearly defined stakeholders, participating
organizations, and all the needed information including the community’s vulnerabilities.
Therefore, when all the information has been provided, the APF implementation team can
work on current vulnerabilities and assess the situation (via a socio-economic analysis) in the
community and design initial objectives and frameworks (UNDP-APF 2012). Once the
status quo current situation has been analyzed, the implementation team analyses the future
expected risk and climate hazards in the community. Next, the team conducts an assessment
of the community’s natural resources, and the social and economical situation to find out
future opportunities and risks. After all these analyses have been carried out, and information
classified as current situation and future conditions, the expected adaptation framework is
formulated. The APF requires that the community prioritize the options and steps regarding
to the community’s needs and vulnerabilities, and develop related adaptation strategies. At
the project implementation stage, the final step is the monitoring and results validation
analysis for future implementations (UNDP-APF 2012).
As points are mentioned in the action plan column of Table 2.3, UNDP try to help
communities through involving new players (public and private organizations) in the
implementation part of the framework, because as much as different parts of the community
get involved in the project, more people feel responsibility for the results. Other benefits of
new partners’ involvement in the project are the financial aspects of the project. Since more
organizations involved in the project lead to additional funding sources so that the
community can achieve its targets faster.

M.Sc Systems Science Ilghelich Nadimi
Page | 30
2.1.5 EU Commission-ECCP (European Climate Change Program)
The European Commission launched the European Climate Change Program (ECCP) in June
2000 as part of EU’s strategic identification and development of implementing the Kyoto
Protocol (European Commission 2010).
The first phase of the project run during 2000 to 2004, and involved all stakeholders
including all EU departments, industry and environmental agency representatives, and all EU
members working and cooperating together (European Commission 2010). The EU continued
the second phase of the project (ECCP II) launching it in October 2005 with the GHG
emission reduction targets set for 2030.
These abovementioned projects ECCP I and II show how the EU plans to combat the
negative impacts of climate change. As a first objective, the European Commission seeks to
reduce greenhouse gas emissions as well as considering other options in the future phases of
the ECCP (EU-ECCP 2003). The initial steps considered by the EU Commission regarding
emissions reduction are to:
“Continually improving the energy efficiency of a wide array of equipment and
household appliances;
Mandating increased use of renewable energy sources, such as wind, solar, hydro
and biomass, and of renewable transport fuels, such as biofuels;
Supporting the development of carbon capture and storage (CCS) technologies to
trap and store CO2 emitted by power stations and other large installations;
Launching the European Climate Change Program (ECCP) in 2000, led to the
adoption of a wide range of new policies and measures, including the Emissions
Trading System, the EU's key tool for reducing greenhouse gas emissions from
industry cost-effectively.
Developing a comprehensive EU adaptation strategy that strengthens Europe's
resilience to climate change.” (EU-ECCP 2003)

M.Sc Systems Science Ilghelich Nadimi
Page | 31
The ECCP’s main objective is to control the global temperature increase and reduce GHG
emissions. In order to achieve this goal they developed the controlling milestones as follows:
“Monitoring the emissions of the six Kyoto greenhouse gases and removals by sinks,
Annual GHG inventory reporting to the European Commission
EC GHG inventory is the sum of GHG inventory of each of the 15 Member States(UK,
Austria, Sweden, Belgium, Finland, Luxemburg , Germany, Italy, Greece, Denmark,
France, Netherland, Spain, Portugal, Ireland)
Member States report their respective data to the UNFCCC(United Nations
Framework Convention on Climate Change)
Implementation and annual reporting of national programmes (including policies and
measures) and emission projections to the Commission and
Evaluation of progress and reporting to the European Parliament and Council by the
Commission.” (Müller and Jol 2012)
As part of the EU future plan for the ECCP’s implementation, all involved
organizations have to report annually and update their action plans continuously, so
they can update the general framework and develop a plan to achieve the EU targets
of the Kyoto Protocol into the future, and reduce the GHG emission in participant
countries (Müller and Jol 2012).

M.Sc Systems Science Ilghelich Nadimi
Page | 32
2.1.6 C-Change
C-Change is an International Community-University Research Alliance (ICURA) project
Managing Adaptation to Environmental Change in Coastal Communities conducted between
Canada and the Caribbean communities for the period 2009-2015. C-Change links
community members and university researchers from Canada with members of the Caribbean
community in support of research on coastal adaptation to environmental change, including
the impacts of the storm surge and sea-level rise on susceptible coastal communities
(International Community-University Research Alliance (ICURA) 2007).
The main mutual objectives of the ICURA between the community and the university are:
Identify the short and long term vulnerabilities for each coastal community due to sea
level rise, storm surge and severe storm events by developing and cataloguing risks.
Mobilize knowledge and innovation to reduce coastal community risks through
workshops, data and research collaboration within the Canada-Caribbean
communities and among the academic participants.
Build capacity through training of graduate and undergraduate students, and local
participants and decision-makers in the communities through workshops, seminars,
and local field work and reports to the community.
Develop impact scenarios, and prepare adaptation action plans in partnership with
the local community government, services, and community members. (International
Community-University Research Alliance (ICURA) 2007)
C-Change developed a research process to achieve its main objectives (as mentioned above).
This process is developed in 5 steps as follows:
1. Community Engagement - Canadian and Caribbean research teams establish local
C-Change Community-University Support Groups. The Support Groups mobilize community
engagement; gather information and local priorities, and assess community resources,
M.Sc Systems Science Ilghelich Nadimi
Page | 33
services, institutional and governance linkages. This information permits the locally-assisted
development of community profiles including environmental vulnerability indices for the
community as a function of the storm and impact scenarios.
2. Scenario development - Community spatial models are developed with the
assistance of the community to examine environmental impact (i.e., storm) scenarios
including integrated econometric and socioeconomic impact models from data projections for
community discussion and review.
3. Capacity building - Baseline indices are updated regularly over the course of the
project with changes to the value of the community vulnerability and adaptive capacity
indicators to reflect ongoing project activities and the recommended policy measures.
4. New governance option - C-Change community partners participate in
questionnaires and meetings toward providing indication of local priorities and issues. Local
community workshops provide training in “Managing Adaptation to Environmental Change”
including decision support aids, the use of the local vulnerability index, and adaptive capacity
indicators and build knowledge towards planning for change. Working documents from local
workshops will be prepared and disseminated through the project website to community
leaders, practitioners and policy makers and new local governance arrangements will be
proposed to further prioritize coastal environmental issues.
5. Practice implementation - Graduate students from the C-Change international
university network will work on specific project elements such as geomatics and information
management, web database development, multi-criteria decision making, policy evaluation,
risk management, and will be overseen by academic as well as community team members,
with opportunities to gain experience working towards the practical application of research
findings.

M.Sc Systems Science Ilghelich Nadimi
Page | 34
Figure 2-2: C-Change Research Process Map. Source: (International
Community-University Research Alliance (ICURA) 2007).
Figure 2.2 presents C-Change’s main strategies for achieving the abovementioned objectives
through: (1) Community engagement, (2) Scenario Development, (3) Capacity Building, (4)
New Governance options, and (5) Practical implementation. Strategy implementation in
partner communities is carried out through: Study area selection, development of Community
support groups, Community profiling and database development, Cumulative effects analysis
of environmental change, Alternative scenarios preparation, Adaptive capacity, Risk
Analysis, and preparation of a Strategic adaptation plan.
In order to implement these activities C-Change uses the following tools: SSM (Soft System
Methodology), SD (System Dynamic Modeling), GIS (Geographic Information systems), VI
(Vulnerability indices), and the AHP (Analytical Hierarchy Process) in support of local
governments needs for multicriteria decision making. AHP, as used in this thesis, is reviewed
in the last part of this chapter. Further information on the four C-Change Canadian
M.Sc Systems Science Ilghelich Nadimi
Page | 35
communities is provided in detail in Chapter 4 of this thesis. These four Canadian coastal
communities (Gibsons, B.C., Iqaluit, NT, Charlottetown, P.E.I., and Isle Madame, N.S.) are
presented there and reviewed with respect to the comparative analysis of their adaptation
processes.
Table 2.4 shows the summary of the discussed international protocols, with a brief discussion
about each protocol’s goals, objectives and action plans. Although each of these protocols is
working in different areas, and their main objectives are different than others, all of these
protocols are working similarly toward developing and implementing adaptation strategies
for pending climate change. Some of the protocols, e.g., CARE, focus on developing
communities, while others, e.g., UNDP, ICLEI, develop worldwide general frameworks for
adaptation to climate change. Consequently, comparing and combining these protocols’
adaptation frameworks and related experiences helps to understand and to develop a more
ideal adaptation framework for coastal communities as the objective of this research.

M.Sc Systems Science Ilghelich Nadimi
Page | 36
Protocol Description Goals and Objectives and Action Plans
ICLEI-CCP
International association of local
governments that made a commitment
to sustainable development
Build capacity, share knowledge, and support local government in the
implementation of sustainable development at the local level. Profile baseline and
forecast emissions. State GHG reduction goals and explanation of how to achieve.
Outline policies and implement local Action Plan highlighted by Commit to regular
monitoring and reviewing. This action plan developed in five steps: Incorporate
background information, and goals, Choose actions to achieve these goals, Identify staff
responsibilities for actions, Set priorities, timelines, and budget figures (where possible)
for actions, and establish a monitoring and review process and timeframe.
FCM-PCP
Network of Canadian municipal
governments that have committed to
reducing greenhouse gases and acting
on climate change
The Infrastructure Risk project’s goal is to help Canadian municipal governments
assess the vulnerability of their communities, specifically municipal infrastructure, to
current and potential future climate risks and natural hazards. Design and complete the
foundation work necessary to develop case studies. Part of this foundation work
includes facilitating interaction between municipal staff and researchers working on
science-based regional climate change projects. Present a summary of baseline
emissions forecasts and targets, a set of existing and proposed emissions reduction
actions, implementation strategies, including the resources involved; and input from
stakeholders.
CARE
One of the world’s largest private
international humanitarian
organizations fighting global poverty
through helping the people in poor
communities
In cooperation with its partners, CARE seeks to increase the skills, experience and
resources in communities to develop and implement CBA projects and in the same time
combine it into projects in climate-sensitive areas.
CARE contributes to the learning process about adaptation especially in developing
countries to educate the society about adaptation concepts.
CARE helps vulnerable communities against climate change hazards threaten their
communities, and educate people about the adaptation process.

M.Sc Systems Science Ilghelich Nadimi
Page | 37
Care address the Climate-Resilient Livelihoods, Disaster Risk Reduction, Capacity
Development, Addressing Underlying Causes of Vulnerability with contribution of
local partners (NGOs), and communities
UNDP Global development network based in
the United Nations to change and
connect countries to help people have
better lives through education and
transfer of experience and expertise,
and resources
UNDP programs identify development priorities, determine current and future climate
risks and projected impacts on development identify and design adaptation
opportunities, and implement and integrate climate change risks into ongoing
adaptation processes.
UNDP seeks to support the changing and connecting process in communities around
the world to exchange their knowledge, experience and resources toward raising
society’s quality of life. UNDP-APF promotes tighter linkages from assessment,
upstream policy and institutional change activities to investment and financing of
solutions, complements efforts at the national level by facilitating action at the
provincial, municipal and community levels, balances the emphasis placed on
adaptation and mitigation, diversifies the funding sources that countries can access and
enable them to effectively combine and sequence the different sources, broadens
public-private partnerships with the private sector, and engages new actors,
mainstreams Climate Change into core development processes, reaching out to non-
environment sectors

M.Sc Systems Science Ilghelich Nadimi
Page | 38
European Climate Change
Programme (ECCP I and II)
The European Commission launched
European Climate Change Program
(ECCP) at June 2000 as part of EU’s
strategic identification and
development of implementing Kyoto
Protocol.
ECCP’s main objectives are to: Improve the resilience of social and economical
systems as well as ecosystems across Europe and in other parts of the world, and
Reduce their vulnerability to the impacts of climate change.
ECCP seeks to develop a comprehensive EU adaptation strategy that strengthens
Europe's resilience to climate change. The strategy includes: Annual GHG inventory
reporting to the European Commission, Monitoring the emissions of the six Kyoto
greenhouse gases and removals by sinks, Implementation and annual reporting of
national programmes (including policies and measures) and emission projections to the
Commission, and Evaluation of progress and reporting to the European Parliament and
Council by the Commission
C-Change
International Community-University
Research Alliance (ICURA) project,
“Managing Adaptation to
Environmental Change in Coastal
Communities: Canada and the
Caribbean”
C-Change community and university objectives are to: Identify the short and long term
vulnerabilities, Mobilize knowledge and innovation, Build capacity Develop impact
scenarios, and Prepare adaptation Action plans.
The C-Change research process includes the steps of: Community Engagement,
Scenario development, Capacity building, New governance option, Practical
implementation.
Table 2.4: Summary of Adaptation Protocols description

M.Sc Systems Science Ilghelich Nadimi
Page | 39
2.2 Case studies
This section of the literature review provides a review of case studies that demonstrate how
different communities in different regions of Canada are addressing climate change
adaptation (National Round Table on the Environment and the Economy 2009). Each of the
Canadian communities’ case studies is designed to improve awareness of climate change
impacts through designing specific methods and action plans for the communities. The case
studies analyzed in this chapter reflect the actions taken in specific communities across
Canada, and as such, are relevant to different communities in different comparable regions in
Canada and abroad. These actions help these communities in the decision making process to
improve the community’s long term preparation level against climate change impacts and
reduce the future potential risk.
In the community case studies for Vancouver, Toronto, Halifax, Edmonton, Sudbury, and
Dawson Creek are all presented and described in detail in the Natural Resource Canada
publication “Adaptation to Climate Change – An Introduction for Canadian Municipalities”
by Richardson (2010). This publication was prepared as a source of local application of
Canadian examples of community adaptation. This publication is cited considerably in the
literature review as an excellent source for current adaptation practices of relevance to the
thesis.
Communities are applying the FCM protocol locally. Case studies illustrating these
community applications are described in detail in the Natural Resource Canada publication
Adaptation to Climate Change – An Introduction for Canadian Municipalities” (Richardson
2010).

M.Sc Systems Science Ilghelich Nadimi
Page | 40
Figure 2-3: Map of Canada, Source: (EmbassyWorld.com Inc 2012)
The locations of these cities are identified in Figure 2.3 Map of Canada, above.
2.2.1 Metro Vancouver Integrated Stormwater Management Plan (ISMP)
Metro Vancouver known as the Greater Vancouver Regional District (GVRD), is located on
the west coast of Canada (Figure 2.3), and comprises within its boundaries 24 member
municipalities including Richmond, Langley, and Surrey (Metro Vancouver 2010). Figure 2.4
presents an aerial view of the GVRD with indicated municipalities. For these municipalities,
one of the main climate related concerns is about how changes in stormwater runoff quality
and quantity impact the region’s many urban and rural salmon and trout streams. The
municipalities of Greater Vancouver in collaboration with provincial and federal
environmental agencies including Environment Canada, and Fisheries and Oceans Canada,
developed the Stormwater Interagency Liaison Group (SILG), and formed in 2002 the

M.Sc Systems Science Ilghelich Nadimi
Page | 41
Integrated Stormwater Management Plan (ISMP) under its provincially approved liquid
Waste Management Plan (Richardson 2010).
Figure 2-4: Aerial Photo of the Greater Vancouver Regional District (GVRD). (Source:
Google Map, 2012)
Through this co-ordination, they prepared a template in the ISMP for developing watershed-
specific, flexible and adaptive strategies for protecting communities from localized flooding,
and for integrating a wide range of water management issues, including watershed health,
land use planning, engineering, community values, and climate variability and change. For
developing and implementing the ISMP plan, the Metro Vancouver strategic group developed
seven steps as follows:
1. “Secure political interest and support.
2. Identify watershed problems and opportunities.
3. Develop objectives and alternative scenarios.
4. Collect meaningful data and refine scenarios.
5. Evaluate alternatives and develop component plans.
6. Develop an implementation program.
7. Refine the plan through adaptive management.” (Richardson 2010).

M.Sc Systems Science Ilghelich Nadimi
Page | 42
Many Metro Vancouver municipalities have translated the ISMPs into actions since 2001
under the Liquid Waste Management Plan (LWMP) (Metro Vancouver 2001). Under this
plan, municipalities are expected to apply the plan on all levels of their society until the 2014
deadline. For better understanding of the ISMP plan, SILG developed the Template for
Integrated Stormwater Management Plan (TISMP) in 2002, and updated it in 2005. In this
template, 35 different analyses and assessments were carried out including: data collection
and review; field assessments to supplement watershed knowledge, and identify values
developed to help the municipalities to implement their ISMP plan (Metro Vancouver 2012).
Among the strategies of the ISMP in Still Creek, they are developing a specific Hydraulic
model to assess their Hydraulic structure as well as to assess impacts of channel
implementation on flow conveyance. These actions take place under the following strategies
of the overall ISMP: (i) Develop and Implement Watershed-scale Rainwater Facilities and
(ii)Plans to Reduce Flooding and Flood Impacts within the Still Creek Corridor, and
(iii)Improve Integration of Drainage Infrastructure Management and Maintenance Practices
among Vancouver, Burnaby and the GVRD.
In conclusion, the ISMP provided the participant municipalities with the methods to develop
their local framework to increase their preparedness against environmental risk the their
water infrastructure systems in the future (Richardson 2010).
M.Sc Systems Science Ilghelich Nadimi
Page | 43
2.2.2 Toronto
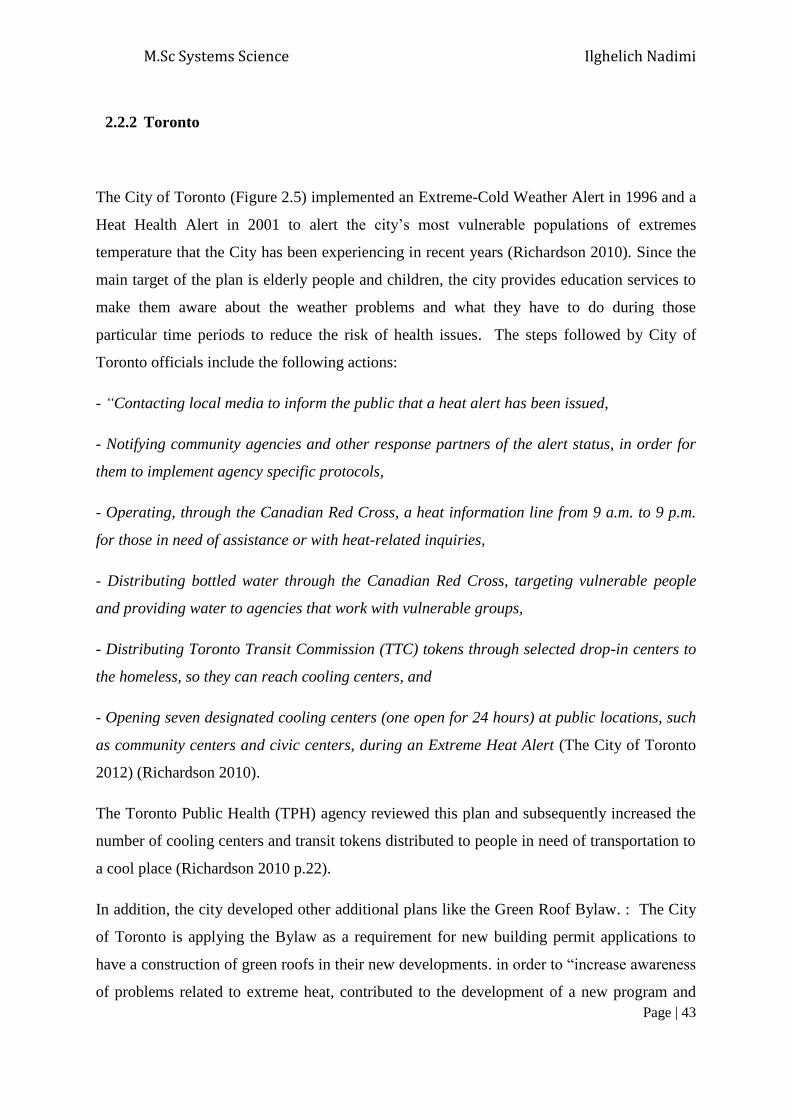
The City of Toronto (Figure 2.5) implemented an Extreme-Cold Weather Alert in 1996 and a
Heat Health Alert in 2001 to alert the city’s most vulnerable populations of extremes
temperature that the City has been experiencing in recent years (Richardson 2010). Since the
main target of the plan is elderly people and children, the city provides education services to
make them aware about the weather problems and what they have to do during those
particular time periods to reduce the risk of health issues. The steps followed by City of
Toronto officials include the following actions:
- “Contacting local media to inform the public that a heat alert has been issued,
- Notifying community agencies and other response partners of the alert status, in order for
them to implement agency specific protocols,
- Operating, through the Canadian Red Cross, a heat information line from 9 a.m. to 9 p.m.
for those in need of assistance or with heat-related inquiries,
- Distributing bottled water through the Canadian Red Cross, targeting vulnerable people
and providing water to agencies that work with vulnerable groups,
- Distributing Toronto Transit Commission (TTC) tokens through selected drop-in centers to
the homeless, so they can reach cooling centers, and
- Opening seven designated cooling centers (one open for 24 hours) at public locations, such
as community centers and civic centers, during an Extreme Heat Alert (The City of Toronto
2012) (Richardson 2010).
The Toronto Public Health (TPH) agency reviewed this plan and subsequently increased the
number of cooling centers and transit tokens distributed to people in need of transportation to
a cool place (Richardson 2010 p.22).
In addition, the city developed other additional plans like the Green Roof Bylaw. : The City
of Toronto is applying the Bylaw as a requirement for new building permit applications to
have a construction of green roofs in their new developments. in order to “increase awareness
of problems related to extreme heat, contributed to the development of a new program and

M.Sc Systems Science Ilghelich Nadimi
Page | 44
measures to combat the urban heat island effect, and helped facilitate the partnering of
various city departments” (The City of Toronto 2012) (Richardson 2010).
Figure 2-5: Aerial Photo of the Toronto (Source: Google Map, 2012)
Through this plan and participation of public organizations and NGO’s (like: Toronto police
services, Office of emergency management, and Street health), and the attention of the rest of
the society, the City of Toronto expect to reduce the numbers of victims of recurring hot
weather extremes during the summer in future years.
Lake of Ontario

M.Sc Systems Science Ilghelich Nadimi
Page | 45
2.2.3 Halifax ClimateSMART (Sustainable Mitigation and Adaptation Risk Toolkit)
In September 2003 and February 2004, the Halifax Regional Municipality (HRM) launched
ClimateSMART (Sustainable Mitigation & Adaptation Risk Toolkit) to help develop climate
change mitigation and adaptation into municipal planning and decision-making. The
objective of this Toolkit is to assist the municipality in dealing with its current problems
related to the rising sea level, and increased storm intensity with waves and storm surges
(Richardson 2010).
Figure 2-6: Aerial Photo of the Halifax Regional municipality
To achieve their objectives of the study of storm impacts on the HRM, scientists developed
water run-up scenarios. In doing so, the process to define these scenarios included milestones
as follows:
“Analyze historical sea-level rise

M.Sc Systems Science Ilghelich Nadimi
Page | 46
Document observed historical stormwater levels and impacts on coastal areas
Project future sea levels and stormwater levels in Halifax Harbour
Apply high-resolution mapping of possible future flood levels for planning
purposes.”(Richardson 2010)
In the first step of the Toolkit, scientists calculated the sea level rise and land rise in past
decades. Next, Halifax historical storm data were analyzed to find out the highest sea level
rise in the past 90 years, the frequency of storms, and the effects of land rising. Through all
these analyses, 3 storm scenarios were developed for upper, middle, and lower range for sea
level rise during the period of 2000-2100. In the lower range, Scenario 1, 16cm were forecast
from the community’s historical data, and 57cm were modeled as the upper level based on
the IPCC’s fourth assessment in 2007 (IPCC 2007). Finally, 1.3m was suggested from more
recent literature (Richardson 2010).
All the above mentioned scenarios were analyzed using GIS software to simulate the
situation out to 2100 based on each of the 3 seal level rise scenarios.
After this analysis, the HRM Council chose the Scenario 2C as the most likely scenario for
Halifax harbor. Figure 2.7 below presents a picture of the flood impacts to 2100 versus the
present day shoreline from the Scenario 2C sea level rise (Natural Resource Canada 2010).

M.Sc Systems Science Ilghelich Nadimi
Page | 47
Figure 2-7: Halifax Harbour Water Level Flood Impacts from Scenario 2C.
Community decision makers began plan implementation based on the Scenario 2C results.
The plan included the following steps to be carried out by the HRM:
“Further consultation with property owners and other stakeholders to obtain
feedback on options and strategies
Modeling exercise to accurately predict the impact of heavy wave action on harbour-
front properties
Development of a risk assessment database containing information on the
vulnerability of harbour-front properties

M.Sc Systems Science Ilghelich Nadimi
Page | 48
Creation of measures that could include minimum ground elevation for new
development, engineered solutions such as raising sea wall heights, and land use and
development regulations for flood-prone areas” (Richardson 2010).
By implementing this plan, council expects to reduce the effects of sea level rise in the next
100 years. The plan also calls for updating measurements by monitoring and assessing the
plan from time by time (Richardson 2010).
2.2.4 Edmonton
According to Natural Resource Canada book’s (Richardson 2010) report, the City of
Edmonton’s (Figure 2.8) one of the major challenge, is the scale and intensity of drought-
related tree deaths. Edmonton’s policy is to replace each and every fallen tree, but recently,
the City has been unable to keep up with the rate of the recent losses (600-900 tree deaths
annually).
Figure 2-8: Aerial Photo of Edmonton (Source: Google Map, 2012)
M.Sc Systems Science Ilghelich Nadimi
Page | 49
The changing climate threatens the health and viability of Edmonton’s urban trees through
the instances of: drought, insect infestations, disease and storms. It is estimated that if the
summer drought conditions continue year over year, the City will need to increase its
replanting efforts and reconsider which trees have to be replanted in order to reduce the
number of losses. The City’s other main consideration is the wave coming from the south of
invasive pests and diseases that are seizing mostly green ash and American elms (Richardson
2010).
These threats led the City to develop the first Urban Forest Management Plan (UFMP) in
2006. The Plan’s vision is “to have a diverse and sustainable urban forest that enhances the
beauty of Edmonton and contributes to the wellbeing and quality of life for future generation”
(Wheeler 2010).
The main objectives developed for this plan were:
“To provide Edmonton with a comprehensive plan for effectively managing,
sustaining and ensuring the growth of the City’s urban forest
To educate the general public, other city agencies, neighboring communities and
community partners about the importance of the urban forest, forestry issues and
management best practices; and
To protect native forest and tree stands in conjunction with the city’s Office of
Natural Areas, which is responsible for the natural areas and the Natural
Connections Strategic Plan.” (Wheeler 2010)
For capturing these objectives, the City developed strategies such as creating an inventory of
the urban forest, and at the same time developing a replacement strategy for trees lost,
reviewing existing planting strategies, as well as creating a fire and disaster management plan
and disease control plan for more preparation against future climate change affects
(Richardson 2010).

M.Sc Systems Science Ilghelich Nadimi
Page | 50
2.2.5 Sudbury
The Regional municipality of Sudbury is located in Northern Ontario (Figures 2.3 and 2.9)
(EmbassyWorld.com Inc 2012)(Google Map 2012), and includes seven separate
municipalities (Sudbury, Capreol, Nickel Centre, Onaping Falls, Rayside-Balfour, Valley
East, and Walden, (Wikipedia 2011) . In 1993, Sudbury was chosen as a one of 11 Ontario
municipalities to be studied to identify barriers and develop solutions to implementing energy
efficient activities for the Ontario municipal sector named as the Ontario Municipal Energy
Collaborative (OMEC). The project “Energy Management and CO2 Reduction” was
developed in Sudbury and coordinated by ICLEI (Eszes 2000), and sponsored by the Ontario
Ministry of Environment and Energy(Ontario Ministry of Environment and Energy 2012).
In 1995, the Region signed a partnership agreement with ICLEI to develop a strategic energy
plan in a payback period of seven years to decrease the municipality's energy usage and
reduce implementation cost in the energy sector. The objective was to use ICLEI's expertise
to increase their knowledge in environmental management (Eszes 2000).
Figure 2-9: Aerial Photo of Sudbury (Source: Google Map, 2012)

M.Sc Systems Science Ilghelich Nadimi
Page | 51
As part of the implementation of this project, the municipality engaged the public and the
private sector (Greater Sudbury 2012) including regional staff, councilors, provincial utilities,
local utilities, and external consultants to contribute to an auditing plan for existing energy
use, to measure potential energy and cost savings in the community, and to analyze the
economic and environmental benefit of this project (Eszes 2000). This project cost $6.4
million dollars in total, and by implementing the project, the Region expects to save $1.1
million in energy saving per annum, and a CO2 emission reduction of 28%. The annual
savings they expected will return the costs of the project in 5.8-years (Eszes 2000).
After finalizing the “Energy Management and CO2 Reduction” project in 1997 (Eszes 2000),
the Regional Municipality of Sudbury joined ICLEI’s Cities for Climate Protection
Campaign (CCP) to implement its plan within the context of the CCP campaign milestones
(Eszes 2000).
On the other hand, since 2003 the community has been developing the local action plan for
sustainability known as the “EarthCare Sudbury Action Plan” for increasing the resilience
and livability in the community and for controlling continuously the GHG emission and the
ecosystem’s overall health (Greater Sudbury 2010).

M.Sc Systems Science Ilghelich Nadimi
Page | 52
2.2.6 Dawson Creek
Dawson Creek is a city located in northeastern British Columbia. Dawson Creek has a
population of more than 11,000 people. The city is located in a strategic junction of several
railways and highways, and this strategic location is the main reason of the city’s economic
prosperity (FCM 2001).
Figure 2-10: Aerial Photo of Dawson Creek. (Source: Google Map, 2012)
Dawson Creek expects growth of 1,000 residents annually through to the year 2021 as a
consequence of its economic potential. And, through this additional population, the city
expects significant development in commercial and industrial sectors in the growing city. To
achieve the city’s expected future population growth goals; it had been applying its strategic
plan known as the Official Community Plan (OCP) and the Capital Workers Plan. Now the

M.Sc Systems Science Ilghelich Nadimi
Page | 53
City of Dawson Creek has developed a Comprehensive Environmental Development Plan
(CEDP) that provides an up-to-date long-term strategy to deliver municipal infrastructure
service in an efficient, cost-effective and environmentally responsible way (FCM 2001).
The first priority in this plan is water service improvement. Therefore the city is promoting
water conservation, managing stormwater flow, and reducing the environmental impacts of
wastewater.
This plan was developed in three steps. In the first step the city gathers data for completing
the supply and demand requirements to recognize the current used lands and the potential of
remained lands to meet the project's demand.
Next, the project team prepares the infrastructure report to analyze how water, sanitation,
sewer, storm drainage and roads could affect the project's annual growth demand. The third
step is to prepare a financial report, and to present the financial improvement strategies in an
environmentally responsible and cost-effective way (FCM 2001).
The result of the CEDP's implementation demonstrated that the existing wastewater system
was sufficient for forecasted growth, but it recommended stronger guidelines for new
subdivisions to minimize erosion, runoff, and environmental impacts of urban drainage (FCM
2001).
Table 2.5 shows the summary of the discussed communities, with a brief discussion about
each community’s issues, goals and objectives, processes, and actions. Although shows how
each of these communities in different area, dealing with their specific climate issues through
working on developing and implementing adaptation strategies for pending climate change
by using International protocols milestones (Table 2.4) or developing local action plans.
Consequently, comparing and combining these communities’ experiences helps to understand
and to develop a more ideal adaptation framework for coastal communities.

M.Sc Systems Science Ilghelich Nadimi
Page | 54
Community Issue Goals and Objectives Process Action
Metro Vancouver
NRCan, 2010
How changes in stormwater runoff
quantity and quality impact the region’s
many urban and rural salmon and trout
streams
Develop effective plans to protect
communities from flooding and
results in no net loss to
environmental quality
ISMP
Secure political interest and support, Identify
watershed problems and opportunities,
Develop objectives and alternative scenarios,
Collect meaningful data and refine scenarios,
Evaluate alternatives and develop component
plans, Develop an implementation program,
Refine the plan through adaptive management
Toronto
NRCan, 2010
Populations at risk from extreme heat
weather
Help public health agencies
identify heat stress conditions
that are likely to be harmful to
human health so they can
implement appropriate health
services.
Toronto Hot
Weather
Response Plan
Increase awareness of problem related to
extreme heat, contributed to the development
of new program and measures to combat the
urban heat island effect, and helped facilitate
the partnering of various city departments
Halifax
NRCan, 2010
Rising sea level, increased storm
intensity and associated waves and
storm surges
Help to mainstream climate
change mitigation and adaptation
into municipal planning and
decision making.
ClimateSMART
Further consultation with property owners and
other stakeholders to obtain feedback on
options and strategies, Modeling exercise to
accurately predict the impact of heavy wave
action on harbour-front properties,
Development of a risk assessment database
containing information on the vulnerability of

M.Sc Systems Science Ilghelich Nadimi
Page | 55
harbour-front properties, Creation of measures
that could include minimum ground elevation
for new development, engineered solutions
such as raising sea wall heights, and land use
and development regulations for flood-prone
areas
Edmonton
NRCan,2010
Urban tree threaten by recent drought,
insect infestations, disease and storms
Having a diverse and sustainable
urban forest that enhances the
beauty of Edmonton and
contributes to the well-being and
quality of life for future
generations
Provide a plan, effectively
managing, sustaining and
ensuring the growth of the City’s
urban forest, educate the general
public about the importance of
the urban forest, and forestry
issues, protect native forest and
tree stands in conjunction with
UFMP
To provide Edmonton with a
comprehensive plan for effectively
managing, sustaining and ensuring the
growth of the City’s urban forest
To educate the general public, other
city agencies, neighboring
communities and community partners
about the importance of the urban
forest, forestry issues and management
best practices
To protect native forest and tree stands
in conjunction with the city’s Office of
Natural Areas, which is responsible for

M.Sc Systems Science Ilghelich Nadimi
Page | 56
the city’s Office of Natural Areas the natural areas and the Natural
Connections Strategic Plan.
Sudbury
ICLEI, 1995
The cost of energy usage, increasing
level of CO2 emission
Reduce greenhouse gas emission
Energy Strategic
Plan
Saving energy cost and reduce CO2 emission,
and The municipality engaged the public
and the private sector, and external
consultants to contribute to an auditing
plan for existing energy use, to measure
potential energy and cost savings in the
community, and to analyze the economic
and environmental benefit of this project
Dawson Creek
FCM,2001
Community development plan for
designing community’s facility for
future growth
Provides a long-term strategy to
deliver municipal infrastructure
services in an efficient, cost-
effective and environmentally
responsible way
CEDP Gathering data for completing the supply
and demand requirements to recognize the
current used lands and the potential of
remained lands to meet project's demand,
the project team prepares the infrastructure
report to analyze how water, sanitation,
sewer, storm drainage and roads could

M.Sc Systems Science Ilghelich Nadimi
Page | 57
affect the project's annual growth demand,
to prepare a financial report, and to present
the financial improvement strategies in an
environmentally responsible and cost-
effective way
Table 2.5: Case Studies Summary

M.Sc Systems Science Ilghelich Nadimi
Page | 58
2.3 The Scientific Method of Problem Solving
Management science is the method designed to help solve management problems
scientifically. Management science is very wide in scope so that the developed techniques
can be used in different fields of business, e.g., economics, finance, marketing, accounting,
etc., to satisfy similar kinds of problem solving needs, such as improving the process and
efficiency of organizations as well as increasing the success rate of implementation.
The problem solving approach is the logical and scientifically-based approach of
management science to solve management related problems and help to make better
decisions. This method has become known as the “scientific method of problem solving”
(Taylor 2001).
As shown in the Figure 2.11, this method is generally developed in five steps as follow:
(1) Observation
(2) Problem definition
(3) Model construction
(4) Solution, and
(5) Implementation
The scientific method of problem solving is explained briefly, and then AHP, the Analytical
Hierarchy Process, a tool to implement a specific scientific-based method of problem solving
with respect to multicriteria decision problems is discussed in more detail below and with
specific reference to this research.
In this study for designing an ideal protocol for the coastal communities’ adaptation
frameworks, existing protocols are reviewed and the experience, effectiveness, and results of
these approaches relative to management science and problem solving are examined. To this
end, the scientific method of problem solving is presented as the evaluative framework in
which to evaluate adaptive frameworks for problem solving. The steps of the scientific
method of problem solving are used as specified in the figure below (Taylor 2001).

M.Sc Systems Science Ilghelich Nadimi
Page | 59
The approach starts with observation, and it continues with problem definition and model
construction, which leads to the production of model solutions. The approach is finalized
with implementation of the solution results and monitoring and review of the ongoing
impacts.
Figure 2-11: The Management Science Process (Taylor 2001)
As shown in Figure 2.11, the hierarchy for the scientific method of problem solving is broken
down into 5 main steps, as explained below.
M.Sc Systems Science Ilghelich Nadimi
Page | 60
1) Observation. This is the initial step of the scientific method of problem solving hierarchy
(Taylor 2001). The main concern is the identification of the problem in the system through
observing the system. Therefore problems could be identified as soon as the occur in the
system.
2) Problem definition. The step after identification of the problem is problem definition.
Since the previous steps shows the problem exists, team has to take action to define the
problem clearly. This step demonstrates how clear definition of problem leads the
organization to resolve the problem as soon as it occurs again in the future.
3) Model construction. The third step in the scientific method of problem solving is the
construction of a mathematical model; this model will be notion of organizations current
problem.
4) Solution. The fourth step is developing the solution. In this step the defined problem in
step (2) is solved through the model developed in step (3).
5) Implementation. The final step and criterion is the implementation of the recommended
solution to the defined problem. This is the developed model, or the solution for the existing
problem.

M.Sc Systems Science Ilghelich Nadimi
Page | 61
2.4 The Analytic hierarchy process (AHP)
Multiple criteria decision making (MCDM) is developed to help decision makers
make decisions in complex, multiple objective problem situations. In these problems, a
number of alternatives are evaluated with respect to multiple criteria to find a preferred
ranking of the alternatives. There are several methods available for solving MCDM problems
including: simple scoring methods, ideal point approaches, and structural problem
hierarchical methods (Lane 2010). In this study, AHP is selected as an effective MCDM
procedure to apply in the case due to its ease of use and understanding as well as its ability to
combine subjective and objective measures without concern for scaling problems (Zeleny
1998, Xu 2001).
The Analytic hierarchy process (AHP) is a multicriteria decision making (MCDM) support
method for analyzing problems that may be described by quantitative and qualitative
measures. AHP is used as a decision making tool to solve unstructured problems since 1977,
and make supportive decisions that involve complicated and conflicting multiple criteria
(Saaty 1980).
As part of the decision making process, AHP assists decision makers in analyzing complex
problems in the form of a simple structured hierarchy format enabling decomposition of the
problem into a plain hierarchical structure (Lane 2007). AHP’s approach gives weights to the
multicriteria factors that then enables evaluation of decision options that contribute
differently to these criteria (Saaty 1980).
As shown in Table 2.6, AHP’s capability of qualitative analysis exposed by the following
five components, namely: possible epithets of equal, Somewhat more, Much more, Very
much more, and Absolutely more important (Lee, Yoon et al. 2007).

M.Sc Systems Science Ilghelich Nadimi
Page | 62
Figure 2-12: Structure of hierarchical Structure of AHP model, Source: (Lee, Yoon et
al. 2007)
The AHP defines four steps for its process method as:
1. “Decomposition - In the first level, the objective and goals of the project are
placed in a hierarchical structure. Main criteria and sub-criteria are placed in the
second and in the third levels of the hierarchy, respectively (as shown in Figure
2.12). This structure allows for additional measurable sub-categories of indicators
to be created as needed.
2. Prioritizing - In this step decision makers provide a pairwise comparison on a
Likert scale between criteria in each level (Table 2.6).
3. Synthesis – The decision maker weights each criterion in each level based on the
pairwise comparison analysis done in the previous step.
4. Sensitivity analysis – In this step, decision makers make an overall assessment
among different alternatives based on gathered criteria through the given weights
established in previous steps.” (Lee, Yoon et al. 2007)

M.Sc Systems Science Ilghelich Nadimi
Page | 63
Intensity of Importance Definition Explanation
1 Equal importance Two factors contribute equally to the objective
3 Somewhat more important Experience and judgment slightly favor one over the other.
5 Much more important Experience and judgment strongly favor one over the other.
7 Very much more important Experience and judgment very strongly favor one over the
other. Its importance is demonstrated in practice.
9 Absolutely more important The evidence favoring one over the other is of the highest
possible validity.
2,4,6,8 Intermediate values When compromise is needed
Table 2.6: Saaty’s AHP Rating Scale. Source: (Lee, Yoon et al. 2007)
For example, in the case of 3-criteria comparisons there are 3 pairwise comparisons to
review. These are captured in the relative scale values, , where i is not equal to j, and
i,j=1,2,3.
The resulting 3x3 matrix (see below) has a characteristic eigenvector that is determined and
scaled to 1 so that the resulting elements of the vectors are considered as the weights of
importance of each criterion (Saaty 1980).
Across the levels of the hierarchy the overall weight for each alternative k is
determined by the score of each alternative, with respect to the criteria, i by multiplying
the respective criterion weight, , i=1,2,3, and , k=1,2,…,n where n is the number of
alternatives. Then:

M.Sc Systems Science Ilghelich Nadimi
Page | 64
=
where Alternative overall scores, are scaled to obtain the overall alternative relative
ranking.
In conclusion, AHP helps decision makers to understand their ranking of available
alternatives with respect to each alternative’s contribution to the multiple criteria and their
relative importance to the decision maker (Lane 2007).
2.5 Summary of literature review
In this chapter, the international protocols in the area of community adaptation frameworks to
climate change such as those that developed by ICLEI, FCM, UNDP, ECCP, and C-Change
are analyzed, and their milestones and steps are presented. Case studies of selected Canadian
communities, their climate related issues, and vulnerabilities as well as their local action
planning targeting adaption of the communities to changing climate are analyzed.
The scientific method of problem solving is defined, and the usage of problem solving steps
is presented and discussed. The AHP model is introduced as a tool to deal explicitly with
multicriteria problems and the provision of decision support, as needed in this research on
adaptation frameworks for coastal communities.
In the next chapter, the Methodology used in this study is presented and the modeling and
research process established through using the background literature will present. The criteria
taken from the protocols will be compared pairwise by applying the AHP’s Expert Choice
software, and the highest ranked protocols chosen in order to fulfill this study’s objective of
developing an ideal protocol for adaptation frameworks applied to coastal communities.

M.Sc Systems Science Ilghelich Nadimi
Page | 65
3 Methodology
This chapter presents the research methods used in this thesis. These methods are based in
part on the analysis of the literature discussed in the previous chapter as adapted for the
current research.
The aim of the research methods is to develop procedures to discover a “best practices”
framework using the scientific method of problem solving in order to assist coastal
communities to develop and implement their own efficient adaptation plans for the
management of their changing coastal environments. The framework provided in this chapter
explains the basis and process of analyses done in order to meet the final research objectives.
Specifically, this chapter explains the research process for the assessment of the international
adaptation protocols as discussed in Chapter 2, and the application of AHP for ranking the
protocols with respect to the scientific method of problem solving. The chapter also describes
the method of research analysis of the Canadian C-Change communities also applying the
steps of the scientific method through AHP.
In the following, subsection 3.1 presents the phases of the research process. Subsection 3.2
details the criteria and subcriteria of the scientific method of problem solving, and
subsections 3.3 to 3.5 present the details of the Phases 1 to 3 of the research process.
Subsection 3.6 provides a summary of the research methods.
3.1 Research Process
Three phases are defined for the application of the methodology process. These phases are:
Phase1. Evaluation of International adaptation protocols (as presented in Chapter 2) through
using AHP formulated with a hierarchy, defined by the scientific method of problem solving.
This phase includes ranking and comparison of the application of the scientific method of
problem solving to the adaptation protocols, and identification of best practices.

M.Sc Systems Science Ilghelich Nadimi
Page | 66
Phase2. Application of the scientific method of problem solving to the C-Change
communities through the evaluation of the scientific method of problem solving via the AHP
model defined in Phase 1. This phase involves ranking and comparison of results among the
Canadian C-Change communities and the identification of best practices among
communities. It also includes a “gap analysis” of the communities and critiques of C-Change
communities’ work to date.
Phase 3. Development of Community Guidelines for adaptation. This phase identifies the
roles and responsibilities of community members in the event of an environmental threat to
the community as well as the determination of Community Action plans for the preparation
of community groups.
These ordered phases apply the research methods at each step in the process. The following
sections present the research methods:
Defining the scientific method of problem solving as well as defining and describing
the specific steps of the scientific method of problem solving.
Formulating the AHP multicriteria decision support model based on the steps and
understanding of the scientific method of problem solving, and developing the AHP
model using the Expert Choice Software.
Evaluating the performance and sensitivity of the international protocols and the
communities for comparison and contrast as a means of identifying “best practices” in
adaptation framework and problem solving.
3.2 Scientific Method of Problem Solving
As discussed in Chapter 2, the scientific method of problem solving is used to identify
defined research problems in this study. The scientific method of problem solving hierarchy,
presented by Taylor (Taylor 2001, Figure 2.11), is applied to develop this study’s framework
as the approach of this research problem is to evaluate alternative approaches to manage
adaptation as defined in Chapter 1.
M.Sc Systems Science Ilghelich Nadimi
Page | 67
As shown in Figure 3.1 below, the hierarchy for the scientific method of problem solving is
broken down into 5 main steps, as explained below.
1) Problem Identification. This initial step of the scientific method is defined as a top-level
criterion of the multi-criteria problem formulation of the AHP hierarchy. This criterion
contains four relevant variables that are defined as sub-criteria. The following sub-criteria for
this criterion are developed and applied to the AHP hierarchical formulation: (1.1) Problem
Definition, (1.2) Affected Clients, (1.3) Declaration of Objectives, and (1.4) Constraining
Factors.
2) Data. This step identifies the second top-level criterion and the relevant factors defined for
it. These factors are: (2.1) Availability, (2.2) Measurability, (2.3) Cost and Issue, (2.4) Data
Management and (2.5) Profiling Risk/Priorities. This criterion demonstrates how required
information in the community is available and how these available data are measurable. If the
reliable data were not available, then this criterion determines how much it would cost to find
and process relevant data in the project. Other issues related to data are managing the data in
the community, for example, updating data in specific time periods and prioritizing the data
systematically. This step demonstrates how we could find relevant data in each step of the
project accurately.
3) Model building for problem solving. The third step in the scientific method of problem
solving is the construction of a mathematical model. As a criterion in the AHP hierarchy,
model building has four subordinate factors defined as: (3.1) Static/Dynamic Modeling, (3.2)
Relevance of Model Objective(s), (3.3) Model Communication and (3.4)
Deterministic/Probabilistic Modeling. The objective of defining these factors is to show that
the analysis done in modeling develops a model designed to meet the project’s main
objectives.
4) Testing/Sensitivity/Validity. The fourth step is model testing and validation. The factors for
this criterion are: (4.1) Analysis in Place, (4.2) Robustness and (4.3) Feedback for
Adjustment. This process requires us to analyze the data in each step and update the system
with feedback on the robustness of each phase.
5) Monitoring and Control. The fifth step in the scientific method is the ongoing monitoring
and control of the recommended problem resolutions. This criterion has the following

M.Sc Systems Science Ilghelich Nadimi
Page | 68
factors: (5.1) Advantage and Ongoing Verification of Objectives, (4.2) Switching
Capabilities of Objectives, and (4.3) the Control Process. In this step the system has to be
monitored and updated to control the process to make sure implementation and the results of
actual indicators of the system parallel the defined objectives.
6) Implementation. The final step and criterion is the implementation of the recommended
solution to the defined problem. For this criterion, two sub-criteria of the model are defined:
(6.1) Evidence of Results, and (6.2) Guideline of Decision Method for Preparedness.
Figure 3-1: Steps of the Scientific Method of Problem Solving based on Figure 2.11
(Taylor 2001)
In the following, the framework of Figure 3.1 is developed into the applied hierarchy in AHP
and implemented into the Expert Choice Software (Expert Choice 2004).
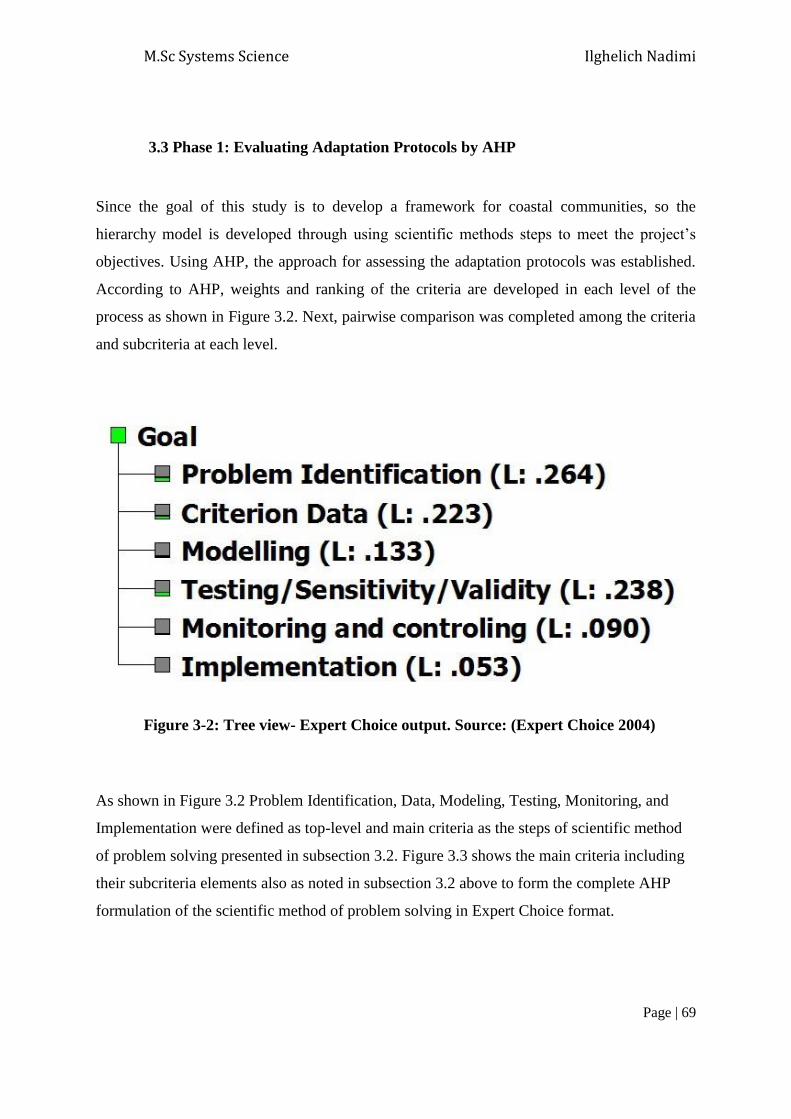
M.Sc Systems Science Ilghelich Nadimi
Page | 69
3.3 Phase 1: Evaluating Adaptation Protocols by AHP
Since the goal of this study is to develop a framework for coastal communities, so the
hierarchy model is developed through using scientific methods steps to meet the project’s
objectives. Using AHP, the approach for assessing the adaptation protocols was established.
According to AHP, weights and ranking of the criteria are developed in each level of the
process as shown in Figure 3.2. Next, pairwise comparison was completed among the criteria
and subcriteria at each level.
Figure 3-2: Tree view- Expert Choice output. Source: (Expert Choice 2004)
As shown in Figure 3.2 Problem Identification, Data, Modeling, Testing, Monitoring, and
Implementation were defined as top-level and main criteria as the steps of scientific method
of problem solving presented in subsection 3.2. Figure 3.3 shows the main criteria including
their subcriteria elements also as noted in subsection 3.2 above to form the complete AHP
formulation of the scientific method of problem solving in Expert Choice format.

M.Sc Systems Science Ilghelich Nadimi
Page | 70
Figure 3-3: Detail AHP hierarchy model for the Scientific Method of Problem Solving
formulation. Source: (Expert Choice 2004)

M.Sc Systems Science Ilghelich Nadimi
Page | 71
All top level criteria and the sub-criteria levels were evaluated by pairwise comparison by
following Saaty’s nine point scales (as shown above in Table 2.6). These evaluations were
made independent of the problem alternatives (to follow) and provide the basis for evaluating
these alternatives (protocols and communities) and their own valuations.
The pairwise comparison values for the top level criteria and within lower level subcriteria
were determined by the researcher based on the literature related to the scientific method, and
the relative importance applied to the steps of the process. The results and defense of these
pairwise comparisons are discussed in Chapter 4.
The AHP method, through the use of the Expert Choice software provides relative weights
for each criteria and sub-Criteria. The assignment of the pairwise comparison value was
applied while maintaining the consistency level under 0.1 for each criterion comparison in
each level.
It is noted that the Figure 3.3 hierarchy is applied to both Phase 1 (international adaptation
protocols), and Phase 2 (C-Change community comparison).
3.4 Phase 2: Application of scientific methods to C-Change communities
In Phase 1, the developed hierarchical framework (Figure 3.3) is used for comparing the
analyzed international protocols (Chapter 2). Therefore the same steps and milestones of the
evaluation of the international protocols are applied in the scientific method steps as
developed in AHP. Weights are assigned for each criterion in comparison to other criterion in
the same level as well as in relation with the higher level criteria. The final feedback from
this application develops the final framework for applying best practices.
After all these analyses have been applied for the international protocols, the final framework
is applied in Canadian C-Change communities (Isle Madame, Gibsons, Iqaluit, and
Charlottetown) to discover how problem solving in the communities are ranked and
compared. Therefore, in this part, communities will be analyzed and criteria will be weighted
and compared regarding to communities’ specific situation and needs. Through the result of
this analysis, the researcher can determine how to assist the community developing its local

M.Sc Systems Science Ilghelich Nadimi
Page | 72
action plan and guideline. Through this analysis of the applied protocols in Canadian
communities, selecting the preferred elements of the adaptation framework is developed.
3.5 Phase 3: Development of Community Guidelines for adaptation
Through the analysis done in Phase 2, guidelines are developing for the C-Change coastal
communities. These guidelines define the roles and responsibilities of the key community
leaders involved at all levels, including the governments (federal, provincial, local
government, and municipality), and households. The Municipality’s responsibilities and all
other participant organizations duties are generally discussed, then households’ emergency
kits assessed. Consequently, the Community Action Plan is developed for all community
members through information provided in this guideline. This Action Plan covers and
manages the activities taking place in the community during storms, hazards or other natural
events when the community is called upon to implement a preparedness plan.

M.Sc Systems Science Ilghelich Nadimi
Page | 73
3.6 Summary of the Chapter
In this chapter, the application of the scientific method of problem solving and its break down
as a multicriteria hierarchical problem is presented. The AHP formulation using Expert
Choice is explained.
The phases of the research process are provided. In Phase 1, the International protocols are
analyzed and their specific elements compared through the AHP problem solving formulation
of the scientific method of problem solving. In Phase 2, the best practices application among
Canadian C-Change communities is developed. And finally, in Phase 3, the Community
Action Plans guidelines are developed.
In next chapter, the results of the research process are presented. The AHP Expert Choice
software is applied to identify best practices from the ranked protocols and the coastal
communities.
M.Sc Systems Science Ilghelich Nadimi
Page | 74
4 Analysis and Results
This chapter presents the applied analysis and results of the research methods and process
presented in Chapter 3. This chapter includes the following sections:
4.1) preparation of the AHP formulation of the scientific method of problem solving
by developing the pairwise comparisons of the importance of the method for
adaptation frameworks thereby establishing the weighted hierarchy for general
application of the formulation
4.2) evaluation and comparison of the applied scientific method of problem solving of
the International protocols for managing adaptation through the application of the
AHP model for Multi-Criteria decision making by applying the Expert Choice
software (Expert Choice 2004) (Phase 1 analysis)
4.3) identification of ‘best practices’ among the International protocols for managing
adaptation result from the sensitivity analysis of the AHP model (Phase 1 results) ;
4.4) evaluation and comparison of the applied scientific method of problem solving of
the C-Change Canada communities for managing adaptation through the
application of the AHP model (Phase 2 analysis); and
4.5) Gap analysis of the ranked C-Change Canada communities including lessons
applied from the best practices of the International protocols for managing
adaptation resulting from the sensitivity analysis of the AHP model (Phase 2
results).
Lastly, the results of these analyses are provided as an aid to the determination of contents for
the community adaptation action plans and guidelines (Phase 3). These guidelines, presented
in Chapter 5, are the consequence of the action plans, best practices, and observations about
the international adaptation protocols, as applied to the C-Change Canada communities. As
such, the guidelines presented in Chapter 5 provide the recommended template for applied
adaptation planning and implementation for the C-Change Canada communities based on the
construction of the scientific method of problem solving and its expected implementation in
practice.
M.Sc Systems Science Ilghelich Nadimi
Page | 75
In this chapter, the AHP Expert Choice software is used as a decision making support tool to
rank alternatives in a multicriteria setting and to determine best practices in adaptation
planning and action. The results of this structured comparison of international protocols
permits prioritization of the specific criteria that are required and are most effective in
practice toward satisfying the adaptation needs of coastal communities such as the C-Change
ICURA project communities in Canada.
4.1 Preparation of the AHP Weighted Hierarchy
This section presents the pairwise comparison estimates for the general scientific method of
problem solving problem as formulated in section 3.3 and Figure 3.3. The weighted hierarchy
of Figure 3.3 is determined by comparing: (i) each two criterion in a pairwise manner; and
(ii) each two subcriteria also in a pairwise mode as discussed in sections 2.4 and 3.3 above.
The following Tables 4.1 to 4.7 provide the hierarchy pairwise comparison information that
is used in this thesis to define the weighted hierarchy for the scientific method of problem
solving problem formulation.
Table 4.1, shows the values were assigned between each pair of the first level criteria in
pairwise comparison. As shown in the table, there are noted differences between the
Modeling and the Testing criteria, and Testing is set as being more important than Modeling
in terms of Saaty’s 1-9 Likert scale (Table 2.6). As discussed in Taylor’s management
science process in Figure 3.1, the Modeling exercise is carried out prior to Testing or model
validity and model parameter sensitivity analysis take place. The purpose of Testing is to
analyze model issues and difficulties as well as address these by adjusting the model
accordingly to make necessary corrections. This troubleshooting stage helps to improve the
developed model. Therefore in the analysis of Table 4.1, the Testing/Sensitivity/Validity
criterion is given more relative importance with a score of +4 relative to the Modeling
criterion score due to the importance of the Testing, Sensitivity and Validity analysis of the
model.
In another case, as shown in the Table 4.1, Modeling received a higher score of +4 in
comparison to the Implementation criterion. Higher score assign for modeling compare to
implementation because in general for any project successful model must construct for
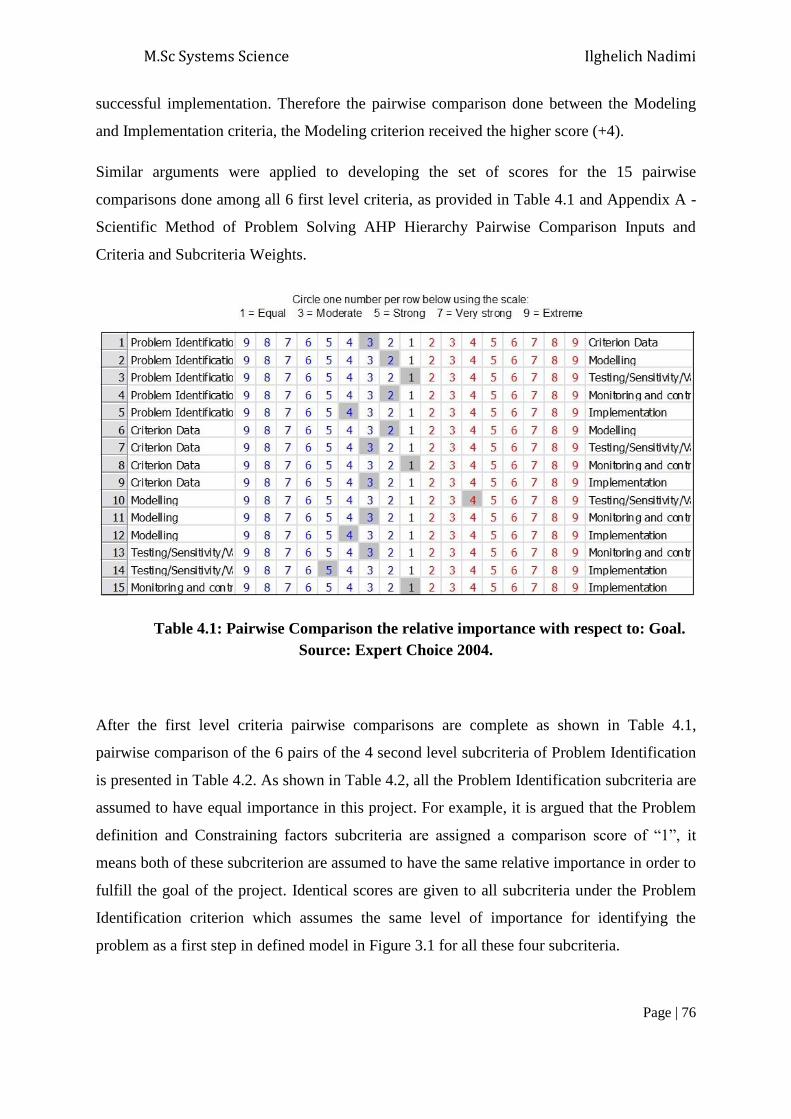
M.Sc Systems Science Ilghelich Nadimi
Page | 76
successful implementation. Therefore the pairwise comparison done between the Modeling
and Implementation criteria, the Modeling criterion received the higher score (+4).
Similar arguments were applied to developing the set of scores for the 15 pairwise
comparisons done among all 6 first level criteria, as provided in Table 4.1 and Appendix A -
Scientific Method of Problem Solving AHP Hierarchy Pairwise Comparison Inputs and
Criteria and Subcriteria Weights.
Table 4.1: Pairwise Comparison the relative importance with respect to: Goal.
Source: Expert Choice 2004.
After the first level criteria pairwise comparisons are complete as shown in Table 4.1,
pairwise comparison of the 6 pairs of the 4 second level subcriteria of Problem Identification
is presented in Table 4.2. As shown in Table 4.2, all the Problem Identification subcriteria are
assumed to have equal importance in this project. For example, it is argued that the Problem
definition and Constraining factors subcriteria are assigned a comparison score of “1”, it
means both of these subcriterion are assumed to have the same relative importance in order to
fulfill the goal of the project. Identical scores are given to all subcriteria under the Problem
Identification criterion which assumes the same level of importance for identifying the
problem as a first step in defined model in Figure 3.1 for all these four subcriteria.
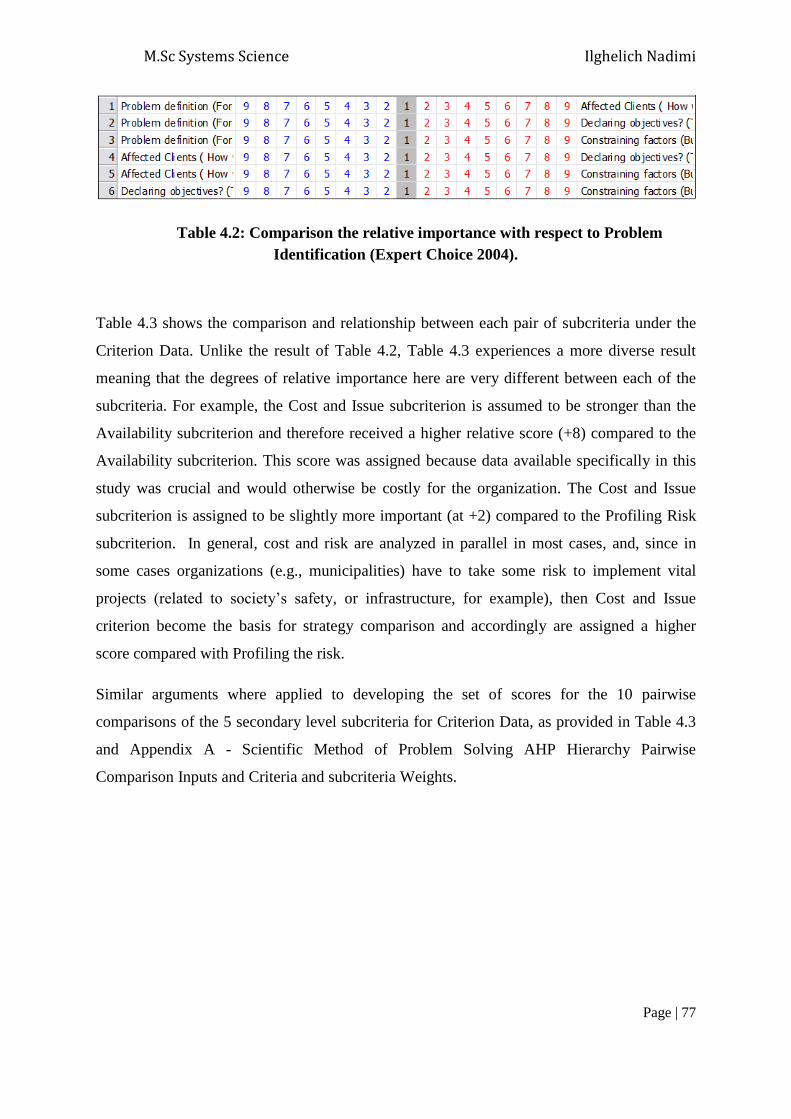
M.Sc Systems Science Ilghelich Nadimi
Page | 77
Table 4.2: Comparison the relative importance with respect to Problem
Identification (Expert Choice 2004).
Table 4.3 shows the comparison and relationship between each pair of subcriteria under the
Criterion Data. Unlike the result of Table 4.2, Table 4.3 experiences a more diverse result
meaning that the degrees of relative importance here are very different between each of the
subcriteria. For example, the Cost and Issue subcriterion is assumed to be stronger than the
Availability subcriterion and therefore received a higher relative score (+8) compared to the
Availability subcriterion. This score was assigned because data available specifically in this
study was crucial and would otherwise be costly for the organization. The Cost and Issue
subcriterion is assigned to be slightly more important (at +2) compared to the Profiling Risk
subcriterion. In general, cost and risk are analyzed in parallel in most cases, and, since in
some cases organizations (e.g., municipalities) have to take some risk to implement vital
projects (related to society’s safety, or infrastructure, for example), then Cost and Issue
criterion become the basis for strategy comparison and accordingly are assigned a higher
score compared with Profiling the risk.
Similar arguments where applied to developing the set of scores for the 10 pairwise
comparisons of the 5 secondary level subcriteria for Criterion Data, as provided in Table 4.3
and Appendix A - Scientific Method of Problem Solving AHP Hierarchy Pairwise
Comparison Inputs and Criteria and subcriteria Weights.

M.Sc Systems Science Ilghelich Nadimi
Page | 78
Table 4.3: Comparison the relative importance with respect to Criterion Data
(Expert Choice 2004).
Table 4.4 shows below the 6 pairwise comparison scores assigned to the 4 subcriteria under
the primary level criterion “Modeling”. In this case, it is argued that the Static/Dynamic Sub-
Criterion is assigned the lowest score (at scores of “8” and “3”) compared with each of the
other subcriteria for Modeling. The other 3 subcriteria pairs are less different and more
comparable (with scores of “2” and “3”) in their pairwise comparison scores. The logic
behind this scoring method for example, assigns more importance with respect to whether the
specific project is Deterministic or Probabilistic compared to being Static or Dynamic.
Similar arguments where applied to developing the set of scores for the 6 pairwise
comparisons of all four second level subcriteria for Modeling, as provided in Table 4.4 and
Appendix A - Scientific Method of Problem Solving AHP Hierarchy Pairwise Comparison
Inputs and Criteria and subcriteria Weights.
Table 4.4: Comparison the relative importance with respect to Modeling (Expert Choice
2004).
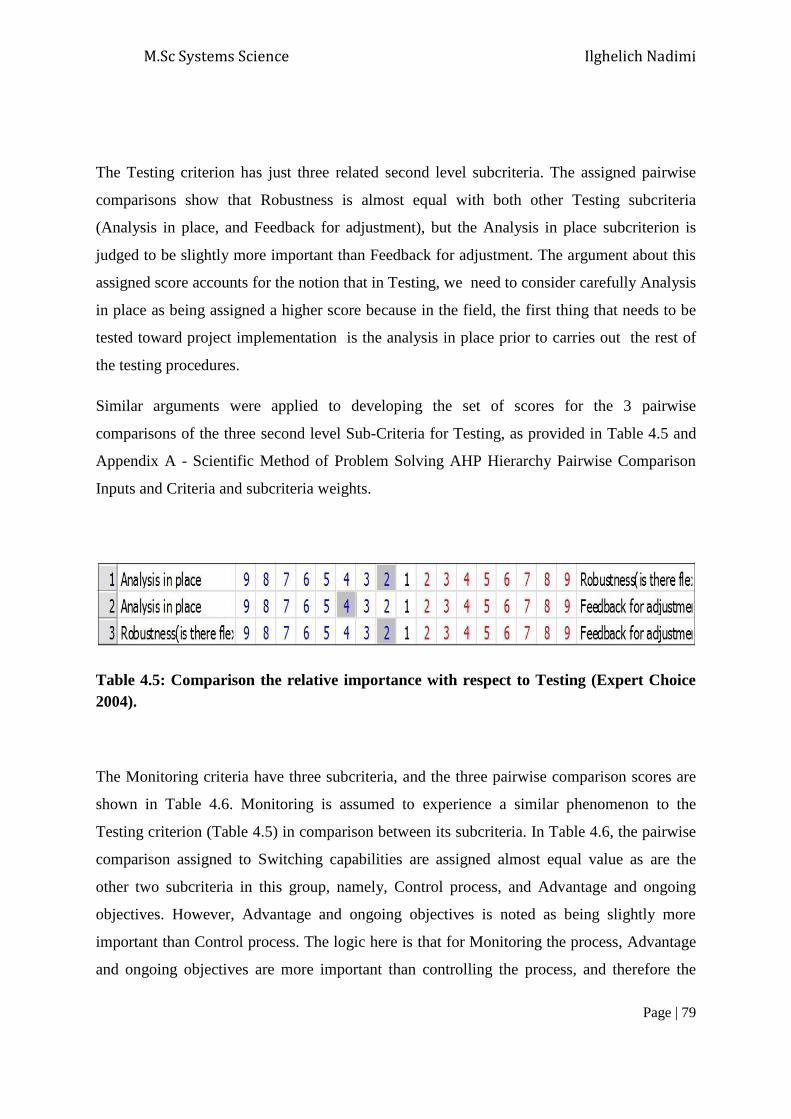
M.Sc Systems Science Ilghelich Nadimi
Page | 79
The Testing criterion has just three related second level subcriteria. The assigned pairwise
comparisons show that Robustness is almost equal with both other Testing subcriteria
(Analysis in place, and Feedback for adjustment), but the Analysis in place subcriterion is
judged to be slightly more important than Feedback for adjustment. The argument about this
assigned score accounts for the notion that in Testing, we need to consider carefully Analysis
in place as being assigned a higher score because in the field, the first thing that needs to be
tested toward project implementation is the analysis in place prior to carries out the rest of
the testing procedures.
Similar arguments were applied to developing the set of scores for the 3 pairwise
comparisons of the three second level Sub-Criteria for Testing, as provided in Table 4.5 and
Appendix A - Scientific Method of Problem Solving AHP Hierarchy Pairwise Comparison
Inputs and Criteria and subcriteria weights.
Table 4.5: Comparison the relative importance with respect to Testing (Expert Choice
2004).
The Monitoring criteria have three subcriteria, and the three pairwise comparison scores are
shown in Table 4.6. Monitoring is assumed to experience a similar phenomenon to the
Testing criterion (Table 4.5) in comparison between its subcriteria. In Table 4.6, the pairwise
comparison assigned to Switching capabilities are assigned almost equal value as are the
other two subcriteria in this group, namely, Control process, and Advantage and ongoing
objectives. However, Advantage and ongoing objectives is noted as being slightly more
important than Control process. The logic here is that for Monitoring the process, Advantage
and ongoing objectives are more important than controlling the process, and therefore the

M.Sc Systems Science Ilghelich Nadimi
Page | 80
Monitoring step with Advantage and ongoing objectives criterion can be shifted among the
other two subcriteria.
Similar arguments were applied to developing the set of scores for the 3 pairwise
comparisons of the three second level subcriteria, as provided in Table 4.6 and Appendix A -
Scientific Method of Problem Solving AHP Hierarchy Pairwise Comparison Inputs and
Criteria and subcriteria weights.
Table 4.6: Comparison the relative importance with respect to Monitoring (Expert
Choice 2004).
The last pairwise comparison is between the single pairwise comparison of the
Implementation criterion’s two Sub-Criteria, namely, Evidence of result, and Guideline of
design model (Table 4.7). The study’s main objectives suggest that the Guideline of the
design model is moderately more important than Evidence of results with a score of “3”).
This is because without the Guideline of design model, the Evidence of results does not make
sense.
Table 4.7: Comparison the relative importance with respect to Implementation
(Expert Choice 2004).
After providing the pairwise comparison values for the scientific method of problem solving
AHP hierarchy formulation, these given values are used to weight the relative importance of
M.Sc Systems Science Ilghelich Nadimi
Page | 81
the overall hierarchy for general application to alternative adaptation frameworks and, in
particular, for evaluating the international protocols of Phase 1 of the research process.
After all the pairwise comparisons have been assigned between the criteria at all levels
(Figure 4.1), the weighted hierarchy model can be developed to form the complete weighted
AHP formulation of the scientific method of problem solving in Expert Choice format. In
Figure 4.1, final weights are given to each criterion in all levels. The weights are scaled to 1
across the first level criteria, and for each set of second level Sub-Criteria. For example, the
Problem Identification’s Sub-Criteria weight summation across its four Sub-Criteria yield:
0.221+0.257+0.239+0.283 = 1.000.
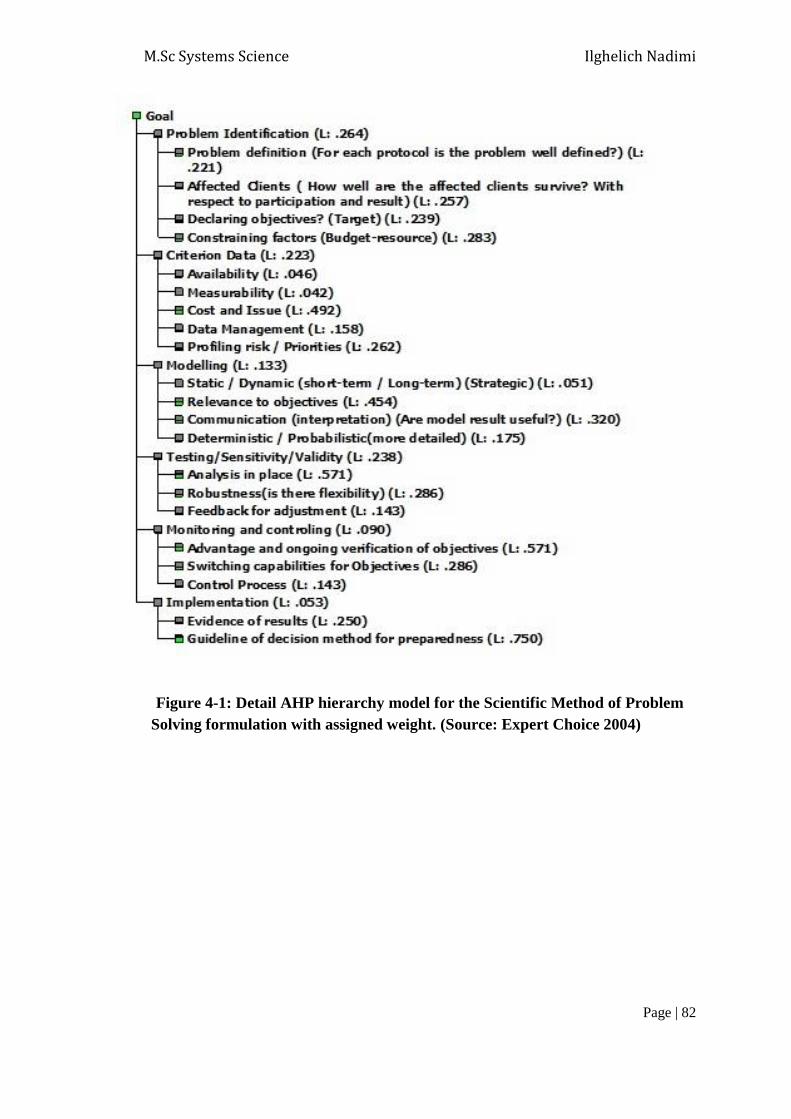
M.Sc Systems Science Ilghelich Nadimi
Page | 82
Figure 4-1: Detail AHP hierarchy model for the Scientific Method of Problem
Solving formulation with assigned weight. (Source: Expert Choice 2004)

M.Sc Systems Science Ilghelich Nadimi
Page | 83
Figure 4-2: Main Criteria’s final scores. Source: (Expert Choice 2004)
Figure 4.2 shows the weighted importance of the first level elements of the defined hierarchy
from the pairwise comparison scores. In this Figure, the importance of 3 criteria: Problem
identification, Criterion data, and Testing/Sensitivity/Validity are more heavily weighted than
other elements and account for a combined 72.5% of the hierarchy total weight (of 100%).
Hence, we can conclude these factors are relatively more important than other factors in
regard to the decision of managing community adaptation frameworks.
4.2 Phase1. Evaluation of International protocols for managing adaptation
In this initial step, the International protocols for managing adaptation presented in Chapter 2
are analysed one by one and their criterion data for the scientific method of problem solving
assessed. This is achieved by scoring each protocol independently with respect to the

M.Sc Systems Science Ilghelich Nadimi
Page | 84
measures and indicators associated with the subcriteria at the lowest level hierarchy elements
of the AHP model (Section 3.3, Figure 3.3).
As presented in the review of Chapter 2, the international protocols for managing adaptation
are as follows:
1) ICLEI - the International Council for Local Environmental Initiatives
2) FCM - the Federation of Canadian Municipalities
3) CARE - Cooperative for Assistance and Relief Everywhere
4) UNDP - The United Nations Development Program
5) EU-ECCP - The European Commission’s European Climate Change Program as part
of EU’s strategic identification and development of implementing the Kyoto Protocol.
The scores for the 5 international protocols are presented below in Table 4.8 for the 3 Sub-
Criteria of the Problem Identification first level criterion. The derivations and assignment of
the protocol scores are discussed further below.
Table 4.8: Data Grid scores (protocols). Source: (Expert Choice 2004)

M.Sc Systems Science Ilghelich Nadimi
Page | 85
In Table 4.8, the score given for the Problem Identification criterion and the Sub-Criterion
Problem definition of the hierarchy for each protocol asks the question whether the
adaptation problem is well-defined. As shown in Figure 4.8, regarding the scores given to
each protocol, it is obvious the response to this question is different among these introduced
protocols, especially between ICLEI and the EU Commission (ICLEI score is 9 versus a
score of 3 for the EU Commission). For this particular example, these scores are given
because ICLEI’s considerable experience in defining specific milestones for its different
types of client communities. On the other hand, EU Commission’s framework developed to
help the broader EU countries reduce GHG emissions and adapt to climate changes is much
less specific in terms of problem definition. As such, this protocol is relatively new, and the
EU with less experience than ICLEI, is still proceeding in the initial phases of defining the
project problem. Therefore the EU Commission receives a lower weight (3). The Affected
client Sub-Criterion comparison between the same two protocols shows different results. In
this case the score assigned to ICLEI and EU Commission are almost same (ICLEI = 8, EU
Commission = 7). The reason for these scores is because both protocols supported very well
the affected clients, even though the variety of communities supported by ICLEI are very
diverse than the communities supported by EU Commission.
Other examples analyze the third subcriterion under Problem Identification - Declaring
Objectives. Analyzing the score assigned to protocols under this subcriterion in Table 4.8
shows all protocols received more or less similar scores in this case and the lowest score is 5
for FCM. The logic behind these results assumes that these protocols are trying to follow
their target and their main purposes and therefore these protocols receive high scores. Care
and FCM were assigned lower scores compared with other protocols because these two
protocols are still dealing with new communities that are continuing to develop their
priorities and are facing issues, developing their frameworks, and receiving further feedback
from them.

M.Sc Systems Science Ilghelich Nadimi
Page | 86
The score given to all criteria (Data Grid Scores) for the International Adaptation Protocols
analysis are presented in Appendix C – “Protocol’s Data Grids”.
Another important element affecting the scoring process is about utility scores and it’s shown
through gray areas in Table 4.8. Since the graph (Appendix B) in this study is not linear and
regarding to the first level criteria have to make curves (Figure 4.3). These curves affecting
the value of scores given for each protocol through the following system:
Figure 4-3: Utility Curve
In Figure 4.3 the curve is divided in different parts and all scores higher than 6 can be
considered acceptable. The marginal utility for this case decreases as we proceed from the
minimum to maximum anchor points.
The marginal utility for this case (Figure 4.3) decreases as we proceed from the minimum to
maximum anchor points. This implies that gains made (in utility) are expected to fall as the
scores increase, e.g., if the score is very low (3), the gains in utility from moving to 4 or 5 are
higher than the gains in utility moving from a higher utility (7) to 8 or 9. This interpretation
reflects decision makers’ understand of the problem.
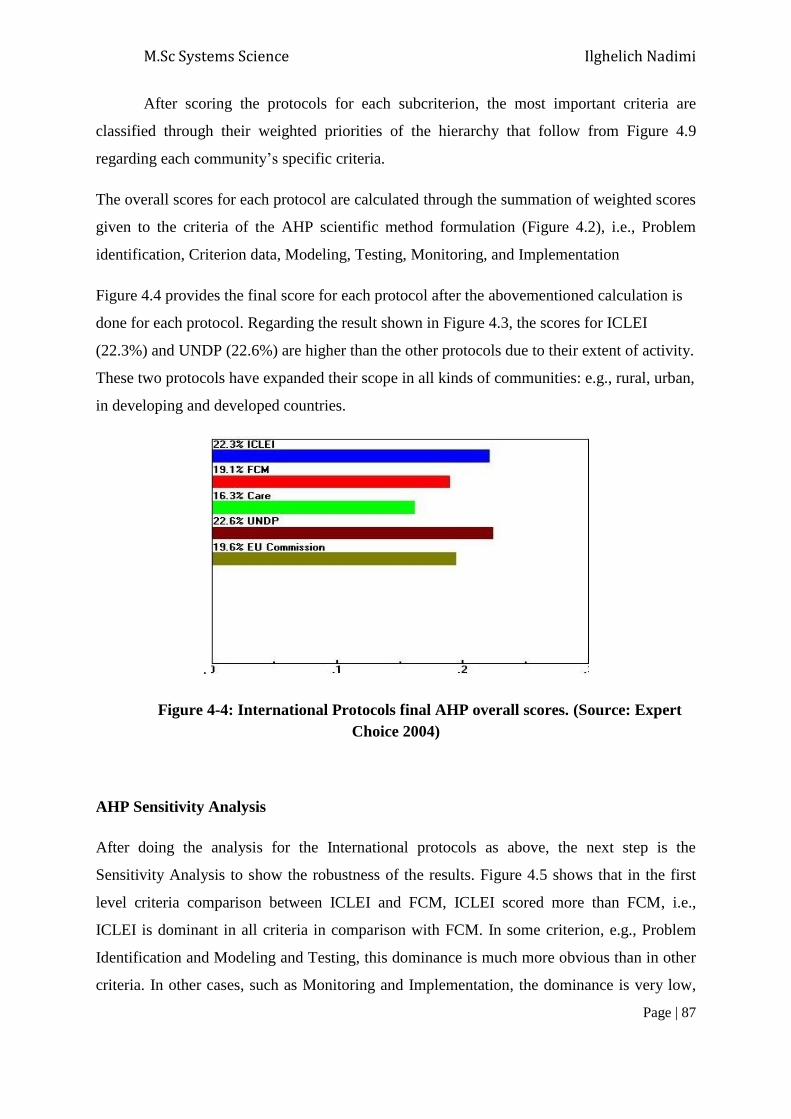
M.Sc Systems Science Ilghelich Nadimi
Page | 87
After scoring the protocols for each subcriterion, the most important criteria are
classified through their weighted priorities of the hierarchy that follow from Figure 4.9
regarding each community’s specific criteria.
The overall scores for each protocol are calculated through the summation of weighted scores
given to the criteria of the AHP scientific method formulation (Figure 4.2), i.e., Problem
identification, Criterion data, Modeling, Testing, Monitoring, and Implementation
Figure 4.4 provides the final score for each protocol after the abovementioned calculation is
done for each protocol. Regarding the result shown in Figure 4.3, the scores for ICLEI
(22.3%) and UNDP (22.6%) are higher than the other protocols due to their extent of activity.
These two protocols have expanded their scope in all kinds of communities: e.g., rural, urban,
in developing and developed countries.
.
Figure 4-4: International Protocols final AHP overall scores. (Source: Expert
Choice 2004)
AHP Sensitivity Analysis
After doing the analysis for the International protocols as above, the next step is the
Sensitivity Analysis to show the robustness of the results. Figure 4.5 shows that in the first
level criteria comparison between ICLEI and FCM, ICLEI scored more than FCM, i.e.,
ICLEI is dominant in all criteria in comparison with FCM. In some criterion, e.g., Problem
Identification and Modeling and Testing, this dominance is much more obvious than in other
criteria. In other cases, such as Monitoring and Implementation, the dominance is very low,

M.Sc Systems Science Ilghelich Nadimi
Page | 88
but through looking at the overall comparison at the bottom of the figure, it is concluded that
ICLEI is dominant in comparison to FCM. Therefore ICLEI is expected to be a more
appropriate overall protocol for application to the C-Change coastal communities (Phase 2).
See also Appendix D- “Protocols AHP output-Sensitivity Analysis”.
Figure 4-5: Weighted head to head Protocols Comparison. Source: (Expert Choice
2004)
In the final point of discussion about the International protocols rankings, the analysis of all
protocols and the first level criteria is presented in Figure 4.6. This Figure shows the scores
given to each criterion with the related International Protocols.
As shown in figure 4.6, ICLEI and UNDP are dominant in all criteria comparisons. This
dominance is more obvious in some criterion such as Modeling. Dominance is reduced over
other protocols in criterion such as Implementation. Overall for all criteria, the analysis of
ICLEI and UNDP maintain their dominance and are assigned higher scores compared to
other protocols.

M.Sc Systems Science Ilghelich Nadimi
Page | 89
Figure 4-6: Protocol’s comparison, Source: (Expert Choice 2004)

M.Sc Systems Science Ilghelich Nadimi
Page | 90
Moreover, as shown in figure 4.6 UNDP and ICLEI are very close to each other and both of
them have a much higher score than other protocols in all criteria. The highest score belongs
to the Modeling criterion and again, ICLEI and UNDP received highest score among all
protocols with respect to the Modeling criterion, and CARE assigned 3, the lowest score.
Furthermore, the lowest score for all protocols is in Implementation criterion due to progress
of implementation of all these protocols. Therefore, changing Implementation score assigned
to these protocols could make a significant change in overall result of this analysis.
In summary, in this part (Phase1) all the international protocols introduced in Chapter 2 are
assessed and the scientific method of problem solving steps are applied in AHP Expert
Choice software to do pairwise comparison between the criteria of these protocols in all
levels to obtain best practices. Regarding the results obtained from AHP and analysis done
among these data, ICLEI and UNDP are chosen as the best practices. These two protocols get
the highest rank in all criteria and it is as a result of years of experience in the field, and
developing and implementing their framework in partnership with different group of
communities in developed and developing countries.
In the next step (Phase 2), the AHP hierarchy for the scientific method of problem solving is
applied among Canadian C-Change communities to find the best case practice and hereby
develop a preferred and model framework for coastal communities.
Moreover, as shown in the above Figures 4.4, and 4.5, UNDP and ICLEI have much higher
scores than other protocols in all criteria. The highest score belongs to the Modeling criterion
and again, ICLEI and UNDP received the highest scores among all protocols with respect to
the Modeling criterion, while CARE assigned 3, the lowest score. Furthermore, the lowest
score for all protocols is in Implementation criterion due to progress of implementation of all
these protocols. Therefore, changing the Implementation score assigned to these protocols
could make a significant change in overall result of this analysis.

M.Sc Systems Science Ilghelich Nadimi
Page | 91
4.3 Identification of ‘best practices’
This step discusses the identification of ‘best practices’ among the International protocols for
managing adaptation resulting from the sensitivity analysis of the AHP model (Phase 1
results) from section 4.2. Regarding the results obtained from the analysis done in Phase 1,
ICLEI and UNDP are chosen as models of “best practices”. These two protocols obtained the
highest rank in all criteria. This is attributed to their years of experience in the field, and for
developing and implementing their adaptation frameworks in partnership with different
groups of communities in developed and developing countries. This result is relative to the
overall data since both of these protocols are dominant, and receive the highest weights
among all analyzed protocols.
The reason these two protocols are chosen as ‘best practices’ include:
These protocols support a variety of communities in different regions of the world.
ICLEI and UNDP are implementing their framework on developing and developed
countries, in urban and rural areas.
ICLEI and UNDP have proven methodologies and reliable databases with a variety of
successful cases.
Both of these protocols develop in the communities through training local authorities
and transferring knowledge and experience to the community.
Helping the communities to develop their own framework through using their basic
reliable framework.
Moreover, ICLEI and UNDP are chosen as highest ranking protocols that demonstrate best
practices in delivery of community based adaptation. These protocols contribute to the
specific elements of the constructed model framework. Analyzing all aspects of these
protocols in comparison with the other international protocols indicates where the preferred
protocols make specific gains on others. The result of the analysis of best elements chosen
through pairwise comparison provide the ranked protocols with better performance with

M.Sc Systems Science Ilghelich Nadimi
Page | 92
respect to problem solving. As well, insight gained from the hierarchical structure and
scoring of the protocols permit direct comparison of the different protocols and communities.
In summary, in this part (Phase1), all the international protocols introduced in Chapter 2 are
assessed according to their treatment and experience of applying the scientific method of
problem solving within the adaptation framework. Regarding the results obtained from the
AHP analysis, ICLEI and UNDP are chosen as models of “best practices”. These two
protocols obtained the highest rank in all criteria as a result of years of experience in the field,
and developing and implementing their framework in partnership with different groups of
communities in developed and developing countries.
In the next step (Phase 2), the AHP hierarchy and the scientific method of problem solving
steps will be applied among Canadian C-Change communities to find the best case practice
and hereby develop the characteristics of a preferred framework for coastal communities.
M.Sc Systems Science Ilghelich Nadimi
Page | 93
4.4 Phase 2 - Application of scientific methods on C-Change communities
Phase 2 is part of ICURA C-Change project. The ICURA’s main goal is to develop climate
change adaptation capabilities among coastal communities in Canada and the Caribbean
through connecting the communities with research groups in universities throughout Canada
and the University of the West Indies network in the Caribbean (International Community-
University Research Alliance (ICURA) 2007). Therefore, the related goal defined for this
study is to develop a preferred adaptation framework for coastal communities to assist them
in adapting to coastal climate changes and to apply the developed framework to compare the
C-Change Canadian communities. Hence, the analysis of Phase 1 among the international
adaptation protocols through applying the scientific method of problem solving and the
AHP’s hierarchy, these developed methods are now applied, in Phase 2, among the four
Canadian C-Change communities.
The Canadian C-Change communities are analyzed below with respect to their social,
economic, cultural, and environmental profiles. Then, the four communities are compared
regarding their estimated ability to present the scientific method of problem solving through
applying the AHP hierarchy as before.

M.Sc Systems Science Ilghelich Nadimi
Page | 94
4.4.1 Isle Madame, Nova Scotia
Figure 4-7: Aerial Photo of the Town of Isle Madame (Source: Google Map, 2012)
Isle Madame is located in the south-eastern part of Cape Breton Island in Nova Scotia,
Canada. The island archipeligo consists of three main island communities: Isle Madame
proper, Petit-de-Grat to the east, and Janvrin’s Island to the west. Isle Madame is in fact part
of Richmond County and is separated from mainland Cape Breton Island by a narrow channel
named Lennox Passage to the north (International Community-University Research Alliance
(ICURA) 2007) (Figure 4.7).
Storm surge and sea level rise are considered as the biggest coastal environmental issues
facing Isle Madame. Since most of the infrastructure (roads, water treatment, wharves) are
built close to shore, it makes the community more vulnerable to storm surge (from more
frequent severe storms) and pending sea level rise (Pakdel 2011).

M.Sc Systems Science Ilghelich Nadimi
Page | 95
4.4.2 Gibsons, British Columbia
Figure 4-8: Aerial Photo of the Town of Gibsons (Source: Google Map, 2012)
The Town of Gibsons is a growing coastal community which is located in southwestern
British Columbia on the Strait of Georgia. Gibsons is 64km north of Vancouver, in the area
known as British Columbia’s Sunshine Coast. The community is accessible by ferry through
Vancouver and by air.
Average annual temperatures for Gibsons (and the Sunshine Coast area) are slightly higher
than that of Vancouver (13 versus 12 degrees Celsius) and, Gibsons has on average more
frost free days (334 versus 329 for Vancouver). Winters are relatively mild and lots of rain
makes this area green and blooming year round (United Nations Development Programme
2012).
M.Sc Systems Science Ilghelich Nadimi
Page | 96
In 2009, Gibsons earned an international recognition when it was named the "Most Liveable
Community under 20,000" in a world-wide competition by the UN-backed International
Awards for Liveable Communities. In 2005, Gibson’s was recognized with the Berkley
Springs International Water Tasting Award as the Gold Medal Winner (United Nations
Development Programme 2012).
The Town of Gibsons addresses climate issues by developing the community energy and
emission plan to reduce the energy usage in the community and GHG emissions as well. The
community targets to reduce the energy consumption and GHG emission until 2031. Gibsons
designed the following action to achieve their reduction goals (Epp 2010):
“Support Energy Efficient Land Use Practices
Reduce Dependence on Single Occupant Vehicles
Enhance the Green Building Sector
Expand Local Renewable Energy Opportunities
Reduce and Reuse Solid Waste as a Resource
Strengthen the Local Economy
Manage Brownfield Sites
Foster a Culture of Conservation in the Community”
This plan is designed to be updated during the implementation phase since reporting and
monitoring are done continually (Epp 2010).

M.Sc Systems Science Ilghelich Nadimi
Page | 97
4.4.3 Iqaluit, Nunavut
Figure 4-9: Aerial Photo of the Town of Iqaluit (Source: Google Map, 2012)
Iqaluit is Canada's most northern capital of the territory of Nunavut, which is located on the
head of Frobisher Bay overlooking Koojesse Inlet on the southeastern coast of Baffin Island.
Iqaluit, once known as the community of Frobisher Bay, is the largest community in Nunavut
with a population of more than 7,250 (2010 estimate). The temperature in Iqaluit in January
averages -30°C, and in July it is about 15°C. There are nearly 24 hours of daylight per day in
June whereas in December there are only 6 hours of daylight per day. The long cold winter
begins in September and the ground is usually snow-covered until June. The summer months
are July and August (United Nations Development Programme 2012).
Iqaluit’s key environmental factors include permafrost and ground ice, but also surface
hydrology, sea ice, drifting snow, storms and flooding hazards. The macro tidal setting
creates spectacular tidal flats and challenges for shipping. Climate change in this area is

M.Sc Systems Science Ilghelich Nadimi
Page | 98
imposing changes on a number of species, including seals, which are among the most
important country food besides fish (United Nations Development Programme 2012).
Global warming is the biggest climate issue in recent years (Nielsen 2007) mostly affecting
extreme changes in weather. Iqaluit has recently experienced different climate change
impacts including: extreme weather changes (increase in temperature and wind speed and
quantity of rain) , changes in precipitation ( quantity of rain and snow in the different months)
, and coastal environmental change like sea level rise and ice melting. Since infrastructure in
the Arctic area is built based on past climate conditions, extreme changes in climate such as
heavier snow or rain fall may cause serious damage to all infrastructures in the community.
Furthermore, global warming contributes to sea level rise, coastal flooding, storm surge as
well as land falling, i.e., subsidence. Buildings, roads, and other infrastructure in this area are
becoming more vulnerable and there is a need to develop a new plan to help the community
adapt to the changing climate conditions (Nielsen 2007).

M.Sc Systems Science Ilghelich Nadimi
Page | 99
4.4.4 Charlottetown, Prince Edward Island
Figure 4-10: Aerial Photo of the Town of Charlottetown (Source: Google Map, 2012)
Charlottetown is the capital of the Canadian Province of Prince Edward Island and is located
on the south shore of Prince Edward Island, just off the eastern shore of Canada in the Gulf of
the St. Lawrence. The city is situated on Charlottetown Harbor, which is formed by the
confluence of three rivers and which opens into the Northumberland Strait. The City of
Charlottetown has an impressive inventory of parks and green spaces (approximately 400
acres), which provides a range of passive and active experiences, including the award
winning Confederation Landing Park, and a beautifully landscaped waterfront park.
Charlottetown has an extensive and distinct architectural heritage including individual
heritage buildings as well as a heritage area located in its downtown (International
Community-University Research Alliance (ICURA) 2007).
As mentioned in Natural Resource Canada’s report in 2009, Charlottetown has had
problems with storm surge and land falling (subsidence). Hartt (2010), storm surge affects
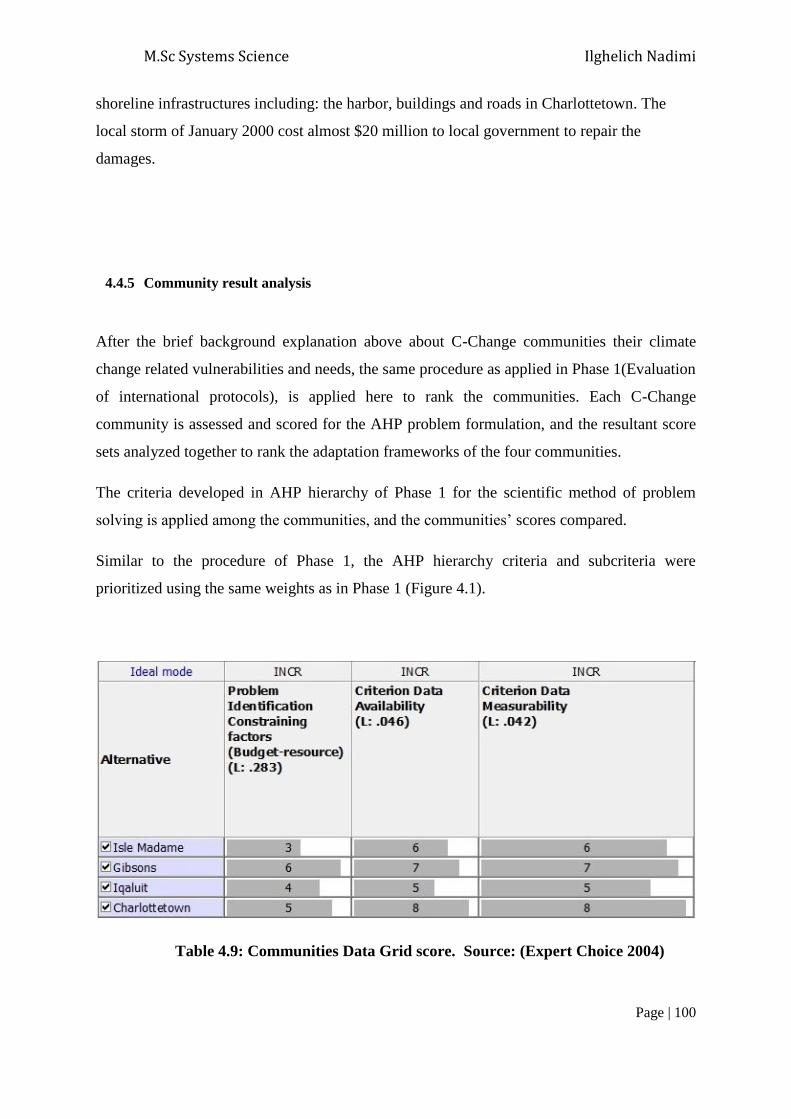
M.Sc Systems Science Ilghelich Nadimi
Page | 100
shoreline infrastructures including: the harbor, buildings and roads in Charlottetown. The
local storm of January 2000 cost almost $20 million to local government to repair the
damages.
4.4.5 Community result analysis
After the brief background explanation above about C-Change communities their climate
change related vulnerabilities and needs, the same procedure as applied in Phase 1(Evaluation
of international protocols), is applied here to rank the communities. Each C-Change
community is assessed and scored for the AHP problem formulation, and the resultant score
sets analyzed together to rank the adaptation frameworks of the four communities.
The criteria developed in AHP hierarchy of Phase 1 for the scientific method of problem
solving is applied among the communities, and the communities’ scores compared.
Similar to the procedure of Phase 1, the AHP hierarchy criteria and subcriteria were
prioritized using the same weights as in Phase 1 (Figure 4.1).
Table 4.9: Communities Data Grid score. Source: (Expert Choice 2004)

M.Sc Systems Science Ilghelich Nadimi
Page | 101
The scores for the four communities are provided for the hierarchy subcriteria measures as in
Phase 1. For instance, the score given for the Problem Identification criterion, sub criteria:
Constraining factors (Budget-resource) are shown in Table 4.9. Gibsons and Charlottetown
have higher scores (6 and 5 respectively) than Iqaluit and Isle Madame (4 and 3 respectively).
These scores are assigned because Gibsons is a relatively rich community and has resources
and infrastructures to develop the framework in the community. On the other hand,
Charlottetown is one of the more developed communities in an urban setting, with local
action plans in place and so a considerable community database and forecast analyses about
future climate impacts. Therefore, these two communities are justified in receiving higher
scores than the other two communities regarding Constraining factors, Budget-resource. The
Criterion data availability subcriterion comparison between communities shows a different
result. Even though again Gibsons and Charlottetown have a higher score compare than the
other two communities, the score given to all communities are almost same (Gibsons = 7,
Charlottetown = 7, Isle Madame = 6, and Iqaluit= 5). The reason for these scores is because
communities’ climate historical information and the necessary infrastructure for developing
the framework are available .The difference in scores indicates how each community has
more potential in the new framework implementation regarding data availability.
Another example is Criterion data measurability, the second subcriterion under Criterion
Data. Analyzing the score received by communities under this subcriterion in Table 4.9
shows all protocols received similar scores in this case, and the lowest score is 5 for Iqaluit.
The logic behind these results is because these entire communities keep updated climate
related data and information, and the data available in these communities could be used as a
initial step of data gathering in problem identification. The difference between scores comes
from the quality of the data available, and the infrastructure each community currently has.
Therefore, as in the previous example, Gibsons and Charlottetown receive slightly higher
scores in comparison to the other two communities.
The score given to all criteria (Data Grid Scores) for the Canadian C-Change communities’
analysis are presented in Appendix E - “Communities Data Grids”.
After scoring each criterion for each community, the application of the AHP to these data,
including the weighted hierarchy enabled a ranking of the communities in terms of their

M.Sc Systems Science Ilghelich Nadimi
Page | 102
adaptive framework status to date. The results of the cooperative ranking of the four
communities are provided in Figure 4.11 below.
Figure 4-11: Alternative Community comparison. Source: (Expert Choice 2004)
The overall scores for each community (in Figure 4.11) are calculated through summation of
scores given to scientific method elements (Figure 4.1) (Problem identification, Criterion
data, Modeling, Testing, Monitoring, and Implementation) for that particular community.
Regarding the result shown in Figure 4.11, all communities scored similarly. The scores for
Gibsons (26.1%) and Charlottetown (26.3%) are higher than the other two communities due
to their extent of activity. These two communities are active in developing local action plans,
have established historic databases about past climate impacts and employ expert dedicated
staff on the issue of local coastal adaptation.
The next step presents the Sensitivity analysis to show the robustness of the Figure 4.12
results. As shown in Figure 4.12, in most of the first criteria comparison between Isle
Madame and Charlottetown, Charlottetown scored higher than Isle Madame. In some
criterion like Criterion data and Modeling this dominance is much more obvious than in other

M.Sc Systems Science Ilghelich Nadimi
Page | 103
criteria. Even though in some cases like Testing and Implementation, Isle Madame was
assigned a higher score but the overall comparison in the bottom of the figure we can
conclude Charlottetown is dominant in comparison to Isle Madame. Therefore we expect it to
be a more appropriate overall community for the application of the adaptation framework to
the C-Change coastal communities. See also Appendix F - Communities AHP output-
Sensitivity Analysis.
Figure 4-12: Weighted head to head Communities comparison. Source: (Expert Choice
2004)
In the final step of discussion about C-Change communities, the analysis of all protocols and
the first level criteria is presented in Figure 4.13. In this figure, all fluctuations are shown
regarding to the scores given to each criterion with the related communities.
As shown in the figures below Charlottetown and Gibsons are dominant communities in most
criteria except in the Testing and Implementation criterion. In the Testing criterion Isle
Madame is assigned a higher rank in comparison to Charlottetown, and in the Implementation
criterion Isle Madame and Iqaluit are assigned higher rank than the other two communities.
Since Charlottetown and Gibsons are still in their initial step of applying process

M.Sc Systems Science Ilghelich Nadimi
Page | 104
implementation. Overall for all criteria, Charlottetown and Gibsons kept their dominance and
are assigned higher scores compared to other two communities.
Figure 4-13: Communities detailed comparison. Source: (Expert Choice 2004)

M.Sc Systems Science Ilghelich Nadimi
Page | 105
Moreover as shown in Figure 4.13, all communities are very close but Charlottetown and
Gibsons are more stable in comparison to the other two communities, therefore these two
communities have higher overall scores.
4.5 Gap analysis of the ranked C-Change Canada communities
This section includes:
Lessons applied from the best practices of the International protocols for
managing adaptation resulting from the sensitivity analysis of the AHP model
(Phase 2 results)
Comparison of communities with respect to their overall ranking and statement
of why some are better than others and the gaps that communities need to
address to “improve”, e.g., more data, etc.
In this part (Phase 2) all the C-Change Canadian communities are assessed and the
Scientific methods of problem solving steps are applied in the AHP Expert Choice software
(Expert Choice 2004). Regarding the results obtained from AHP and analysis done among
these data, Charlottetown and Gibsons are chosen as the communities that are currently best
prepared for the application of their adaptation frameworks. These two communities attain
the highest rank in most criteria (as discussed in section 4.4.5), as a result of years of
experience in the developing local action plans, and their source and preparedness.
Regarding Community data (Figure 4.13), Isle Madame should be expected to
improve its Criterion Data, Modeling, and Monitoring criteria. Consequently, this community
needs to prepare background information about the community’s historical climate and
threats and vulnerabilities, and develop a concise monitoring plan to track the current climate
changes in the community. For this purpose, the community needs to develop an
organizational chart of responsibilities to determine all involved organizations in the
adaptation process. Isle Madame also has to develop its Model and framework specifically.

M.Sc Systems Science Ilghelich Nadimi
Page | 106
Iqaluit as other community analyzed in this study faces serious issues in comparison
with Isle Madame. As shown in Figure 4.14, the community of Iqaluit needs to improve in all
aspects relative to the scores for Isle Madame. For example, more resources (technical and
financial) need to be provided for the community, which should have the authority to train
and develop the community’s background climate database.
In the next Chapter (Phase 3), the Community Action Plan and guideline is developed
through the analyses and results of Phase 1 and Phase 2.
Figure 4-14: Weighted head to head comparison between Isle Madame and Iqaluit

M.Sc Systems Science Ilghelich Nadimi
Page | 107
5 Community Action plan and Adaptation Guideline
This chapter presents the Community Action Plan and Adaptation Guidelines for applying the
adaptation framework. The Action Plan is developed from lessons learned to date from
applied community adaptation planning, e.g., in the international protocols and community
cases, and from the recorded experience (e.g., Chapter 2, Section 2.4), and the best practices
and gap analysis discussed in Chapter 4 above. The Community Action Plan and Adaptation
Guidelines presented here are intended to inform the C-Change project communities in
Canada and the Caribbean.
Developing adaptation guidelines at the community level requires consideration of particular
characteristics. These characteristics are:
Background information and Community Profile – the collection of community
context information regarding the community’s climate history, impacts, and
vulnerabilities and threats including demographic factors as well as other important
social, cultural characteristics.
Community Priorities - evaluation regarding the community’s specific social,
geographical, economical, and cultural preferences.
Simplicity and Engagement – Community Action Plans and Adaptation Guidelines
are to be simple and understandable and apply to community leadership and
governance, as well as to community family and individual units equally, and in so
doing, are required to engage all members of the community from seniors to youth, to
professionals and volunteers.
Delivery Format – Community Action Plans and Adaptation Guidelines are expected
to be delivered to community members in multiple formats that include preparing a
checklist, so that the community is prepared for an emergency event. The initial step
in checklist preparation will apply the general community profile background
information and incorporate the community’s priority information. Community
Adaptation Guideline preparation starts by planning within families, and educates and

M.Sc Systems Science Ilghelich Nadimi
Page | 108
informs family members. This will be delivered as an “emergency kit” for use by each
family in the community. As well, the Community Action Plan and Adaptation
Guidelines develop procedures in the event of emergencies that trigger action by
community leaders in response. The roles and responsibilities of the Action Plan are
laid out.
Integrating the Action Plan in Community Activities - Community Action Plans
and Adaptation Guidelines requires rising awareness in the community and
establishing and enhancing the partnership among the in-charge organizations and
community leaders.
Event Simulation and Monitoring - Community Action Plan and Adaptation
Guidelines include a regular period of repeat simulation, training, and monitoring of
emergency events representing a “mock-up” of potential events that require
implementation of the Action Plan and involve all representative community groups.
The result of event simulation is a revision in the roles and responsibilities of
community members and lessons learned from the exercise.
The following sections incorporate the above criteria in the development of a Community
Action Plan and Adaptation Guidelines and include:
5.1. General Guideline and action plan
5.2. Assignment of Responsibilities
5.3. Family Emergency Plan, and
5.4. Conceptual Action Plan website output
M.Sc Systems Science Ilghelich Nadimi
Page | 109
5.1 General Guideline and Action Plan Frameworks
According to ICLEI’s definition, Action Plans are defined by a series of activities in the
community to reduce the climate change’s future effect and increase the sustainability and
preparedness in the community with the targeted goals such as: improving public health and
community liveability (Peterson 2011). This guideline is action items discussed since
protocols presented in chapter 2. Presenting the Guideline in this stage shows the application
of the action and applying the problem solving method in the community.
Following on the ICLEI definition and the characteristics noted above, Community Action
Plan and Adaptation Guidelines can be broken down into five steps as follows: (New
Brunswick Emergency Measures Organization 2001)
Step 1. Categorizing vulnerable populations and places
One of the major tasks in developing a guideline for the communities is categorizing the
vulnerable populations and places in each community and designing the future action plan to
assist them in the shortest time possible.
Step 2. Set community priorities
This is Core guideline applicable for all communities. The development of a guideline
requires setting the priorities in the communities through identifying the main vulnerabilities
and risks.(New Brunswick Emergency Measures Organization 2001)
Step 3. Assign responsibilities
In third step we can develop responsibility plans to manage and highlight the persons
responsible and the description of the roles for each person and organization in the
community.
Step 4. Communicate the plan
The community could be educated about the specified vulnerabilities and the plan’s detail by
local media: TV, Newspapers, as well as getting information to families through schools and
developing workshops for students and educating them about local environment issues.

M.Sc Systems Science Ilghelich Nadimi
Page | 110
Step 5. Monitor the plan
Responsible organizations have to monitor the action plans in order to make needed updates
to the community’s climate and society changes.
In the development of the Community Action Plans and Adaptation Guidelines for Canadian
communities, three levels of government are considered: (i) local (regional and municipal),
(ii) provincial, and (iii) federal levels, but since in the following step the plan discussed in
community level in following chart shows in Figure 5.1 the plan start from the local
government level (New Brunswick Emergency Measures Organization 2001). Figure 5.1
shows the responsible organizations hierarchical chart as well as household emergency
activities (72 Hours).
With respect to the local government, the list of organizations responsible for first action and
response are as follows (New Brunswick Emergency Measures Organization 2001):
Fire department
Police department
Ambulance and hospitals
Red Cross Canada
Municipality coordinators
Initial actions that take place in any community during a hazard, e.g., severe storm, are as
follows (New Brunswick Emergency Measures Organization 2001):
i) Analyse the community’s situation in the face of the hazard, e.g., storm surge, sea
level rise, hurricane, flood, and coastal storm;
ii) Respond via the local action plans;
iii) Implement responsibility chart at high, medium, and low levels to involve all
community members in implementing the adaptation and hazard response strategies;
and
iv) Recognize the more vulnerable parts of society and prioritize first response action
accordingly.

M.Sc Systems Science Ilghelich Nadimi
Page | 111
Figure 5-1: Action plan Organization chart Source: (New Brunswick Emergency
Measures Organization 2001) (Public Safety and Emergency Prepardness Canada 2011)
The following section discusses each organization’s duties in the plan and defines the roles
and responsibilities for all authorities mentioned in Figure 5.1.
M.Sc Systems Science Ilghelich Nadimi
Page | 112
5.2 Assignment of Responsibilities
In this step the responsibility checklist is developed to show every organization’s duties when
the climate hazard occurs in a community. The Town of Mattawa’s Emergency Plan is used
as a reference source of the assignment of that organization’s responsibility description, as
noted in Table 5.1 (Corporation of the Town of Mattawa 2008). These responsibilities help to
implement the developed model in Section 5.1, through defining each particular leader’s role
in the implementation stage. Through these specified assigned responsibilities, community
decision makers are provided instruction to manage the organization during an emergency,
and this leads to a more effective and more efficient operation flow and a more successful
operation overall. These assigned responsibilities help to avoid confusion among the
operational teams and they help to maximize the productivity of all operational components.
The guidelines developed in this section show the application of action items for a
community and their leaders in the event of an emergency event in the community. Evidence
from community emergency planning exercises are applied to the specific cases of the coastal
communities.

M.Sc Systems Science Ilghelich Nadimi
Page | 113
Table 5.1 states the community’s Mayor’s responsibilities as Lead of the local, municipal
government.
No. Action Group Lead
1 Declare an emergency to exist. Municipal Control Group Mayor
2 Declare the emergency terminated Municipal Control Group Mayor
3 Request senior Government assistance Municipal Control Group Mayor
4 Inform other members of Council of
incident status from time to time
Municipal Control Group Mayor
5 Consult with the Administrator/ Clerk/
Treasurer on press releases
Municipal Control Group Mayor
6 Head of Council, and Chair the
meetings of the Municipal Control
Group
Municipal Control Group Mayor
Table 5.1: Mayor’s responsibilities (Source: Corporation of the Town of Mattawa 2008)

M.Sc Systems Science Ilghelich Nadimi
Page | 114
The Table 5.2 outlines the Municipal Control Groups responsibilities during the climate
hazards:
No. Action Group Lead
1 Declaring an emergency to exist Municipal Decision group Mayor
2 Designating emergency areas Municipal Decision group Mayor
3 Authorizing expenditures of funds for
implementing the emergency plan
Municipal Decision group Mayor
4 Evacuating buildings or selections
within an emergency area
Municipal Decision group Mayor
5 Discontinuing utilities or services
provided by public or private concerns
without advising any consumers in the
municipality if necessary
Municipal Decision group Mayor
6 Arranging for accommodation and
welfare on a temporary basis of any
residents who are in need of assistance
due to displacement as a result of the
emergency
Municipal Decision group Mayor
7 Calling in and employment of any
municipal personnel and equipment
which is required in the emergency
Municipal Decision group Mayor
8 Arranging assistance from other
agencies (Volunteers) as may be
required by the emergency
Municipal Decision group Mayor

M.Sc Systems Science Ilghelich Nadimi
Page | 115
9 Establishing a reporting and inquiry
centre to handle individual requests for
information concerning any aspect of
the emergency
Municipal Decision group Mayor
Table 5.2: Responsibilities of the Municipal Control Group (Source: Corporation
of the Town of Mattawa 2008)
The Police force counts as one of the important organizations in the community for
controlling public safety, and helping as part of rescue team. Therefore, the following
responsibilities are defined for the police force in general.
No. Action Group Lead
1 Provide information and advice on law
enforcement matters
Police Force Head of Police
department
2 Control operations at the scene of an
emergency (If necessary)
Police Force Head of Police
department
3 Seal off the area of concern Police Force Head of Police
department
4 Control, and disperse crowds within the
emergency area
Police Force Head of Police
department
5 Control the movement of emergency vehicles
to and from the site of the emergency
Police Force Head of Police
department
6 Coordinate police operations with other
municipal departments and arrange for
additional supplies and equipment when
needed
Police Force Head of Police
department
7 Conduct evacuation of buildings or areas Police Force Head of Police
department

M.Sc Systems Science Ilghelich Nadimi
Page | 116
when ordered by Head of Council
8 Arrange for maintenance or law and order in
temporary facilities
Police Force Head of Police
department
9 Protect property in the emergency area Police Force Head of Police
department
10 Arrange for additional police assistance, if
required
Police Force Head of Police
department
Table 5.3: Police force’s responsibilities (Corporation of the Town of Mattawa
2008)
Since the fire department works as a rescue team in the community, they are prepared for
emergencies as part of their general duties. The Fire Department is one of the important
assets to control the situation during an emergency in the community. Therefore the general
duties named for the Fire Department are as follows (Table 5.4).
No. Action Group Lead
1 Provide Head of Council with
information and advice on firefighting
matters
Fire department Head of Fire
department
2 Develop and maintain a system for
alternating MCG members in an
emergency
Fire department Head of Fire
department
3 Control operations at the scene of an
emergency (If necessary)
Fire department Head of Fire
department
4 Inform the Mutual Aid fire coordinator
and trigger mutual aid arrangements for
the provision of additional firefighting
manpower and equipment (If needed)
Fire department Head of Fire
department
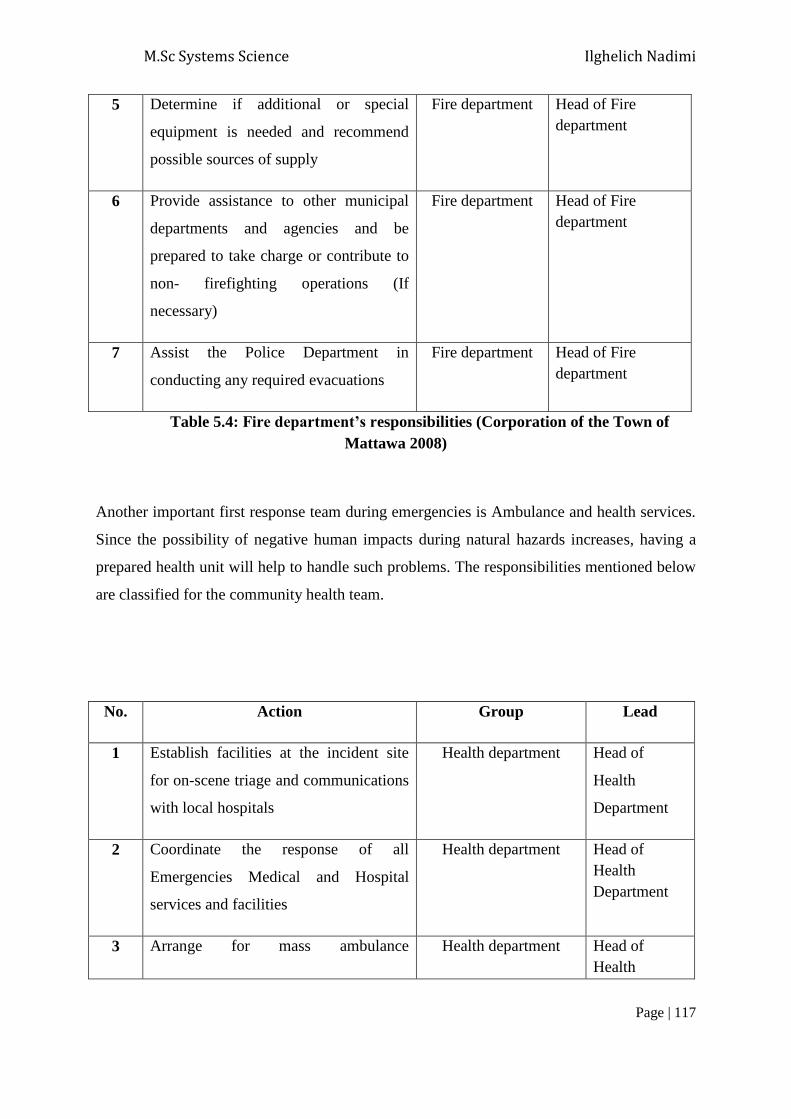
M.Sc Systems Science Ilghelich Nadimi
Page | 117
5 Determine if additional or special
equipment is needed and recommend
possible sources of supply
Fire department Head of Fire
department
6 Provide assistance to other municipal
departments and agencies and be
prepared to take charge or contribute to
non- firefighting operations (If
necessary)
Fire department Head of Fire
department
7 Assist the Police Department in
conducting any required evacuations
Fire department Head of Fire
department
Table 5.4: Fire department’s responsibilities (Corporation of the Town of
Mattawa 2008)
Another important first response team during emergencies is Ambulance and health services.
Since the possibility of negative human impacts during natural hazards increases, having a
prepared health unit will help to handle such problems. The responsibilities mentioned below
are classified for the community health team.
No. Action Group Lead
1 Establish facilities at the incident site
for on-scene triage and communications
with local hospitals
Health department Head of
Health
Department
2 Coordinate the response of all
Emergencies Medical and Hospital
services and facilities
Health department Head of
Health
Department
3 Arrange for mass ambulance Health department Head of
Health

M.Sc Systems Science Ilghelich Nadimi
Page | 118
transportation where required Department
4 Arrange for a balance distribution of
casualties to hospitals.
Health department Head of
Health
Department
5 Arrange for relocation of patients to
other hospitals outside of the
municipality (If necessary)
Health department Head of
Health
Department
6 Coordinate and develop individual
Hospital Contingency Plans
Health department Head of
Health
Department
Table 5.5: Ambulance and health services responsibilities (Corporation of the
Town of Mattawa 2008)
Last but not least here in Table 5.6 community service team’s duties are as follow:
No. Action Group Lead
1 Provide social services assistance to any
person in need of food, accommodation,
clothing, financial and personal
counselling due to the emergency
situation
Health department Head of Health
Department
2 Arrange for the opening, operation,
direction and supervision of sufficient
Emergency Welfare Centres required
providing the immediate emergency
social services needed
Health department Head of Health
Department
3 Arrange for and coordinate assistance
from the volunteer agencies within the
community to carry out the social
services functions (e.g. Red Cross,
Salvation Army, Church Groups, and
Health department Head of Health
Department

M.Sc Systems Science Ilghelich Nadimi
Page | 119
Local Business & Industry)
4 Arrange for the establishment of
registration and inquiry centre or
centres as required with the assistance
of the local Red Cross
Health department Head of Health
Department
5 Advise the Emergency Operations
Control Group if Senior Government
assistance is required for emergency
social services
Health department Head of Health
Department
6 Establish and maintain an internal
Contingency plan for the provision of
emergency social services
Health department Head of Health
Department
Table 5.6: Community services responsibilities (Corporation of the Town of
Mattawa 2008)

M.Sc Systems Science Ilghelich Nadimi
Page | 120
5.3 Family Emergency Plan
After the local organization’s responsibilities are defined, the next step applies to household
responsibilities in the community. This step provides clear milestones for families to help
them to recover faster during natural hazards. In this part, family plans take the form of 72
hours family preparation plans. Such plans have developed in the “Public Safety and
Emergency Preparedness Canada” program which is used as a reference. The main objective
of this plan is to require family units to be prepared to live autonomously without power,
heat, and water for 72 hours after a hazard has happened in the community. This time is
estimated to allow rescue teams time to come to the family with help (Public Safety and
Emergency Prepardness Canada 2011).
Canada’s Public safety and emergency preparedness plan for families has the following steps
in time of emergency as shown in the Table 5.8 below (Public Safety and Emergency
Prepardness Canada 2011).
Step Action Description
1 Identify the escape routes
2 Establish meeting places
3 Plan for children
4 Address special health needs
5 Make plans for pets
6 Make a plan for specific risks
7 Record emergency contact information
Table 5.7: 72 hour plan for families, Source: (Public Safety and Emergency
Prepardness Canada 2011)
M.Sc Systems Science Ilghelich Nadimi
Page | 121
The first step in the plan as shown in the Table 5.7 is “Identifying the escape routes”. In this
part emergency exits from each room of the home, and escape routes from the neighbourhood
in case of evacuation order are determined and communicated to all family members.
In the next step, meeting places (or “muster points”) are established for the family to meet up
at a designated safe place. Note that meeting places should be designated on the same side of
the street as the home, so as to avoid crossing the street into traffic or in front of emergency
vehicles (Public Safety and Emergency Prepardness Canada 2011).
In the third step, specific plans for children are determined in case of an emergency during
school hours when designated persons are responsible for picking up children from daycare
or school. Parents need to make sure that the school or daycare has updated contact
information for parents and caregivers (Public Safety and Emergency Prepardness Canada
2011).
The fourth step addresses special health needs and means that a support network of friends,
relatives, health-care providers, co-workers and neighbours needs to be established who
understand the special needs. At the same time, details about medical conditions, allergies,
surgeries, family medical history, medications, health screenings, recent vaccinations,
emergency contacts and insurance information must be specified with respect to all
household members' special needs (Public Safety and Emergency Prepardness Canada 2011).
After family planning, the fifth step is to have a plan for family pets. The most important
thing to protect pets is to take them with the family if there is need to evacuate. This requires
advance planning as pets are not allowed in some public shelters or hotels.
In the sixth step, a plan is made for the specific risks of the local region. These should be
written down instructions for the risks that are most likely to occur in your region.
In the seventh and final step, families need to record all emergency contact information.
Remember that families maybe separated in the event of a hazard. The family Plan therefore
includes how to meet or contact one another. This includes a discussion among family
members about what to do in different situations (like: fire, storm, and earthquake)and the
recording of the local and out-of-town emergency contact numbers (Public Safety and
Emergency Prepardness Canada 2011).

M.Sc Systems Science Ilghelich Nadimi
Page | 122
Finally, family members should all be aware of the locations of fire extinguishers, water
valves, electrical panels, gas valves and floor drains (Public Safety and Emergency
Prepardness Canada 2011).
During and after their implementation, plans must be continually monitored and data and
equipment regularly updated for improvement purposes in the future. The monitoring phase
plays an important role in future implementation because changes in communities’, families’
and individuals’ needs always occur and can be updated and ready to use for each new
situation.
One of the main community education and communication awareness sources will be the
schools. Schools play a very important role in educating future generations through providing
new information, developing workshops and courses related to the community’s
environmental and climate issues as well as its dynamic vulnerabilities. Therefore, students
will one day be more responsible citizens and, in turn, they can teach and communicate their
new knowledge to their families.
Through these steps, families are encouraged to prepare their own emergency kits. This kit
may be different for each specific family, according to their needs. But, in general, all
emergency kits consist of some basic and essential items (Public Safety and Emergency
Prepardness Canada 2011). These items include:
Water – two litres of water per person per day (include small bottles that can be
carried easily in case of an evacuation order)
Food – that won't spoil, such as canned food, energy bars and dried foods (remember
to replace the food and water once a year)
Manual can opener
Flashlight and batteries
Battery–powered or wind–up radio (and extra batteries)
First aid kit
Special needs items – prescription medications, infant formula or equipment for
people with disabilities.
Extra keys – for your car and house

M.Sc Systems Science Ilghelich Nadimi
Page | 123
Cash – include smaller bills, such as $10 bills (traveller’s cheques are also useful) and
change for payphones
Emergency plan – include a copy of it and ensure it contains in–town and out–of–
town contact information (Public Safety and Emergency Prepardness Canada 2011).
5.4 Conceptual Action plan website output
In this section, as part of the output of this study, a conceptual model of the Action Plan is
presented in the form of an online database and source of reference. This online database is
designed to assist federal decision makers to develop this database resource as a product for
local governments to apply toward the formation of Community Action Plans and Adaptation
Guidelines.
Through this database, local governments develop local action plans specific to their needs
and vulnerabilities. Database inputs are the issues of communities (Steps 1 and 2), the list of
responsible organizations along with their roles (Step 3), and International protocols’ selected
criteria and milestones. Therefore, as shown in Figure 5.2, all the information determined
through the steps discussed earlier is provided as input for this database. The interface is
illustrated in Figure 5.2 below.
Initially, as a local community member, the user chooses the relevant region in the Canada
map. Thus, regarding the chosen region related data will be called in the database.

M.Sc Systems Science Ilghelich Nadimi
Page | 124
Figure 5-2: Database homepage

M.Sc Systems Science Ilghelich Nadimi
Page | 125
Figure 5-3: Database homepage- Issues
In the next step (and screen), as shown in Figure 5.3, issues are chosen that reflect the
communities concerns and vulnerabilities. (Alternative lists of issues appear depending the
region selected at the previous step). Users may choose as many issues as they face in their
community.
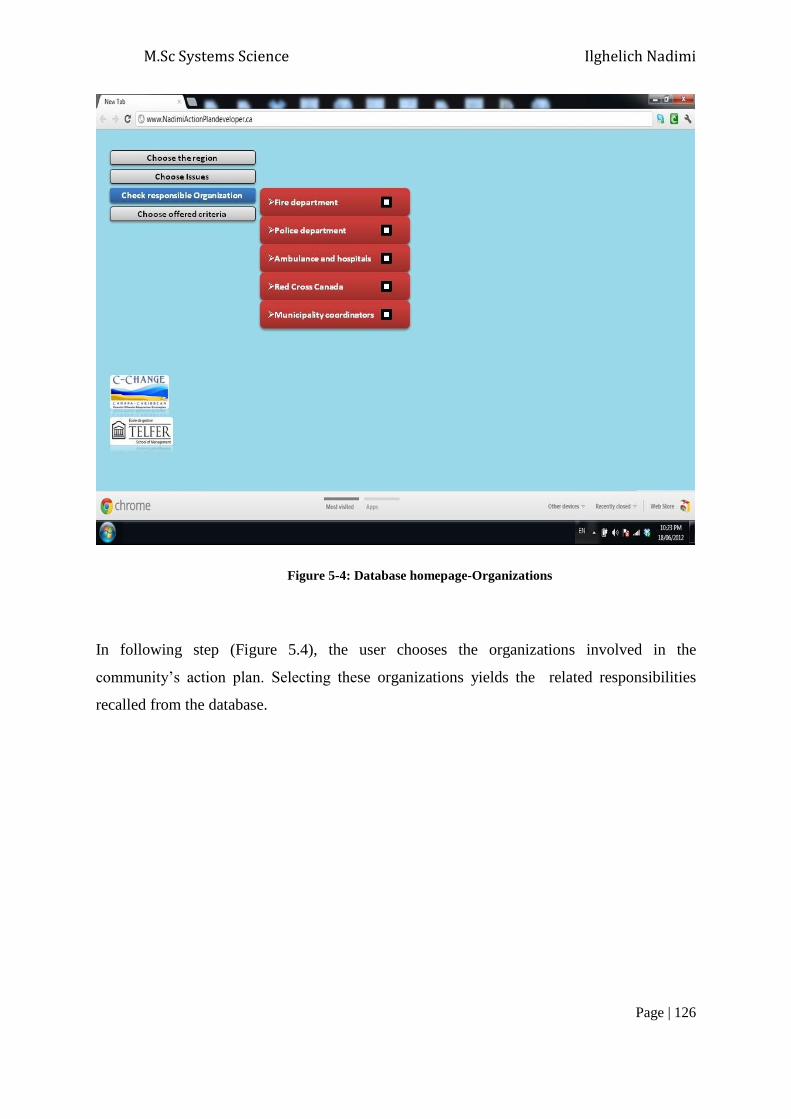
M.Sc Systems Science Ilghelich Nadimi
Page | 126
Figure 5-4: Database homepage-Organizations
In following step (Figure 5.4), the user chooses the organizations involved in the
community’s action plan. Selecting these organizations yields the related responsibilities
recalled from the database.
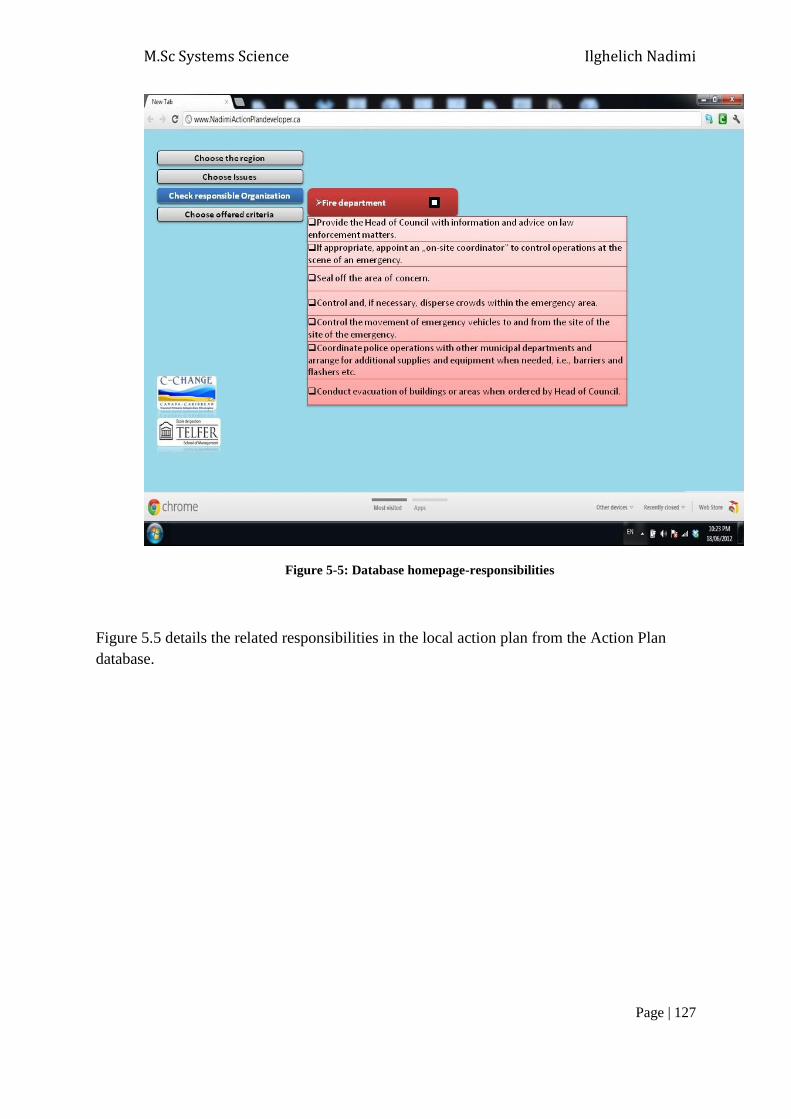
M.Sc Systems Science Ilghelich Nadimi
Page | 127
Figure 5-5: Database homepage-responsibilities
Figure 5.5 details the related responsibilities in the local action plan from the Action Plan
database.

M.Sc Systems Science Ilghelich Nadimi
Page | 128
In the following step, the criteria of the scientific method of problem solving are provided
including the AHP top-level criteria, and subsequent subcriteria (as developed in AHP
model). The user may choose subcriteri that are related to their local climate issues.
Figure 5-6: Database homepage-criteria

M.Sc Systems Science Ilghelich Nadimi
Page | 129
Figure 5-7: Database homepage-Action plan
Finally, after all these steps have been selected, the user can execute the database which then
produces a draft final Community Action Plan that involves: Milestones, description of each
milestone with detailed responsibilities and related action and involved organizations.

M.Sc Systems Science Ilghelich Nadimi
Page | 130
Figure 5-8: Database homepage-modifications
After generating a draft community action plan framework as mentioned in Figure 5.8, the
system allows the user to modify the draft framework to their specific needs and local issues.
After modification, the offered framework can be used in the community as a starting point,
and updating of the plan can take place before final implementation.
In conclusion, this Community Action Plan and Adaptation Guideline framework
development can be used to assist all communities. Further, their feedback systems will
improve and could offer a more developed framework related to the community’s exact
issues and problems.
The following final chapter discusses the findings of this research project, provides a
consolidation of the research results and demonstrates how this work satisfies the objectives
of this project presented in the introduction of the thesis. As well, it recommends how the
proposed framework will facilitate further studies in coastal community adaptation practices.
M.Sc Systems Science Ilghelich Nadimi
Page | 131
6 Conclusions and Recommendations
This chapter summarizes the findings of this research project. The first section of this
chapter provides a consolidation of the research results and demonstrates how this work
satisfies the objectives originally stated in the introduction of the thesis. The second section
of the chapter recommends how the proposed framework will facilitate further studies in
coastal community adaptation practices.
6.1 Conclusions
The conclusions of this study relate to the research objectives presented in Chapter 1. These
objectives are summarized as follows:
1. Identifying the suite of specific protocol and adaptation processes currently in
place through known international initiatives and local case studies.
This objective is fulfilled in the literature review of Chapter 2, Section 2.1 (Global
Adaptation Protocols). The identified International adaptation protocols include ICLEI, FCM,
Care, UNDP, and the EU Commission. The international protocols processes, methods,
milestones, action plans, and applications are presented and analyzed. These initiatives
provide a framework for the development and application of local community-based
adaptation protocols.
2. Defining and applying the scientific method of problem solving as the multi-
criteria framework to compare and evaluate adaptation processes for
international initiatives.
M.Sc Systems Science Ilghelich Nadimi
Page | 132
The scientific method of problem solving is researched and presented in the literature
review of Chapter 2. Further, the steps of the method are detailed in the methodology of
Chapter 3 in order to prepare a formulation of the method in terms of a multi-criteria decision
problem. The formulation corresponds to the hierarchy for an AHP model developed using
the Expert Choice software by applying the prioritized steps of the scientific method of
problem solving to the AHP model hierarchy and evaluated pairwise comparison of the
criteria and sub-criteria attributed to the scientific method. Relative to the AHP problem
formulation, the International protocols are scored to identify the ranking of the protocols for
identification of best practices (Phase 1). In this part, all the international protocols
introduced in Chapter 2 are assessed and the scientific method of problem solving steps are
applied in the AHP Expert Choice software. Regarding the results obtained from AHP and
analysis done among these data, ICLEI and UNDP chosen as the best practices. These two
protocols obtain the highest rank in all criteria as a result of years of experience in the field,
and developing and implementing their framework in partnership with different groups of
communities in developed and developing countries.
3. Applying the adaptation framework to determine best practices for coastal
communities through current protocols, and communities’ vulnerabilities.
As for the analysis of the International protocols through AHP, the same hierarchy
formulation of the scientific method is applied to the set of Canadian C-Change communities
to evaluate and rank the relative performance of the community adaptation procedures. This
work is presented in Chapter 4 and the AHP complete results provided in Appendices E and
F.
Through the assigned measurements among the first level criteria of the defined AHP
hierarchy in Chapter 4 (Figure 4.10), the weighting of the importance of 3 criteria: Problem
identification, Criterion data, and Testing/Sensitivity/Validity are much more than other
criteria in the formulation. Hence, it can be concluded that these factors are more important
than other factors in relation to all components of the problem solving framework.

M.Sc Systems Science Ilghelich Nadimi
Page | 133
4. Detailing the key components and guidelines of coastal communities’ climate
change action plans including identifying roles and responsibilities, and
operational activities of community members from best practices of evidenced-
based examples.
Through the international protocols and previous studies done in this area, an
appropriate framework for applying community adaptation guidelines is developed for the C-
Change communities Action Planning requirement of that project. The work of Chapter 5
presents the community guideline framework, including the community organization (in
general) along with the roles and responsibilities of local government and first responders
during emergency situations. The guidelines also include a household plan for family units to
follow as part of their individual contribution to the overall community action plan.
As final goal of this study, the Action Plan for coastal communities’ adaptation strategies
introduced an online website and database for adaptation action plan content and checklist.
The checklist develops how communities provide the required information of the local
community adaptation action plan.
This guideline framework can be applied to all coastal communities. Expansion of the
community database, input data, and some modification can be used to assist other coastal
communities in Canada and Caribbean toward managing their adaptation strategies.

M.Sc Systems Science Ilghelich Nadimi
Page | 134
6.2 Recommendations for Future Research
This thesis analyzed the International protocols and applied best practices in four Canada C-
Change communities. Further research is suggested in the following areas:
6.2.1 Developing Applications for Community Use
The proposed online database is in its conceptual stage. In the future, researchers can develop
this database through some coding language like: C++ or Java and test among the C-Change
communities in actual area. With ongoing monitoring and reporting of adaptation strategies
(as a required element of the scientific method of problem solving), scholars can update the
database after each implementation so it will be more reliable and useful in the future. The
online database is also a good gateway for communities to share their experiences.
Mobile (cell phone and computer pads) App (i.e., applications) could also be added to the
online database to remind leaders of their responsibilities during the hazard to the person or
organization in charge, and provide emergency contact numbers to members of the
community so that everyone could directly contact people in charge during emergency
situations.
6.2.2 Further Analysis of Cases (and identification of best practices)
In this study, four Canadian C-Change communities introduced and analyzed, for further
research, accurate data should be gathered from these communities to improve the reliability
and validity of the study as well as develop more appropriate framework for the communities,
finalizing the protocols evaluation, using the best practices in protocols to apply to C-Change
communities, continuing ongoing evaluation of C-Change communities, and preparing of
guidelines for each community.

M.Sc Systems Science Ilghelich Nadimi
Page | 135
6.2.3 Further analysis of the AHP hierarchy and a more objective means of assigning
pairwise comparisons and data grid scores
Since International protocols are still in the developing and implementing phase, the data
provided for AHP model in this study may be considered preliminary with respect to how
well these protocols deal with the elements of the problem solving method. Therefore, in
future research, researchers could use actual developed data taken from International
protocols and their implementation results, and apply it in the AHP model.

M.Sc Systems Science Ilghelich Nadimi
Page | 136
Bibliography
Binder, L. W. 2007. Preparing for Climate Change: A Guidebook for Local, Regional, and
State Governments: Washington Water Research Center.
Bruce, J. P., Egener, I. D. M., & Noble, D. 2006. Adapting to Climate Change A Risk-based
Guide for Ontario Municipalities. Natural Resources Canada.
Bruce, J., Egener, M., & Nobel, D. 2005. An overview of the risk management approach to
adaptation to climate change in Canada. Global Change Strategies International.
Retrieved 4/19/2011, from http://www.ccevaluation.org/inventory/464-
GEF/version/1/part/20/data/riskmanagement_approachCanada.pdf?branch=main&lan
guage=en
Climate Guide. 2007. Red Cross/Red Crescent. Retrieved 14/9/2011, from
http://www.climatecentre.org/downloads/File/reports/RCRC_climateguide_intro.pdf
Caldwell, R. 2002. CARE Project Design Handbook. Atlanta: CARE International.
http://pqdl. care. org/practice/Design% 20Monitoring% 20and%
20Evaluation/Forms/By% 20Language. aspx.
California Air Resources Board, California Climate Action Registry, ICLEI - Local
Governments for Sustainability, & The Climate Registry. 2008. Local Government
Operations Protocol For the quantification and reporting of greenhouse gas emissions
inventories. Retrieved 4/1/2012, from
http://www.arb.ca.gov/cc/protocols/localgov/pubs/lgo_protocol_v1_1_2010-05-
03.pdf
CARE International. 2010. Community-Based Adaptation Toolkit. Retrieved 4/19/2011,
from http://www.careclimatechange.org/tk/cba/en/
Carpenter, C. 2008. The Bali Action Plan: Key Issues in the Climate Negotiations. Summary
for Policy Makers. An Environment and Energy Group Publication, UNDP.

M.Sc Systems Science Ilghelich Nadimi
Page | 137
CCP Australia. 2009. MILESTONE 3: ACTION PLAN. Retrieved 2012/06/17, 2012, from
http://www.iclei.org/index.php?id=2480
CNN Wire Staff. 2011. Widespread destruction from Japan earthquake, tsunamis. Retrieved
24/3/2012 from http://articles.cnn.com/2011-03-11/world/japan.quake_1_hokkaido-
tsunami-east-japan-railway?_s=PM:WORLD
Commission of the European Communities. 2009. Adapting to climate change: Towards a
European framework for action. Retrieved 12/3/2012 from
http://www.rdsu.ie/nrn/general/2009/04/adapting-to-climate-change-towards-a-
european-framework-for-action/
Corporation of the Town of Mattawa. 2008. Community Emergency Plan The Corporation of
the Town of Mattawa. Retrieved 1/4/2012 from
http://mattawa.ca/uploads/docs/Emergency_Planning/Community%20Emergency%20
Plan.pdf
Crane Droesch, Mershon, et al. (2008). A Guide to the Vulnerability Reduction Assessment:
13.
Daily Mail. 2011. Japan's apocalypse now: Rescuers pick their way through a wasteland of
bodies, wreckage and people washing in rivers. Retrieved 11/9/2011 from
http://www.dailymail.co.uk/news/article-1366395/Japan-tsunami-earthquake-
Rescuers-pick-way-apocalypse-wasteland.html
Dawson Creek crafts blueprint for sustainable growth 2010. Retrieved 12/9/2011, from
http://www.sustainablecommunities.fcm.ca/files/Newsletters/2008_Newsletters/Febru
ary_2008/Dawson_Creek_Case_Study.pdf
Dazé, A., Ambrose, K., & Ehrhardt, C. 2009. Climate vulnerability and capacity analysis
handbook. Care International.
De Bruin, K., Dellink, R., Ruijs, A., Bolwidt, L., Van Buuren, A., Graveland, J., et al. 2009.
Adapting to climate change in The Netherlands: an inventory of climate adaptation
options and ranking of alternatives. Climatic Change, 95(1), 23-45.
Dolan, A., & Walker, I. 2006. Understanding vulnerability of coastal communities to climate
change related risks. Journal of Coastal Research, 1316-1323.

M.Sc Systems Science Ilghelich Nadimi
Page | 138
Dorland, Tol, et al. (1999). "Vulnerability of the Netherlands and Northwest Europe to Storm
Damage under Climate Change." Kluwer Academic Publishers 43: 513–535.
Droesch, A. C., Mershon, A., Moussa, K. M., Rankine, D., & Santos, A. 2008. A Guide to the
Vulnerability Reduction Assessment: United Nations Development Programme.
Retrieved 18/4/2012, from
http://www.undpadaptation.org/projects/websites/docs/CBA_VRA_Guide_Dec_08.pd
f
EmbassyWorld.com Inc. 2012. Map of Canada: EmbassyWorld.com Inc. Retrieved
27/3/2012, from http://www.embassyworld.com/maps/Maps_Of_Canada/
Environment Canada. 2011. Emergency Management Basics. Retrieved 08/09/2011, from
http://www.ec.gc.ca/ouragans-hurricanes/default.asp?lang=En&n=31DADDF5-1
Epp, M. 2010. Sunshine Coast Community Energy and Emissions Plan. Retrieved
20/6/2012, from http://www.gibsons.ca/sunshine-coast-community-energy-and-
emissions-plan.html
Eszes, R. Regional Municipality of Sudbury: Energy Management and CO2 reduction.
Retrieved 12/6/2011, from
http://www.iclei.org/fileadmin/user_upload/documents/Global/case_studies/ICLEI_C
ase_Study_Sudbury_56_August_2000.pdf
EU-ECCP. 2003. Can we meet our Kyoto targets? : European Commission. Retrieved
12/2/2012, from
http://ec.europa.eu/clima/policies/eccp/docs/second_eccp_report_en.pdf
European Commission. 2010. European Climate Change Programme. Retrieved 21/2/2011,
from http://ec.europa.eu/clima/policies/eccp/index_en.htm
Expert Choice. 2004. Expert Choice (Version 11). Arlington: Expert Choice Inc.
FCM. 2001. Dawson Creek crafts blueprint for sustainable growth. Retrieved 5/4/2011, from
Green Municipal Fund. Federation of Canadian Municipalities:
http://www.sustainablecommunities.fcm.ca/files/Newsletters/2008_Newsletters/Febru
ary_2008/Dawson_Creek_Case_Study.pdf
M.Sc Systems Science Ilghelich Nadimi
Page | 139
FCM. 2009. Partners for Climate Protection. Green Municipal Fund. Retrieved 4/21/2011,
from http://www.sustainablecommunities.ca/files/capacity_building_-
_pcp/pcp_resources/mun-re-_adapting-climate-change-e.pdf
FCM. 2011. Partners for Climate Protection. Retrieved 4/21/2011, from
http://www.fcm.ca/English/view.asp?x=1
Federation of Canadian Municipalities 2011. PCP a Five-Milestone Framework. Retrieved
14/4/2011, from http://www.sustainablecommunities.fcm.ca/Partners-for-Climate-
Protection/PCP_Milestone.asp
Fowler. 2008. Aristotle. Retrieved 5/4/2011, from Virginia University:
http://galileoandeinstein.physics.virginia.edu/lectures/aristot2.html
Furgal, C., & Environmental, I. 2008. Human health in a changing climate: a Canadian
assessment of vulnerabilities and adaptive capacity. Human Health in a Changing
Climate, 1. Retrieved 4/2/2012, from
http://www.cleanair.hamilton.ca/downloads/UWDW08-BERRY-PRES-1C.pdf
GEOSCAN Database. 2012. GEOSCAN Database. Retrieved 2012/06/14, 2012, from
http://geoscan.ess.nrcan.gc.ca/geoscan-index.html
Google Inc (Cartographer). 2012. Map
Greater Sudbury. 2010. EarthCare Sudbury Action Plan 2010. Retrieved 2012/06/17, 2012,
from,http://www.greatersudbury.ca/cms/index.cfm?app=div_earthcare&lang=en&cur
rID=9703
Greater Sudbury. 2012. Participating Retailers. Retrieved 2012/04/17, 2012, from
http://www.greatersudbury.ca/cms/index.cfm?app=div_earthcare&lang=en&currID=6
781&parID=6765
Hartt, M. 2010. Geographic Systems and Systems Dynamics-Modelling the Impacts of
Climate Change on Coastal Communities. University of Ottawa.
Hennessey, R., Jones, S., Duerden, F., & Swales, S. 2009. Community Adaptation Project:
Dawson Climate Change Adaptation Plan. Northern Climate Exchange

M.Sc Systems Science Ilghelich Nadimi
Page | 140
Home Inventory. 2008. Canada Home Inventory - Natural Disasters. Retrieved 14/4/2012,
from http://www.canadahomeinventory.com/Natural_Disasters.htm
Horton, & O’Grady, M. 2009. Climate Risk Information: New York City Panel on Climate
Change. New York City Panel on Climate Change.
ICLEI. 2008. About ICLEI. Retrieved 4/6/2011,from http://www.iclei.org/index.php?id=744
International Community-University Research Alliance (ICURA). 2007. Coastal Climate
Adaptation Strategies Retrieved 18/3/2011, from
http://www.coastalchange.ca/index2.html
IPCC. 2007. Climate Change 2007:Synthesis Report. Valencia, Spain: Intergovernmental
Panel on Climate Change.
Jackson, Barry, & Marzok. 2008. Changing Climate,Changing Communities: Guide and
Workbook for Municipal Climate Adaptation. ICLEI – Local Governments for
Sustainability, Canada Office. 17/2/2012, from
http://fcm.ca/Documents/tools/PCP/changing_climate_changing_communities_guide
_for_municipal_climate_adaptation_EN.pdf
Klein, J. 2004. Francis Bacon. The Stanford Encyclopaedia of Philosophy, Fall.
Lane, D.E. 2007. PLANNING IN FISHERIES RELATED SYSTEMS: Multicriteria models
for decision support. In Bjorndal, T. (ed.) Handbook on Operations Research in
Natural Resources. International Series in Operations Research and Management
Science. Springer. 237-272.
Lane, D. E., Watson, P., & St, M. 2010. Managing adaptation to environmental change in
coastal communities: Canada and the Caribbean.
Lawrence, M. B., & Blake, E. S. 2002. Tropical Cyclone Report-Hurricane Gabrielle.
Retrieved 15/6/2011 from http://www.nhc.noaa.gov/2001gabrielle.html
Lee, Yoon, & Kim. 2007. A study on making a long-term improvement in the national energy
efficiency and GHG control plans by the AHP approach. Energy Policy, Volume 35.
Lemmen, D. S., Warren, F. J., Lacroix, J., & Bush, E. 2008. from Impacts to Adaptation:
Canada in a Changing Climate 2007. Government of Canada, Ottawa, ON. Retrieved
M.Sc Systems Science Ilghelich Nadimi
Page | 141
24/3/2012, from http://www.nrcan.gc.ca/sites/www.nrcan.gc.ca.earth-
sciences/files/pdf/assess/2007/pdf/full-complet_e.pdf
MCCAC. 2009. Municipal Climate Change Action Plan: Government of Alberta. Retrieved
15/3/2012, from http://mccac.ca/site-admin/file-
manager/files/Resources/Reports/Municipal%20Climate%20Change%20Action%20P
lan%20September%201.pdf
Metro Vancouver. 2012. Integrated Stormwater Management PlansLessons Learned to 2011.
Richmond: Urban Systems Ltd. Retrieved 15/3/2012 from
http://www.metrovancouver.org/about/publications/Publications/ISMP_Lessons_Lear
ned-April_2012.pdf
Metro Vancouver. 2010. Local Governments of Metro Vancouver. Retrieved 15/3/2012 from
http://www.metrovancouver.org/about/maps/Maps/Municipalities.pdf
Metro Vancouver. 2001. Greater Vancouver Regional District Liquid Waste Management
Plan: Metro Vancouver. Retrieved 15/3/2012 from
http://www.metrovancouver.org/about/publications/Publications/LiquidWasteManage
mentPlan2001.pdf
Müller, L., & Jol, A. 2012. EU GHG Monitoring Mechanism: European Commission.
National Round Table on the Environment and the Economy. 2009. True North: Adapting
Infrastructure to Climate Change in Northern Canada.
New Brunswick Emergency Measures Organization. 2001. Planning Guide for the
Emergency Operations Centre: Government of New Brunswick. Retrieved 12/1/2012
from http://www2.gnb.ca/content/dam/gnb/Departments/ps-sp/pdf/emo/opscentre-
e.pdf
Nicholls, R. J., P.P. Wong, V.R. Burkett, J.O. Codignotto, J.E. Hay, R.F. McLean, et al.
2007. Coastal systems and low-lying areas. Cambridge University Press, Cambridge,
UK,.

M.Sc Systems Science Ilghelich Nadimi
Page | 142
Nielsen, D. 2007. The City of Iqaluit's Climate Change Impacts, Infrastructure Risks and
Adaptive Capacity Project: Indian & Northern Affairs Canada’s Aboriginal and
Northern Community Action Program.
NOAA Coastal Services Center. 2009. Local Strategies for Addressing Climate Change: The
National Oceanic and Atmospheric Administration (NOAA) Retrieved 17/3/2012,
from http://www.csc.noaa.gov/magazine/climatechangestrategies.pdf
Noble, D., Bruce, J., & Egener, M. 2005. An overview of the risk management approach to
adaptation to climate change in Canada: Ottawa: Global Change Strategies
International.
Norman. 2008. Principles for an intergovernmental agreement for coastal planning and
climate change in Australia. Habitat International.
Ontario Ministry of Environment and Energy. 2012. Incentives Programs for Home.
Retrieved 2012/06/17, from http://www.energy.gov.on.ca/en/incentives-program-for-
home/
Pakdel, S. 2011. System dynamics and GIS in the simulation of environmental change to
coastal communities. Master’s Program in Systems Science Thesis. University of
Ottawa.
Peterson, D. 2011. Climate Action Planning Breakout Session: National Renewable Energy
Laboratory (NREL).
Public Safety and Emergency Prepardness Canada. 2011. Emergency Preparedness guide:
Government of Canada.
Richardson. 2010. Adapting to Climate Change: An Introduction for Canadian
Municipalities. Natural Resources Canada.
Saaty, T. L. 2008. Decision making with the analytic hierarchy process. Int. J. Services
Sciences.
Saaty, T. L. 1977. A Scaling Method for Priorities in Hierarchial Structures. Journal of
Mathematical Psychology, 15(3), 234–281.
Saaty, T. L. 1980. Analytic hierarchy process: Wiley Online Library.

M.Sc Systems Science Ilghelich Nadimi
Page | 143
Schiermeier, Q. (2011). "Increased flood risk linked to global warming." Nature 470(316 ).
Stinner, A. 2003. Scientific Method, Imagination, and The Teaching of Physics. Physics in
Canada, 59(6). Retrieved 11/3/2012 from
http://www.hsse.uwinnipeg.ca/Publications/Scientific%20Method.pdf
Suomalainen, E. 2006. Multicriteria analysis and visualization of location-allocation
problems. Master's thesis, Department of Engineering Physics and Mathematics,
University of Helsinki.
Sustainable Resource Development Government of Alberta. 2010. Climate Change
Adaptation Framework Manual. Retrieved 1/4/2012from
http://www.srd.alberta.ca/MapsPhotosPublications/Publications/documents/ClimateC
hangeAdaptationFrameworkManual-April%202010.pdf
Taylor, B. W. 2001. Introduction to Management Science Prentice Hall.
Taylor III, B. W. 2007. Introduction to management science: Prentice-Hall, Inc.
The City of Toronto (2012). "Green Roof Bylaw." , Retrieved 1/6/2012,from
http://www.toronto.ca/greenroofs/overview.htm.
The City of Toronto. 2012. The Heat Alert System. 2012, Retrieved 1/6/2012,from
http://www.toronto.ca/health/heatalerts/alertsystem.htm
The City of Toronto (2012). "Toronto Green Standard." , Retrieved 1/6/2012, from
http://www.toronto.ca/planning/environment/index.htm.
The Toronto Environment Office, & The City of Toronto Climate Adaptation Steering Group
2008. Ahead of the Storm: Preparing Toronto for Climate Change. City of Toronto
Climate Change Adaptation Project. from,
http://www.toronto.ca/teo/pdf/ahead_of_the_storm.pdf
TheStar. 2010. Hurricane Igor rips into Nfld., washing out roads, toppling trees. Retrieved
4/27/2011, from http://www.thestar.com/news/canada/article/864119--hurricane-igor-
rips-into-nfld-washing-out-roads-toppling-trees
Thompson. 2011. Japan's Tsunami: How It Happened. Retrieved 15/2/2012, from
http://www.livescience.com/13180-japan-tsunami-earthquake-explained.html
M.Sc Systems Science Ilghelich Nadimi
Page | 144
Thornton. 2009. Karl Popper. Retrieved 5/2/2011, from The Stanford Encyclopedia of
Philosophy http://plato.stanford.edu/archives/sum2009/entries/popper/
UNDP. 2007. Adaptation to climate change: Doing development differently: United Nations
Development Programme. Retrieved 5/2/2012, from
http://www.pacificdisaster.net/pdnadmin/data/original/UNDP_2007_AdaptationBrief
Nov071.pdf
UNDP. 2008. Climate Change at UNDP: Scaling Up to Meet the Challenge: UNDP
Environment and Energy Group. Retrieved 21/7/2012, from
http://www.undp.org/content/dam/aplaws/publication/en/publications/environment-
energy/www-ee-library/climate-change/climate-change-at-undp-scaling-up-to-meet-
the-challenge-september-2008/UNDP_CC_Strategy.pdf
UNDP-APF. 2012. Adaptation Policy Framework (APF). Retrieved 21/7/2012, from
http://content.undp.org/go/newsroom/publications/environment-energy/www-ee-
library/climate-change/adaptation-policy-framework-apf-.en
UNDP-GEF. 2012. Climate Change Adaptation. Retrieved 20/7/2012, from
http://web.undp.org/gef/do_cc_adaptation.shtml
UNFCC. 1998. Kyoto Protocol to the United Nations Framework Convention on Climate
Change. Retrieved 2012/06/12, from http://unfccc.int
United Nations Development Programme. 2012. Climate Change. Retrieved 20/7/2012 from
http://www.undp.org/content/undp/en/home/ourwork/environmentandenergy/strategic
_themes/climate_change.html
United Nations Development Programme. 2012. Green, Low-Emission and Climate-Resilient
Development Strategies. Retrieved 28/7/2012, from
http://www.undp.org/content/undp/en/home/ourwork/environmentandenergy/focus_ar
eas/climate_strategies.html
United Nations secretariat of the International Strategy for Disaster Reduction (UNISDR).
2010. Local Governments and Disaster Risk Reduction: United Nations.
Warren,F.J. 2004. Climate Change Impacts and Adaptation: A Canadian Perspective: Natural
Resources Canada. Retrieved 8/2/2012, from
M.Sc Systems Science Ilghelich Nadimi
Page | 145
http://www.nrcan.gc.ca/sites/www.nrcan.gc.ca.earth-
sciences/files/pdf/perspective/pdf/report_e.pdf
Wheeler, J. 2010. Edmonton’s Urban Forest Management Plan. Retrieved 2012/06/17, from
http://www.nrcan.gc.ca/earth-sciences/climate-change/community-
adaptation/municipalities/682
Xu, L. and J. B. Yang (2001). "Introduction to Multi-Criteria Decision Making and the
Evidential Reasoning Approach." University of Manchester Institute of Science and
Technology.2012/12/01
Zeleny, M. (1998). "Multiple criteria decision making: eight concepts of optimality." Human
Systems Management.2012/12/01
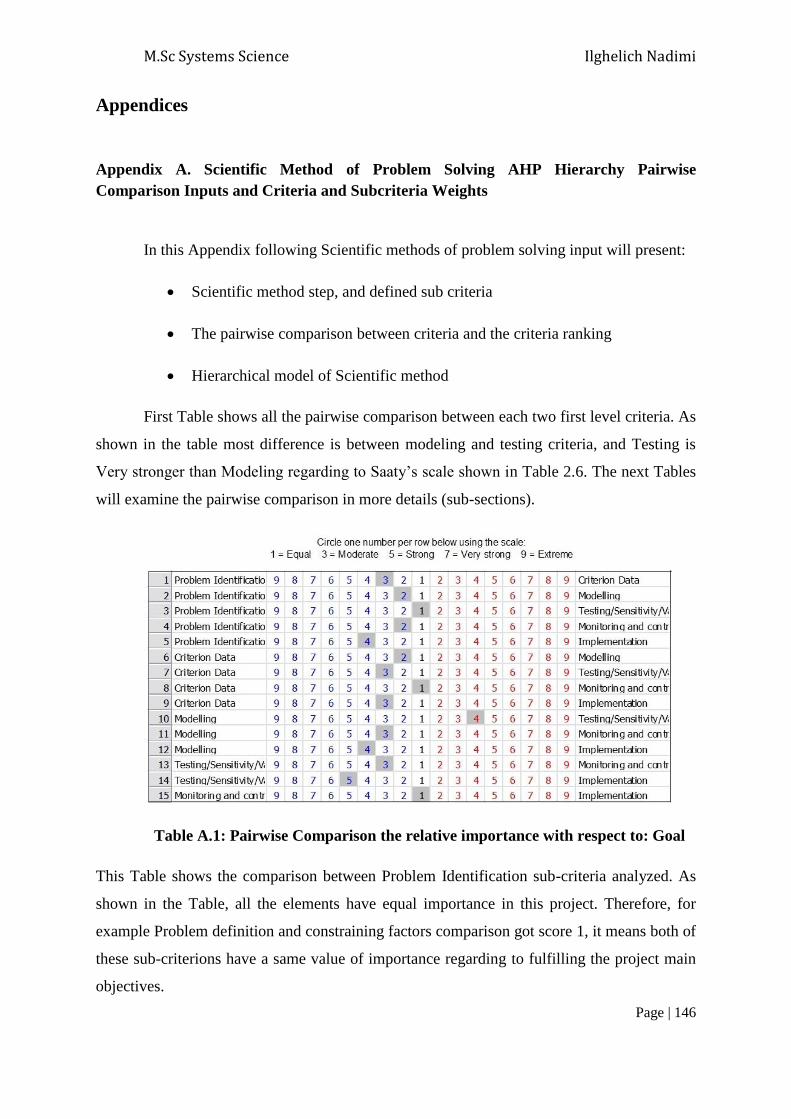
M.Sc Systems Science Ilghelich Nadimi
Page | 146
Appendices
Appendix A. Scientific Method of Problem Solving AHP Hierarchy Pairwise
Comparison Inputs and Criteria and Subcriteria Weights
In this Appendix following Scientific methods of problem solving input will present:
Scientific method step, and defined sub criteria
The pairwise comparison between criteria and the criteria ranking
Hierarchical model of Scientific method
First Table shows all the pairwise comparison between each two first level criteria. As
shown in the table most difference is between modeling and testing criteria, and Testing is
Very stronger than Modeling regarding to Saaty’s scale shown in Table 2.6. The next Tables
will examine the pairwise comparison in more details (sub-sections).
Table A.1: Pairwise Comparison the relative importance with respect to: Goal
This Table shows the comparison between Problem Identification sub-criteria analyzed. As
shown in the Table, all the elements have equal importance in this project. Therefore, for
example Problem definition and constraining factors comparison got score 1, it means both of
these sub-criterions have a same value of importance regarding to fulfilling the project main
objectives.

M.Sc Systems Science Ilghelich Nadimi
Page | 147
Table A.2: Comparison the relative importance with respect to Problem Identification
After assessing the sub-criteria of the problem identification in previous Table, below
Table shows the comparison and relationship between each two sub-criterion under the
Criterion Data.
Table A.3: Comparison the relative importance with respect to Criterion Data
This Table shows the comparison between the criteria under the Modeling exposed
this factor has almost two different group of criterion and some of them are much more
important than others.
Table A.4: Comparison the relative importance with respect to Modeling

M.Sc Systems Science Ilghelich Nadimi
Page | 148
Testing has just three sub-criteria, and pairwise comparison with them shows Robustness is
almost equal with both other sub-criteria (Analysis in place, and Feedback for adjustment),
but the Analysis in place is slightly more important than Feedback for adjustment.
Table A.5: Comparison the relative importance with respect to Testing
Same as Testing, Monitoring has three sub-criteria, and as shown in the Table below.
Monitoring experiencing same phenomena as experienced in Testing in comparison between
the sub-criteria. In this Table pairwise comparison shows Switching capabilities almost have
equal value as other two sub-criteria (Control process, and Advantage and ongoing
objectives), but the Advantage and ongoing objectives is slightly more important than
Control process.
Table A.6: Comparison the relative importance with respect to Monitoring
The last pairwise comparison done between the Implementation factor’s two criteria
(Evidence of result, Guideline of design model), through the information provided in
previous chapter (Chapter 2, Chapter 3), and regarding to study’s main objectives decided
Guideline of design model is moderately important than Evidence of result because without
the Guideline of design model the Evidence of result does not make sense and we have to
develop guideline first.
Table A.7: Comparison the relative importance with respect to Implementation
The Analytical Hierarchy Process (AHP) result shows the hierarchy developed
through scientific method of problem solving steps among the coastal communities.

M.Sc Systems Science Ilghelich Nadimi
Page | 149
Figure A.1: Detail AHP hierarchy model for the Scientific Method of Problem Solving
formulation
The output results analyzed are shown in the Figure below, the measurement shown
regarding the first level elements of the defined hierarchy. In this Figure the importance of 3
elements: Problem identification, Criterion data, and Testing/Sensitivity/Validity are more
heavily weighted than other elements and account for a combined 72.5% of the hierarchy
total weight (of 100%). Hence we can conclude these factors are more important than other
factors in relevance to the decision of managing community adaptation.

M.Sc Systems Science Ilghelich Nadimi
Page | 150
Figure A.2: Main Criteria’s final scores

M.Sc Systems Science Ilghelich Nadimi
Page | 151
Appendix B. Data Grid Utility Function
The Analytical Hierarchy Process (AHP) results shows data Grid utility curves, these
curves as shown below are divided in different parts, in this case two sample curve chosen
here to compare as shown in the Figures below, first curve belong to Advantage and ongoing
verification of objectives, and the other one belong to robustness criterion; in first curve due
to errors (qualitative errors) it cannot be distinguished, therefore all scores higher than 6 can
be considered acceptable.
On the other hand because middle part of the scale, statistically is the most selected
area in the researches so in this study scores in this area kept close.
As in qualitative studies the worst or the lowest score should be very different than
the scores are one level higher because statistically worst score in research is marked (closed)
when the parameter is really low on that particular analysis.
As shown here for robustness curve, we divided the curve in two parts, one is less
than 4 and other part is more than 4. It means that for this curve the values less than 4 are not
acceptable and all the given values to protocols, if more than 4, are almost the same and they
are acceptable.

M.Sc Systems Science Ilghelich Nadimi
Page | 152
Figure B.1: Data Grid output curves
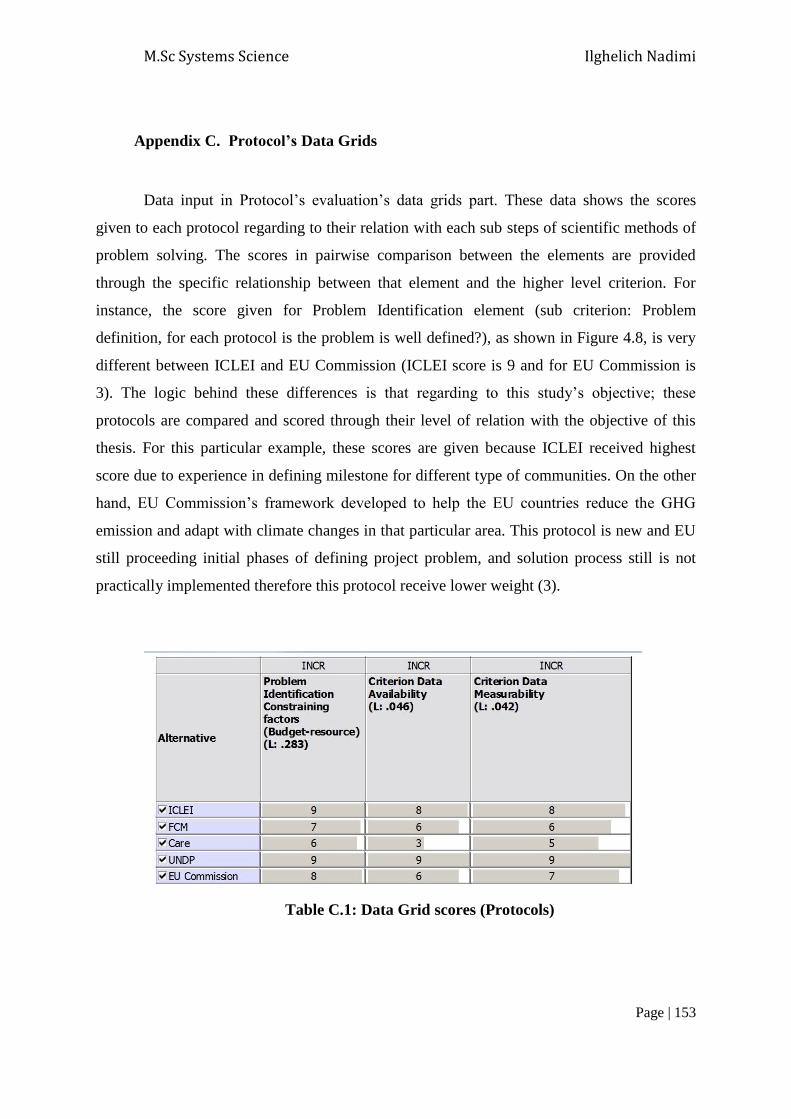
M.Sc Systems Science Ilghelich Nadimi
Page | 153
Appendix C. Protocol’s Data Grids
Data input in Protocol’s evaluation’s data grids part. These data shows the scores
given to each protocol regarding to their relation with each sub steps of scientific methods of
problem solving. The scores in pairwise comparison between the elements are provided
through the specific relationship between that element and the higher level criterion. For
instance, the score given for Problem Identification element (sub criterion: Problem
definition, for each protocol is the problem is well defined?), as shown in Figure 4.8, is very
different between ICLEI and EU Commission (ICLEI score is 9 and for EU Commission is
3). The logic behind these differences is that regarding to this study’s objective; these
protocols are compared and scored through their level of relation with the objective of this
thesis. For this particular example, these scores are given because ICLEI received highest
score due to experience in defining milestone for different type of communities. On the other
hand, EU Commission’s framework developed to help the EU countries reduce the GHG
emission and adapt with climate changes in that particular area. This protocol is new and EU
still proceeding initial phases of defining project problem, and solution process still is not
practically implemented therefore this protocol receive lower weight (3).
Table C.1: Data Grid scores (Protocols)

M.Sc Systems Science Ilghelich Nadimi
Page | 154
Table C.2: Data Grid scores (Protocols)
Table C.3: Data Grid scores (Protocols)

M.Sc Systems Science Ilghelich Nadimi
Page | 155
Table C.4: Data Grid scores (Protocols)
Table C.5: Data Grid scores (Protocols)

M.Sc Systems Science Ilghelich Nadimi
Page | 156
Table C.6: Data Grid scores (Protocols)

M.Sc Systems Science Ilghelich Nadimi
Page | 157
Appendix D. Protocol’s AHP output
All the scores for each protocol calculated through summation of scores given to scientific
method elements (Figure 4.1) (Problem identification, Criterion data, Modeling, Testing,
Monitoring, and Implementation) under that particular protocol.
Consequently, this Figure provided the final score for each protocol after abovementioned
calculation done for each protocol. Regarding the result shown in Figure below, the scores for
ICLEI (22.3%) and UNDP (22.6%) have slightly higher than other protocols due to their
extent of activity ( These two protocols are expanded their scope in all different kind of
communities; rural, urban, in developing and developed countries).
Figure D.1: International Protocols final AHP overall scores
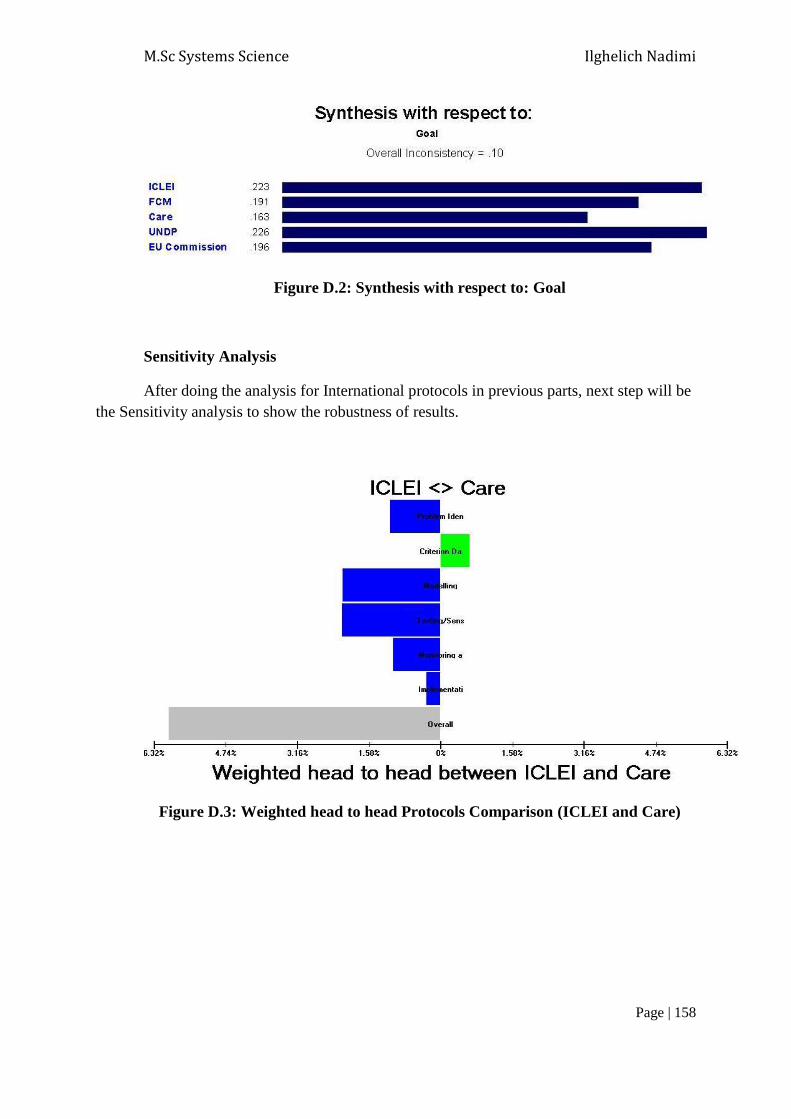
M.Sc Systems Science Ilghelich Nadimi
Page | 158
Figure D.2: Synthesis with respect to: Goal
Sensitivity Analysis
After doing the analysis for International protocols in previous parts, next step will be
the Sensitivity analysis to show the robustness of results.
Figure D.3: Weighted head to head Protocols Comparison (ICLEI and Care)

M.Sc Systems Science Ilghelich Nadimi
Page | 159
Figure D.4: Weighted head to head Protocols Comparison (ICLEI and EU)
Figure D.5: Weighted head to head Protocols Comparison (ICLEI and FCM)

M.Sc Systems Science Ilghelich Nadimi
Page | 160
Figure D.6: Weighted head to head Protocols Comparison (ICLEI and UNDP)
Protocol’s comparison
As shown in figures below UNDP and ICLEI are very close to each other and both of
them have much higher score than other protocols in all criteria. The highest score belongs to
modeling criterion and again ICLEI and UNDP with almost 9 have highest score in this
criterion, and CARE with 3 get lowest score. Furthermore, the lowest score for all protocols
is in implementation part due to progress of implementation of all these protocols.

M.Sc Systems Science Ilghelich Nadimi
Page | 161
Fi
gure D.7: Protocol’s comparison

M.Sc Systems Science Ilghelich Nadimi
Page | 162
Appendix E. Communities Data Grid’s
Data input in Communities evaluation’s data grids part. These data shows the scores given to
each Community regarding to their relation with each sub steps of scientific methods of
problem solving. The scores in pairwise comparison between the elements are provided
through the specific relationship between that element and the higher level criterion. For
instance the score given for problem identification element (sub criterion: Constraining
factors, Budget-resource) as shown in Figure 4.9 is almost same for all communities but in
closer look Gibsons and Charlottetown have higher score than Iqaluit and Isle Madame, these
scores given because Gibsons is a rich community and have resources infrastructures to
develop the framework in the community on the other hand Charlottetown is one of the
communities developed so many local action plans so have a huge database about community
situation and forecasted analysis about future climate impact, therefore this two communities
get slightly more scores than other two communities regarding to this criterion (Constraining
factors, Budget-resource).
Table E.1: Data Grid scores (Communities)

M.Sc Systems Science Ilghelich Nadimi
Page | 163
Table E.2: Data Grid scores (Communities)
Table E.3: Data Grid scores (Communities)
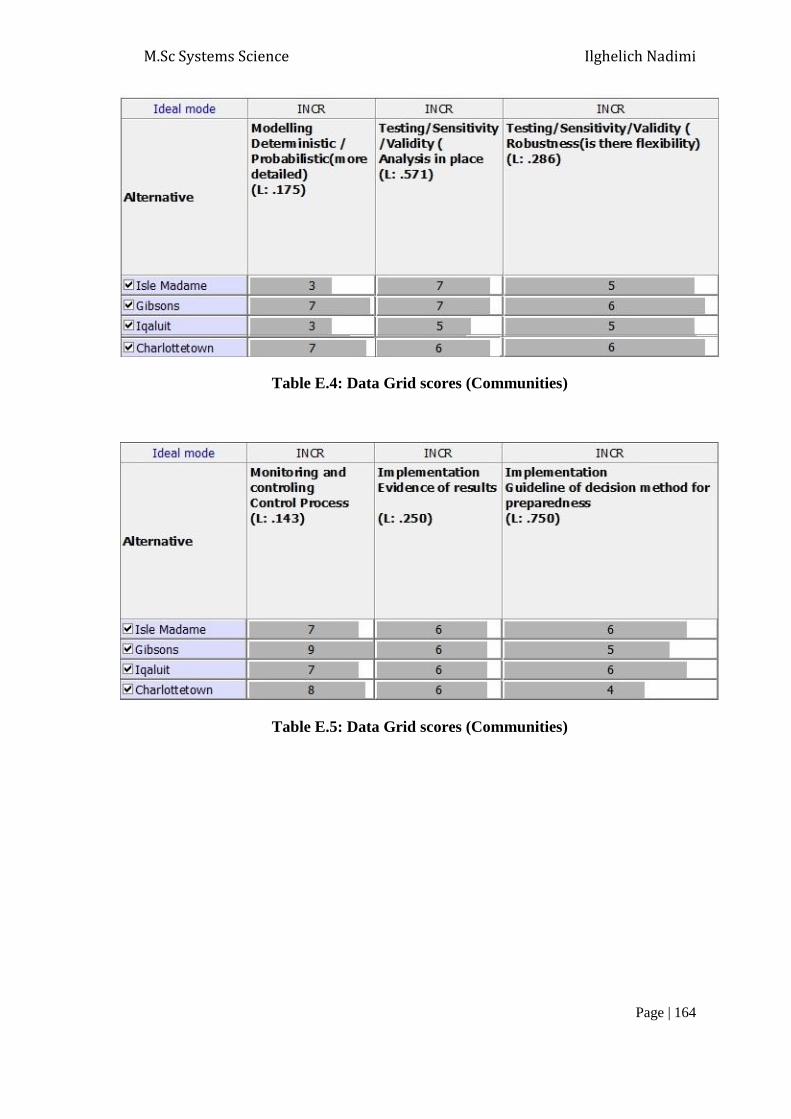
M.Sc Systems Science Ilghelich Nadimi
Page | 164
Table E.4: Data Grid scores (Communities)
Table E.5: Data Grid scores (Communities)

M.Sc Systems Science Ilghelich Nadimi
Page | 165
Table E.6: Data Grid scores (Communities)

M.Sc Systems Science Ilghelich Nadimi
Page | 166
Appendix F. C-Change Communities AHP output.
Analytical Hierarchy Process (AHP) results from communities’ evaluation. In figures below
all the scores came from pairwise comparison of the protocol shown.
All the scores for each community calculated through summation of scores given to scientific
method elements (Figure 4.1) (Problem identification, Criterion data, Modeling, Testing,
Monitoring, and Implementation) under that particular protocol.
Consequently, this Figure provided the final score for each community after
abovementioned calculation done for each community. Regarding the result shown in Figure
above, even all communities almost receive similar result, still Gibsons and Charlottetown
have higher rank than other two communities, due to their extent of activity ( These two
communities are active in developing local action plans, have established historic database
about past climate impacts and expert staffs ).
Figure F.1: Communities final AHP overall scores

M.Sc Systems Science Ilghelich Nadimi
Page | 167
Table F.1: Communities final AHP overall scores
Sensitivity Analysis
After doing the analysis for C-Change communities in previous parts, next step will
be the Sensitivity analysis to show the robustness of results.
Figure F.2: Weighted head to head Communities Comparison (Isle Madame and
Gibsons)
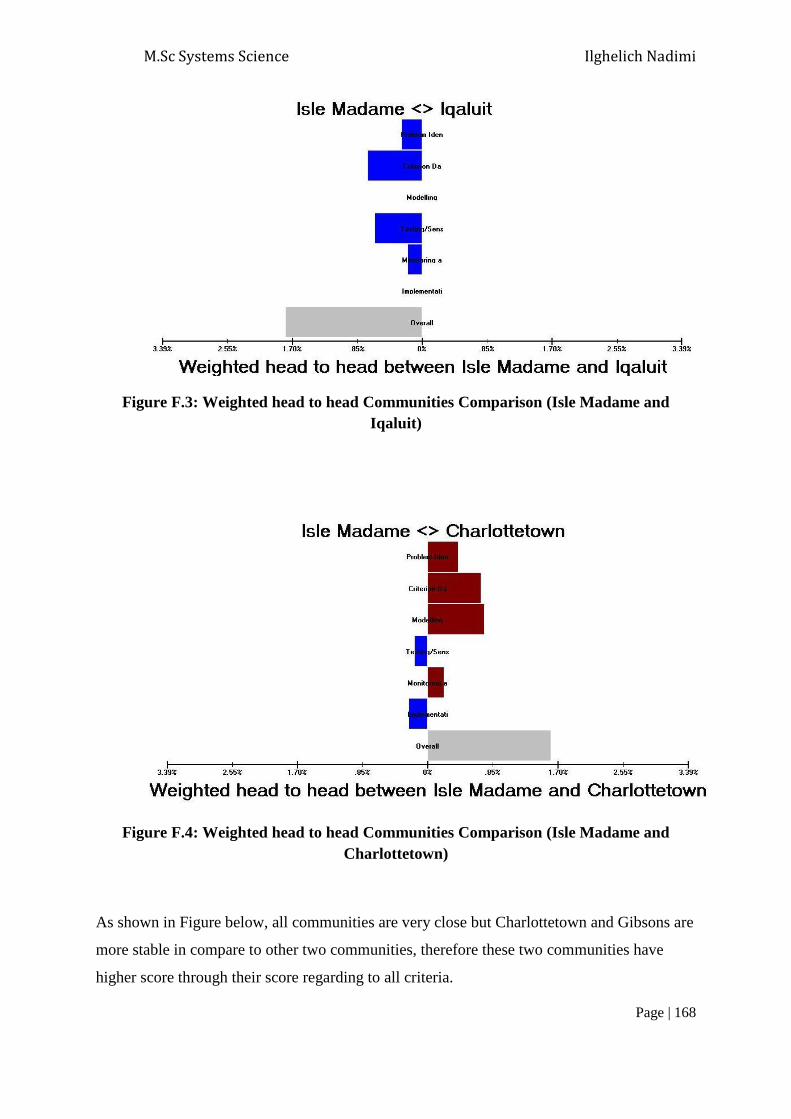
M.Sc Systems Science Ilghelich Nadimi
Page | 168
Figure F.3: Weighted head to head Communities Comparison (Isle Madame and
Iqaluit)
Figure F.4: Weighted head to head Communities Comparison (Isle Madame and
Charlottetown)
As shown in Figure below, all communities are very close but Charlottetown and Gibsons are
more stable in compare to other two communities, therefore these two communities have
higher score through their score regarding to all criteria.

M.Sc Systems Science Ilghelich Nadimi
Page | 169
Figure F.4: Communities Comparison
Binder, L. W. (2007). Preparing for Climate Change: A Guidebook for Local, Regional, and
State Governments, Washington Water Research Center.