coastal acid sulfate soil processes in barker inlet, south
TRANSCRIPT
Coastal acid sulfate soil processes in Barker Inlet, South
Australia
Doctor of Philosophy
The University of Adelaide
School of Earth and Environmental Sciences
Brett P. Thomas
September 2010
6. Soil morphology – Gillman study site
94
C h a p t e r S i x
6. Soil morphology and acid sulfate soil characterisation of the
Gillman study site
The prime objective of this chapter is to identify and characterise representative
descriptive toposequence processes models for the non-tidal and intertidal areas of the
Gillman study site by summarising key soil morphological and classification
information across each toposequence.
Gillman is located on the southern side of the Barker inlet, about 10 km south of the St
Kilda study site (Figure 3-1). Due to the large size (close to 800 ha) and environmental
heterogeneity of the Gillman study site, four focus areas were selected for detailed
study. The focus areas were selected to best represent the hydrological and pedological
characteristics of the site, and cumulatively covered 11 of the 12 mapping units defined
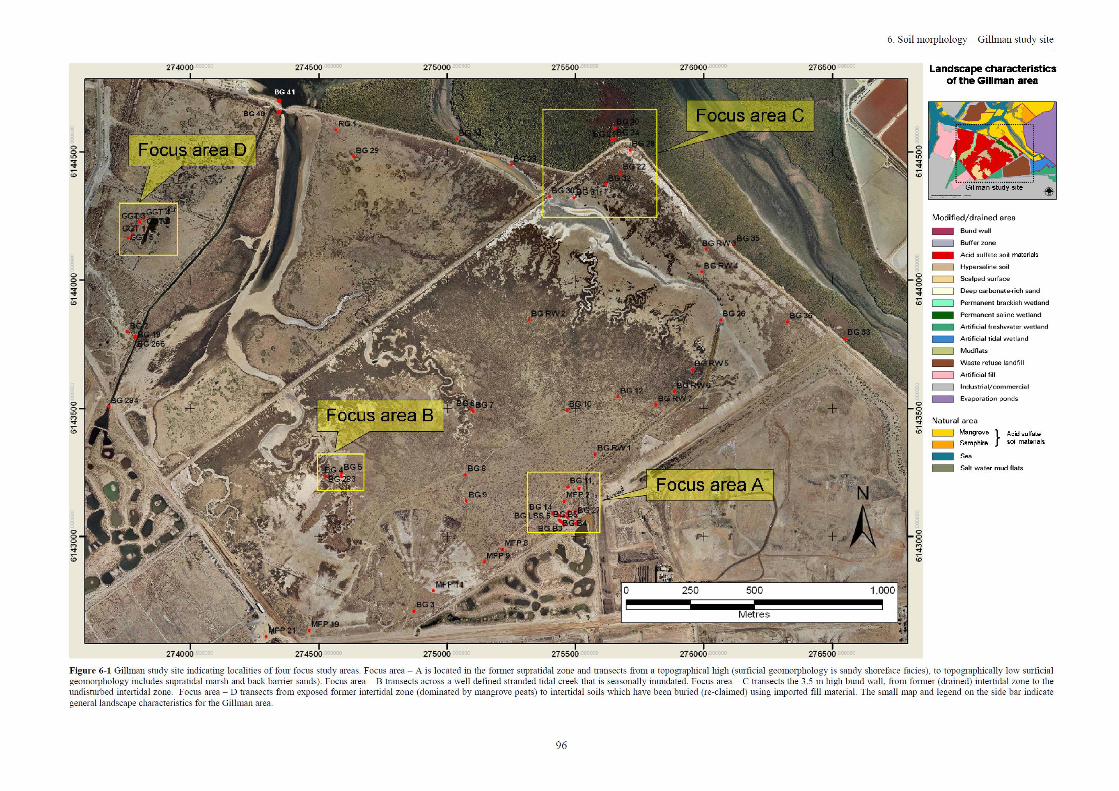
in Table 6-1. Focus area A was located about 1 km south of the bund wall and traversed
from a prominent position in the landscape to a low lying position at the outlet pond of
the ‘Range wetlands’ (Figure 6-1). Focus area A contained map units 1 (Water), 3 (Salt
scalded mud flats), 5 (Open low scrub and grasses) and 6 (Open grass plain and shrub).
Focus area B was located about 1 km to the west of Focus area A and traversed from an
elevated position in the landscape (map unit 6) to the bed of a former tidal creek
representing map unit 2 (benthic mat and bare salt scalded mud flat). Focus area C
traversed across the bund wall at the centre north of the study site (Figure 6-1). On the
drained side of the bund wall Focus area C contained map units 1 (Water), 2 (Benthic
mat and bare salt scalded mud flat), 3 (Salt scalded mud flats) and 4 (Dense low heath –
samphire shrublands). On the tidal (north) side of the bund wall Focus area C contained
map units 9 (Water), 10 (Mangrove woodlands) and 11 (Low growing salt marsh plants)
(Table 6-1). Focus area D was located at the far western portion of the Gillman study
site, within the Magazine creek ponding basin (Figure 6-1). Focus area D traversed from
the top of a 4.5 m high mound constructed using artificial fill materials (map unit 8) to a
low lying area covered by map unit 4 (Dense low heath - samphire shrublands) (Table
6-1). Soil morphology and acid sulfate soil characteristics for ‘type’ profiles (Table 6-1)
6. Soil morphology – Gillman study site
95
are described in the following sections and represent soil types from each of the map
units.
To make the chapter length manageable, only one soil profile from each of the map units
is described in detail in the text. The other ‘type’ profiles are summarised here, and full
descriptions are provided in Appendix B.
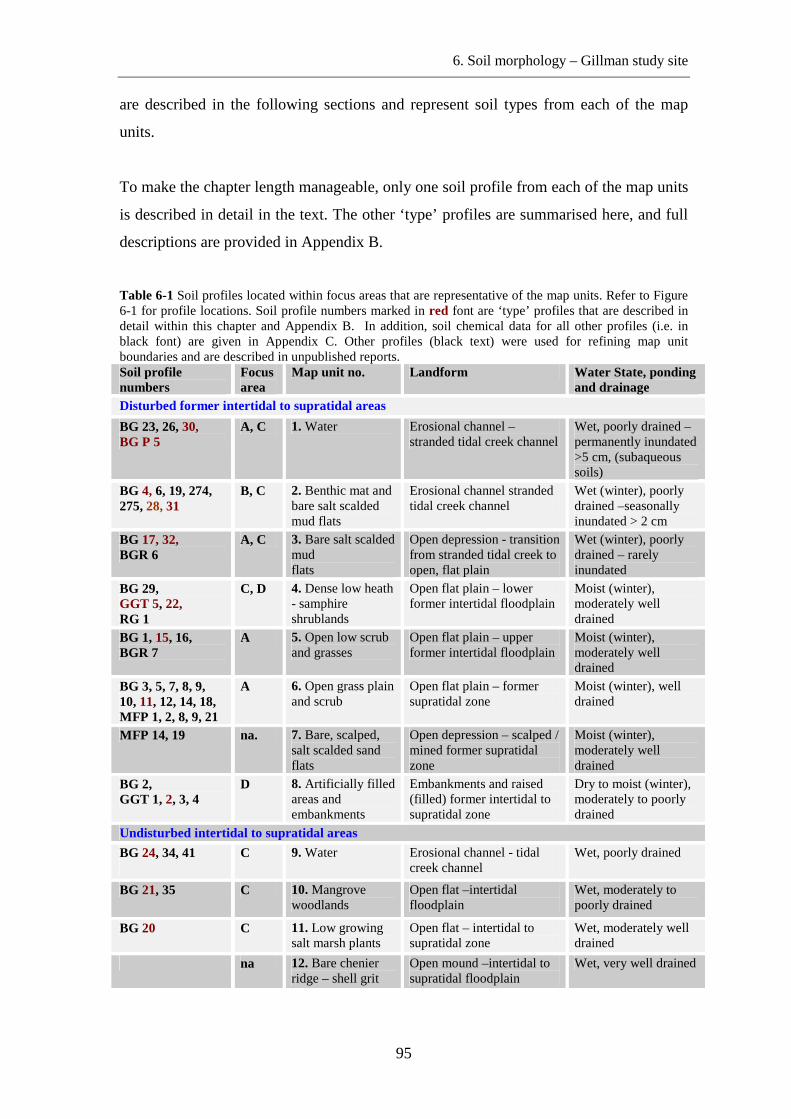
Table 6-1 Soil profiles located within focus areas that are representative of the map units. Refer to Figure 6-1 for profile locations. Soil profile numbers marked in red font are ‘type’ profiles that are described in detail within this chapter and Appendix B. In addition, soil chemical data for all other profiles (i.e. in black font) are given in Appendix C. Other profiles (black text) were used for refining map unit boundaries and are described in unpublished reports. Soil profile numbers
Focus area
Map unit no. Landform Water State, ponding and drainage
Disturbed former intertidal to supratidal areas
BG 23, 26, 30, BG P 5
A, C 1. Water Erosional channel –stranded tidal creek channel
Wet, poorly drained – permanently inundated >5 cm, (subaqueous soils)
BG 4, 6, 19, 274, 275, 28, 31
B, C 2. Benthic mat and bare salt scalded mud flats
Erosional channel stranded tidal creek channel
Wet (winter), poorly drained –seasonally inundated > 2 cm
BG 17, 32, BGR 6
A, C 3. Bare salt scalded mud flats
Open depression - transition from stranded tidal creek to open, flat plain
Wet (winter), poorly drained – rarely inundated
BG 29, GGT 5, 22, RG 1
C, D 4. Dense low heath - samphire shrublands
Open flat plain – lower former intertidal floodplain
Moist (winter), moderately well drained
BG 1, 15, 16, BGR 7
A 5. Open low scrub and grasses
Open flat plain – upper former intertidal floodplain
Moist (winter), moderately well drained
BG 3, 5, 7, 8, 9, 10, 11, 12, 14, 18, MFP 1, 2, 8, 9, 21
A 6. Open grass plain and scrub
Open flat plain – former supratidal zone
Moist (winter), well drained
MFP 14, 19 na. 7. Bare, scalped, salt scalded sand flats
Open depression – scalped / mined former supratidal zone
Moist (winter), moderately well drained
BG 2, GGT 1, 2, 3, 4
D 8. Artificially filled areas and embankments
Embankments and raised (filled) former intertidal to supratidal zone
Dry to moist (winter), moderately to poorly drained
Undisturbed intertidal to supratidal areas
BG 24, 34, 41
C 9. Water Erosional channel - tidal creek channel
Wet, poorly drained
BG 21, 35 C 10. Mangrove woodlands
Open flat –intertidal floodplain
Wet, moderately to poorly drained
BG 20 C 11. Low growing salt marsh plants
Open flat – intertidal to supratidal zone
Wet, moderately well drained
na 12. Bare chenier ridge – shell grit
Open mound –intertidal to supratidal floodplain
Wet, very well drained
6. Soil morphology, Gillman study site
97
6.1. Descriptive soil toposequence process models for a drained supratidal
landscape
6.1.1. Gillman Focus area A
Focus area A is situated on the leeward (eastern) side of a geomorphically controlled
relic sandy shore face, which forms a slight north-east projecting ridgeline
predominantly covered by salt tolerant grasses. The ridgeline is evident from aerial
photography and on the digital elevation map (Figure 3-6), with an elevation ranging
from 1.8 to 2.8 m AHD. Prior to the construction of bund walls, which drained this area
in 1935, the sandy ridgeline was likely supratidal and covered by thick samphire marsh
vegetation (Belperio and Rice 1989; Burton 1982b). This rectangular bunded area was
used as the ‘over-shoot’ area for the Dean rifle range until 2003. Focus area A
encompasses a toposequence that transects from the relatively high sand ridge, across
lower lying back barrier sands and clays to a permanently inundated ‘constructed’ saline
wetland pond (the outfall pond of the Range Wetlands). Four map units occur within
focus area A. The soil types that underlay these map units are represented by four soil
profiles that form a north-south toposequence that transects from the topographically
elevated “open grass plain and scrub” to low-lying permanent “water” (Figure 6-2 and
Figure 6-3). The four soil profiles are; BG 11, BG 15, BG 17 and BG P 5 (Table 6-2).
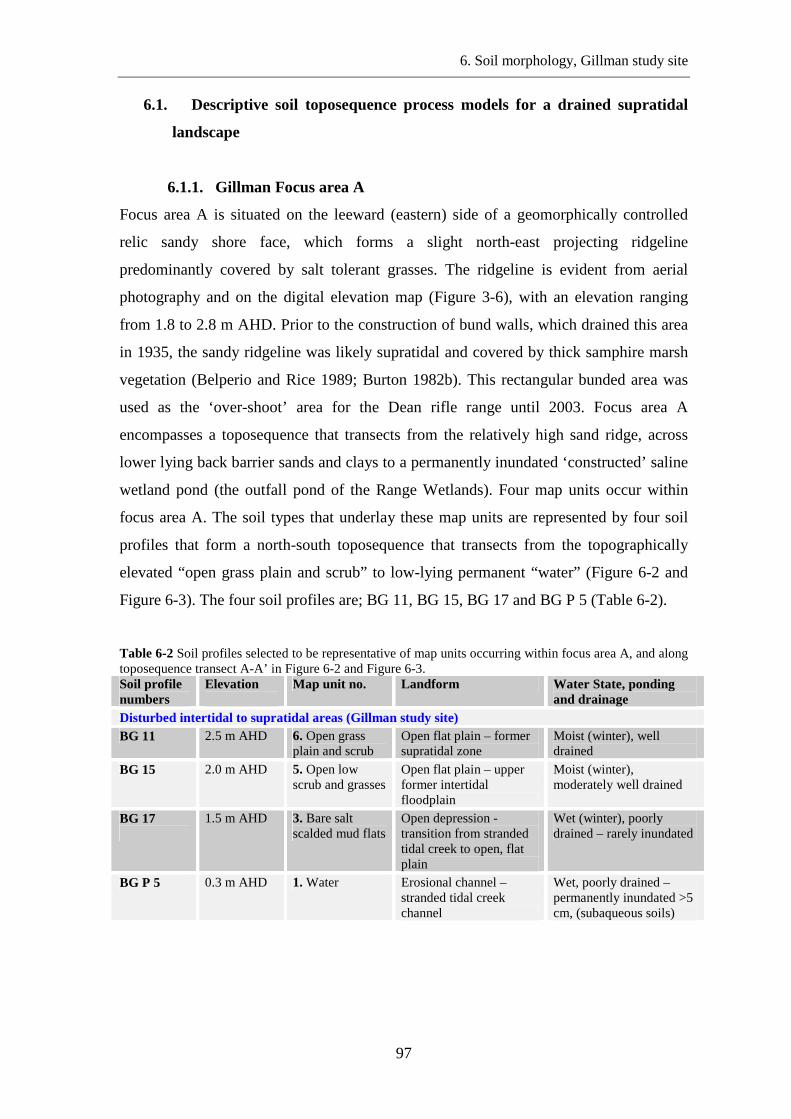
Table 6-2 Soil profiles selected to be representative of map units occurring within focus area A, and along toposequence transect A-A’ in Figure 6-2 and Figure 6-3. Soil profile numbers
Elevation
Map unit no. Landform Water State, ponding and drainage
Disturbed intertidal to supratidal areas (Gillman study site) BG 11 2.5 m AHD 6. Open grass
plain and scrub Open flat plain – former supratidal zone
Moist (winter), well drained
BG 15 2.0 m AHD 5. Open low scrub and grasses
Open flat plain – upper former intertidal floodplain
Moist (winter), moderately well drained
BG 17
1.5 m AHD 3. Bare salt scalded mud flats
Open depression - transition from stranded tidal creek to open, flat plain
Wet (winter), poorly drained – rarely inundated
BG P 5 0.3 m AHD 1. Water Erosional channel –stranded tidal creek channel
Wet, poorly drained – permanently inundated >5 cm, (subaqueous soils)
6. Soil morphology, Gillman study site
98
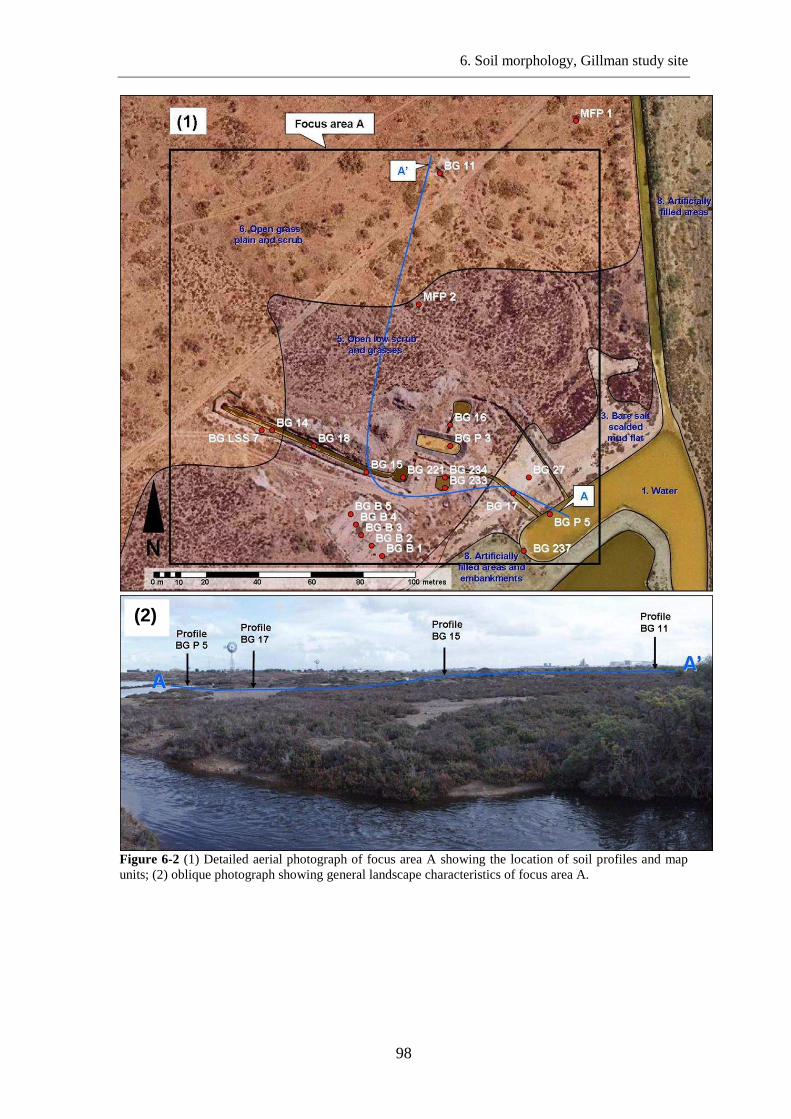
Figure 6-2 (1) Detailed aerial photograph of focus area A showing the location of soil profiles and map units; (2) oblique photograph showing general landscape characteristics of focus area A.
(2)
6. Soil morphology, Gillman study site
99
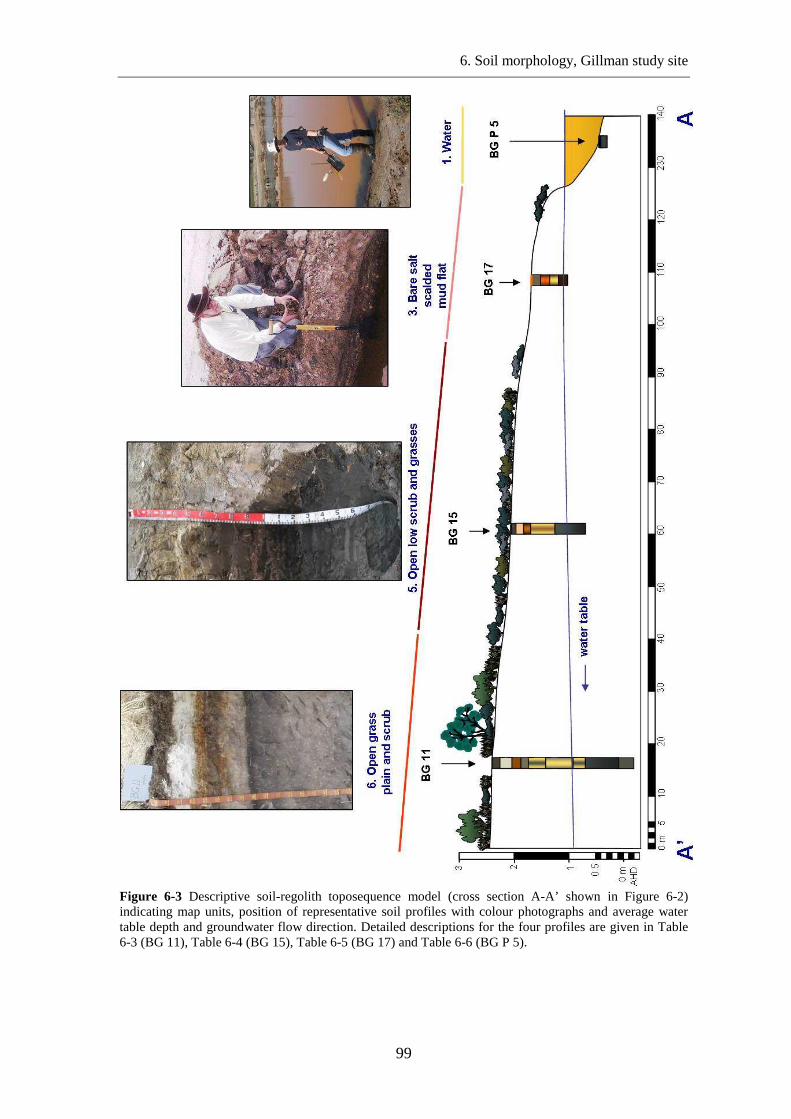
Figure 6-3 Descriptive soil-regolith toposequence model (cross section A-A’ shown in Figure 6-2) indicating map units, position of representative soil profiles with colour photographs and average water table depth and groundwater flow direction. Detailed descriptions for the four profiles are given in Table 6-3 (BG 11), Table 6-4 (BG 15), Table 6-5 (BG 17) and Table 6-6 (BG P 5).
6. Soil morphology, Gillman study site
100
Map unit 6 - Moist (winter): well drained, open grass plain and scrub – former
supratidal zone. Profile BG 11
Soil profile BG 11 occurs within map unit 6 (Open grass plain and scrub). A detailed
summary of the soil morphological features together with a corresponding close-up
photograph of soil fragments are given in Table 6-2. Profile BG 11 was originally
developed in a supratidal regime but tidal inundation was totally excluded in 1935 when
a bund wall was constructed causing oxidation of sulfidic material. The parent material
consists of several layers of lacustrine and tidal sediments deposited under mangrove
and supratidal samphire vegetation.
The near surface horizons (Oe and A) were dry to slightly moist (due to recent rainfall
events when sampled), well drained, firm and have a well developed (strong) subangular
blocky structure. Root mass of salt tolerant grasses and breakdown of organic matter
formed an organic horizon (Oe) at the top of the profile (0-10 cm). The organic matter
content of the Oe horizon was approximately 6.8 % and was predominantly uniform
dark reddish-brown with no evident redoximorphic features. The underlying A horizon
(10-12 cm) had minor Fe-oxide mottles along ped surfaces and 1.5% CaCO3. Organic
matter decreased with depth in the A horizon, E and B horizons to generally < 1%. The
E horizons (2E1 and 2Ey2) had a weak consistency and a very sharp upper boundary (at
12 cm). These horizons consist of light grey, well sorted medium sands with low
amounts of organic matter and few redoximorphic features except near the lower
boundary of the 2Ey2 horizon (from 30-40 cm) where frequent iron mottles were
associated with remnant root channels and coarse shell fragments. Between the O and B
horizons discontinuous lenses of decalcifying, coarse shell fragments occurred. Below
40 cm, in the B horizons, the soil profile remained moist due to wicking of acidic, saline
groundwater. Below 160 cm all soil horizons remained permanently saturated. The
3Bty1 horizon occurs directly below the 2Ey2 horizon and consists of a dark greyish
brown layered clay with distinct reddish-brown iron oxide mottles along remnant root
channels, and has a weak consistency. Gypsum crystals are clearly visible using a hand
lens. Above the permanent groundwater table (at 160 cm) the B horizon consists of five
definable horizons, with three more B horizons occurring below the water table. Horizon
4Bjy1 (49-58 cm) contains some dark greyish brown clay but in a much sandier matrix
than 3Bty1 (40-49 cm). Jarosite mottles have formed around elongate, vertically-
oriented macropores (remnant from mangrove pneumatophores) and have a thin layer of
6. Soil morphology, Gillman study site
101
reddish-brown iron oxide coatings surrounding them. The underlying 4Bj2, 4Bjg3 and
4Bjg4 horizons (occurring from 58 cm to 160 cm) have similar redoximorphic features
to 4Bjy1 (49-58 cm), but in a sandier, dark grey to light brownish grey matrix. Jarosite
mottles become more prominent and abundant with depth until the winter water table is
reached at about 100 cm. Horizon 4Bjg5 occurs below 160 cm and consists of weak
sand with a dark grey matrix and some slightly darker grey (sulfidic) mottles (Table
6-3). The matrix and mottles in this horizon have a chroma of 2 or less and are therefore
considered to be reduced due to the presence of Fe2+ (Schoeneberger et al. 2002).
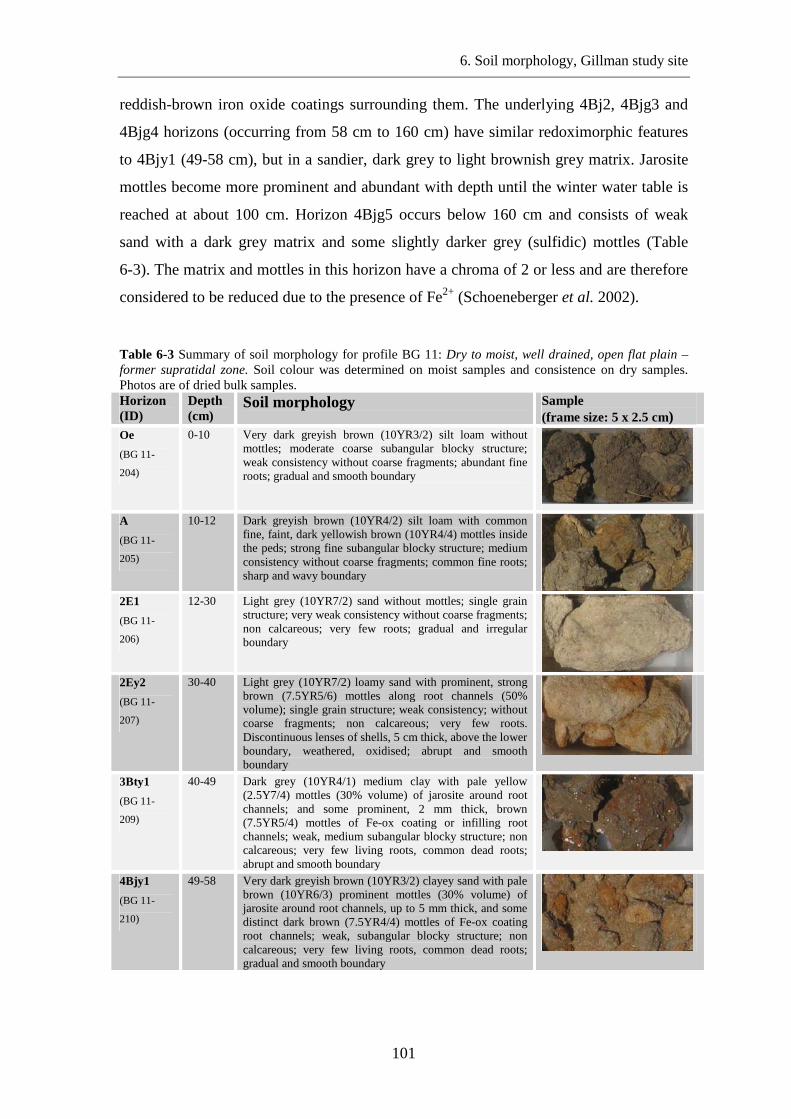
Table 6-3 Summary of soil morphology for profile BG 11: Dry to moist, well drained, open flat plain – former supratidal zone. Soil colour was determined on moist samples and consistence on dry samples. Photos are of dried bulk samples. Horizon (ID)
Depth (cm)
Soil morphology Sample (frame size: 5 x 2.5 cm)
Oe
(BG 11-
204)
0-10 Very dark greyish brown (10YR3/2) silt loam without mottles; moderate coarse subangular blocky structure; weak consistency without coarse fragments; abundant fine roots; gradual and smooth boundary
A
(BG 11-
205)
10-12 Dark greyish brown (10YR4/2) silt loam with common fine, faint, dark yellowish brown (10YR4/4) mottles inside the peds; strong fine subangular blocky structure; medium consistency without coarse fragments; common fine roots; sharp and wavy boundary
2E1
(BG 11-
206)
12-30 Light grey (10YR7/2) sand without mottles; single grain structure; very weak consistency without coarse fragments; non calcareous; very few roots; gradual and irregular boundary
2Ey2
(BG 11-
207)
30-40 Light grey (10YR7/2) loamy sand with prominent, strong brown (7.5YR5/6) mottles along root channels (50% volume); single grain structure; weak consistency; without coarse fragments; non calcareous; very few roots. Discontinuous lenses of shells, 5 cm thick, above the lower boundary, weathered, oxidised; abrupt and smooth boundary
3Bty1
(BG 11-
209)
40-49 Dark grey (10YR4/1) medium clay with pale yellow (2.5Y7/4) mottles (30% volume) of jarosite around root channels; and some prominent, 2 mm thick, brown (7.5YR5/4) mottles of Fe-ox coating or infilling root channels; weak, medium subangular blocky structure; non calcareous; very few living roots, common dead roots; abrupt and smooth boundary
4Bjy1
(BG 11-
210)
49-58 Very dark greyish brown (10YR3/2) clayey sand with pale brown (10YR6/3) prominent mottles (30% volume) of jarosite around root channels, up to 5 mm thick, and some distinct dark brown (7.5YR4/4) mottles of Fe-ox coating root channels; weak, subangular blocky structure; non calcareous; very few living roots, common dead roots; gradual and smooth boundary
6. Soil morphology, Gillman study site
102
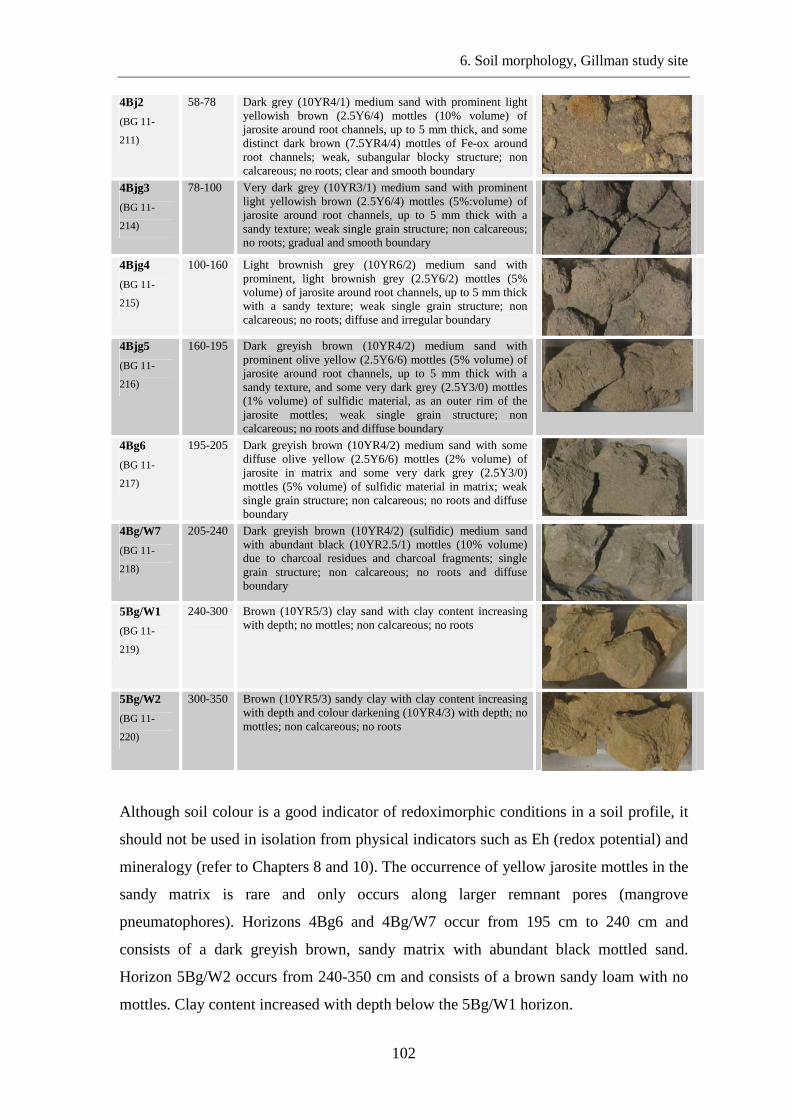
4Bj2
(BG 11-
211)
58-78 Dark grey (10YR4/1) medium sand with prominent light yellowish brown (2.5Y6/4) mottles (10% volume) of jarosite around root channels, up to 5 mm thick, and some distinct dark brown (7.5YR4/4) mottles of Fe-ox around root channels; weak, subangular blocky structure; non calcareous; no roots; clear and smooth boundary
4Bjg3
(BG 11-
214)
78-100 Very dark grey (10YR3/1) medium sand with prominent light yellowish brown (2.5Y6/4) mottles (5%:volume) of jarosite around root channels, up to 5 mm thick with a sandy texture; weak single grain structure; non calcareous; no roots; gradual and smooth boundary
4Bjg4
(BG 11-
215)
100-160 Light brownish grey (10YR6/2) medium sand with prominent, light brownish grey (2.5Y6/2) mottles (5% volume) of jarosite around root channels, up to 5 mm thick with a sandy texture; weak single grain structure; non calcareous; no roots; diffuse and irregular boundary
4Bjg5
(BG 11-
216)
160-195 Dark greyish brown (10YR4/2) medium sand with prominent olive yellow (2.5Y6/6) mottles (5% volume) of jarosite around root channels, up to 5 mm thick with a sandy texture, and some very dark grey (2.5Y3/0) mottles (1% volume) of sulfidic material, as an outer rim of the jarosite mottles; weak single grain structure; non calcareous; no roots and diffuse boundary
4Bg6
(BG 11-
217)
195-205 Dark greyish brown (10YR4/2) medium sand with some diffuse olive yellow (2.5Y6/6) mottles (2% volume) of jarosite in matrix and some very dark grey (2.5Y3/0) mottles (5% volume) of sulfidic material in matrix; weak single grain structure; non calcareous; no roots and diffuse boundary
4Bg/W7
(BG 11-
218)
205-240 Dark greyish brown (10YR4/2) (sulfidic) medium sand with abundant black (10YR2.5/1) mottles (10% volume) due to charcoal residues and charcoal fragments; single grain structure; non calcareous; no roots and diffuse boundary
5Bg/W1
(BG 11-
219)
240-300 Brown (10YR5/3) clay sand with clay content increasing with depth; no mottles; non calcareous; no roots
5Bg/W2
(BG 11-
220)
300-350 Brown (10YR5/3) sandy clay with clay content increasing with depth and colour darkening (10YR4/3) with depth; no mottles; non calcareous; no roots
Although soil colour is a good indicator of redoximorphic conditions in a soil profile, it
should not be used in isolation from physical indicators such as Eh (redox potential) and
mineralogy (refer to Chapters 8 and 10). The occurrence of yellow jarosite mottles in the
sandy matrix is rare and only occurs along larger remnant pores (mangrove
pneumatophores). Horizons 4Bg6 and 4Bg/W7 occur from 195 cm to 240 cm and
consists of a dark greyish brown, sandy matrix with abundant black mottled sand.
Horizon 5Bg/W2 occurs from 240-350 cm and consists of a brown sandy loam with no
mottles. Clay content increased with depth below the 5Bg/W1 horizon.
6. Soil morphology, Gillman study site
103
Soil EC generally increased with depth and ranged from 0.6 in the surface layer to 6.9
dS/m at the base of the profile. Clay rich layer 4Bjy1 had an EC of 17.0 dS/m. Soil pH
(1:5) was near neutral for the upper 49 cm of the profile and was acidic between 49 and
240 cm depth. Soil pH (1:5) of the acidic part of the profile ranged between 3.9 and 4.6
(Figure 6-4). Soil pHCaCl2 results were very similar to pH (1:5) values, but were about
0.2 to 0.3 of a pH unit lower. Total organic carbon contents were highest (6.8%) at the
surface and decreased with depth to 0.1% at the base of the profile. Total sulfur
measurements increased with depth and ranged from 0.1% at the surface layer to a
maximum of 1.3% at 205 cm depth (Figure 6-4). Carbonate content was highest in the
near surface A horizon, measuring 1.6% CaCO3, and was not detected in the underlying
layers.
Soil profile BG 11 classifies as: Typic Sulfaquepts (Soil Survey Staff 2010);
Sulfuric Salic Hydrosol (Isbell 2002).
Acid Sulfate Soil Characteristics
Soil pH testing (pHW, pHOX and pHIncubation)
Soil-water pH (pHw) data (Figure 6-4) show that soil layers above 49 cm (Oe, A, 2E1,
2Ey2 and 3Bty1) are circum-neutral. Soil layers between 49 and 195 cm depth (4Bjy1,
4Bj2, 4Bjg3, 4Bjg4, 4Bjg5,) were strongly acidic, with a mean pHW of 3.3 for the depth
interval. Below 205 cm depth (horizons 4Bg6, 4Bg/W7, 5Bg/W1, 5Bg/W2) were
slightly acidic, with pHW ranging from 5.2 to 6.5 (Figure 6-4). Peroxide oxidation tests
(pHOX) were performed on all samples to gauge the likely presence of sulfidic materials
(See Chapter 4). The pHOX dropped by > 1 pH unit to less than 2.5 in 8 soil samples,
however only one of these soil samples had a starting pH above 4 (Figure 6-4). The
pHOX results suggest that much of the sulfuric material in this profile is likely to still
contain pyrite. After incubating soil samples for 19 weeks, only one sample (from layer
4Bg/W7) showed a drop in pH of at least 0.5 pH unit to less than pH 4, which is likely
due to sulfide oxidation, according to SCR analysis data. Some incubated samples
containing sulfuric material showed a rise in of between 0.5 and 1.0 pH unit.
6. Soil morphology, Gillman study site
104
Existing Acidity (Titratable actual acidity (TAA) and Retained acidity)
Eight of the 9 samples analysed had a pHKCl of < 6.5, indicating they contain Existing
Acidity as TAA, and had no acid effective neutralising capacity. TAA ranged between
zero, at the top and bottom of the soil profile, and 49 mole H+/tonne of soil (in layer
4Bjg4) and a mean of TAA of 10.3 mole H+/tonne for the profile. Retained acidity was
measured in 7 samples, only 2 of which had a pHKCl of < 4.5. Retained acidity ranged
from zero at the top and base of the soil profile to 122 mole H+/tonne of soil (in layer
4Bj2) and a mean value of 40 mole H+/tonne for the profile (Figure 6-4).
Chromium Reducible Sulfur (SCR)
Reduced inorganic sulfur was determined for 9 layer samples within soil profile BG 11
(Figure 6-4). SCR values ranged form 0% and 1.05%, with 6 soil layers containing
detectable SCR (of 0.01% or above), indicating that they contain Potential Sulfidic
Acidity. The highest SCR values occurred low down in the soil profile, within gleyed,
sandy soil layers below 160 cm. No samples were analysed for AVS due to there being
only a minor occurrence of dark grey to black mottles. AVS were therefore considered
not to be significant in any of the soil layers in profile BG 11.
Acid Neutralising Capacity (ANC)
Near surface soil samples (between 0 and 49 cm) contained minor ANC with up to 0.4%
CaCO3. Between 49 cm and 300 cm depth, soil samples measured a pHKCl below 6.5
(Figure 6-4), and by definition they contain zero ANC (refer to Ahern et al. 2004).
Net Acidity
The topsoil layer of profile BG 11 had a Net Acidity value of -53 mole H+/tonne (Figure
6-4), and is therefore net alkaline. All other soil layers had positive Net Acidity values,
which ranged between 7 and 764 mole H+/tonne (occurring at 205 cm depth) (Figure
6-4). The mean Net Acidity value for profile BG 11 was 120 mole H+/tonne.
Acid sulfate soil materials: In accordance with the acid sulfate soil terminology
adopted (refer to Table 4-2), soil profile BG 11 classifies as an acid sulfate soil,
containing: sulfuric material with both hypersulfidic and hyposulfidic materials.
6. Soil morphology, Gillman study site
105
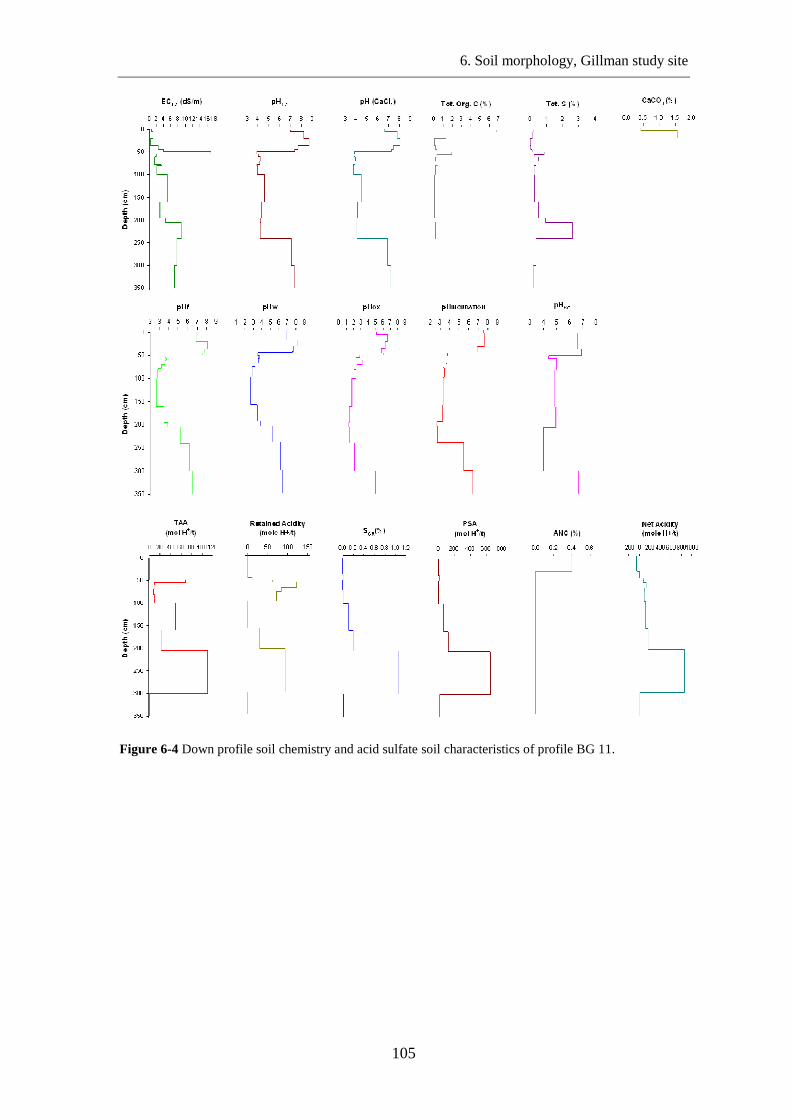
Figure 6-4 Down profile soil chemistry and acid sulfate soil characteristics of profile BG 11.
6. Soil morphology, Gillman study site
106
Map unit 5 - Moist (winter): moderately well drained, open low scrub and grasses –
lower former intertidal floodplain. Profile BG 15
Soil profile BG 15 occurs within map unit 5 (Open low scrub and grasses). Soil
morphology for profile BG 15 is provided in Table 6-4, together with a corresponding
close-up photograph of soil fragments. Profile BG 15 originally developed in an upper
intertidal regime but tidal inundation was totally excluded in 1935 when a bund wall was
constructed causing oxidation of sulfidic materials. The parent material consists of
several layers of lacustrine and tidal sediments deposited under mangrove and supratidal
samphire vegetation. The surface horizons (Oe and A) were dry to slightly moist,
moderately well drained brown to greyish brown, firm cracked clay. Strong brown
mottles are evident in the pale yellow (slightly bleached) silty clay E horizons, along
with a few white specks of gypsum. The underlying B horizons (40 to 95 cm) and 5Oijg
horizon are greyish brown sandy clays and sandy peats with clear, pale brown to pale
yellow jarosite mottles (up to 25% volume) that occur along larger pores (mangrove
pneumatophores) and within the soil matrix. Jarosite mottles are less common below
110 cm, in wet, gleyed, greyish brown, sandy horizons. Horizon 7Bg/W1 was the
deepest layer recorded and occured between 150 and 170 cm depth, and consisted of
brown sandy clay with no mottles.
Soil EC measured 0.8 dS/m at the surface and increased with depth to a maximum of
45.2 dS/m at 110 cm. This hypersaline soil layer occurred approximately at the summer
groundwater table. Soil pH (1:5) was near neutral for the upper 25 cm of the profile and
then was acidic to 170 cm depth. The soil pH (1:5) of the acidic portion of the profile
ranged between 2.3 and 4.4 (Figure 6-5) Soil pHCaCl2 results were very similar to pH
(1:5) values, but were about 0.1 to 0.5 of a pH unit lower. Total organic carbon contents
were highest (14.8%) in the 5Oijg horizon (95 to 110 cm). Total organic C was also
elevated at the surface and measured 3.3%. Total sulfur measurements increased with
depth and ranged from 0.1% at the surface layer to a maximum of 11.3% in horizon
5Oijg (Figure 6-5). Carbonate content was highest at the near surface layers, measuring
1.5% CaCO3, and was not detected in the underlying layers.
6. Soil morphology, Gillman study site
107
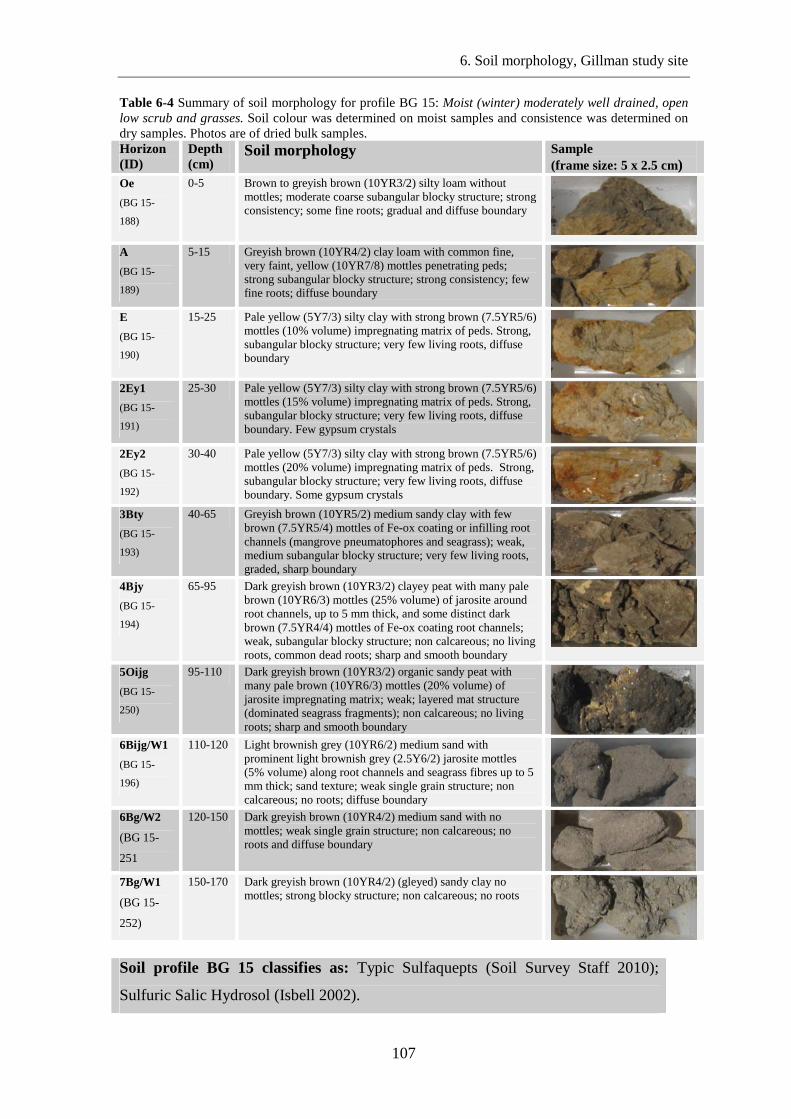
Table 6-4 Summary of soil morphology for profile BG 15: Moist (winter) moderately well drained, open low scrub and grasses. Soil colour was determined on moist samples and consistence was determined on dry samples. Photos are of dried bulk samples. Horizon (ID)
Depth (cm)
Soil morphology Sample (frame size: 5 x 2.5 cm)
Oe
(BG 15-
188)
0-5 Brown to greyish brown (10YR3/2) silty loam without mottles; moderate coarse subangular blocky structure; strong consistency; some fine roots; gradual and diffuse boundary
A
(BG 15-
189)
5-15 Greyish brown (10YR4/2) clay loam with common fine, very faint, yellow (10YR7/8) mottles penetrating peds; strong subangular blocky structure; strong consistency; few fine roots; diffuse boundary
E
(BG 15-
190)
15-25 Pale yellow (5Y7/3) silty clay with strong brown (7.5YR5/6) mottles (10% volume) impregnating matrix of peds. Strong, subangular blocky structure; very few living roots, diffuse boundary
2Ey1
(BG 15-
191)
25-30 Pale yellow (5Y7/3) silty clay with strong brown (7.5YR5/6) mottles (15% volume) impregnating matrix of peds. Strong, subangular blocky structure; very few living roots, diffuse boundary. Few gypsum crystals
2Ey2
(BG 15-
192)
30-40 Pale yellow (5Y7/3) silty clay with strong brown (7.5YR5/6) mottles (20% volume) impregnating matrix of peds. Strong, subangular blocky structure; very few living roots, diffuse boundary. Some gypsum crystals
3Bty
(BG 15-
193)
40-65 Greyish brown (10YR5/2) medium sandy clay with few brown (7.5YR5/4) mottles of Fe-ox coating or infilling root channels (mangrove pneumatophores and seagrass); weak, medium subangular blocky structure; very few living roots, graded, sharp boundary
4Bjy
(BG 15-
194)
65-95 Dark greyish brown (10YR3/2) clayey peat with many pale brown (10YR6/3) mottles (25% volume) of jarosite around root channels, up to 5 mm thick, and some distinct dark brown (7.5YR4/4) mottles of Fe-ox coating root channels; weak, subangular blocky structure; non calcareous; no living roots, common dead roots; sharp and smooth boundary
5Oijg
(BG 15-
250)
95-110 Dark greyish brown (10YR3/2) organic sandy peat with many pale brown (10YR6/3) mottles (20% volume) of jarosite impregnating matrix; weak; layered mat structure (dominated seagrass fragments); non calcareous; no living roots; sharp and smooth boundary
6Bijg/W1
(BG 15-
196)
110-120 Light brownish grey (10YR6/2) medium sand with prominent light brownish grey (2.5Y6/2) jarosite mottles (5% volume) along root channels and seagrass fibres up to 5 mm thick; sand texture; weak single grain structure; non calcareous; no roots; diffuse boundary
6Bg/W2
(BG 15-
251
120-150 Dark greyish brown (10YR4/2) medium sand with no mottles; weak single grain structure; non calcareous; no roots and diffuse boundary
7Bg/W1
(BG 15-
252)
150-170 Dark greyish brown (10YR4/2) (gleyed) sandy clay no mottles; strong blocky structure; non calcareous; no roots
Soil profile BG 15 classifies as: Typic Sulfaquepts (Soil Survey Staff 2010);
Sulfuric Salic Hydrosol (Isbell 2002).
6. Soil morphology, Gillman study site
108
Acid Sulfate Soil Characteristics
Soil pH testing (pHW, pHOX and pHIncubation)
Soil-water pH (pHW) values (Figure 6-5) for near surface soil layers (i.e. horizons Oe, A,
E) are circum-neutral. Soil layer 2Ey1 (between 25 and 30 cm depth) is slightly acidic
with a pHW of 4.3. Soil layers between 30 and 150 cm were acidic with pHW ranging
between 1.5 and 3.5. The pHW of the soil layer below 150 cm depth (7Bg/W1) was less
acidic, with a pHW of 4.7 (Figure 6-5).Peroxide oxidation tests (pHOX) were performed
on all samples to gauge the likely presence of sulfidic materials. Although the pH of
most soil samples dropped by more than 1 pH unit following treatment with hydrogen
peroxide, only one non-sulfuric soil sample experienced a drop in pH to less than 2.5
(Figure 6-5). After incubating soil samples for at least 19 weeks, only one sample (from
layer 7Bg/W1) showed a drop in pH of at least 0.5 pH unit to less than pH 4, which is
likely due to sulfide oxidation, according to pHOX and SCR analysis data.
Existing Acidity (Titratable actual acidity (TAA) and Retained acidity)
All 8 samples analysed had a pHKCl of < 6.5, indicating they contain Existing Acidity as
TAA, which ranged between 15 and 468 mole H+/tonne of soil (mean of 132 mole
H+/tonne). The highest TAA value occurred in organic matter rich soil layer 5Oijg
(Figure 6-5). Retained acidity for the profile was very high, with a mean of 317 mole
H+/tonne. The highest retained acidity (1169 mole H+/tonne) was measured in soil layer
4Bjy, which occurs between 65 and 95 cm depth.
Chromium Reducible Sulfur (SCR)
Reduced inorganic sulfur was determined on 8 samples within soil profile BG 15 and
ranged between 0.01% and 6.88% indicating that the profile contains substantial
Potential Sulfidic Acidity. The highest SCR value was contained in the middle of the soil
profile within a sandy peat soil layer (5Oijg) which also contained the highest TAA
(Figure 6-5). No samples were analysed for AVS as no black mottles were observed.
Acid Neutralising Capacity (ANC)
All samples had a pHKCl below 6.5 which by definition indicates that they contained
zero effective ANC.
6. Soil morphology, Gillman study site
109
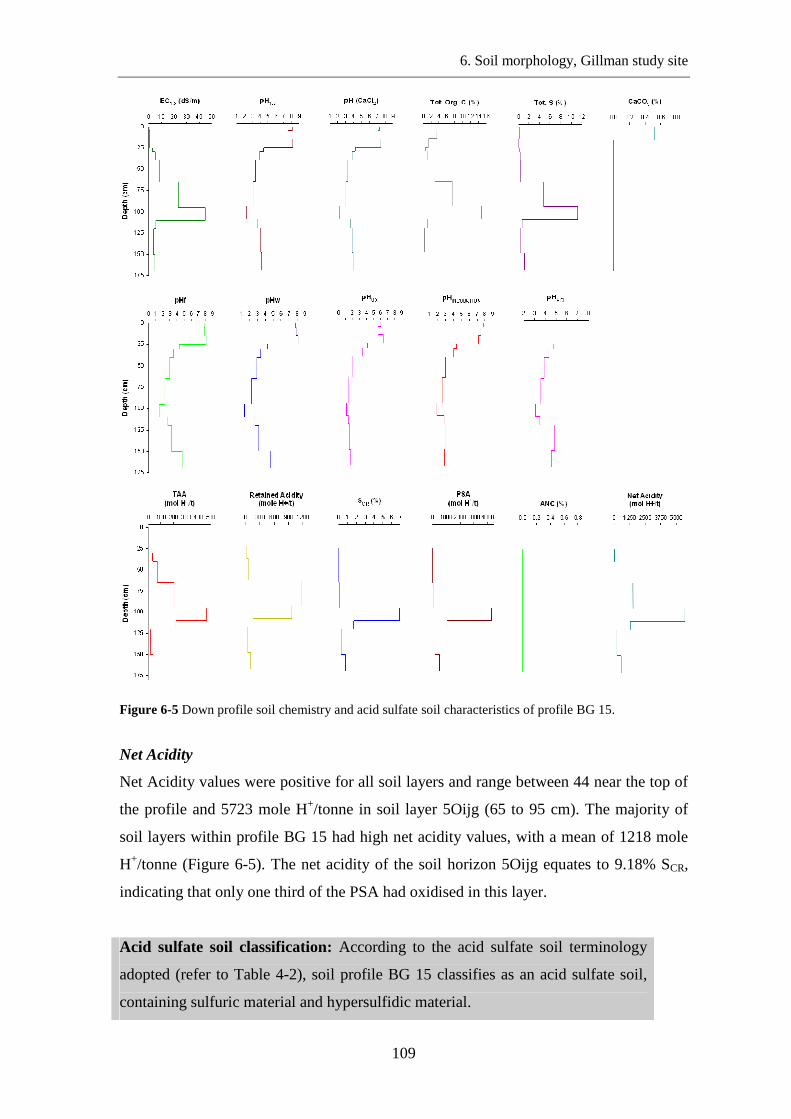
Figure 6-5 Down profile soil chemistry and acid sulfate soil characteristics of profile BG 15.
Net Acidity
Net Acidity values were positive for all soil layers and range between 44 near the top of
the profile and 5723 mole H+/tonne in soil layer 5Oijg (65 to 95 cm). The majority of
soil layers within profile BG 15 had high net acidity values, with a mean of 1218 mole
H+/tonne (Figure 6-5). The net acidity of the soil horizon 5Oijg equates to 9.18% SCR,
indicating that only one third of the PSA had oxidised in this layer.
Acid sulfate soil classification: According to the acid sulfate soil terminology
adopted (refer to Table 4-2), soil profile BG 15 classifies as an acid sulfate soil,
containing sulfuric material and hypersulfidic material.
6. Soil morphology, Gillman study site
110
Map unit 3 - Wet (winter): poorly drained, open depression –bare salt scalded mud
flats. Profile BG 17
Soil profile BG 17 occurs within map unit 3 (Bare salt scalded mud flat). Soil
morphology for profile BG 17 is provided in Table 6-5 together with corresponding
close-up photographs of soil fragments. Profile BG 17 originally developed in an
intertidal regime but tidal sulfidic materials oxidised following tidal exclusion. The
parent material consists of layers of tidal sediments deposited under mangrove
vegetation.
The surface horizon (AE) was moist (due to wicking from shallow groundwater), poorly
drained, sandy loam with well developed crumb structure (Table 6-5). Light yellowish
brown jarosite mottles were evident in B horizons between 10 and 60 cms and occurred
predominantly along larger pores (remnant from mangrove pneumatophores). Gleyed,
dark grey sandy soil layers occur below 60 cm to 120 cm depth and contain some black
mottles within the sandy matrix.
Soil EC was 12.2 dS/m in the surface layer due to salt crust formation and decreased
with depth until the water table was approached, where soil layer 3Bjg1 was most saline
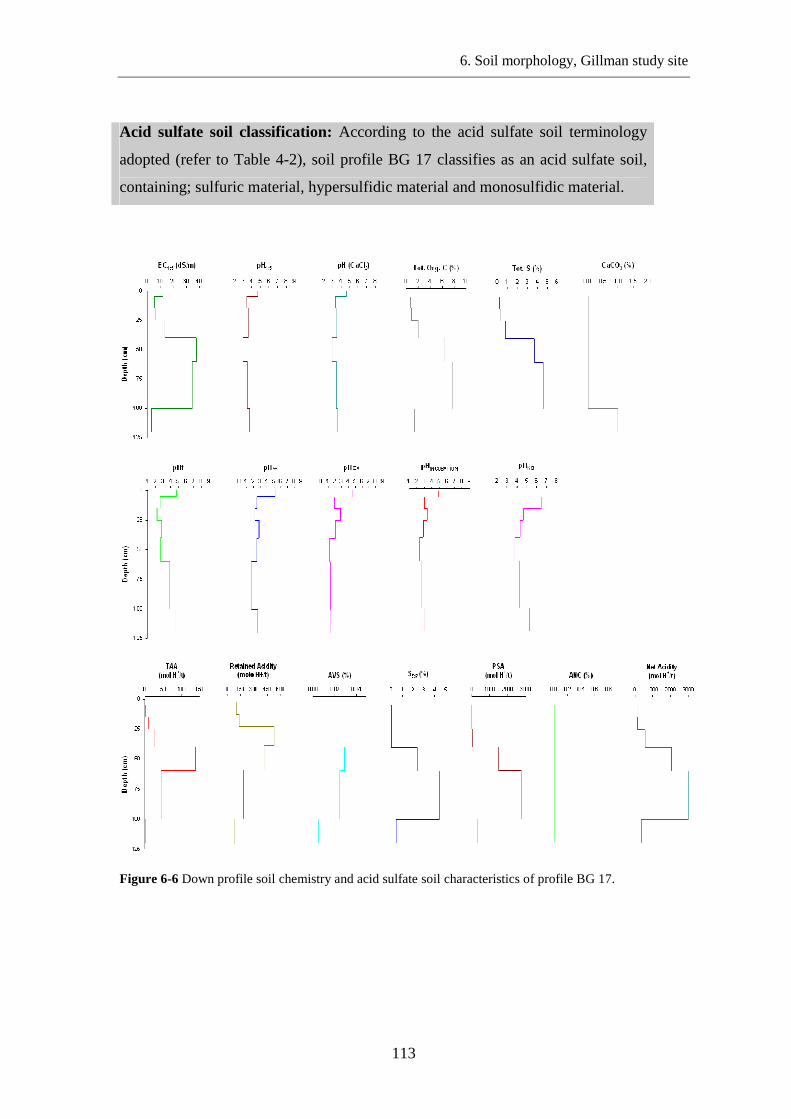
(EC measured 38.0 dS/m). Soil pH (1:5) was acidic for the entire profile and ranged
from 4.7 at the surface to a minimum of 2.9 at 40 cm depth (Figure 6-6). Soil pHCaCl2
results were very similar to pH (1:5) values, but were about 0.1 to 0.5 of a pH unit
lower. Total organic carbon contents were highest (7.7%) in the 3Bg/W2 horizon (60 to
100 cm). Total organic C was not elevated at the near surface and measured 0.9%. Total
sulfur measured 0.3% at the surface and increased with depth to the water table where a
maximum value of 4.6% was measured in horizon 3Bg/W2 (Figure 6-6). Carbonate was
only detected in the 4Bg/W1 horizon at the base of the profile (measuring 1.0% CaCO3).
6. Soil morphology, Gillman study site
111
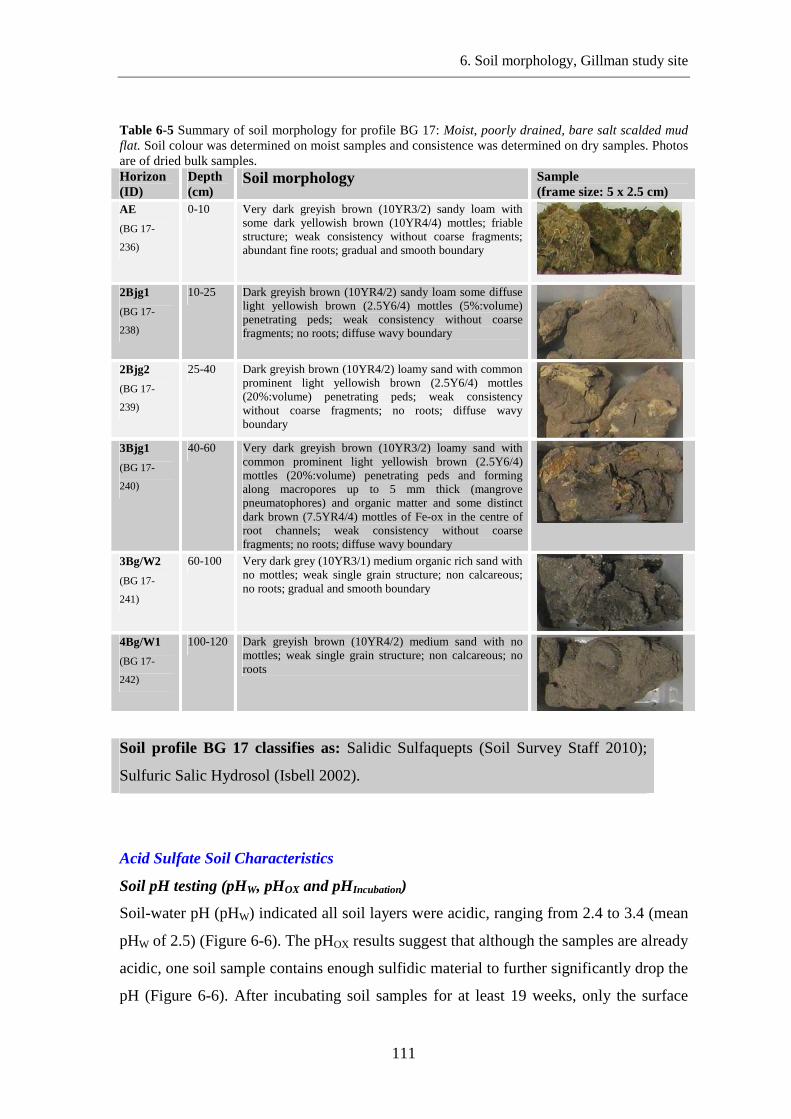
Table 6-5 Summary of soil morphology for profile BG 17: Moist, poorly drained, bare salt scalded mud flat. Soil colour was determined on moist samples and consistence was determined on dry samples. Photos are of dried bulk samples. Horizon (ID)
Depth (cm)
Soil morphology Sample (frame size: 5 x 2.5 cm)
AE
(BG 17-
236)
0-10 Very dark greyish brown (10YR3/2) sandy loam with some dark yellowish brown (10YR4/4) mottles; friable structure; weak consistency without coarse fragments; abundant fine roots; gradual and smooth boundary
2Bjg1
(BG 17-
238)
10-25 Dark greyish brown (10YR4/2) sandy loam some diffuse light yellowish brown (2.5Y6/4) mottles (5%:volume) penetrating peds; weak consistency without coarse fragments; no roots; diffuse wavy boundary
2Bjg2
(BG 17-
239)
25-40 Dark greyish brown (10YR4/2) loamy sand with common prominent light yellowish brown (2.5Y6/4) mottles (20%:volume) penetrating peds; weak consistency without coarse fragments; no roots; diffuse wavy boundary
3Bjg1
(BG 17-
240)
40-60 Very dark greyish brown (10YR3/2) loamy sand with common prominent light yellowish brown (2.5Y6/4) mottles (20%:volume) penetrating peds and forming along macropores up to 5 mm thick (mangrove pneumatophores) and organic matter and some distinct dark brown (7.5YR4/4) mottles of Fe-ox in the centre of root channels; weak consistency without coarse fragments; no roots; diffuse wavy boundary
3Bg/W2
(BG 17-
241)
60-100 Very dark grey (10YR3/1) medium organic rich sand with no mottles; weak single grain structure; non calcareous; no roots; gradual and smooth boundary
4Bg/W1
(BG 17-
242)
100-120 Dark greyish brown (10YR4/2) medium sand with no mottles; weak single grain structure; non calcareous; no roots
Soil profile BG 17 classifies as: Salidic Sulfaquepts (Soil Survey Staff 2010);
Sulfuric Salic Hydrosol (Isbell 2002).
Acid Sulfate Soil Characteristics
Soil pH testing (pHW, pHOX and pHIncubation)
Soil-water pH (pHW) indicated all soil layers were acidic, ranging from 2.4 to 3.4 (mean
pHW of 2.5) (Figure 6-6). The pHOX results suggest that although the samples are already
acidic, one soil sample contains enough sulfidic material to further significantly drop the
pH (Figure 6-6). After incubating soil samples for at least 19 weeks, only the surface
6. Soil morphology, Gillman study site
112
sample showed a further drop in pH. The vast majority of samples showed a slight rise
in pH of between 0.5 and 1 pH unit. The pH of soil horizon 4Bg/W1 (the deepest layer)
rose substantially following incubation, from pHw 3.06 to pHIncubation 4.74. This rise may
be attributed to incubation samples being too moist, allowing reformation of sulfides to
occur, and/or the soil carbonate present to react.
Existing acidity (Titratable actual acidity (TAA) and Retained acidity)
All six samples analysed had a pHKCl of <6.5 (Figure 6-6), indicating they contain
Existing Acidity as TAA, which ranged between zero (in the surface layer) and 140
mole H+/tonne of soil in the 3Bjg1 layer (at 40 to 60 cm depth). The mean TAA value
was 38 mole H+/tonne) (Figure 6-6). Retained acidity was measured on all 6 samples
and ranged between 87 mole H+/tonne at the base of the profile to 524 mole H+/tonne in
the 2Bjg2 layer (25 to 40 cm depth) (Figure 6-6). The mean retained acidity value for the
profile was 240 mole H+/tonne.
Chromium Reducible Sulfur (SCR)
Reduced inorganic sulfur was detected in all 6 horizons sampled indicating that they all
contain potential sulfidic acidity. SCR values ranged form 0.01% for the two upper soil
layers to 4.41% SCR in a gleyed, very dark grey sandy soil layer 3Bg/W2 (from 60 to
100 cm). The profile had a mean SCR value of 1.22%. The bottom three soil horizons
were analysed for AVS due to the presence of dark grey to black mottles. AVS contents
were low and ranged from 0.01 to 0.03% AVS (Figure 6-6).
Acid Neutralising Capacity (ANC)
All samples had a pHKCl below 6.5 (Figure 6-6) indicating they contain zero effective
ANC.
Net Acidity
Net Acidity values were positive for all soil layers assessed and range between 110 mole
H+/tonne at the surface to 2798 mole H+/tonne at between 60 and 100 cm depth. The soil
layer above (40 to 60 cm depth) had a similarly elevated net acidity of 2056 mole
H+/tonne. The mean net acidity value for profile BG 17 was 1037 mole H+/tonne. The
majority of the acidity in profile BG 17 is in the form of Potential Sulfidic Acidity
(Figure 6-6).
6. Soil morphology, Gillman study site
113
Acid sulfate soil classification: According to the acid sulfate soil terminology
adopted (refer to Table 4-2), soil profile BG 17 classifies as an acid sulfate soil,
containing; sulfuric material, hypersulfidic material and monosulfidic material.
Figure 6-6 Down profile soil chemistry and acid sulfate soil characteristics of profile BG 17.
6. Soil morphology, Gillman study site
114
Map unit 1 - Wet (subaqueous): poorly drained, erosional channel – water. Profile
BG P 5
Soil profile BG P 5 occurs within map unit 1 (Water). Soil morphology for profile BG P
5 is provided in Table 6-6 together with a corresponding close-up photograph of soil
fragments from each horizon. Profile BG P 5 originally developed in an intertidal to
supratidal regime. Profile BG P 5 occurs in a pond that was excavated during the
construction of the Range Wetland in 1992 and has since been filled with saline water
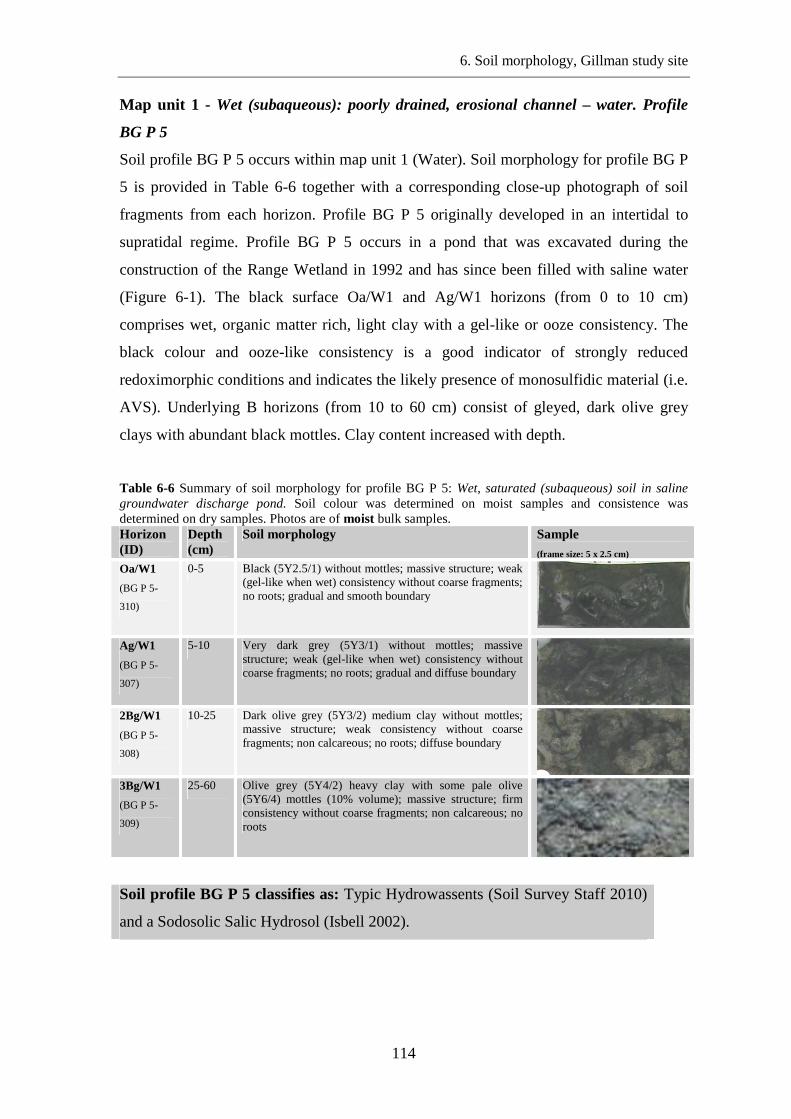
(Figure 6-1). The black surface Oa/W1 and Ag/W1 horizons (from 0 to 10 cm)
comprises wet, organic matter rich, light clay with a gel-like or ooze consistency. The
black colour and ooze-like consistency is a good indicator of strongly reduced
redoximorphic conditions and indicates the likely presence of monosulfidic material (i.e.
AVS). Underlying B horizons (from 10 to 60 cm) consist of gleyed, dark olive grey
clays with abundant black mottles. Clay content increased with depth.
Table 6-6 Summary of soil morphology for profile BG P 5: Wet, saturated (subaqueous) soil in saline groundwater discharge pond. Soil colour was determined on moist samples and consistence was determined on dry samples. Photos are of moist bulk samples. Horizon (ID)
Depth (cm)
Soil morphology Sample (frame size: 5 x 2.5 cm)
Oa/W1
(BG P 5-
310)
0-5 Black (5Y2.5/1) without mottles; massive structure; weak (gel-like when wet) consistency without coarse fragments; no roots; gradual and smooth boundary
Ag/W1
(BG P 5-
307)
5-10 Very dark grey (5Y3/1) without mottles; massive structure; weak (gel-like when wet) consistency without coarse fragments; no roots; gradual and diffuse boundary
2Bg/W1
(BG P 5-
308)
10-25 Dark olive grey (5Y3/2) medium clay without mottles; massive structure; weak consistency without coarse fragments; non calcareous; no roots; diffuse boundary
3Bg/W1
(BG P 5-
309)
25-60 Olive grey (5Y4/2) heavy clay with some pale olive (5Y6/4) mottles (10% volume); massive structure; firm consistency without coarse fragments; non calcareous; no roots
Soil profile BG P 5 classifies as: Typic Hydrowassents (Soil Survey Staff 2010)
and a Sodosolic Salic Hydrosol (Isbell 2002).
6. Soil morphology, Gillman study site
115
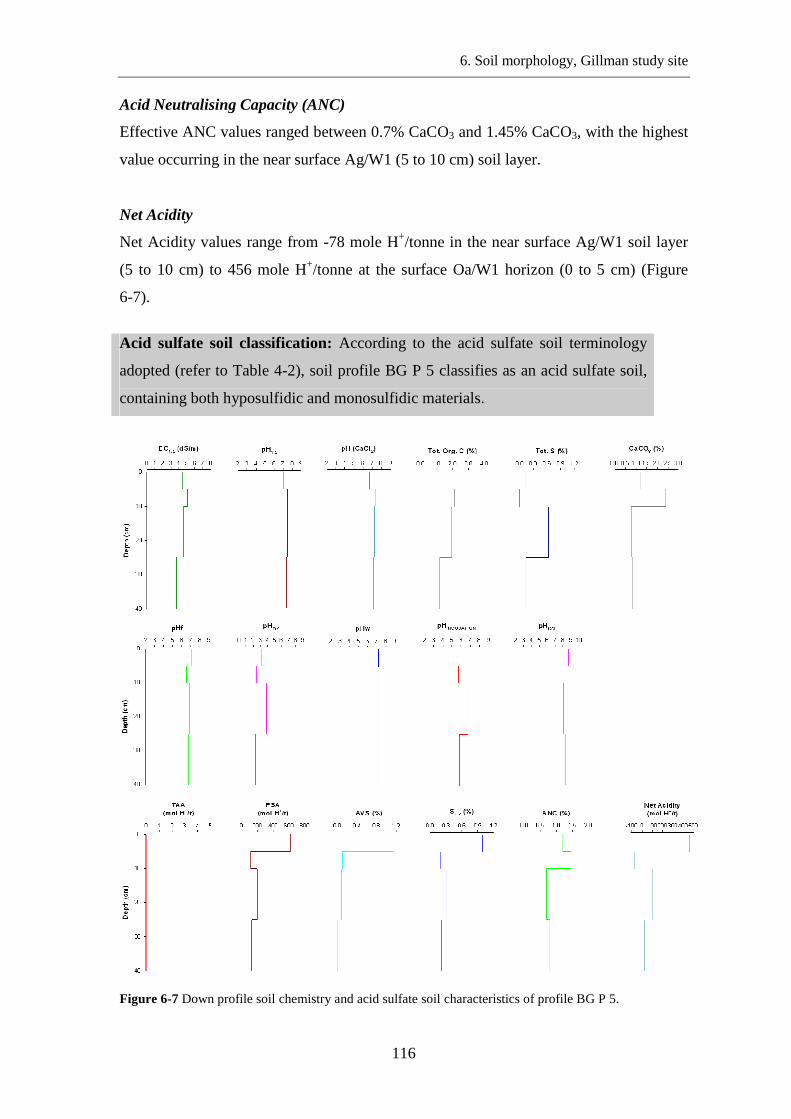
Soil EC was reasonably consistent throughout the profile and ranged from 6.7 to 5.1
dS/m. Soil pH (1:5) was near neutral for the entire profile and ranged from 7.0 in the
lower 3Bg/W1 horizon (25 to 60 cm) to 7.5 in the surface Oa/W1 horizon (0 to 5 cm).
Soil pHCaCl2 results were very similar to pH (1:5) values, but were about 0.2 to 0.3 of a
pH unit lower. Total organic carbon contents were moderately low and ranged from
1.2% in the Ag/W1 horizon (5 to 10 cm) to 2.1% in the surface Oa/W1 horizon, with a
mean of 1.7% for the profile. Total sulfur measurements were surprisingly low,
measuring 0.1% in the surface Oa/W1 horizon, 0.6% in the lower Ag/W1 horizon, and
0.1% in underlying B horizons (Figure 6-7). Carbonate content was highest in the near
surface Ag/W1 horizon (2.4% CaCO3).
Acid Sulfate Soil Characteristics
Soil pH testing (pHW, pHOX and pHIncubation)
Soil:water pH measurements were made in a 1:1 soil-water mixture (pHW), after
treatment with peroxide (pHOX) and after 19 weeks of ageing (pHIncubation) the soil in a
moist environment. Soil-water pH data show that all soil layers were circum-neutral
(Figure 6-7). A drop in pH was observed for most samples following treatment with
peroxide, however only two soil sample (from horizons Ag/W1 and 3Bg/W1) contained
sufficient sulfidic material to obtain a pHOX of less than 2.5 (Figure 6-7). After
incubating soil samples for 19 weeks the pH of all soil layers remained above pH 4. All
samples showed a slight drop in pH of between 0.5 and 1 pH unit during incubation.
Existing acidity (Titratable actual acidity (TAA) and Retained acidity)
All four samples analysed had a pHKCl of >6.5 (ranging from pHKCl 8.02 to 8.83),
indicating they contain no Existing Acidity.
Chromium Reducible Sulfur (SCR)
Reduced inorganic sulfur was determined for 4 layer samples within soil profile BG P 5.
SCR values ranged form 0.99% in the surficial black gel to 0.19% in the underlying soil
layer. All samples were analysed for AVS content, which had a very similar down
profile distribution pattern as the SCR. AVS contents ranged from 1.14% in the surficial
black gel to 0.08% in the gleyed olive grey clay at the base of the soil profile (Figure
6-7).
6. Soil morphology, Gillman study site
116
Acid Neutralising Capacity (ANC)
Effective ANC values ranged between 0.7% CaCO3 and 1.45% CaCO3, with the highest
value occurring in the near surface Ag/W1 (5 to 10 cm) soil layer.
Net Acidity
Net Acidity values range from -78 mole H+/tonne in the near surface Ag/W1 soil layer
(5 to 10 cm) to 456 mole H+/tonne at the surface Oa/W1 horizon (0 to 5 cm) (Figure
6-7).
Acid sulfate soil classification: According to the acid sulfate soil terminology
adopted (refer to Table 4-2), soil profile BG P 5 classifies as an acid sulfate soil,
containing both hyposulfidic and monosulfidic materials.
Figure 6-7 Down profile soil chemistry and acid sulfate soil characteristics of profile BG P 5.
6. Soil morphology, Gillman study site
117
Summary - Gillman Focus area A
Soil profiles BG 11 (map unit 6) and BG 15 (map unit 5) both classify as Sulfuric, Salic
Hydrosols (Isbell 2002) and Typic Sulfaquepts (Soil Survey Staff 2010). These two
profiles are dominated by sandy shore face sediments that underlay organic matter rich
intertidal mangrove loams and supratidal samphire clays of varying thickness. Soil
profile BG 11 contains a thick layer of sulfuric material between 49 and 240 cm depth,
with hypersulfidic and hyposulfidic materials occurring below 240 cm. Sulfuric
materials also contain some reduced inorganic sulfide. Soil profile BG 15 contains a
thick layer of sulfuric material, between 30 and 160 cm depth, with hypersulfidic
material occurring below 160 cm. Sulfuric material contained high amounts of existing
acidity and extremely high PSA, with reduced inorganic sulfide contents of up to 6.88%
SCR remaining in the profile.
Soil profile BG 17 (map unit 3) classifies as a Sulfuric Salic Hydrosol (Isbell 2002) and
Salidic Sulfaquepts (Soil Survey Staff 2010), and contains sulfuric material from the
surface to below 120 cm depth. Sulfuric material also contains high concentrations of
reduced inorganic sulfur contents (up to 4.4%) and minor amounts of AVS in black
mottles that occur below the water table.
Subaqueous soil profile BG P 5 (map unit 1) classifies as a Sodosolic Salic Hydrosol
(Isbell 2002), and a Typic Hydrowassents (Soil Survey Staff 2010). Soil profile BG P 5
contains hyposulfidic material and monosulfidic material (with up to 1.14% AVS) in
near surface layers.
The very high SCR levels measured in profile BG 15 may be natural (historically high in
the back barrier formation sediments). However nutrient rich, hypersaline water from the
Range Wetland is probably contributing to local groundwater recharge and providing
constituents for the formation of FeS and FeS2 in saturated soils. Soil profile BG 4 in
Gillman Focus area B has similarly elevated SCR values (maximum of 7.05%) and is also
influenced by hypersaline waters (refer to the next section in this chapter and Appendix
B).
6. Soil morphology, Gillman study site
118
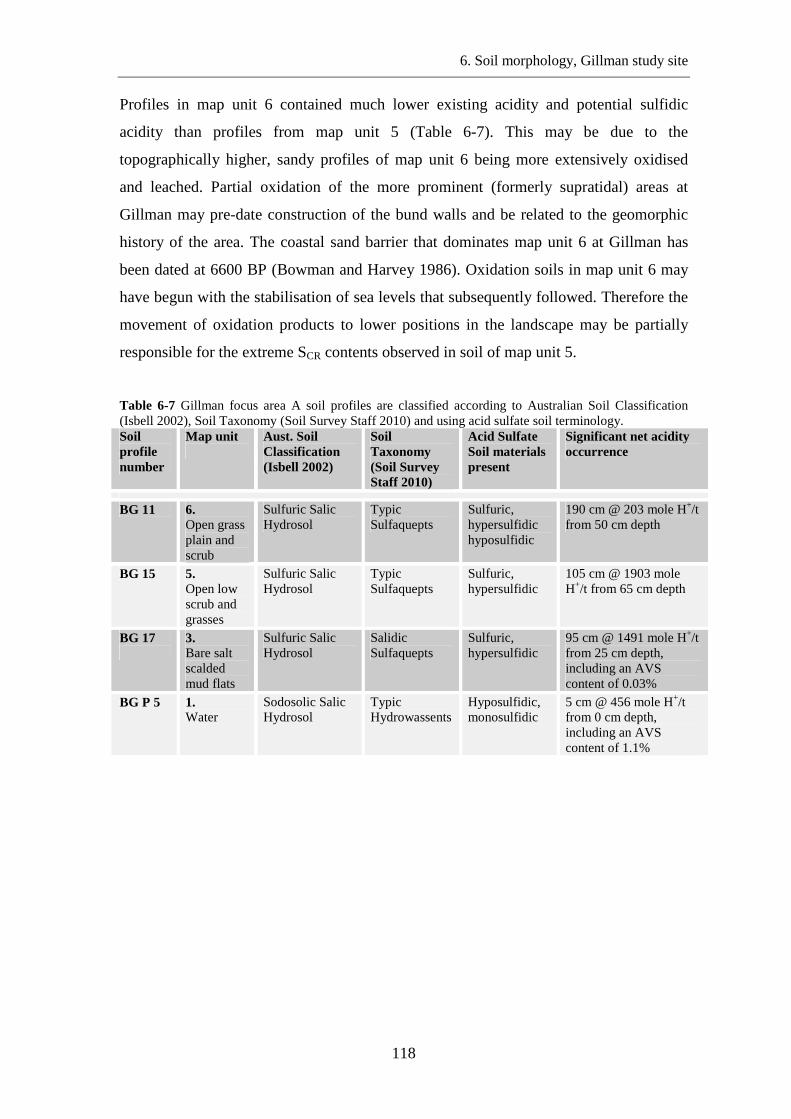
Profiles in map unit 6 contained much lower existing acidity and potential sulfidic
acidity than profiles from map unit 5 (Table 6-7). This may be due to the
topographically higher, sandy profiles of map unit 6 being more extensively oxidised
and leached. Partial oxidation of the more prominent (formerly supratidal) areas at
Gillman may pre-date construction of the bund walls and be related to the geomorphic
history of the area. The coastal sand barrier that dominates map unit 6 at Gillman has
been dated at 6600 BP (Bowman and Harvey 1986). Oxidation soils in map unit 6 may
have begun with the stabilisation of sea levels that subsequently followed. Therefore the
movement of oxidation products to lower positions in the landscape may be partially
responsible for the extreme SCR contents observed in soil of map unit 5.
Table 6-7 Gillman focus area A soil profiles are classified according to Australian Soil Classification (Isbell 2002), Soil Taxonomy (Soil Survey Staff 2010) and using acid sulfate soil terminology. Soil profile number
Map unit
Aust. Soil Classification (Isbell 2002)
Soil Taxonomy (Soil Survey Staff 2010)
Acid Sulfate Soil materials present
Significant net acidity occurrence
BG 11 6. Open grass plain and scrub
Sulfuric Salic Hydrosol
Typic Sulfaquepts
Sulfuric, hypersulfidic hyposulfidic
190 cm @ 203 mole H+/t from 50 cm depth
BG 15 5. Open low scrub and grasses
Sulfuric Salic Hydrosol
Typic Sulfaquepts
Sulfuric, hypersulfidic
105 cm @ 1903 mole H+/t from 65 cm depth
BG 17
3. Bare salt scalded mud flats
Sulfuric Salic Hydrosol
Salidic Sulfaquepts
Sulfuric, hypersulfidic
95 cm @ 1491 mole H+/t from 25 cm depth, including an AVS content of 0.03%
BG P 5 1. Water
Sodosolic Salic Hydrosol
Typic Hydrowassents
Hyposulfidic, monosulfidic
5 cm @ 456 mole H+/t from 0 cm depth, including an AVS content of 1.1%
6. Soil morphology, Gillman study site
119
6.1.2. Gillman Focus area B
Focus area B is sited at a former tidal creek that forms a subtle erosion gully in the
geomorphically-controlled, relic sandy shore face facies (Figure 6-1). The sandy shore
face facies forms a north-east projecting ridgeline (topographic high). The ridgeline and
tidal creek depression are evident in aerial photography and on the digital elevation map
(Figure 3-6). Prior to the construction of the bund walls in 1935 the sandy ridgeline was
supratidal and covered by samphire vegetation (Belperio and Rice 1989).
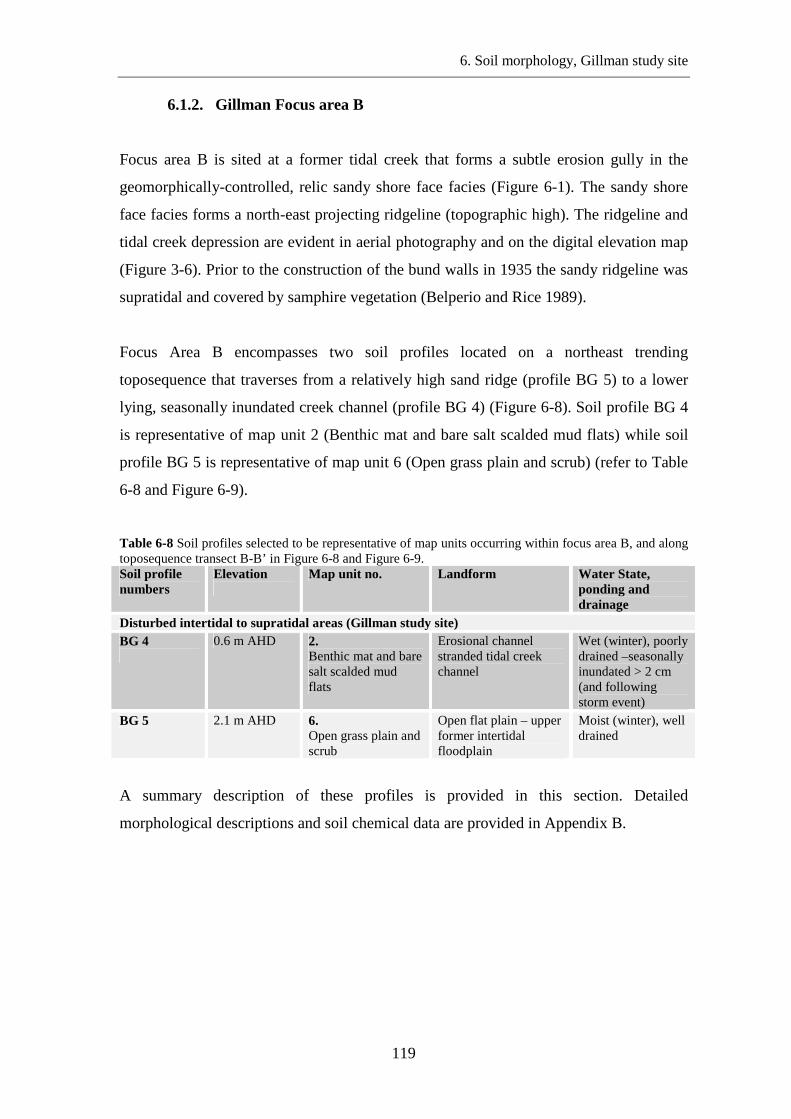
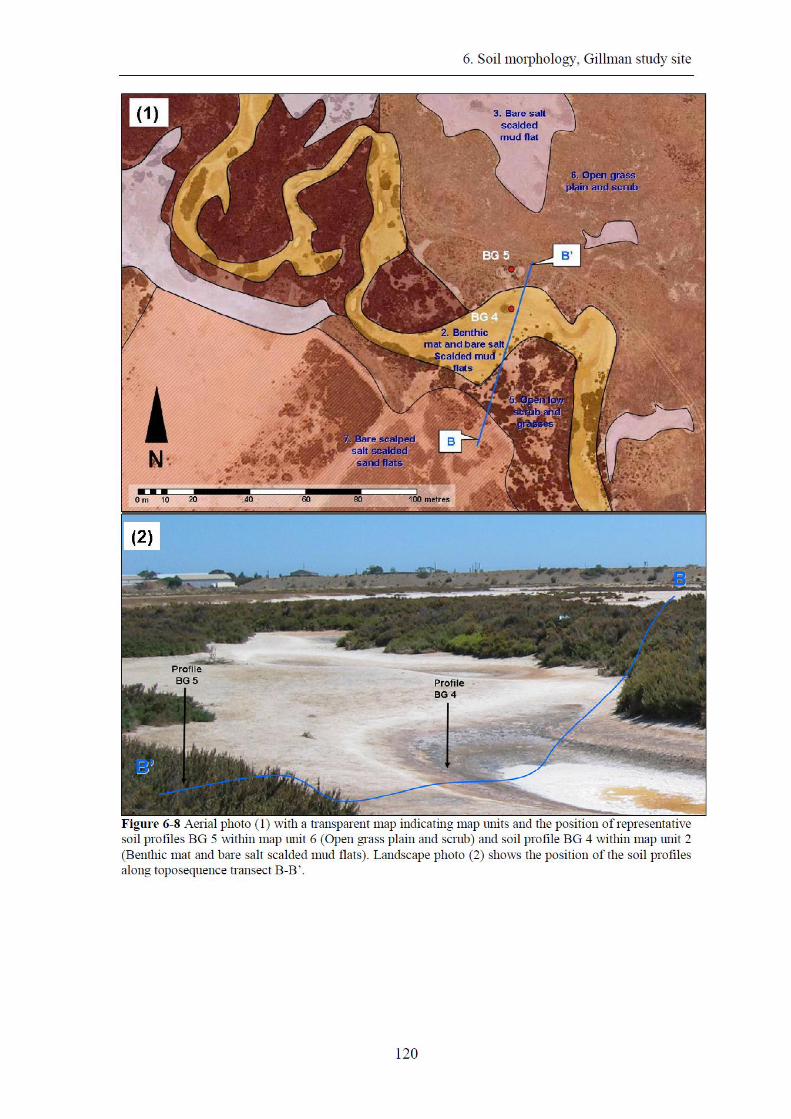
Focus Area B encompasses two soil profiles located on a northeast trending
toposequence that traverses from a relatively high sand ridge (profile BG 5) to a lower
lying, seasonally inundated creek channel (profile BG 4) (Figure 6-8). Soil profile BG 4
is representative of map unit 2 (Benthic mat and bare salt scalded mud flats) while soil
profile BG 5 is representative of map unit 6 (Open grass plain and scrub) (refer to Table
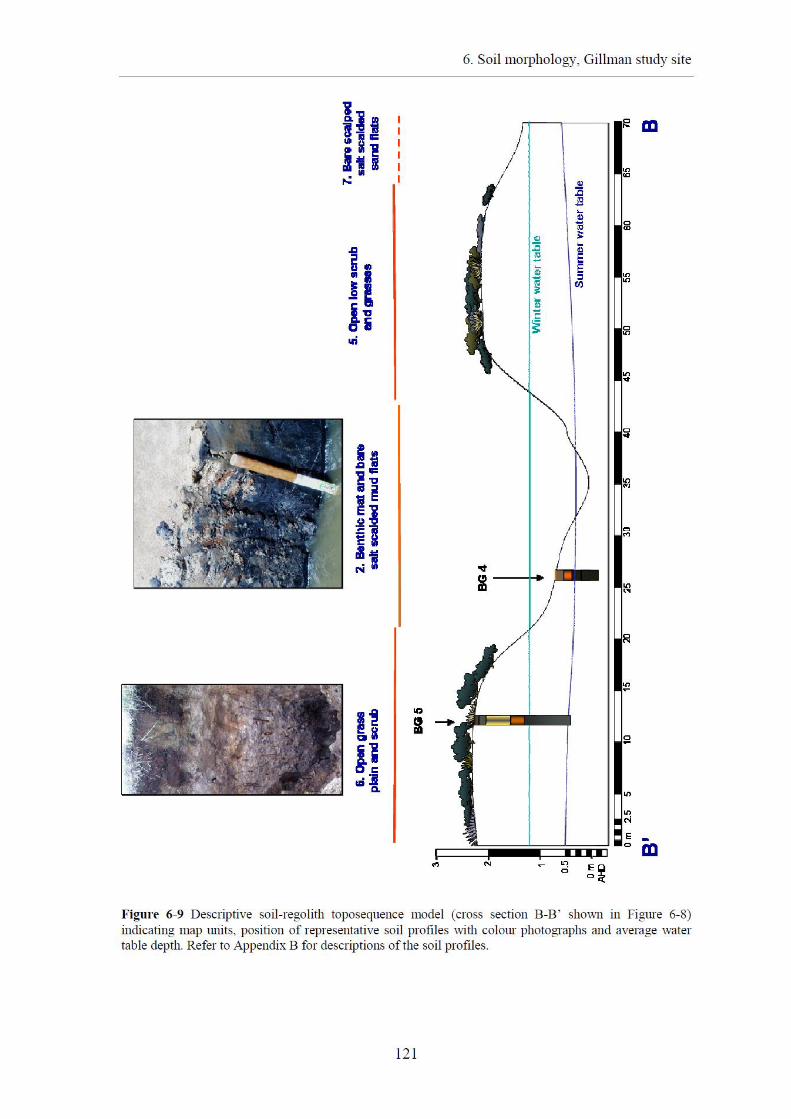
6-8 and Figure 6-9).
Table 6-8 Soil profiles selected to be representative of map units occurring within focus area B, and along toposequence transect B-B’ in Figure 6-8 and Figure 6-9. Soil profile numbers
Elevation
Map unit no. Landform Water State, ponding and drainage
Disturbed intertidal to supratidal areas (Gillman study site) BG 4
0.6 m AHD 2. Benthic mat and bare salt scalded mud flats
Erosional channel stranded tidal creek channel
Wet (winter), poorly drained –seasonally inundated > 2 cm (and following storm event)
BG 5 2.1 m AHD 6. Open grass plain and scrub
Open flat plain – upper former intertidal floodplain
Moist (winter), well drained
A summary description of these profiles is provided in this section. Detailed
morphological descriptions and soil chemical data are provided in Appendix B.
6. Soil morphology, Gillman study site
122
Summary - Gillman Focus area B
Toposequence B-B’ traverses from elevated sandy shore face facies sediments (profile
BG 5) to low lying sandy tidal creek sediments (soil profile BG 4) (Figure 6-8 and
Figure 6-9). These two profiles have different physical features (e.g. water state and
redox conditions), which are reflected by their chemical and acid sulfate soil
characteristics. The profiles share characteristics to other soils that occur in the same
map unit counterparts. Profile BG 5 is similar to BG 11, being relatively leached of salts
and sulfur and containing sulfuric materials above the redox boundary (Appendix B).
Minor residual, reduced inorganic sulfur remains in the oxidised zone but SCR contents
are much higher below the redox boundary in gleyed soils horizons. Some topographical
edge effect would probably have contributed to the leaching of profile BG 5, which is
positioned on the bank of the creek depression (Figure 6-9). This topographically
controlled leaching (edge) effect is evident on aerial photographs by a sharp contrast in
vegetation (surface cover type) along the banks of creek depressions (Figure 6-1).
The creek depression in which profile BG 4 is located is inundated seasonally, or
following substantial storms events. When profile BG 4 is inundated for extended
periods it resembles the subaqueous soil profile BG P 5 (map unit 1); with black, gel-
like near surface layers. During summer subsoil layers in profile BG 4 retain very high
AVS contents (up to 3.5%), and high reduced inorganic sulfur contents (up to 7.1%)
(Appendix B). During dry months the near surface layers (top 10 to 20 cm) of profile
BG 4 are partially oxidised and become acidic with pH <4 (Appendix B). Soil horizons
containing monosulfidic material have also accumulated carbonate/bicarbonate (of about
7% CaCO3).
Profile BG 4 had similarly high SCR and net acidity contents in subsoil layers to the
sandy soil profile BG 17 (map unit 3).
6. Soil morphology, Gillman study site
123
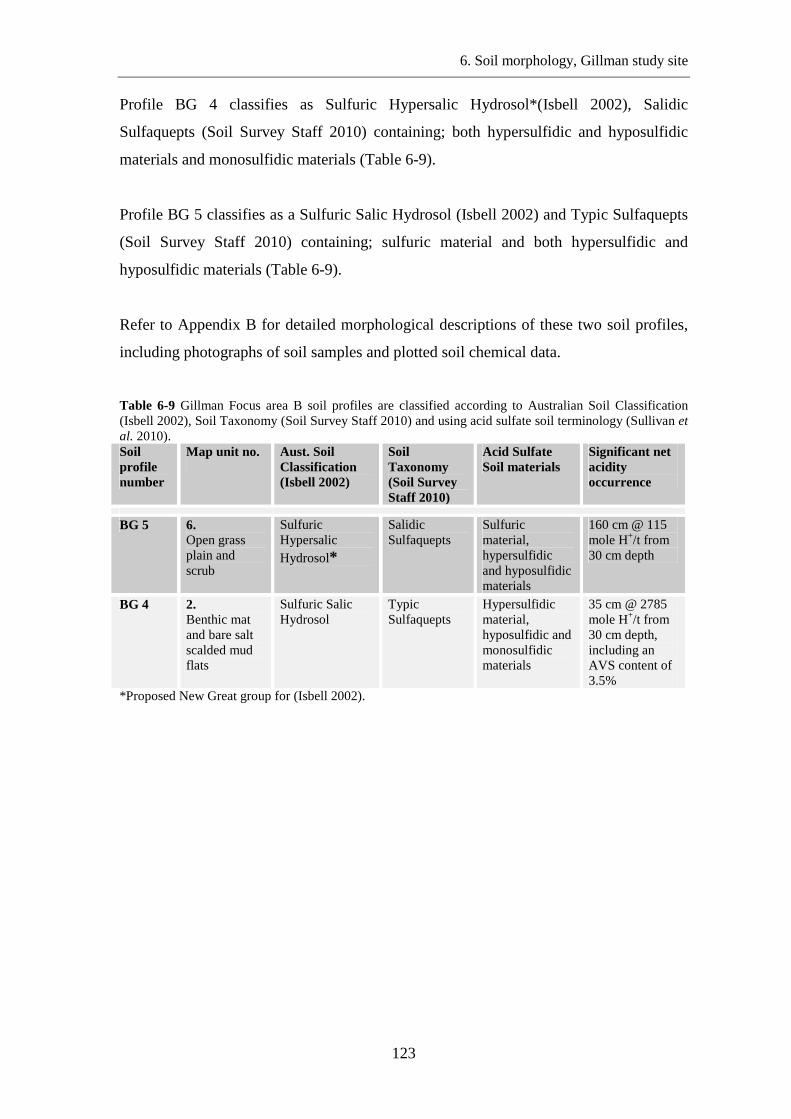
Profile BG 4 classifies as Sulfuric Hypersalic Hydrosol*(Isbell 2002), Salidic
Sulfaquepts (Soil Survey Staff 2010) containing; both hypersulfidic and hyposulfidic
materials and monosulfidic materials (Table 6-9).
Profile BG 5 classifies as a Sulfuric Salic Hydrosol (Isbell 2002) and Typic Sulfaquepts
(Soil Survey Staff 2010) containing; sulfuric material and both hypersulfidic and
hyposulfidic materials (Table 6-9).
Refer to Appendix B for detailed morphological descriptions of these two soil profiles,
including photographs of soil samples and plotted soil chemical data.
Table 6-9 Gillman Focus area B soil profiles are classified according to Australian Soil Classification (Isbell 2002), Soil Taxonomy (Soil Survey Staff 2010) and using acid sulfate soil terminology (Sullivan et al. 2010). Soil profile number
Map unit no.
Aust. Soil Classification (Isbell 2002)
Soil Taxonomy (Soil Survey Staff 2010)
Acid Sulfate Soil materials
Significant net acidity occurrence
BG 5 6. Open grass plain and scrub
Sulfuric Hypersalic Hydrosol*
Salidic Sulfaquepts
Sulfuric material, hypersulfidic and hyposulfidic materials
160 cm @ 115 mole H+/t from 30 cm depth
BG 4 2. Benthic mat and bare salt scalded mud flats
Sulfuric Salic Hydrosol
Typic Sulfaquepts
Hypersulfidic material, hyposulfidic and monosulfidic materials
35 cm @ 2785 mole H+/t from 30 cm depth, including an AVS content of 3.5%
*Proposed New Great group for (Isbell 2002).
6. Soil morphology, Gillman study site
124
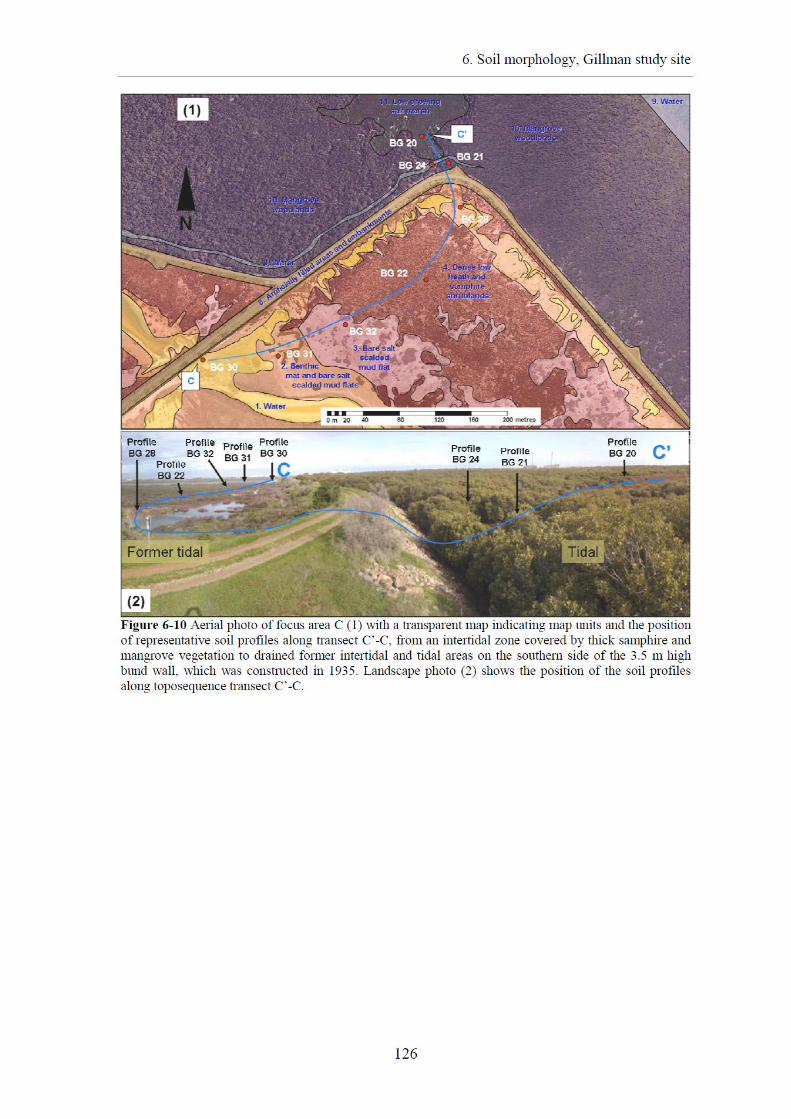
6.1.3. Gillman Focus area C
Focus area C is situated at the northern end of Gillman and covers the undrained
(intertidal) and drained (formerly intertidal) zones on either side of the bund wall (Figure
6-10 and Figure 6-11). The undisturbed area to the north of the bund wall is covered by
thick intertidal samphire and mangrove vegetation that is generally flooded each day.
This section of the bund wall was constructed in 1935. The drained part of Focus area C
was formerly covered by intertidal samphire and mangrove vegetation.
The southern section of Focus area C is characterised by a low-lying, stranded tidal
creek that forms a lake (ponding basin) during wet winter months. The lake is fed by
stormwater overflow from the Range Wetlands (at Focus area A; Figure 6-1). The
majority of the lake dries out during summer, with a small body of water remaining at
the bund wall which acts as a dam. Soil profile BG 30 was located at this area of
permanent water (Figure 6-11).
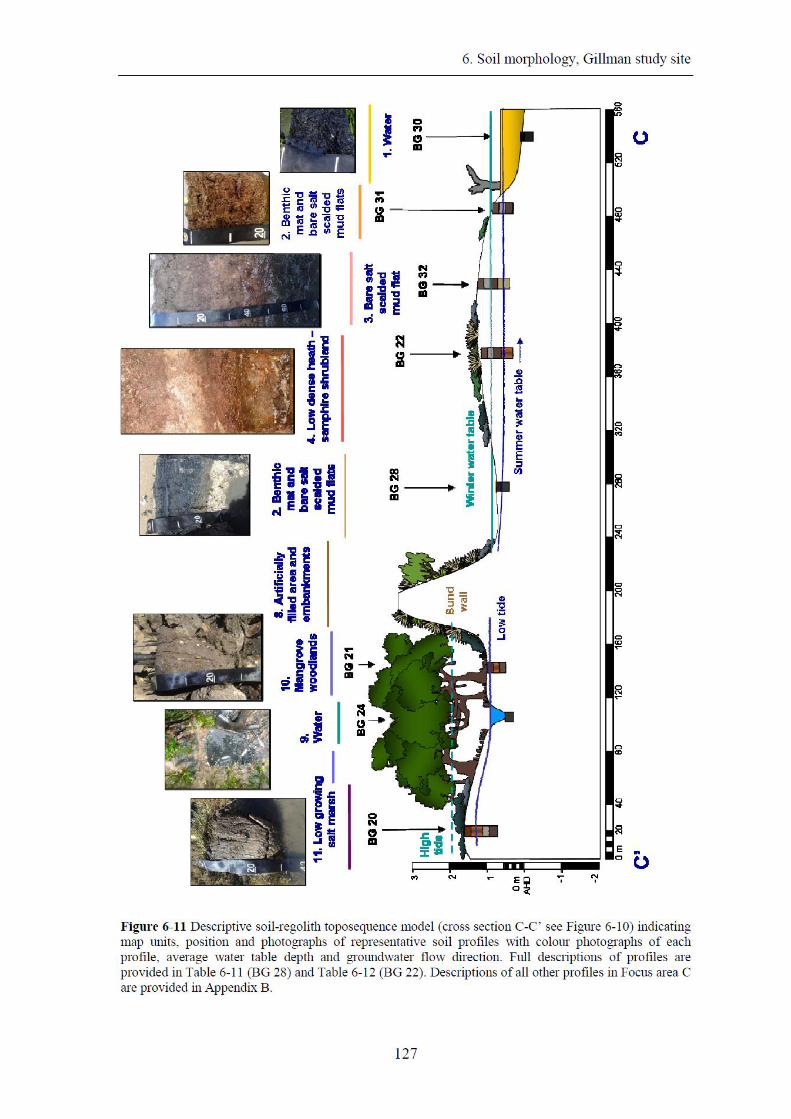
Focus Area C encompasses eight soil profiles located on a 550 m long, north-south
trending toposequence. The toposequence C’-C traverses across the bund wall from tidal
samphire and mangrove vegetation to drained samphire vegetation and across relatively
low lying seasonally and permanently inundated creek channel soils (Figure 6-11).
The tidal zone contains map units 9 (Water), 10 (Mangrove woodlands) and 11 (Low
growing salt marsh plants), that are represented by soil profiles BG 24, BG 21 and BG
20 respectively (Table 6-10).
Four map units occur on the southern (drained) side of the bund wall and include 1
(Water), 2 (Benthic mat and bare salt scalded mud flats), 3 (Bare salt scalded mud flats)
and 4 (Dense low heath-samphire shrublands). These map units are represented by soil
profiles BG 30, BG 28, BG 32 and BG 22 respectively (refer to Figure 6-10 and Table
6-10).
In this section full profile descriptions are provided for soil profiles BG 28 and BG 22 to
represent map units 2 and 4. Characteristics of the remaining 6 soil profiles that occur on
toposequence C’-C are summarised in the discussion below and comparisons are made
6. Soil morphology, Gillman study site
125
to soil profiles occurring within equivalent map units from other focus areas. Detailed
morphological descriptions of these six soil profiles, including photographs of soil
samples and plotted soil chemical data, are provided in Appendix B.
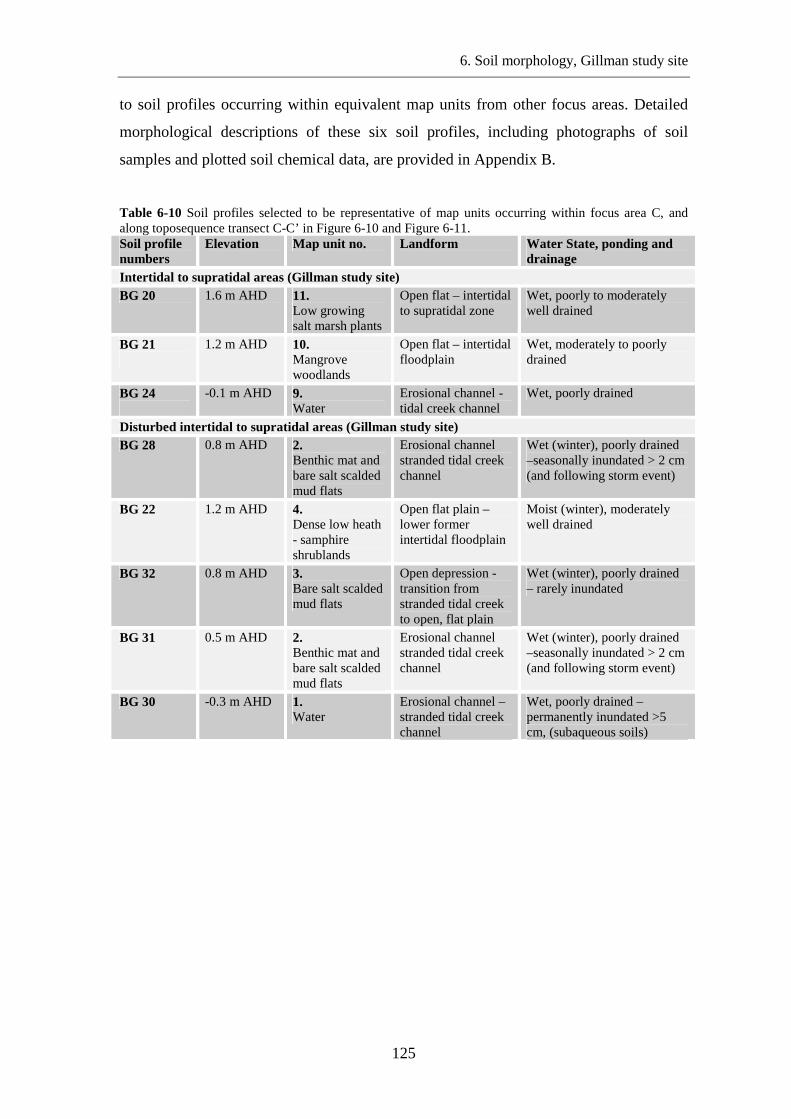
Table 6-10 Soil profiles selected to be representative of map units occurring within focus area C, and along toposequence transect C-C’ in Figure 6-10 and Figure 6-11. Soil profile numbers
Elevation
Map unit no. Landform Water State, ponding and drainage
Intertidal to supratidal areas (Gillman study site) BG 20 1.6 m AHD 11.
Low growing salt marsh plants
Open flat – intertidal to supratidal zone
Wet, poorly to moderately well drained
BG 21
1.2 m AHD 10. Mangrove woodlands
Open flat – intertidal floodplain
Wet, moderately to poorly drained
BG 24
-0.1 m AHD 9. Water
Erosional channel - tidal creek channel
Wet, poorly drained
Disturbed intertidal to supratidal areas (Gillman study site) BG 28 0.8 m AHD 2.
Benthic mat and bare salt scalded mud flats
Erosional channel stranded tidal creek channel
Wet (winter), poorly drained –seasonally inundated > 2 cm (and following storm event)
BG 22 1.2 m AHD 4. Dense low heath - samphire shrublands
Open flat plain – lower former intertidal floodplain
Moist (winter), moderately well drained
BG 32 0.8 m AHD 3. Bare salt scalded mud flats
Open depression - transition from stranded tidal creek to open, flat plain
Wet (winter), poorly drained – rarely inundated
BG 31 0.5 m AHD 2. Benthic mat and bare salt scalded mud flats
Erosional channel stranded tidal creek channel
Wet (winter), poorly drained –seasonally inundated > 2 cm (and following storm event)
BG 30 -0.3 m AHD 1. Water
Erosional channel –stranded tidal creek channel
Wet, poorly drained – permanently inundated >5 cm, (subaqueous soils)
6. Soil morphology, Gillman study site
128
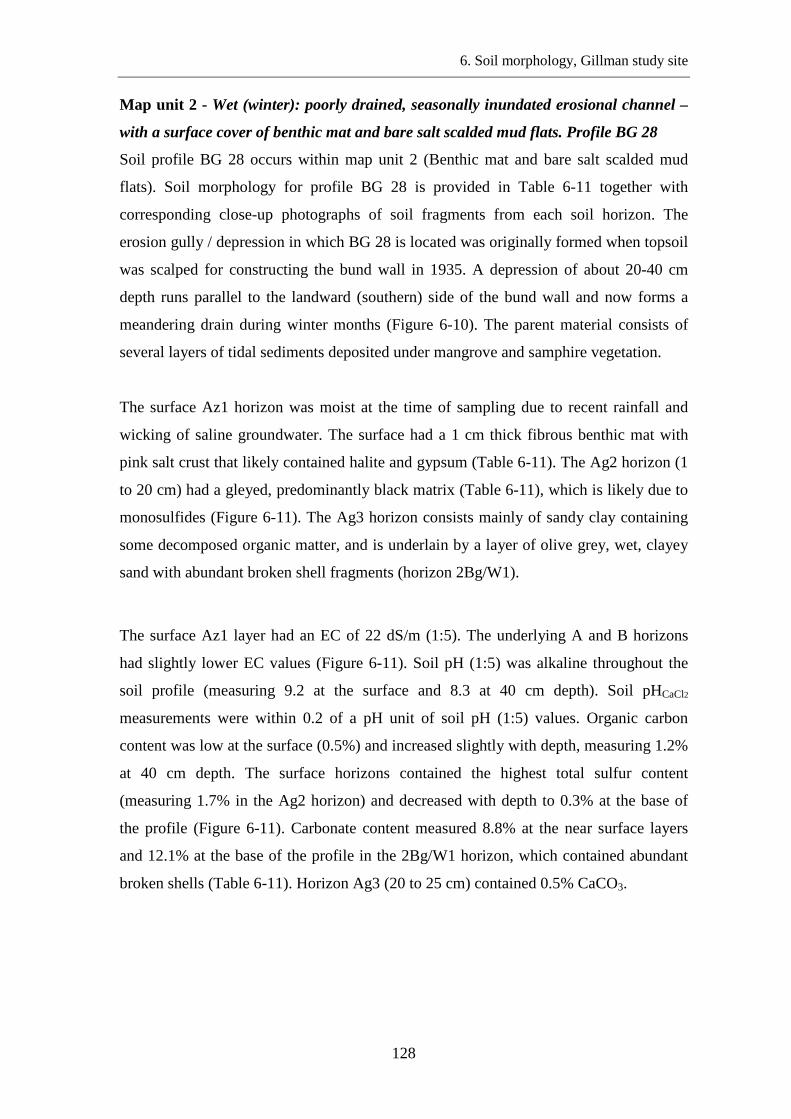
Map unit 2 - Wet (winter): poorly drained, seasonally inundated erosional channel –
with a surface cover of benthic mat and bare salt scalded mud flats. Profile BG 28
Soil profile BG 28 occurs within map unit 2 (Benthic mat and bare salt scalded mud
flats). Soil morphology for profile BG 28 is provided in Table 6-11 together with
corresponding close-up photographs of soil fragments from each soil horizon. The
erosion gully / depression in which BG 28 is located was originally formed when topsoil
was scalped for constructing the bund wall in 1935. A depression of about 20-40 cm
depth runs parallel to the landward (southern) side of the bund wall and now forms a
meandering drain during winter months (Figure 6-10). The parent material consists of
several layers of tidal sediments deposited under mangrove and samphire vegetation.
The surface Az1 horizon was moist at the time of sampling due to recent rainfall and
wicking of saline groundwater. The surface had a 1 cm thick fibrous benthic mat with
pink salt crust that likely contained halite and gypsum (Table 6-11). The Ag2 horizon (1
to 20 cm) had a gleyed, predominantly black matrix (Table 6-11), which is likely due to
monosulfides (Figure 6-11). The Ag3 horizon consists mainly of sandy clay containing
some decomposed organic matter, and is underlain by a layer of olive grey, wet, clayey
sand with abundant broken shell fragments (horizon 2Bg/W1).
The surface Az1 layer had an EC of 22 dS/m (1:5). The underlying A and B horizons
had slightly lower EC values (Figure 6-11). Soil pH (1:5) was alkaline throughout the
soil profile (measuring 9.2 at the surface and 8.3 at 40 cm depth). Soil pHCaCl2
measurements were within 0.2 of a pH unit of soil pH (1:5) values. Organic carbon
content was low at the surface (0.5%) and increased slightly with depth, measuring 1.2%
at 40 cm depth. The surface horizons contained the highest total sulfur content
(measuring 1.7% in the Ag2 horizon) and decreased with depth to 0.3% at the base of
the profile (Figure 6-11). Carbonate content measured 8.8% at the near surface layers
and 12.1% at the base of the profile in the 2Bg/W1 horizon, which contained abundant
broken shells (Table 6-11). Horizon Ag3 (20 to 25 cm) contained 0.5% CaCO3.
6. Soil morphology, Gillman study site
129
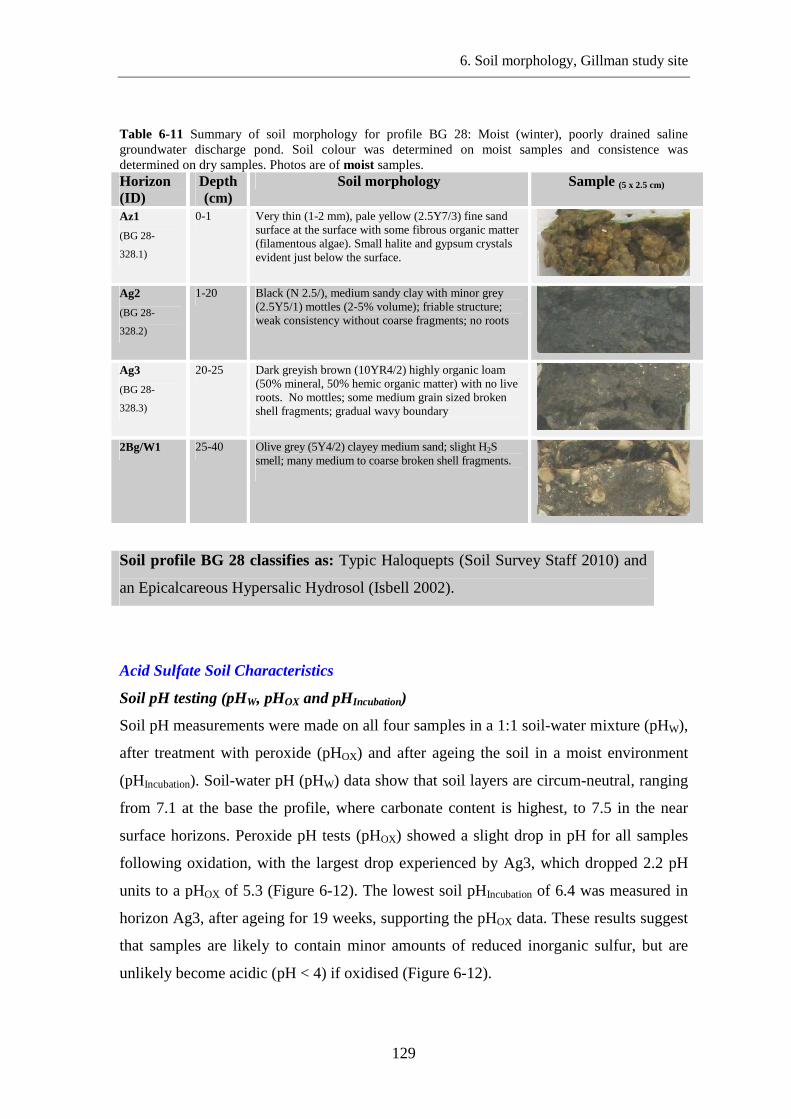
Table 6-11 Summary of soil morphology for profile BG 28: Moist (winter), poorly drained saline groundwater discharge pond. Soil colour was determined on moist samples and consistence was determined on dry samples. Photos are of moist samples. Horizon (ID)
Depth (cm)
Soil morphology Sample (5 x 2.5 cm)
Az1
(BG 28-
328.1)
0-1 Very thin (1-2 mm), pale yellow (2.5Y7/3) fine sand surface at the surface with some fibrous organic matter (filamentous algae). Small halite and gypsum crystals evident just below the surface.
Ag2
(BG 28-
328.2)
1-20 Black (N 2.5/), medium sandy clay with minor grey (2.5Y5/1) mottles (2-5% volume); friable structure; weak consistency without coarse fragments; no roots
Ag3
(BG 28-
328.3)
20-25 Dark greyish brown (10YR4/2) highly organic loam (50% mineral, 50% hemic organic matter) with no live roots. No mottles; some medium grain sized broken shell fragments; gradual wavy boundary
2Bg/W1 25-40 Olive grey (5Y4/2) clayey medium sand; slight H2S smell; many medium to coarse broken shell fragments.
Soil profile BG 28 classifies as: Typic Haloquepts (Soil Survey Staff 2010) and
an Epicalcareous Hypersalic Hydrosol (Isbell 2002).
Acid Sulfate Soil Characteristics
Soil pH testing (pHW, pHOX and pHIncubation)
Soil pH measurements were made on all four samples in a 1:1 soil-water mixture (pHW),
after treatment with peroxide (pHOX) and after ageing the soil in a moist environment
(pHIncubation). Soil-water pH (pHW) data show that soil layers are circum-neutral, ranging
from 7.1 at the base the profile, where carbonate content is highest, to 7.5 in the near
surface horizons. Peroxide pH tests (pHOX) showed a slight drop in pH for all samples
following oxidation, with the largest drop experienced by Ag3, which dropped 2.2 pH
units to a pHOX of 5.3 (Figure 6-12). The lowest soil pHIncubation of 6.4 was measured in
horizon Ag3, after ageing for 19 weeks, supporting the pHOX data. These results suggest
that samples are likely to contain minor amounts of reduced inorganic sulfur, but are
unlikely become acidic (pH < 4) if oxidised (Figure 6-12).
6. Soil morphology, Gillman study site
130
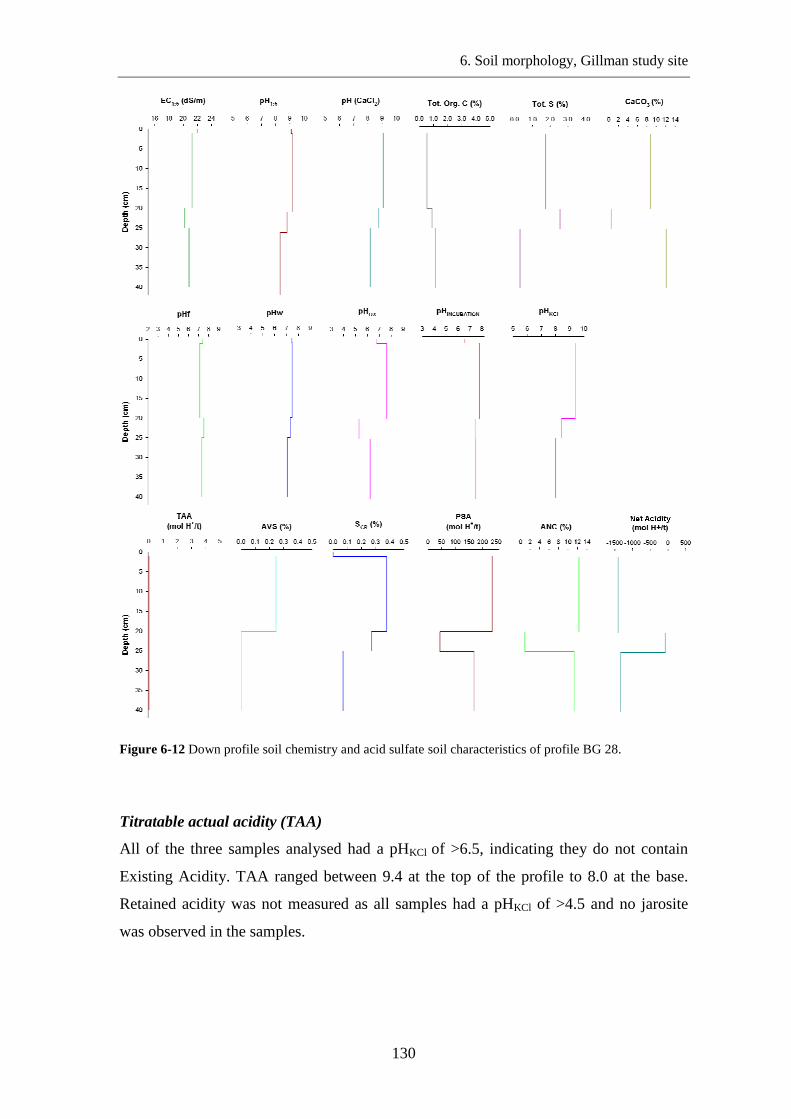
Figure 6-12 Down profile soil chemistry and acid sulfate soil characteristics of profile BG 28.
Titratable actual acidity (TAA)
All of the three samples analysed had a pHKCl of >6.5, indicating they do not contain
Existing Acidity. TAA ranged between 9.4 at the top of the profile to 8.0 at the base.
Retained acidity was not measured as all samples had a pHKCl of >4.5 and no jarosite
was observed in the samples.
6. Soil morphology, Gillman study site
131
Acid Volatile Sulfur
Acid volatile sulfur was determined for soil horizon Ag2 (1 to 20 cm) due to its black
matrix colour, and measured 0.25% AVS.
Chromium Reducible Sulfur (SCR)
Reduced inorganic sulfur values measured 0.38% in horizon Ag2, 0.27% in horizon Ag3
and 0.07% in the 2Bg/W1 horizon, indicating that these layers contained Potential
Sulfidic Acidity (Figure 6-12).
Acid Neutralising Capacity (ANC)
Acid neutralising capacities were high (above 11%) in the near surface Ag2 horizon and
lower 2Bg/W1 horizon. The Ag3 horizon had an ANC of 0.9%.
Net Acidity
Net Acidity values are negative for all soil layers assessed and range between -72 and -
1326.5 mole H+/tonne, with a mean of -937 mole H+/tonne for the profile (Figure 6-12).
This is to be expected with relatively high ANC values found in the soil.
Acid sulfate soil classification: According to the acid sulfate soil terminology
adopted (refer to Table 4-2), soil profile BG 28 classifies as an acid sulfate soil,
containing; hyposulfidic material and monosulfidic material.
6. Soil morphology, Gillman study site
132
Map unit 4 - Moist (winter): moderately well drained, open flat plain in the lower
former intertidal floodplain with a surface cover of dense low heath and samphire
shrublands. Profile BG 22.
Soil profile BG 22 occurs within map unit 4 (Dense low heath and samphire
shrublands). Soil morphology for profile BG 22 is provided in Table 6-12 together with
a corresponding close-up photograph of soil fragments from each horizon. Profile BG 22
developed in an intertidal regime prior to construction of the bund wall. The soil
material consisted of an organic rich sandy loam layer (25 cm thick) that formed under
samphire and mangrove vegetation. A shell grit layer (buried chenier ridge) occurred
below 40 cm.
The near surface horizon (Oe1; 0-5 cm) consisted of a moderately well drained, friable,
organic rich fine sandy loam with some live and dead roots, and no redoximorphic
features. The underlying Oe2 horizon (5-15 cm) had a slightly higher mineral content
and was finely layered. Some strong brown mottles occurred along root channels. The
underlying Oe3 horizon (15-25 cm) had a subangular blocky structure with a slightly
stronger consistency and some strong brown mottles (about 5% volume).
Two B horizons occur below the organic rich O horizons; 2Bw (25 to 40 cm) and
3Bg/W1 (40 to 65 cm). The 2Bw horizon consisted of greyish brown, medium loamy
sand (non-calcareous), with minor yellowish red mottling along fine root channels and
ped surfaces. The underlying 3Bg/W1 horizon was a gleyed, olive grey, medium sandy
clay with minor yellowish red mottles distributed through the matrix and along broken
shell surfaces (Table 6-12).
The surface Oe1 and Oe2 horizons had relatively low ECs of 8.6 and 8.7 dS/m (Figure
6-13). The three underlying layers had much higher ECs of 34.2, 27.1 and 22.1 dS/m
respectively. Soil pH (1:5) was slightly acidic in the upper three soil horizons, ranging
from 5.2 to 6.5, and increased with depth to a pH (1:5) of 9.3 at the base of the profile.
Soil pHCaCl2 measurements were within 0.2 pH units of pH (1:5) values (Figure 6-13).
Total organic carbon results were generally higher in the upper portion of the profile and
ranged from 6.9% in the surface Oe1 horizon to 1.3% in the 2Bw horizon. Total sulfur
measured 0.08% in the surface Oe1 horizon and increased slightly with depth, to a
maximum of 0.56% in horizon Oe3. Carbonate content measured zero in the upper four
6. Soil morphology, Gillman study site
133
horizons and 36.1% at the base of the soil profile (40 to 65 cm depth) in the 3Bg/W1
horizon. The soil morphology for profile BG 22 is detailed in Table 6-12.
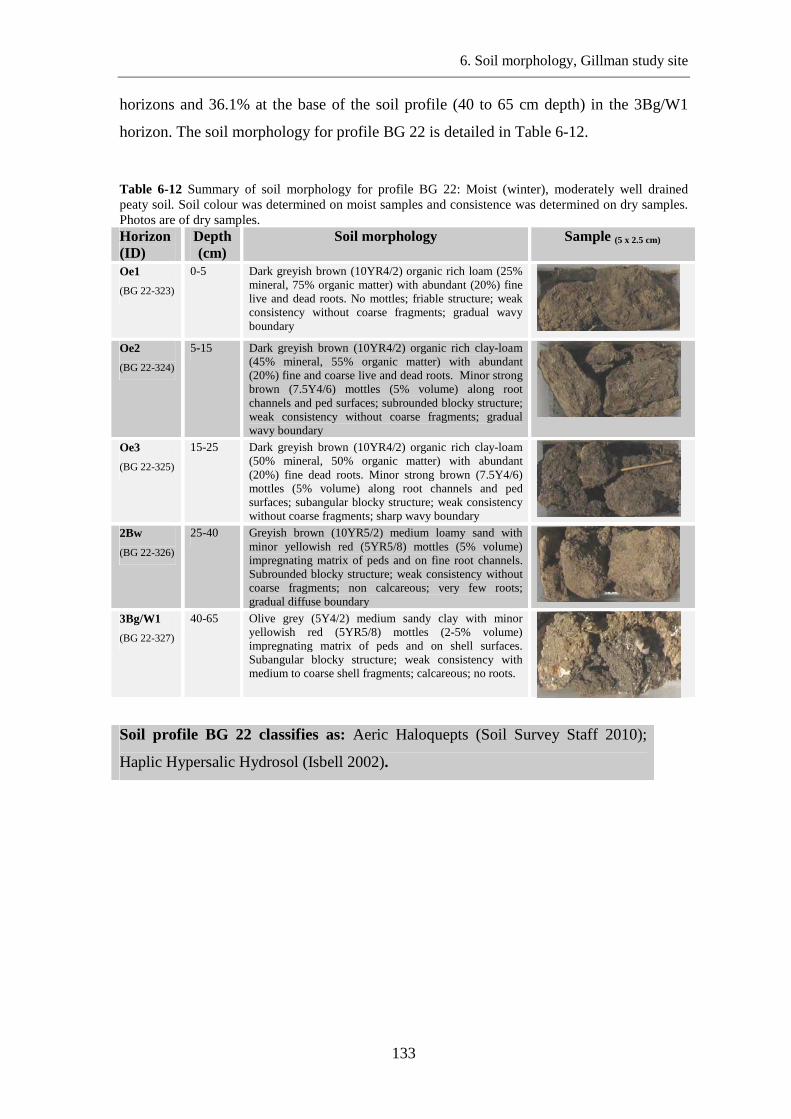
Table 6-12 Summary of soil morphology for profile BG 22: Moist (winter), moderately well drained peaty soil. Soil colour was determined on moist samples and consistence was determined on dry samples. Photos are of dry samples. Horizon (ID)
Depth (cm)
Soil morphology Sample (5 x 2.5 cm)
Oe1
(BG 22-323)
0-5 Dark greyish brown (10YR4/2) organic rich loam (25% mineral, 75% organic matter) with abundant (20%) fine live and dead roots. No mottles; friable structure; weak consistency without coarse fragments; gradual wavy boundary
Oe2
(BG 22-324)
5-15 Dark greyish brown (10YR4/2) organic rich clay-loam (45% mineral, 55% organic matter) with abundant (20%) fine and coarse live and dead roots. Minor strong brown (7.5Y4/6) mottles (5% volume) along root channels and ped surfaces; subrounded blocky structure; weak consistency without coarse fragments; gradual wavy boundary
Oe3
(BG 22-325)
15-25 Dark greyish brown (10YR4/2) organic rich clay-loam (50% mineral, 50% organic matter) with abundant (20%) fine dead roots. Minor strong brown (7.5Y4/6) mottles (5% volume) along root channels and ped surfaces; subangular blocky structure; weak consistency without coarse fragments; sharp wavy boundary
2Bw
(BG 22-326) 25-40 Greyish brown (10YR5/2) medium loamy sand with
minor yellowish red (5YR5/8) mottles (5% volume) impregnating matrix of peds and on fine root channels. Subrounded blocky structure; weak consistency without coarse fragments; non calcareous; very few roots; gradual diffuse boundary
3Bg/W1
(BG 22-327) 40-65 Olive grey (5Y4/2) medium sandy clay with minor
yellowish red (5YR5/8) mottles (2-5% volume) impregnating matrix of peds and on shell surfaces. Subangular blocky structure; weak consistency with medium to coarse shell fragments; calcareous; no roots.
Soil profile BG 22 classifies as: Aeric Haloquepts (Soil Survey Staff 2010);
Haplic Hypersalic Hydrosol (Isbell 2002).
6. Soil morphology, Gillman study site
134
Acid Sulfate Soil Characteristics
Soil pH testing (pHW, pHOX and pHIncubation)
Soil pH measurements were made on soil samples from all 5 soil layers using a 1:1 soil-
water mixture (pHW), after treatment with peroxide (pHOX) and after ageing (pHIncubation)
the soil in a moist environment for up to19 weeks. Soil-water pH (pHW) data show that
soil layers range from acidic (pHW 4.7) to circum-neutral (pHW 7.5) at the base the
profile. Peroxide oxidation tests (pHOX) showed no significant drop in pH (from a pHW
of > 4 to a resultant pHOX of 2.5 or less) in any of the samples, indicating they are
unlikely to contain hypersulfidic material (Figure 6-13). After incubating soil samples,
none experienced a significant drop in pH to less than pH 4, supporting the pHOX data.
Four of the five samples showed a slight rise in pH of between 0.5 and 1 pH unit after
incubation.
Existing acidity (Titratable actual acidity (TAA) and Retained acidity)
pHKCl results for four of the five samples analysed were > 6.5, indicating they did not
contain Existing Acidity. The B1 horizon had a pHKCl of 6.18 but no TAA was
measured. pHKCl ranged from 6.2 to 9.3. Retained acidity was considered zero as all
pHKCl results were well above 4.5 and no jarosite was observed in the samples.
Acid Volatile Sulfur (AVS)
All five samples were analysed for AVS due to dark grey matrix colours being present.
An AVS content of 0.01% was detected only in the surface Oe1 horizon (0-5 cm) only
(Figure 6-13).
Chromium Reducible Sulfur (SCR)
Reduced inorganic sulfur was determined for all five layers within the profile. SCR
values were very low (0.01%) in the upper three O horizons. SCR measured 0.05% in the
2Bw horizon (25 to 40 cm), and 0.22% in the 3Bg/W1 horizon (40-65 cm), indicating
they contain notable Potential Sulfidic Acidity.
Acid Neutralising Capacity (ANC)
Effective ANC was only detected in the 3Bg/W1 horizon (12.4% CaCO3).
6. Soil morphology, Gillman study site
135
Net Acidity
Net acidity values were low but positive for the upper four soil horizons, ranging from 4
to 33 mole H+/tonne. Net acidity of the 3Bg/W1 horizon was very negative (measuring -
1507 mole H+/tonne) (Figure 6-13).
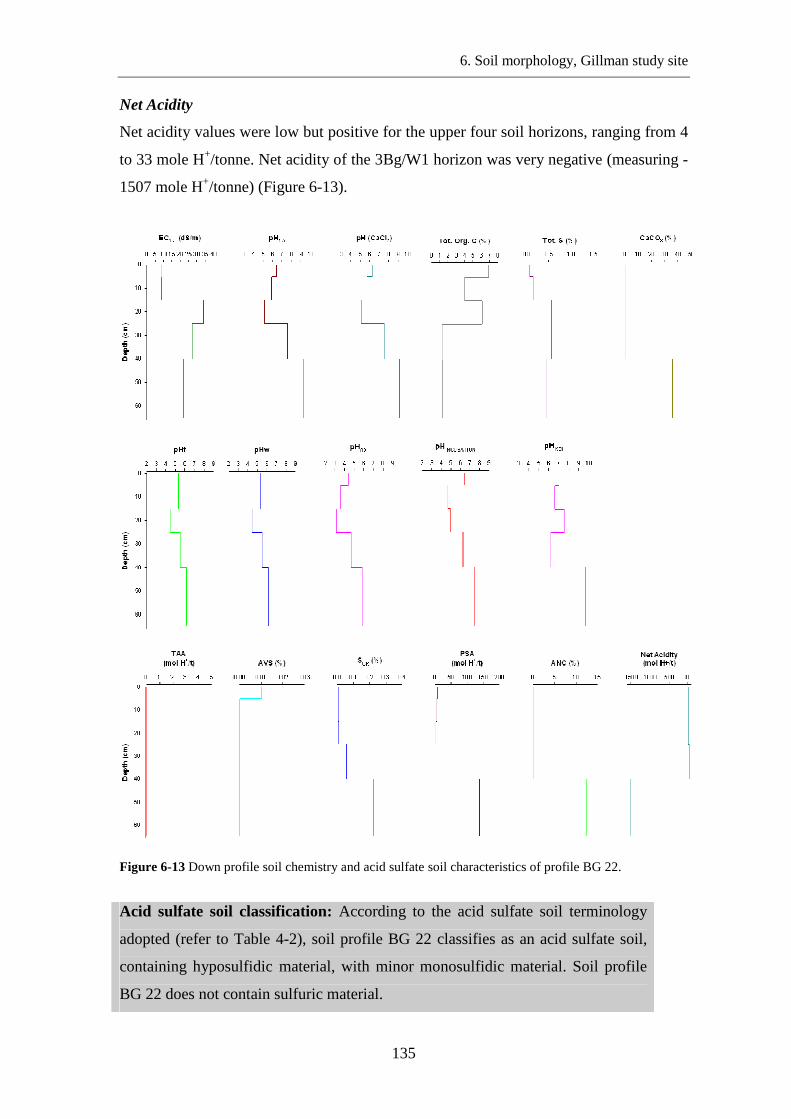
Figure 6-13 Down profile soil chemistry and acid sulfate soil characteristics of profile BG 22.
Acid sulfate soil classification: According to the acid sulfate soil terminology
adopted (refer to Table 4-2), soil profile BG 22 classifies as an acid sulfate soil,
containing hyposulfidic material, with minor monosulfidic material. Soil profile
BG 22 does not contain sulfuric material.
6. Soil morphology, Gillman study site
136
Summary – Gillman Focus area C
Toposequence C-C’ traverses across the bund wall from intertidal samphire to former
tidal creek sediments. The soil profiles from map units 3 and 4 represent the ‘drained’
equivalent of map units 10 and 11 (Figure 6-11).
Oxidation of sulfides has lowered soil pH (although not forming sulfuric material) and
removed carbonate from the drained soil profiles. The loss of tidal flushing has caused
reduced inorganic sulfur contents to build up at the lowest positions in the landscape.
These areas are represented by map units 1 and 2 and contain subaqueous and seasonally
inundated soil profiles (e.g. BG 30 and BG 28). Reduced inorganic sulfur contents
recorded in the disturbed area of Gillman Focus area C were highest in subaqueous soil
profile BG 30 (with an AVS of 1.2% and a SCR of 1.7%) (Appendix B). The maximum
reduced inorganic sulfur contents found in tidally flushed subaqueous soil, within Barker
Inlet, was from profile BG 24 (AVS of 0.32% and a SCR of 0.72%; Appendix B).
Reducing environments within the bunded (formerly tidal) area at Gillman generally
contained higher levels of SCR and AVS than soils within tidally influenced areas.
Soil profiles BG 21 and BG 20, within the intertidal zone and both classify as Hemic,
Sulfidic, Intertidal Hydrosols (Isbell 2002), and Sulfic Hydrowassents (Soil Survey Staff
2010), containing hypersulfidic and hyposulfidic materials and minor monosulfidic
materials. Soil profile BG 24 was located in a tidal creek channel and classified as a
Hemic, Epicalcareous, Intertidal Hydrosol (Isbell 2002) and a Typic Hydrowassents
(Soil Survey Staff 2010), containing hyposulfidic materials and monosulfidic materials
(Table 6-13). These 3 soil profiles had similar chemical characteristics to intertidal soil
profiles at St Kilda (occurring within the comparable map units).
On the southern (non-tidal) side of the bund wall soil profile BG 30 occurs at the lowest
position in the landscape and classifies as a Sodosolic Salic Hydrosol (Isbell 2002) and a
Typic Hydrowassents (Soil Survey Staff 2010), containing; hyposulfidic and
monosulfidic materials. Profiles BG 28 and BG 31 occurred in map unit 2. Profile BG
28 classified as an Epicalcareous Hypersalic Hydrosol (Isbell 2002) and Typic
Haloquepts (Soil Survey Staff 2010), and contained hyposulfidic and monosulfidic
materials. Soil profiles BG 31 classified as a Haplic Hypersalic Hydrosol (Isbell 2002)
6. Soil morphology, Gillman study site
137
and a Aeric Haloquepts (Soil Survey Staff 2010), containing hyposulfidic materials
(Table 6-13).
Soil profiles BG 22 and BG 32 were located within map units 3 and 4 and classified as
Haplic Hypersalic Hydrosols (Isbell 2002) and Aeric Haloquepts (Soil Survey Staff
2010), containing hyposulfidic materials (Table 6-13).
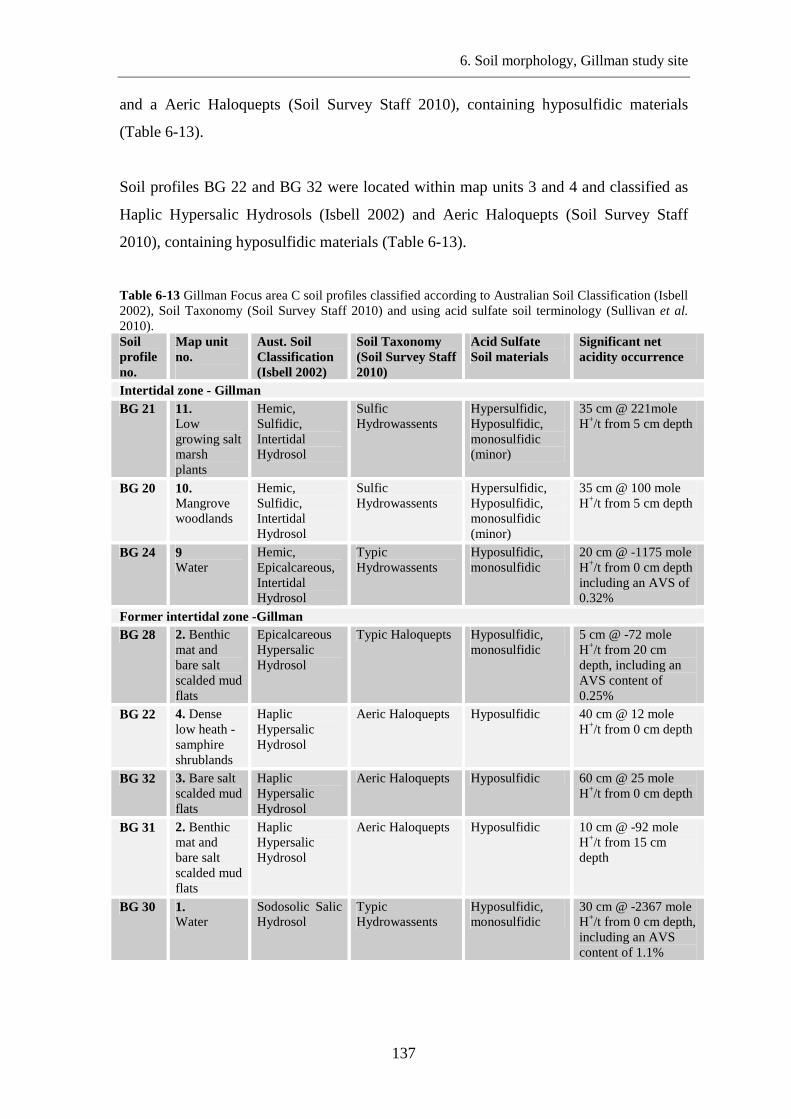
Table 6-13 Gillman Focus area C soil profiles classified according to Australian Soil Classification (Isbell 2002), Soil Taxonomy (Soil Survey Staff 2010) and using acid sulfate soil terminology (Sullivan et al. 2010). Soil profile no.
Map unit no.
Aust. Soil Classification (Isbell 2002)
Soil Taxonomy (Soil Survey Staff 2010)
Acid Sulfate Soil materials
Significant net acidity occurrence
Intertidal zone - Gillman BG 21 11.
Low growing salt marsh plants
Hemic, Sulfidic, Intertidal Hydrosol
Sulfic Hydrowassents
Hypersulfidic, Hyposulfidic, monosulfidic (minor)
35 cm @ 221mole H+/t from 5 cm depth
BG 20 10. Mangrove woodlands
Hemic, Sulfidic, Intertidal Hydrosol
Sulfic Hydrowassents
Hypersulfidic, Hyposulfidic, monosulfidic (minor)
35 cm @ 100 mole H+/t from 5 cm depth
BG 24 9 Water
Hemic, Epicalcareous, Intertidal Hydrosol
Typic Hydrowassents
Hyposulfidic, monosulfidic
20 cm @ -1175 mole H+/t from 0 cm depth including an AVS of 0.32%
Former intertidal zone -Gillman BG 28 2. Benthic
mat and bare salt scalded mud flats
Epicalcareous Hypersalic Hydrosol
Typic Haloquepts Hyposulfidic, monosulfidic
5 cm @ -72 mole H+/t from 20 cm depth, including an AVS content of 0.25%
BG 22 4. Dense low heath - samphire shrublands
Haplic Hypersalic Hydrosol
Aeric Haloquepts Hyposulfidic 40 cm @ 12 mole H+/t from 0 cm depth
BG 32 3. Bare salt scalded mud flats
Haplic Hypersalic Hydrosol
Aeric Haloquepts Hyposulfidic 60 cm @ 25 mole H+/t from 0 cm depth
BG 31 2. Benthic mat and bare salt scalded mud flats
Haplic Hypersalic Hydrosol
Aeric Haloquepts Hyposulfidic 10 cm @ -92 mole H+/t from 15 cm depth
BG 30 1. Water
Sodosolic Salic Hydrosol
Typic Hydrowassents
Hyposulfidic, monosulfidic
30 cm @ -2367 mole H+/t from 0 cm depth, including an AVS content of 1.1%
6. Soil morphology, Gillman study site
138
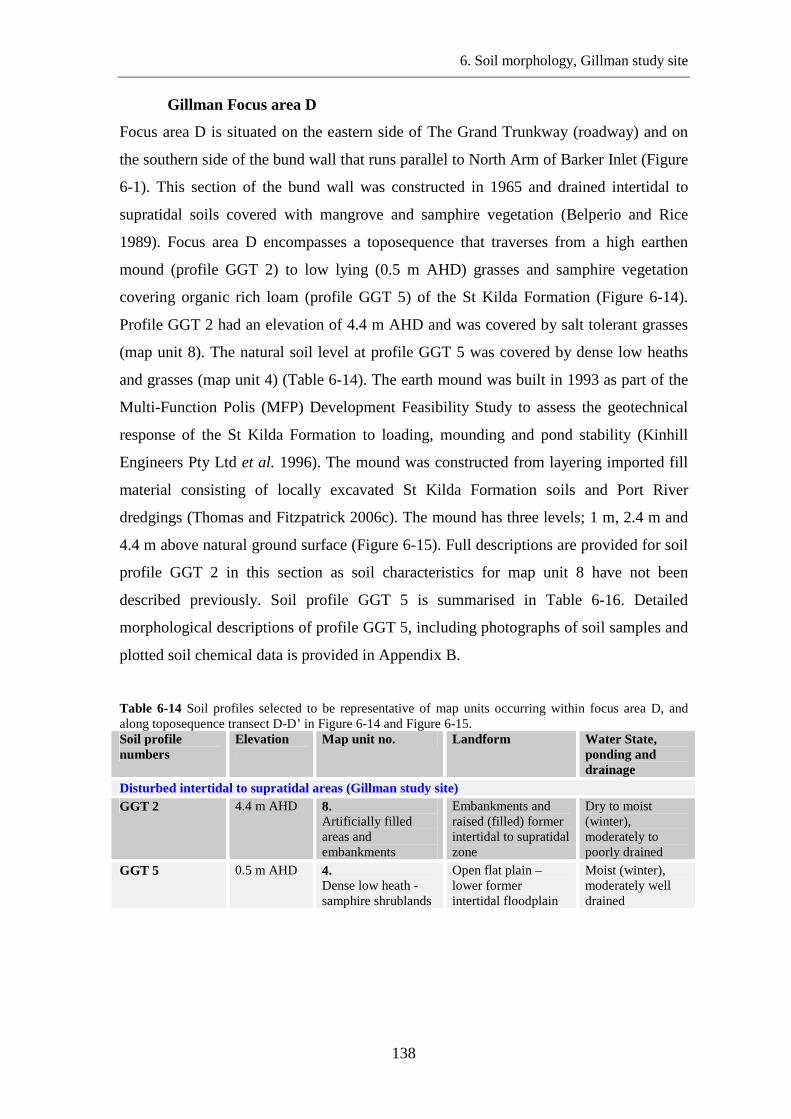
Gillman Focus area D
Focus area D is situated on the eastern side of The Grand Trunkway (roadway) and on
the southern side of the bund wall that runs parallel to North Arm of Barker Inlet (Figure
6-1). This section of the bund wall was constructed in 1965 and drained intertidal to
supratidal soils covered with mangrove and samphire vegetation (Belperio and Rice
1989). Focus area D encompasses a toposequence that traverses from a high earthen
mound (profile GGT 2) to low lying (0.5 m AHD) grasses and samphire vegetation
covering organic rich loam (profile GGT 5) of the St Kilda Formation (Figure 6-14).
Profile GGT 2 had an elevation of 4.4 m AHD and was covered by salt tolerant grasses
(map unit 8). The natural soil level at profile GGT 5 was covered by dense low heaths
and grasses (map unit 4) (Table 6-14). The earth mound was built in 1993 as part of the
Multi-Function Polis (MFP) Development Feasibility Study to assess the geotechnical
response of the St Kilda Formation to loading, mounding and pond stability (Kinhill
Engineers Pty Ltd et al. 1996). The mound was constructed from layering imported fill
material consisting of locally excavated St Kilda Formation soils and Port River
dredgings (Thomas and Fitzpatrick 2006c). The mound has three levels; 1 m, 2.4 m and
4.4 m above natural ground surface (Figure 6-15). Full descriptions are provided for soil
profile GGT 2 in this section as soil characteristics for map unit 8 have not been
described previously. Soil profile GGT 5 is summarised in Table 6-16. Detailed
morphological descriptions of profile GGT 5, including photographs of soil samples and
plotted soil chemical data is provided in Appendix B.
Table 6-14 Soil profiles selected to be representative of map units occurring within focus area D, and along toposequence transect D-D’ in Figure 6-14 and Figure 6-15. Soil profile numbers
Elevation
Map unit no. Landform Water State, ponding and drainage
Disturbed intertidal to supratidal areas (Gillman study site) GGT 2 4.4 m AHD 8.
Artificially filled areas and embankments
Embankments and raised (filled) former intertidal to supratidal zone
Dry to moist (winter), moderately to poorly drained
GGT 5 0.5 m AHD 4. Dense low heath - samphire shrublands
Open flat plain – lower former intertidal floodplain
Moist (winter), moderately well drained
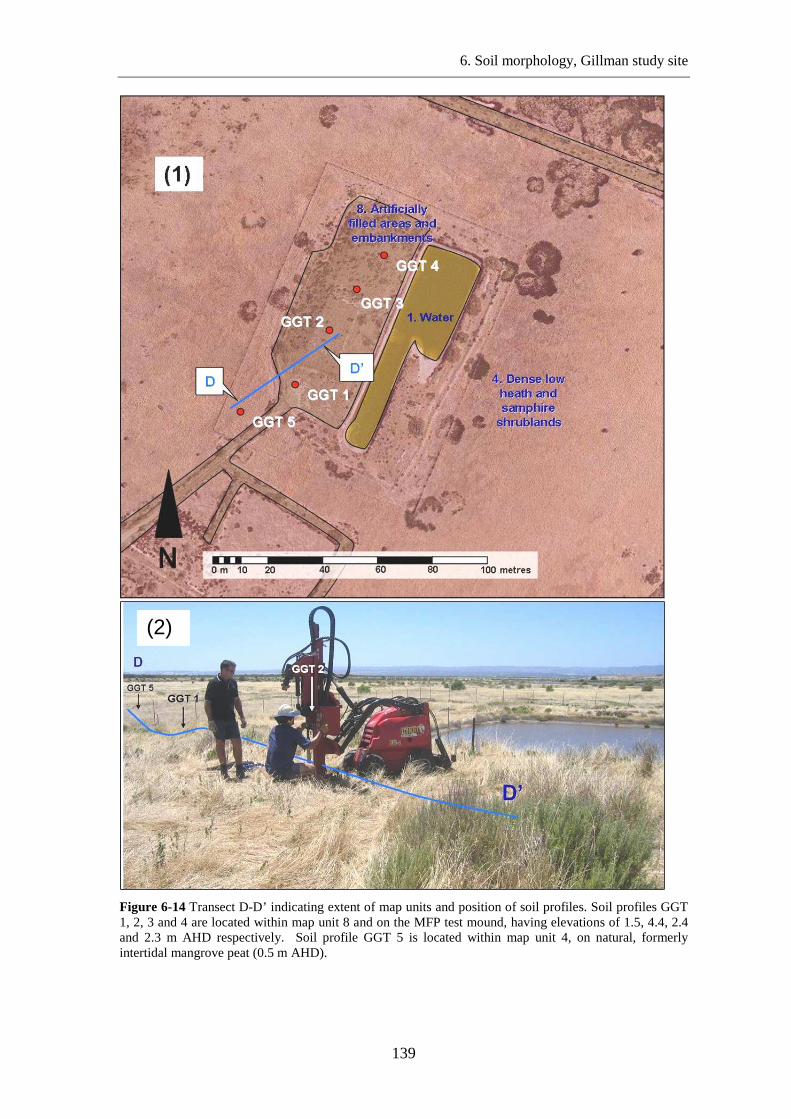
6. Soil morphology, Gillman study site
139
Figure 6-14 Transect D-D’ indicating extent of map units and position of soil profiles. Soil profiles GGT 1, 2, 3 and 4 are located within map unit 8 and on the MFP test mound, having elevations of 1.5, 4.4, 2.4 and 2.3 m AHD respectively. Soil profile GGT 5 is located within map unit 4, on natural, formerly intertidal mangrove peat (0.5 m AHD).
(2)
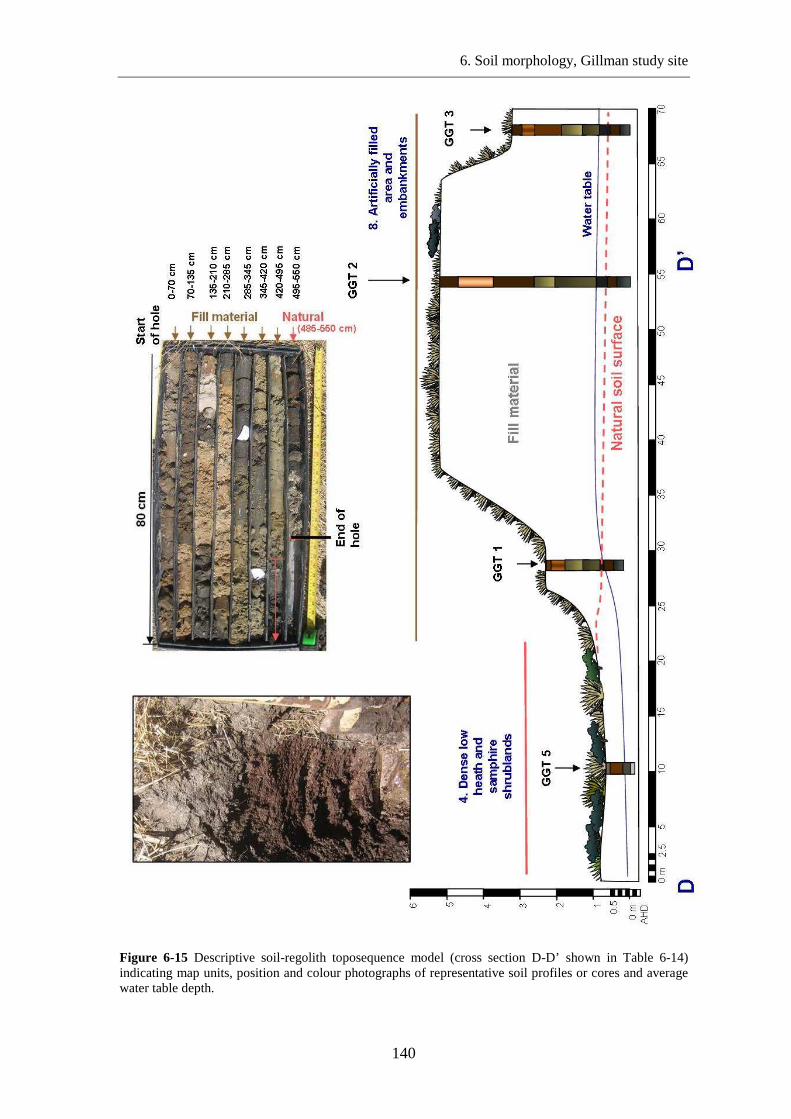
6. Soil morphology, Gillman study site
140
Figure 6-15 Descriptive soil-regolith toposequence model (cross section D-D’ shown in Table 6-14) indicating map units, position and colour photographs of representative soil profiles or cores and average water table depth.
6. Soil morphology, Gillman study site
141
Map unit 8 - Dry to Moist (winter): moderately well to poorly drained, embankment
and artificially raised (filled) former intertidal to supratidal floodplain. Profile GGT 2
Soil profile GGT 2 occurs within map unit 8 (Artificially filled areas and embankments).
Soil morphology for profile GGT 2 is provided in Table 6-15 together with a
corresponding close-up photograph of soil fragments for each horizon or layer. Profile
GGT 2 consists of over 4 m of fill material placed on former intertidal mangrove soils.
The fill material consists of interlayered clays, sandy loams, shell grit and organic rich
loams that were sourced from soil adjacent to the mound (during pond construction) and
also from dredge spoil. The dredge spoil was originally Port River sediments that were
hydraulically placed (forming playas) onto land west of the Grand Trunkway in the
1950s, then quarried for use in the MFP mound in 1993 (Thomas and Fitzpatrick 2006c).
Fill material extends from the surface to 495 cm depth (Figure 6-15).
The surface Ap horizon (0 to 5 cm) was dry, moderately well drained, pale brown sandy
clay loam. It had a firm, subangular blocky structure and abundant live roots from a
thick cover of salt tolerant grasses. The upper 495 cm of the profile was dominated by
yellow to pale brown loam to sandy clay loam, with very few mottles and some
interbedded shell grit and calcrete fragments. Dark grey mottles were evident in the
lowest layer of fill material (490 to 495 cm), indicating reducing conditions and the
likely occurrence of monosulfidic material (Table 6-15). At the time of sampling, the
groundwater table was at 472 cm from the surface (23 cm above the buried, natural soil
layers). Dark grey mottles (10% by volume) were more evident in the top layer of the
buried natural soil material (495 to 500 cm), consisting of organic rich loam (horizon
3Abg/W1). The underlying 4Abg/W1 horizon (500-515 cm) had fewer dark grey mottles
(5% by volume) within an organic sandy loam matrix. A gleyed, greyish brown sand
layer (horizon 5Bgg/W1) occurred from 515 to 530 cm. A calcareous 6Bg/W1 horizon
occurred at the base of the profile and contained very coarse shell fragments with
yellowish red staining on some shell surfaces (Table 6-15).
Within the fill material ECs were relatively low, ranging from 2.5 dS/m at the surface
Ap horizon and within the lowest layer of fill material (horizon 2Ap7), to 4.8 dS/m in
horizon 2Ap3 (175 to 205 cm) in the centre of the mound. The natural, organic rich soil
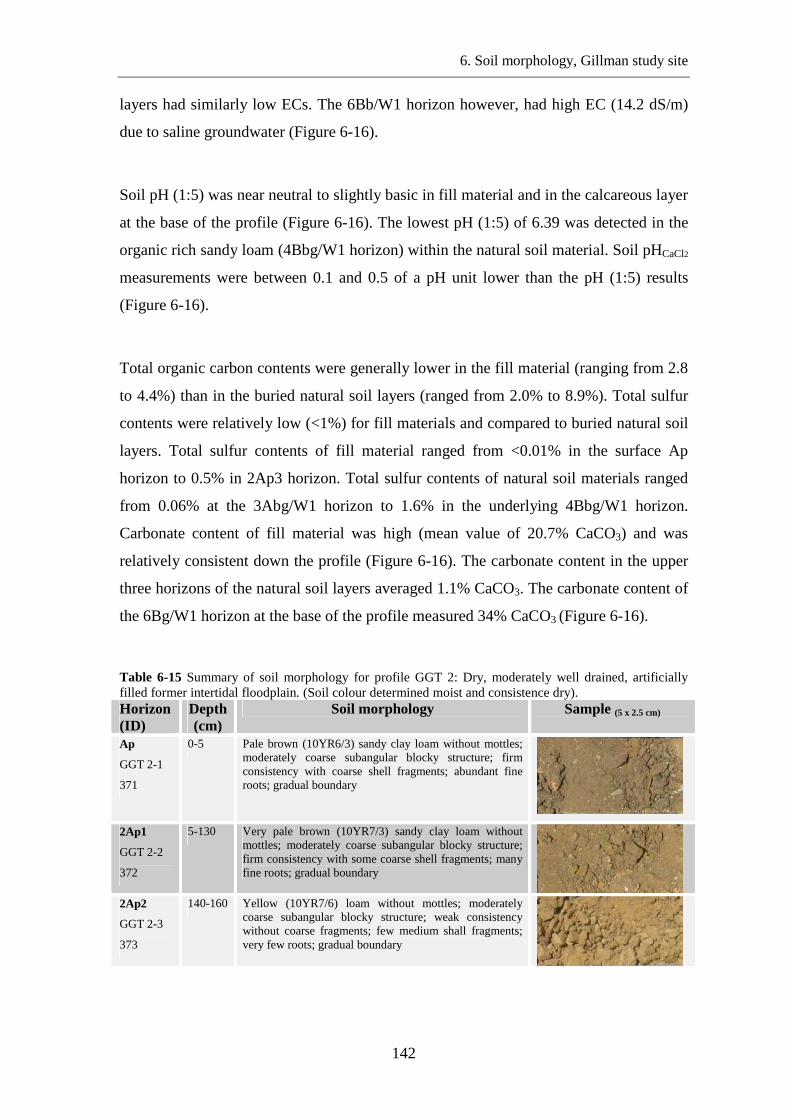
6. Soil morphology, Gillman study site
142
layers had similarly low ECs. The 6Bb/W1 horizon however, had high EC (14.2 dS/m)
due to saline groundwater (Figure 6-16).
Soil pH (1:5) was near neutral to slightly basic in fill material and in the calcareous layer
at the base of the profile (Figure 6-16). The lowest pH (1:5) of 6.39 was detected in the
organic rich sandy loam (4Bbg/W1 horizon) within the natural soil material. Soil pHCaCl2
measurements were between 0.1 and 0.5 of a pH unit lower than the pH (1:5) results
(Figure 6-16).
Total organic carbon contents were generally lower in the fill material (ranging from 2.8
to 4.4%) than in the buried natural soil layers (ranged from 2.0% to 8.9%). Total sulfur
contents were relatively low (<1%) for fill materials and compared to buried natural soil
layers. Total sulfur contents of fill material ranged from <0.01% in the surface Ap
horizon to 0.5% in 2Ap3 horizon. Total sulfur contents of natural soil materials ranged
from 0.06% at the 3Abg/W1 horizon to 1.6% in the underlying 4Bbg/W1 horizon.
Carbonate content of fill material was high (mean value of 20.7% CaCO3) and was
relatively consistent down the profile (Figure 6-16). The carbonate content in the upper
three horizons of the natural soil layers averaged 1.1% CaCO3. The carbonate content of
the 6Bg/W1 horizon at the base of the profile measured 34% CaCO3 (Figure 6-16).
Table 6-15 Summary of soil morphology for profile GGT 2: Dry, moderately well drained, artificially filled former intertidal floodplain. (Soil colour determined moist and consistence dry). Horizon (ID)
Depth (cm)
Soil morphology Sample (5 x 2.5 cm)
Ap
GGT 2-1
371
0-5 Pale brown (10YR6/3) sandy clay loam without mottles; moderately coarse subangular blocky structure; firm consistency with coarse shell fragments; abundant fine roots; gradual boundary
2Ap1
GGT 2-2
372
5-130 Very pale brown (10YR7/3) sandy clay loam without mottles; moderately coarse subangular blocky structure; firm consistency with some coarse shell fragments; many fine roots; gradual boundary
2Ap2
GGT 2-3
373
140-160 Yellow (10YR7/6) loam without mottles; moderately coarse subangular blocky structure; weak consistency without coarse fragments; few medium shall fragments; very few roots; gradual boundary
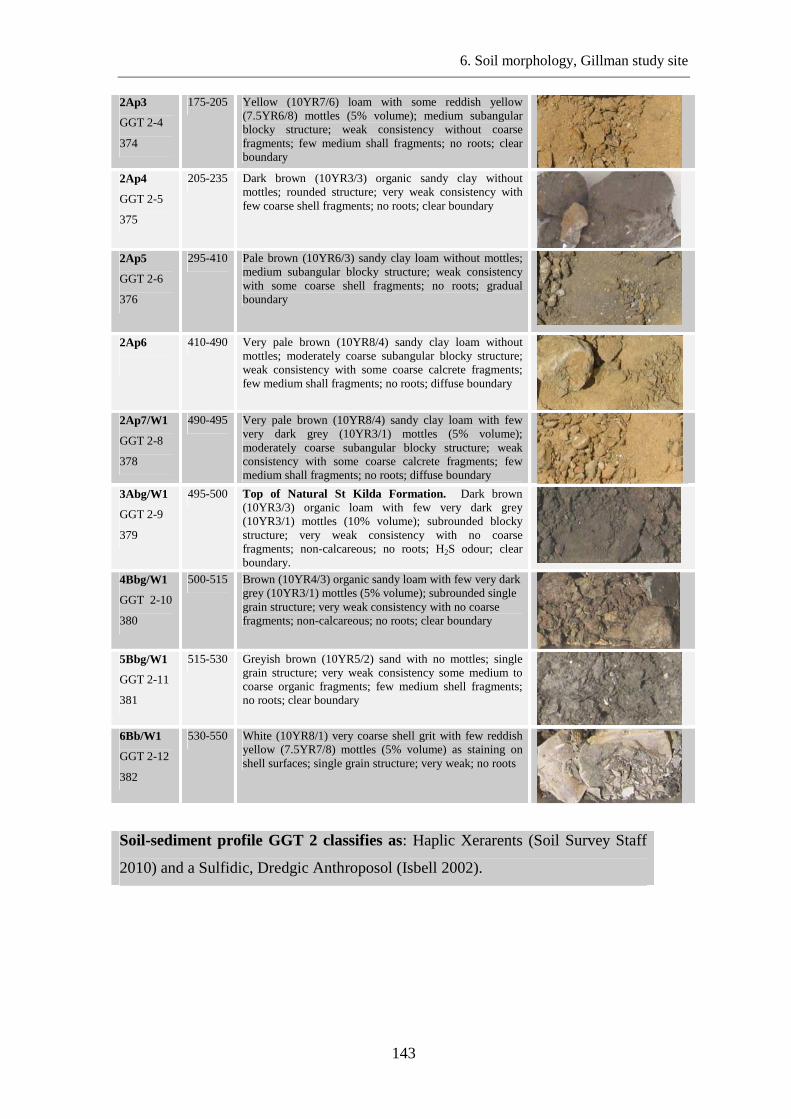
6. Soil morphology, Gillman study site
143
2Ap3
GGT 2-4
374
175-205 Yellow (10YR7/6) loam with some reddish yellow (7.5YR6/8) mottles (5% volume); medium subangular blocky structure; weak consistency without coarse fragments; few medium shall fragments; no roots; clear boundary
2Ap4
GGT 2-5
375
205-235 Dark brown (10YR3/3) organic sandy clay without mottles; rounded structure; very weak consistency with few coarse shell fragments; no roots; clear boundary
2Ap5
GGT 2-6
376
295-410 Pale brown (10YR6/3) sandy clay loam without mottles; medium subangular blocky structure; weak consistency with some coarse shell fragments; no roots; gradual boundary
2Ap6
410-490 Very pale brown (10YR8/4) sandy clay loam without mottles; moderately coarse subangular blocky structure; weak consistency with some coarse calcrete fragments; few medium shall fragments; no roots; diffuse boundary
2Ap7/W1
GGT 2-8
378
490-495 Very pale brown (10YR8/4) sandy clay loam with few very dark grey (10YR3/1) mottles (5% volume); moderately coarse subangular blocky structure; weak consistency with some coarse calcrete fragments; few medium shall fragments; no roots; diffuse boundary
3Abg/W1
GGT 2-9
379
495-500 Top of Natural St Kilda Formation. Dark brown (10YR3/3) organic loam with few very dark grey (10YR3/1) mottles (10% volume); subrounded blocky structure; very weak consistency with no coarse fragments; non-calcareous; no roots; H2S odour; clear boundary.
4Bbg/W1
GGT 2-10
380
500-515 Brown (10YR4/3) organic sandy loam with few very dark grey (10YR3/1) mottles (5% volume); subrounded single grain structure; very weak consistency with no coarse fragments; non-calcareous; no roots; clear boundary
5Bbg/W1
GGT 2-11
381
515-530 Greyish brown (10YR5/2) sand with no mottles; single grain structure; very weak consistency some medium to coarse organic fragments; few medium shell fragments; no roots; clear boundary
6Bb/W1
GGT 2-12
382
530-550 White (10YR8/1) very coarse shell grit with few reddish yellow (7.5YR7/8) mottles (5% volume) as staining on shell surfaces; single grain structure; very weak; no roots
Soil-sediment profile GGT 2 classifies as: Haplic Xerarents (Soil Survey Staff
2010) and a Sulfidic, Dredgic Anthroposol (Isbell 2002).
6. Soil morphology, Gillman study site
144
Acid Sulfate Soil Characteristics
Soil pH testing (pHW, pHOX and pHIncubation)
Soil pH measurements were made for all layer samples in a 1:1 soil-water mixture
(pHW), after treatment with peroxide (pHOX) and after ageing (pHIncubation) the soil in a
moist environment for 19 weeks. S oil-water pH (pHW) values were circum-neutral for
all layers however the natural, buried soil layers generally had slightly lower pHW values
than the fill material (Figure 6-16). Soil layers between 0 and 495 cm depth (fill
material) had a pHW range from 7.5 for soil horizon 2Ap3 (175 to 205 cm) to 6.6 in
horizon 2Ap7/W1 (490 to 495 cm). The pHW of soil layers below 495 cm depth (natural
material) ranged from 6.1 and 7.5.
A drop of about one pH unit was observed for most samples following treatment with
peroxide (Figure 6-16). The lowest pHOX of 3.1 was measured in a natural sandy layer
(515 and 530 cm). After incubating samples for up to 19 weeks, the lowest pHIncubation
obtained was 5.9 (horizon 4Abg/W1), indicating that no soil layers contain hypersulfidic
material. The vast majority of samples showed a slight rise in pH of between 0.5 and 1
pH unit following incubation (Figure 6-16). The high net acidity values subsequently
measured in horizons 3Abg/W1 and 4Abg/W1 (refer below) suggested the incubation
results were inaccurate and were therefore repeated. For the repeated incubation
experiment bulk soil samples were sieved (2mm), homogenise prior to incubating in
chip tray compartments for 19 weeks. The pHIncubation of horizon 3Abg/W1 measured
4.1, and 4Abg/W1 measured 3.6, indicating that horizon 4Abg/W1 contained
hypersulfidic material. The discrepancy was probably due the samples not being
homogenised sufficiently for the original incubation experiment. This issue is
exacerbated in coarse grained samples due to the small amount of subsample portioned
to chip tray compartments.
Existing acidity (Titratable actual acidity (TAA) and Retained acidity)
Only one of the seven samples analysed had a pHKCl of < 6.5, indicating it likely
contains a minor amount of Existing Acidity, and no effective acid neutralising capacity.
The TAA for this sample (natural, organic rich sandy loam layer from 500 to 515 cm
depth) measured 2.5 mole H+/tonne. Retained acidity was not measured as no jarosite
was observed in the layer samples.
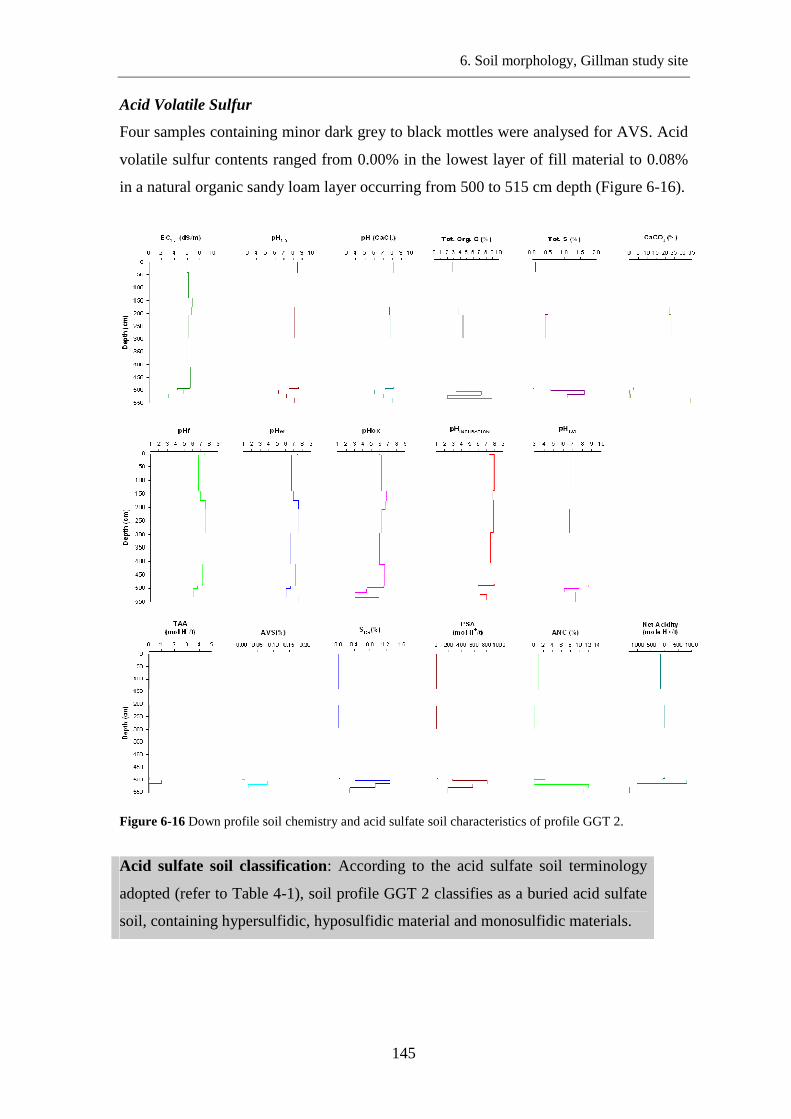
6. Soil morphology, Gillman study site
145
Acid Volatile Sulfur
Four samples containing minor dark grey to black mottles were analysed for AVS. Acid
volatile sulfur contents ranged from 0.00% in the lowest layer of fill material to 0.08%
in a natural organic sandy loam layer occurring from 500 to 515 cm depth (Figure 6-16).
Figure 6-16 Down profile soil chemistry and acid sulfate soil characteristics of profile GGT 2.
Acid sulfate soil classification: According to the acid sulfate soil terminology
adopted (refer to Table 4-1), soil profile GGT 2 classifies as a buried acid sulfate
soil, containing hypersulfidic, hyposulfidic material and monosulfidic materials.
6. Soil morphology, Gillman study site
146
Chromium Reducible Sulfur (SCR)
Reduced inorganic sulfur was determined for seven samples within soil profile GGT 2.
SCR contents were very low in the fill material and ranged form 0.00%SCR to 0.03%SCR.
High SCR contents were measured in all natural soil materials and ranged from 0.29%SCR
at the base of the profile (horizon 6Bg/W1) to 1.30%SCR within the organic rich sandy
loam layer at 500 to 515 cm depth (Figure 6-16).
Acid Neutralising Capacity (ANC)
ANC was high (11.4% CaCO3) within the calcareous layer near the base of the soil
profile, and relatively low elsewhere (ranging between 0 and 3.4% CaCO3).
Net Acidity
Net Acidity within fill material ranged from 4.4 mole H+/tonne to -133 mole H+/tonne,
with an average of -86 mole H+/tonne. Two natural organic rich soil layers (between 500
and 530 cm depth) had positive net acidities, measuring 835 mole H+/tonne and 426
mole H+/tonne. The other natural soil layers had negative net acidity values of -57 mole
H+/tonne in horizon Ap1 and -1338 mole H+/tonne in the lowest soil horizon (6Bb/W1)
(Figure 6-16).
Summary – Gillman Focus area D
Toposequence D-D’ transects from an elevated, artificial mound (map unit 8) to former
intertidal mangrove and samphire sediments (map unit 4) (Figure 6-15). The soil profile
through the mound (GGT 2) classifies as a Sulfidic, Dredgic Anthroposol (Isbell 2002)
and a Haplic Xerarents (Soil Survey Staff 2010), containing, hypersulfidic, hyposulfidic
materials and minor monosulfidic materials. The mound was placed on formerly
intertidal mangrove and samphire sediments that was similar to soil profile GGT 5
which classifies as a Sulfuric, Salic Hydrosol (Isbell 2002), Typic Sulfaquepts (Soil
Survey Staff 2010), containing sulfuric material and hyposulfidic materials (Table 6-16).
Refer to Appendix B for a detailed description of profile GGT 5.
6. Soil morphology, Gillman study site
147
Profile GGT 2 contains over 4 m of fill material sourced from dredgings and locally
excavated soil. The fill material probably contained some sulfidic material prior to the
mound being formed. Oxidization of sulfides is evidenced by some strong brown iron
oxide mottles that were most abundant as coatings on shell fragments. Some sulfide has
is preserved in organic rich layers of fill material above the water table.
The mound has compressed the underlying St Kilda Formation soils, pushing the
original soil surface below the watertable. The original soils probably contained both
sulfuric and sulfidic materials prior to burial, (resembling profile GGT 5). Any existing
acidity originally present in the soil profile was likely neutralised following burial by at
least three processes: i) exclusion of oxygen which allowed reducing conditions to re-
establish and iron sulfides to form, ii) acidic soil layers being pushed into contact with
bicarbonate bearing groundwater, and iii ) rain water that passes through >4 metres of
calcareous materials contained bicarbonate.
Soil profile GGT 5 has similar morphology and characteristics to other soil profiles
located within map unit 4, such as profile BG 22, BG 32 (described for Gillman Focus
area C) and BG 29 (refer to Appendix B).
Table 6-16 Gillman Focus area D soil profiles are classified according to Australian Soil Classification (Isbell 2002), Soil Taxonomy (Soil Survey Staff 2010) and using acid sulfate soil terminology (Sullivan et al. 2010). Soil profile no.
Map unit no.
Aust. Soil Classification (Isbell 2002)
Soil Taxonomy (Soil Survey Staff 2010)
Acid Sulfate Soil materials
Significant net acidity occurrence
GGT 2 8. Artificially filled areas and embankments
Sulfidic, Dredgic Anthroposol
Haplic Xerarents Hypersulfidic, Hyposulfidic, monosulfidic
20 cm @ 631 mole H+/t from 500 cm depth
GGT 5 4. Dense low heath - samphire shrublands
Sulfuric, Salic Hydrosol
Typic Sulfaquepts
Sulfuric, hyposulfidic
70 cm @ 272 mole H+/t from 0 cm depth
6. Soil morphology, Gillman study site
148
6.2. Summary – Gillman study site
Eleven map units identified at the Gillman study site are inherently linked to the
hydrological and pedological characteristics of the area, which are predominantly
controlled by geomorphology, micro-elevation, hydrology and vegetation (source of
organic matter). Therefore the map units, discernable by aerial photography were related
to the geomorphology and topography to improve their correlation to acid sulfate soil
characteristics, and soil processes. Correlations between map units and soil types at the
Gillman study site are presented in Table 6-17.
Soil-water pH (pHW) ranged from 1.5 (in profile BG 15) to 8.14 (in profile BG 11). Soil
pHW data indicated that five soil profiles contained sulfuric materials that predominantly
occurred in profiles located in map units 5 and 6. Soil incubation experiments indicated
that net acidity of hypersulfidic material was highest sandy soil layers occurring close to
or below the redox front.
Soil profiles within map unit 5 contained both (i) very high existing acidity and (ii) very
high potential sulfidic acidity values. Sulfuric material identified in organic rich soil
profiles from map units 4 and 3 had considerably lower net acidity contents (e.g. profiles
BG 22, BG 32 and GGT 5). All 16 soil profiles contained potential sulfidic acidity in the
form of reduced inorganic sulfur. The highest SCR content (7.05%) was measured in soil
profile BG 4, located within map unit 2. The highest AVS content of 3.48% was also
measured in profile BG 4. Modest AVS contents (> 0.2%) were detected in most soil
profiles from map units 1, 2, and 9, due to the presence of saturated or subaqueous soils.
Minor concentrations of AVS were also measured within a buried organic-rich layer in
profiles GGT 2, and BG 2 (Appendix C) which are located in map unit 8.
The correlations that have been established between landscape features and soil
characteristics at Gillman (Table 6-17) and St Kilda (Table 5-12) are used in Chapter 7
to produce soil maps covering the full extent of the Gillman and St Kilda study sites.
Map units are also linked to acid sulfate soil hazards.
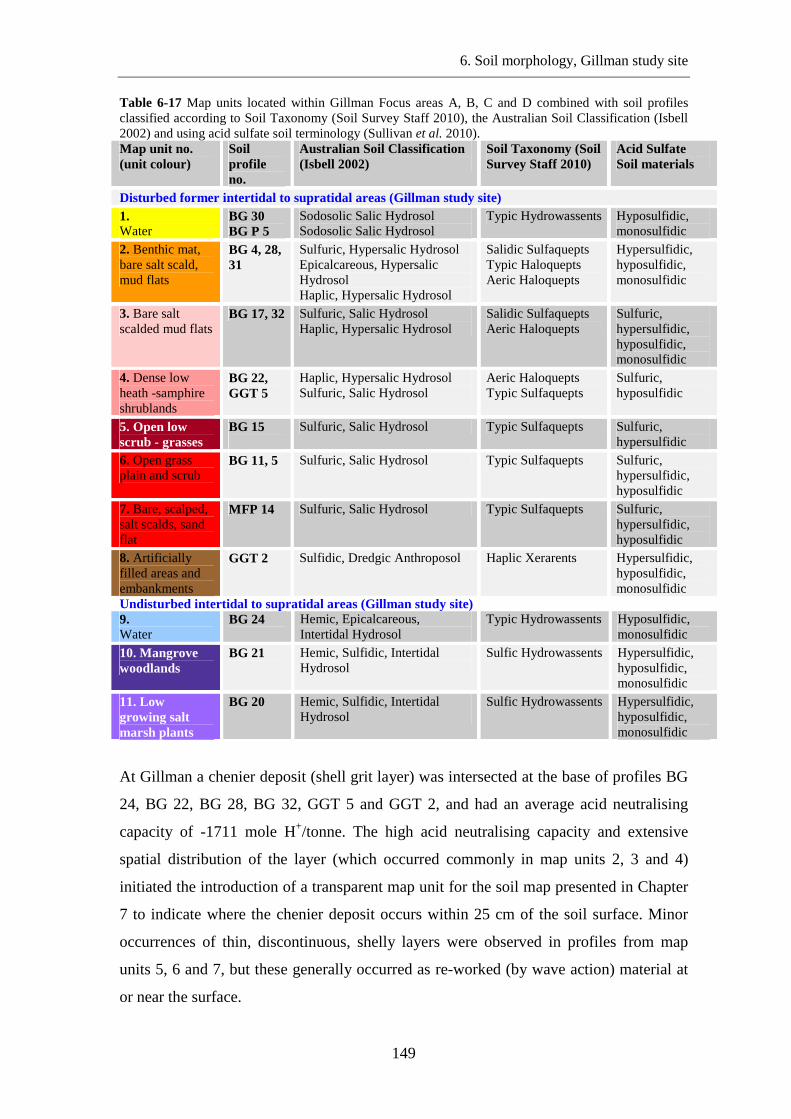
6. Soil morphology, Gillman study site
149
Table 6-17 Map units located within Gillman Focus areas A, B, C and D combined with soil profiles classified according to Soil Taxonomy (Soil Survey Staff 2010), the Australian Soil Classification (Isbell 2002) and using acid sulfate soil terminology (Sullivan et al. 2010). Map unit no. (unit colour)
Soil profile no.
Australian Soil Classification (Isbell 2002)
Soil Taxonomy (Soil Survey Staff 2010)
Acid Sulfate Soil materials
Disturbed former intertidal to supratidal areas (Gillman study site) 1. Water
BG 30 BG P 5
Sodosolic Salic Hydrosol Sodosolic Salic Hydrosol
Typic Hydrowassents Hyposulfidic, monosulfidic
2. Benthic mat, bare salt scald, mud flats
BG 4, 28, 31
Sulfuric, Hypersalic Hydrosol Epicalcareous, Hypersalic Hydrosol Haplic, Hypersalic Hydrosol
Salidic Sulfaquepts Typic Haloquepts Aeric Haloquepts
Hypersulfidic, hyposulfidic, monosulfidic
3. Bare salt scalded mud flats
BG 17, 32 Sulfuric, Salic Hydrosol Haplic, Hypersalic Hydrosol
Salidic Sulfaquepts Aeric Haloquepts
Sulfuric, hypersulfidic, hyposulfidic, monosulfidic
4. Dense low heath -samphire shrublands
BG 22, GGT 5
Haplic, Hypersalic Hydrosol Sulfuric, Salic Hydrosol
Aeric Haloquepts Typic Sulfaquepts
Sulfuric, hyposulfidic
5. Open low scrub - grasses
BG 15
Sulfuric, Salic Hydrosol Typic Sulfaquepts Sulfuric, hypersulfidic
6. Open grass plain and scrub
BG 11, 5 Sulfuric, Salic Hydrosol Typic Sulfaquepts Sulfuric, hypersulfidic, hyposulfidic
7. Bare, scalped, salt scalds, sand flat
MFP 14 Sulfuric, Salic Hydrosol Typic Sulfaquepts Sulfuric, hypersulfidic, hyposulfidic
8. Artificially filled areas and embankments
GGT 2 Sulfidic, Dredgic Anthroposol Haplic Xerarents Hypersulfidic, hyposulfidic, monosulfidic
Undisturbed intertidal to supratidal areas (Gillman study site) 9. Water
BG 24
Hemic, Epicalcareous, Intertidal Hydrosol
Typic Hydrowassents Hyposulfidic, monosulfidic
10. Mangrove woodlands
BG 21
Hemic, Sulfidic, Intertidal Hydrosol
Sulfic Hydrowassents Hypersulfidic, hyposulfidic, monosulfidic
11. Low growing salt marsh plants
BG 20
Hemic, Sulfidic, Intertidal Hydrosol
Sulfic Hydrowassents Hypersulfidic, hyposulfidic, monosulfidic
At Gillman a chenier deposit (shell grit layer) was intersected at the base of profiles BG
24, BG 22, BG 28, BG 32, GGT 5 and GGT 2, and had an average acid neutralising
capacity of -1711 mole H+/tonne. The high acid neutralising capacity and extensive
spatial distribution of the layer (which occurred commonly in map units 2, 3 and 4)
initiated the introduction of a transparent map unit for the soil map presented in Chapter
7 to indicate where the chenier deposit occurs within 25 cm of the soil surface. Minor
occurrences of thin, discontinuous, shelly layers were observed in profiles from map
units 5, 6 and 7, but these generally occurred as re-worked (by wave action) material at
or near the surface.