coast norway v.2002 (computer assisted shipping traffic database) bjørn Øygarden
Post on 19-Dec-2015
214 views
TRANSCRIPT
COAST Norway v.2002(COmputer Assisted Shipping Traffic Database)
Bjørn Øygarden

2
COAST
BackgroundCOAST ?DevelopmentAreas of Use
3
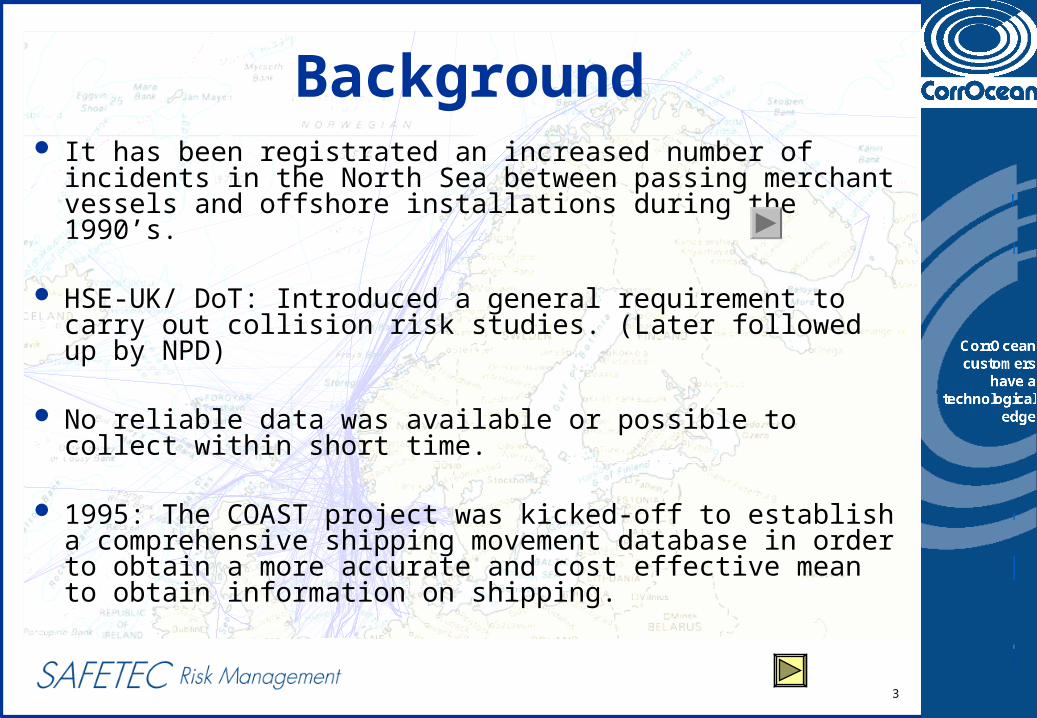
Background It has been registrated an increased number of incidents in
the North Sea between passing merchant vessels and offshore installations during the 1990’s.
HSE-UK/ DoT: Introduced a general requirement to carry out collision risk studies. (Later followed up by NPD)
No reliable data was available or possible to collect within short time.
1995: The COAST project was kicked-off to establish a comprehensive shipping movement database in order to obtain a more accurate and cost effective mean to obtain information on shipping.

4

5
Background Cont.1996: COAST UK V.1 (HSE-UK, DoT)2002: COAST Norway v2002 (OLF)2002: COAST Singapore Strait2003: COAST Venezuela/ Gulf of Paria (ConocoPhilips)2003: COAST Brazil (Petrobras), Pending
The COAST databases are subject to ongoing updates to maintain the databases as a ”live” and accurate tool. (COAST Fund)

6
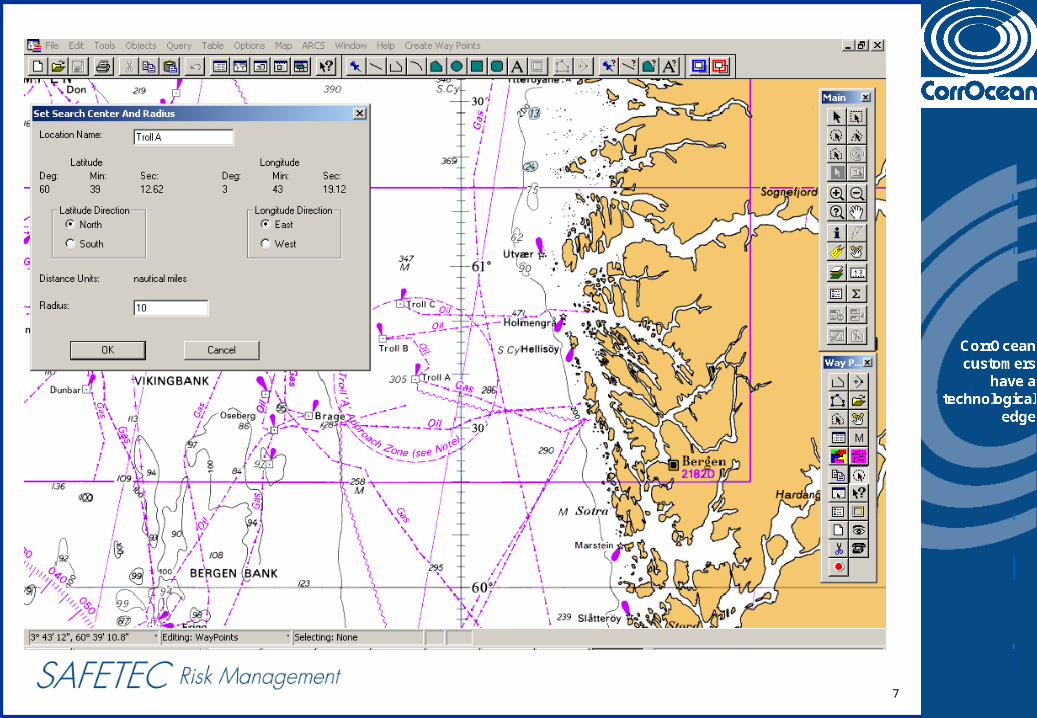
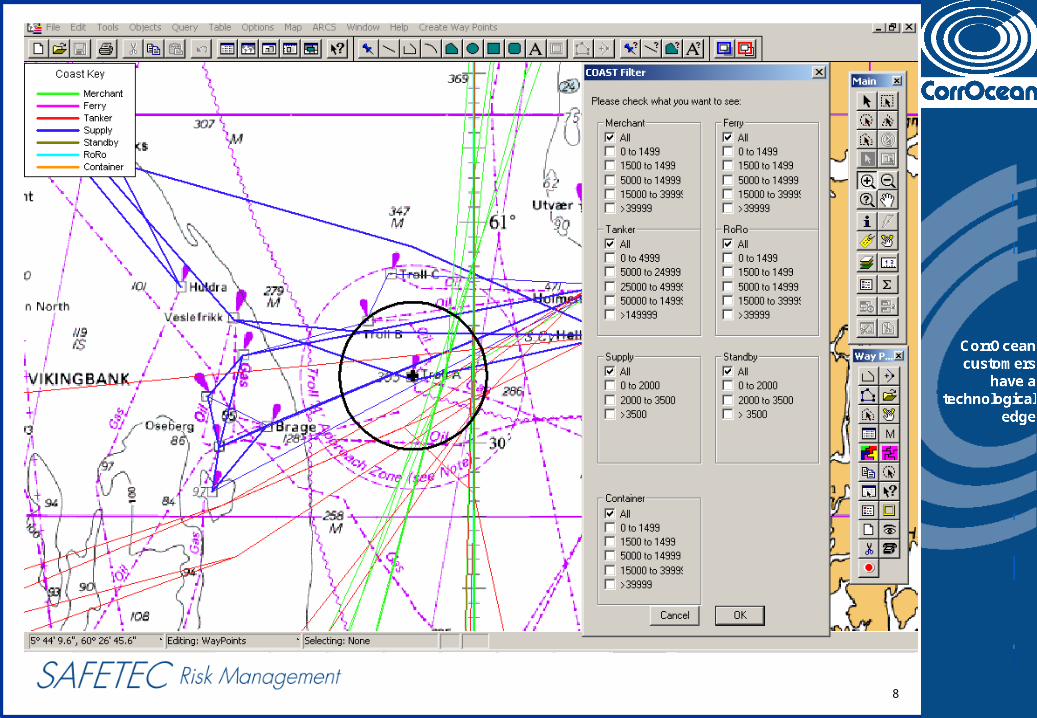
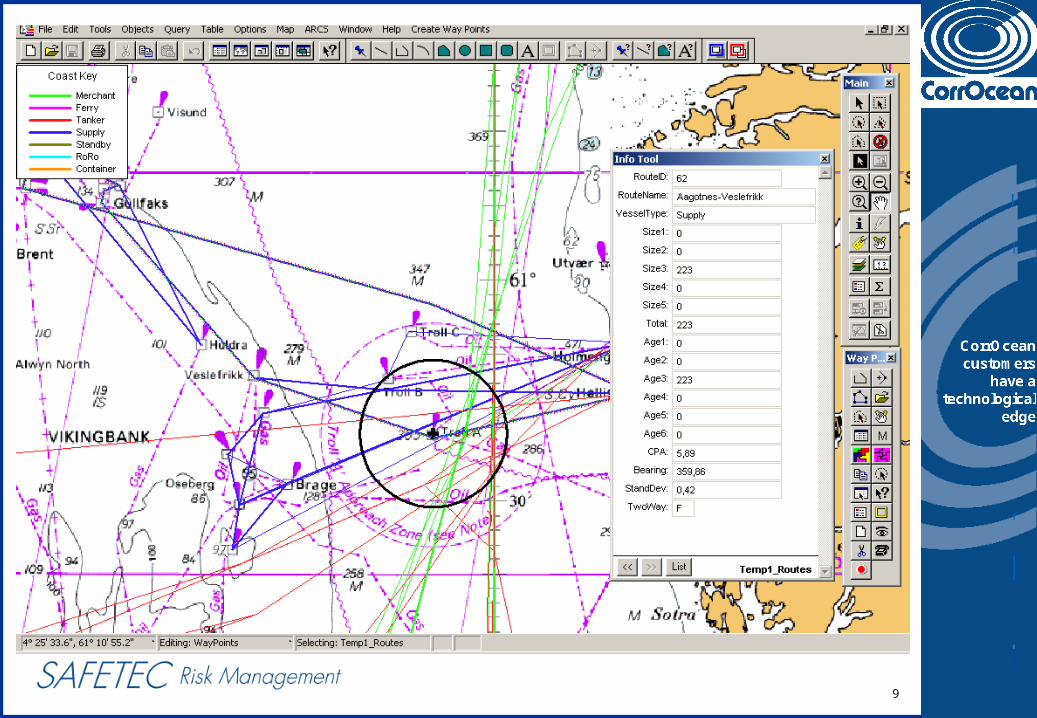
COmputer Assisted Shipping Traffic Database Runs in MapInfo (GIS) Easy search and display function Presents details on shipping movements in the North Sea:
- Route Description- CPA to a predefined location - Vessel Type- Vessel Size- Volume of vessels- Port To/From- Standard deviation of routes- Age and Speed of vessels
COAST ?
7
8
9

10
COAST Output ReportRoute No. Main Contributor1 CPA (nm) SD Bearing (°) No. of Vessels Per
Annum
1 Tees-Aaheim 1,6 1 295,3 4
2 Montrose-Bomlafjorden 2,1 1 326,3 28
3 Kirkwall-Baltic 2,9 2 198,6 8
4 Baltic-Ireland 3,0 2 193,6 1170
5 Mongstad-Tees 3,1 1.5 114,9 76
TOTAL 1286
Route Size Distribution (DWT) No of Vessels No. < 1,500 1,500–5,000 5,000–15,000 15,000–40,000 > 40,000 Per Annum
5 0 4 0 0 0 4
9 0 24 28 0 0 52
15 0 4 0 0 0 4 TOTAL 0 32 28 0 0 60
Route Distribution
Size Distribution

11
COAST Development
COAST Database
Port Log Data
Radar/ ManualData Collection
Other Traffic Data

12
Oseberg/ Troll: 7 days Example Plot
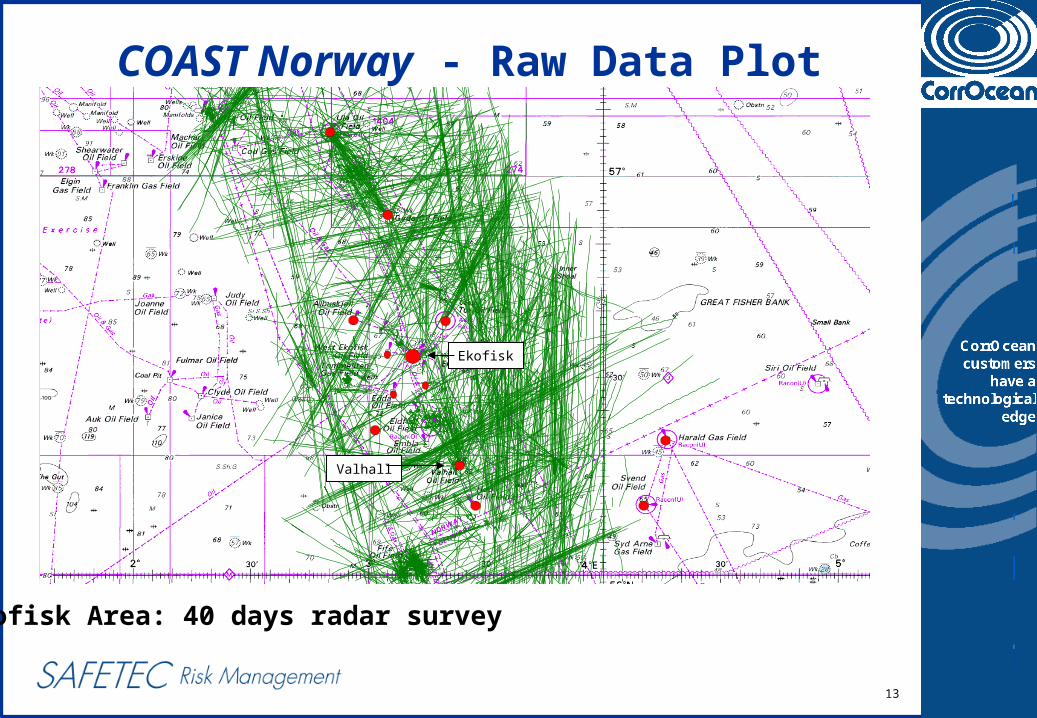
COAST Norway - Raw Data Plot
13
Ekofisk
Valhall
COAST Norway - Raw Data Plot
Ekofisk Area: 40 days radar survey
14
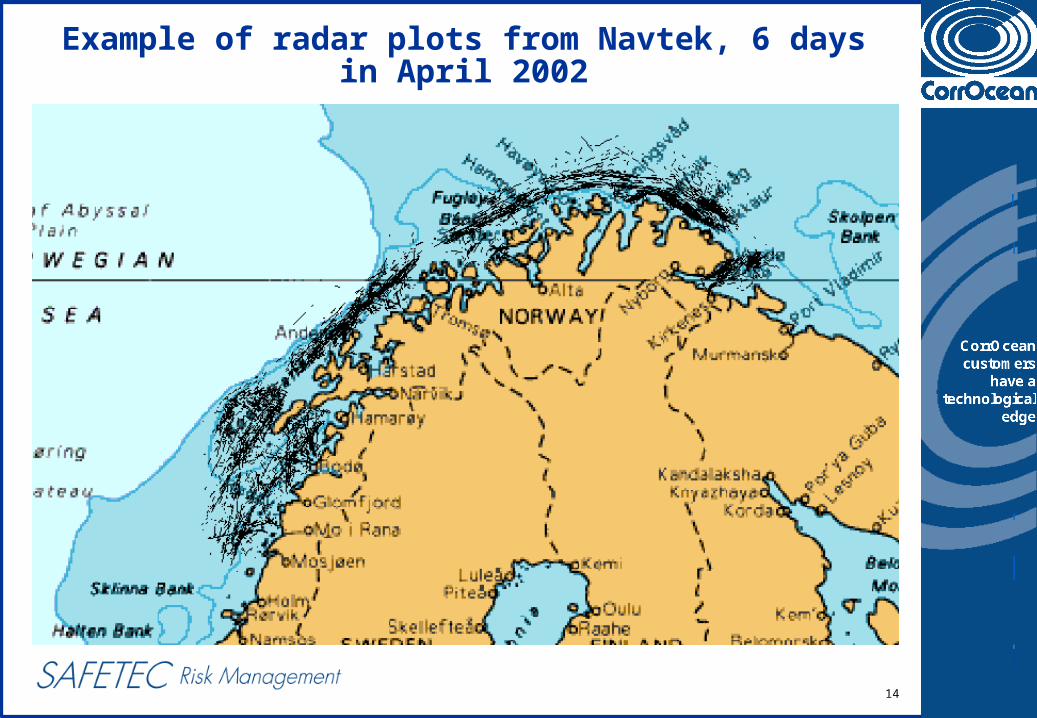
Example of radar plots from Navtek, 6 days in April 2002

15
Areas of Use: Ship to Installation Collision Frequency and Impact Studies
- Platforms- Wind Farms- Fish Farms
Ship to Ship Collision Risk Studies Power Cable and Oil/Gas pipeline laying studies Grounding Assessments Ship Traffic Management Cost-Benefit Analysis, Navigational Aid Chart Update Analysis Oil Spill Contingency Plan Studies SAR/ SBV response time plots Trend/ Sensitivity Analysis

16

17
All Installations
1,00E-08
1,00E-07
1,00E-06
1,00E-05
1,00E-04
1,00E-03
0,01 0,1 1 10 100 1000 10000
Impact Energy (MJ)
Cu
mu
lati
ve F
req
uen
cy
Installation A
Installation B
Installation C

18
Ship To Ship

19
Vessel Density Plot
Ships per year
> 500100 to 500
50 to 10010 to 50
< 10