coast community college district career technical education · coast community college district...
TRANSCRIPT

Coast Community College District
Career Technical Education
State Initiatives – Grants – Program Reviews
Educational Services and Technology Division
May 16, 2018

1
Contents
SUMMARY ------------------------------------------------------------------------------------------------------------------------------------------------------------------------ 2
STATE INITIATIVES WITH IMPACT ON CTE PROGRAMS AND FUNDING ------------------------------------------------------------------- 3
CURRENT CTE-RELATED GRANTS --------------------------------------------------------------------------------------------------------------------------------- 6
CTE PROGRAM REVIEWS -------------------------------------------------------------------------------------------------------------------------------------------- 10 APPENDIX 1 _______________________________________________________________________________12

2
Summary
State Initiatives with Impact on Career Technical Education (CTE) Programs and Funding
The Strong Workforce Program, which has taken effect in 2016‐17, has placed stronger emphasis on regional collaboration
in developing and implementing CTE programs and providing part of the funding to the regional collaborative rather than
directly to individual community college districts or individual colleges. CTE plans developed by the regional collaborative
must be aligned with federal requirements of the Workforce Innovation and Opportunity Act. The 2017‐18 local allocation
from the Strong Workforce Program for Coast Community College District is $3,240,071. The 2017‐18 regional allocation
from the Strong Workforce Program for Orange County community colleges is $9,745,808. Coast Community College District
is leading regional projects for which $3,522,907 was allocated from the regional funding.
CTE‐related Grants
District‐wide, the colleges and the District Office currently manage more than $23 million in active CTE‐related grants in 2017‐18. These grants span a wide array of regional partnerships and CTE programs and federal, state, and local funding. The colleges and the District Office are constantly monitoring and seeking grant opportunities that fulfill the missions of the colleges and the District. The District Grants Office continues to actively search for grant opportunities where the three colleges can work collaboratively to innovate and expand CTE programs and offerings. The District Grants Office assists the colleges to effectively manage the CTE funds currently active in the district.
CTE Program Reviews
In accordance with Education Code Section 78016, local districts are required to review each CTE program every two years
to ensure that the program:
1. Meets a documented labor market demand, 2. Is not duplicative of other regional training, and 3. Is effective.
Together, CCC, GWC, and OCC offer 76 CTE programs which lead to certificates or associate degrees in all of the ten priority
industry sectors of the Doing What Matters for Jobs and the Economy framework from the California Community Colleges
Chancellor's Office and all of the 15 industry sectors as outlined in the CTE Model Curriculum Standards from the California
Department of Education.
During 2017‐18, CCC, GWC, and OCC conducted biennial program reviews for 27 of the 76 CTE programs in the district. The
biennial program review examined the following: the labor market demand; certificates and associates degrees offered at
colleges in the Orange County region; and enrollment, course retention rates, course success rates and degrees/certificates
awarded in the past five years.

3
State Initiatives with Impact on CTE Programs and Funding In September 2012, the State Chancellor’s Office launched the Doing What Matters for Jobs and the Economy initiative. This
initiative has changed the state approach relative to requirements for community college districts and individual colleges to
work closely and collaboratively shifting the focus from work done by and funding for individual colleges to regional
consortia and funding.
The Doing What Matters for Jobs and the Economy initiative is based on the following expectations:
While colleges have traditionally allocated considerable resources to serve and grow local economies, working from the perspective of a single college or district is no longer sufficient to address the magnitude of the problems created by the economic downturn.
Regions are mobilizing around jobs and the economy. Community colleges need to do the same in order to remain vital partners in the workforce mission. Colleges must collaboratively respond and innovate in order to meet the needs of regional labor markets.
Employers who compete in the marketplace, must also partner to create a shared talent pool. Colleges are being asked to respond on three fronts:
a soft skills gap, a basic skills gap (including digital literacy), and an applied skills gap.
Employers and colleges who partner regionally will be better able to prepare a competitive workforce. If businesses can collaborate, so can the California community colleges.
As a result of this initiative, the State Chancellor’s Office launched starting with fiscal year 2014‐15, the CTE Enhancement Funds, of which 60% was allocated to individual college districts and 40% to regional consortia. Specific requirements were established in terms of the local and regional plans that community college districts and regional consortia had to respond to. Also, starting with fiscal year 2014‐15, the State Chancellor’s Office, in conjunction with the State Superintendent for Public Instruction Office for K12 education, expanded the California Career Pathways Trust program to fund joint collaborations between community colleges and high schools with emphasis on career and academic pathways from high schools to community colleges leading to workforce development and college readiness. Under these initiatives, the District and the colleges focused on the following: CTE Enhancement Funds Coastline Community College Programs: Computer Networking; Cybersecurity; Internship Project Golden West College Programs: Biotechnology & Biomedical Technology; Alternative Fuels & Transportation; Electric Vehicle; Digital Audio; Biomedical; Internship Project Orange Coast College Programs: Architecture; Aviation Maintenance Technology; School of Photography; Advanced Manufacturing; Biomedical; Fashion; Advanced Manufacturing; Internship Project. California Career Pathways Trust Coastline Community College Pathways: ICT, Cybersecurity Golden West College Pathways: Biotechnology Design Media Orange Coast College Pathways: Engineering/Project Lead the Way Strong Workforce Program The Strong Workforce Program was established through a trailer bill and took effect in 2016‐17. $200 million in apportioned funds for CTE were distributed via the regional consortia and were subject to the direction/constraints of the region as outlined in the trailer bill.

4
The Strong Workforce Program was established for the purpose of expanding the availability of quality community college career technical education and workforce development courses, programs, pathways, credentials, certificates, and degrees. To facilitate program coordination and alignment with other workforce training, education, and employment services in the state, the Strong Workforce Program operates in a manner that complies with the California Strategic Workforce Development Plan, required pursuant to the federal Workforce Innovation and Opportunity Act (Public Law 113‐128), and expands upon existing Career Technical Education Regional Consortia infrastructure. To avoid duplication of effort, activities funded under the Strong Workforce Program are informed by, aligned with, and expand upon the activities of existing workforce and education regional partnerships, including those partnership activities that pertain to regional planning efforts established pursuant to the federal Workforce Innovation and Opportunity Act (Public Law 113‐128), adult education block grant consortia, and K‐12 career technical education programs. All of the following guiding principles apply to community college districts participating in the Strong Workforce Program:
1. Community college districts shall ensure community college career technical education and workforce development courses, credentials, certificates, degrees, programs, and pathway offerings are responsive to the needs of employers, workers, civic leaders, and students.
2. Community college districts shall collaborate with other public institutions, including, but not limited to, local educational agencies, adult education consortia, local workforce development boards, and interested California State University and University of California institutions on a regional basis.
3. Collaborative efforts shall focus upon evidence‐based decision making and student success with workforce outcomes aligned with the performance accountability measures of the federal Workforce Innovation and Opportunity Act, and closing labor market and employment gaps. Each collaborative shall strive to align programmatic offerings in the most effective and efficient manner to avoid duplication of effort and streamline access to services, and education and training opportunities.
4. Community college districts and other participating entities within a regional collaborative are encouraged to develop long‐term partnerships with private sector employers and labor partners to provide coordinated courses, programs, and pathways with employer involvement in the assessment, planning, and development of community college career technical education courses, programs, and pathways. To the extent practicable, employer partnerships should build upon regional partnerships formed pursuant to the federal Workforce Innovation and Opportunity Act (WIOA), existing infrastructure established by the chancellor's office, and other state or federal programs.
The 2016‐17 and 2017‐18 Strong Workforce Program local allocation and regional allocation based on leading or
participating in regional projects are listed in the table below.

5
The Los Angeles Orange County (LAOC) Regional Consortium has planned for the 2018‐19 regional allocation from the
Strong Workforce Program for the Orange County community colleges. The regional allocation for CCCD is $2,301,807.
Discussions at the LAOC Regional Consortium are considering the following distribution of the regional allocation:
85% regional projects
10% other regional work (outreach, data use, professional development)
5% fiscal agent
In developing the regional projects, consortia are to consider the following join regional planning questions:
1. Are priority and emergent sectors for the region still the same?
2. What more must be done for students to move through the region’s career pathways in selected sectors?
3. How will job placement, internships, and regional industry engagement be coordinated?
4. How can industry inform and co‐invest in CTE development?
Both local and regional projects must lead to improving the following:
Increase quantity of CTE Programs
• CTE enrollment
Improve quality of CTE Programs
• Skills gains
• Completion of CTE programs
• Transfer
• Employment rates
• Employment in field of study
• Earnings
• Median change in earnings
• Proportion of students who attained living wages
Local Regional Total
CCC 350,051$ 1,520,000$ 1,870,051$
GWC 637,635$ 60,000$ 697,635$
OCC 1,369,560$ 890,000$ 2,259,560$
District 57,252$ 100,000$ 157,252$
2,414,498$ 2,570,000$ 4,984,498$
Local Regional (Year 1) Regional (Year 2) Total
CCC 440,952$ 1,250,000$ 1,132,000$ 2,822,952$
GWC 710,447$ 159,250$ 212,350$ 1,082,047$
OCC 1,402,740$ 58,057$ 600,000$ 2,060,797$
District 63,216$ 2,055,600$ 300,000$ 2,418,816$
17% Positive 622,716$ 622,716$
3,240,071$ 3,522,907$ 2,244,350$ 9,007,328$
FY 2016/17
FY 2017/18

6
Current CTE-related Grants District‐wide, the colleges and the District Office currently manage over $23 million in active CTE‐related grants. These grants span a wide array of regional partnerships and CTE programs and federal, state and local funding. The colleges and the District Office are constantly monitoring and seeking grant opportunities that fulfill the missions of the colleges and the District. The District Grants Office continues to actively search for grant opportunities where the three Coast colleges can work collaboratively to innovate and expand CTE programs and offerings. The District Grants Office also assists the colleges to effectively manage the CTE allocations and grants currently active in the district.
The information below provides an overview of the current CTE‐related grants through Fiscal Year 2017‐18.
Coastline Community College ‐ $4,791,396 Strong Workforce Program Regional FY 2016‐17‐ $1,511,478 CCC received Strong Workforce Program Regional allocation in the following projects: Regional NetLabs, CyberPatriot, Career Technical Education Instructor Professional Development, and Regional and Sector Specific Marketing Strong Workforce Program Regional FY 2017‐18‐ $961,968 CCC received Strong Workforce Program Regional allocation in the following projects: Regional NetLabs, CyberPatriot, Data Science Pathway Specialist, and OC Careers in Education Pathway Collaborative. Cybersecurity Instructional Success Network ‐ $163,696 CCC will establish a National Centers of Academic Excellence in Cyber Defense ‐ Two‐Year Education Regional Resource Center to provide assistance to the 113 California community colleges and other western regional colleges in preparation for their application to CAE2Y designation Innovation and Effective Grant ‐ $200,000 CCC will use the grant funds to support enhancing four areas of focus: 1) guided pathways; 2) student learning outcomes; 3) internal communication; and 4) professional development infrastructure California Cybersecurity Apprenticeship Project (CCAP) ‐ $1,000,000 CCC is the lead educational agency and fiscal agent for the CCAP project which focuses on the acute need for cybersecurity professionals to fill positions across the state of California for a variety of professional roles that exist in a stepped career pathway. Department of Defense Information Assurance Scholarship Program Cyber Security Workforce Education ‐ $214,983 Focuses on review of cyber pathway models and development and adoption of K‐12 cyber pathways that are offered with a community college partner. This project brings faculty and instructors together to develop pathways, including best practices and implementation strategies. Centers of Academic Excellence National and Regional Resource Center and Cybersecurity Workforce Education Initiatives ‐ $100,000 This grant funds activities related to working with colleges and universities in the Western Region of the US to provide assistance in the Centers of Academic Excellence program development and application process for non‐Centers of Academic Excellence institutions and helping current CAE institutions develop further their programs United Way Free Tax Prep Campaign ‐ $4,111 This is a grant to support the capacity of the Orange County United Way Partner Sites across Orange County to provide free tax services to eligible low‐income working families, ensuring client access to all eligible tax benefits, and are intended to increase the permanent capacity of Partner Sites so that they may expand their direct service delivery to their client population.

7
California Career Pathways Trust II ‐ Santa Ana Tech ‐ $387,682 The goal of the California Career Pathways Trust is to build robust partnerships between employers, schools, and community colleges in order to better prepare students for the 21st century workplace and improve student transition into postsecondary education, training, and employment. The California Career Pathways Trust II grant is a collaboration led by Santa Ana Unified School District (SAUSD) with Coastline, Santa Ana College, and Golden West College to develop seven K‐14 pathways for the SAUSD. Coastline is responsible for the computer science, cyber security, and digital graphics (shared with GWC) pathways. This award will fund the development of Cybersecurity pathways between SAUSD and Coastline Community College. CTE Enhancement Funds ‐ $247,478 These funds augmented and further developed the CyberSecurity/Computer Networking Program. Golden West College ‐ $1,779,115 Strong Workforce Program Regional FY 2016‐17‐ $182,228 GWC received Strong Workforce Program Regional allocation in the Automotive Technology, Career Technical Education Instructor Professional Development, Drone Technology Initiative, Regional and Sector Specific Marketing, and Vertical Sector Leader – Small Business and Entrepreneur. Strong Workforce Program Regional FY 2017‐18‐ $271,218 GWC received Strong Workforce Program Regional allocation in the following projects: Data Science Pathway Specialist, Work‐Based Learning and Job Placement, OC Careers in Education Pathway Collaborative, and CTE Marketing. Deputy Sector Navigator ‐ Health, also known at Health Workforce Initiative (HWI) Orange County ‐ $200,000 The Deputy Sector Navigator facilitates collaboration in the health occupations sector, bringing together education and industry partners to achieve the goals of both Economic and Workforce Development Program (SB1402) and the Career Technical Education Pathways Program (SB1070). Matching funds of $200,000 are required, source of funds are industry match for the new Graduate RN Transition program and revenue generated from projects. The Health Workforce Initiative (HWI) at Golden West College serves the Orange County region. The HWI has facilitated many activities that enhance the success of Doing What Matters and Economic and Workforce Development Program and that further the goals of the Strategic Priority Area. Marketing efforts through active involvement in community meetings, advisory committees, and state wide project committees enhance the HWI Program brand. The HWI products available on the www.ca‐hwi.org website are a valuable resource to both colleges and health care facilities. Many referrals come as a result of someone sharing HWI resources with a colleague. Participants in HWI educational offerings and meetings are well aware of the HWI programs and contributions to promote the advancement of California’s health care workforce through quality education and services. The grant has facilitated development for nursing and allied health faculty and staff, facilitated incumbent worker training for nursing and allied health, partnered with regional nursing and allied health programs to conduct meetings to more effect respond to industry needs and requests, facilitated curriculum and program development and revisions to meet workforce needs, and provided leadership for Regional Testing Center to continue operations for CNA exam. It has also funded CAMP Med for high school students at UC Irvine, sponsored a Regional Counselor's Workshop, held a regional medical assistant advisory board meeting at OCC, sponsored Medical Careers in Action at Kaiser Permanente Anaheim for 144 high school students, provided high school teacher training and HASPI program implementation, provided a healthcare pipeline collaboration workshop, sponsored a Men in Nursing statewide conference, and facilitated awareness related to career options in healthcare with high school students at the Coalition of Orange County Community Health Centers. California Career Pathways Trust II ‐ Santa Ana Tech ‐ $342,676 The goal of the California Career Pathways Trustis to build robust partnerships between employers, schools, and community colleges in order to better prepare students for the 21st century workplace and improve student transition into

8
postsecondary education, training, and employment. This award will fund the development of Digital Media pathways between Santa Unified School District and Golden West College. CTE Enhancement Funds ‐ $385,993 These funds augmented and further developed the Biomedical Design and Auto Tech/Alternative Fuels programs. Enrollment Growth for Associate Degree Nursing ‐ $97,000 The grant provides funding per student to increase the number of spaces in the Registered Nurse program and supports a pathway for Licensed Vocational Nurses to obtain the education required to be eligible to take the Registered Nurse licensing examination. Innovationmaker Grant Implementation ‐ $100,000 GWC plans to build a Makerspace as part of the statewide makerspace community of practice. GWC works with the CCC Maker team to strengthen the community of practice, support faculty and student leadership through the implementation phase and help GWC become recognized as a best practice model for education innovation Innovation and Effectiveness Grant ‐ $200,000 GWC will use grant funds to enhance four areas of focus: 1) enrollment management; 2) English as a Second Language; 3) long‐range financial planning/budget allocation model; and 4) pathways and community education. Orange Coast College ‐ $2,051,805 Strong Workforce Program Regional FY 2016‐17‐ $865,879 OCC received Strong Workforce Program Regional allocation in the following Projects: Drone Technology Initiative, Career Technical Education Professional Development, Regional and Sector Specific Marketing, Vertical Sector Development – Retail, Hospitality and Tourism and Energy and Sustainability Strong Workforce Program Regional FY 2017‐18‐ $180,025 OCC received Strong Workforce Program Regional allocation in the Biotech Consortium and Automation Pathways. Innovationmaker Grant Implementation ‐ $340,000 OCC will develop and participate in a statewide community of practice to develop and sustain innovative programs and activities supporting entrepreneurship, design thinking, design and fabrication technology, and sustainability "green" technologies. Aquatic Center Grants ‐ $28,070 The funding provides the OCC School of Sailing and Seamanship the opportunity to replace six sailing dinghies used for beginning instruction, provides student scholarships, instructor training. CTE Enhancement Funds ‐ $637,831 These funds augmented and further developed the Design Technology, Aviation Maintenance Technology, Advanced Manufacturing Technology, and Photography programs. District Office ‐ $14,582,357 Perkins VTEA 1‐C and CTE Transitions 2017‐18 ‐ $1,596,045 The purpose of the Perkins 1‐C grant is to develop more fully the academic, career and technical skills of secondary students and postsecondary students who elect to enroll in Career Technical Education (CTE) programs. CTE Transitions, also part of Perkins funding, promotes high school‐to‐community college pathways for CTE students and supports the generation and administration of CTE articulation agreements between high schools and community colleges.

9
Strong Workforce Program Regional FY 2016‐17‐ $100,000 Coast Community College District received Strong Workforce Program Regional allocation for the Regional Website Catalog. Coast Community College District leads this project by coordinating with other community college districts in Orange County to work with the product vendor to coordinate a regional workgroup and maximize the resources available to implement CourseLeaf as the regional online catalog. Strong Workforce Program Regional FY 2017‐18‐ $780,600 The Coast Community College District Strong Workforce Regional allocation is for two regional projects: 1) the Pathways and Early College Credit Scale Up and 2) the Story Map platform. Strong Workforce Program Local Allocation – FY 2016‐17‐ $2,414,498 The Strong Workforce Program Local Allocation is allocated across the three colleges and the District. The following programs are funded through the local allocation: CCC ‐ Computer Infrastructure, Engineering Technology, Marketing & Distribution, Digital Media, Accounting, Business & Commerce; GWC‐ Business Information Worker and Automotive Technology; OCC ‐ Aeronautics & Aviation, Construction Crafts Technology, Environmental Control Technology, Welding Technology and Manufacturing Technology; and District – Research Analyst. Strong Workforce Program Local Allocation – FY 2017‐18 ‐ $3,240,071 The Strong Workforce Program Local Allocation is allocated across the three colleges and the District. The following programs are funded through the local allocation: CCC ‐ Computer Infrastructure, Paralegal, Accounting, Business & Management; GWC – Cosmetology, Marketing, Professional Development, Digital Media, Health Information Technology, Computer Aided Drafting; OCC – Film, Applied Photography, Welding Technology, Manufacturing Technology; District – Research Analyst. Adult Education Block Grant ‐ $3,033,260 allocation for CCCD 2016‐17 and 2017‐18 Coast CCD is the Project Director and Consortium Chair for the Coast Adult Education Consortium consisting of the three colleges, Huntington Beach Union HSD, Newport‐Mesa USD, Garden Grove USD, Coastline ROP, and the Orange County Department of Education. The Coast Adult Education Consortium is charged with annually developing and implementing a regional education and workforce service plan for adults within the geographic boundaries of the Coast CCD. Current projects are the alignment and coordination of ESL courses and assessments between the adult schools and the Coast colleges, the development of a college math readiness program utilizing diagnostic assessments and targeted instruction, offering better access to counselors and support services for adult students, developing communities of practice between community college faculty and adult education instructors, developing targeted, short‐term non‐credit CTE programs at both the adult schools and the community colleges, and partnering with community non‐governmental organizations for recruitment and provision of services for the adult student population. Adult Education Block Grant Data & Accountability ‐ $376,642 The Adult Education Block Grant Data & Accountability funds is used to foster regional and local system integration efforts, support data sharing, and respond to the short term data reporting requirements of the grant. Strong Workforce Career Pathways Grant ‐ $250,000 This grant funds the SB1070 Consortium, comprised of four community college districts, nine colleges, high school Regional Occupational Programs, middle schools, and regional business organizations led by the CCCD. The SB1070 Consortium has worked collaboratively to create policy changes to ease awarding credit to high school students for articulated courses, create industry‐relevant stacked credentials, promote countywide pathways and build the infrastructure to collect data to populate the CCC Chancellor's Office LaunchBoard data interface. SB1070 ‐ OC Career Technical Education Pathways Program Grant‐ $1,979,491 The SB 1070 Career Technical Education (CTE) Pathways Program grant is a collaboration of the nine Orange County community colleges, the North Orange County Community College District School of Continuing Education, the Orange County Department of Education, K‐12 districts and Regional Occupational Programs (ROPs), and regional business and labor organizations. The three‐year grant has leveraged funding to work collaboratively across Orange County to develop and

10
recommend policy changes that ease the awarding of college credit to high school students for articulated and dual enrollment courses, create industry‐recognized portable and stackable credentials, and promote countywide pathways. Areas of focus are in high wage, high demand industry sectors such as: Advanced Manufacturing; Biotech; Digital Media Arts; Energy and Utilities; Engineering; Global Trade and Logistics; Healthcare; Information Communications Technology (ICT); Retail, Hospitality and Tourism; and Small Business. California Career Pathways Trust II ‐ $811,750 The goal of the California Career Pathways Trust is to build robust partnerships between employers, schools, and community colleges in order to better prepare students for the 21st century workplace and improve student transition into postsecondary education, training, and employment. Total active CTE or supporting CTE grant funds through fiscal year 2017‐18 (as of May 2018): $23,204,673.
CTE Program Reviews In accordance with Education Code Section 78016, local districts are required to review each CTE program every two years to ensure that the program: 1. Meets a documented labor market demand, 2. Is not duplicative of other regional training, and 3. Is effective. Together, CCC, GWC, and OCC offer 76 CTE programs leading to certificates or associate degrees in all of the ten priority industry sectors of the Doing What Matters for Jobs and the Economy framework from the California Community Colleges Chancellor's Office and all of the 15 industry sectors as outlined in the CTE Model Curriculum Standards from the California Department of Education. During 2017‐18 CCC, GWC, and OCC conducted biennial program review for 27 of the 76 CTE programs in the district.
To address the requirement of whether a CTE program meets a documented labor market demand, the biennial program
review analyzed the current and projected job openings reported by the Economic Modeling Specialists International (EMSI).
This information is presented on Table 1 of the biennial program review template, which also includes a comparison of
differences between current and project job openings. Additionally, to address this requirement, Table 2 of the biennial
program review template provides the percentile earnings within the market for the occupations associated with the
program.
To address the requirement of whether a CTE program is duplicative of other regional training, a tally of certificates and
associate degrees awarded by colleges for the same program in the Orange County Region is provided on Table 3 of the
biennial program review template. This information also shows the percentage distribution of the total
certificates/associate degrees awarded by colleges and a growth comparison of these awards.
Lastly, to address the effectiveness of a CTE program, the biennial program review examined the enrollment, retention
rates, course success rates and the degrees and certificates awarded for the past five academic years. This information is
presented on Table 4 of the biennial program review template.
The following are programs reviewed in 2017‐18. Coastline College Biology Business Communication

11
Electronics and Electric Technology Gerontology Human Services Information Technology Real Estate Golden West College Criminal Justice Interpreting Nursing Orange Coast College Accounting Airline Business Computer Information Systems Display and Visual Presentation Early Childhood Health Education Hospitality, Travel, and Tourism Hotel Interior Design Journalism Management Mariner Marketing Polysomnographic Technology Radiologic Technology Real Estate Appendix 1 contains the biennial program review sheet for each of the CTE programs listed.

Appendix 1
2017-18 Biennial Program Reviews
Appendix 1 12

Coastline Community College
Appendix 1 13

PROGRAM TITLE: Biology COLLEGE: Coastline Community College
DATE: 2018 Biennial Program Review TOPS CODE:
0430.00: Biotechnology and Biomedical Technology
1260.00: Health Professions, Transfer Core Curriculum
CERTIFICATES AND DEGREES TOTAL: 2
CERTIFICATES DEGREES
Certificate of Achievement: Biological Lab Technician
Certificate of Achievement: Health Science
NONE
.
Coastline Community College offers two degrees under the Biology Program. According to the Economic Modeling
Specialists International (EMSI), there were 11,007 job openings in 2016 associated with the Biology Program. Overall,
this program is expected to increase by 5.6% between 2016 and 2025, with Medical and Clinical Laboratory Technicians
showing a strong increase of 17.8%, and Inspectors, Tester, Sorters, Samplers, and Weighers anticipated to have an
increase of 1.6%.
The table below shows the projected openings and percentage changes within each occupation associated with the
program.
1. PROGRAM MEETS A DOCUMENTED LABOR MARKET DEMAND: GROWTH IN MARKET Data based on TOP code crosswalk to applicable SOC Codes Job openings based on Orange County Region as reported in EMSI: Occupation Overview Report
OCCUPATION EMSI Current Openings (2016)
EMSI Projected Openings (2025)
Change Between 2016‐2025 Job Openings
% Change
Biological Technicians (19‐4021) 561 602 +41 +7.3%
Life, Physical, and Social Science Technicians, All Other (19‐4099)
649 743 +94 +14.5%
Medical and Clinical Laboratory Technicians (29‐2012)
1,768 2,083 +315 +17.8%
Medical Equipment Repairers (49‐9062)
420 470 +50 +11.9%
Inspectors, Testers, Sorters, Samplers, and Weighers (51‐9061)
7,609 7,729 +120 +1.6%
TOTAL 11,007 11,627 +620 +5.6%
Appendix 1 14

The Medical Equipment Repairers occupation leads the Biology Program related occupation with a median earnings of
$32.88/hour; while the Inspectors, Testers, Sorters, Samplers, and Weighers occupation have the lowest median
earnings of $24.12/hour.
Of the total 78 certificate and associate’s degrees awarded in 2016‐17, Coastline Community College awarded 23.1% of
the certificate associate’s degrees in Biology in the Orange County Region. Compared to 2015‐16, the number of awards
by Coastline Community College decreased by 18.2%.
2. PROGRAM MEETS A DOCUMENTED LABOR MARKET DEMAND: PERCENTILE EARNINGS WITHIN MARKET Data based on TOP code crosswalk to applicable SOC Codes Percentile earnings based on Orange County Region as reported in EMSI: Occupation Overview Report
OCCUPATION 25th Percentile Earnings Median Earnings 75th Percentile Earnings
Biological Technicians (19‐4021) $16.90/hour $20.41/hour $28.92/hour
Life, Physical, and Social Science Technicians, All Other (19‐4099)
$19.51/hour $24.22/hour $30.62/hour
Medical and Clinical Laboratory Technicians (29‐2012)
$16.77/hour $20.75/hour $26.18/hour
Medical Equipment Repairers (49‐9062)
$18.28/hour $23.29/hour $32.88/hour
Inspectors, Testers, Sorters, Samplers, and Weighers (51‐9061)
$13.92/hour $18.13/hour $24.12/hour
PERCENTILE EARNING AVERAGE $14.90/hour $19.32/hour $25.31/hour
3. PROGRAM DOES NOT REPRESENT UNNECESSARY DUPLICATION OF OTHER MANPOWER TRAINING PROGRAMS IN THE AREA:
Programs based on CIP Code (26.0502 and 51.1199) Certificates and Associate’s degrees in Orange County Region as reported in EMSI: Program Overview
INSTITUTION Certificates Awarded
(2016‐2017)
Associate Degrees Awarded
(2016‐2017)
% Distribution of Total Certificate /Associate Degrees Awarded
EMSI Growth % Year over Year (YOY) (2015)
Irvine Valley College 0 25 32.1% +78.6%
Fullerton College 0 21 26.9% ‐38.2%
Coastline Community College
18 0 23.1% ‐18.2%
Santa Ana College 0 14 17.9% +142.9%
Appendix 1 15

The course data above reflect course TOP codes aligned with the program TOP codes. Students may enroll in
required associate or certificate courses within the program that fall outside of the program TOP codes. These
external TOP codes are not included in the above figures.
The enrollment in the Biology program remained stagnant over the last three years from 0 in 2014‐2015 to 0 in
2016‐2017. The FTES also remained stagnant over the last three years from 0 in 2014‐15 to 0 in 2016‐2017. The
instructional load efficiency (WSCH/FTEF) remained stagnant from 0 in 2015‐2016 to 0 in 2016‐2017. A value of
525 or higher is the standard average target and it is a measure of average class enrollment needed for cost
efficiency purposes.
Overall, with the stagnation of enrollment in the program, the number of FTES, degrees and certificates have
remained stagnant as well.
4. PROGRAM IS OF DEMONSTRATED EFFECTIVENESS AS MEASURED BY THE ENROLLMENT AND COMPLETION SUCCESS OF ITS STUDENTS:
Data based on TOP code (0430.00 and 1260.00) reported to the District by each of the respective college. Enrollment: Data Source: Argos – Program Review Enrollment Cube (Census Enrollment) FTES: Data Source: Argos – Program Review Enrollment Cube (FTES Total) FTES: Resident: Data Source: Argos – Program Review Enrollment Cube (FTES Res 320) FTES: Non‐Resident: Data Source: Argos – Program Review Enrollment Cube (FTES NRes 320) WSCH/FTEF: Data Source: Argos – Program Review Enrollment Cube (WSCH_FTEF 525 Est) Retention within Subject: Data Source: DataMart ‐ Retention/Success Rate (Enrollment Count in Fall compared with Retention Count in Spring) Annualized Course Success Rate: Data Source: Argos – Program Review Access Success Cube (Success) Degrees and Certificates: Data Source: DataMart ‐ Program Awards Summary
Academic Year 2012‐2013 2013‐2014 2014‐2015 2015‐2016 2016‐2017
Enrollment 3 0 0 0 0
FTES 0 0 0 0 0
FTES: Resident 0 0 0 0 0
FTES: Non‐Resident 0 0 0 0 0
WSCH/FTEF 0 0 0 0 0
Fall to Spring Retention Within Subject
Fall‐to‐Spring 4/3 0/0 0/0 0/0 0/0
Fall‐to‐Spring Retention 75% NA NA NA NA
Annualized Course Success Rate
73.8% 73.9% 74.7% 75.2% 77.0%
Degrees and Certificates
Certificates 0 0 23 18 24
Associate Degrees 0 0 0 0 0
Total 0 0 23 18 24
Appendix 1 16

PROGRAM TITLE: Business Computing COLLEGE: Coastline Community College
DATE: 2018 Biennial Program Review TOPS CODE:
0514.00: Office Technology/Office Computer Applications
0614.30: Website Design and Development
0702.10: Software Applications
CERTIFICATES AND DEGREES TOTAL: 6
CERTIFICATES DEGREES
Certificate of Achievement: OSS: Financial Assistant
Certificate of Achievement: OSS: General Office Manager
Certificate of Completion: Mobile Applications
Certificate of Completion: Medical Admin Office Tech
Certificate of Completion: Medical Coding Specialist
Associate of Science: OSS: Financial Manager
1. PROGRAM MEETS A DOCUMENTED LABOR MARKET DEMAND: GROWTH IN MARKET Data based on TOP code crosswalk to applicable SOC Codes Job openings based on Orange County Region as reported in EMSI: Occupation Overview Report
OCCUPATION EMSI Current Openings (2016)
EMSI Projected Openings (2025)
Change Between 2016‐2025 Job Openings
% Change
Web Developers (15‐1134) 3,202 3,718 +516 +16.1%
Executive Secretaries and Executive Administrative Assistants (43‐6011)
9,109 9,078 ‐31 ‐0.3%
Secretaries and Administrative Assistants, Except Legal, Medical, and Executive (43‐6014)
25,805 28,674 +2,869 +11.1%
Data Entry Keyers (43‐9021) 3,203 3,261 +58 +1.8%
TOTAL 41,320 44,731 +3,411 +8.3%
Coastline Community College offers six degrees and certificates under the Business Computing Program. According to
the Economic Modeling Specialists International (EMSI), there were 41,320 job openings in 2016 associated with the
Business Computing Program. Overall, this program is expected to increase by 8.3% between 2016 and 2025, with Web
Developers showing a strong increase of 16.1%, and Executive Secretaries and Executive Administrative Assistants
anticipated to have a decreased 0.3%.
The table below shows the projected openings and percentage changes within each occupation associated with the
program.
Appendix 1 17

The Web Developers occupation leads the Business Computing Program related occupation with a median earnings of
$42.59/hour; while the Data Entry Keyers occupation have the lowest median earnings of $20.22/hour.
Of the total 142 certificate and associate’s degrees awarded in 2016‐17, Coastline Community College awarded 25.4% of
the certificate associate’s degrees in Business Computing in the Orange County Region. Compared to 2015‐16, the
number of awards by Coastline Community College decreased by 18.2%
2. PROGRAM MEETS A DOCUMENTED LABOR MARKET DEMAND: PERCENTILE EARNINGS WITHIN MARKET Data based on TOP code crosswalk to applicable SOC Codes Percentile earnings based on Orange County Region as reported in EMSI: Occupation Overview Report
OCCUPATION 25th Percentile Earnings Median Earnings 75th Percentile Earnings
Web Developers (15‐1134) $20.03/hour $27.45/hour $42.59/hour
Executive Secretaries and Executive Administrative Assistants (43‐6011)
$23.69/hour $29.32/hour $35.62/hour
Secretaries and Administrative Assistants, Except Legal, Medical, and Executive (43‐6014)
$15.11/hour $18.66/hour $23.60/hour
Data Entry Keyers (43‐9021) $12.69/hour $16.26/hour $20.22/hour
PERCENTILE EARNING AVERAGE $16.06/hour $20.63/hour $27.48/hour
3. PROGRAM DOES NOT REPRESENT UNNECESSARY DUPLICATION OF OTHER MANPOWER TRAINING PROGRAMS IN THE AREA:
Programs based on CIP Code (11.0601, 11.0801, and 52.0401) Certificates and Associate’s degrees in Orange County Region as reported in EMSI: Program Overview
INSTITUTION Certificates Awarded
(2016‐2017)
Associate Degrees Awarded
(2016‐2017)
% Distribution of Total Certificate /Associate Degrees Awarded
EMSI Growth % Year over Year (YOY) (2015)
Irvine Valley College 35 8 30.3% +59.3%
Coastline Community College
12 24 25.4% ‐29.4%
Saddleback College 16 6 15.5% ‐12.0%
Santa Ana College 13 4 12.0% ‐23.5%
Cypress College 8 3 7.7% +27.3%
Golden West College 4 2 4.2% +20.0%
Allied American University 4 0 2.8% ‐71.4%
Argosy University–The Art Institute of California–Orange County
1 3 2.8% ‐55.6%
InterCoast Colleges‐Anaheim
3 0 2.1% +300%
Appendix 1 18

4. PROGRAM IS OF DEMONSTRATED EFFECTIVENESS AS MEASURED BY THE ENROLLMENT AND COMPLETION SUCCESS OF ITS STUDENTS:
Data based on TOP code (0514.00, 0614.30 and 0702.10) reported to the District by each of the respective college. Enrollment: Data Source: Argos – Program Review Enrollment Cube (Census Enrollment) FTES: Data Source: Argos – Program Review Enrollment Cube (FTES Total) FTES: Resident: Data Source: Argos – Program Review Enrollment Cube (FTES Res 320) FTES: Non‐Resident: Data Source: Argos – Program Review Enrollment Cube (FTES NRes 320) WSCH/FTEF: Data Source: Argos – Program Review Enrollment Cube (WSCH_FTEF 525 Est) Retention within Subject: Data Source: DataMart ‐ Retention Rate (Enrollment Count in Fall and Spring of Academic Year compared with Retained Count) Annualized Course Success Rate: Data Source: Argos – Program Review Access Success Cube (Success) Degrees and Certificates: Data Source: DataMart ‐ Program Awards Summary
Academic Year 2012‐2013 2013‐2014 2014‐2015 2015‐2016 2016‐2017
Enrollment 1,549 1,655 1,565 1,569 1,044
FTES 83 95 133 127 77
FTES: Resident 82 94 133 125 76
FTES: Non‐Resident 0 0 0 1 1
WSCH/FTEF 0 0 0 513.3 397.9
Fall to Spring Course Retention Within Subject
Fall‐to‐Spring 1,229/943 1,295/977 1,215/961 1,245/936 853/641
Fall‐to‐Spring Retention 76.7% 75.4% 79.1% 75.2% 75.1%
Annualized Course Success Rate
76.7% 63.9% 56.1% 59.6% 57.0%
Degrees and Certificates
Certificates 12 20 25 12 20
Associate Degrees 21 17 26 24 30
Total 33 37 51 36 50
The course data above reflect course TOP codes aligned with the program TOP codes. Students may enroll in
required associate or certificate courses within the program that fall outside of the program TOP codes. These
external TOP codes are not included in the above figures.
The enrollment in the Business Computing program decreased over the last three years from 1.565 in 2014‐2015
to 1,044 in 2016‐2017. The FTES also decreased over the last three years from 133 in 2014‐15 to 77 in 2016‐
2017. The instructional load efficiency (WSCH/FTEF) decreased from 513.3 in 2015‐2016 to 379.9 in 2016‐2017.
A value of 525 or higher is the standard average target and it is a measure of average class enrollment needed for
cost efficiency purposes.
While there was an overall decrease of enrollment in the program, the number of FTES, degrees and certificates
have fluctuated.
Appendix 1 19

PROGRAM TITLE: Electronics and Electric Technology
COLLEGE: Coastline Community College
DATE: 2018 Biennial Program Review TOPS CODE:
0934.00: Electronics and Electric Technology
CERTIFICATES AND DEGREES TOTAL: 2
CERTIFICATES DEGREES
Certificate of Achievement: Electronics Associate of Arts: Electronics
1. PROGRAM MEETS A DOCUMENTED LABOR MARKET DEMAND: GROWTH IN MARKET Data based on TOP code crosswalk to applicable SOC Codes Job openings based on Orange County Region as reported in EMSI: Occupation Overview Report
OCCUPATION EMSI Current Openings (2016)
EMSI Projected Openings (2025)
Change Between 2016‐2025 Job Openings
% Change
Electronics Engineers, Except Computer (17‐2072)
3,943 3,832 ‐111 ‐2.8%
Electrical and Electronics Engineering Technicians (17‐3023)
2,317 2,289 ‐28 ‐1.2%
Electric Motor, Power Tool, and Related Repairers (49‐2092)
44 51 7 15.9%
Electrical and Electronics Installers and Repairers, Transportation Equipment (49‐2093)
30 36 6 20.0%
Electrical and Electronics Repairers, Commercial and Industrial Equipment (49‐2094)
1,160 1,175 15 1.3%
Electrical and Electronics Repairers, Powerhouse, Substation, and Relay (49‐2095)
107 111 4 3.7%
Electrical and Electronic Equipment Assemblers (51‐2022)
5,724 5,387 ‐337 ‐5.9%
TOTAL 13,325 12,881 ‐444 ‐3.3%
Coastline Community College offers two degrees under the Electronics and Electric Technology Program. According to
the Economic Modeling Specialists International (EMSI), there were 13,325 job openings in 2016 associated with the
Electronics and Electric Technology Program. Overall, this program is expected to decrease by 3.3% between 2016 and
2025, with Electrical and Electronics Installers and Repairers, Transportation Equipment showing a strong increase of
20.0%, and Electrical and Electronic Equipment Assemblers anticipated to have a decrease of 5.6%.
The table below shows the projected openings and percentage changes within each occupation associated with the
program.
Appendix 1 20

The Electronics Engineers, Except Computer occupation leads the Electronics and Electric Technology Program related
occupation with a median earnings of $62.62/hour; while the Electrical and Electronic Equipment Assemblers
occupation have the lowest median earnings of $16.54/hour.
Of the total 162 certificate and associate’s degrees awarded in 2016‐17, Coastline Community College awarded 77.2% of
the certificates and associate’s degrees in Electronics and Electric Technology in the Orange County Region. Compared
to 2015‐16, the number of awards by Coastline Community College increased by 1.6%.
2. PROGRAM MEETS A DOCUMENTED LABOR MARKET DEMAND: PERCENTILE EARNINGS WITHIN MARKET Data based on TOP code crosswalk to applicable SOC Codes Percentile earnings based on Orange County Region as reported in EMSI: Occupation Overview Report
OCCUPATION 25th Percentile Earnings Median Earnings 75th Percentile Earnings
Electronics Engineers, Except Computer (17‐2072)
$34.35/hour $45.40/hour $62.62/hour
Electrical and Electronics Engineering Technicians (17‐3023)
$19.86/hour $27.15/hour $34.98/hour
Electric Motor, Power Tool, and Related Repairers (49‐2092)
$20.41/hour $24.63/hour $32.43/hour
Electrical and Electronics Installers and Repairers, Transportation Equipment (49‐2093)
$30.65/hour $37.27/hour $44.21/hour
Electrical and Electronics Repairers, Commercial and Industrial Equipment (49‐2094)
$20.91/hour $26.08/hour $33.65/hour
Electrical and Electronics Repairers, Powerhouse, Substation, and Relay (49‐2095)
$36.43/hour $40.66/hour $47.20/hour
Electrical and Electronic Equipment Assemblers (51‐2022)
$10.74/hour $13.09/hour $16.54/hour
PERCENTILE EARNING AVERAGE $13.79/hour $23.06/hour $37.84/hour
3. PROGRAM DOES NOT REPRESENT UNNECESSARY DUPLICATION OF OTHER MANPOWER TRAINING PROGRAMS IN THE AREA:
Programs based on CIP Code (15.0303 and 47.0101) Certificates and Associate’s degrees in Orange County Region as reported in EMSI: Program Overview
INSTITUTION Certificates Awarded
(2016‐2017)
Associate Degrees Awarded
(2016‐2017)
% Distribution of Total Certificate /Associate Degrees Awarded
EMSI Growth % Year over Year (YOY) (2015)
Coastline Community College
0 125 77.2% +1.6%
Irvine Valley College 16 5 13.0% 40.0%
Saddleback College 5 4 5.6% ‐64.0%
Orange Coast College 3 4 4.3% 16.7%
Appendix 1 21

4. PROGRAM IS OF DEMONSTRATED EFFECTIVENESS AS MEASURED BY THE ENROLLMENT AND COMPLETION SUCCESS OF ITS STUDENTS:
Data based on TOP code (0934.00) reported to the District by each of the respective college. Enrollment: Data Source: Argos – Program Review Enrollment Cube (Census Enrollment) FTES: Data Source: Argos – Program Review Enrollment Cube (FTES Total) FTES: Resident: Data Source: Argos – Program Review Enrollment Cube (FTES Res 320) FTES: Non‐Resident: Data Source: Argos – Program Review Enrollment Cube (FTES NRes 320) WSCH/FTEF: Data Source: Argos – Program Review Enrollment Cube (WSCH_FTEF 525 Est) Retention within Subject: Data Source: DataMart ‐ Retention Rate (Enrollment Count in Fall and Spring of Academic Year compared with Retained Count) Annualized Course Success Rate: Data Source: Argos – Program Review Access Success Cube (Success) Degrees and Certificates: Data Source: DataMart ‐ Program Awards Summary
Academic Year 2012‐2013 2013‐2014 2014‐2015 2015‐2016 2016‐2017
Enrollment Insufficient Data Insufficient Data Insufficient Data Insufficient Data Insufficient Data
FTES Insufficient Data Insufficient Data Insufficient Data Insufficient Data Insufficient Data
FTES: Resident Insufficient Data Insufficient Data Insufficient Data Insufficient Data Insufficient Data
FTES: Non‐Resident Insufficient Data Insufficient Data Insufficient Data Insufficient Data Insufficient Data
WSCH/FTEF Insufficient Data Insufficient Data Insufficient Data Insufficient Data Insufficient Data
Fall to Spring Course Retention Within Subject
Fall‐to‐Spring Insufficient Data Insufficient Data Insufficient Data Insufficient Data Insufficient Data
Fall‐to‐Spring Retention
Insufficient Data Insufficient Data Insufficient Data Insufficient Data Insufficient Data
Annualized Course Success Rate
Insufficient Data Insufficient Data Insufficient Data Insufficient Data Insufficient Data
Degrees and Certificates
Certificates 0 0 0 0 0
Associate Degrees 84 89 123 128 100
Total 84 89 123 128 100
The course data above reflect course TOP codes aligned with the program TOP codes. Students may enroll in
required associate or certificate courses within the program that fall outside of the program TOP codes. These
external TOP codes are not included in the above figures.
The enrollment in the Electronics and Electric Technology program is unique because of an articulation
agreement through Military/Contract Education allowing students to utilize training to satisfy program
requirements for the associate degree. Based on this reason and no enrollment within the certificate program
there is no course information for this program.
Overall the award of associate degrees has fluctuated peaking in 2015‐2016 (128 degrees awarded), however
dropping to below 2014‐2015 numbers in 2016‐2017 (100 degrees awarded).
Appendix 1 22
PROGRAM TITLE: Gerontology COLLEGE: Coastline Community College
DATE: 2018 Biennial Program Review TOPS CODE:
1309.00: Gerontology
CERTIFICATES AND DEGREES TOTAL: 3
CERTIFICATES DEGREES
Certificate of Achievement: Gerontology (CTE)
Associate of Arts: Gerontology (CTE)
Associate of Arts: Gerontology (MAJOR)
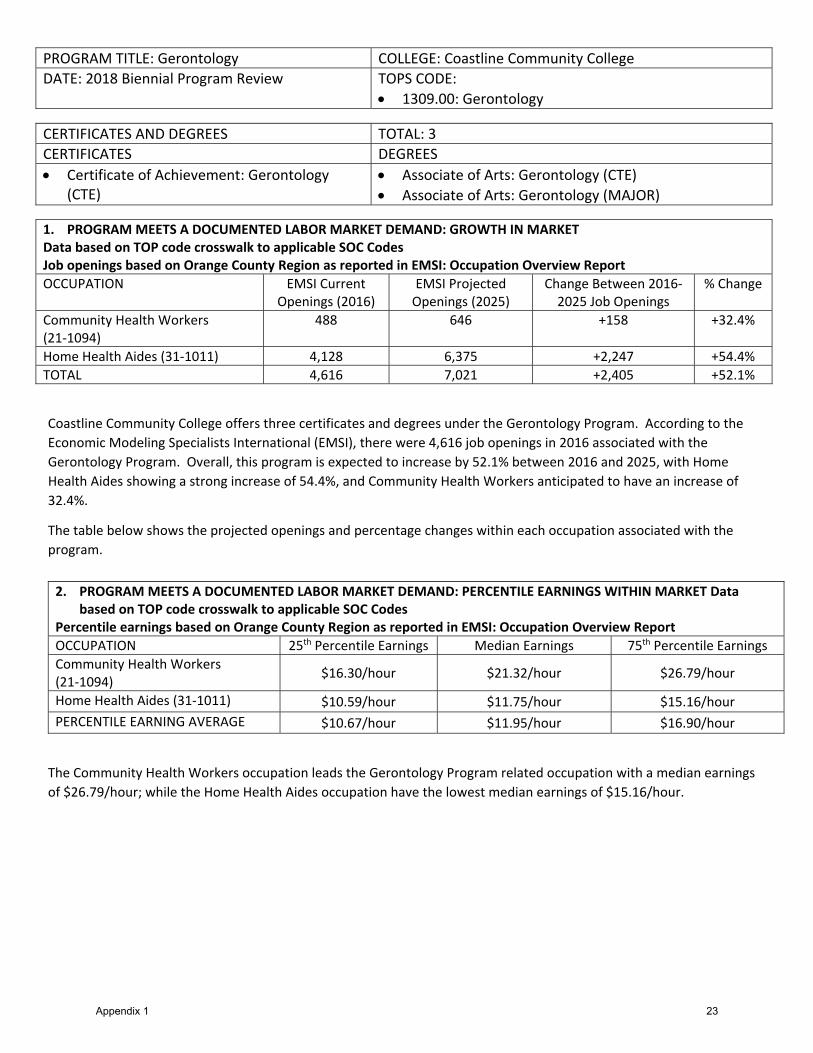
1. PROGRAM MEETS A DOCUMENTED LABOR MARKET DEMAND: GROWTH IN MARKET Data based on TOP code crosswalk to applicable SOC Codes Job openings based on Orange County Region as reported in EMSI: Occupation Overview Report
OCCUPATION EMSI Current Openings (2016)
EMSI Projected Openings (2025)
Change Between 2016‐2025 Job Openings
% Change
Community Health Workers (21‐1094)
488 646 +158 +32.4%
Home Health Aides (31‐1011) 4,128 6,375 +2,247 +54.4%
TOTAL 4,616 7,021 +2,405 +52.1%
Coastline Community College offers three certificates and degrees under the Gerontology Program. According to the
Economic Modeling Specialists International (EMSI), there were 4,616 job openings in 2016 associated with the
Gerontology Program. Overall, this program is expected to increase by 52.1% between 2016 and 2025, with Home
Health Aides showing a strong increase of 54.4%, and Community Health Workers anticipated to have an increase of
32.4%.
The table below shows the projected openings and percentage changes within each occupation associated with the
program.
The Community Health Workers occupation leads the Gerontology Program related occupation with a median earnings
of $26.79/hour; while the Home Health Aides occupation have the lowest median earnings of $15.16/hour.
2. PROGRAM MEETS A DOCUMENTED LABOR MARKET DEMAND: PERCENTILE EARNINGS WITHIN MARKET Data based on TOP code crosswalk to applicable SOC Codes
Percentile earnings based on Orange County Region as reported in EMSI: Occupation Overview Report
OCCUPATION 25th Percentile Earnings Median Earnings 75th Percentile Earnings
Community Health Workers (21‐1094)
$16.30/hour $21.32/hour $26.79/hour
Home Health Aides (31‐1011) $10.59/hour $11.75/hour $15.16/hour
PERCENTILE EARNING AVERAGE $10.67/hour $11.95/hour $16.90/hour
Appendix 1 23

Of the total 22 certificate and associate’s degrees awarded in 2016‐17, Coastline Community College awarded 54.5% of
the certificates and associate’s degrees in Gerontology in the Orange County Region. Compared to 2015‐16, the number
of awards by Coastline Community College decreased by 20.0%.
3. PROGRAM DOES NOT REPRESENT UNNECESSARY DUPLICATION OF OTHER MANPOWER TRAINING PROGRAMS IN THE AREA:
Programs based on CIP Code (19.0702) Certificates and Associate’s degrees in Orange County Region as reported in EMSI: Program Overview
INSTITUTION Certificates Awarded
(2016‐2017)
Associate Degrees Awarded
(2016‐2017)
% Distribution of Total Certificate /Associate Degrees Awarded
EMSI Growth % Year over Year (YOY) (2015)
Coastline Community College
6 6 54.5% ‐20.0%
Saddleback College 8 0 36.4% ‐38.5%
Cypress College 2 0 9.1% ‐33.3%
Appendix 1 24

4. PROGRAM IS OF DEMONSTRATED EFFECTIVENESS AS MEASURED BY THE ENROLLMENT AND COMPLETION SUCCESS OF ITS STUDENTS:
Data based on TOP code (1309.00) reported to the District by each of the respective college. Enrollment: Data Source: Argos – Program Review Enrollment Cube (Census Enrollment) FTES: Data Source: Argos – Program Review Enrollment Cube (FTES Total) FTES: Resident: Data Source: Argos – Program Review Enrollment Cube (FTES Res 320) FTES: Non‐Resident: Data Source: Argos – Program Review Enrollment Cube (FTES NRes 320) WSCH/FTEF: Data Source: Argos – Program Review Enrollment Cube (WSCH_FTEF 525 Est) Retention within Subject: Data Source: DataMart ‐ Retention Rate (Enrollment Count in Fall and Spring of Academic Year compared with Retained Count) Annualized Course Success Rate: Data Source: Argos – Program Review Access Success Cube (Success) Degrees and Certificates: Data Source: DataMart ‐ Program Awards Summary
Academic Year 2012‐2013 2013‐2014 2014‐2015 2015‐2016 2016‐2017
Enrollment 132 102 102 87 81
FTES 11 9 8 7 7
FTES: Resident 11 9 8 7 7
FTES: Non‐Resident 0 0 0 0 0
WSCH/FTEF 0 0 0 347.4 361.1
Fall to Spring Course Retention Within Subject
Fall‐to‐Spring 122/79 95/68 89/63 76/68 79/65
Fall‐to‐Spring Retention
64.8% 71.6% 70.8% 89.5% 82.3%
Annualized Course Success Rate
58.8% 65.2% 64.3% 65.8% 71.3%
Degrees and Certificates
Certificates 10 11 15 12 13
Associate Degrees 1 3 6 6 8
Total 11 14 21 18 21
The course data above reflect course TOP codes aligned with the program TOP codes. Students may enroll in
required associate or certificate courses within the program that fall outside of the program TOP codes. These
external TOP codes are not included in the above figures.
The enrollment in the Gerontology program has declined over the last three years from 102 in 2014‐2015 to 81 in
2016‐2017. The FTES dropped slightly over the last three years from 8 in 2014‐15 to 7 in 2016‐2017. The
instructional load efficiency (WSCH/FTEF) increased from 347.7 in 2015‐2016 to 361.1 in 2016‐2017. A value of
525 or higher is the standard average target and it is a measure of average class enrollment needed for cost
efficiency purposes.
Overall, with the drop of enrollment in the program as well as the number of FTES, the degrees and certificates
awarded have fluctuated over the past five years. The past three years have resulted in total certificates and
degrees awarded remaining between 18 and 21.
Appendix 1 25
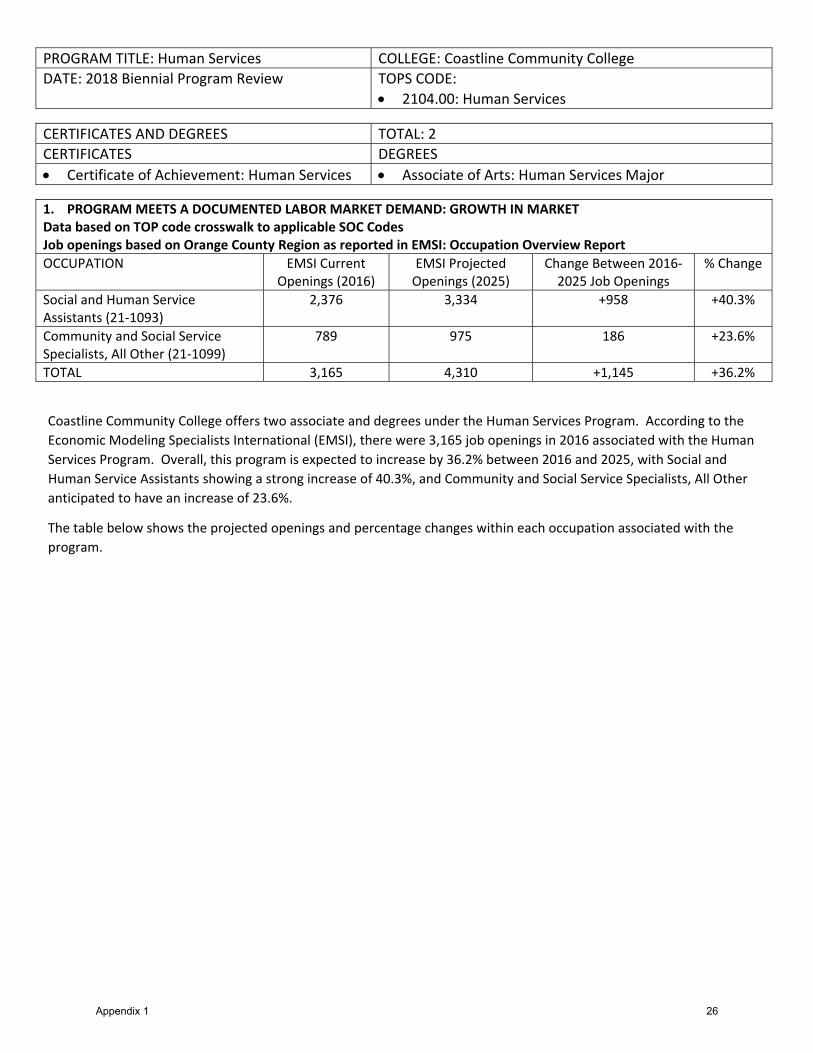
PROGRAM TITLE: Human Services COLLEGE: Coastline Community College
DATE: 2018 Biennial Program Review TOPS CODE:
2104.00: Human Services
CERTIFICATES AND DEGREES TOTAL: 2
CERTIFICATES DEGREES
Certificate of Achievement: Human Services Associate of Arts: Human Services Major
1. PROGRAM MEETS A DOCUMENTED LABOR MARKET DEMAND: GROWTH IN MARKET Data based on TOP code crosswalk to applicable SOC Codes Job openings based on Orange County Region as reported in EMSI: Occupation Overview Report
OCCUPATION EMSI Current Openings (2016)
EMSI Projected Openings (2025)
Change Between 2016‐2025 Job Openings
% Change
Social and Human Service Assistants (21‐1093)
2,376 3,334 +958 +40.3%
Community and Social Service Specialists, All Other (21‐1099)
789 975 186 +23.6%
TOTAL 3,165 4,310 +1,145 +36.2%
Coastline Community College offers two associate and degrees under the Human Services Program. According to the
Economic Modeling Specialists International (EMSI), there were 3,165 job openings in 2016 associated with the Human
Services Program. Overall, this program is expected to increase by 36.2% between 2016 and 2025, with Social and
Human Service Assistants showing a strong increase of 40.3%, and Community and Social Service Specialists, All Other
anticipated to have an increase of 23.6%.
The table below shows the projected openings and percentage changes within each occupation associated with the
program.
Appendix 1 26

The Community and Social Service Specialists, All Other occupation leads the Human Services Program related
occupation with a median earnings of $35.10/hour; while the Social and Human Service Assistants occupation have the
lowest median earnings of $20.84/hour.
Of the total 98 certificates and associate’s degrees awarded in 2016‐17, Coastline Community College awarded 25.5% of
the certificates and associate’s degrees in Human Services program in the Orange County Region. Compared to 2015‐16,
the number of awards by Coastline Community College decreased by 39.3%.
2. PROGRAM MEETS A DOCUMENTED LABOR MARKET DEMAND: PERCENTILE EARNINGS WITHIN MARKET Data based on TOP code crosswalk to applicable SOC Codes Percentile earnings based on Orange County Region as reported in EMSI: Occupation Overview Report
OCCUPATION 25th Percentile Earnings Median Earnings 75th Percentile Earnings
Social and Human Service Assistants (21‐1093)
$13.08/hour $16.59/hour $20.84/hour
Community and Social Service Specialists, All Other (21‐1099)
$19.14/hour $27.10/hour $35.10/hour
PERCENTILE EARNING AVERAGE $13.83/hour $17.97/hour $25.20/hour
3. PROGRAM DOES NOT REPRESENT UNNECESSARY DUPLICATION OF OTHER MANPOWER TRAINING PROGRAMS IN THE AREA:
Programs based on CIP Code (44.0000) Certificates and Associate’s degrees in Orange County Region as reported in EMSI: Program Overview
INSTITUTION Certificates Awarded
(2016‐2017)
Associate Degrees Awarded
(2016‐2017)
% Distribution of Total Certificate /Associate Degrees Awarded
EMSI Growth % Year over Year (YOY) (2015)
Santa Ana College 2 35 37.8% ‐39.3%
Coastline Community College
14 11 25.5% 0.0%
Cypress College 15 6 21.4% ‐36.4%
Saddleback College 10 0 10.2% +66.7%
Orange Coast College 4 1 5.1% ‐58.3%
Appendix 1 27

The course data above reflect course TOP codes aligned with the program TOP codes. Students may enroll in
required associate or certificate courses within the program that fall outside of the program TOP codes. These
external TOP codes are not included in the above figures.
The enrollment in the Human Services program has decreased over the last three years from 391 in 2014‐2015 to
324 in 2016‐2017. The FTES also fluctuated over the last three years from 23 in 2014‐15, increasing slightly and
going back to 23 in 2016‐2017. The instructional load efficiency (WSCH/FTEF) has decreased from 544.6 in 2015‐
2016 to 466.3 in 2016‐2017. A value of 525 or higher is the standard average target and it is a measure of
average class enrollment needed for cost efficiency purposes.
Overall, with the drop of enrollment in the program as well as the number of FTES, the degrees and certificates
awarded have fluctuated over the past five years. The past three years have resulted in total certificates and
degrees awarded increasing from 25 in 2014‐2015 to 34 in 2016‐2017.
4. PROGRAM IS OF DEMONSTRATED EFFECTIVENESS AS MEASURED BY THE ENROLLMENT AND COMPLETION SUCCESS OF ITS STUDENTS:
Data based on TOP code (2104.00) reported to the District by each of the respective college. Enrollment: Data Source: Argos – Program Review Enrollment Cube (Census Enrollment) FTES: Data Source: Argos – Program Review Enrollment Cube (FTES Total) FTES: Resident: Data Source: Argos – Program Review Enrollment Cube (FTES Res 320) FTES: Non‐Resident: Data Source: Argos – Program Review Enrollment Cube (FTES NRes 320) WSCH/FTEF: Data Source: Argos – Program Review Enrollment Cube (WSCH_FTEF 525 Est) Retention within Subject: Data Source: DataMart ‐ Retention Rate (Enrollment Count in Fall and Spring of Academic Year compared with Retained Count) Annualized Course Success Rate: Data Source: Argos – Program Review Access Success Cube (Success) Degrees and Certificates: Data Source: DataMart ‐ Program Awards Summary
Academic Year 2012‐2013 2013‐2014 2014‐2015 2015‐2016 2016‐2017
Enrollment 410 375 391 398 324
FTES 24 24 23 25 23
FTES: Resident 24 23 23 25 23
FTES: Non‐Resident 0 0 0 0 0
WSCH/FTEF 0.0 0.0 0.0 544.6 466.3
Fall to Spring Course Retention Within Subject
Fall‐to‐Spring 130/113 126/108 111/94 127/117 112/100
Fall‐to‐Spring Retention
86.9% 85.7% 84.7% 92.1% 89.3%
Annualized Course Success Rate
51.0% 58.5% 59.6% 61.9% 67.8%
Degrees and Certificates
Certificates 0 11 9 14 19
Associate Degrees 12 21 16 11 15
Total 12 32 25 25 34
Appendix 1 28

PROGRAM TITLE: Information Technology COLLEGE: Coastline Community College
DATE: 2018 Biennial Program Review TOPS CODE:
0799.00: Other Information Technology
CERTIFICATES AND DEGREES TOTAL: 3
CERTIFICATES DEGREES
Certificate of Achievement: Informatics Associate of Arts: Informatics
Associate of Science: Informatics
1. PROGRAM MEETS A DOCUMENTED LABOR MARKET DEMAND: GROWTH IN MARKET Data based on TOP code crosswalk to applicable SOC Codes Job openings based on Orange County Region as reported in EMSI: Occupation Overview Report
OCCUPATION EMSI Current Openings (2016)
EMSI Projected Openings (2025)
Change Between 2016‐2025 Job Openings
% Change
Computer Occupations, All Other (15‐1199)
3,294 3,543 +249 +7.6%
TOTAL 3,294 3,543 +249 +7.6%
Coastline Community College offers three certificates and degrees under the Information Technology Program.
According to the Economic Modeling Specialists International (EMSI), there were 3,294 job openings in 2016 associated
with the Information Technology Program. Overall, this program is expected to increase by 7.6% between 2016 and
2025, with Computer Occupations, All Other occupation dictating the increase of 17.8%, as the sole SOC code aligned for
the program.
The table below shows the projected openings and percentage changes within each occupation associated with the
program.
The Computer Occupations, All Other occupation dictates the Information Technology Program median earnings at
$32.88/hour.
2. PROGRAM MEETS A DOCUMENTED LABOR MARKET DEMAND: PERCENTILE EARNINGS WITHIN MARKET Data based on TOP code crosswalk to applicable SOC Codes Percentile earnings based on Orange County Region as reported in EMSI: Occupation Overview Report
OCCUPATION 25th Percentile Earnings Median Earnings 75th Percentile Earnings
Computer Occupations, All Other (15‐1199)
$25.62/hour $36.87/hour $53.00/hour
PERCENTILE EARNING AVERAGE $25.62/hour $36.87/hour $53.00/hour
Appendix 1 29

There were no certificate and associate’s degrees awarded within the Information Technology program during the 2016‐
17 academic year, or the year prior, in the Orange County Region.
3. PROGRAM DOES NOT REPRESENT UNNECESSARY DUPLICATION OF OTHER MANPOWER TRAINING PROGRAMS IN THE AREA:
Programs based on CIP Code (11.9999) Certificates and Associate’s degrees in Orange County Region as reported in EMSI: Program Overview
INSTITUTION Certificates Awarded
(2016‐2017)
Associate Degrees Awarded
(2016‐2017)
% Distribution of Total Certificate /Associate Degrees Awarded
EMSI Growth % Year over Year (YOY) (2015)
Coastline Community College
0 0 NA NA
Cypress College 0 0 NA NA
Fullerton College 0 0 NA NA
Irvine Valley College 0 0 NA NA
Santa Ana College 0 0 NA NA
Saddleback College 0 0 NA NA
Platt College‐Newport Beach
0 0 NA NA
Maric College‐Anaheim 0 0 NA NA
Appendix 1 30

The course data above reflect course TOP codes aligned with the program TOP codes. Students may enroll in
required associate or certificate courses within the program that fall outside of the program TOP codes. These
external TOP codes are not included in the above figures.
There have been no enrollments in the Information Technology program over the past 5 years, resulting in no
information regarding enrollments or completion above.
4. PROGRAM IS OF DEMONSTRATED EFFECTIVENESS AS MEASURED BY THE ENROLLMENT AND COMPLETION SUCCESS OF ITS STUDENTS:
Data based on TOP code (0799.00) reported to the District by each of the respective college. Enrollment: Data Source: Argos – Program Review Enrollment Cube (Census Enrollment) FTES: Data Source: Argos – Program Review Enrollment Cube (FTES Total) FTES: Resident: Data Source: Argos – Program Review Enrollment Cube (FTES Res 320) FTES: Non‐Resident: Data Source: Argos – Program Review Enrollment Cube (FTES NRes 320) WSCH/FTEF: Data Source: Argos – Program Review Enrollment Cube (WSCH_FTEF 525 Est) Retention within Subject: Data Source: DataMart ‐ Retention Rate (Enrollment Count in Fall and Spring of Academic Year compared with Retained Count) Annualized Course Success Rate: Data Source: Argos – Program Review Access Success Cube (Success) Degrees and Certificates: Data Source: DataMart ‐ Program Awards Summary
Academic Year 2012‐2013 2013‐2014 2014‐2015 2015‐2016 2016‐2017
Enrollment 0 0 0 0 0
FTES 0 0 0 0 0
FTES: Resident 0 0 0 0 0
FTES: Non‐Resident 0 0 0 0 0
WSCH/FTEF 0 0 0 0 0
Fall to Spring Course Retention Within Subject
Fall‐to‐Spring 0 0 0 0 0
Fall‐to‐Spring Retention
NA NA NA NA NA
Annualized Course Success Rate
NA NA NA NA NA
Degrees and Certificates
Certificates 0 0 0 0 0
Associate Degrees 0 0 0 0 0
Appendix 1 31

PROGRAM TITLE: Real Estate COLLEGE: Coastline Community College
DATE: 2018 Biennial Program Review TOPS CODE:
0511.00: Real Estate
CERTIFICATES AND DEGREES TOTAL: 4
CERTIFICATES DEGREES
Certificate of Achievement: Real Estate Broker
Certificate of Achievement: Real Estate Studies
Certificate of Specialization: Real Estate Lend & Mortgage Broker
Certificate of Specialization: Real Estate Property Sales
None
1. PROGRAM MEETS A DOCUMENTED LABOR MARKET DEMAND: GROWTH IN MARKET Data based on TOP code crosswalk to applicable SOC Codes Job openings based on Orange County Region as reported in EMSI: Occupation Overview Report
OCCUPATION EMSI Current Openings (2016)
EMSI Projected Openings (2025)
Change Between 2016‐2025 Job Openings
% Change
Property, Real Estate, and Community Association Managers (11‐9141)
5,494 5,887 +393 +7.2%
Appraisers and Assessors of Real Estate (13‐2021)
1,055 1,073 +18 +1.7%
Real Estate Brokers (41‐9021) 2,464 2,492 +28 +1.1%
Real Estate Sales Agents (41‐9022) 7,308 7,382 +74 +1.0%
TOTAL 16,322 16,833 +511 +3.1%
Coastline Community College offers four certificates under the Real Estate Program. According to the Economic
Modeling Specialists International (EMSI), there were 16,322 job openings in 2016 associated with the Real Estate
Program. Overall, this program is expected to increase by 3.1% between 2016 and 2025, with Property, Real Estate, and
Community Association Managers showing a strong increase of 7.2%, and Real Estate Sales Agents anticipated to have
an increase of 1.0%.
The table below shows the projected openings and percentage changes within each occupation associated with the
program.
Appendix 1 32

The Property, Real Estate, and Community Association Managers occupation leads the Real Estate Program related
occupation with a median earnings of $38.50/hour; while the Real Estate Sales Agents occupation have the lowest
median earnings of $22.46/hour.
Of the total 43 certificates and associate’s degrees awarded in 2016‐17, Coastline Community College awarded 9.3% of
the certificates and associate’s degrees in Real Estate in the Orange County Region. Compared to 2015‐16, the number
of awards by Coastline Community College decreased by 42.9%.
2. PROGRAM MEETS A DOCUMENTED LABOR MARKET DEMAND: PERCENTILE EARNINGS WITHIN MARKET Data based on TOP code crosswalk to applicable SOC Codes Percentile earnings based on Orange County Region as reported in EMSI: Occupation Overview Report
OCCUPATION 25th Percentile Earnings Median Earnings 75th Percentile Earnings
Property, Real Estate, and Community Association Managers (11‐9141)
$20.02/hour $25.56/hour $38.50/hour
Appraisers and Assessors of Real Estate (13‐2021)
$21.97/hour $25.52/hour $38.39/hour
Real Estate Brokers (41‐9021) $21.60/hour $25.33/hour $29.55/hour
Real Estate Sales Agents (41‐9022) $17.87/hour $19.24/hour $22.46/hour
PERCENTILE EARNING AVERAGE $18.49/hour $21.94/hour $30.68/hour
3. PROGRAM DOES NOT REPRESENT UNNECESSARY DUPLICATION OF OTHER MANPOWER TRAINING PROGRAMS IN THE AREA:
Programs based on CIP Code (52.1501) Certificates and Associate’s degrees in Orange County Region as reported in EMSI: Program Overview
INSTITUTION Certificates Awarded
(2016‐2017)
Associate Degrees Awarded
(2016‐2017)
% Distribution of Total Certificate /Associate Degrees Awarded
EMSI Growth % Year over Year (YOY) (2015)
Irvine Valley College 12 3 34.9% ‐6.4%
Saddleback College 10 5 34.9% ‐16.7%
Coastline Community College
4 0 9.3% ‐42.9%
Orange Coast College 2 2 9.3% +100%
Santiago Canyon College 1 2 7.0% +100%
Fullerton College 0 1 2.3% +100%
Allied American University 1 0 2.3% ‐85.7%
Golden West College 0 0 0.0% 0%
Appendix 1 33
The course data above reflect course TOP codes aligned with the program TOP codes. Students may
enroll in required associate or certificate courses within the program that fall outside of the program
TOP codes. These external TOP codes are not included in the above figures.
The enrollment in the Real Estate program has slightly decreased over the last three years from 321 in
2014‐2015 to 313 in 2016‐2017. The FTES also has slightly decreased the last three years from 30 in
2014‐15 to 29 in 2016‐2017. The instructional load efficiency (WSCH/FTEF) decreased from 496.8 in
2015‐2016 to 429.2 in 2016‐2017. A value of 525 or higher is the standard average target and it is a
measure of average class enrollment needed for cost efficiency purposes.
Overall, with the fluctuation of enrollment in the program as well as the number of FTES, the degrees
and certificates awarded have fluctuated over the past five years. The past three years have resulted in
total certificates awarded dropping from 6 in 2014‐2015 to 3 in 2015‐2016, and increasing 4 in 2016‐
2017.
4. PROGRAM IS OF DEMONSTRATED EFFECTIVENESS AS MEASURED BY THE ENROLLMENT AND COMPLETION SUCCESS OF ITS STUDENTS:
Data based on TOP code (0511.00) reported to the District by each of the respective college. Enrollment: Data Source: Argos – Program Review Enrollment Cube (Census Enrollment) FTES: Data Source: Argos – Program Review Enrollment Cube (FTES Total) FTES: Resident: Data Source: Argos – Program Review Enrollment Cube (FTES Res 320) FTES: Non‐Resident: Data Source: Argos – Program Review Enrollment Cube (FTES NRes 320) WSCH/FTEF: Data Source: Argos – Program Review Enrollment Cube (WSCH_FTEF 525 Est) Retention within Subject: Data Source: DataMart ‐ Retention Rate (Enrollment Count in Fall and Spring of Academic Year compared with Retained Count) Annualized Course Success Rate: Data Source: Argos – Program Review Access Success Cube (Success) Degrees and Certificates: Data Source: DataMart ‐ Program Awards Summary
Academic Year 2012‐2013 2013‐2014 2014‐2015 2015‐2016 2016‐2017
Enrollment 313 269 321 326 313
FTES 29 25 30 30 29
FTES: Resident 29 25 29 30 29
FTES: Non‐Resident 0 0 0 0 0
WSCH/FTEF 0.0 0.0 0.0 496.8 429.2
Fall to Spring Course Retention Within Subject
Fall‐to‐Spring 274/218 240/181 278/207 285/210 313/252
Fall‐to‐Spring Retention
79.6% 75.4% 74.5% 73.7% 80.5%
Annualized Course Success Rate
71.2% 63.4% 62.9% 59.2% 58.7%
Degrees and Certificates
Certificates 0 1 6 3 4
Associate Degrees NA NA NA NA NA
Total 0 1 6 3 4
Appendix 1 34

Golden West College
Appendix 1 35

PROGRAM TITLE: Criminal Justice COLLEGE: Golden West College
DATE: 2018 Biennial Program Review TOPS CODE:
2105.00: Administration of Justice
2105.10: Corrections
2105.50: Police Academy
CERTIFICATES AND DEGREES TOTAL: 4
CERTIFICATES DEGREES
Certificate of Achievement: Law Enforcement Associate of Arts: CJ: Administration of Justice
Associate of Arts: CJ: Corrections
Associate of Arts: CJ: Police Academy
Golden West College offers eleven certificates and degrees under the Criminal Justice Program. According to the
Economic Modeling Specialists International (EMSI), there were 7,626 job openings in 2016 associated with the Criminal
Justice Program. Overall, this program is expected to increase by 8.7% between 2016 and 2025, with First‐Line
Supervisors of Correctional Officers showing a strong increase of 73.3%, Private Detectives and Investigators are
anticipated to have an increase of 5.6%.
The table below shows the projected openings and percentage changes within each occupation associated with the
program
1. PROGRAM MEETS A DOCUMENTED LABOR MARKET DEMAND: GROWTH IN MARKET Data based on TOP code crosswalk to applicable SOC Codes (33‐1011, 33‐1012, 33‐3011, 33‐3012, 33‐3021, 33‐3051, and 33‐9021) Job openings based on Orange County Region as reported in EMSI: Occupation Overview Report
OCCUPATION EMSI Current Openings (2016)
EMSI Projected Openings (2025)
Change Between 2016‐2025 Job Openings
% Change
First‐Line Supervisors of Correctional Officers (33‐1011)
15 26 +11 +73.3%
First‐Line Supervisors of Police and Detectives (33‐1012)
176 204 +28 +15.9%
Bailiffs (33‐3011) 110 118 +8 +7.3%
Correctional Officers and Jailers (33‐3012)
904 1,065 +161 +17.8%
Detectives and Criminal Investigators (33‐3021)
726 767 +41 +5.6%
Police and Sheriff's Patrol Officers (33‐3051)
4,223 4,599 +376 +8.9%
Private Detectives and Investigators (33‐9021)
726 767 +41 +5.6%
TOTAL 7,626 8,286 +660 +8.7%
The First‐Line Supervisors of Police and Detectives occupation leads the Criminal Justice Program related occupation
with a median earnings of $69.47/hour; while the Bailiffs occupation have the lowest median earnings of $17.23/hour.
.
Appendix 1 36

Of the total 357 certificate and associate’s degrees awarded in 2016‐17, Golden College awarded 27.5% of the certificate
associate’s degrees in Criminal Justice in the Orange County Region. Compared to 2015‐16, the number of awards by
Golden West College increased by 11.4%.
2. PROGRAM MEETS A DOCUMENTED LABOR MARKET DEMAND: PERCENTILE EARNINGS WITHIN MARKET Data based on TOP code crosswalk to applicable SOC Codes Percentile earnings based on Orange County Region as reported in EMSI: Occupation Overview Report
OCCUPATION 25th Percentile Earnings Median Earnings 75th Percentile Earnings
First‐Line Supervisors of Correctional Officers (33‐1011)
$43.09/hour $45.27/hour $46.12/hour
First‐Line Supervisors of Police and Detectives (33‐1012)
$58.44/hour $69.47/hour $79.87/hour
Bailiffs (33‐3011) $13.65/hour $17.23/hour $27.71/hour
Correctional Officers and Jailers (33‐3012)
$27.27/hour $31.31/hour $35.97/hour
Detectives and Criminal Investigators (33‐3021)
$40.65/hour $50.43/hour $58.98/hour
Police and Sheriff's Patrol Officers (33‐3051)
$41.89/hour $47.61/hour $54.96/hour
Private Detectives and Investigators (33‐9021)
$40.65/hour $50.43/hour $58.98/hour
PERCENTILE EARNING AVERAGE $31.71/hour $43.23/hour $52.66/hour
3. PROGRAM DOES NOT REPRESENT UNNECESSARY DUPLICATION OF OTHER MANPOWER TRAINING PROGRAMS IN THE AREA:
Programs based on CIP Code (43.0102 and 43.0107) Certificates and Associate’s degrees in Orange County Region as reported in EMSI: Program Overview
INSTITUTION Certificates Awarded
(2016‐2017)
Associate Degrees Awarded
(2016‐2017)
% Distribution of Total Certificate /Associate Degrees Awarded
EMSI Growth % Year over Year (YOY) (2015)
Santa Ana College 17 99 32.5% ‐47.3%
Golden West College 45 53 27.5% +11.4%
Fullerton College 0 68 19.0% ‐34.0%
Irvine Valley College 5 36 11.4% +10.8%
Coastline Community College
0 31 8.7% ‐3.1%
Cypress College 2 0 0.6% ‐33.3%
Saddleback College 1 0 0.3% ‐75.0%
Appendix 1 37

4. PROGRAM IS OF DEMONSTRATED EFFECTIVENESS AS MEASURED BY THE ENROLLMENT AND COMPLETION SUCCESS OF ITS STUDENTS:
Data based on TOP code (2105.00, 2105.10 and 2105.50) reported to the District by each of the respective college. Enrollment: Data Source: Argos – Program Review Enrollment Cube (Census Enrollment) FTES: Data Source: Argos – Program Review Enrollment Cube (FTES Total) FTES: Resident: Data Source: Argos – Program Review Enrollment Cube (FTES Res 320) FTES: Non‐Resident: Data Source: Argos – Program Review Enrollment Cube (FTES NRes 320) WSCH/FTEF: Data Source: Argos – Program Review Enrollment Cube (WSCH_FTEF 525 Est) Retention within Subject: Data Source: DataMart ‐ Retention Rate (Enrollment Count in Fall and Spring of Academic Year compared with Retained Count) Annualized Course Success Rate: Data Source: Argos – Program Review Access Success Cube (Success) Degrees and Certificates: Data Source: DataMart ‐ Program Awards Summary
Academic Year 2012‐2013 2013‐2014 2014‐2015 2015‐2016 2016‐2017
Enrollment 1,876 2,048 1,956 1,894 1,961
FTES 278 336 278 284 321
FTES: Resident 277 334 277 280 319
FTES: Non‐Resident 1 1 1 3 3
WSCH/FTEF Data Not Available Data Not Available Data Not Available 1,004.3 11,616.6
Fall to Spring Course Retention Within Subject
Fall‐to‐Spring 1,789/1,604 1,851/1,690 1,745/1,550 1,699/1,541 1,612/1,469
Fall‐to‐Spring Retention
89.7% 91.3% 88.8% 90.7% 91.1%
Annualized Course Success Rate
76.4% 76.7% 75.0% 76.9% 80.1%
Degrees and Certificates
Certificates 46 56 62 45 55
Associate Degrees 25 36 27 52 79
Total 71 92 89 97 134
The course data above reflect course TOP codes aligned with the program TOP codes. Students may enroll in
required associate or certificate courses within the program that fall outside of the program TOP codes. These
external TOP codes are not included in the above figures.
The enrollment in the Criminal Justice program increased over the last three years from 1956 in 2014‐2015 to
1,961 in 2016‐2017. The FTES also increased over the last three years from 278 in 2014‐15 to 321 in 2016‐2017.
The instructional load efficiency (WSCH/FTEF) increased from 1,004.3 in 2015‐2016 to 11,616.6 in 2016‐2017. A
value of 525 or higher is the standard average target and it is a measure of average class enrollment needed for
cost efficiency purposes.
Overall, with the increase in enrollment in the program, the number of FTES, degrees and certificates have also
increased.
Appendix 1 38

PROGRAM TITLE: Interpreting COLLEGE: Golden West College
DATE: 2018 Biennial Program Review TOPS CODE:
0850.10: Sign Language Interpreting
CERTIFICATES AND DEGREES TOTAL: 2
CERTIFICATES DEGREES
Certificate of Achievement: American Sign Language Interp
Associate of Arts: American Sign Language Interp
Golden West College offers two certificates and degrees under the Interpreting Program. According to the Economic
Modeling Specialists International (EMSI), there were 1,015 job openings in 2016 associated with the Interpreting
Program. Overall, this program is expected to increase by 22.6% between 2016 and 2025, with Interpreters and
Translators showing a strong increase of 22.6%.
The table below shows the projected openings and percentage changes within each occupation associated with the
program.
The Interpreters and Translators is the primary occupation within the Interpreting Program with a median earnings of
$22.52/hour.
Of the total 51 certificates and associate’s degrees awarded in 2016‐17, Golden West College awarded 58.8% of the
certificates and associate’s degrees in Interpreting in the Orange County Region. Compared to 2015‐16, the number of
awards by Coastline Community College increased by 3.4%.
1. PROGRAM MEETS A DOCUMENTED LABOR MARKET DEMAND: GROWTH IN MARKET Data based on TOP code crosswalk to applicable SOC Codes (27‐3091) Job openings based on Orange County Region as reported in EMSI: Occupation Overview Report
OCCUPATION EMSI Current Openings (2016)
EMSI Projected Openings (2025)
Change Between 2016‐2025 Job Openings
% Change
Interpreters and Translators (27‐3091)
1,015 1,244 +229 +22.6%
TOTAL 1,015 1,244 +229 +22.6%
2. PROGRAM MEETS A DOCUMENTED LABOR MARKET DEMAND: PERCENTILE EARNINGS WITHIN MARKET Data based on TOP code crosswalk to applicable SOC Codes Percentile earnings based on Orange County Region as reported in EMSI: Occupation Overview Report
OCCUPATION 25th Percentile Earnings Median Earnings 75th Percentile Earnings
Interpreters and Translators (27‐3091)
$19.08/hour $22.52/hour $25.88/hour
PERCENTILE EARNING AVERAGE $19.08/hour $22.52/hour $25.88/hour
3. PROGRAM DOES NOT REPRESENT UNNECESSARY DUPLICATION OF OTHER MANPOWER TRAINING PROGRAMS IN THE AREA:
Programs based on CIP Code (16.1603) Certificates and Associate’s degrees in Orange County Region as reported in EMSI: Program Overview
INSTITUTION Certificates Awarded
(2016‐2017)
Associate Degrees Awarded
(2016‐2017)
% Distribution of Total Certificate /Associate Degrees Awarded
EMSI Growth % Year over Year (YOY) (2015)
Golden West College 20 10 58.8% +3.4%
Saddleback College 17 3 39.2% +81.8%
Santiago Canyon College 1 0 2.0% ‐100.0%
Appendix 1 39

The course data above reflect course TOP codes aligned with the program TOP codes. Students may enroll in required
associate or certificate courses within the program that fall outside of the program TOP codes. These external TOP codes
are not included in the above figures.
The enrollment in the Interpreting program decreased over the last three years from 791 in 2014‐2015 to 698 in 2016‐
2017. The FTES also decreased over the last three years from 102 in 2014‐15 to 92 in 2016‐2017. The instructional load
efficiency (WSCH/FTEF) decreased from 441.4 in 2015‐2016 to 439.5 in 2016‐2017. A value of 525 or higher is the
standard average target and it is a measure of average class enrollment needed for cost efficiency purposes.
Overall, with the decrease in enrollment in the program, the number of FTES, degrees and certificates have also
declined.
4. PROGRAM IS OF DEMONSTRATED EFFECTIVENESS AS MEASURED BY THE ENROLLMENT AND COMPLETION SUCCESS OF ITS STUDENTS:
Data based on TOP code (1030.00) reported to the District by each of the respective college. Enrollment: Data Source: Argos – Program Review Enrollment Cube (Census Enrollment) FTES: Data Source: Argos – Program Review Enrollment Cube (FTES Total) FTES: Resident: Data Source: Argos – Program Review Enrollment Cube (FTES Res 320) FTES: Non‐Resident: Data Source: Argos – Program Review Enrollment Cube (FTES NRes 320) WSCH/FTEF: Data Source: Argos – Program Review Enrollment Cube (WSCH_FTEF 525 Est) Retention within Subject: Data Source: DataMart ‐ Retention Rate (Enrollment Count in Fall and Spring of Academic Year compared with Retained Count) Annualized Course Success Rate: Data Source: Argos – Program Review Access Success Cube (Success) Degrees and Certificates: Data Source: DataMart ‐ Program Awards Summary
Academic Year 2012‐2013 2013‐2014 2014‐2015 2015‐2016 2016‐2017
Enrollment 728 786 791 650 698
FTES 102 109 102 84 92
FTES: Resident 101 109 101 83 89
FTES: Non‐Resident 1 1 1 2 2
WSCH/FTEF Data Not Available Data Not Available Data Not Available 441.4 439.5
Fall to Spring Course Retention Within Subject
Fall‐to‐Spring 212/171 174/152 225/205 221/197 166/151
Fall‐to‐Spring Retention
80.7% 87.4% 91.1% 89.1% 90.1%
Annualized Course Success Rate
71.8% 73.1% 75.9% 75.1% 71.4%
Degrees and Certificates
Certificates 18 13 19 20 14
Associate Degrees 2 4 10 10 11
Total 20 17 29 30 25
Appendix 1 40

PROGRAM TITLE: Nursing COLLEGE: Golden West College
DATE: 2018 Biennial Program Review TOPS CODE:
1230.10: Registered Nursing
CERTIFICATES AND DEGREES TOTAL: 2
CERTIFICATES DEGREES
NONE Associate of Science: Nursing‐Registered Nurse
Associate of Science: Nursing‐Registered Nurse LVN
Golden West College offers two degrees under the Nursing Program. According to the Economic Modeling Specialists
International (EMSI), there were 22,062 job openings in 2016 associated with the Nursing Program. Overall, this
program is expected to increase by 20.5% between 2016 and 2025 based on the sole occupation of Registered Nurses.
The table below shows the projected openings and percentage changes within each occupation associated with the
program.
The Registered Nurse occupation within the Nursing Program shows a median earnings of $42.81/hour.
1. PROGRAM MEETS A DOCUMENTED LABOR MARKET DEMAND: GROWTH IN MARKET Data based on TOP code crosswalk to applicable SOC Codes (29‐1141) Job openings based on Orange County Region as reported in EMSI: Occupation Overview Report
OCCUPATION EMSI Current Openings (2016)
EMSI Projected Openings (2025)
Change Between 2016‐2025 Job Openings
% Change
Registered Nurses (29‐1141)
22,062 26,587 +4,525 +20.5%
TOTAL 22,062 26,587 +4,525 +20.5%
2. PROGRAM MEETS A DOCUMENTED LABOR MARKET DEMAND: PERCENTILE EARNINGS WITHIN MARKET Data based on TOP code crosswalk to applicable SOC Codes Percentile earnings based on Orange County Region as reported in EMSI: Occupation Overview Report
OCCUPATION 25th Percentile Earnings Median Earnings 75th Percentile Earnings
Registered Nurses (29‐1141)
$33.23/hour $42.81/hour $51.72/hour
PERCENTILE EARNING AVERAGE $33.23/hour $42.81/hour $51.72/hour
Appendix 1 41

Of the total 584 certificates and associate’s degrees awarded in 2016‐17, Golden West College awarded
14.7% of the certificates and associate’s degrees in Nursing in the Orange County Region. Compared to
2015‐16, the number of awards by Golden West College decreased by 3.4%.
3. PROGRAM DOES NOT REPRESENT UNNECESSARY DUPLICATION OF OTHER MANPOWER TRAINING PROGRAMS IN THE AREA:
Programs based on CIP Code (51.3801) Certificates and Associate’s degrees in Orange County Region as reported in EMSI: Program Overview
INSTITUTION Certificates Awarded
(2016‐2017)
Associate Degrees Awarded
(2016‐2017)
% Distribution of Total Certificate /Associate Degrees Awarded
EMSI Growth % Year over Year (YOY) (2015)
Saddleback College 104 103 35.4% +5.1%
Career Networks Institute 0 99 17.0% +147.5%
Santa Ana College 0 91 15.6% +2.2%
Golden West College 0 86 14.7% ‐3.4%
Cypress College 0 85 14.6% +18.1%
Stanbridge College 0 16 2.7% +1600%
Appendix 1 42

4. PROGRAM IS OF DEMONSTRATED EFFECTIVENESS AS MEASURED BY THE ENROLLMENT AND COMPLETION SUCCESS OF ITS STUDENTS:
Data based on TOP code (1230.10) reported to the District by each of the respective college. Enrollment: Data Source: Argos – Program Review Enrollment Cube (Census Enrollment) FTES: Data Source: Argos – Program Review Enrollment Cube (FTES Total) FTES: Resident: Data Source: Argos – Program Review Enrollment Cube (FTES Res 320) FTES: Non‐Resident: Data Source: Argos – Program Review Enrollment Cube (FTES NRes 320) WSCH/FTEF: Data Source: Argos – Program Review Enrollment Cube (WSCH_FTEF 525 Est) Retention within Subject: Data Source: DataMart ‐ Retention Rate (Enrollment Count in Fall and Spring of Academic Year compared with Retained Count) Annualized Course Success Rate: Data Source: Argos – Program Review Access Success Cube (Success) Degrees and Certificates: Data Source: DataMart ‐ Program Awards Summary
Academic Year 2012‐2013 2013‐2014 2014‐2015 2015‐2016 2016‐2017
Enrollment 581 580 598 381 560
FTES 284 269 280 225 224
FTES: Resident 282 268 278 224 222
FTES: Non‐Resident 2 1 2 1 2
WSCH/FTEF Data Not Available Data Not Available Data Not Available 176.9 185.1
Fall to Spring Course Retention Within Subject
Fall‐to‐Spring 581/549 539/515 557/528 382/364 560/535
Fall‐to‐Spring Retention
94.49% 95.55% 94.79% 95.29% 95.54%
Annualized Course Success Rate
92.6% 92.4% 89.1% 94.2% 91.1%
Degrees and Certificates
Certificates Not Applicable Not Applicable Not Applicable Not Applicable Not Applicable
Associate Degrees 102 96 89 87 78
Total 102 96 89 87 78
The course data above reflect course TOP codes aligned with the program TOP codes. Students may enroll in
required associate or certificate courses within the program that fall outside of the program TOP codes. These
external TOP codes are not included in the above figures.
The enrollment in the Nursing program decreased over the last three years from 598 in 2014‐2015 to 560 in
2016‐2017. The FTES also decreased over the last three years from 280 in 2014‐15 to 224 in 2016‐2017. The
instructional load efficiency (WSCH/FTEF) increased from 176.9 in 2015‐2016 to 185.1 in 2016‐2017. A value of
525 or higher is the standard average target and it is a measure of average class enrollment needed for cost
efficiency purposes.
Overall, with the decrease in enrollment in the program, the number of FTES, degrees and certificates have also
declined.
Appendix 1 43

Orange Coast College
Appendix 1 44

PROGRAM TITLE: Accounting COLLEGE: Orange Coast College
DATE: 2018 Biennial Program Review TOPS CODE:
0502.00: Accounting
CERTIFICATES AND DEGREES TOTAL: 9
CERTIFICATES DEGREES
Certificate of Achievement: Accounting
Certificate of Specialization: Entry Level Accounting
Certificate of Specialization: Business Taxation Competency
Certificate of Specialization: Cost Accounting Competency
Certificate of Specialization: Financial Accounting Competency
Certificate of Specialization: Individual Taxation Competency
Certificate of Specialization: NonProfit Accounting Competency
Certificate of Specialization: Payroll Accounting Competency
Associate of Science: Accounting
Orange Coast College offers nine certificates and degrees under the Accounting Program. According to the Economic
Modeling Specialists International (EMSI), there were 44,615 job openings in 2016 associated with the Accounting Program. Overall, this program is expected to increase by 6.1% between 2016 and 2025, with Accountants and Auditors
showing a strong increase of 14.0%, Bookkeeping, Accounting, and Auditing Clerks are anticipated to have a decrease of
0.7%.
The table below shows the projected openings and percentage changes within each occupation associated with the
program
1. PROGRAM MEETS A DOCUMENTED LABOR MARKET DEMAND: GROWTH IN MARKET Data based on TOP code crosswalk to applicable SOC Codes (13‐2011, 13‐2082, 43‐3031, 43‐3051, and 43‐4011) Job openings based on Orange County Region as reported in EMSI: Occupation Overview Report
OCCUPATION EMSI Current Openings (2016)
EMSI Projected Openings (2025)
Change Between 2016‐2025 Job Openings
% Change
Accountants and Auditors (13‐2011)
18,333 20,895 +2,562 +14.0%
Tax Preparers (13‐2082) 2,035 2,200 +165 +8.1%
Bookkeeping, Accounting, and Auditing Clerks (43‐3031)
20,871 20,728 ‐143 ‐0.7%
Payroll and Timekeeping (43‐3051) 2,766 2,813 +47 +1.7%
Brokerage Clerks (43‐4011) 609 681 +72 +11.8%
TOTAL 44,615 47,317 +2,702 +6.1%
The Accountants and Auditors occupation leads the Accounting Program related occupation with a median earnings of
$41.87/hour; while the Bookkeeping, Accounting, and Auditing Clerks occupation have the lowest median earnings of
$27.23/hour.
Appendix 1 45

Of the total 501 certificate and associate’s degrees awarded in 2016‐17, Orange Coast College awarded 5.99% of the
certificate associate’s degrees in Accounting in the Orange County Region. Compared to 2015‐16, the number of awards
by Orange Coast College increased by 50.0%.
2. PROGRAM MEETS A DOCUMENTED LABOR MARKET DEMAND: PERCENTILE EARNINGS WITHIN MARKET Data based on TOP code crosswalk to applicable SOC Codes Percentile earnings based on Orange County Region as reported in EMSI: Occupation Overview Report
OCCUPATION 25th Percentile Earnings Median Earnings 75th Percentile Earnings
Accountants and Auditors (13‐2011)
$26.09/hour $32.12/hour $41.87/hour
Tax Preparers (13‐2082) $17.84/hour $23.45/hour $33.09/hour
Bookkeeping, Accounting, and Auditing Clerks (43‐3031)
$17.16/hour $21.54/hour $27.23/hour
Payroll and Timekeeping (43‐3051) $18.60/hour $23.22/hour $27.84/hour
Brokerage Clerks (43‐4011) $20.87/hour $23.67/hour $27.93/hour
PERCENTILE EARNING AVERAGE $19.90/hour $25.84/hour $32.75/hour
3. PROGRAM DOES NOT REPRESENT UNNECESSARY DUPLICATION OF OTHER MANPOWER TRAINING PROGRAMS IN THE AREA:
Programs based on CIP Code (52.0302) Certificates and Associate’s degrees in Orange County Region as reported in EMSI: Program Overview
INSTITUTION Certificates Awarded
(2016‐2017)
Associate Degrees Awarded
(2016‐2017)
% Distribution of Total Certificate /Associate Degrees Awarded
EMSI Growth % Year over Year (YOY) (2015)
Santa Ana College 148 16 32.73% ‐70.87%
Irvine Valley College 114 16 25.95% ‐13.91%
Coastline Community College
49 38 17.37% +26.09%
Saddleback College 23 5 5.59% +3.70%
Orange Coast College 17 13 5.99% +50.00%
Fullerton College 2 14 3.19% +45.45%
Golden West College 13 13 5.19% +4.00%
Cypress College 4 9 2.59% +85.71%
InterCoast Colleges‐Anaheim
4 0 0.80% ‐66.67%
Santiago Canyon College 1 2 0.60% 0.00%
Appendix 1 46
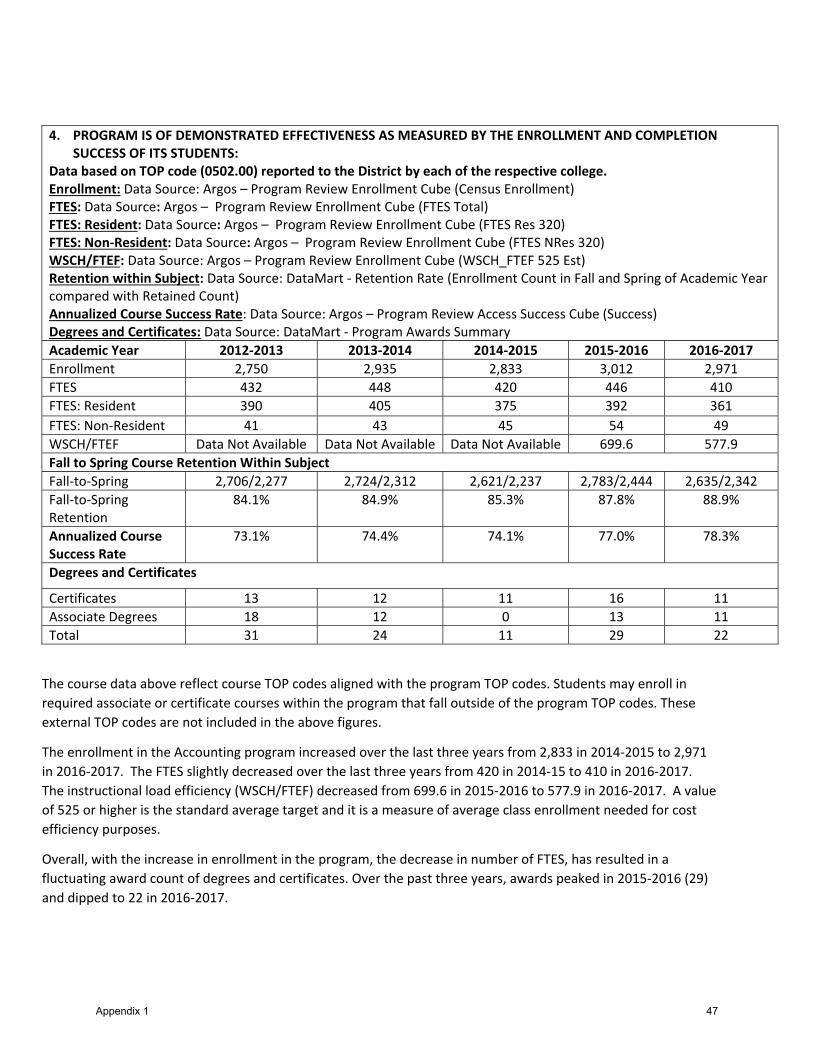
4. PROGRAM IS OF DEMONSTRATED EFFECTIVENESS AS MEASURED BY THE ENROLLMENT AND COMPLETION SUCCESS OF ITS STUDENTS:
Data based on TOP code (0502.00) reported to the District by each of the respective college. Enrollment: Data Source: Argos – Program Review Enrollment Cube (Census Enrollment) FTES: Data Source: Argos – Program Review Enrollment Cube (FTES Total) FTES: Resident: Data Source: Argos – Program Review Enrollment Cube (FTES Res 320) FTES: Non‐Resident: Data Source: Argos – Program Review Enrollment Cube (FTES NRes 320) WSCH/FTEF: Data Source: Argos – Program Review Enrollment Cube (WSCH_FTEF 525 Est) Retention within Subject: Data Source: DataMart ‐ Retention Rate (Enrollment Count in Fall and Spring of Academic Year compared with Retained Count) Annualized Course Success Rate: Data Source: Argos – Program Review Access Success Cube (Success) Degrees and Certificates: Data Source: DataMart ‐ Program Awards Summary
Academic Year 2012‐2013 2013‐2014 2014‐2015 2015‐2016 2016‐2017
Enrollment 2,750 2,935 2,833 3,012 2,971
FTES 432 448 420 446 410
FTES: Resident 390 405 375 392 361
FTES: Non‐Resident 41 43 45 54 49
WSCH/FTEF Data Not Available Data Not Available Data Not Available 699.6 577.9
Fall to Spring Course Retention Within Subject
Fall‐to‐Spring 2,706/2,277 2,724/2,312 2,621/2,237 2,783/2,444 2,635/2,342
Fall‐to‐Spring Retention
84.1% 84.9% 85.3% 87.8% 88.9%
Annualized Course Success Rate
73.1% 74.4% 74.1% 77.0% 78.3%
Degrees and Certificates
Certificates 13 12 11 16 11
Associate Degrees 18 12 0 13 11
Total 31 24 11 29 22
The course data above reflect course TOP codes aligned with the program TOP codes. Students may enroll in
required associate or certificate courses within the program that fall outside of the program TOP codes. These
external TOP codes are not included in the above figures.
The enrollment in the Accounting program increased over the last three years from 2,833 in 2014‐2015 to 2,971
in 2016‐2017. The FTES slightly decreased over the last three years from 420 in 2014‐15 to 410 in 2016‐2017.
The instructional load efficiency (WSCH/FTEF) decreased from 699.6 in 2015‐2016 to 577.9 in 2016‐2017. A value
of 525 or higher is the standard average target and it is a measure of average class enrollment needed for cost
efficiency purposes.
Overall, with the increase in enrollment in the program, the decrease in number of FTES, has resulted in a
fluctuating award count of degrees and certificates. Over the past three years, awards peaked in 2015‐2016 (29)
and dipped to 22 in 2016‐2017.
Appendix 1 47

PROGRAM TITLE: Airline COLLEGE: Orange Coast College
DATE: 2018 Biennial Program Review TOPS CODE:
3020.40: Flight Attendants
CERTIFICATES AND DEGREES TOTAL: 3
CERTIFICATES DEGREES
Certificate of Achievement: HTT: Airline & Travel Careers
Certificate of Achievement: Corporate/Contract Flight Atten
Associate of Science: HTT: Contract Flight Attendant
Orange Coast College offers three certificates and degrees under the Airline Program. According to the Economic
Modeling Specialists International (EMSI), there were 19 job openings in 2016 associated with the Airline Program.
Overall, this program is expected to increase by 147.4% between 2016 and 2025, with the sole occupation of Flight
Attendant showing an increase that mirrors this growth.
The table below shows the projected openings and percentage changes within each occupation associated with the
program
1. PROGRAM MEETS A DOCUMENTED LABOR MARKET DEMAND: GROWTH IN MARKET Data based on TOP code crosswalk to applicable SOC Codes (53‐2031) Job openings based on Orange County Region as reported in EMSI: Occupation Overview Report
OCCUPATION EMSI Current Openings (2016)
EMSI Projected Openings (2025)
Change Between 2016‐2025 Job Openings
% Change
Flight Attendants (53‐2031)
19 47 +28 +147.4%
TOTAL 19 47 +28 +147.4%
The Flight Attendants occupation is the sole occupation within the Airline Program related occupation with a median
earnings of $22.29/hour.
Of the total 43 certificate and associate’s degrees awarded in 2016‐17, Orange Coast College awarded 27.91% of the
certificate associate’s degrees in the Airline program in the Orange County Region. Compared to 2015‐16, the number
of awards by Orange Coast College increased by 50.0%.
2. PROGRAM MEETS A DOCUMENTED LABOR MARKET DEMAND: PERCENTILE EARNINGS WITHIN MARKET Data based on TOP code crosswalk to applicable SOC Codes Percentile earnings based on Orange County Region as reported in EMSI: Occupation Overview Report
OCCUPATION 25th Percentile Earnings Median Earnings 75th Percentile Earnings
Flight Attendants (53‐2031)
$19.07/hour $22.29/hour $27.52/hour
PERCENTILE EARNING AVERAGE $19.07/hour $22.29/hour $27.52/hour
Appendix 1 48

3. PROGRAM DOES NOT REPRESENT UNNECESSARY DUPLICATION OF OTHER MANPOWER TRAINING PROGRAMS IN THE AREA:
Programs based on CIP Code (49.0106) Certificates and Associate’s degrees in Orange County Region as reported in EMSI: Program Overview
INSTITUTION Certificates Awarded
(2016‐2017)
Associate Degrees Awarded
(2016‐2017)
% Distribution of Total Certificate /Associate Degrees Awarded
EMSI Growth % Year over Year (YOY) (2015)
Cypress College 27 4 72.09% ‐16.21%
Orange Coast College 0 12 27.91% +50.00%
Appendix 1 49

4. PROGRAM IS OF DEMONSTRATED EFFECTIVENESS AS MEASURED BY THE ENROLLMENT AND COMPLETION SUCCESS OF ITS STUDENTS:
Data based on TOP code (3020.40) reported to the District by each of the respective college. Enrollment: Data Source: Argos – Program Review Enrollment Cube (Census Enrollment) FTES: Data Source: Argos – Program Review Enrollment Cube (FTES Total) FTES: Resident: Data Source: Argos – Program Review Enrollment Cube (FTES Res 320) FTES: Non‐Resident: Data Source: Argos – Program Review Enrollment Cube (FTES NRes 320) WSCH/FTEF: Data Source: Argos – Program Review Enrollment Cube (WSCH_FTEF 525 Est) Retention within Subject: Data Source: DataMart ‐ Retention Rate (Enrollment Count in Fall and Spring of Academic Year compared with Retained Count) Annualized Course Success Rate: Data Source: Argos – Program Review Access Success Cube (Success) Degrees and Certificates: Data Source: DataMart ‐ Program Awards Summary
Academic Year 2012‐2013 2013‐2014 2014‐2015 2015‐2016 2016‐2017
Enrollment 613 587 499 512 445
FTES 46 48 46 46 41
FTES: Resident 38 32 29 29 29
FTES: Non‐Resident 8 16 17 17 12
WSCH/FTEF Data Not Available Data Not Available Data Not Available 421.4 364.2
Fall to Spring Course Retention Within Subject
Fall‐to‐Spring 472/418 452/377 390/322 398/324 358/289
Fall‐to‐Spring Retention
87.45% 83.41% 82.56% 81.41% 80.73%
Annualized Course Success Rate
72.0% 61.5% 42.7% 62.4% 64.6%
Degrees and Certificates
Certificates 0 5 6 0 0
Associate Degrees 8 5 3 12 3
Total 8 10 9 12 3
The course data above reflect course TOP codes aligned with the program TOP codes. Students may enroll in
required associate or certificate courses within the program that fall outside of the program TOP codes. These
external TOP codes are not included in the above figures.
The enrollment in the Airline program decreased over the last three years from 499 in 2014‐2015 to 445 in 2016‐
2017. The FTES slightly decreased over the last three years from 46 in 2014‐15 to 41 in 2016‐2017. The
instructional load efficiency (WSCH/FTEF) decreased from 421.4 in 2015‐2016 to 364.2 in 2016‐2017. A value of
525 or higher is the standard average target and it is a measure of average class enrollment needed for cost
efficiency purposes.
Overall, with the decrease in enrollment in the program, decrease in the number of FTES, has resulted in a
fluctuating award count of degrees and certificates. Over the past three years, awards peaked in 2015‐2016 (12)
and dipped to 3 in 2016‐2017.
Appendix 1 50
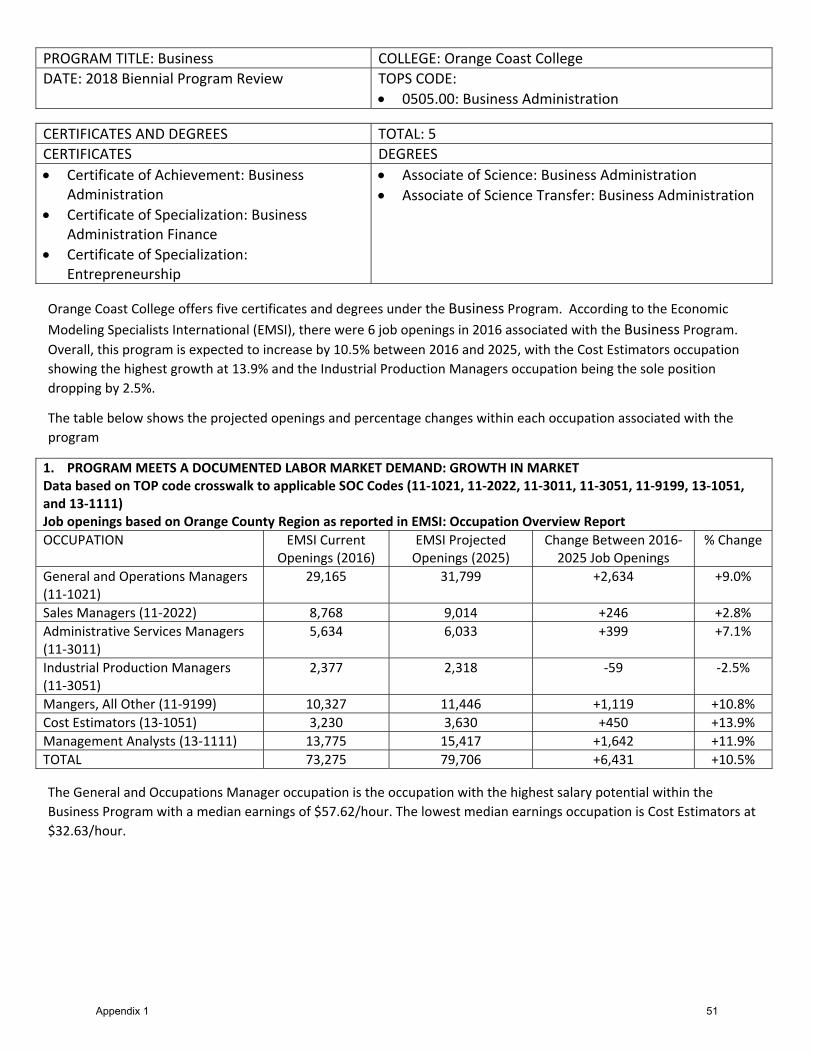
PROGRAM TITLE: Business COLLEGE: Orange Coast College
DATE: 2018 Biennial Program Review TOPS CODE:
0505.00: Business Administration
CERTIFICATES AND DEGREES TOTAL: 5
CERTIFICATES DEGREES
Certificate of Achievement: Business Administration
Certificate of Specialization: Business Administration Finance
Certificate of Specialization: Entrepreneurship
Associate of Science: Business Administration
Associate of Science Transfer: Business Administration
Orange Coast College offers five certificates and degrees under the Business Program. According to the Economic
Modeling Specialists International (EMSI), there were 6 job openings in 2016 associated with the Business Program.
Overall, this program is expected to increase by 10.5% between 2016 and 2025, with the Cost Estimators occupation
showing the highest growth at 13.9% and the Industrial Production Managers occupation being the sole position
dropping by 2.5%.
The table below shows the projected openings and percentage changes within each occupation associated with the
program
1. PROGRAM MEETS A DOCUMENTED LABOR MARKET DEMAND: GROWTH IN MARKET Data based on TOP code crosswalk to applicable SOC Codes (11‐1021, 11‐2022, 11‐3011, 11‐3051, 11‐9199, 13‐1051, and 13‐1111) Job openings based on Orange County Region as reported in EMSI: Occupation Overview Report
OCCUPATION EMSI Current Openings (2016)
EMSI Projected Openings (2025)
Change Between 2016‐2025 Job Openings
% Change
General and Operations Managers (11‐1021)
29,165 31,799 +2,634 +9.0%
Sales Managers (11‐2022) 8,768 9,014 +246 +2.8%
Administrative Services Managers (11‐3011)
5,634 6,033 +399 +7.1%
Industrial Production Managers (11‐3051)
2,377 2,318 ‐59 ‐2.5%
Mangers, All Other (11‐9199) 10,327 11,446 +1,119 +10.8%
Cost Estimators (13‐1051) 3,230 3,630 +450 +13.9%
Management Analysts (13‐1111) 13,775 15,417 +1,642 +11.9%
TOTAL 73,275 79,706 +6,431 +10.5%
The General and Occupations Manager occupation is the occupation with the highest salary potential within the
Business Program with a median earnings of $57.62/hour. The lowest median earnings occupation is Cost Estimators at
$32.63/hour.
Appendix 1 51

Of the total 3,028 certificate and associate’s degrees awarded in 2016‐17, Orange Coast College awarded 11.56% of the
certificate associate’s degrees in Business program in the Orange County Region. Compared to 2015‐16, the number of
awards by Orange Coast College increased by 31.58%.
2. PROGRAM MEETS A DOCUMENTED LABOR MARKET DEMAND: PERCENTILE EARNINGS WITHIN MARKET Data based on TOP code crosswalk to applicable SOC Codes Percentile earnings based on Orange County Region as reported in EMSI: Occupation Overview Report
OCCUPATION 25th Percentile Earnings Median Earnings 75th Percentile Earnings
General and Operations Managers (11‐1021)
$36.63/hour $57.62/hour $93.20/hour
Sales Managers (11‐2022) $35.54/hour $54.09/hour $78.15/hour
Administrative Services Managers (11‐3011)
$36.59/hour $50.85/hour $66.84/hour
Industrial Production Managers (11‐3051)
$32.38/hour $44.57/hour $59.58/hour
Mangers, All Other (11‐9199) $17.11/hour $22.59/hour $57.03/hour
Cost Estimators (13‐1051) $25.58/hour $32.63/hour $45.40/hour
Management Analysts (13‐1111) $29.86/hour $37.12/hour $49.01/hour
PERCENTILE EARNING AVERAGE $30.22/hour $46.07/hour $70.80/hour
3. PROGRAM DOES NOT REPRESENT UNNECESSARY DUPLICATION OF OTHER MANPOWER TRAINING PROGRAMS IN THE AREA:
Programs based on CIP Code (52.0201) Certificates and Associate’s degrees in Orange County Region as reported in EMSI: Program Overview
INSTITUTION Certificates Awarded
(2016‐2017)
Associate Degrees Awarded
(2016‐2017)
% Distribution of Total Certificate /Associate Degrees Awarded
EMSI Growth % Year over Year (YOY) (2015)
Coastline Community College
308 833 37.68%
+43.52%
Orange Coast College 22 328 11.56% +31.58% Fullerton College 2 258 8.59% ‐2.26% Santa Ana College 7 247 8.39% ‐0.39% Santiago Canyon College 31 200 7.63% ‐2.94% Saddleback College 0 215 7.10% ‐44.30% Irvine Valley College 6 186 6.34% ‐6.67%
Cypress College 1 159 5.28% +18.52% Golden West College 5 147 5.02% +25.66% Allied American University 7 66 2.41% +38.33%
Appendix 1 52

4. PROGRAM IS OF DEMONSTRATED EFFECTIVENESS AS MEASURED BY THE ENROLLMENT AND COMPLETION SUCCESS OF ITS STUDENTS:
Data based on TOP code (Category 0500.00, no courses map to the program code of 0505.00) reported to the District by each of the respective college. Enrollment: Data Source: Argos – Program Review Enrollment Cube (Census Enrollment) FTES: Data Source: Argos – Program Review Enrollment Cube (FTES Total) FTES: Resident: Data Source: Argos – Program Review Enrollment Cube (FTES Res 320) FTES: Non‐Resident: Data Source: Argos – Program Review Enrollment Cube (FTES NRes 320) WSCH/FTEF: Data Source: Argos – Program Review Enrollment Cube (WSCH_FTEF 525 Est) Retention within Subject: Data Source: DataMart ‐ Retention Rate (Enrollment Count in Fall and Spring of Academic Year compared with Retained Count) Annualized Course Success Rate: Data Source: Argos – Program Review Access Success Cube (Success) Degrees and Certificates: Data Source: DataMart ‐ Program Awards Summary
Academic Year 2012‐2013 2013‐2014 2014‐2015 2015‐2016 2016‐2017
Enrollment 2,834 3,052 3,449 3,581 3,618
FTES 283 304 343 358 364
FTES: Resident 265 279 314 317 319
FTES: Non‐Resident 18 26 28 41 46
WSCH/FTEF Data Not Available Data Not Available Data Not Available 650.3 620.5
Fall to Spring Course Retention Within Subject
Fall‐to‐Spring 7,533/6,381 7,603/6,534 7,824/6,789 8,026/7,010 7,708/6,887
Fall‐to‐Spring Retention
84.71% 85.94% 86.77% 87.34% 89.35%
Annualized Course Success Rate
70.6% 71.0% 72.6% 74.7% 74.9%
Degrees and Certificates
Certificates 23 27 18 19 11
Associate Degrees 23 120 243 327 371
Total 46 147 261 346 382
The course data above reflect course TOP codes aligned with the program TOP codes. Students may enroll in
required associate or certificate courses within the program that fall outside of the program TOP codes. These
external TOP codes are not included in the above figures.
The enrollment in the Business program increased over the last three years from 3,449 in 2014‐2015 to 3,618 in
2016‐2017. The FTES slightly increased over the last three years from 343 in 2014‐15 to 364 in 2016‐2017. The
instructional load efficiency (WSCH/FTEF) decreased from 650.3 in 2015‐2016 to 620.5 in 2016‐2017. A value of
525 or higher is the standard average target and it is a measure of average class enrollment needed for cost
efficiency purposes.
Overall, with the increase in enrollment in the program, increase in the number of FTES, has resulted in a
increased award count of degrees and certificates. Over the past three years, awards grew from 261 in 2015‐
2016 to 382 in 2016‐2017.
Appendix 1 53

PROGRAM TITLE: Computer Information Systems COLLEGE: Orange Coast College
DATE: 2018 Biennial Program Review TOPS CODE:
0702.00: Computer Information Systems
0706.00: Computer Science (transfer)
0707.00: Computer Software Development
0707.10: Computer Programming
CERTIFICATES AND DEGREES TOTAL: 18
CERTIFICATES DEGREES
Certificate of Achievement: Computer Information Systems
Certificate of Achievement: Computer Programming
Certificate of Achievement: CIS: Network Admin Windows
Certificate of Achievement: CIS Business Application Devl
Certificate of Specialization: Python Programming
Certificate of Specialization: CIS: Network Technician
Certificate of Specialization: CIS: Virtual & Cloud Computing
Certificate of Specialization: CIS: C++ Programming
Certificate of Specialization: CIS: Enterprise Routing
Certificate of Specialization: CIS: Linux
Certificate of Specialization: CIS: Network Svcs/Applications
Certificate of Specialization: CIS: Network Infrastructure
Certificate of Specialization: CIS: Network Admin/Operations
Certificate of Specialization: CIS: Network Professional
Certificate of Specialization: CIS: Network Security
Certificate of Specialization: CIS: Web Design
Associate of Science: Computer Information Systems
Associate of Science: CIS Business Application Devl
Associate of Science: Computer Programming
Associate of Science Transfer: Computer Science
Orange Coast College offers 20 certificates and degrees under the Computer Information Systems Program.
According to the Economic Modeling Specialists International (EMSI), there were 11 job openings in 2016 associated
with the Computer Information Systems Program. Overall, this program is expected to increase by 11.5% between
2016 and 2025, with the Cost Estimators occupation showing the highest growth at 22.2% associated with the Computer
and Information Research Scientists and the Computer Programmers occupation being the sole position dropping by
4.6%.
Appendix 1 54

The table below shows the projected openings and percentage changes within each occupation associated with the
program
1. PROGRAM MEETS A DOCUMENTED LABOR MARKET DEMAND: GROWTH IN MARKET Data based on TOP code crosswalk to applicable SOC Codes (11‐3021, 15‐1111, 15‐1121, 15‐1122, 15‐1131, 15‐1132, 15‐1133, 15‐1134, 15‐1151, 15‐1152, 15‐1199) Job openings based on Orange County Region as reported in EMSI: Occupation Overview Report
OCCUPATION EMSI Current Openings (2016)
EMSI Projected Openings (2025)
Change Between 2016‐2025 Job Openings
% Change
Computer and Information Systems Managers (11‐3021)
4,954 5,588 +634 +12.8%
Computer and Information Research Scientists (15‐1111)
144 176 +32 +22.2%
Computer Systems Analysts (15‐1121)
5,754 6,802 +1,048 +18.2%
Information Security Analysts (15‐1122)
814 956 +142 +17.4%
Computer Programmers (15‐1131) 4,139 3,947 ‐192 ‐4.6%
Software Developers, Applications (15‐1132)
10,808 12,532 +1,724 +16.0%
Software Developers, Systems Software (15‐1133)
8,143 8,651 +508 +6.2%
Web Developers (15‐1134) 3,202 3,718 +516 +16.1%
Computer User Support Specialists (15‐1151)
8,229 9,308 +1,079 +13.1%
Computer Network Support Specialists (15‐1152)
2,131 2,337 +206 +9.7%
Computer Occupations, All Other (15‐1199)
3,294 3,543 +249 +7.6%
TOTAL 51,614 57,559 +5,945 +11.5%
The Computer and Information Systems Managers occupation is the occupation with the highest salary potential within
the Computer Information Systems Program with a median earnings of $65.93/hour. The lowest median earnings
occupation is Computer User Support Specialists at $26.39/hour.
Appendix 1 55

Of the total 139 certificate and associate’s degrees awarded in 2016‐17, Orange Coast College awarded 13.67% of the
certificate associate’s degrees in Computer Information Systems in the Orange County Region. Compared to 2015‐16,
the number of awards by Orange Coast College increased by 46.15%.
2. PROGRAM MEETS A DOCUMENTED LABOR MARKET DEMAND: PERCENTILE EARNINGS WITHIN MARKET Data based on TOP code crosswalk to applicable SOC Codes Percentile earnings based on Orange County Region as reported in EMSI: Occupation Overview Report
OCCUPATION 25th Percentile Earnings Median Earnings 75th Percentile Earnings
Computer and Information Systems Managers (11‐3021)
$47.63/hour $65.93/hour $81.55/hour
Computer and Information Research Scientists (15‐1111)
$26.88/hour $36.88/hour $51.02/hour
Computer Systems Analysts (15‐1121)
$33.58/hour $44.04/hour $55.95/hour
Information Security Analysts (15‐1122)
$36.40/hour $46.98/hour $61.55/hour
Computer Programmers (15‐1131) $26.71/hour $36.05/hour $50.79/hour
Software Developers, Applications (15‐1132)
$42.13/hour $54.22/hour $66.28/hour
Software Developers, Systems Software (15‐1133)
$42.08/hour $54.86/hour $70.03/hour
Web Developers (15‐1134) $20.03/hour $27.45/hour $42.59/hour
Computer User Support Specialists (15‐1151)
$20.46/hour $26.39/hour $35.81/hour
Computer Network Support Specialists (15‐1152)
$24.19/hour $33.03/hour $41.78/hour
Computer Occupations, All Other (15‐1199)
$25.62/hour $36.87/hour $53.00/hour
PERCENTILE EARNING AVERAGE $30.31/hour $43.89/hour $60.16/hour
3. PROGRAM DOES NOT REPRESENT UNNECESSARY DUPLICATION OF OTHER MANPOWER TRAINING PROGRAMS IN THE AREA:
Programs based on CIP Code (11.0103, 11.0201, 11.0701) Certificates and Associate’s degrees in Orange County Region as reported in EMSI: Program Overview
INSTITUTION Certificates Awarded
(2016‐2017)
Associate Degrees Awarded
(2016‐2017)
% Distribution of Total Certificate /Associate Degrees Awarded
EMSI Growth % Year over Year (YOY) (2015)
Irvine Valley College 0 33 23.74% ‐83.33% Santa Ana College 1 18 13.67% ‐61.22% Stanbridge College 9 2 7.91% ‐62.07% Santiago Canyon College 1 11 8.63% ‐78.18% Orange Coast College 9 10 13.67% +46.15% Cypress College 7 9 11.51% ‐29.17% Fullerton College 1 9 7.19% ‐23.08%
Saddleback College 2 9 7.91% +57.14%
Allied American University 4 0 2.88% ‐33.33% Golden West College 2 2 2.88% 0.00%
Appendix 1 56
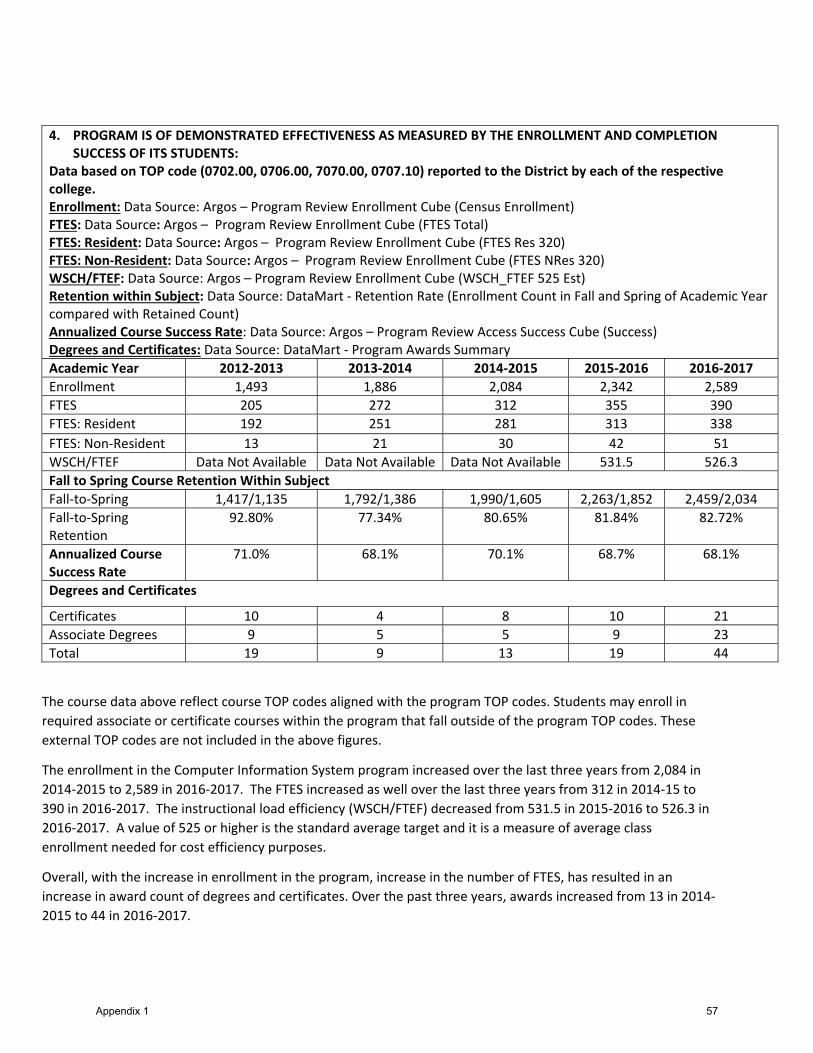
4. PROGRAM IS OF DEMONSTRATED EFFECTIVENESS AS MEASURED BY THE ENROLLMENT AND COMPLETION SUCCESS OF ITS STUDENTS:
Data based on TOP code (0702.00, 0706.00, 7070.00, 0707.10) reported to the District by each of the respective college. Enrollment: Data Source: Argos – Program Review Enrollment Cube (Census Enrollment) FTES: Data Source: Argos – Program Review Enrollment Cube (FTES Total) FTES: Resident: Data Source: Argos – Program Review Enrollment Cube (FTES Res 320) FTES: Non‐Resident: Data Source: Argos – Program Review Enrollment Cube (FTES NRes 320) WSCH/FTEF: Data Source: Argos – Program Review Enrollment Cube (WSCH_FTEF 525 Est) Retention within Subject: Data Source: DataMart ‐ Retention Rate (Enrollment Count in Fall and Spring of Academic Year compared with Retained Count) Annualized Course Success Rate: Data Source: Argos – Program Review Access Success Cube (Success) Degrees and Certificates: Data Source: DataMart ‐ Program Awards Summary
Academic Year 2012‐2013 2013‐2014 2014‐2015 2015‐2016 2016‐2017
Enrollment 1,493 1,886 2,084 2,342 2,589
FTES 205 272 312 355 390
FTES: Resident 192 251 281 313 338
FTES: Non‐Resident 13 21 30 42 51
WSCH/FTEF Data Not Available Data Not Available Data Not Available 531.5 526.3
Fall to Spring Course Retention Within Subject
Fall‐to‐Spring 1,417/1,135 1,792/1,386 1,990/1,605 2,263/1,852 2,459/2,034
Fall‐to‐Spring Retention
92.80% 77.34% 80.65% 81.84% 82.72%
Annualized Course Success Rate
71.0% 68.1% 70.1% 68.7% 68.1%
Degrees and Certificates
Certificates 10 4 8 10 21
Associate Degrees 9 5 5 9 23
Total 19 9 13 19 44
The course data above reflect course TOP codes aligned with the program TOP codes. Students may enroll in
required associate or certificate courses within the program that fall outside of the program TOP codes. These
external TOP codes are not included in the above figures.
The enrollment in the Computer Information System program increased over the last three years from 2,084 in
2014‐2015 to 2,589 in 2016‐2017. The FTES increased as well over the last three years from 312 in 2014‐15 to
390 in 2016‐2017. The instructional load efficiency (WSCH/FTEF) decreased from 531.5 in 2015‐2016 to 526.3 in
2016‐2017. A value of 525 or higher is the standard average target and it is a measure of average class
enrollment needed for cost efficiency purposes.
Overall, with the increase in enrollment in the program, increase in the number of FTES, has resulted in an
increase in award count of degrees and certificates. Over the past three years, awards increased from 13 in 2014‐
2015 to 44 in 2016‐2017.
Appendix 1 57

PROGRAM TITLE: Display and Visual Presentation COLLEGE: Orange Coast College
DATE: 2018 Biennial Program Review TOPS CODE:
0509.60: Display
CERTIFICATES AND DEGREES TOTAL: 2
CERTIFICATES DEGREES
Certificate of Achievement: Display & Visual Presentation
Associate of Science: Display & Visual Presentation
Orange Coast College offers five certificates and degrees under the Display and Visual Presentation Program.
According to the Economic Modeling Specialists International (EMSI), there were 6 job openings in 2016 associated with
the Display and Visual Presentation Program. Overall, this program is expected to increase by 10.5% between 2016
and 2025, with the Cost Estimators occupation showing the highest growth at 13.9% and the Industrial Production
Managers occupation being the sole position dropping by 2.5%.
The table below shows the projected openings and percentage changes within each occupation associated with the
program
1. PROGRAM MEETS A DOCUMENTED LABOR MARKET DEMAND: GROWTH IN MARKET Data based on TOP code crosswalk to applicable SOC Codes (27‐1026, 41‐1011, 41‐1012, and 41‐4012) Job openings based on Orange County Region as reported in EMSI: Occupation Overview Report
OCCUPATION EMSI Current Openings (2016)
EMSI Projected Openings (2025)
Change Between 2016‐2025 Job Openings
% Change
Merchandise Displayers and Window Trimmers (27‐1026)
2,271 2,149 ‐122 ‐5.4%
First‐Line Supervisors of Retail Sales Workers (41‐1011)
13,293 13,405 +112 +0.8%
First‐Line Supervisors of Non‐Retail Sales Workers (41‐1012)
5,368 5,288 ‐80 ‐1.5%
Sales Representatives, Wholesale and Manufacturing, Except Technical and Scientific Products (41‐4012)
17,403 17,754 +351 +2.0%
TOTAL 38,336 38,596 +260 +0.7%
The General and Occupations Manager occupation is the occupation with the highest salary potential within the
Business Program with a median earnings of $57.62/hour. The lowest median earnings occupation is Cost Estimators at
$32.63/hour.
Appendix 1 58

Of the total 1 certificate and associate’s degrees awarded in 2016‐17, Orange Coast College awarded 100% of the
certificate associate’s degrees in Display and Visual Presentation in the Orange County Region. Compared to 2015‐16,
the number of awards by Orange Coast College increased by 100.0%.
2. PROGRAM MEETS A DOCUMENTED LABOR MARKET DEMAND: PERCENTILE EARNINGS WITHIN MARKET Data based on TOP code crosswalk to applicable SOC Codes Percentile earnings based on Orange County Region as reported in EMSI: Occupation Overview Report
OCCUPATION 25th Percentile Earnings Median Earnings 75th Percentile Earnings
Merchandise Displayers and Window Trimmers (27‐1026)
$10.94/hour $12.03/hour $15.44/hour
First‐Line Supervisors of Retail Sales Workers (41‐1011)
$13.41/hour $16.27/hour $21.82/hour
First‐Line Supervisors of Non‐Retail Sales Workers (41‐1012)
$17.52/hour $26.20/hour $37.02/hour
Sales Representatives, Wholesale and Manufacturing, Except Technical and Scientific Products (41‐4012)
$17.74/hour $25.83/hour $37.01/hour
PERCENTILE EARNING AVERAGE $14.46/hour $20.35/hour $31.57/hour
3. PROGRAM DOES NOT REPRESENT UNNECESSARY DUPLICATION OF OTHER MANPOWER TRAINING PROGRAMS IN THE AREA:
Programs based on CIP Code (52.1899) Certificates and Associate’s degrees in Orange County Region as reported in EMSI: Program Overview
INSTITUTION Certificates Awarded
(2016‐2017)
Associate Degrees Awarded
(2016‐2017)
% Distribution of Total Certificate /Associate Degrees Awarded
EMSI Growth % Year over Year (YOY) (2015)
Orange Coast College 1 0 100.00% +100.00% Coastline Community College
0 0 NA
0.0%
Fullerton College 0 0 NA 0.0% Santa Ana College 0 0 NA 0.0% Saddleback College 0 0 NA 0.0%
Appendix 1 59

4. PROGRAM IS OF DEMONSTRATED EFFECTIVENESS AS MEASURED BY THE ENROLLMENT AND COMPLETION SUCCESS OF ITS STUDENTS:
Data based on TOP code (0509.60) reported to the District by each of the respective college. Enrollment: Data Source: Argos – Program Review Enrollment Cube (Census Enrollment) FTES: Data Source: Argos – Program Review Enrollment Cube (FTES Total) FTES: Resident: Data Source: Argos – Program Review Enrollment Cube (FTES Res 320) FTES: Non‐Resident: Data Source: Argos – Program Review Enrollment Cube (FTES NRes 320) WSCH/FTEF: Data Source: Argos – Program Review Enrollment Cube (WSCH_FTEF 525 Est) Retention within Subject: Data Source: DataMart ‐ Retention Rate (Enrollment Count in Fall and Spring of Academic Year compared with Retained Count) Annualized Course Success Rate: Data Source: Argos – Program Review Access Success Cube (Success) Degrees and Certificates: Data Source: DataMart ‐ Program Awards Summary
Academic Year 2012‐2013 2013‐2014 2014‐2015 2015‐2016 2016‐2017
Enrollment 30 27 27 23 40
FTES 3 3 3 2 4
FTES: Resident 3 3 2 2 3
FTES: Non‐Resident 0 0 0 0 1
WSCH/FTEF Data Not Available Data Not Available Data Not Available 357.4 310.9
Fall to Spring Course Retention Within Subject
Fall‐to‐Spring 30/26 27/25 27/27 23/22 18/16
Fall‐to‐Spring Retention
86.67% 92.59% 100.00% 95.65% 88.89%
Annualized Course Success Rate
76.7% 77.8% 96.3% 82.6% 80.0%
Degrees and Certificates
Certificates 0 3 0 0 0
Associate Degrees 0 3 0 1 0
Total 0 6 0 1 0
The course data above reflect course TOP codes aligned with the program TOP codes. Students may enroll in
required associate or certificate courses within the program that fall outside of the program TOP codes. These
external TOP codes are not included in the above figures.
The enrollment in the Display and Visual Review program has fluctuated over the last three years from 27 in
2014‐2015, dipping to 23 in 2015‐2016, and increasing to 40 in 2016‐2017. The FTES also fluctuated over the last
three years from 27 in 2014‐15, to 23 in 2015‐2016, and increasing to 40 in 2016‐2017. The instructional load
efficiency (WSCH/FTEF) decreased from 357.4 in 2015‐2016 to 310.9 in 2016‐2017. A value of 525 or higher is the
standard average target and it is a measure of average class enrollment needed for cost efficiency purposes.
Overall, with the fluctuation of enrollment in the program, as well as in the number of FTES, has resulted in
fluctuating award count of degrees and certificates. Over the past three years, there has only been 1 graduate in
2015‐2016.
Appendix 1 60

PROGRAM TITLE: Early Childhood COLLEGE: Orange Coast College
DATE: 2018 Biennial Program Review TOPS CODE:
1305.40: Preschool Age Children
1305.80: Child Development Administration and Management
1305.90: Infants and Toddlers
CERTIFICATES AND DEGREES TOTAL: 7
CERTIFICATES DEGREES
Certificate of Achievement: EC: Preschool Teacher
Certificate of Achievement: EC: Infant & Toddler
Certificate of Achievement: Early Childhood Administration
Associate in Science: EC: Preschool Teacher
Associate in Science Transfer: Early Childhood Education
Associate in Science: EC: Infant & Toddler
Associate in Science: Early Childhood Administration
Orange Coast College offers 7 certificates and degrees under the Early Childhood Program. According to the Economic
Modeling Specialists International (EMSI), there were 15,182 job openings in 2016 associated with the Early Childhood Program. Overall, this program is expected to increase by 9.6% between 2016 and 2025, with the Education
Administrators, Preschool and Childcare Center/Program occupation showing the highest growth at 13.0% associated
while the Childcare Workers occupation showing the lowest growth at 8.5%.
The table below shows the projected openings and percentage changes within each occupation associated with the
program
1. PROGRAM MEETS A DOCUMENTED LABOR MARKET DEMAND: GROWTH IN MARKET Data based on TOP code crosswalk to applicable SOC Codes (11‐9031, 25‐2011, and 39‐9011) Job openings based on Orange County Region as reported in EMSI: Occupation Overview Report
OCCUPATION EMSI Current Openings (2016)
EMSI Projected Openings (2025)
Change Between 2016‐2025 Job Openings
% Change
Education Administrators, Preschool and Childcare Center/Program (11‐9031)
592 669 +77 +13.0%
Preschool Teachers, Except Special Education (25‐2011)
5,187 5,774 +587 +11.3%
Childcare Workers (39‐9011)
9,403 10,203 +800 +8.5%
TOTAL 15,182 16,646 +1,464 +9.6%
The Education Administrators, Preschool and Childcare Center/Program occupation is the occupation with the highest
salary potential within the Early Childhood Program with a median earnings of $22.05/hour. The lowest median earnings
occupation is Childcare Workers at $10.05/hour.
Appendix 1 61

Of the total 247 certificate and associate’s degrees awarded in 2016‐17, Orange Coast College awarded 14.17% of the
certificate associate’s degrees in Early Childhood in the Orange County Region. Compared to 2015‐16, the number of
awards by Orange Coast College increased by 16.67%.
2. PROGRAM MEETS A DOCUMENTED LABOR MARKET DEMAND: PERCENTILE EARNINGS WITHIN MARKET Data based on TOP code crosswalk to applicable SOC Codes Percentile earnings based on Orange County Region as reported in EMSI: Occupation Overview Report
OCCUPATION 25th Percentile Earnings Median Earnings 75th Percentile Earnings
Education Administrators, Preschool and Childcare Center/Program (11‐9031)
$17.67/hour $22.05/hour $29.71/hour
Preschool Teachers, Except Special Education (25‐2011)
$12.15/hour $15.27/hour $18.71/hour
Childcare Workers (39‐9011)
$7.76/hour $10.05/hour $12.50/hour
PERCENTILE EARNING AVERAGE $8.74/hour $11.79/hour $15.73/hour
3. PROGRAM DOES NOT REPRESENT UNNECESSARY DUPLICATION OF OTHER MANPOWER TRAINING PROGRAMS IN THE AREA:
Programs based on CIP Code (19.0708 and 19.0709) Certificates and Associate’s degrees in Orange County Region as reported in EMSI: Program Overview
INSTITUTION Certificates Awarded
(2016‐2017)
Associate Degrees Awarded
(2016‐2017)
% Distribution of Total Certificate /Associate Degrees Awarded
EMSI Growth % Year over Year (YOY) (2015)
Santa Ana College 41 34 30.36% +15.38% Saddleback College 38 22 24.29% ‐41.18% Irvine Valley College 44 5 19.83% +2.09%
Orange Coast College 20 15 14.17% +16.67%
Fullerton College 2 16 7.29% +12.50% Santiago Canyon College 10 0 4.05% +900%
Appendix 1 62

4. PROGRAM IS OF DEMONSTRATED EFFECTIVENESS AS MEASURED BY THE ENROLLMENT AND COMPLETION SUCCESS OF ITS STUDENTS:
Data based on TOP code (1305) reported to the District by each of the respective college. Enrollment: Data Source: Argos – Program Review Enrollment Cube (Census Enrollment) FTES: Data Source: Argos – Program Review Enrollment Cube (FTES Total) FTES: Resident: Data Source: Argos – Program Review Enrollment Cube (FTES Res 320) FTES: Non‐Resident: Data Source: Argos – Program Review Enrollment Cube (FTES NRes 320) WSCH/FTEF: Data Source: Argos – Program Review Enrollment Cube (WSCH_FTEF 525 Est) Retention within Subject: Data Source: DataMart ‐ Retention Rate (Enrollment Count in Fall and Spring of Academic Year compared with Retained Count) Annualized Course Success Rate: Data Source: Argos – Program Review Access Success Cube (Success) Degrees and Certificates: Data Source: DataMart ‐ Program Awards Summary
Academic Year 2012‐2013 2013‐2014 2014‐2015 2015‐2016 2016‐2017
Enrollment 740 725 813 825 877
FTES 73 71 83 81 91
FTES: Resident 72 70 81 78 87
FTES: Non‐Resident 1 2 2 3 5
WSCH/FTEF Data Not Available Data Not Available Data Not Available 387.0 414.3
Fall to Spring Course Retention Within Subject
Fall‐to‐Spring 1,465/1,374 1,864/1,704 1,923/1,753 1,772/1,623 1,734/1,595
Fall‐to‐Spring Retention
93.8% 91.4% 91.2% 91.6% 91.9%
Annualized Course Success Rate
89.1% 85.2% 86.7% 86.9% 90.1%
Degrees and Certificates
Certificates 20 22 18 20 16
Associate Degrees 7 7 12 15 15
Total 27 15 30 35 31
The course data above reflect course TOP codes aligned with the program TOP codes. Students may enroll in
required associate or certificate courses within the program that fall outside of the program TOP codes. These
external TOP codes are not included in the above figures.
The enrollment in the Early Childhood program increased over the last three years from 813in 2014‐2015 to 877
in 2016‐2017. The FTES fluctuated as well over the last three years from 83 in 2014‐15, dropping to 81 in 2015‐
2016, and increasing to 91 in 2016‐2017. The instructional load efficiency (WSCH/FTEF) increased from 387.0 in
2015‐2016 to 414.3 in 2016‐2017. A value of 525 or higher is the standard average target and it is a measure of
average class enrollment needed for cost efficiency purposes.
Overall, with the increase in enrollment in the program, fluctuating of the FTES, has resulted in an increase in a
fluctuating award count of degrees and certificates. Over the past three years, awards increased from 30 in 2014‐
2015 to 35 in 2015‐2016, and dropped to 31 in 2016‐2017.
Appendix 1 63

PROGRAM TITLE: Health Education COLLEGE: Orange Coast College
DATE: 2018 Biennial Program Review TOPS CODE:
1201.00: Health Occupations, General
CERTIFICATES AND DEGREES TOTAL: 1
CERTIFICATES DEGREES
NOT APPLICABLE Associate of Arts: Health
Orange Coast College offers one degree under the Health Education Program. According to the Economic Modeling
Specialists International (EMSI), there were 19 job openings in 2016 associated with the Health Education Program.
Overall, this program is expected to increase by 40.0% between 2016 and 2025, with the occupation of Home Health
Aides showing the greatest occupational growth at 54.4%, followed by Nursing Assistants projected to grow at 32.4%.
The table below shows the projected openings and percentage changes within each occupation associated with the
program
1. PROGRAM MEETS A DOCUMENTED LABOR MARKET DEMAND: GROWTH IN MARKET Data based on TOP code crosswalk to applicable SOC Codes (31‐1011 and 31‐1014) Job openings based on Orange County Region as reported in EMSI: Occupation Overview Report
OCCUPATION EMSI Current Openings (2016)
EMSI Projected Openings (2025)
Change Between 2016‐2025 Job Openings
% Change
Home Health Aides (31‐1011) 4,128 6,375 +2,247 +54.4%
Nursing Assistants (31‐1014) 7,800 10,324 +2,524 +32.4%
TOTAL 11,928 16,699 +4,771 +40.0%
The Nursing Assistants occupation within the Health Education Program shows the greatest median earnings of
$13.63/hour, followed by Home Health Aides with a median earnings of $11.75/hour.
Of the total 110 certificate and associate’s degrees awarded in 2016‐17, Orange Coast College awarded 14.54% of the
certificate associate’s degrees in the Health Education program in the Orange County Region. Compared to 2015‐16, the
number of awards by Orange Coast College decreased by 11.11%.
2. PROGRAM MEETS A DOCUMENTED LABOR MARKET DEMAND: PERCENTILE EARNINGS WITHIN MARKET Data based on TOP code crosswalk to applicable SOC Codes Percentile earnings based on Orange County Region as reported in EMSI: Occupation Overview Report
OCCUPATION 25th Percentile Earnings Median Earnings 75th Percentile Earnings
Home Health Aides (31‐1011) $10.59/hour $11.75/hour $15.16/hour
Nursing Assistants (31‐1014) $12.13/hour $13.63/hour $15.11/hour
PERCENTILE EARNING AVERAGE $11.38/hour $13.11/hour $15.12/hour
Appendix 1 64

3. PROGRAM DOES NOT REPRESENT UNNECESSARY DUPLICATION OF OTHER MANPOWER TRAINING PROGRAMS IN THE AREA:
Programs based on CIP Code (51.0000) Certificates and Associate’s degrees in Orange County Region as reported in EMSI: Program Overview
INSTITUTION Certificates Awarded
(2016‐2017)
Associate Degrees Awarded
(2016‐2017)
% Distribution of Total Certificate /Associate Degrees Awarded
EMSI Growth % Year over Year (YOY) (2015)
Saddleback College 0 90 81.81% +3.44%
Orange Coast College 0 16 14.54% ‐11.11%
Allied American University 0 4 3.64% 400.00%
Appendix 1 65

4. PROGRAM IS OF DEMONSTRATED EFFECTIVENESS AS MEASURED BY THE ENROLLMENT AND COMPLETION SUCCESS OF ITS STUDENTS:
Data based on TOP code (1201.00) reported to the District by each of the respective college. Enrollment: Data Source: Argos – Program Review Enrollment Cube (Census Enrollment) FTES: Data Source: Argos – Program Review Enrollment Cube (FTES Total) FTES: Resident: Data Source: Argos – Program Review Enrollment Cube (FTES Res 320) FTES: Non‐Resident: Data Source: Argos – Program Review Enrollment Cube (FTES NRes 320) WSCH/FTEF: Data Source: Argos – Program Review Enrollment Cube (WSCH_FTEF 525 Est) Retention within Subject: Data Source: DataMart ‐ Retention Rate (Enrollment Count in Fall and Spring of Academic Year compared with Retained Count) Annualized Course Success Rate: Data Source: Argos – Program Review Access Success Cube (Success) Degrees and Certificates: Data Source: DataMart ‐ Program Awards Summary
Academic Year 2012‐2013 2013‐2014 2014‐2015 2015‐2016 2016‐2017
Enrollment 1,528 1,721 1,627 1,616 1,554
FTES 102 123 112 115 113
FTES: Resident 99 121 110 113 110
FTES: Non‐Resident 2 2 2 1 2
WSCH/FTEF Data Not Available Data Not Available Data Not Available 1,167.5 1,160.6
Fall to Spring Course Retention Within Subject
Fall‐to‐Spring 1,532/1,406 1,720/1,554 1,638/1,490 1,621/1,459 1,558/1,398
Fall‐to‐Spring Retention
91.78% 90.35% 90.97% 90.01% 89.73%
Annualized Course Success Rate
78.2% 69.4% 67.5% 70.0% 65.7%
Degrees and Certificates
Certificates NA NA NA NA NA
Associate Degrees 39 23 18 16 8
Total 39 23 18 16 8
The course data above reflect course TOP codes aligned with the program TOP codes. Students may enroll in
required associate or certificate courses within the program that fall outside of the program TOP codes. These
external TOP codes are not included in the above figures.
The enrollment in the Health Education program decreased over the last three years from 1,627 in 2014‐2015 to
1,554 in 2016‐2017. The FTES slightly fluctuated slightly over the last three years from 112 in 2014‐15, to 115 in
2015‐16, and recently 113 in 2016‐2017. The instructional load efficiency (WSCH/FTEF) decreased from 1,167.5
in 2015‐2016 to 1,606.6 in 2016‐2017. A value of 525 or higher is the standard average target and it is a measure
of average class enrollment needed for cost efficiency purposes.
Overall, with the decrease in enrollment in the program, stagnant number of FTES, has resulted in a decreasing
award count of degrees. Over the past three years, awards dropped from 18 in 2014‐2015 to 8 in 2016‐2017.
Appendix 1 66

PROGRAM TITLE: Hospitality, Travel, and Tourism COLLEGE: Orange Coast College
DATE: 2018 Biennial Program Review TOPS CODE:
1307.00: Hospitality
1307.20: Lodging Management
3009.00: Travel Services and Tourism
CERTIFICATES AND DEGREES TOTAL: 4
CERTIFICATES DEGREES
Certificate of Achievement: HTT: Front Office Specialist
Certificate of Achievement: Meeting & Event Management
Certificate of Achievement: Travel Agency Specialist
Associate of Science: HTT: Travel & Tourism
Orange Coast College offers 4 certificates and degrees under the Hospitality, Travel, and Tourism Program. According
to the Economic Modeling Specialists International (EMSI), there were 18,949 job openings in 2016 associated with the
Hospitality, Travel, and Tourism Program. Overall, this program is expected to increase by 14.8% between 2016 and
2025, with the First‐Line Supervisors of Food Preparation and Serving Workers occupation showing the highest growth
at 22.5% associated while the Travel Guides occupation showing the lowest growth at 2.4%.
The table below shows the projected openings and percentage changes within each occupation associated with the
program
1. PROGRAM MEETS A DOCUMENTED LABOR MARKET DEMAND: GROWTH IN MARKET Data based on TOP code crosswalk to applicable SOC Codes (11‐9051, 11‐9081, 13‐1121, 35‐1012, 39‐7011, 39‐7012, 41‐3041, 43‐4181, 53‐6061) Job openings based on Orange County Region as reported in EMSI: Occupation Overview Report
OCCUPATION EMSI Current Openings (2016)
EMSI Projected Openings (2025)
Change Between 2016‐2025 Job Openings
% Change
Food Service Managers (11‐9051) 4,750 5,171 +421 +8.9%
Lodging Managers (11‐9081) 520 554 +34 +6.5%
Meeting, Convention, and Event Planners (13‐1121)
1,993 2,283 +290 +14.6%
First‐Line Supervisors of Food Preparation and Serving Workers (35‐1012)
8,425 10,320 +1,895 +22.5%
Tour Guides and Escorts (39‐7011) 364 415 +51 +14.0%
Travel Guides (39‐7012) 41 42 +1 +2.4%
Travel Agents (41‐3041) 1,831 1,892 +61 +3.3%
Reservation and Transportation Ticket Agents and Travel Clerks (43‐4181)
892 918 +26 +2.9%
Transportation Attendants, Except Flight Attendants (53‐6061)
134 151 +17 +12.7%
TOTAL 18,949 21,745 +2,796 +14.8%
Appendix 1 67

The Lodging Managers occupation is the occupation with the highest salary potential within the Hospitality, Travel,
and Tourism Program with a median earnings of $24.70/hour. The lowest median earnings occupation is
Transportation Attendants, Except Flight Attendants at $11.24/hour.
Of the total 77 certificate and associate’s degrees awarded in 2016‐17, Orange Coast College awarded 31.17% of the
certificate associate’s degrees in Hospitality, Travel, and Tourism in the Orange County Region. Compared to 2015‐
16, the number of awards by Orange Coast College increased by 71.43%.
2. PROGRAM MEETS A DOCUMENTED LABOR MARKET DEMAND: PERCENTILE EARNINGS WITHIN MARKET Data based on TOP code crosswalk to applicable SOC Codes Percentile earnings based on Orange County Region as reported in EMSI: Occupation Overview Report
OCCUPATION 25th Percentile Earnings Median Earnings 75th Percentile Earnings
Food Service Managers (11‐9051) $11.59/hour $20.36/hour $29.09/hour
Lodging Managers (11‐9081) $17.26/hour $24.70/hour $32.69/hour
Meeting, Convention, and Event Planners (13‐1121)
$18.75/hour $22.99/hour $31.39/hour
First‐Line Supervisors of Food Preparation and Serving Workers (35‐1012)
$11.84/hour $14.43/hour $21.84/hour
Tour Guides and Escorts (39‐7011) $10.23/hour $14.01/hour $18.66/hour
Travel Guides (39‐7012) $14.86/hour $20.42/hour $24.06/hour
Travel Agents (41‐3041) $15.32/hour $19.73/hour $23.91/hour
Reservation and Transportation Ticket Agents and Travel Clerks (43‐4181)
$13.31/hour $17.20/hour $23.55/hour
Transportation Attendants, Except Flight Attendants (53‐6061)
$10.23/hour $11.24/hour $13.53/hour
PERCENTILE EARNING AVERAGE $12.31/hour $17.11/hour $25.29/hour
3. PROGRAM DOES NOT REPRESENT UNNECESSARY DUPLICATION OF OTHER MANPOWER TRAINING PROGRAMS IN THE AREA:
Programs based on CIP Code (52.0901, 52.0904, and 52.1905) Certificates and Associate’s degrees in Orange County Region as reported in EMSI: Program Overview
INSTITUTION Certificates Awarded
(2016‐2017)
Associate Degrees Awarded
(2016‐2017)
% Distribution of Total Certificate /Associate Degrees Awarded
EMSI Growth % Year over Year (YOY) (2015)
Cypress College 42 7 63.64% +75.00% Orange Coast College 17 7 31.17% +71.43%
Saddleback College 3 1 5.20% ‐63.64%
Appendix 1 68

4. PROGRAM IS OF DEMONSTRATED EFFECTIVENESS AS MEASURED BY THE ENROLLMENT AND COMPLETION SUCCESS OF ITS STUDENTS:
Data based on TOP code (1307.00, 1307.20, 3009.00) reported to the District by each of the respective college. Enrollment: Data Source: Argos – Program Review Enrollment Cube (Census Enrollment) FTES: Data Source: Argos – Program Review Enrollment Cube (FTES Total) FTES: Resident: Data Source: Argos – Program Review Enrollment Cube (FTES Res 320) FTES: Non‐Resident: Data Source: Argos – Program Review Enrollment Cube (FTES NRes 320) WSCH/FTEF: Data Source: Argos – Program Review Enrollment Cube (WSCH_FTEF 525 Est) Retention within Subject: Data Source: DataMart ‐ Retention Rate (Enrollment Count in Fall and Spring of Academic Year compared with Retained Count) Annualized Course Success Rate: Data Source: Argos – Program Review Access Success Cube (Success) Degrees and Certificates: Data Source: DataMart ‐ Program Awards Summary
Academic Year 2012‐2013 2013‐2014 2014‐2015 2015‐2016 2016‐2017
Enrollment 1,137 1,177 1,026 885 817
FTES 77 72 65 62 54
FTES: Resident 64 63 52 47 36
FTES: Non‐Resident 13 9 13 15 13
WSCH/FTEF Data Not Available Data Not Available Data Not Available 951.7 735.8
Fall to Spring Course Retention Within Subject
Fall‐to‐Spring 1,204/1,056 1,291/1,080 1,130/967 1,018/852 884/755
Fall‐to‐Spring Retention
87.71% 85.58% 83.69% 85.41%
Annualized Course Success Rate
74.2% 73.4% 67.9% 72.3% 73.4%
Degrees and Certificates
Certificates 7 4 12 17 18
Associate Degrees 2 1 2 7 3
Total 9 5 14 24 21
The course data above reflect course TOP codes aligned with the program TOP codes. Students may enroll in
required associate or certificate courses within the program that fall outside of the program TOP codes. These
external TOP codes are not included in the above figures.
The enrollment in the Hospitality, Travel, and Tourism program decreased over the last three years from 1,026
in 2014‐2015 to 817 in 2016‐2017. The FTES decreased as well over the last three years from 65 in 2014‐15 and
decreasing to 64 in 2016‐2017. The instructional load efficiency (WSCH/FTEF) decreased from 951.7 in 2015‐
2016 to 735.8 in 2016‐2017. A value of 525 or higher is the standard average target and it is a measure of
average class enrollment needed for cost efficiency purposes.
Overall, with the decrease in enrollment in the program, decrease of the FTES, has resulted in a fluctuating award
count of degrees and certificates. Over the past three years, awards increased from 14 in 2014‐2015 to 24 in
2015‐2016, and dropped to 21 in 2016‐2017.
Appendix 1 69

PROGRAM TITLE: Hotel COLLEGE: Orange Coast College
DATE: 2018 Biennial Program Review TOPS CODE:
1307.20: Lodging Management
CERTIFICATES AND DEGREES TOTAL: 2
CERTIFICATES DEGREES
Certificate of Achievement: HTT: Human Resource Mgmt
Certificate of Achievement: HTT: Sales & Marketing Spec
NOT APPLICABLE
Orange Coast College offers 2 certificates under the Hotel Program. According to the Economic Modeling Specialists
International (EMSI), there were 5,270 job openings in 2016 associated with the Hotel Program. Overall, this program is
expected to increase by 8.6% between 2016 and 2025, with the Food Service Managers occupation showing the highest
growth at 8.9% associated while the Lodging Managers occupation showing the lowest growth at 6.5%.
The table below shows the projected openings and percentage changes within each occupation associated with the
program
1. PROGRAM MEETS A DOCUMENTED LABOR MARKET DEMAND: GROWTH IN MARKET Data based on TOP code crosswalk to applicable SOC Codes (11‐9051 and 11‐9081) Job openings based on Orange County Region as reported in EMSI: Occupation Overview Report
OCCUPATION EMSI Current Openings (2016)
EMSI Projected Openings (2025)
Change Between 2016‐2025 Job Openings
% Change
Food Service Managers (11‐9051) 4,750 5,171 +421 +8.9%
Lodging Managers (11‐9081) 520 554 +34 +6.5%
TOTAL 5,270 5,725 +455 +8.6%
The Lodging Managers occupation is the occupation with the highest salary potential within the Hotel Program with a
median earnings of $24.70/hour. The lowest median earnings occupation is Lodging Managers at $20.36/hour.
Of the total 25 certificate and associate degrees awarded in 2016‐17, Orange Coast College awarded 36.00% of the
certificate Hotel programs in the Orange County Region. Compared to 2015‐16, the number of awards by Orange Coast
College increased by 12.5%.
2. PROGRAM MEETS A DOCUMENTED LABOR MARKET DEMAND: PERCENTILE EARNINGS WITHIN MARKET Data based on TOP code crosswalk to applicable SOC Codes Percentile earnings based on Orange County Region as reported in EMSI: Occupation Overview Report
OCCUPATION 25th Percentile Earnings Median Earnings 75th Percentile Earnings
Food Service Managers (11‐9051) $11.59/hour $20.36/hour $29.09/hour
Lodging Managers (11‐9081) $17.26/hour $24.70/hour $32.69/hour
PERCENTILE EARNING AVERAGE $12.05/hour $20.86/hour $30.34/hour
Appendix 1 70

3. PROGRAM DOES NOT REPRESENT UNNECESSARY DUPLICATION OF OTHER MANPOWER TRAINING PROGRAMS IN THE AREA:
Programs based on CIP Code (52.0904) Certificates and Associate’s degrees in Orange County Region as reported in EMSI: Program Overview
INSTITUTION Certificates Awarded
(2016‐2017)
Associate Degrees Awarded
(2016‐2017)
% Distribution of Total Certificate /Associate Degrees Awarded
EMSI Growth % Year over Year (YOY) (2015)
Cypress College 13 3 64.00% +6.67% Orange Coast College 5 4 36.00% +12.5%
Appendix 1 71

4. PROGRAM IS OF DEMONSTRATED EFFECTIVENESS AS MEASURED BY THE ENROLLMENT AND COMPLETION SUCCESS OF ITS STUDENTS:
Data based on TOP code (1307.20) reported to the District by each of the respective college. Enrollment: Data Source: Argos – Program Review Enrollment Cube (Census Enrollment) FTES: Data Source: Argos – Program Review Enrollment Cube (FTES Total) FTES: Resident: Data Source: Argos – Program Review Enrollment Cube (FTES Res 320) FTES: Non‐Resident: Data Source: Argos – Program Review Enrollment Cube (FTES NRes 320) WSCH/FTEF: Data Source: Argos – Program Review Enrollment Cube (WSCH_FTEF 525 Est) Retention within Subject: Data Source: DataMart ‐ Retention Rate (Enrollment Count in Fall and Spring of Academic Year compared with Retained Count) Annualized Course Success Rate: Data Source: Argos – Program Review Access Success Cube (Success) Degrees and Certificates: Data Source: DataMart ‐ Program Awards Summary
Academic Year 2012‐2013 2013‐2014 2014‐2015 2015‐2016 2016‐2017
Enrollment 1,125 1,190 1,016 861 803
FTES 75 72 63 57 50
FTES: Resident 62 63 52 45 38
FTES: Non‐Resident 13 9 12 12 12
WSCH/FTEF Data Not Available Data Not Available Data Not Available 329.8 302.6
Fall to Spring Course Retention Within Subject
Fall‐to‐Spring 924/792 986/800 840/705 724/598 646/546
Fall‐to‐Spring Retention
85.71% 81.14% 83.93% 82.60% 84.52%
Annualized Course Success Rate
67.2% 52.0% 81.1% 73.2% 75.7%
Degrees and Certificates
Certificates 3 2 7 5 5
Associate Degrees NA NA NA NA NA
Total 3 2 7 5 5
The course data above reflect course TOP codes aligned with the program TOP codes. Students may enroll in
required associate or certificate courses within the program that fall outside of the program TOP codes. These
external TOP codes are not included in the above figures.
The enrollment in the Hotel program decreased over the last three years from 1,016 in 2014‐2015 to 803 in
2016‐2017. The FTES decreased as well over the last three years from 63 in 2014‐15 and decreasing to 50 in
2016‐2017. The instructional load efficiency (WSCH/FTEF) decreased from 329.8 in 2015‐2016 to 302.6 in 2016‐
2017. A value of 525 or higher is the standard average target and it is a measure of average class enrollment
needed for cost efficiency purposes.
Overall, with the decrease in enrollment in the program, decrease of the FTES, has resulted in a fluctuating award
count of certificates. Over the past three years, awards increased from 7n 2014‐2015 to 5 in 2015‐2016 and
2016‐2017.
Appendix 1 72

PROGRAM TITLE: Interior Design COLLEGE: Orange Coast College
DATE: 2018 Biennial Program Review TOPS CODE:
1302.00: Interior Design and Merchandising
CERTIFICATES AND DEGREES TOTAL: 4
CERTIFICATES DEGREES
Certificate of Achievement: Interior Design: Merchandising
Certificate of Achievement: Interior Design: Professional
Certificate of Specialization: Interior Design: Kitchen/Bath
Associate of Science: Interior Design: Assistant Lvl 2
Orange Coast College offers 4 certificates and degrees under the Interior Design Program. According to the Economic
Modeling Specialists International (EMSI), there were 2,140 job openings in 2016 associated with the Interior Design Program. Overall, this program is expected to increase by 1.2% between 2016 and 2025, with the occupation of Set and
Exhibit Designers showing the greatest occupational growth at 2.4%, followed by Interior Designers projected to grow at
1.0%.
The table below shows the projected openings and percentage changes within each occupation associated with the
program
1. PROGRAM MEETS A DOCUMENTED LABOR MARKET DEMAND: GROWTH IN MARKET Data based on TOP code crosswalk to applicable SOC Codes (27‐1025 and 27‐1027) Job openings based on Orange County Region as reported in EMSI: Occupation Overview Report
OCCUPATION EMSI Current Openings (2016)
EMSI Projected Openings (2025)
Change Between 2016‐2025 Job Openings
% Change
Interior Designers (27‐1025) 1,889 1,908 +19 +1.0%
Set and Exhibit Designers (27‐1027) 251 257 +6 +2.4%
TOTAL 2,140 2,166 +26 +1.2%
The Set and Exhibit Designers occupation within the Interior Design Program shows the greatest median earnings of
$21.66/hour, followed by Interior Designers with a median earnings of $21.45/hour.
Of the total 114 certificates and associate’s degrees awarded in 2016‐17, Orange Coast College awarded 23.68% of the
certificates and associate’s degrees in the Interior Design program in the Orange County Region. Compared to 2015‐16,
the number of awards by Orange Coast College decreased by 34.15%.
2. PROGRAMS MEETS A DOCUMENTED LABOR MARKET DEMAND: PERCENTILE EARNINGS WITHIN MARKET Data based on TOP code crosswalk to applicable SOC Codes Percentile earnings based on Orange County Region as reported in EMSI: Occupation Overview Report
OCCUPATION 25th Percentile Earnings Median Earnings 75th Percentile Earnings
Interior Designers (27‐1025) $19.00/hour $21.45/hour $26.70/hour
Set and Exhibit Designers (27‐1027) $18.06/hour $21.66/hour $32.28/hour
PERCENTILE EARNING AVERAGE $18.92/hour $21.48/hour $27.24/hour
Appendix 1 73

3. PROGRAM DOES NOT REPRESENT UNNECESSARY DUPLICATION OF OTHER MANPOWER TRAINING PROGRAMS IN THE AREA:
Programs based on CIP Code (50.0408) Certificates and Associate’s degrees in Orange County Region as reported in EMSI: Program Overview
INSTITUTION Certificates Awarded
(2016‐2017)
Associate Degrees Awarded
(2016‐2017)
% Distribution of Total Certificate /Associate Degrees Awarded
EMSI Growth % Year over Year (YOY) (2015)
Interior Design Institute 0 41 35.96% +5.13%
Saddleback College 24 5 25.44% +52.63%
Orange Coast College 21 6 23.68% ‐34.15%
Fullerton College 9 8 14.91% +30.77%
Appendix 1 74

4. PROGRAM IS OF DEMONSTRATED EFFECTIVENESS AS MEASURED BY THE ENROLLMENT AND COMPLETION SUCCESS OF ITS STUDENTS:
Data based on TOP code (1302.00) reported to the District by each of the respective college. Enrollment: Data Source: Argos – Program Review Enrollment Cube (Census Enrollment) FTES: Data Source: Argos – Program Review Enrollment Cube (FTES Total) FTES: Resident: Data Source: Argos – Program Review Enrollment Cube (FTES Res 320) FTES: Non‐Resident: Data Source: Argos – Program Review Enrollment Cube (FTES NRes 320) WSCH/FTEF: Data Source: Argos – Program Review Enrollment Cube (WSCH_FTEF 525 Est) Retention within Subject: Data Source: DataMart ‐ Retention Rate (Enrollment Count in Fall and Spring of Academic Year compared with Retained Count) Annualized Course Success Rate: Data Source: Argos – Program Review Access Success Cube (Success) Degrees and Certificates: Data Source: DataMart ‐ Program Awards Summary
Academic Year 2012‐2013 2013‐2014 2014‐2015 2015‐2016 2016‐2017
Enrollment 625 780 780 725 832
FTES 83 100 101 91 109
FTES: Resident 77 93 93 81 96
FTES: Non‐Resident 6 6 8 10 12
WSCH/FTEF Data Not Available Data Not Available Data Not Available 317.6 374.8
Fall to Spring Course Retention Within Subject
Fall‐to‐Spring 625/540 756/667 764/661 727/653 825/759
Fall‐to‐Spring Retention
86.4% 88.2% 86.5% 89.8% 92.0%
Annualized Course Success Rate
79.9% 79.4% 78.8% 81.0% 87.3%
Degrees and Certificates
Certificates 19 16 25 21 20
Associate Degrees 11 10 16 6 12
Total 30 26 41 27 32
The course data above reflect course TOP codes aligned with the program TOP codes. Students may enroll in
required associate or certificate courses within the program that fall outside of the program TOP codes. These
external TOP codes are not included in the above figures.
The enrollment in the Interior Design program fluctuated over the last three years from 780 in 2014‐2015,
dropping to 725 in 2015‐2016, and increasing to 832 in 2016‐2017. The FTES also fluctuated over the last three
years from 101 in 2014‐15, to 91 in 2015‐16, and recently 109 in 2016‐2017. The instructional load efficiency
(WSCH/FTEF) increased from 317.6 in 2015‐2016 to 374.8 in 2016‐2017. A value of 525 or higher is the standard
average target and it is a measure of average class enrollment needed for cost efficiency purposes.
Overall, with the fluctuating enrollment in the program, fluctuating number of FTES, has resulted in a fluctuating
award count of certificates and degrees. Over the past three years, awards dropped from 41 in 2014‐2015 to 27
in 2016‐2017, and increased to 32 in 2016‐2017.
Appendix 1 75

PROGRAM TITLE: Journalism COLLEGE: Orange Coast College
DATE: 2018 Biennial Program Review TOPS CODE:
0602.00: Journalism
CERTIFICATES AND DEGREES TOTAL: 2
CERTIFICATES DEGREES
Not Applicable Associate of Arts: Journalism
Associate of Arts Transfer: Journalism
Orange Coast College offers 2 associate degrees under the Journalism Program. According to the Economic Modeling
Specialists International (EMSI), there were 3,118 job openings in 2016 associated with the Journalism Program.
Overall, this program is expected to increase by 8.6% between 2016 and 2025, with the occupation of Writers and
Authors showing the greatest occupational growth at 10.2%, while Broadest News Analysts show the greatest drop with
a projected loss of 3.3%.
The table below shows the projected openings and percentage changes within each occupation associated with the
program
1. PROGRAM MEETS A DOCUMENTED LABOR MARKET DEMAND: GROWTH IN MARKET Data based on TOP code crosswalk to applicable SOC Codes (27‐3021, 27‐3022, 27‐3041 and 27‐3043) Job openings based on Orange County Region as reported in EMSI: Occupation Overview Report
OCCUPATION EMSI Current Openings (2016)
EMSI Projected Openings (2025)
Change Between 2016‐2025 Job Openings
% Change
Broadcast News Analysts (27‐3021) 30 29 ‐1 ‐3.3%
Reporters and Correspondents (27‐3022)
202 205 +3 +1.5%
Editors (27‐3041) 1,202 1,295 +93 +7.7%
Writers and Authors (27‐3043) 1,685 1,857 +172 +10.2%
TOTAL 3,118 3,386 +268 +8.6%
The Broadcast News Analysts occupation within the Journalism Program shows the greatest median earnings of
$30.02/hour, followed by Writers and Authors with a median earnings of $17.98/hour.
Of the total 48 certificates and associate’s degrees awarded in 2016‐17, Orange Coast College awarded 16.67% of the
certificates and associate’s degrees in the Journalism program in the Orange County Region. Compared to 2015‐16, the
number of awards by Orange Coast College graduated students at the same rates.
2. PROGRAM MEETS A DOCUMENTED LABOR MARKET DEMAND: PERCENTILE EARNINGS WITHIN MARKET Data based on TOP code crosswalk to applicable SOC Codes Percentile earnings based on Orange County Region as reported in EMSI: Occupation Overview Report
OCCUPATION 25th Percentile Earnings Median Earnings 75th Percentile Earnings
Broadcast News Analysts (27‐3021) $19.89/hour $30.02/hour $33.78/hour
Reporters and Correspondents (27‐3022)
$15.66/hour $19.55/hour $22.23/hour
Editors (27‐3041) $21.56/hour $24.72/hour $29.24/hour
Writers and Authors (27‐3043) $16.17/hour $17.98/hour $21.50/hour
PERCENTILE EARNING AVERAGE $16.89/hour $20.61/hour $25.81/hour
Appendix 1 76

3. PROGRAM DOES NOT REPRESENT UNNECESSARY DUPLICATION OF OTHER MANPOWER TRAINING PROGRAMS IN THE AREA:
Programs based on CIP Code (09.0401) Certificates and Associate’s degrees in Orange County Region as reported in EMSI: Program Overview
INSTITUTION Certificates Awarded
(2016‐2017)
Associate Degrees Awarded
(2016‐2017)
% Distribution of Total Certificate /Associate Degrees Awarded
EMSI Growth % Year over Year (YOY) (2015)
Fullerton College 0 26 54.17% +100.00%
Orange Coast College 0 8 16.67% 0.00%
Santa Ana College 0 7 14.58% +700.00%
Saddleback College 0 7 14.58% +700.00%
Appendix 1 77

4. PROGRAM IS OF DEMONSTRATED EFFECTIVENESS AS MEASURED BY THE ENROLLMENT AND COMPLETION SUCCESS OF ITS STUDENTS:
Data based on TOP code (0602.00) reported to the District by each of the respective college. Enrollment: Data Source: Argos – Program Review Enrollment Cube (Census Enrollment) FTES: Data Source: Argos – Program Review Enrollment Cube (FTES Total) FTES: Resident: Data Source: Argos – Program Review Enrollment Cube (FTES Res 320) FTES: Non‐Resident: Data Source: Argos – Program Review Enrollment Cube (FTES NRes 320) WSCH/FTEF: Data Source: Argos – Program Review Enrollment Cube (WSCH_FTEF 525 Est) Retention within Subject: Data Source: DataMart ‐ Retention Rate (Enrollment Count in Fall and Spring of Academic Year compared with Retained Count) Annualized Course Success Rate: Data Source: Argos – Program Review Access Success Cube (Success) Degrees and Certificates: Data Source: DataMart ‐ Program Awards Summary
Academic Year 2012‐2013 2013‐2014 2014‐2015 2015‐2016 2016‐2017
Enrollment 195 188 231 203 216
FTES 29 22 28 26 27
FTES: Resident 28 21 26 24 26
FTES: Non‐Resident 1 1 2 2 1
WSCH/FTEF Data Not Available Data Not Available Data Not Available 309.9 394.4
Fall to Spring Course Retention Within Subject
Fall‐to‐Spring 180/156 187/166 234/194 208/166 219/176
Fall‐to‐Spring Retention
86.7% 88.8% 82.9% 79.8% 80.4%
Annualized Course Success Rate
73.2% 76.6% 73.2% 74.9% 71.8%
Degrees and Certificates
Certificates NA NA NA NA NA
Associate Degrees 2 7 8 8 4
Total 2 7 8 8 4
The course data above reflect course TOP codes aligned with the program TOP codes. Students may enroll in
required associate or certificate courses within the program that fall outside of the program TOP codes. These
external TOP codes are not included in the above figures.
The enrollment in the Journalism program fluctuated over the last three years from 231 in 2014‐2015, dropping
to 203 in 2015‐2016, and increasing to 216 in 2016‐2017. The FTES also fluctuated slightly over the last three
years from 28 in 2014‐15, to 26 in 2015‐16, and recently 27 in 2016‐2017. The instructional load efficiency
(WSCH/FTEF) increased from 309.9 in 2015‐2016 to 394.4 in 2016‐2017. A value of 525 or higher is the standard
average target and it is a measure of average class enrollment needed for cost efficiency purposes.
Overall, with the fluctuating enrollment in the program, fluctuating number of FTES, has resulted in a fluctuating
award count of certificates and degrees. Over the past three years, awards maintained from 8 in 2014‐2015 to 8
in 2016‐2017, and dropped to 4 in 2016‐2017.
Appendix 1 78
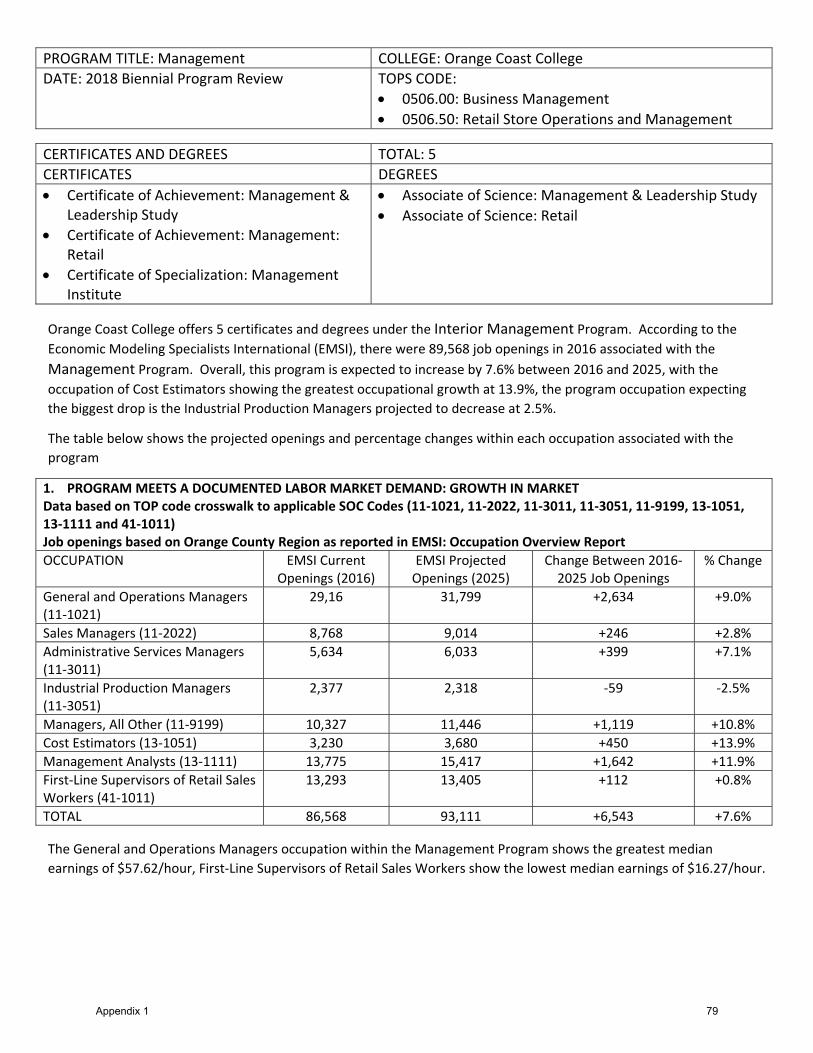
PROGRAM TITLE: Management COLLEGE: Orange Coast College
DATE: 2018 Biennial Program Review TOPS CODE:
0506.00: Business Management
0506.50: Retail Store Operations and Management
CERTIFICATES AND DEGREES TOTAL: 5
CERTIFICATES DEGREES
Certificate of Achievement: Management & Leadership Study
Certificate of Achievement: Management: Retail
Certificate of Specialization: Management Institute
Associate of Science: Management & Leadership Study
Associate of Science: Retail
Orange Coast College offers 5 certificates and degrees under the Interior Management Program. According to the
Economic Modeling Specialists International (EMSI), there were 89,568 job openings in 2016 associated with the
Management Program. Overall, this program is expected to increase by 7.6% between 2016 and 2025, with the
occupation of Cost Estimators showing the greatest occupational growth at 13.9%, the program occupation expecting
the biggest drop is the Industrial Production Managers projected to decrease at 2.5%.
The table below shows the projected openings and percentage changes within each occupation associated with the
program
1. PROGRAM MEETS A DOCUMENTED LABOR MARKET DEMAND: GROWTH IN MARKET Data based on TOP code crosswalk to applicable SOC Codes (11‐1021, 11‐2022, 11‐3011, 11‐3051, 11‐9199, 13‐1051, 13‐1111 and 41‐1011) Job openings based on Orange County Region as reported in EMSI: Occupation Overview Report
OCCUPATION EMSI Current Openings (2016)
EMSI Projected Openings (2025)
Change Between 2016‐2025 Job Openings
% Change
General and Operations Managers (11‐1021)
29,16 31,799 +2,634 +9.0%
Sales Managers (11‐2022) 8,768 9,014 +246 +2.8%
Administrative Services Managers (11‐3011)
5,634 6,033 +399 +7.1%
Industrial Production Managers (11‐3051)
2,377 2,318 ‐59 ‐2.5%
Managers, All Other (11‐9199) 10,327 11,446 +1,119 +10.8%
Cost Estimators (13‐1051) 3,230 3,680 +450 +13.9%
Management Analysts (13‐1111) 13,775 15,417 +1,642 +11.9%
First‐Line Supervisors of Retail Sales Workers (41‐1011)
13,293 13,405 +112 +0.8%
TOTAL 86,568 93,111 +6,543 +7.6%
The General and Operations Managers occupation within the Management Program shows the greatest median
earnings of $57.62/hour, First‐Line Supervisors of Retail Sales Workers show the lowest median earnings of $16.27/hour.
Appendix 1 79

Of the total 2,685 certificates and associate’s degrees awarded in 2016‐17, Orange Coast College awarded 11.53% of the
certificates and associate’s degrees in the Management program in the Orange County Region. Compared to 2015‐16,
the number of awards by Orange Coast College increased by 31.58%.
2. PROGRAM MEETS A DOCUMENTED LABOR MARKET DEMAND: PERCENTILE EARNINGS WITHIN MARKET Data based on TOP code crosswalk to applicable SOC Codes Percentile earnings based on Orange County Region as reported in EMSI: Occupation Overview Report
OCCUPATION 25th Percentile Earnings Median Earnings 75th Percentile Earnings
General and Operations Managers (11‐1021)
$36.63/hour $57.62/hour $93.20/hour
Sales Managers (11‐2022) $35.54/hour $54.09/hour $78.15/hour
Administrative Services Managers (11‐3011)
$36.59/hour $50.85/hour $66.84/hour
Industrial Production Managers (11‐3051)
$32.38/hour $44.57/hour $59.58/hour
Managers, All Other (11‐9199) $17.11/hour $22.59/hour $57.03/hour
Cost Estimators (13‐1051) $25.58/hour $32.63/hour $45.40/hour
Management Analysts (13‐1111) $29.86/hour $37.12/hour $49.01/hour
First‐Line Supervisors of Retail Sales Workers (41‐1011)
$13.41/hour $16.27/hour $21.82/hour
PERCENTILE EARNING AVERAGE $24.34/hour $40.15/hour $64.76/hour
3. PROGRAM DOES NOT REPRESENT UNNECESSARY DUPLICATION OF OTHER MANPOWER TRAINING PROGRAMS IN THE AREA:
Programs based on CIP Code (52.0201 and 52.0212) Certificates and Associate’s degrees in Orange County Region as reported in EMSI: Program Overview
INSTITUTION Certificates Awarded
(2016‐2017)
Associate Degrees Awarded
(2016‐2017)
% Distribution of Total Certificate /Associate Degrees Awarded
EMSI Growth % Year over Year (YOY) (2015)
Coastline Community College
309 833 37.63% +43.47%
Orange Coast College 22 328 11.53% +31.58%
Fullerton College 2 258 8.57% ‐2.26%
Santa Ana College 9 248 8.47% ‐2.28%
Santiago Canyon College 31 200 7.61% ‐3.46%
Saddleback College 2 215 7.15% +43.71%
Irvine Valley College 6 186 6.33% +6.67%
Cypress College 2 159 5.30% +18.38%
Golden West College 5 147 5.01% +34.51%
Allied American University 7 66 2.41% +21.67%
Appendix 1 80

4. PROGRAM IS OF DEMONSTRATED EFFECTIVENESS AS MEASURED BY THE ENROLLMENT AND COMPLETION SUCCESS OF ITS STUDENTS:
Data based on TOP code (0506.00 and 0506.50) reported to the District by each of the respective college. Enrollment: Data Source: Argos – Program Review Enrollment Cube (Census Enrollment) FTES: Data Source: Argos – Program Review Enrollment Cube (FTES Total) FTES: Resident: Data Source: Argos – Program Review Enrollment Cube (FTES Res 320) FTES: Non‐Resident: Data Source: Argos – Program Review Enrollment Cube (FTES NRes 320) WSCH/FTEF: Data Source: Argos – Program Review Enrollment Cube (WSCH_FTEF 525 Est) Retention within Subject: Data Source: DataMart ‐ Retention Rate (Enrollment Count in Fall and Spring of Academic Year compared with Retained Count) Annualized Course Success Rate: Data Source: Argos – Program Review Access Success Cube (Success) Degrees and Certificates: Data Source: DataMart ‐ Program Awards Summary
Academic Year 2012‐2013 2013‐2014 2014‐2015 2015‐2016 2016‐2017
Enrollment 291 260 268 273 178
FTES 28 25 26 26 18
FTES: Resident 27 24 23 23 15
FTES: Non‐Resident 1 1 3 3 3
WSCH/FTEF Data Not Available Data Not Available Data Not Available 718.7 510.3
Fall to Spring Course Retention Within Subject
Fall‐to‐Spring 292/231 260/209 268/234 273/227 179/164
Fall‐to‐Spring Retention
79.1% 80.4% 87.3% 83.2% 91.6%
Annualized Course Success Rate
58.0% 56.6% 64.7% 67.7% 73.5%
Degrees and Certificates
Certificates 1 5 3 3 2
Associate Degrees 0 4 3 3 1
Total 1 9 6 6 3
The course data above reflect course TOP codes aligned with the program TOP codes. Students may enroll in
required associate or certificate courses within the program that fall outside of the program TOP codes. These
external TOP codes are not included in the above figures.
The enrollment in the Management program fluctuated over the last three years from 268 in 2014‐2015,
increasing to 273 in 2015‐2016, and dropping to 178 in 2016‐2017. The FTES dropped over the last three years
from 26 in 2014‐15 to 15 in 2016‐2017. The instructional load efficiency (WSCH/FTEF) dropped from 718.7 in
2015‐2016 to 510.3 in 2016‐2017. A value of 525 or higher is the standard average target and it is a measure of
average class enrollment needed for cost efficiency purposes.
Overall, with the fluctuating enrollment in the program, dropping number of FTES, has resulted in a dropping
award count of certificates and degrees. Over the past three years, awards dropped from 6 in 2014‐2015 to 27 in
3 in 2016‐2017.
Appendix 1 81

PROGRAM TITLE: Mariner COLLEGE: Orange Coast College
DATE: 2018 Biennial Program Review TOPS CODE:
0959.00: Marine Technology
CERTIFICATES AND DEGREES TOTAL: 2
CERTIFICATES DEGREES
Certificate of Achievement: Professional Mariner ‐ Level 1
Associate of Science: Professional Mariners
Orange Coast College offers 2 certificates and degrees under the Mariner Program. According to the Economic
Modeling Specialists International (EMSI), there were less than 10 job openings in 2016 associated with the Mariner Program. Overall, this program had so few openings in 2015 there is insufficient data on growth between 2016 and
2025.
The table below shows the projected openings and percentage changes within each occupation associated with the
program
1. PROGRAM MEETS A DOCUMENTED LABOR MARKET DEMAND: GROWTH IN MARKET Data based on TOP code crosswalk to applicable SOC Codes (53‐5031) Job openings based on Orange County Region as reported in EMSI: Occupation Overview Report
OCCUPATION EMSI Current Openings (2016)
EMSI Projected Openings (2025)
Change Between 2016‐2025 Job Openings
% Change
Ship Engineers (53‐5031) <10 16 Insf. Data Insf. Data
TOTAL <10 16 Insf. Data Insf. Data
The Mariner Program has had such low occupational employment that median earning data is insufficient.
Of the total 13 certificates awarded in 2016‐17, Orange Coast College awarded 69.23% of the certificates in the Mariner
program in the Orange County Region. Compared to 2015‐16, the number of awards by Orange Coast College increased
by 80.00%.
2. PROGRAM MEETS A DOCUMENTED LABOR MARKET DEMAND: PERCENTILE EARNINGS WITHIN MARKET Data based on TOP code crosswalk to applicable SOC Codes Percentile earnings based on Orange County Region as reported in EMSI: Occupation Overview Report
OCCUPATION 25th Percentile Earnings Median Earnings 75th Percentile Earnings
Ship Engineers (53‐5031) Insf. Data Insf. Data Insf. Data
PERCENTILE EARNING AVERAGE Insf. Data Insf. Data Insf. Data
3. PROGRAM DOES NOT REPRESENT UNNECESSARY DUPLICATION OF OTHER MANPOWER TRAINING PROGRAMS IN THE AREA:
Programs based on CIP Code (49.0399) Certificates and Associate’s degrees in Orange County Region as reported in EMSI: Program Overview
INSTITUTION Certificates Awarded
(2016‐2017)
Associate Degrees Awarded
(2016‐2017)
% Distribution of Total Certificate /Associate Degrees Awarded
EMSI Growth % Year over Year (YOY) (2015)
Orange Coast College 9 0 69.23% +80.00%
Saddleback College 4 0 30.77% +300.00%
Appendix 1 82
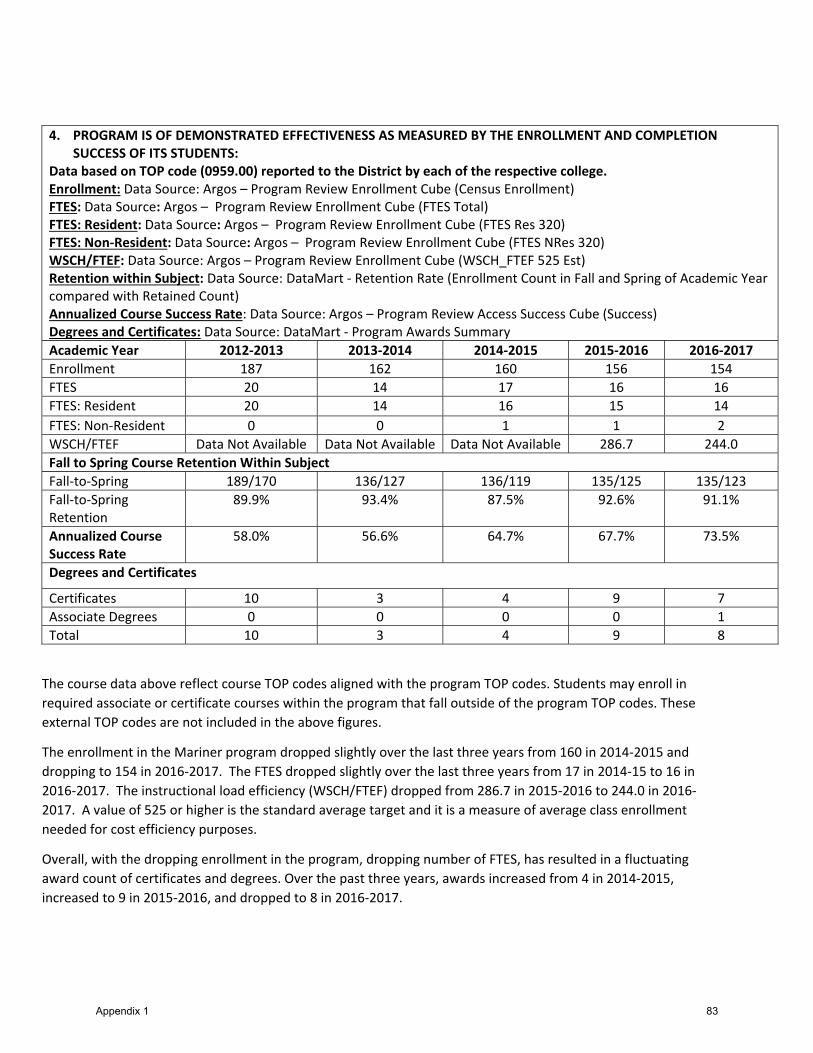
4. PROGRAM IS OF DEMONSTRATED EFFECTIVENESS AS MEASURED BY THE ENROLLMENT AND COMPLETION SUCCESS OF ITS STUDENTS:
Data based on TOP code (0959.00) reported to the District by each of the respective college. Enrollment: Data Source: Argos – Program Review Enrollment Cube (Census Enrollment) FTES: Data Source: Argos – Program Review Enrollment Cube (FTES Total) FTES: Resident: Data Source: Argos – Program Review Enrollment Cube (FTES Res 320) FTES: Non‐Resident: Data Source: Argos – Program Review Enrollment Cube (FTES NRes 320) WSCH/FTEF: Data Source: Argos – Program Review Enrollment Cube (WSCH_FTEF 525 Est) Retention within Subject: Data Source: DataMart ‐ Retention Rate (Enrollment Count in Fall and Spring of Academic Year compared with Retained Count) Annualized Course Success Rate: Data Source: Argos – Program Review Access Success Cube (Success) Degrees and Certificates: Data Source: DataMart ‐ Program Awards Summary
Academic Year 2012‐2013 2013‐2014 2014‐2015 2015‐2016 2016‐2017
Enrollment 187 162 160 156 154
FTES 20 14 17 16 16
FTES: Resident 20 14 16 15 14
FTES: Non‐Resident 0 0 1 1 2
WSCH/FTEF Data Not Available Data Not Available Data Not Available 286.7 244.0
Fall to Spring Course Retention Within Subject
Fall‐to‐Spring 189/170 136/127 136/119 135/125 135/123
Fall‐to‐Spring Retention
89.9% 93.4% 87.5% 92.6% 91.1%
Annualized Course Success Rate
58.0% 56.6% 64.7% 67.7% 73.5%
Degrees and Certificates
Certificates 10 3 4 9 7
Associate Degrees 0 0 0 0 1
Total 10 3 4 9 8
The course data above reflect course TOP codes aligned with the program TOP codes. Students may enroll in
required associate or certificate courses within the program that fall outside of the program TOP codes. These
external TOP codes are not included in the above figures.
The enrollment in the Mariner program dropped slightly over the last three years from 160 in 2014‐2015 and
dropping to 154 in 2016‐2017. The FTES dropped slightly over the last three years from 17 in 2014‐15 to 16 in
2016‐2017. The instructional load efficiency (WSCH/FTEF) dropped from 286.7 in 2015‐2016 to 244.0 in 2016‐
2017. A value of 525 or higher is the standard average target and it is a measure of average class enrollment
needed for cost efficiency purposes.
Overall, with the dropping enrollment in the program, dropping number of FTES, has resulted in a fluctuating
award count of certificates and degrees. Over the past three years, awards increased from 4 in 2014‐2015,
increased to 9 in 2015‐2016, and dropped to 8 in 2016‐2017.
Appendix 1 83

PROGRAM TITLE: Marketing COLLEGE: Orange Coast College
DATE: 2018 Biennial Program Review TOPS CODE:
0508.00: International Business and Trade
0509.00: Marketing and Distribution
0509.10: Advertising
0509.40: Sales and Salesmanship
CERTIFICATES AND DEGREES TOTAL: 8
CERTIFICATES DEGREES
Certificate of Achievement: Marketing: International Business
Certificate of Achievement: General Marketing
Certificate of Specialization: Marketing: International Business
Certificate of Specialization: Entry Level Marketing
Certificate of Specialization: Marketing: Advertising
Certificate of Specialization: Marketing: Sales
Associate of Science: Management & Leadership Study
Associate of Science: General Marketing
Orange Coast College offers 8 certificates and degrees under the Marketing Program. According to the Economic
Modeling Specialists International (EMSI), there were 100,189 job openings in 2016 associated with the Marketing Program. Overall, this program is expected to increase by 4.3% between 2016 and 2025, with the occupation of Sales
and Related Workers, All Other showing the greatest occupational growth at 10.9%, the program occupation expecting
the biggest drop is the First‐Line Supervisors of Non‐Retail Sales Workers projected to decrease at 1.5%.
The table below shows the projected openings and percentage changes within each occupation associated with the
program
Appendix 1 84

1. PROGRAM MEETS A DOCUMENTED LABOR MARKET DEMAND: GROWTH IN MARKET Data based on TOP code crosswalk to applicable SOC Codes (11‐1021, 11‐2011, 13‐1022, 13‐1023, 41‐1011, 41‐1012, 41‐2022, 41‐3011, 41‐3041, 41‐3099, 41‐4011, 41‐4012, and 41‐9099) Job openings based on Orange County Region as reported in EMSI: Occupation Overview Report
OCCUPATION EMSI Current Openings (2016)
EMSI Projected Openings (2025)
Change Between 2016‐2025 Job Openings
% Change
General and Operations Managers (11‐1021)
29,165 31,799 +2,634 +9.0%
Advertising and Promotions Managers (11‐2011)
395 411 +16 +4.1%
Wholesale and Retail Buyers, Except Farm Products (13‐1022)
1,934 1,998 +64 +3.3%
Purchasing Agents, Except Wholesale, Retail, and Farm Products (13‐1023)
4,368 4,504 +136 +3.1%
First‐Line Supervisors of Retail Sales Workers (41‐1011)
13,293 13,405 +112 +0.8%
First‐Line Supervisors of Non‐Retail Sales Workers (41‐1012)
5,368 5,288 ‐80 ‐1.5%
Advertising Sales Agents (41‐3011) 1,842 1,644 ‐198 ‐10.7%
Travel Agents (41‐3041) 1,831 1,892 +61 +3.3%
Sales Representatives, Services, All Other (41‐3099)
14,622 15,677 +1,055 +7.2%
Sales Representatives, Wholesale and Manufacturing, Technical and Scientific Products (41‐4011)
8,338 8,324 ‐14 ‐0.2%
Sales Representatives, Wholesale and Manufacturing, Except Technical and Scientific Products (41‐4012)
17,403 17,754 +351 +2.0%
Sales and Related Workers, All Other (41‐9099)
1,630 1,807 +177 +10.9%
TOTAL 100,189 104,504 +4,314 +4.3%
The General and Operations Managers occupation within the Marketing Program shows the greatest median earnings of
$57.62/hour, First‐Line Supervisors of Retail Sales Workers show the lowest median earnings of $16.27/hour.
Appendix 1 85
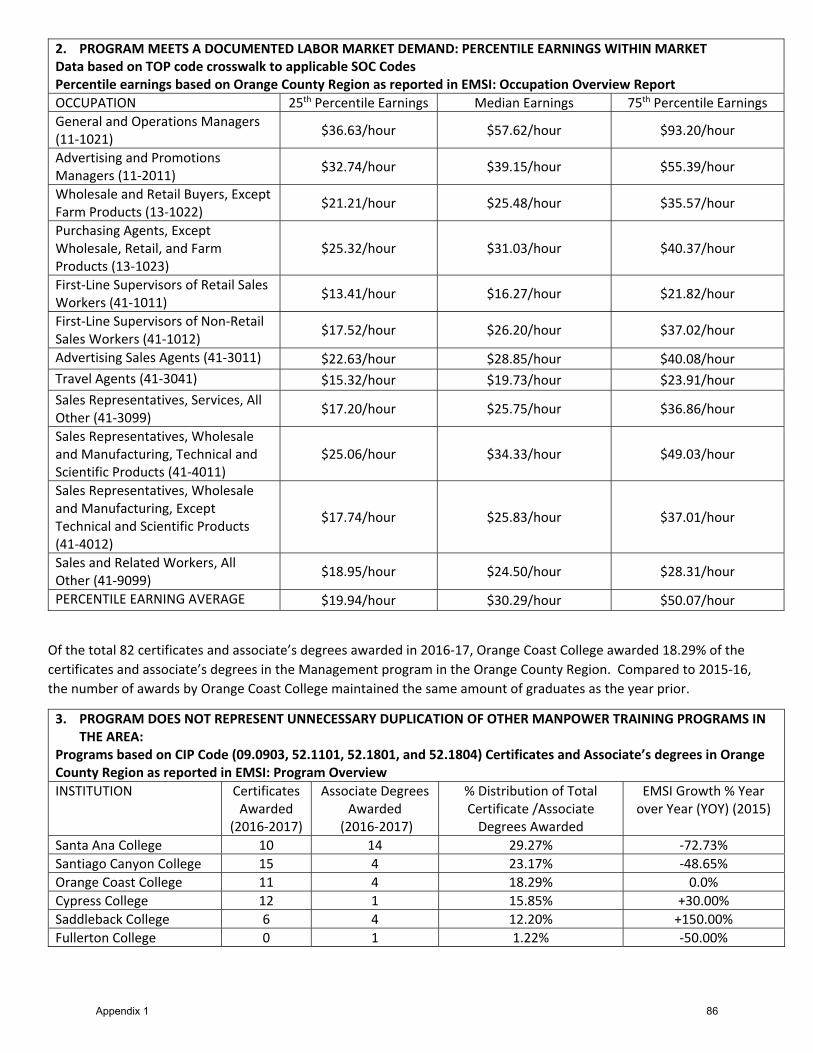
Of the total 82 certificates and associate’s degrees awarded in 2016‐17, Orange Coast College awarded 18.29% of the
certificates and associate’s degrees in the Management program in the Orange County Region. Compared to 2015‐16,
the number of awards by Orange Coast College maintained the same amount of graduates as the year prior.
2. PROGRAM MEETS A DOCUMENTED LABOR MARKET DEMAND: PERCENTILE EARNINGS WITHIN MARKET Data based on TOP code crosswalk to applicable SOC Codes Percentile earnings based on Orange County Region as reported in EMSI: Occupation Overview Report
OCCUPATION 25th Percentile Earnings Median Earnings 75th Percentile Earnings
General and Operations Managers (11‐1021)
$36.63/hour $57.62/hour $93.20/hour
Advertising and Promotions Managers (11‐2011)
$32.74/hour $39.15/hour $55.39/hour
Wholesale and Retail Buyers, Except Farm Products (13‐1022)
$21.21/hour $25.48/hour $35.57/hour
Purchasing Agents, Except Wholesale, Retail, and Farm Products (13‐1023)
$25.32/hour $31.03/hour $40.37/hour
First‐Line Supervisors of Retail Sales Workers (41‐1011)
$13.41/hour $16.27/hour $21.82/hour
First‐Line Supervisors of Non‐Retail Sales Workers (41‐1012)
$17.52/hour $26.20/hour $37.02/hour
Advertising Sales Agents (41‐3011) $22.63/hour $28.85/hour $40.08/hour
Travel Agents (41‐3041) $15.32/hour $19.73/hour $23.91/hour
Sales Representatives, Services, All Other (41‐3099)
$17.20/hour $25.75/hour $36.86/hour
Sales Representatives, Wholesale and Manufacturing, Technical and Scientific Products (41‐4011)
$25.06/hour $34.33/hour $49.03/hour
Sales Representatives, Wholesale and Manufacturing, Except Technical and Scientific Products (41‐4012)
$17.74/hour $25.83/hour $37.01/hour
Sales and Related Workers, All Other (41‐9099)
$18.95/hour $24.50/hour $28.31/hour
PERCENTILE EARNING AVERAGE $19.94/hour $30.29/hour $50.07/hour
3. PROGRAM DOES NOT REPRESENT UNNECESSARY DUPLICATION OF OTHER MANPOWER TRAINING PROGRAMS IN THE AREA:
Programs based on CIP Code (09.0903, 52.1101, 52.1801, and 52.1804) Certificates and Associate’s degrees in Orange County Region as reported in EMSI: Program Overview
INSTITUTION Certificates Awarded
(2016‐2017)
Associate Degrees Awarded
(2016‐2017)
% Distribution of Total Certificate /Associate Degrees Awarded
EMSI Growth % Year over Year (YOY) (2015)
Santa Ana College 10 14 29.27% ‐72.73%
Santiago Canyon College 15 4 23.17% ‐48.65%
Orange Coast College 11 4 18.29% 0.0%
Cypress College 12 1 15.85% +30.00%
Saddleback College 6 4 12.20% +150.00%
Fullerton College 0 1 1.22% ‐50.00%
Appendix 1 86
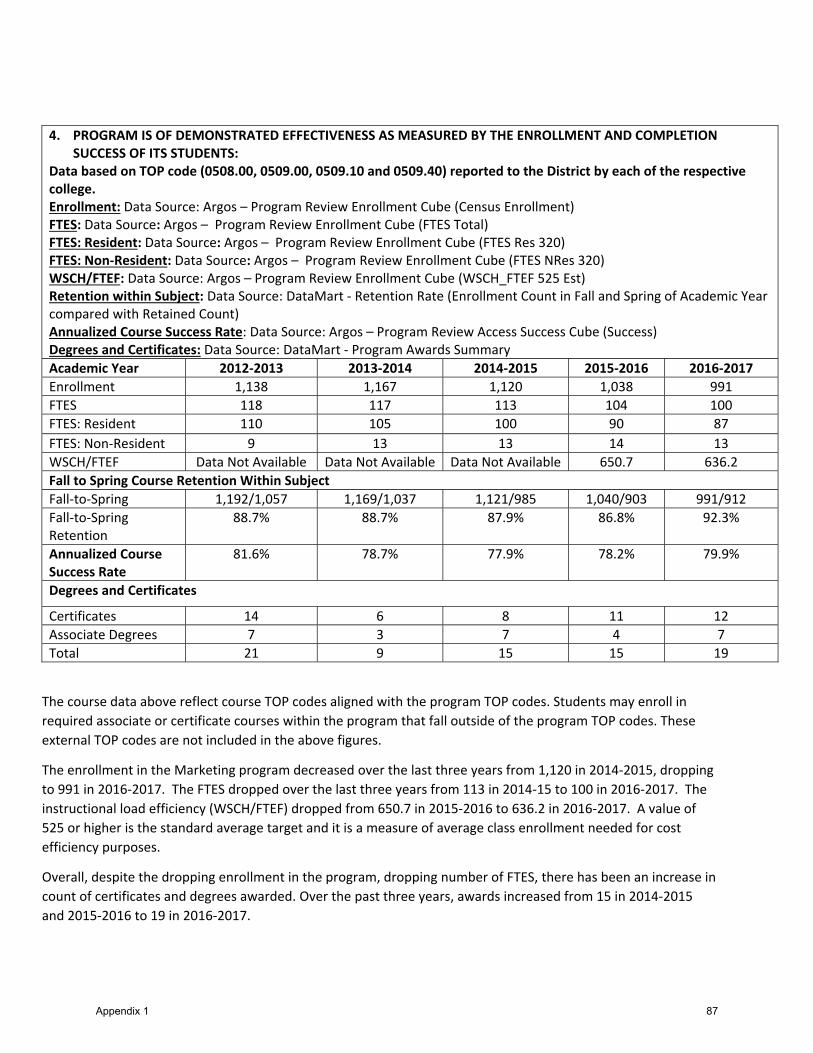
4. PROGRAM IS OF DEMONSTRATED EFFECTIVENESS AS MEASURED BY THE ENROLLMENT AND COMPLETION SUCCESS OF ITS STUDENTS:
Data based on TOP code (0508.00, 0509.00, 0509.10 and 0509.40) reported to the District by each of the respective college. Enrollment: Data Source: Argos – Program Review Enrollment Cube (Census Enrollment) FTES: Data Source: Argos – Program Review Enrollment Cube (FTES Total) FTES: Resident: Data Source: Argos – Program Review Enrollment Cube (FTES Res 320) FTES: Non‐Resident: Data Source: Argos – Program Review Enrollment Cube (FTES NRes 320) WSCH/FTEF: Data Source: Argos – Program Review Enrollment Cube (WSCH_FTEF 525 Est) Retention within Subject: Data Source: DataMart ‐ Retention Rate (Enrollment Count in Fall and Spring of Academic Year compared with Retained Count) Annualized Course Success Rate: Data Source: Argos – Program Review Access Success Cube (Success) Degrees and Certificates: Data Source: DataMart ‐ Program Awards Summary
Academic Year 2012‐2013 2013‐2014 2014‐2015 2015‐2016 2016‐2017
Enrollment 1,138 1,167 1,120 1,038 991
FTES 118 117 113 104 100
FTES: Resident 110 105 100 90 87
FTES: Non‐Resident 9 13 13 14 13
WSCH/FTEF Data Not Available Data Not Available Data Not Available 650.7 636.2
Fall to Spring Course Retention Within Subject
Fall‐to‐Spring 1,192/1,057 1,169/1,037 1,121/985 1,040/903 991/912
Fall‐to‐Spring Retention
88.7% 88.7% 87.9% 86.8% 92.3%
Annualized Course Success Rate
81.6% 78.7% 77.9% 78.2% 79.9%
Degrees and Certificates
Certificates 14 6 8 11 12
Associate Degrees 7 3 7 4 7
Total 21 9 15 15 19
The course data above reflect course TOP codes aligned with the program TOP codes. Students may enroll in
required associate or certificate courses within the program that fall outside of the program TOP codes. These
external TOP codes are not included in the above figures.
The enrollment in the Marketing program decreased over the last three years from 1,120 in 2014‐2015, dropping
to 991 in 2016‐2017. The FTES dropped over the last three years from 113 in 2014‐15 to 100 in 2016‐2017. The
instructional load efficiency (WSCH/FTEF) dropped from 650.7 in 2015‐2016 to 636.2 in 2016‐2017. A value of
525 or higher is the standard average target and it is a measure of average class enrollment needed for cost
efficiency purposes.
Overall, despite the dropping enrollment in the program, dropping number of FTES, there has been an increase in
count of certificates and degrees awarded. Over the past three years, awards increased from 15 in 2014‐2015
and 2015‐2016 to 19 in 2016‐2017.
Appendix 1 87

PROGRAM TITLE: Polysomnographic Technology COLLEGE: Orange Coast College
DATE: 2018 Biennial Program Review TOPS CODE:
1211.00: Polysomnographic Technology
CERTIFICATES AND DEGREES TOTAL: 1
CERTIFICATES DEGREES
Not Applicable Associate of Science: Polysomnography
Orange Coast College offers 1 degree under the Polysomnographic Technology Program. According to the Economic
Modeling Specialists International (EMSI), there were 2,000 job openings in 2016 associated with the
Polysomnographic Technology Program. Overall, this program is expected to increase by 35.5% between 2016 and
2025, with the sole associated occupation of Health Technologists and Technicians, All Other showing the same growth
projections.
The table below shows the projected openings and percentage changes within each occupation associated with the
program
1. PROGRAM MEETS A DOCUMENTED LABOR MARKET DEMAND: GROWTH IN MARKET Data based on TOP code crosswalk to applicable SOC Codes (29‐2099) Job openings based on Orange County Region as reported in EMSI: Occupation Overview Report
OCCUPATION EMSI Current Openings (2016)
EMSI Projected Openings (2025)
Change Between 2016‐2025 Job Openings
% Change
Health Technologists and Technicians, All Other (29‐2099)
2,000 2,710 +710 +35.5%
TOTAL 2,000 2,710 +710 +35.5%
The Health Technologists and Technicians, All Other within the Polysomnographic Technology shows a median
earnings of $19.50/hour.
Of the total 18 certificates awarded in 2016‐17, Orange Coast College awarded 5.88% of the certificates in the
Polysomnographic Technology program in the Orange County Region. Compared to 2015‐16, the number of awards
by Orange Coast College decrease by 90.00%.
2. PROGRAM MEETS A DOCUMENTED LABOR MARKET DEMAND: PERCENTILE EARNINGS WITHIN MARKET Data based on TOP code crosswalk to applicable SOC Codes Percentile earnings based on Orange County Region as reported in EMSI: Occupation Overview Report
OCCUPATION 25th Percentile Earnings Median Earnings 75th Percentile Earnings
Health Technologists and Technicians, All Other (29‐2099)
$16.48/hour $19.50/hour $25.97/hour
PERCENTILE EARNING AVERAGE $16.48/hour $19.50/hour $25.97/hour
Appendix 1 88

3. PROGRAM DOES NOT REPRESENT UNNECESSARY DUPLICATION OF OTHER MANPOWER TRAINING PROGRAMS IN THE AREA:
Programs based on CIP Code (51.1004) Certificates and Associate’s degrees in Orange County Region as reported in EMSI: Program Overview
INSTITUTION Certificates Awarded
(2016‐2017)
Associate Degrees Awarded
(2016‐2017)
% Distribution of Total Certificate /Associate Degrees Awarded
EMSI Growth % Year over Year (YOY) (2015)
Saddleback College 11 6 94.44% +21.43%
Orange Coast College 0 1 5.88% ‐90.00%
Appendix 1 89

4. PROGRAM IS OF DEMONSTRATED EFFECTIVENESS AS MEASURED BY THE ENROLLMENT AND COMPLETION SUCCESS OF ITS STUDENTS:
Data based on TOP code (1211.00) reported to the District by each of the respective college. Enrollment: Data Source: Argos – Program Review Enrollment Cube (Census Enrollment) FTES: Data Source: Argos – Program Review Enrollment Cube (FTES Total) FTES: Resident: Data Source: Argos – Program Review Enrollment Cube (FTES Res 320) FTES: Non‐Resident: Data Source: Argos – Program Review Enrollment Cube (FTES NRes 320) WSCH/FTEF: Data Source: Argos – Program Review Enrollment Cube (WSCH_FTEF 525 Est) Retention within Subject: Data Source: DataMart ‐ Retention Rate (Enrollment Count in Fall and Spring of Academic Year compared with Retained Count) Annualized Course Success Rate: Data Source: Argos – Program Review Access Success Cube (Success) Degrees and Certificates: Data Source: DataMart ‐ Program Awards Summary
Academic Year 2012‐2013 2013‐2014 2014‐2015 2015‐2016 2016‐2017
Enrollment 216 57 148 43 203
FTES 25 2 17 2 23
FTES: Resident 25 2 17 2 23
FTES: Non‐Resident 0 0 0 0 0
WSCH/FTEF Data Not Available Data Not Available Data Not Available 452.1 509.5
Fall to Spring Course Retention Within Subject
Fall‐to‐Spring 217/217 57/57 147/144 44/44 202/202
Fall‐to‐Spring Retention
100.0% 100.0% 98.0% 100.0% 100.0%
Annualized Course Success Rate
99.1% 100.0% 97.3% 97.7% 100.0%
Degrees and Certificates
Certificates NA NA NA NA NA
Associate Degrees 15 3 10 1 16
Total 15 3 10 1 16
The course data above reflect course TOP codes aligned with the program TOP codes. Students may enroll in
required associate or certificate courses within the program that fall outside of the program TOP codes. These
external TOP codes are not included in the above figures.
The enrollment in the Polysomnographic Technology program fluctuated over the last three years from 148 in
2014‐2015, dropping to 43 in 2015‐2016, and increasing to 203 in 2016‐2017. The FTES fluctuated over the last
three years from 17 in 2014‐15, dropping to 2 in 2015‐2016, and increasing to 23 in 2016‐2017. The instructional
load efficiency (WSCH/FTEF) increased from 452.1 in 2015‐2016 to 509.5 in 2016‐2017. A value of 525 or higher
is the standard average target and it is a measure of average class enrollment needed for cost efficiency
purposes.
Overall, with the fluctuating enrollment in the program, fluctuating number of FTES, has resulted in a fluctuating
award count of degrees. Over the past three years, awards dropped from 10 in 2014‐2015 to 1in 2015‐2016, and
increased to 16 in 2016‐2017.
Appendix 1 90

PROGRAM TITLE: Radiologic Technology COLLEGE: Orange Coast College
DATE: 2018 Biennial Program Review TOPS CODE:
1225.00: Radiologic Technology
CERTIFICATES AND DEGREES TOTAL: 1
CERTIFICATES DEGREES
Not Applicable Associate of Science: Radiologic Tech: Diagnostic
Orange Coast College offers 1 degree under the Radiologic Technology Program. According to the Economic Modeling
Specialists International (EMSI), there were 1,279 openings in 2016 associated with the Radiologic Technology Program. Overall, this program is expected to increase by 15.9% between 2016 and 2025, with the sole associated
occupation of Radiologic Technologists.
The table below shows the projected openings and percentage changes within each occupation associated with the
program
1. PROGRAM MEETS A DOCUMENTED LABOR MARKET DEMAND: GROWTH IN MARKET Data based on TOP code crosswalk to applicable SOC Codes (29‐2034) Job openings based on Orange County Region as reported in EMSI: Occupation Overview Report
OCCUPATION EMSI Current Openings (2016)
EMSI Projected Openings (2025)
Change Between 2016‐2025 Job Openings
% Change
Radiologic Technologists (29‐2034) 1,279 1,483 +204 +15.9%
TOTAL 1,279 1,483 +204 +15.9%
The Radiologic Technologists within the Radiologic Technology shows a median earnings of $33.21/hour.
Of the total 122 certificates awarded in 2016‐17, Orange Coast College awarded 18.85% of the certificates and associate
degrees in the Radiologic Technology program in the Orange County Region. Compared to 2015‐16, the number of
awards by Orange Coast College increase by 35.29%.
2. PROGRAM MEETS A DOCUMENTED LABOR MARKET DEMAND: PERCENTILE EARNINGS WITHIN MARKET Data based on TOP code crosswalk to applicable SOC Codes Percentile earnings based on Orange County Region as reported in EMSI: Occupation Overview Report
OCCUPATION 25th Percentile Earnings Median Earnings 75th Percentile Earnings
Radiologic Technologists (29‐2034) $22.62/hour $33.21/hour $43.29/hour
PERCENTILE EARNING AVERAGE $22.62/hour $33.21/hour $43.29/hour
Appendix 1 91

3. PROGRAM DOES NOT REPRESENT UNNECESSARY DUPLICATION OF OTHER MANPOWER TRAINING PROGRAMS IN THE AREA:
Programs based on CIP Code (51.0911) Certificates and Associate’s degrees in Orange County Region as reported in EMSI: Program Overview
INSTITUTION Certificates Awarded
(2016‐2017)
Associate Degrees Awarded
(2016‐2017)
% Distribution of Total Certificate /Associate Degrees Awarded
EMSI Growth % Year over Year (YOY) (2015)
Cypress College 26 27 43.44% ‐19.70%
Modern Technology School
46 0 37.70% ‐23.33%
Orange Coast College 0 23 18.85% +35.29%
Appendix 1 92

4. PROGRAM IS OF DEMONSTRATED EFFECTIVENESS AS MEASURED BY THE ENROLLMENT AND COMPLETION SUCCESS OF ITS STUDENTS:
Data based on TOP code (1225.00) reported to the District by each of the respective college. Enrollment: Data Source: Argos – Program Review Enrollment Cube (Census Enrollment) FTES: Data Source: Argos – Program Review Enrollment Cube (FTES Total) FTES: Resident: Data Source: Argos – Program Review Enrollment Cube (FTES Res 320) FTES: Non‐Resident: Data Source: Argos – Program Review Enrollment Cube (FTES NRes 320) WSCH/FTEF: Data Source: Argos – Program Review Enrollment Cube (WSCH_FTEF 525 Est) Retention within Subject: Data Source: DataMart ‐ Retention Rate (Enrollment Count in Fall and Spring of Academic Year compared with Retained Count) Annualized Course Success Rate: Data Source: Argos – Program Review Access Success Cube (Success) Degrees and Certificates: Data Source: DataMart ‐ Program Awards Summary
Academic Year 2012‐2013 2013‐2014 2014‐2015 2015‐2016 2016‐2017
Enrollment 597 596 560 596 681
FTES 115 117 108 116 122
FTES: Resident 115 117 108 116 122
FTES: Non‐Resident 0 0 0 0 0
WSCH/FTEF Data Not Available Data Not Available Data Not Available 544.2 529.1
Fall to Spring Course Retention Within Subject
Fall‐to‐Spring 429/418 425/417 399/390 431/414 504/491
Fall‐to‐Spring Retention
97.4% 98.1% 97.7% 96.1% 97.4%
Annualized Course Success Rate
96.4% 95.8% 96.4% 94.2% 90.9%
Degrees and Certificates
Certificates 0 0 0 0 0
Associate Degrees 19 23 17 23 22
Total 19 23 17 23 22
The course data above reflect course TOP codes aligned with the program TOP codes. Students may enroll in
required associate or certificate courses within the program that fall outside of the program TOP codes. These
external TOP codes are not included in the above figures.
The enrollment in the Radiologic Technology program increased over the last three years from 560 in 2014‐
2015 to 681 in 2016‐2017. The FTES also increased over the last three years from 108 in 2014‐15 to 122 in 2016‐
2017. The instructional load efficiency (WSCH/FTEF) decreased from 544.2 in 2015‐2016 to 529.1 in 2016‐2017.
A value of 525 or higher is the standard average target and it is a measure of average class enrollment needed for
cost efficiency purposes.
Overall, the increased enrollment in the program, increased number of FTES, there has been a fluctuation of
award count of degrees. Over the past three years, awards increased from 17 in 2014‐2015 to 23 in 2015‐2016,
and decreased to 22 in 2016‐2017.
Appendix 1 93

PROGRAM TITLE: Real Estate COLLEGE: Orange Coast College
DATE: 2018 Biennial Program Review TOPS CODE:
0511.00: Real Estate
CERTIFICATES AND DEGREES TOTAL: 3
CERTIFICATES DEGREES
Certificate of Achievement: Real Estate Broker Certificate of Achievement: Real Estate Achievement
Associate of Science: Real Estate Broker
Orange Coast College offers 3 certificates and degrees under the Real Estate Program. According to the Economic
Modeling Specialists International (EMSI), there were 16,322 job openings in 2016 associated with the Real Estate Program. Overall, this program is expected to increase by 3.1% between 2016 and 2025, with the occupation of
Property, Real Estate, and Community Association Managers showing the greatest occupational growth at 7.2%, the
program occupation expecting the smallest growth is the Real Estate Sales Agents projected to increase at 1.0%.
The table below shows the projected openings and percentage changes within each occupation associated with the
program
1. PROGRAM MEETS A DOCUMENTED LABOR MARKET DEMAND: GROWTH IN MARKET Data based on TOP code crosswalk to applicable SOC Codes (11‐9141, 13‐2021, 41‐9021, and 41‐9022) Job openings based on Orange County Region as reported in EMSI: Occupation Overview Report
OCCUPATION EMSI Current Openings (2016)
EMSI Projected Openings (2025)
Change Between 2016‐2025 Job Openings
% Change
Property, Real Estate, and Community Association Managers (11‐9141)
5,494 5,887 +393 +7.2%
Appraisers and Assessors of Real Estate (13‐2021)
1,055 1,073 +18 +1.7%
Real Estate Broker (41‐9021) 2,464 2,492 +28 +1.1%
Real Estate Sales Agents (41‐9022) 7,308 7,382 +74 +1.0%
TOTAL 16,322 16,833 +511 +3.1%
The Property, Real Estate, and Community Association Managers occupation within the Real Estate Program shows the
greatest median earnings of $25.56/hour Real Estate Sales Agents show the lowest median earnings of $19.24/hour.
Appendix 1 94

Of the total 43 certificates and associate’s degrees awarded in 2016‐17, Orange Coast College awarded 9.3% of the
certificates and associate’s degrees in the Real Estate program in the Orange County Region. Compared to 2015‐16, the
number of awards by Orange Coast College increased by 400%.
2. PROGRAM MEETS A DOCUMENTED LABOR MARKET DEMAND: PERCENTILE EARNINGS WITHIN MARKET Data based on TOP code crosswalk to applicable SOC Codes Percentile earnings based on Orange County Region as reported in EMSI: Occupation Overview Report
OCCUPATION 25th Percentile Earnings Median Earnings 75th Percentile Earnings
Property, Real Estate, and Community Association Managers (11‐9141)
$20.02/hour $25.56/hour $38.50/hour
Appraisers and Assessors of Real Estate (13‐2021)
$21.97/hour $25.52/hour $38.39/hour
Real Estate Broker (41‐9021) $21.60/hour $25.33/hour $29.55/hour
Real Estate Sales Agents (41‐9022) $17.87/hour $19.24/hour $22.46/hour
PERCENTILE EARNING AVERAGE $18.49/hour $21.94/hour $30.68/hour
3. PROGRAM DOES NOT REPRESENT UNNECESSARY DUPLICATION OF OTHER MANPOWER TRAINING PROGRAMS IN THE AREA:
Programs based on CIP Code (52.1501) Certificates and Associate’s degrees in Orange County Region as reported in EMSI: Program Overview
INSTITUTION Certificates Awarded
(2016‐2017)
Associate Degrees Awarded
(2016‐2017)
% Distribution of Total Certificate /Associate Degrees Awarded
EMSI Growth % Year over Year (YOY) (2015)
Irvine Valley College 12 3 34.88% ‐6.25%
Saddleback College 10 5 34.88% ‐16.67%
Coastline Community College
4 0 9.30% ‐42.88%
Orange Coast College 2 2 9.30% +400.00%
Santiago Canyon College 1 2 6.98% +300.00%
Fullerton College 0 1 2.32% +10.00%
Allied American University 1 0 2.32% ‐85.71%
Appendix 1 95

4. PROGRAM IS OF DEMONSTRATED EFFECTIVENESS AS MEASURED BY THE ENROLLMENT AND COMPLETION SUCCESS OF ITS STUDENTS:
Data based on TOP code (0511.00) reported to the District by each of the respective college. Enrollment: Data Source: Argos – Program Review Enrollment Cube (Census Enrollment) FTES: Data Source: Argos – Program Review Enrollment Cube (FTES Total) FTES: Resident: Data Source: Argos – Program Review Enrollment Cube (FTES Res 320) FTES: Non‐Resident: Data Source: Argos – Program Review Enrollment Cube (FTES NRes 320) WSCH/FTEF: Data Source: Argos – Program Review Enrollment Cube (WSCH_FTEF 525 Est) Retention within Subject: Data Source: DataMart ‐ Retention Rate (Enrollment Count in Fall and Spring of Academic Year compared with Retained Count) Annualized Course Success Rate: Data Source: Argos – Program Review Access Success Cube (Success) Degrees and Certificates: Data Source: DataMart ‐ Program Awards Summary
Academic Year 2012‐2013 2013‐2014 2014‐2015 2015‐2016 2016‐2017
Enrollment 457 466 453 473 557
FTES 43 44 42 44 52
FTES: Resident 42 42 41 42 50
FTES: Non‐Resident 1 1 2 2 2
WSCH/FTEF Data Not Available Data Not Available Data Not Available 663.6 601.4
Fall to Spring Course Retention Within Subject
Fall‐to‐Spring 458/405 467/418 453/408 474/426 465/435
Fall‐to‐Spring Retention
88.4% 89.5% 90.1% 89.8% 93.5%
Annualized Course Success Rate
77.6% 76.4% 77.0% 79.3% 82.4%
Degrees and Certificates
Certificates 3 2 0 2 4
Associate Degrees 2 0 0 2 3
Total 5 2 0 4 7
The course data above reflect course TOP codes aligned with the program TOP codes. Students may enroll in
required associate or certificate courses within the program that fall outside of the program TOP codes. These
external TOP codes are not included in the above figures.
The enrollment in the Real Estate program increased over the last three years from 453 in 2014‐2015, increasing
to 557 in 2016‐2017. The FTES also increased over the last three years from 42 in 2014‐15 to 52 in 2016‐2017.
The instructional load efficiency (WSCH/FTEF) dropped from 663.6 in 2015‐2016 to 601.4 in 2016‐2017. A value
of 525 or higher is the standard average target and it is a measure of average class enrollment needed for cost
efficiency purposes.
Overall, the increasing enrollment in the program, increasing number of FTES, has led to an increase in count of
certificates and degrees awarded. Over the past three years, awards increased from 0 in 2014‐2015 and 2015‐
2016 to 7 in 2016‐2017.
Appendix 1 96