coal information 2012 edition - beyond 20/20 wdswds.iea.org/wds/pdf/documentation for coal...
TRANSCRIPT

COAL INFORMATION (2012 edition) - 1
COAL INFORMATION
2012 EDITION
DOCUMENTATION FOR BEYOND 2020 FILES


COAL INFORMATION (2012 edition) - 3
TABLE OF CONTENTS
1. List of electronic tables .................................................................................. 5 2. Product definitions ......................................................................................... 7 3. Flow definitions – Statistics ......................................................................... 11 4. Flow definitions – Balances ......................................................................... 21 5. Flow definitions – Calorific values .............................................................. 31 6. Geographical coverage ................................................................................ 33 7. Introduction ................................................................................................... 43 8. Definitions ..................................................................................................... 45 Energy sources ...................................................................................... 45 Flows: energy balance ........................................................................... 48 Units and conversions ............................................................................ 50 9. Sources and notes ........................................................................................ 51 General notes ......................................................................................... 51 Price data ............................................................................................... 51 Quarterly energy statistics ...................................................................... 55 Data sources .......................................................................................... 55 10. Country notes ............................................................................................... 57 11. Geographical coverage ................................................................................ 65 12. Abbreviations, conversion factors and calorific values ............................ 67


COAL INFORMATION (2012 edition) - 5
1. LIST OF ELECTRONIC TABLES Data for all available years are provided here, gener-ally from 1960 to 2011 for OECD countries, 1971 to 2011 for non-OECD countries and 1978-2011 for OECD Imports and Exports to partner countries. Data for some products began in 1978. Some data is re-leased for 2011 in July 2012 and should be considered preliminary.
Coal World Supply.ivt
In this table, statistics for different types of coal and coal products, including manufactured gases are shown. These products are: anthracite, coking coal, other bituminous coal, sub-bituminous coal, lignite, peat, patent fuel, coke oven coke, gas coke, coal tar, BKB/peat briquettes, gas works gas, coke oven gas, blast furnace gas and oxygen steel furnace gas. The aggregates hard coal, brown coal and steam coal are also included. This table provides reference statistics of coal such as indigenous production, imports, ex-ports and primary energy supply, based in kilotonnes for solid fuel and TJ for gases for OECD and Non-OECD countries.
Coal Imports.ivt
This table presents detailed coal import data by coun-try of origin for OECD member states for the follow-ing coal products and aggregates: anthracite, coking-coal, sub-bituminous coal, lignite, patent fuel, coke
oven coke, coal tar, BKB/peat briquettes, hard coal, brown coal, and steam coal. The data is reported in kilotonnes.
Coal Exports.ivt
This table presents detailed coal export data by coun-try of destination for OECD member states for the following coal products and aggregates: anthracite, coking coal, sub-bituminous coal, lignite, patent fuel, coke oven coke, coal tar, BKB/peat briquettes, hard coal, brown coal and steam coal. The data is reported in kilotonnes.
Coal Statistics OECD.ivt
In this table, statistics for different types of coal and coal products, including manufactured gases are shown. These products are: anthracite, coking coal, other bituminous coal, sub-bituminous coal, lignite, peat, patent fuel, coke oven coke, gas coke, coal tar, BKB/peat briquettes, gas works gas, coke oven gas, blast furnace gas and oxygen steel furnace gas. The aggregates hard coal, brown coal and steamcoal are also included. This table provides full supply and con-sumption data of coal such as primary energy supply, transformation sector, energy sector and final con-sumption based in kilotonnes for OECD countries and OECD country aggregate groups.
World coal supply:
OECD coal imports:
OECD coal exports:
OECD coal statistics:

6 - COAL INFORMATION (2012 edition)
INTERNATIONAL ENERGY AGENCY
Coal Balance OECD.ivt
In this table, a balance for different types of coal and coal products, including manufactured gases is shown. These products are: anthracite, coking coal, other bi-tuminous coal, sub-bituminous coal, lignite, peat, pat-ent fuel, coke oven coke, gas coke, coal tar, BKB/peat briquettes, gas works gas, coke oven gas, blast furnace gas and oxygen steel furnace gas. The aggregates hard coal, brown coal and steam coal are also included, as is a product coal which includes all primary coal types, and all derived coal products. This table pro-vides full balance data such as primary energy supply, transformation sector and final consumption based in kilotonnes of coal equivalent (7,000 Gigacalories) for OECD countries and OECD country aggregate groups. Other units are selectable and they
include kilotonnes of oil equivalent (10,000 Gi-gacalories), Terajoules and Teracalories.
Coal NCV OECD.ivt
In this table, calorific values for different types of coal and coal products are shown on a country by country basis. These products are: anthracite, coking coal, other bituminous coal, sub-bituminous coal, lignite, peat, patent fuel, coke oven coke, gas coke, coal tar and BKB/peat briquettes. The aggregates hard coal and brown coal are included for years prior to 1978 only. This table provides the calorific values used to convert raw tonnes of coal and coal products into en-ergy for the OECD Coal Balance data. It is shown in Megajoules per tonne for OECD countries.
OECD coal balances:
OECD coal calorific values:

COAL INFORMATION (2012 edition) - 7
2. PRODUCT DEFINITIONSCoal Coal is a family name for a variety of solid organic fuels and refers to a whole range of combustible sedimentary rock materials spanning a continuous quality scale. For convenience, this continuous series is often divided into two main categories, which are themselves divided into two subcategories:
• Hard coal • Anthracite • Bituminous coal
- Coking coal - Other bituminous coal
• Brown coal • Sub-bituminous coal • Lignite
In cases where data are presented in Mtoe or Mtce in this book and sourced to OECD/IEA Energy Balances, the term “Coal” includes all primary coal types listed above, peat, and coal products (patent fuel, coke oven coke, gas coke, coal tar, BKB, coke oven gas, gas works gas, blast furnace gas, and oxygen steel furnace gas).
Classifying different types of coal into practical cate-gories for use at an international level is difficult for two reasons:
Divisions between coal categories vary between clas-sification systems, both national and international, based on calorific value, volatile matter content, fixed carbon content, caking and coking properties, or some combination of two or more of these criteria.
Although the relative value of the coals within a par-ticular category depends on the degree of dilution by moisture and ash and contamination by sulphur, chlorine, phosphorous and certain trace elements, these factors do not affect the divisions between categories.
Coal quality can vary and it is not always possible to ensure that the available descriptive and analytical information is truly representative of the body of coal to which it refers.
The International Coal Classification of the Economic Commission for Europe (UNECE) recognises two broad categories of coal:
i) Hard coal - Coal of gross calorific value not less than 5 700 kcal/kg (23.9 GJ/t) on an ash-free but moist basis and with a mean random reflectance of vitrinite of at least 0.6.
ii) Brown coal - Non-agglomerating coal with a gross calorific value less than 5 700 kcal/kg (23.9 GJ/t) containing more than 31% volatile matter on a dry mineral matter free basis.
The IEA has adopted the basis of these definitions of hard coal and brown coal in this book and in other publications for presenting statistics relating to coal production, trade and consumption.
It should be stressed that this classification system is based on the inherent qualities of the coal in question and not on the final use of the coal. In this way the classification system attempts to be objective and simple to apply.
Primary coal used in pulverised (or granular) coal injection in blast furnaces is commonly abbreviated to PCI (or GCI) coal. (In this book PCI includes GCI). The IEA does not have a separate category for PCI as the term defines a particular end-use for coal. In IEA statistics, PCI is included in steam coal, except for Japan and Korea, where it is included with coking coal.
Data presented in this book may be different from that presented in the national publications of individual countries because the countries may have adopted a different coal classification and reporting system that better suits their particular national needs. As far as

8 - COAL INFORMATION (2012 edition)
INTERNATIONAL ENERGY AGENCY
possible, national coal statistics reported by the IEA in this book and in other publications have been adjusted to be consistent with the IEA definitions noted above.
Furthermore, in order to improve the information base for coal market analysis and projections, these two categories of coal have been further sub-divided in IEA/OECD Coal Statistics from 1978 as follows:
Hard coal Hard coal is calculated as the sum of anthracite and bituminous coals.
• Anthracite is a high-rank, hard coal used mainly for industrial and residential heat raising.
• Bituminous coal is a medium-rank coal used for gasification, industrial coking and heat raising and residential heat raising. Bituminous coal that can be used in the production of a coke capable of supporting a blast furnace charge is known as cok-ing coal.
• Other bituminous coal, not included under coking coal, is also commonly known as thermal coal. Also included are recovered slurries, middlings and other low-grade, higher-rank coal products not further classified by type.
Note that for the following countries, hard coal also includes sub-bituminous coal: Australia, Belgium, Chile, Finland, France, Iceland, Japan, Korea, Mex-ico, New Zealand, Portugal and the United States.
Except for these 12 countries, steam coal for all other countries in the world is equivalent to the sum of an-thracite and other bituminous coal.
Brown coal Brown coal is calculated as the sum of sub-bituminous coal and lignite. Oil shale mined and combusted directly is also currently reported as lig-nite. (Shale oil is reported as other hydrocarbons.)
• Sub-bituminous coal: non-agglomerating coals with a gross calorific value between 4 165 kcal/kg (17.4 GJ/t) and 5 700 kcal/kg (23.9 GJ/t) on an ash-free but moist basis.
• Lignite: non-agglomerating coal with a gross calo-rific value less than 4 165 kcal/kg (17.4 GJ/t) on an ash-free but moist basis.
Note that for 12 countries (listed above), sub-bituminous coal is included in hard coal, not brown coal. Under current methodology, lignite data also includes oil shale (but not shale oil).
Steam Coal Steam coal in this publication contains all anthracite, other bituminous coal and sub-bituminous coal.
In prior years, all hard coals that were not coking coal (including the sub-bituminous coal from the excepted countries) were classed as steam coal. This also in-cluded by necessity countries (not listed) where sub-bituminous coal was unable to be separated from other bituminous coal data for reporting purposes.
For the Coal Information 2012 publication, the defini-tion of steam coal was adjusted to include all sub-bituminous coals. This move was done to achieve greater congruence with practical, formal and infor-mal definitions of steam coal in the market and coal industry at large.
The definitions of hard coal and brown coal remain unchanged and consistent with the UNECE guidelines above and InterEnerStat definitions, so hard coal can no longer be calculated by adding steam coal data to coking coal data.
Coal products Derived solid fuels are products resulting from the transformation or manufacturing of hard coal, brown coal or other primary solid fuels, sometimes with the addition of other materials.

COAL INFORMATION (2012 edition) - 9
Coal and coal products Flow Short name Definition
Coal and coal products COAL (for balances only) This is the sum of all primary coals (not peat) and all derived coal products (cokes, gases, tars, briquettes etc) with the exception of gas works gas which is included with natural gas for IEA balances.
Hard coal HARDCOAL Hard coal refers to coal of gross calorific value greater than 23 865 kJ/kg (5 700 kcal/kg) on an ash-free but moist basis and with a mean random reflectance of vitrinite of at least 0.6. Hard coal is the sum of anthracite, coking coal, other bituminous coal and for some countries (see Note on Coal Classification above), hard coal includes sub-bituminous coal.
Brown coal BROWN Brown coal is the sum of lignite and sub-bituminous coal. For some countries (see Note on Coal Classification above) brown coal ex-cludes sub-bituminous coal.
Steam coal STEAMCOAL Steam coal is coal used for steam raising and space heating purposes and includes all anthracite and bituminous coals not included under coking coal and for all countries; steam coal also includes sub-bituminous coal.
Anthracite ANTCOAL A high rank coal used for industrial and residential applications. It is generally less than 10% volatile matter and a high carbon content (about 90% fixed carbon). Its gross calorific value is greater than 23 865 kJ/kg (5 700 kcal/kg) on an ash-free but moist basis.
Coking coal COKCOAL Coal with a quality that allows the production of a coke suitable to support a blast furnace charge. Its gross calorific value is greater than 23 865 kJ/kg (5 700 kcal/kg) on an ash-free but moist basis.
Other bituminous coal BITCOAL Other bituminous coal is used for steam raising and space heating purposes and includes all bituminous coal that is not included under coking coal. It usually contains more than 10% volatile matter and relatively high carbon content (less than 90% fixed carbon). Its gross calorific value is greater than 23 865 kJ/kg (5 700 kcal/kg) on an ash-free but moist basis.
Sub-bituminous coal SUBCOAL Non-agglomerating coals with a gross calorific value between 17 435 kJ/kg (4 165 kcal/kg) and 23 865 kJ/kg (5 700 kcal/kg) con-taining more than 31 per cent volatile matter on a dry mineral matter free basis.
Lignite LIGNITE Non-agglomerating coal with a gross calorific value of less than 17 435 kJ/kg (4 165 kcal/kg), and greater than 31 per cent volatile matter on a dry mineral matter free basis. Oil shale and tar sands produced and combusted directly are included in this category. Oil shale and tar sands used as inputs for other transformation processes are also included here.
Peat PEAT Combustible soft, porous or compressed, fossil sedimentary deposit of plant origin with high water content (up to 90 per cent in the raw state), easily cut, of light to dark brown colour. Peat used for non-energy purposes is not included.

10 - COAL INFORMATION (2012 edition)
INTERNATIONAL ENERGY AGENCY
Coal and coal products Flow Short name Definition
Patent fuel PATFUEL A composition fuel manufactured from hard coal fines with the addi-tion of a binding agent. The amount of patent fuel produced is, there-fore slightly higher than the actual amount of coal consumed in the transformation process.
Coke oven coke OVENCOKE The solid product obtained from the carbonisation of coal, princi-pally coking coal, at high temperature. It is low in moisture content and volatile matter. Also included are semi-coke, a solid product obtained from the carbonisation of coal at a low temperature, lignite coke, semi-coke made from lignite/brown coal, coke breeze and foundry coke.
Gas coke GASCOKE A by-product of hard coal used for the production of town gas in gas works. Gas coke is used for heating purposes.
Coal tar COALTAR Coal tar is a result of the destructive distillation of bituminous coal. Coal tar is the liquid by-product of the distillation of coal to make coke in the coke oven process. Coal tar can be further distilled into different organic products (e.g. benzene, toluene, naphthalene), which normally would be reported as a feedstock to the petrochemi-cal industry.
Brown coal briquettes BKB Composition fuels manufactured from lignite/brown coal, produced by briquetting under high pressure. These figures include peat bri-quettes, dried lignite fines and dust.
Gas works gas GASWKSGS Covers all types of gas produced in public utility or private plants, whose main purpose is the manufacture, transport and distribution of gas. It includes gas produced by carbonisation (including gas pro-duced by coke ovens and transferred to gas works), by total gasifica-tion (with or without enrichment with oil products), by cracking of natural gas, and by reforming and simple mixing of gases and/or air. This heading also includes substitute natural gas, which is a high calorific value gas manufactured by chemical conversion of a hydro-carbon fossil fuel.
Coke oven gas COKEOVGS Obtained as a by-product of the manufacture of coke oven coke for the production of iron and steel.
Blast furnace gas BLFURGS Produced during the combustion of coke in blast furnaces in the iron and steel industry. It is recovered and used as a fuel partly within the plant and partly in other steel industry processes or in power stations equipped to burn it.
Oxygen steel furnace gas
OXYSTGS Usually obtained as a by-product of the production of steel in an oxygen furnace and is recovered on leaving the furnace. The gas is also known as converter gas, LD gas or BOS gas.

COAL INFORMATION (2012 edition) - 11
3. FLOW DEFINITIONS – STATISTICS Supply
Flow Short name Definition
Production INDPROD Production refers to the quantities of fuels extracted or produced, cal-culated after any operation for removal of inert matter or impurities (e.g. sulphur from natural gas). For “other hydrocarbons” (shown with crude oil), production should include synthetic crude oil (including mineral oil extracted form bituminous minerals such as oil shale and tar sands, etc.). Production of secondary oil products represents the gross refinery output. Secondary coal products and gases represent the output from coke ovens, gas works, blast furnaces and other transformation processes.
From other sources – coal
OSCOAL From other sources refers to both primary energy that has not been ac-counted for under production and secondary energy that has been ac-counted for in the production of another fuel. For example, under addi-tives: benzol, alcohol and methanol produced from natural gas; under refinery feedstocks: backflows from the petrochemical industry used as refinery feed-stocks; under “other hydrocarbons” (included with crude oil): liquids obtained from coal liquefaction and GTL plants; under primary coal: recovered slurries, middlings, recuperated coal dust and other low-grade coal products that cannot be classified according to type of coal from which they are obtained; under gas works gas: natu-ral gas, refinery gas, and LPG, that are treated or mixed in gas works (i.e. gas works gas produced from sources other than coal).
From other sources – natural gas
OSNATGAS
From other sources – oil products
OSOIL
From other sources – renewables
OSRENEW
From other sources – non - specified
OSNONSPEC
Imports IMPORTS Imports comprise the amount of fuels obtained from or supplied to other countries, whether or not there is an economic or customs union between the relevant countries. Coal in transit should not be included.
Exports EXPORTS Exports comprise the amount of fuels obtained from or supplied to other countries, whether or not there is an economic or customs union between the relevant countries. Coal in transit should not be included.

12 - COAL INFORMATION (2012 edition)
INTERNATIONAL ENERGY AGENCY
Supply Flow Short name Definition
International marine bunkers
MARBUNK International marine bunkers covers those quantities delivered to ships of all flags that are engaged in international navigation. The interna-tional navigation may take place at sea, on inland lakes and waterways, and in coastal waters. Consumption by ships engaged in domestic navigation is excluded. The domestic/international split is determined on the basis of port of departure and port of arrival, and not by the flag or nationality of the ship. Consumption by fishing vessels and by mili-tary forces is also excluded. See definitions of transport, fishing, and other non-specified.
International aviation bunkers
AVBUNK As per international marine bunkers, International aviation bunkers covers those quantities delivered to aircraft of all flags that are engaged in international aviation. Consumption by aircraft engaged in domestic aviation is excluded. The domestic/international split is determined on the basis of airport of departure and airport of arrival, and not by the flag or nationality of the aircraft. Consumption by military forces is also excluded.
Stock changes STOCKCHA Stock changes reflects the difference between opening stock levels on the first day of the year and closing levels on the last day of the year of stocks on national territory held by producers, importers, energy trans-formation industries and large consumers. Oil and gas stock changes in pipelines are not taken into account. With the exception of large users mentioned above, changes in final users' stocks are not taken into ac-count. A stock build is shown as a negative number, and a stock draw as a positive number.
Domestic supply DOMSUP Domestic supply is defined as production + from other sources + im-ports - exports - international marine bunkers ± stock changes.
Transfers TRANSFER Transfers comprises interproduct transfers, products transferred and recycled products. Interproduct transfers results from reclassification of products either because their specification has changed or because they are blended into another product, e.g. kerosene may be reclassified as gasoil after blending with the latter in order to meet its winter diesel specification. The net balance of interproduct transfers is zero. Prod-ucts transferred is intended for petroleum products imported for further processing in refineries. For example, fuel oil imported for upgrading in a refinery is transferred to the feedstocks category. Recycled prod-ucts are finished products which pass a second time through the mar-keting network, after having been once delivered to final consumers (e.g. used lubricants which are reprocessed).
Statistical differences STATDIFF Statistical difference is defined as deliveries to final consumption + use for transformation processes and consumption by energy industry own use + losses - domestic supply - transfers. Statistical differences arise because the data for the individual components of supply are often de-rived from different data sources by the national administration. Fur-thermore, the inclusion of changes in some large consumers' stocks in the supply part of the balance introduces distortions which also con-tribute to the statistical differences.

COAL INFORMATION (2012 edition) - 13
Transformation processes Flow Short name Definition
Transformation proc-esses
TOTTRANF Transformation processes comprise the conversion of primary forms of energy to secondary and further transformation (e.g. coking coal to coke, crude oil to oil products, and fuel oil to electricity).
Main activity producer electricity plants
MAINELEC Electricity plants refers to plants which are designed to produce elec-tricity only. If one or more units of the plant is a CHP unit (and the inputs and outputs can not be distinguished on a unit basis) then the whole plant is designated as a CHP plant. Main activity producers generate electricity and/or heat for sale to third parties, as their pri-mary activity. They may be privately or publicly owned. Note that the sale need not take place through the public grid.
Autoproducer electricity plants
AUTOELEC Electricity plants refers to plants which are designed to produce elec-tricity only. If one or more units of the plant is a CHP unit (and the inputs and outputs can not be distinguished on a unit basis) then the whole plant is designated as a CHP plant. Autoproducer undertakings generate electricity and/or heat, wholly or partly for their own use as an activity which supports their primary activity. They may be pri-vately or publicly owned.
Main activity producer CHP plants
MAINCHP Combined heat and power plants refers to plants which are designed to produce both heat and electricity (sometimes referred to as co-generation power stations). If possible, fuel inputs and electricity/heat outputs are on a unit basis rather than on a plant basis. However, if data are not available on a unit basis, the convention for defining a CHP plant noted above should be adopted. Main activity producers generate electricity and/or heat for sale to third parties, as their pri-mary activity. They may be privately or publicly owned. Note that the sale need not take place through the public grid.
Autoproducer CHP plants
AUTOCHP Combined heat and power plants refers to plants which are designed to produce both heat and electricity (sometimes referred to as co-generation power stations). If possible, fuel inputs and electricity/heat outputs are on a unit basis rather than on a plant basis. However, if data are not available on a unit basis, the convention for defining a CHP plant noted above should be adopted. Note that for autopro-ducer's CHP plants, all fuel inputs to electricity production are taken into account, while only the part of fuel inputs to heat sold is shown. Fuel inputs for the production of heat consumed within the autopro-ducer's establishment are not included here but are included with fig-ures for the final consumption of fuels in the appropriate consuming sector. Autoproducer undertakings generate electricity and/or heat, wholly or partly for their own use as an activity which supports their primary activity. They may be privately or publicly owned.
Main activity producer heat plants
MAINHEAT Heat plants refers to plants designed to produce heat only and who sell heat to a third party (e.g. residential, commercial or industrial con-sumers) under the provisions of a contract. Main activity producers generate electricity and/or heat for sale to third parties, as their pri-mary activity. They may be privately or publicly owned. Note that the sale need not take place through the public grid.

14 - COAL INFORMATION (2012 edition)
INTERNATIONAL ENERGY AGENCY
Transformation processes Flow Short name Definition
Autoproducer heat plants
AUTOHEAT Heat plants refers to plants designed to produce heat only and who sell heat to a third party (e.g. residential, commercial or industrial con-sumers) under the provisions of a contract. Autoproducer undertakings generate electricity and/or heat, wholly or partly for their own use as an activity which supports their primary activity. They may be pri-vately or publicly owned.
Heat pumps THEAT Heat pumps includes heat produced by heat pumps in transformation. Heat pumps that are operated within the residential sector where the heat is not sold are not considered a transformation process and are not included here – the electricity consumption would appear as resi-dential use.
Electric boilers TBOILER Includes electric boilers used to produce heat.
Chemical heat for elec-tricity production
TELE Includes heat from chemical processes that is used to generate electricity.
Blast furnaces TBLASTFUR Blast furnaces covers the quantities of fuels used for the production of blast furnace gas and oxygen steel furnace gas. The production of pig-iron from iron ore in blast furnaces uses fuels for supporting the blast furnace charge and providing heat and carbon for the reduction of the iron ore. Accounting for the calorific content of the fuels entering the process is a complex matter as transformation (into blast furnace gas) and consumption (heat of combustion) occur simultaneously. Some carbon is also retained in the pig-iron; almost all of this reappears later in the oxygen steel furnace gas (or converter gas) when the pig-iron is converted to steel. In the 1992/1993 annual questionnaires, Member Countries were asked for the first time to report in the transformation sector the quantities of all fuels (e.g. pulverised coal injection [PCI] coal, coke oven coke, natural gas and oil) entering blast furnaces and the quantity of blast furnace gas and oxygen steel furnace gas pro-duced. The Secretariat then needed to split these inputs into the trans-formation and consumption components. The transformation compo-nent is shown in the row blast furnaces/gas works in the column ap-propriate for the fuel, and the consumption component is shown in the row iron and steel, in the column appropriate for the fuel. Originally, the Secretariat assumed that there was a transformation efficiency of 100%, which meant that the energy going into the transformation process was equal to the energy coming out (i.e. equivalent to the en-ergy content of the gases produced). However, when the IEA data were used to calculate CO2 emissions from fuel combustion using the Intergovernmental Panel on Climate Change (IPCC) methodology, as published in the Revised 1996 IPCC Guidelines for National Green-house Gas Inventories, the blast furnaces were showing a carbon gain. Starting with the 1998 edition, the Secretariat decided to assume a transformation efficiency such that the carbon input into the blast fur-naces should equal the carbon output. This is roughly equivalent to assuming an energy transformation efficiency of 40%.

COAL INFORMATION (2012 edition) - 15
Transformation processes Flow Short name Definition
Gas works TGASWKS Gas works covers the quantities of fuels used for the production of town gas.
Coke ovens TCOKEOVS Coke plants covers the use of fuels for the manufacture of coke and coke oven gas.
Patent fuel plants TPATFUEL Patent fuel plants covers the use of fuels for the manufacture of patent fuels.
BKB plants TBKB BKB plants covers the use of fuels for BKB.
Oil refineries TREFINER Oil refineries covers the use of hydrocarbons for the manufacture of finished petroleum products.
Petrochemical industry TPETCHEM Covers backflows returned from the petrochemical industry. Note that backflows from oil products that are used for non-energy purposes (i.e. white spirit and lubricants) are not included here, but in non-energy use.
Coal liquefaction plants TCOALLIQ Includes coal liquefaction plants.
Gas-to-liquids (GTL) plants
TGTL Includes gas-to-liquid plants.
For blended natural gas TBLENDGAS Includes other gases for blending with natural gas.
Charcoal production plants
TCHARCOAL Includes the transformation of solid biomass into charcoal.
Non-specified (Transformation)
TNONSPEC Includes non-specified transformation.

16 - COAL INFORMATION (2012 edition)
INTERNATIONAL ENERGY AGENCY
Energy industry own use and losses Flow Short name Definition
Energy industry own use
TOTENGY Energy industry own use covers the amount of fuels used by the energy producing industries (e.g. for heating, lighting and operation of all equipment used in the extraction process, for traction and for distribu-tion). It includes energy consumed by energy industries for heating, pump-ing, traction and lighting purposes [ISIC Rev. 4 Divisions 05, 06, 19 and 35, Group 091 and Classes 0892 and 0721].
Coal mines EMINES Represents the energy which is used directly within the coal industry for hard coal and lignite mining. It excludes coal burned in pithead power stations (included under electricity plants in transformation processes) and free allocations to miners and their families (considered as part of household consumption and therefore included under residential).
Oil and gas extraction EOILGASEX For oil and gas extraction, flared gas is not included.
Blast furnaces EBLASTFUR Companies’ own consumption of fuels in operating a furnace.
Gas works EGASWKS Comprises consumption of fuels at the gas works and gasification plants.
Gasification plants for biogas
EBIOGAS Includes own consumption of biogas necessary to support tempera-tures needed for anaerobic fermentation.
Coke ovens ECOKEOVS Companies’ own consumption of fuels at the coking plant.
Patent fuel plants EPATFUEL Comprises own consumption of fuels by patent fuel plants.
BKB plants EBKB Comprises own consumption of fuels by briquetting plants.
Oil refineries EREFINER Comprises own consumption of fuels in refineries.
Coal liquefaction plants ECOALLIQ Comprises own consumption of fuels at coal liquefaction plants.
Liquefaction (LNG) / regasification plants
ELNG Comprises own consumption of fuels at liquefaction (LNG)/ regasifi-cation plants.
Gas-to-liquids (GTL) plants
EGTL Comprises own consumption of fuels at gas-to-liquids (GTL) plants.
Own use in electricity, CHP and heat plants
EPOWERPLT Companies’ own consumption of fuels in electricity plants, combined heat and power plants (CHP) and heat plants.
Used for pumped storage
EPUMPST Represents electricity consumed in hydro-electric plants for pumped storage.
Nuclear industry ENUC Represents the energy used in the nuclear industry.
Charcoal production plants
ECHARCOAL Represents the energy used in charcoal production plants.
Non-specified (energy) ENONSPEC Represents use in non-specified energy industries.
Losses DISTLOSS Losses in gas distribution, electricity transmission, and coal transport.

COAL INFORMATION (2012 edition) - 17
Final consumption Flow Short name Definition
Final consumption FINCONS Equal to the sum of the consumption in the end-use sectors. Energyused for transformation processes and for own use of the energy pro-ducing industries is excluded. Final consumption reflects for the most part deliveries to consumers (see note on stock changes). Backflows from the petrochemical industry are not included in final consumption (see from other sources under supply and petrochemical plants in transformation processes). Starting with the 2009 edition, international aviation bunkers is no longer included in final consumption at the country level.
Industry TOTIND Industry consumption is specified as follows: (energy used for transport by industry is not included here but is reported under transport):
Iron and steel IRONSTL [ISIC Rev. 4 Group 241 and Class 2431]
Chemical and petrochemical
CHEMICAL [ISIC Rev. 4 Divisions 20 and 21] Excluding petrochemical feedstocks.
Non-ferrous metals NONFERR [ISIC Rev. 4 Group 242 and Class 2432] Basic industries.
Non-metallic minerals NONMET [ISIC Rev. 4 Division 23] Such as glass, ceramic, cement, etc.
Transport equipment TRANSEQ [ISIC Rev. 4 Divisions 29 and 30]
Machinery MACHINE [ISIC Rev. 4 Divisions 25 to 28] Fabricated metal products, machinery and equipment other than transport equipment.
Mining and quarrying MINING [ISIC Rev. 4 Divisions 07 and 08 and Group 099] Mining (excluding fuels) and quarrying.
Food and tobacco FOODPRO [ISIC Rev. 4 Divisions 10 to 12]
Paper, pulp and print PAPERPRO [ISIC Rev. 4 Divisions 17 and 18]
Wood and wood products
WOODPRO [ISIC Rev. 4 Division 16] Wood and wood products other than pulp and paper.
Construction CONSTRUC [ISIC Rev. 4 Division 41 to 43]
Textile and leather TEXTILES [ISIC Rev. 4 Divisions 13 to 15]
Non-specified (industry)
INONSPEC [ISIC Rev. 4 Divisions 22, 31 and 32] Any manufacturing industry not included above. Note: Most countries have difficulties supplying an industrial breakdown for all fuels. In these cases, the non-specified in-dustry row has been used. Regional aggregates of industrial consump-tion should therefore be used with caution.
Transport TOTTRANS Consumption in transport covers all transport activity (in mobile en-gines) regardless of the economic sector to which it is contributing [ISIC Rev. 4 Divisions 49 to 51], and is specified as follows:

18 - COAL INFORMATION (2012 edition)
INTERNATIONAL ENERGY AGENCY
Final consumption Flow Short name Definition
Domestic aviation DOMESAIR Includes deliveries of aviation fuels to aircraft for domestic aviation -commercial, private, agricultural, etc. It includes use for purposes other than flying, e.g. bench testing of engines, but not airline use of fuel for road transport. The domestic/international split should be determined on the basis of departure and landing locations and not by the nationality of the airline. Note that this may include journeys of considerable length between two airports in a country (e.g. San Francisco to Honolulu). For many countries this incorrectly includes fuel used by domestically owned carriers for outbound international traffic;
Road ROAD Road includes fuels used in road vehicles as well as agricultural and industrial highway use. Excludes military consumption as well as motor gasoline used in stationary engines and diesel oil for use in tractors that are not for highway use.
Rail RAIL Rail includes quantities used in rail traffic, including industrial railways.
Pipeline transport PIPELINE Includes energy used in the support and operation of pipelines trans-porting gases, liquids, slurries and other commodities, including the energy used for pump stations and maintenance of the pipeline. Energy for the pipeline distribution of natural or manufactured gas, hot water or steam (ISIC Rev. 4 Division 35) from the distributor to final users is excluded and should be reported in energy industry own use, while the energy used for the final distribution of water (ISIC Rev. 4 Division 36) to household, industrial, commercial and other users should be included in commercial/public services. Losses occurring during the transport between distributor and final users should be reported as losses;
Domestic navigation DOMESNAV Includes fuels delivered to vessels of all flags not engaged in interna-tional navigation (see international marine bunkers). The domestic/international split should be determined on the basis of port of departure and port of arrival and not by the flag or nationality of the ship. Note that this may include journeys of considerable length between two ports in a country (e.g. San Francisco to Honolulu). Fuel used for ocean, coastal and inland fishing and military consumption are excluded;
Non-specified (transport)
TRNONSPE Includes all transport not elsewhere specified. Note: International ma-rine bunkers and international aviation bunkers are shown in Supply and are not included in transport as part of final consumption.
Other TOTOTHER Includes residential, commercial/public services, agriculture/forestry, fishing and non-specified (other).
Residential RESIDENT Includes consumption by households, excluding fuels used for trans-port. Includes households with employed persons [ISIC Rev. 4 Divi-sion 97] which is a small part of total residential consumption.
Commercial and public services
COMMPUB [ISIC Rev. 4 Divisions 33, 36-39, 45-47, 52, 53, 55-56, 58-66, 68-75, 77-82, 84 (excluding Class 8422), 85-88, 90-96 and 99]

COAL INFORMATION (2012 edition) - 19
Final consumption Flow Short name Definition
Agriculture/forestry AGRICULT Includes deliveries to users classified as agriculture, hunting and for-estry by the ISIC, and therefore includes energy consumed by such us-ers whether for traction (excluding agricultural highway use), power or heating (agricultural and domestic) [ISIC Rev. 4 Divisions 01 and 02].
Fishing FISHING Includes fuels used for inland, coastal and deep-sea fishing. Fishing covers fuels delivered to ships of all flags that have refuelled in the country (including international fishing) as well as energy used in the fishing industry [ISIC Rev. 4 Division 03]. Prior to last year, fishing was included with agriculture/forestry and this may continue to be the case for some countries.
Non-specified (other) ONONSPEC Includes all fuel use not elsewhere specified as well as consumption in the above-designated categories for which separate figures have not been provided. Military fuel use for all mobile and stationary consump-tion is included here (e.g. ships, aircraft, road and energy used in living quarters) regardless of whether the fuel delivered is for the military of that country or for the military of another country.
Non-energy use NONENUSE Non-energy use covers those fuels that are used as raw materials in the different sectors and are not consumed as a fuel or transformed into another fuel. Non-energy use is shown separately in final consumption under the heading non-energy use. Note that for biomass commodities, only the amounts specifically used for energy purposes (a small part of the total) are included in the energy statistics. Therefore, all non-energy use quantities are null by definition.
Non-energy use ind./transf./energy
NEINTREN Non-energy in industry, transformation processes and energy industry own use.
Memo: feedstock use in petrochemical industry
NECHEM The petrochemical industry includes cracking and reforming processes for the purpose of producing ethylene, propylene, butylene, synthesis gas, aromatics, butadene and other hydrocarbon-based raw materials in processes such as steam cracking, aromatics plants and steam reforming [part of ISIC Rev. 4 Group 201].
Non-energy use in transport
NETRANS Non-energy use in transport.
Non-energy use in other sectors
NEOTHER Non-energy use in “Other”.

20 - COAL INFORMATION (2012 edition)
INTERNATIONAL ENERGY AGENCY
Electricity output (GWh) Flow Short name Definition
Electricity output in GWh
ELOUTPUT Shows the total number of GWh generated by thermal power plants separated into electricity plants and CHP plants, as well as production by nuclear and hydro, geothermal, etc.
Electricity output-main activity producer electricity plants
ELMAINE Total electricity generated in main activity producer electricity plants.
Electricity output-autoproducer electricity plants
ELAUTOE Total electricity generated in autoproducer electricity plants.
Electricity output-main activity producer CHP plants
ELMAINC Total electricity generated in main activity producer CHP plants.
Electricity output-autoproducer CHP plants
ELAUTOC Total electricity generated in autoproducer CHP plants.
Heat output (TJ) Flow Short name Definition
Heat output in TJ HEATOUT Shows the total amount of TJ generated by power plants separated into CHP plants and heat plants.
Heat output-main activ-ity producer CHP plants
HEMAINC Total heat generated in main activity producer CHP plants.
Heat output-autoproducer CHP plants
HEAUTOC Total electricity generated in autoproducer CHP plants.
Heat output-main activ-ity producer heat plant
HEMAINH Total electricity generation in main activity producer heat plants.
Heat output-autoproducer heat plants
HEAUTOH Total electricity generation in autoproducer heat plants.

COAL INFORMATION (2012 edition) - 21
4. FLOW DEFINITIONS – BALANCES Supply
Flow Short name Definition
Production INDPROD Production is the production of primary energy, i.e. hard coal, lig-nite/brown coal, peat, crude oil, NGLs, natural gas, combustible re-newables and waste, nuclear, hydro, geothermal, solar and the heat from heat pumps that is extracted from the ambient environment. Pro-duction is calculated after removal of impurities (e.g. sulphur from natural gas). Calculation of production of hydro, geothermal, etc. and nuclear electricity is explained in Section 6.
Imports IMPORTS Comprise amounts having crossed the national territorial boundaries of the country whether or not customs clearance has taken place. Imports comprise the amount of fuels obtained from other countries, whether or not there is an economic or customs union between the relevant countries. Coal in transit should not be included.
Exports EXPORTS Comprise amounts having crossed the national territorial boundaries of the country whether or not customs clearance has taken place. Exports comprise the amount of fuels supplied to other countries, whether or not there is an economic or customs union between the relevant countries. Coal in transit should not be included.
International marine bunkers
MARBUNK Covers those quantities delivered to ships of all flags that are engaged in international navigation. The international navigation may take place at sea, on inland lakes and waterways, and in coastal waters. Consump-tion by ships engaged in domestic navigation is excluded. The domes-tic/international split is determined on the basis of port of departure and port of arrival, and not by the flag or nationality of the ship. Consump-tion by fishing vessels and by military forces is also excluded. See do-mestic navigation, fishing and other non-specified.
International aviation bunkers
AVBUNK Includes deliveries of aviation fuels to aircraft for international avia-tion. Fuels used by airlines for their road vehicles are excluded. The domestic/international split should be determined on the basis of de-parture and landing locations and not by the nationality of the airline. For many countries this incorrectly excludes fuel used by domesti-cally owned carriers for their international departures.

22 - COAL INFORMATION (2012 edition)
INTERNATIONAL ENERGY AGENCY
Supply Flow Short name Definition
Stock changes STOCKCHA Reflects the difference between opening stock levels on the first day of the year and closing levels on the last day of the year of stocks on national territory held by producers, importers, energy transformation industries and large consumers. A stock build is shown as a negative number, and a stock draw as a positive number.
Total primary energy supply
TPES Total primary energy supply (TPES) is made up of production + imports - exports - international marine bunkers - international aviation bunkers ± stock changes.
Transfers TRANSFER Comprises interproduct transfers, products transferred and recycled products. Interproduct transfers results from reclassification of products either because their specification has changed or because they are blended into another product, e.g. kerosene may be reclassified as gasoil after blending with the latter in order to meet its winter diesel specification. The net balance of interproduct transfers is zero. Products transferred is intended for oil products imported for further processing in refineries. For example, fuel oil imported for upgrading in a refinery is transferred to the feedstocks category. Recycled products are finished products which pass a second time through the marketing network, after having been once delivered to final consumers (e.g. used lubricants which are reprocessed).
Statistical differences
STATDIFF Includes the sum of the unexplained statistical differences for indi-vidual fuels, as they appear in the basic energy statistics. It also in-cludes the statistical differences that arise because of the variety of conversion factors in the coal and oil columns.

COAL INFORMATION (2012 edition) - 23
Transformation processes Flow Short name Definition
Transformation processes
TOTTRANF Transformation processes comprises the conversion of primary forms of energy to secondary and further transformation (e.g. coking coal to coke, crude oil to oil products, and fuel oil to electricity). Inputs to transfor-mation processes are shown as negative numbers and output from the process is shown as a positive number. Transformation losses will appear in the “total” column as negative numbers.
Main activity producer electricity plants
MAINELEC Refers to plants which are designed to produce electricity only. If one or more units of the plant is a CHP unit (and the inputs and outputs can not be distinguished on a unit basis) then the whole plant is des-ignated as a CHP plant. Main activity producers generate electricity for sale to third parties, as their primary activity. They may be pri-vately or publicly owned. Note that the sale need not take place through the public grid.
Autoproducer electricity plants
AUTOELEC Refers to plants which are designed to produce electricity only. If one or more units of the plant is a CHP unit (and the inputs and outputs can not be distinguished on a unit basis) then the whole plant is des-ignated as a CHP plant. Autoproducer undertakings generate electric-ity wholly or partly for their own use as an activity which supports their primary activity. They may be privately or publicly owned.
Main activity producer CHP plants
MAINCHP Refers to plants which are designed to produce both heat and electric-ity (sometimes referred to as co-generation power stations). If possi-ble, fuel inputs and electricity/heat outputs are on a unit basis rather than on a plant basis. However, if data are not available on a unit ba-sis, the convention for defining a CHP plant noted above should be adopted. Main activity producers generate electricity and/or heat for sale to third parties, as their primary activity. They may be privately or publicly owned. Note that the sale need not take place through the public grid.
Autoproducer CHP plants
AUTOCHP Refers to plants which are designed to produce both heat and electric-ity (sometimes referred to as co-generation power stations). If possi-ble, fuel inputs and electricity/heat outputs are on a unit basis rather than on a plant basis. However, if data are not available on a unit ba-sis, the convention for defining a CHP plant noted above should be adopted. Note that for autoproducer CHP plants, all fuel inputs to electricity production are taken into account, while only the part of fuel inputs to heat sold is shown. Fuel inputs for the production of heat consumed within the autoproducer's establishment are not in-cluded here but are included with figures for the final consumption of fuels in the appropriate consuming sector. Autoproducer undertak-ings generate electricity and/or heat, wholly or partly for their own use as an activity which supports their primary activity. They may be privately or publicly owned.

24 - COAL INFORMATION (2012 edition)
INTERNATIONAL ENERGY AGENCY
Transformation processes Flow Short name Definition
Main activity producer heat plants
MAINHEAT Refers to plants (including heat pumps and electric boilers) designed to produce heat only and who sell heat to a third party (e.g. residen-tial, commercial or industrial consumers) under the provisions of a contract. Main activity producers generate heat for sale to third par-ties, as their primary activity. They may be privately or publicly owned. Note that the sale need not take place through the public grid.
Autoproducer heat plants
AUTOHEAT Refers to plants (including heat pumps and electric boilers) designed to produce heat only and who sell heat to a third party (e.g. residen-tial, commercial or industrial consumers) under the provisions of a contract. Autoproducer undertakings generate heat, wholly or partly for their own use as an activity which supports their primary activity. They may be privately or publicly owned.
Heat pumps THEAT Includes heat produced by heat pumps in transformation. Heat pumps that are operated within the residential sector where the heat is not sold are not considered a transformation process and are not included here – the electricity consumption would appear as residential use.
Electric boilers TBOILER Includes electric boilers used to produce heat.
Chemical heat for electricity production
TELE Includes heat from chemical processes that is used to generate electricity.
Blast furnaces TBLASTFUR Includes the production of town gas, blast furnace gas and oxygen steel furnace gas. The production of pig-iron from iron ore in blast furnaces uses fuels for supporting the blast furnace charge and providing heat and carbon for the reduction of the iron ore. Accounting for the calorific con-tent of the fuels entering the process is a complex matter as transforma-tion (into blast furnace gas) and consumption (heat of combustion) occur simultaneously. Some carbon is also retained in the pig-iron; almost all of this reappears later in the oxygen steel furnace gas (or converter gas) when the pig-iron is converted to steel. In the 1992/1993 annual ques-tionnaires, Member Countries were asked for the first time to report in transformation processes the quantities of all fuels (e.g. pulverised coal injection [PCI] coal, coke oven coke, natural gas and oil) entering blast furnaces and the quantity of blast furnace gas and oxygen steel furnace gas produced. The Secretariat then needed to split these inputs into the transformation and consumption components. The transformation com-ponent is shown in the row blast furnaces in the column appropriate for the fuel, and the consumption component is shown in the row iron and steel, in the column appropriate for the fuel. The Secretariat decided to assume a transformation efficiency such that the carbon input into the blast furnaces should equal the carbon output. This is roughly equivalent to assuming an energy transformation efficiency of 40%.
Gas works TGASWKS Includes the manufacture of town gas. Note: in the summary bal-ances this item also includes other gases blended with natural gas (TBLENDGAS).

COAL INFORMATION (2012 edition) - 25
Transformation processes Flow Short name Definition
Coke ovens TCOKEOVS Includes the manufacture of coke and coke oven gas.
Patent fuel plants TPATFUEL Includes the manufacture of patent fuels.
BKB plants TBKB Includes the manufacture of BKB.
Oil refineries TREFINER Includes the manufacture of finished oil products.
Petrochemical plants
TPETCHEM Covers backflows returned from the petrochemical industry. Note that backflows from oil products that are used for non-energy pur-poses (i.e. white spirit and lubricants) are not included here, but in non-energy use.
Coal liquefaction plants
TCOALLIQ Includes coal, oil and tar sands used to produce synthetic oil.
Gas-to-liquids (GTL) plants
TGTL Includes natural gas used as feedstock for the conversion to liquids, e.g. the quantities of fuel entering the methanol product process for transformation into methanol.
For blended natural gas
TBLENDGAS Includes other gases that are blended with natural gas.
Charcoal production plants
TCHARCOAL Includes the transformation of solid biomass into charcoal.
Non-specified (transformation)
TNONSPEC Includes other non-specified transformation.
Energy industry own use and losses Flow Short name Definition
Losses DISTLOSS Losses in gas distribution, electricity transmission and coal transport.
Flow used in the summary balances
Energy industry own use
OWNUSE Is equal to the sum of EMINES, EOILGASEX, EBLASTFUR, EGASWKS, EBIOGAS, ECOKEOVS, EPATFUEL, EBKB, ERE-FINER, ECOALLIQ, ELNG, EGTL, EPOWERPLT, EPUMPST, ENUC, ECHARCOAL, ENONSPEC and DISTLOSS.
Flow Short name Definition
Energy industry own use
TOTENERGY Energy industry own use covers the amount of fuels used by the en-ergy producing industries (e.g. for heating, lighting and operation of all equipment used in the extraction process, for traction and for distribution). It includes energy consumed by energy industries for heating, pump-ing, traction and lighting purposes [ISIC Rev. 4 Divisions 05, 06, 19 and 35, Group 091 and Classes 0892 and 0721].

26 - COAL INFORMATION (2012 edition)
INTERNATIONAL ENERGY AGENCY
Energy industry own use and losses Flow Short name Definition
Coal mines EMINES Represents the energy which is used directly within the coal industry for hard coal and lignite mining. It excludes coal burned in pithead power stations (included under electricity plants in transformation processes) and free allocations to miners and their families (consid-ered as part of household consumption and therefore included under residential).
Oil and gas extraction
EOILGASEX Represents the energy which is used for oil and gas extraction. Flared gas is not included.
Blast furnaces EBLASTFUR Represents the energy which is used in blast furnaces.
Gas works EGASWKS Represents the energy which is used in gas works.
Gasification plants for biogas
EBIOGAS Represents own consumption of biogas necessary to support tempera-tures needed for anaerobic fermentation.
Coke ovens ECOKEOVS Represents the energy used in coke ovens.
Patent fuel plants EPATFUEL Represents the energy used in patent fuel plants.
BKB plants EBKB Represents the energy used in BKB plants.
Oil refineries EREFINER Represents the energy used in oil refineries.
Coal liquefaction plants
ECOALLIQ Represents the energy used in coal liquefaction plants.
Liquefaction (LNG) / regasification plants
ELNG Represents the energy used in LNG and regasification plants.
Gas-to-liquids (GTL) plants
EGTL Represents the energy used in gas-to-liquids plants.
Own use in electricity, CHP and heat plants
EPOWERPLT Represents the energy used in main activity producer electricity, CHP and heat plants.
Used for pumped storage
EPUMPST Represents electricity consumed in hydro-electric plants for pumped storage.
Nuclear industry ENUC Represents the energy used in the nuclear industry.
Charcoal production plants
ECHARCOAL Represents the energy used in charcoal production plants.
Non-specified (energy)
ENONSPEC Represents use in non-specified energy sector.

COAL INFORMATION (2012 edition) - 27
Final consumption Flow Short name Definition
Total final consumption
TFC Equal to the sum of the consumption in the end-use sectors. Energy used for transformation processes and for own use of the energy producing industries is excluded. Final consumption reflects for the most part deliveries to consumers (see note on stock changes). Backflows from the petrochemical industry are not included in final consumption (see from other sources under supply and petrochemi-cal plants in transformation). Starting with the 2009 edition, international aviation bunkers is no longer included in final consumption at the country level.
Industry TOTIND Industry consumption is specified as follows: (energy used for trans-port by industry is not included here but is reported under transport):
Iron and steel IRONSTL [ISIC Rev. 4 Group 241 and Class 2431]
Chemical and petrochemical
CHEMICAL [ISIC Rev. 4 Divisions 20 and 21] Excluding petrochemical feedstocks.
Non-ferrous metals NONFERR [ISIC Rev. 4 Group 242 and Class 2432] Basic industries.
Non-metallic minerals
NONMET [ISIC Rev. 4 Division 23] Such as glass, ceramic, cement, etc.
Transport equipment
TRANSEQ [ISIC Rev. 4 Divisions 29 and 30]
Machinery MACHINE [ISIC Rev. 4 Divisions 25 to 28] Fabricated metal products, machin-ery and equipment other than transport equipment.
Mining and quarrying
MINING [ISIC Rev. 4 Divisions 07 and 08 and Group 099] Mining (excluding fuels) and quarrying.
Food and tobacco FOODPRO [ISIC Rev. 4 Divisions 10 to 12]
Paper, pulp and print
PAPERPRO [ISIC Rev. 4 Divisions 17 and 18]
Wood and wood products
WOODPRO [ISIC Rev. 4 Division 16] Wood and wood products other than pulp and paper.
Construction CONSTRUC [ISIC Rev. 4 Division 41 to 43]
Textile and leather TEXTILES [ISIC Rev. 4 Divisions 13 to 15]
Non-specified (industry)
INONSPEC [ISIC Rev. 4 Divisions 22, 31 and 32] Any manufacturing industry not included above. Note: Most countries have difficulties supplying an industrial breakdown for all fuels. In these cases, the non-specified industry row has been used. Regional aggregates of indus-trial consumption should therefore be used with caution.

28 - COAL INFORMATION (2012 edition)
INTERNATIONAL ENERGY AGENCY
Final consumption Flow Short name Definition
Transport TOTTRANS Consumption in transport covers all transport activity (in mobile engines) regardless of the economic sector to which it is contributing [ISIC Rev. 4 Divisions 49 to 51], and is specified as follows:
Domestic aviation DOMESAIR Includes deliveries of aviation fuels to aircraft for domestic aviation - commercial, private, agricultural, etc. It includes use for purposes other than flying, e.g. bench testing of engines, but not airline use of fuel for road transport. The domestic/international split should be de-termined on the basis of departure and landing locations and not by the nationality of the airline. Note that this may include journeys of considerable length between two airports in a country (e.g. San Fran-cisco to Honolulu). For many countries this incorrectly includes fuel used by domestically owned carriers for outbound international traffic;
Road ROAD Includes fuels used in road vehicles as well as agricultural and in-dustrial highway use. Excludes military consumption as well as mo-tor gasoline used in stationary engines and diesel oil for use in trac-tors that are not for highway use;
Rail RAIL Includes quantities used in rail traffic, including industrial railways; Pipeline transport PIPELINE Includes energy used in the support and operation of pipelines transport-
ing gases, liquids, slurries and other commodities, including the energy used for pump stations and maintenance of the pipeline. Energy for the pipeline distribution of natural or manufactured gas, hot water or steam (ISIC Rev. 4 Division 35) from the distributor to final users is excluded and should be reported in energy industry own use, while the energy used for the final distribution of water (ISIC Rev. 4 Division 36) to household, industrial, commercial and other users should be included in commercial/public services. Losses occurring during the transport be-tween distributor and final users should be reported as losses;
Domestic navigation
DOMESNAV Includes fuels delivered to vessels of all flags not engaged in inter-national navigation (see international marine bunkers). The domes-tic/international split should be determined on the basis of port of departure and port of arrival and not by the flag or nationality of the ship. Note that this may include journeys of considerable length be-tween two ports in a country (e.g. San Francisco to Honolulu). Fuel used for ocean, coastal and inland fishing and military consumption are excluded;
Non-specified (transport)
TRNONSPE Includes all transport not elsewhere specified. Note: International marine bunkers and international aviation bunkers are shown in Supply and are not included in the transport sector as part of final consumption.
Other TOTOTHER Includes residential, commercial/public services, agriculture/forestry, fishing and non-specified (other).
Residential RESIDENT Includes consumption by households, excluding fuels used for trans-port. Includes households with employed persons [ISIC Rev. 4 Divi-sion 97] which is a small part of total residential consumption.
Commercial and public services
COMMPUB [ISIC Rev. 4 Divisions 33, 36-39, 45-47, 52, 53, 55-56, 58-66, 68-75, 77-82, 84 (excluding Class 8422), 85-88, 90-96 and 99]

COAL INFORMATION (2012 edition) - 29
Final consumption Flow Short name Definition
Agriculture/forestry AGRICULT Includes deliveries to users classified as agriculture, hunting and forestry by the ISIC, and therefore includes energy consumed by such users whether for traction (excluding agricultural highway use), power or heating (agricultural and domestic) [ISIC Rev. 4 Divisions 01 and 02].
Fishing FISHING Includes fuels used for inland, coastal and deep-sea fishing. Fishing covers fuels delivered to ships of all flags that have refuelled in the country (including international fishing) as well as energy used in the fishing industry [ISIC Rev. 4 Division 03].
Non-specified (other)
ONONSPEC Includes all fuel use not elsewhere specified as well as consumption in the above-designated categories for which separate figures have not been provided. Military fuel use for all mobile and stationary consumption is included here (e.g. ships, aircraft, road and energy used in living quarters) regardless of whether the fuel delivered is for the military of that country or for the military of another country.
Non-energy use NONENUSE Non-energy use covers those fuels that are used as raw materials in the different sectors and are not consumed as a fuel or transformed into an-other fuel. Non-energy use is shown separately in final consumption under the heading non-energy use. Note that for biomass commodities, only the amounts specifically used for energy purposes (a small part of the total) are included in the energy statistics. Therefore, the non-energy use of biomass is not taken into consideration and the quantities are null by definition.
Non-energy use industry/ transformation/ energy
NEINTREN Non-energy in industry, transformation processes and energy indus-try own use.
Memo: feedstock use in petrochemical industry
NECHEM The petrochemical industry includes cracking and reforming proc-esses for the purpose of producing ethylene, propylene, butylene, synthesis gas, aromatics, butadene and other hydrocarbon-based raw materials in processes such as steam cracking, aromatics plants and steam reforming [part of ISIC Rev. 4 Group 201].
Non-energy use in transport
NETRANS Non-energy use in transport.
Non-energy use in other
NEOTHER Non-energy use in “Other”.
30 - COAL INFORMATION (2012 edition)
INTERNATIONAL ENERGY AGENCY
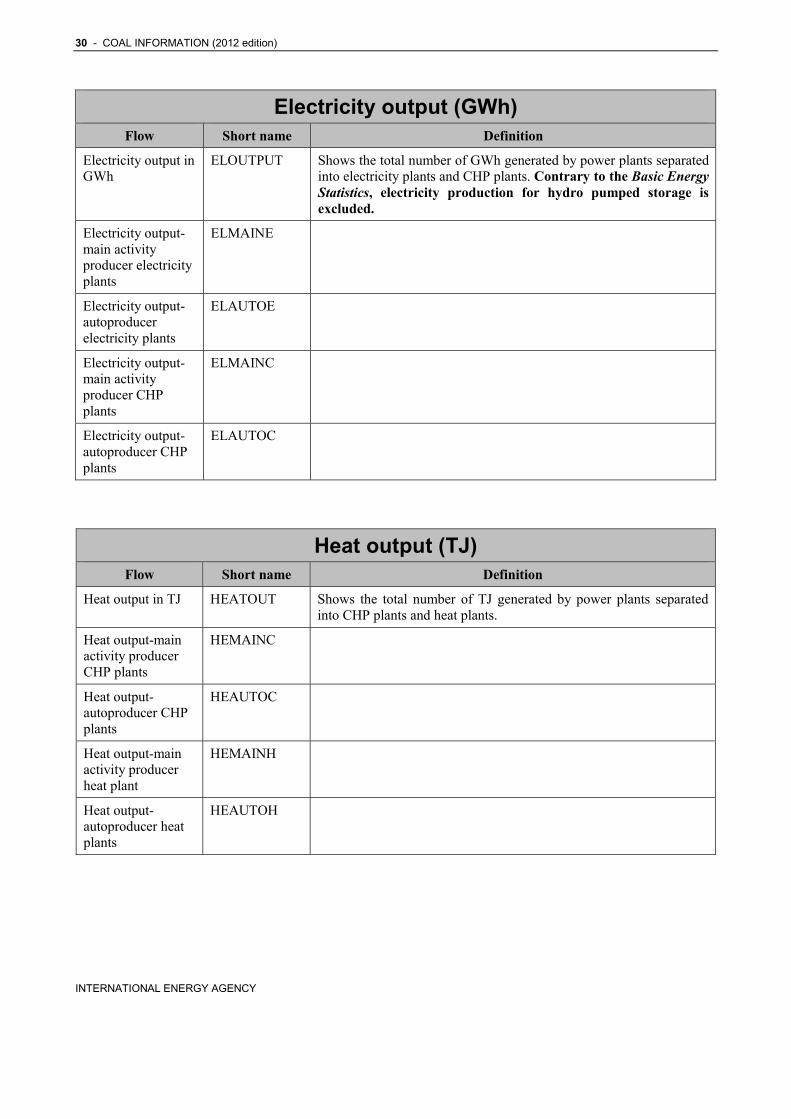
Electricity output (GWh) Flow Short name Definition
Electricity output in GWh
ELOUTPUT Shows the total number of GWh generated by power plants separated into electricity plants and CHP plants. Contrary to the Basic Energy Statistics, electricity production for hydro pumped storage is excluded.
Electricity output-main activity producer electricity plants
ELMAINE
Electricity output-autoproducer electricity plants
ELAUTOE
Electricity output-main activity producer CHP plants
ELMAINC
Electricity output-autoproducer CHP plants
ELAUTOC
Heat output (TJ) Flow Short name Definition
Heat output in TJ HEATOUT Shows the total number of TJ generated by power plants separated into CHP plants and heat plants.
Heat output-main activity producer CHP plants
HEMAINC
Heat output-autoproducer CHP plants
HEAUTOC
Heat output-main activity producer heat plant
HEMAINH
Heat output-autoproducer heat plants
HEAUTOH

COAL INFORMATION (2012 edition) - 31
5. FLOW DEFINITIONS – CALORIFIC VALUES
Net calorific values Expressed in Megajoules / tonne or kilojoules / kilogramme
Flow Short name Definition
NCV of production NINDPROD
NCV of imports NIMPORTS
NCV of exports NEXPORTS
NCV of coke ovens NCOKEOVS
NCV of blast furnaces NBLAST
NCV in main activity producer electricity plants
NMAIN
NCV in autoproducer electricity plants
NAUTOELEC
NCV in main activity CHP plants
NMAINCHP
NCV in autoproducer CHP plants
NAUTOCHP
NCV in main activity heat plants
NMAINHEAT
NCV in autoproducer heat plants
NAUTOHEAT
NCV in industry NIND
NCV for other uses NOTHER


COAL INFORMATION (2012 edition) - 33
6. GEOGRAPHICAL COVERAGE (WORLD)
Countries and regions Flow Short name Definition
Australia AUSTRALI Excludes the overseas territories.
Austria AUSTRIA
Belgium BELGIUM
Canada CANADA
Chile CHILE
Czech Republic CZECH
Denmark DENMARK Excludes the Danish Faroes and Greenland
Estonia ESTONIA
Finland FINLAND
France FRANCE Includes Monaco, and excludes the following overseas departments and territories (Guadeloupe, Guyana, Martinique, New Caledonia, French Polynesia, Reunion, and St.-Pierre and Miquelon).
Germany GERMANY
Greece GREECE
Hungary HUNGARY
Iceland ICELAND
Ireland IRELAND
34 - COAL INFORMATION (2012 edition)
INTERNATIONAL ENERGY AGENCY
Countries and regions Flow Short name Definition
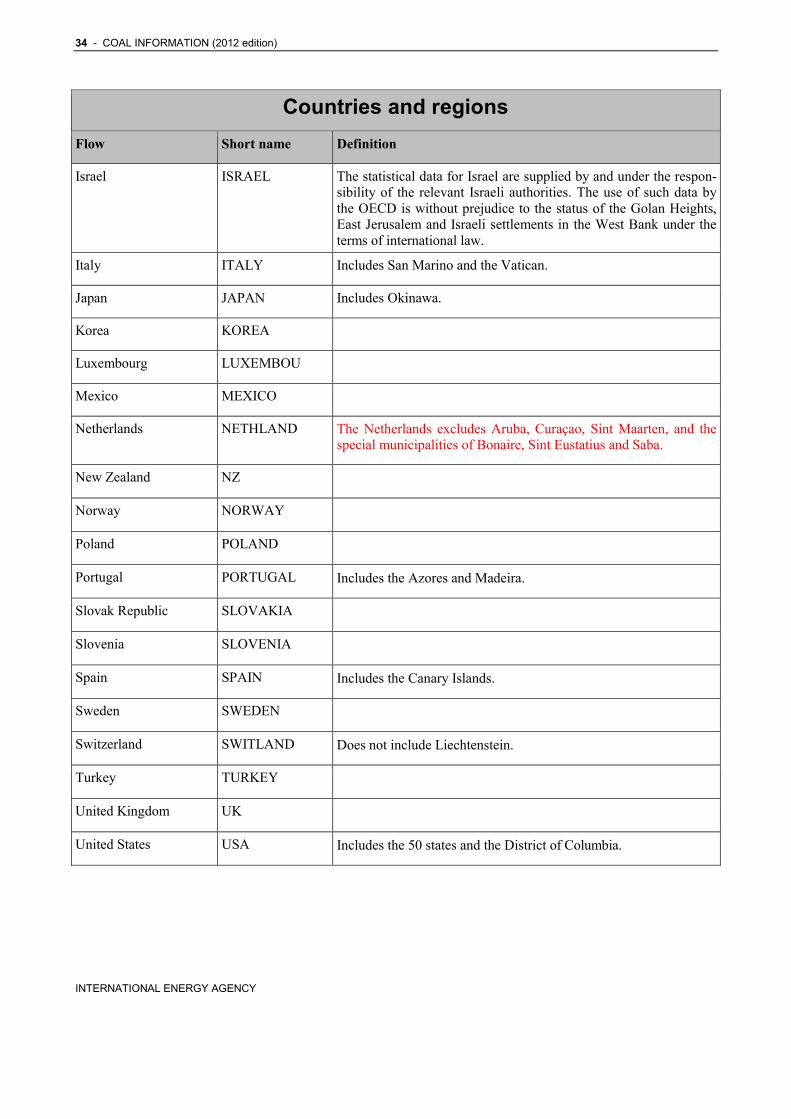
Israel ISRAEL The statistical data for Israel are supplied by and under the respon-sibility of the relevant Israeli authorities. The use of such data by the OECD is without prejudice to the status of the Golan Heights, East Jerusalem and Israeli settlements in the West Bank under the terms of international law.
Italy ITALY Includes San Marino and the Vatican.
Japan JAPAN Includes Okinawa.
Korea KOREA
Luxembourg LUXEMBOU
Mexico MEXICO
Netherlands NETHLAND The Netherlands excludes Aruba, Curaçao, Sint Maarten, and the special municipalities of Bonaire, Sint Eustatius and Saba.
New Zealand NZ
Norway NORWAY
Poland POLAND
Portugal PORTUGAL Includes the Azores and Madeira.
Slovak Republic SLOVAKIA
Slovenia SLOVENIA
Spain SPAIN Includes the Canary Islands.
Sweden SWEDEN
Switzerland SWITLAND Does not include Liechtenstein.
Turkey TURKEY
United Kingdom UK
United States USA Includes the 50 states and the District of Columbia.

COAL INFORMATION (2012 edition) - 35
Countries and regions Flow Short name Definition
OECD Total OECDTOT Includes Australia, Austria, Belgium, Canada, Chile, the Czech Re-public, Denmark, Estonia, Finland, France, Germany, Greece, Hun-gary, Iceland, Ireland, Israel, Italy, Japan, Korea, Luxembourg, Mex-ico, the Netherlands, New Zealand, Norway, Poland, Portugal, the Slovak Republic, Slovenia, Spain, Sweden, Switzerland, Turkey, the United Kingdom and the United States.
OECD Americas OECDAM Includes Canada, Chile, Mexico and the United States.
OECD Asia Oceania OECDAO Includes Australia, Israel, Japan, Korea and New Zealand.
OECD Europe OECDEUR Includes Austria, Belgium, the Czech Republic, Denmark, Estonia, Finland, France, Germany, Greece, Hungary, Iceland, Ireland, It-aly, Luxembourg, the Netherlands, Norway, Poland, Portugal, the Slovak Republic, Slovenia, Spain, Sweden, Switzerland, Turkey and the United Kingdom.
IEA Total IEATOT Includes Australia, Austria, Belgium, Canada, the Czech Republic, Denmark, Finland, France, Germany, Greece, Hungary, Ireland, Italy, Japan, Korea, Luxembourg, the Netherlands, New Zealand, Norway, Poland, Portugal, the Slovak Republic, Spain, Sweden, Switzerland, Turkey, the United Kingdom and the United States.
IEA Americas IEAAM Includes Canada and the United States.
IEA Asia Oceania IEAAO Includes Australia, Japan, Korea and United States.
IEA Europe IEAEUR Includes Austria, Belgium, Czech Republic, Denmark, Finland, France, Germany, Greece, Hungary, Ireland, Italy, Luxembourg, Netherlands, Norway, Poland, Portugal, the Slovak Republic, Spain, Sweden, Switzerland, Turkey and the United Kingdom.
Algeria ALGERIA
Angola ANGOLA
Benin BENIN
Botswana BOTSWANA
Cameroon CAMEROON
Congo CONGO

36 - COAL INFORMATION (2012 edition)
INTERNATIONAL ENERGY AGENCY
Countries and regions Flow Short name Definition
Democratic Rep. of Congo
CONGOREP
Cote d'Ivoire COTEIVOIRE
Egypt EGYPT
Eritrea ERITREA
Ethiopia ETHIOPIA
Gabon GABON
Ghana GHANA
Kenya KENYA
Libya LIBYA
Mauritius MAURITIUS
Morocco MOROCCO
Mozambique MOZAMBIQUE
Namibia NAMIBIA
Nigeria NIGERIA
Senegal SENEGAL
South Africa SOUTHAFRIC
Sudan SUDAN
United Republic of Tanzania
TANZANIA
Togo TOGO
Tunisia TUNISIA
Zambia ZAMBIA
Zimbabwe ZIMBABWE

COAL INFORMATION (2012 edition) - 37
Countries and regions Flow Short name Definition
Other Africa
OTHERAFRIC Includes Botswana (until 1980), Burkina Faso, Burundi, Cape Verde, Central African Republic, Chad, Comoros, Djibouti, Equa-torial Guinea, Gambia, Guinea, Guinea-Bissau, Lesotho, Liberia, Madagascar, Malawi, Mali, Mauritania, Namibia (until 1990), Ni-ger, Reunion, Rwanda, Sao Tome and Principe, Seychelles, Sierra Leone, Somalia, Swaziland and Uganda.
Bangladesh BANGLADESH
Brunei BRUNEI
Cambodia CAMBODIA
India INDIA
Indonesia INDONESIA
DPR of Korea KOREADPR
Malaysia MALAYSIA
Mongolia MONGOLIA
Myanmar MYANMAR
Nepal NEPAL
Pakistan PAKISTAN
Philippines PHILIPPINE
Singapore SINGAPORE
Sri Lanka SRILANKA
Chinese Taipei TAIPEI
Thailand THAILAND
Vietnam VIETNAM
Other Asia
OTHERASIA Includes Afghanistan, Bhutan, Cambodia (until 1994), Cook Is-lands, Fiji, French Polynesia, Kiribati, Laos, Macao, Maldives, Mongolia (until 1984), New Caledonia, Papua New Guinea, Sa-moa, Solomon Islands, East Timor, Tonga and Vanuatu.

38 - COAL INFORMATION (2012 edition)
INTERNATIONAL ENERGY AGENCY
Countries and regions Flow Short name Definition
Hong Kong (China) HONGKONG
People's Republic of China
CHINA
Albania ALBANIA
Armenia ARMENIA
Azerbaijan AZERBAIJAN
Belarus BELARUS
Bosnia and Herzegovina BOSNIAHERZ
Bulgaria BULGARIA
Croatia CROATIA
Cyprus CYPRUS
Georgia GEORGIA
Gibraltar GIBRALTAR
Kazakhstan KAZAKHSTAN
Kosovo KOSOVO
Kyrgyzstan KYRGYZSTAN
Latvia LATVIA
Lithuania LITHUANIA
FY Republic of
Macedonia
FYROM
Malta MALTA
Republic of Moldova MOLDOVA
Montenegro MONTENEGRO
Romania ROMANIA

COAL INFORMATION (2012 edition) - 39
Countries and regions Flow Short name Definition
Russia RUSSIA
Serbia SERBIA
Tajikistan TAJIKISTAN
Turkmenistan TURKMENIST
Ukraine UKRAINE
Uzbekistan UZBEKISTAN
Former Soviet Union (if no detail)
FSUND
Former Yugoslavia (if no detail)
YUGOND
Argentina ARGENTINA
Bolivia BOLIVIA
Brazil BRAZIL
Colombia COLOMBIA
Costa Rica COSTARICA
Cuba CUBA
Dominican Republic DOMINICANR
Ecuador ECUADOR
El Salvador ELSALVADOR
Guatemala GUATEMALA
Haiti HAITI
Honduras HONDURAS
Jamaica JAMAICA

40 - COAL INFORMATION (2012 edition)
INTERNATIONAL ENERGY AGENCY
Countries and regions Flow Short name Definition
Netherlands Antilles NANTILLES The Netherlands Antilles comprises Aruba (until 1986), Curaçao, Sint Maarten and the special municipalities of Bonaire, Sint Eustatius and Saba.
Nicaragua NICARAGUA
Panama PANAMA
Paraguay PARAGUAY
Peru PERU
Trinidad and Tobago TRINIDAD
Uruguay URUGUAY
Venezuela VENEZUELA
Other Non-OECD Americas
OTHERLATIN Includes Antigua and Barbuda, Aruba, Bahamas, Barbados, Belize, Bermuda, British Virgin Islands, Cayman Islands, Dominica, Falk-land Islands, French Guiana, Grenada, Guadeloupe, Guyana, Mar-tinique, Montserrat, St. Kitts and Nevis, Saint Lucia, St. Pierre and Miquelon, St. Vincent and Grenadines, Suriname and Turks and Caicos Islands.
Bahrain BAHRAIN
Islamic Republic of Iran IRAN
Iraq IRAQ
Jordan JORDAN
Kuwait KUWAIT
Lebanon LEBANON
Oman OMAN
Qatar QATAR
Saudi Arabia SAUDIARABI
Syria SYRIA

COAL INFORMATION (2012 edition) - 41
Countries and regions Flow Short name Definition
United Arab Emirates UAE
Yemen YEMEN
Africa
AFRICA Includes Algeria, Angola, Benin, Botswana (since 1981), Camer-oon, Congo, Democratic Republic of Congo, Côte d'Ivoire, Egypt, Eritrea (since 1992), Ethiopia, Gabon, Ghana, Kenya, Libya, Mau-ritius, Morocco, Mozambique, Namibia (since 1991), Nigeria, Senegal, South Africa, Sudan, United Republic of Tanzania, Togo, Tunisia, Zambia, Zimbabwe and Other Africa.
Asia excluding China
ASIA Includes Bangladesh, Brunei Darussalam, Cambodia (since 1995), Chinese Taipei, India, Indonesia, DPR of Korea, Malaysia, Mongo-lia (since 1985), Myanmar, Nepal, Pakistan, Philippines, Singa-pore, Sri Lanka, Thailand, Vietnam and Other Asia.
China Region CHINAREG China Region includes the People’s Republic of China and Hong Kong.
Non-OECD Europe and Eurasia
EURASIA Includes Albania, Armenia, Azerbaijan, Belarus, Bosnia and Her-zegovina, Bulgaria, Croatia, Cyprus, Gibraltar, Kazakhstan, Kyr-gyzstan, Latvia, Lithuania, Former Yugoslav Republic of Mace-donia (FYROM), Malta, Republic of Moldova, Romania, Russian Federation, Serbia, Former Soviet Union, Tajikistan, Turkmenistan, Ukraine, Uzbekistan and Former Yugoslavia.
Middle East
MIDDLEEAST Includes Bahrain, Islamic Republic of Iran, Iraq, Jordan, Kuwait, Lebanon, Oman, Qatar, Saudi Arabia, Syria, United Arab Emirates and Yemen.
Non-OECD Americas
LATINAMERI Includes Argentina, Bolivia, Brazil, Colombia, Costa Rica, Cuba, Dominican Republic, Ecuador, El Salvador, Guatemala, Haiti, Honduras, Jamaica, Netherlands Antilles, Nicaragua, Panama, Pa-raguay, Peru, Trinidad and Tobago, Uruguay, Venezuela and Other Latin America.
Non-OECD Total NONOECDTOT
World marine bunkers WORLDMAR
World WORLD


COAL INFORMATION (2012 edition) - 43
7. INTRODUCTION IEA Coal Information 2012 is the latest edition of an annual publication intended to provide sound market information on coal to policy and market analysts and those employed in all sectors of the coal industry.
This monitoring and reporting of historical trends and current energy market situation provides a strong foundation for policy and market analysis to better inform the policy decision process toward selecting policy instruments that are best suited to meet domes-tic and/or international objectives.
IEA Coal Information 2012 brings together in one volume, the basic statistics compiled by the IEA on coal supply, consumption, trade and prices for both member and non-member countries1. It also includes information on coal by-products.
Part I provides important documentation that will assist the reader in correctly using the data in this publication and to understand the details of the sta-tistical methodology and collection practices related to the coal data. In addition, calorific values used for preparing national energy balances and exchange rates used for the reporting of prices in US dollars are presented.
Part II of the publication provides a review of world coal market developments in 2010. It covers world coal production and coal reserves, coal consumption by type (total, steam, coking and lignite), steam and coking coal trade and prices.
Part III provides the reference tables to the Part II re-view on coal production, consumption, trade and prices. 1. This publication is without prejudice to the status of or sovereignty over any territory, to the delimitation of international frontiers and boundaries and to the name of any territory, city or area. In addition, the term “country” refers to a country or a territory, as the case may be.
Part IV provides, in tabular and graphic form, a more detailed and comprehensive statistical picture of coal developments in the 34 OECD member countries, by region and individually.
Part V provides for selected non-OECD countries summary statistics on coal supply and end-use statis-tics for about 40 countries and regions worldwide. Complete coal balances and coal trade data for se-lected years are presented for 15 major non-OECD coal-producing and consuming countries.
OECD data are taken from IEA/OECD databases of Energy Statistics that are based on annual, quarterly and monthly submissions from OECD Member coun-tries to the Secretariat. The Energy Data Centre of the IEA Secretariat works closely with national admini-stration to secure consistency in all time series with particular regard for IEA product definitions and re-porting conventions. This effort is supplemented by surveys of energy industry publications, national sta-tistics reports and other material. The finalized data provide the basis for IEA/OECD Energy Balances of OECD Countries and Energy Statistics of OECD Countries.
The non-OECD data are based upon information collected by the IEA Secretariat, official national submissions to the United Nations in Geneva and New York, and national energy publications. The resulting synthesis is published in Energy Balances of Non-OECD Countries and Energy Statistics of Non-OECD Countries. Users of this publication are directed to the Methodology Section of those publications for more detail on individual non-Member countries covered in the publication.
OECD coal balances and statistics, including itemized import and export data, are available on a CD-ROM, along with world supply data. Information on ordering the CD-ROM and other energy statistics publications

44 - COAL INFORMATION (2012 edition)
INTERNATIONAL ENERGY AGENCY
is available at the end of this book and on the IEA website at http://www.iea.org.
Price data in Parts II, III and IV are derived from the quarterly publication Energy Prices and Taxes. Readers should consult this IEA/OECD publication for detailed information on methodology, data coverage and data sources. Notes are available at: http://wds.iea.org/WDS/tableviewer/document.aspx?FileId=1389. In addition, a data service is available on the internet, which provides unlimited access through an annual subscription, as well as the possibility to obtain data on a pay-per-view basis. Details are available at http://data.iea.org.
Further information on reporting methodologies is also available on the IEA Web site.
Annual energy data are collected by the Energy Data Centre (EDC) of the IEA Secretariat, headed by Mr. Jean-Yves Garnier. The IEA would like to thank and acknowledge the dedication and professionalism of the statisticians working on energy data in the countries. OECD coal statistics in the EDC were the responsibility of Mr. Julian Smith. Ms. Rachael
Hackney and Mr. Taejin Park contributed to Part II, Part III and Part V and Mr. Tomasz Truś contributed to Part III, Part IV and Part V of the book. Mr. Robert Schnapp had overall responsibility for this publication.
Also in the IEA Secretariat, thanks are due to the non-OECD Member countries section headed by Mr. Pierre Boileau and to the OECD Balances section headed by Ms. Karen Tréanton.
Editorial and desktop publishing support from Ms. Sharon Burghgraeve is also gratefully acknowledged.
Enquiries, comments and suggestions are welcome and should be addressed to:
Robert Schnapp or Julian Smith Energy Data Centre, International Energy Agency 9, rue de la Fédération 75739 Paris Cedex 15 France Telephone: (33) (1) 40 57 66 31 or 40 57 67 02 Telefax: (33) (1) 40 57 66 49 E-mail: [email protected]
What’s New? Steam coal in previous editions consisted of anthracite, other bituminous coal, and in the case of 12 specific countries, sub-bituminous coal. Starting in this edition, steam coal now includes sub-bituminous coal for all countries.
Definitions of hard coal and brown coal remain unchanged. This means that hard coal is no longer calculable by adding together steam coal and coking coal. To avoid confusion, trade in particular may refer to total coal, which will be the sum of hard coal and brown coal, or anthracite, coking coal, other bituminous coal, sub-bituminous coal and lignite.
Limited data for Kosovo and Montenegro are now available. The region previously called Latin America will now be known as non-OECD Americas.
The OECD National Accounts has rebased the GDP and GDP PPP series from 2000 USD to 2005 USD. As a result, those series and all associated ratios now refer to 2005 USD.
Due to reductions in budget, the IEA no longer has adequate resources to provide complete information on en-ergy prices and taxes, so has had to suppress certain sections of Energy Prices and Taxes as of 1 January 2012. As a result, some price series have not been updated in this edition of Coal Information. The IEA considered it necessary to reduce the coverage of this publication in order to maintain the high quality of the remaining in-formation in Energy Prices and Taxes and other publications. We are hopeful that we may be able to restore these sections in the future if resources become available.

COAL INFORMATION (2012 edition) - 45
INTERNATIONAL ENERGY AGENCY
8. DEFINITIONS
Coal Coal is a family name for a variety of solid organic fuels and refers to a whole range of combustible sedimentary rock materials spanning a continuous quality scale. For convenience, this continuous series is often divided into two main categories, which are themselves divided into two subcategories:
• Hard coal • Anthracite • Bituminous coal
- Coking coal - Other bituminous coal
• Brown coal • Sub-bituminous coal • Lignite
In cases where data are presented in Mtoe or Mtce in this book and sourced to OECD/IEA Energy Balances, the term “Coal” includes all primary coal types listed above, peat, and coal products (patent fuel, coke oven coke, gas coke, coal tar, BKB, coke oven gas, gas works gas, blast furnace gas, and oxygen steel furnace gas).
Classifying different types of coal into practical cate-gories for use at an international level is difficult for two reasons:
Divisions between coal categories vary between clas-sification systems, both national and international, based on calorific value, volatile matter content, fixed carbon content, caking and coking properties, or some combination of two or more of these criteria.
Although the relative value of the coals within a par-ticular category depends on the degree of dilution by
moisture and ash and contamination by sulphur, chlorine, phosphorous and certain trace elements, these factors do not affect the divisions between categories.
Coal quality can vary and it is not always possible to ensure that the available descriptive and analytical information is truly representative of the body of coal to which it refers.
The International Coal Classification of the Economic Commission for Europe (UNECE) recognises two broad categories of coal:
i) Hard coal - Coal of gross calorific value not less than 5 700 kcal/kg (23.9 GJ/t) on an ash-free but moist basis and with a mean random reflectance of vitrinite of at least 0.6.
ii) Brown coal - Non-agglomerating coal with a gross calorific value less than 5 700 kcal/kg (23.9 GJ/t) containing more than 31% volatile matter on a dry mineral matter free basis.
The IEA has adopted the basis of these definitions of hard coal and brown coal in this book and in other publications for presenting statistics relating to coal production, trade and consumption.
It should be stressed that this classification system is based on the inherent qualities of the coal in question and not on the final use of the coal. In this way the classification system attempts to be objective and simple to apply.
Primary coal used in pulverised (or granular) coal injection in blast furnaces is commonly abbreviated to PCI (or GCI) coal. (In this book PCI includes GCI). The IEA does not have a separate category for PCI as the term defines a particular end-use for coal. In IEA statistics, PCI is included in steam coal, except for Japan and Korea, where it is included with coking coal.
Data presented in this book may be different from that presented in the national publications of individual countries because the countries may have adopted a
Energy sources

46 - COAL INFORMATION (2012 Edition)
INTERNATIONAL ENERGY AGENCY
different coal classification and reporting system that better suits their particular national needs. As far as possible, national coal statistics reported by the IEA in this book and in other publications have been adjusted to be consistent with the IEA definitions noted above.
Furthermore, in order to improve the information base for coal market analysis and projections, these two categories of coal have been further sub-divided in IEA/OECD Coal Statistics from 1978 as follows:
Hard coal Hard coal is calculated as the sum of anthracite and bituminous coals.
• Anthracite is a high-rank, hard coal used mainly for industrial and residential heat raising.
• Bituminous coal is a medium-rank coal used for gasification, industrial coking and heat raising and residential heat raising. Bituminous coal that can be used in the production of a coke capable of supporting a blast furnace charge is known as cok-ing coal.
• Other bituminous coal, not included under coking coal, is also commonly known as thermal coal. Also included are recovered slurries, middlings and other low-grade, higher-rank coal products not further classified by type.
Note that for the following countries, hard coal also includes sub-bituminous coal: Australia, Belgium, Chile, Finland, France, Iceland, Japan, Korea, Mex-ico, New Zealand, Portugal and the United States.
Except for these 12 countries, steam coal for all other countries in the world is equivalent to the sum of an-thracite and other bituminous coal.
Brown coal Brown coal is calculated as the sum of sub-bituminous coal and lignite. Oil shale mined and combusted directly is also currently reported as lig-nite. (Shale oil is reported as other hydrocarbons.)
• Sub-bituminous coal: non-agglomerating coals with a gross calorific value between 4 165 kcal/kg (17.4 GJ/t) and 5 700 kcal/kg (23.9 GJ/t) on an ash-free but moist basis.
• Lignite: non-agglomerating coal with a gross calo-rific value less than 4 165 kcal/kg (17.4 GJ/t) on an ash-free but moist basis.
Note that for 12 countries (listed above), sub-bituminous coal is included in hard coal, not brown
coal. Under current methodology, lignite data also includes oil shale (but not shale oil).
Steam Coal Steam coal in this publication contains all anthracite, other bituminous coal and sub-bituminous coal.
In prior years, all hard coals that were not coking coal (including the sub-bituminous coal from the excepted countries) were classed as steam coal. This also in-cluded by necessity countries (not listed) where sub-bituminous coal was unable to be separated from other bituminous coal data for reporting purposes.
For the Coal Information 2012 publication, the defini-tion of steam coal was adjusted to include all sub-bituminous coals. This move was done to achieve greater congruence with practical, formal and infor-mal definitions of steam coal in the market and coal industry at large.
The definitions of hard coal and brown coal remain unchanged and consistent with the UNECE guidelines above and InterEnerStat definitions, so hard coal can no longer be calculated by adding steam coal data to coking coal data.
Coal products Derived solid fuels are products resulting from the transformation or manufacturing of hard coal, brown coal or other primary solid fuels, sometimes with the addition of other materials.
Coke oven coke Coke oven coke is the solid product obtained from the carbonisation of coal, principally coking coal, at high temperature. Semi-coke, the solid product obtained from the carbonisation of coal at lower temperatures is also included, along with coke and semi-coke made from lignite.
Gas coke
Gas coke is a solid by-product of coal used for the production of town gas in gas works. Gas coke is used for heating purposes.
Patent fuel
Patent fuel is a composition fuel manufactured from coal fines by shaping with the addition of a binding agent such as pitch.
COAL INFORMATION (2012 edition) - 47
INTERNATIONAL ENERGY AGENCY
Brown coal briquettes (BKB) BKB are composition fuels manufactured from brown coal. The brown coal is crushed, dried and moulded under high pressure into an even shaped briquette without the addition of binders. Peat briquettes, dried brown coke, fines and dust and brown coal breeze are also included.
Coal tar Coal tar is the liquid by-product of the destructive distillation of bituminous coal to make coke in the coke oven process. Coal tar can also be the result of low-temperature carbonisation of brown coal. Coal tar can be further distilled into different organic products (e.g. benzene, toluene, naphthalene), which normally would be reported as a feedstock to the petrochemical industry.
Coke oven gas Coke oven gas is obtained as a by-product of solid fuel carbonisation and gasification operations carried out by coke producers and iron and steel plants not connected with gas works and municipal gas plants.
Gas works gas Gas works gas covers all types of gas produced in public utility or private plants, whose main purpose is the manufacture, transport and distribution of gas. It includes gas produced by carbonisation (including gas produced by coke ovens and transferred to gas works), by total gasification (with or without enrichment with oil products) and by reforming and simple mixing of gases and/or air. Note: Starting with the 2011 edition, gas works gas is included with coal for the years 1990 and beyond. Before 1990, gas works gas is included with natural gas.
Blast furnace gas Blast furnace gas is obtained as a by-product in oper-ating blast furnaces. It is recovered upon leaving the furnace and used partly within the plant and partly in other steel industry processes or used in power sta-tions equipped to burn it.
Oxygen steel furnace gas Oxygen steel furnace gas is obtained as a by-product of the production of steel in an oxygen furnace; it is recovered upon leaving the furnace. The gas is also known as converter gas, LD gas or BOS gas.
Peat A solid formed from the partial decomposition of dead vegetation under conditions of high humidity and limited air access (initial stage of coalification). It is available in two forms for use as a fuel, sod peat and milled peat. Milled peat is also made into briquettes for fuel use. Peat is not considered a renew-able resource as its regeneration period is long.
Coal resources and reserves Quantifying mineable coal is based on a consideration of geological, mining and economic criteria. The amount of coal in place and, in some cases, the amount of mineable coal is influenced by national resource measurement criteria. The basis for comput-ing these resources varies from country to country and, therefore, it must be borne in mind that for this reason, direct comparisons are sometimes not possi-ble. During the 1990s, there was a considerable dis-cussion on the adoption of internationally recognised standards for reporting reserves. This largely stems from the requirements of capital markets for improved transparency in reserve estimation where project fi-nancing is being sought. However, to date there has not been any adoption of international standards. There are, however, some generally recognised defini-tions that can be applied.
Resources
Resources refer to the amount of coal that may be present in a deposit or a coalfield. This does not take into account the feasibility of mining the coal eco-nomically. Not all resources are recoverable using current technology. Reserves constitute those re-sources that are recoverable.
Reserves Reserves may be defined further in terms of proved (or measured) reserves, and probable (or indicated) reserves, based on exploration results and the degree of confidence in those results. Probable reserves have been estimated with a lower degree of confidence than proved reserves. Estimates take account of coalfields’ geological characteristics, in particular the regularity, thickness and quality of seams, the spacing of explo-ration boreholes and other exposures, and geological discontinuities such as faults or folding, all of which affect the practical recoverability of the coal.

48 - COAL INFORMATION (2012 Edition)
INTERNATIONAL ENERGY AGENCY
Proved reserves
Proved reserves are those reserves that are not only confidently considered to be recoverable, but can also be recovered economically under current market con-ditions. In other words, they take into account what current mining technology can achieve, as well as the economics of recovery (mining, transportation and other relevant recovery costs, such as government royalties, and coal prices). Proved reserves will, therefore, fluctuate according to economic conditions, especially price.
Heat and electricity Data for electricity and heat includes disaggregated data on inputs and outputs of ‘combined heat and power’ and on ‘district heating’. Data on heat became available in different years for different countries and thus aggregated country data should be used with cau-tion. Total electricity production includes production from both main activity producers (formerly known as public) and autoproducers. Generally, the split of total electricity production between main activity producers and autoproducers is available only after 1973.
Coal balances are presented in detail in Parts IV and V. In Part IV, Table 5 presents uses in the rows and selected years in the columns. Data is presented in millions of tonnes of coal equivalent (Mtce). One tonne of coal equivalent is 7 million kilocalories.
Each table is divided into three main parts: the first shows supply elements, the second shows the trans-formation processes and energy industries, and the third shows final consumption broken down into vari-ous end-use sectors.
Both primary fuels such as coal and peat, and derived fuels such as coke oven coke and blast furnace gas are included in the calculations. However, derived prod-ucts manifest themselves as positive outputs in the relevant transformation process used to create them. Generally they should be less than the inputs, which result in a net negative entry in the transformation flow. Given that this balance is restricted to coal and associated products, inputs from other fuel types (such as pitch for patent fuels, or oil, gas and renewable inputs to blast furnaces) will not be recorded, nor will
electricity generated, both of which differ from a full energy balance.
The energy balance flows detailed below have the following functions, and may appear in other tables:
Supply
Production
Production is the production of primary energy, i.e. hard coal, brown coal, peat, shale oil, etc. Produc-tion is calculated after the removal of impurities. It is important to note that derived products such as coke oven coke and patent fuel, while included in the bal-ances, do not appear in production.
Imports and exports
Imports and exports comprise amounts having crossed the national territorial boundaries of the coun-try, whether or not customs clearance has taken place. Coal in transit is not included.
Stock changes
Stock changes reflects the difference between opening stock levels on the first day of the year and closing levels on the last day of the year of stocks on national territory held by producers, importers, energy trans-formation industries and large consumers. A stock build is shown as a negative number and a stock draw as a positive number. It is presented this way as this is how it affects the domestic supply, as opposed to how it describes the changes in stocks.
Total primary energy supply Total primary energy supply (TPES) consists of pro-duction + imports - exports ± stock changes as an ab-stract concept. Given that exports and stock builds both are represented as negative numbers, in reality TPES = production + imports + exports + stock changes.
Statistical differences
Statistical differences includes the sum of the unex-plained statistical differences for individual fuels, as they appear in the basic energy statistics. It also in-cludes the statistical differences that arise because of the variety of conversion factors in the coal and oil columns. See the introduction to Energy Statistics of OECD Countries for further details.
Flows: energy balance

COAL INFORMATION (2012 edition) - 49
INTERNATIONAL ENERGY AGENCY
Transformation processes
Transformation processes record the transformation of one kind of fuel or energy into another with both in-puts and outputs being measured. This may bridge several transformation processes. For instance:
• Coking coal used to manufacture coke oven coke would be reported as a negative input to the coke oven transformation process.
• The resulting coke oven coke, coal tar and coke oven gas would be reported as a positive output to the coke oven transformation process flow.
• Energy inputs from other sources, including elec-tricity, will not be reported in this particular in-stance. Therefore, numbers may not be indicative of true efficiencies, but rather map the flow of coal.
• The coke oven coke will largely be used to pro-duce pig-iron in a blast furnace. Therefore, it will be reported where it is used and mainly as an input to the blast furnace transformation process.
• The by-product blast furnace gas will appear as an output in the blast furnace transformation flow. However, a significant amount of energy is lost in the process of making the pig-iron, so the net negative value in the blast furnace transformation flow will tend to be approximately 60% of the to-tal energy inputs.
• The blast furnace gas (and coal tar and coke oven gas) will likewise be reported where used. Some of this will appear in the relevant consumption flows, other parts might be used to generate electricity and appear in electricity transformation.
• In a complete energy balance, the electricity gen-erated would be converted to the appropriate en-ergy unit and reported as a positive output in the applicable electricity transformation flow. This is not the case in the coal balance, so the number displayed in the electricity transformation flow is the fuel input, not the process efficiency loss.
The main transformation processes reported either make a derived coal product or a by-product and have been described earlier in the Energy sources section or are mentioned below.
Electricity and heat generation
Electricity and heat generation can refer to electricity plants, combined heat and power plants (CHP), or
heat plants. Both main activity producer1 and autopro-ducer2 plants are included here. Electricity plants are plants which are designed to produce electricity only. If one or more units of the plant is a CHP unit (and the inputs and outputs cannot be distinguished on a unit basis), then the whole plant is designated as a CHP plant.
Note that for autoproducer CHP plants, all fuel inputs to electricity production are taken into account. How-ever, only the part of the fuel inputs used to produce the heat that is sold is shown. Fuel inputs for the pro-duction of heat that is consumed within the autopro-ducer's establishment are not included here but are included in the final consumption of fuels in the appropriate consuming sector.
Heat plants (including heat pumps and electric boil-ers) are designed to produce heat only, which is sold to a third party under the provisions of a contract. Heat pumps that are operated within the residential sector, where the heat is not sold, are not considered a transformation process and are not included here. However, the electricity consumption appears as resi-dential use.
Other transformation
Other transformation covers non-specified transfor-mation and transformations not shown elsewhere, such as coal liquefaction.
Energy industry own use
Energy industry own use contains the primary and secondary energy consumed by transformation indus-tries for heating, pumping, traction and lighting pur-poses [ISIC 3 05, 06, 19 and 35, Group 091 and Classes 0892 and 0721]. These quantities are shown as negative figures. Included here is, for example, own use of energy in coal mines.
1. Main activity producer generate electricity and/or heat for sale to third parties, as their primary activity. They may be privately or pub-licly owned. Note that the sale need not take place through the public grid. 2. Autoproducer undertakings generate electricity and/or heat, wholly or partly for their own use as an activity which supports their primary activity. They may be privately or publicly owned. 3. International Standard Industrial Classification of All Economic Activities, Series M, No. 4 / Rev. 4, United Nations, New York, 2008.

50 - COAL INFORMATION (2012 Edition)
INTERNATIONAL ENERGY AGENCY
Losses
Losses includes losses in gas distribution, flaring or venting of manufactured gases, electricity transmis-sion and coal transport.
Consumption Total final consumption (TFC) is the sum of con-sumption by the different end-use sectors.
Industry consumption is specified in the following sub-sectors. Note that energy used for transport by industry is not included here but is reported under transport.
Transport includes all fuels used for the transport [ISIC Divisions 49 to 51] of goods or persons between points of departure and destination within the national territory irrespective of the economic sector within which the activity occurs.
Other covers residential, commercial and public ser-vices [ISIC Divisions 33, 36-39, 45-47, 52, 53, 55, 56, 58-66, 68-75, 77-82, 84 (excluding Class 8422), 85-88, 90-96 and 99], agriculture/forestry [ISIC Divi-sions 01 and 02], fishing [ISIC Division 03] and non-specified consumption.
Conversion (to toe and tce)
Most IEA/OECD publications showing inter-fuel rela-tions and projections present such information in a common energy unit, the tonne of oil equivalent (toe). A tonne of oil equivalent is defined as 107 kcal (41.868 GJ), a convenient measure because it is ap-proximately the net heat content of one ton of average crude oil. This unit is used by the IEA/OECD in its energy balances. Note also that totals may not be the sum of their components due to independent rounding.
The change from using the original unit to tonne of oil equivalent implies choosing coefficients of equiva-lence between different forms and sources of energy. This problem can be approached in many different ways. For example, one could adopt a single equiva-lence for each major primary energy source in all countries, e.g. 29 307 kJ/kg (7 000 kcal/kg) for hard coal, 41 868 kJ/kg (10 000 kcal/kg) for oil.
The main objection to this method is that it results in distortions since there is a wide spread in calorific values between types of coal and individual coal products, and between calorific values of these fuels in different countries.
The Secretariat has, therefore, obtained specific calo-rific factors supplied by the national administrations for the main categories of each quality of coal and for each flow or use (i.e. production, imports, exports, electricity generation, coke ovens, blast furnaces and industry). The set of particular national calorific val-ues that allow for the conversion of energy sources from original (physical) units to joules are presented later in Part I.
Iron and steel ISIC Group 241 and Class 2431
Chemical and petrochemical industry
ISIC Divisions 20 and 21, excluding petrochemical feedstocks
Non-ferrous metals ISIC Group 242 and Class 2432
Non-metallic minerals ISIC Division 23, such as glass, ceramic, cement, etc.
Transport equipment ISIC Divisions 29 and 30
Machinery ISIC Divisions 25 to 28, comprises fabricated metal products, machinery and equipment other than transport equipment
Mining (excluding fuels) and quarrying
ISIC Divisions 07 and 08 and Group 099
Food and tobacco ISIC Divisions 10 to 12
Paper, pulp and printing ISIC Divisions 17 and 18
Wood and wood products ISIC Division 16, other than pulp and paper
Construction ISIC Divisions 41 to 43
Textile and leather ISIC Divisions 13 to 15
Non-specified ISIC Divisions 22, 31 and 32, any manufacturing industry not included above
Note: Most countries have difficulties supplying an industrial breakdown for all fuels. In these cases, the non-specified industry row has been used. Regional aggregates of industrial consumption should therefore be used with caution.
Units and conversions

COAL INFORMATION (2012 edition) - 51
INTERNATIONAL ENERGY AGENCY
The balances are expressed in terms of net calorific value. The difference between net and gross being the latent heat of vaporisation of the water produced dur-ing combustion of the fuel. For coal and oil, net calo-rific value is usually around 5% less than gross and for most forms of natural and manufactured gas the difference is 9-10%. The use of net calorific value is consistent with the practice of the Statistical Offices of the European Communities and the United Nations.
In this report some data are reported in terms of tonnes of coal equivalent (tce) because this unit is more widely used in the international coal industry. A tonne of coal equivalent is defined as 7 million kilocalories. The relation between tonne of oil equivalent (toe) and tonne of coal equivalent (tce) is therefore:
1 tce = 0.7 toe
Note that billion refers to thousand million (109). Also, in many cases totals shown in the tables may not be the sum of their components due to independent rounding.
Gas In the IEA/OECD publication Energy Statistics of OECD Countries all data on gases are expressed in terajoules, on the basis of their gross calorific value.
1 terajoule = 0.00002388 Mtoe.
To calculate the net heat content of a gas from its gross heat content, multiply the gross heat content by the appropriate following factor:
Natural gas 0.9 Gas works gas 0.9 Coke oven gas 0.9 Blast furnace gas 1.0 Oxygen steel furnace gas 1.0
Electricity Figures for electricity production, trade, and final con-sumption are calculated using the energy content of the electricity, i.e. at a rate of 1 TWh = 0.086 Mtoe. Hydro-electricity production (excluding pumped stor-age) and electricity produced by other non-thermal means (wind, tide, photovoltaic, etc.) are accounted for similarly using 1 TWh = 0.086 Mtoe. However, the primary energy equivalent of nuclear electricity is calculated from the gross generation by assuming a 33% efficiency, i.e. 1 TWh = (0.086 ÷ 0.33) Mtoe. In the case of electricity produced from geothermal heat the primary equivalent is calculated assuming an effi-ciency of 10%, so 1 TWh = (0.086 ÷ 0.1) Mtoe, unless the actual value is known.
Heat Information on heat is supplied to the Secretariat in terajoules. For autoproducers, only heat sold is re-ported. Fuels consumed by autoproducers for produc-tion of own-use heat are reported as consumption, not transformation.


COAL INFORMATION (2012 edition) - 53
INTERNATIONAL ENERGY AGENCY
9. SOURCES AND NOTES
Energy flows data reported for 2011 (shown as 2011e) are preliminary estimates based on the submissions received in early 2012 and on quarterly submissions to the IEA from member countries.
The fuels listed as “solar, wind, tide” also include wave and ocean, unless otherwise noted.
Statistics of non-OECD countries presented in this publication are based on available data at the time of publishing and may differ from the final non-OECD data to be published in Energy Statistics of Non-OECD Countries.
Additional information on methodologies and report-ing conventions are included in the notes in Energy Balances of OECD Countries 2012 edition and Energy Statistics of OECD Countries 2012 edition.
Preliminary 2011 data - 2011e Data reported for the year 2011 in this publication are preliminary and presented as 2011e. Final 2011 data on solid fuels and manufactured gases will be submit-ted by OECD Member countries to the Secretariat in annual questionnaires in late 2012. As a result, final data for 2011 and preliminary 2012 data will be pub-lished in the 2013 edition of Coal Information in July 2013.
Selected coal data for 2011 for some non-OECD countries have been estimated by the Secretariat, as was the case for two OECD countries: Iceland and Turkey.
Qualifiers Data marked as ‘e’ are estimates of the IEA Secre-tariat. Data marked as ‘c’ mean that the data are con-fidential due to country specific regulations. Data
marked as ‘..’ mean that data are not available (either not collected or not submitted by national govern-ment). Data marked as ‘x’ mean that they are not applicable or there is no meaningful explanation of a value there. For example, the price cannot be shown if the consumption in the country is forbidden or the country itself did not exist as an independent entity at a given point in time.
Treatment of blast furnace coke and PCI data Data on coke used and pulverised coal injected in the blast furnace (PCI) are harmonized for all OECD countries in order to ensure that steam and coking coal consumption data are consistently presented and that comparisons between countries for consumption are meaningful. The main effect of these revisions has been to revise the reported consumption of coal in the iron and steel industry.
It should be noted that in IEA statistics of coal trade and consumption, PCI is not separately specified; rather it is included with steam coal for all countries (except Japan). This classification is based on the fact that most PCI coal is of a steam coal quality and not coking coal quality. For Japan and Korea, PCI con-sumption is reported in this book as a coking coal in order to be consistent with the national practice of including imports of PCI coal with coking coal.
Energy prices are published quarterly in the IEA/OECD Energy Prices and Taxes. IEA data on coal prices are managed in two sub-systems, which vary not only in content, but also with respect to the data collection methods.
• Import and export unit values • End-user prices
General notes
Price data

I.54 - COAL INFORMATION (2011 Edition) PART I
INTERNATIONAL ENERGY AGENCY
Import and export unit values Import and export unit values are calculated quarterly (March, June, September and December) from na-tional customs statistics import and export volumes and values. The basic data are collected from monthly national trade sources (Japan, United States, Australia and Canada) or provided monthly to the IEA by the Statistical Office of the European Communities (Eurostat).
Values recorded at the import stage are the sum of cost, insurance and freight (CIF), but exclude import duties. Values recorded at the export stage (FOB), exclude seaborne or international transport, but in-clude inland transport costs of the exporting country.
As far as possible, the concept of ‘general imports and exports’ is used. This includes coal imports for re-export with or without processing, but excludes transit trade.
The definitions of coal categories and the volume and value units used in each of the above source systems vary considerably. A certain amount of regrouping and unit conversions is necessary once the basic data are compiled.
The rules for regrouping coal categories are consistent with the definitions used in the annual IEA/OECD coal statistics. Prices are compiled for steam coal and for coking coal. Definitions and the correspondence to national and European classifications are discussed in detail in the quarterly IEA publication Energy Prices and Taxes. Comments in Energy Prices and Taxes on certain data items, as well as general background in-formation, are developed systematically. Data com-ments relate mainly to calorific values of specific coal trade flows and to national coal definitions. Back-ground information covers duties and trade regulations.
Due to reductions in budget, the IEA no longer has adequate resources to provide complete information on energy prices and taxes, so has had to suppress certain sections of Energy Prices and Taxes as of 1 January 2012. This included steam and coking coal import and export data for the year gone. As a result, it has not been possible to provide these price series with 2011 data in this edition of Coal Information. We are hopeful that we may be able to restore these sections in the fu-ture if resources become available.
End-user prices End-user prices are collected quarterly from national administrations and other relevant bodies and supple-mented with data extracted from national publications.
Although a standard approach to reporting the data has been developed, differences in definitions be-tween countries are explained in the notes published in Energy Prices and Taxes.
The standard approach to reporting end-use prices can be summarised as follows:
• includes transport costs to the consumer; • shows prices actually paid, i.e. net of rebates; and • includes taxes which have to be paid by the con-
sumer as part of the transaction and which are not refundable. This excludes value added taxes paid in many European countries by industry (including electric power stations) for all goods and services (including energy). In these cases, value added taxes are refunded to the customer, usually in the form of a tax credit. Therefore, it is not shown as part of the prices.
A standard coal quality for international comparisons of end-use prices is not possible given the wide vari-ety of coal qualities in domestic and international coal trade. As a result, only average prices covering differ-ent qualities are collected, along with the calorific value of these average qualities. If average prices are not available, prices of a selected coal may be chosen. Accordingly, international comparisons of coal end-use prices may be misleading. Detailed notes concern-ing these price series are published in Energy Prices and Taxes. Also, please refer to Energy Prices and Taxes for the detailed description of price mechanisms in each country and country specific notes.
Derived price data The information collected on prices is converted by the IEA Secretariat into a variety of secondary data in order to facilitate its analysis. Inter-fuel price com-parisons for one country are usually made on the basis of prices per heat unit such as a tonne of coal equiva-lent. In the end-user price tables, the conversion factor used for converting gross calories to net calories for natural gas is 0.9.
Inter-country price comparisons are made on the basis of a standard currency unit, e.g., US dollars. Prices for regional totals are calculated as the weighted average of the available price data in the region and, therefore, prices shown should be considered as only indicative.
For coal exports and imports, customs unit values are prices reported by OECD Member countries.
Customs unit values are average values derived from customs’ administrations total volume and total value

COAL INFORMATION (2012 edition) - 55
INTERNATIONAL ENERGY AGENCY
data. These data indicate broad price movements as they are averages of all qualities of coal without re-gard to the end-use of the coal or to the contract terms and conditions under which the trade occurs.
End-user prices are those paid by end-users in the power sector and in industry and are reported by Member countries in a quarterly reporting system which the IEA’s Standing Group on Long Term Co-operation initiated in 1981. Data received are pub-lished in the IEA quarterly publication Energy Prices and Taxes.
Unless otherwise stated, prices are reported in US dollars in the year specified (i.e. current US dollars).
In addition to the official price statistics presented, coal price statistics published in the industry press are used to summarise short-term spot steam and coking coal price trends. Although not “official” in that they are not provided by member countries, there is a high correlation between prices published by the industry press and national coal price statistics.
Readers who are interested in more recent data should consult the OECD/IEA publication Oil, Gas, Coal and Electricity Quarterly Statistics which is published in January, March, June and September each year.
This book provides current, accurate and detailed sta-tistics on quarterly production, supply and demand and trade of the major energy forms mainly in, but not limited to, the OECD area.
The information contained in this publication consists of:
Oil - Production of crude oil and NGL for the major
producers in the world. - Refinery balances for crude oil, NGL, refinery
feedstocks, and total (including inputs of origin other than crude oil and NGL);
- Complete product balances of production, trade, refinery intake and output, final consumption, stock levels and changes;
- Crude, NGL and feedstock imports from 47 ori-gins and exports to 24 destinations; and
- Trade data for main product groups, LPG and naphtha; imports from 44 origins and exports to 30 destinations.
Natural gas - Balances of supply and consumption of OECD
member countries; and
- Imports from 28 origins and exports to 20 destinations.
Coal - World steam and coking coal, and lignite production;
- World steam coal and coking coal trade; and
- Coking coal and steam coal imports and exports for major OECD countries.
Electricity - Electricity production, (separately from combusti-
ble fuel, nuclear, hydro and other sources) imports, exports and (apparent) consumption in OECD member countries.
Historical data (1960-2010) The annual historical data in Part IV of this report are taken from the IEA/OECD databases of energy statis-tics which are based on annual submissions from all OECD Member countries.
i) IEA/OECD coal statistics This database of annual statistics for OECD countries covers all primary solid fuels, derived fuels and re-lated manufactured gases. It contains detailed supply/demand balances for each fuel, as well as information on coal trade by origin and destination. The main data from this system are published annually in the IEA/OECD publication Coal Information.
ii) IEA/OECD electricity statistics This database of annual statistics for OECD countries covers generating capacity and electricity production from main activity producers and autoproducers plants. It includes information on electricity produc-tion by fuel type and supply/demand balances for electricity and for heat sold to third parties from dif-ferent types of power and heat plants. The main data from this system are published annually in the IEA/OECD publication Electricity Information.
Quarterly energy statistics
Data sources

I.56 - COAL INFORMATION (2011 Edition) PART I
INTERNATIONAL ENERGY AGENCY
iii) IEA/OECD oil and gas statistics This database of annual statistics for OECD countries covers crude oil, NGL, refinery feedstocks and natural gas, as well as derived oil products. It includes detailed supply/demand balances, trade by origin and destination and stock levels and changes.
The main data from this system are published annu-ally in the IEA/OECD publications Oil Information and Natural Gas Information.
iv) IEA/OECD renewables statistics This database of annual statistics for OECD countries covers hydro, solid biofuels, geothermal, renewable municipal waste, wind, gas from biofuels, solar photovoltaic, solar thermal, tide/wave/ocean, non-renewable municipal waste and industrial waste. It includes detailed supply/demand balances.
The main data from this system are published annually in the IEA/OECD publication Renewables Information.
v) IEA/OECD energy statistics
This annual database integrates data from the four IEA/OECD statistical database systems listed above to provide a summary of energy supply and demand for each OECD country. It includes detailed statistics on production, trade and consumption for each source of energy, expressed in original units (e.g. metric tons, TJ, GWh).
The main data from this data system are published annually in the IEA/OECD publication Energy Statis-tics of OECD Countries. Detailed country notes refer-ring to historical data can be found in this publication.
vi) IEA/OECD energy balances Overall energy balances are constructed annually for all OECD countries from the basic energy statistics
described above. The overall energy balance data are expressed in a common energy unit of tons of oil equivalent (toe), and presented in a standard matrix format. The balances are published annually in the IEA/OECD publication Energy Balances of OECD Countries in which detailed country notes referring to historical data can be found.
vii) IEA/OECD energy prices and taxes The statistics were discussed separately above. The prices and taxes are published quarterly in IEA/OECD Energy Prices and Taxes.
viii) Energy statistics of non-OECD countries
The annual historical data for non-OECD countries presented in Part V of this report are taken from IEA/OECD databases of energy statistics of non-OECD countries. These databases are compiled from data submitted annually to the IEA Secretariat in questionnaires from non-OECD Member countries of the United Nations Economic Commission for Europe (UNECE), from data provided by other international organisations (the United Nations in New York, the Organización Latinoamericana de Energía (OLADE) in Quito, the Asia-Pacific Economic Cooperation fo-rum (APEC) in Tokyo and the Food and Agriculture Organization of the United Nations (FAO) in Rome, etc.), from direct communications with na-tional administrations, industry contacts and from published sources.
The main data from this data system are published an-nually in the IEA/OECD publications Energy Statistics of Non-OECD Countries and Energy Balances of Non-OECD Countries. Detailed country notes referring to historical data can be found in these publications.
COAL INFORMATION (2012 edition) - 57
INTERNATIONAL ENERGY AGENCY
10. COUNTRY NOTES In many cases, data submitted by Member countries to the Secretariat do not conform to the standard report-ing methodology or have other particular characteris-tics. Information set out below will assist readers to interpret data for particular countries and aid in the comparison of data among countries.
In the 2012 edition, data for Australia were revised back to 2006 due to the adoption of the National Greenhouse and Energy Reporting (NGER) data as the main energy consumption data source for the Austra-lian Energy Statistics. As a result, there are breaks in the time series for many data between 2005 and 2006.
All data refer to the fiscal year, (e.g. July 2009 to June 2010 for 2010). For the 2002 data, the Australian Administration began to use a new survey methodol-ogy which has caused shifts in the structure of indus-try consumption. The Australian Administration is planning to revise the historical series.
Data on blast furnace gas for electricity production by autoproducers begins in 1986. Consumption in wood and wood products is included in paper, pulp and print from 2001 onwards. The drop in BKB production in 2004 was due to a fire in the main production plant. Only anthra-cite for export is reported separately; the remainder that is consumed domestically is included with coking coal and other bituminous coal. Revisions in the 2012 edition also resulted in reclassification of some coal.
Sub-bituminous coal is included in hard coal.
Historical revisions by the Austrian Administration have resulted in some breaks in series between 1989 and 1990.
In the 2011 edition, the Austrian Administration has revised the consumption data for coke oven coke from 1999 and lignite from 2001. Other bituminous coal includes patent fuel. “Trockenkohle” is included with BKB because of its high calorific value. Since 1996, gas works gas is reported with natural gas because it is distributed in the same network. The amount of gas works gas is negligible and it is mostly consumed by households. The last lignite mine closed in the second quarter of 2004 and lignite use for power generation ceased in 2006.
Sub-bituminous coal is included in brown coal.
Sub-bituminous coal data reported in from other sources refer to coal recuperated from coal dumps. Production of other bituminous coal ceased on 31 August 1992. The use of coke oven gas in the chemical and petrochemical industries ceased in 1996. The decrease of bituminous coal and coke oven coke in the iron and steel industry in 2002 is due to the clo-sure of several plants.
Sub-bituminous coal is included in hard coal.
Due to the unavailability of data, non-energy use of coke oven coke and hard coal is included with final
Australia
Austria
Belgium
Canada

I.58 - COAL INFORMATION (2011 Edition) PART I
INTERNATIONAL ENERGY AGENCY
consumption sectors prior to 1978 and 1980, respec-tively. Before 1978, lignite inputs to main activity producer heat plants are included in final consump-tion. Starting in 1979, these inputs are included in main activity producer electricity plants. Due to a Canadian confidentiality law, it is not possible for the Canadian Administration to submit disaggregated se-ries for all of the coal types. Between 2002 and 2006, the IEA Secretariat has estimated some of the missing series. The data for 2007 onwards are given directly as reported. The Canadian Administration is planning to further refine its reporting.
Sub-bituminous coal is included in brown coal.
From 1990, consumption in paper and pulp includes forestry and consumption in agriculture is included in non-specified industry. In general, a new methodol-ogy has been applied for data since 1990, leading to other breaks in series between 1989 and 1990. In the 2012 edition, the Chilean Administration has revised the coal time series back to 2004. Other bituminous coal includes sub-bituminous coals.
Data are available starting in 1971.
Final consumption data were submitted by the Czech Administration starting with 1996 data. Due to eco-nomic restructuring in the consumption sectors in the late 1990s (large state enterprises subdividing and/or privatising and the utilisation of new technologies by businesses), there might be breaks in time series in these sectors. Data for 1990 to 1995 were estimated based on the Czech publication Energy Economy Year Book. In 1995, town gas production (included in gas works gas) ceased. Revisions by the Czech Admini-stration have resulted in some breaks in series be-tween 2001 and 2002. Production from other sources of other bituminous coal in 2004 is from coal slurries. Other bituminous coal includes sub-bituminous coals.
Coal which had been previously classified as sub-bituminous coal until the 2008 edition is now reported under lignite for all years.
In the 2004 edition, major revisions were made by the Danish Administration for the 1990 to 2001 data, which may cause breaks in time series between 1989 and 1990.
A large increase of steam coal imports in 2003 is related to a draught in Scandinavia. Thermal power plants were operated more intensively to replace hydro-generated electricity that is consumed in the country. Additionally, more coal-generated electricity was exported to other countries in the region.
Sub-bituminous coal is included in brown coal.
Data for Estonia are available starting in 1990. Prior to that, they are included in Former Soviet Union in Energy Statistics of Non-OECD Countries.
Data reported as lignite are for oil shale. Sub-bituminous coal is included in brown coal.
A new survey system and a reclassification of the data lead to breaks in the time series between 1999 and 2000 for most products and sectors. The new survey system is more detailed and has better product cover-age especially in electricity, CHP and heat production, as well as in industry.
A large increase of steam coal imports in 2003 is re-lated to a draught in Scandinavia. Thermal power plants were operated more intensively to replace hydro-generated electricity that is consumed in the country. Additionally, more coal-generated electricity was ex-ported to other countries in the region. Likewise, peat production is highly dependant upon favourable weather conditions and the pricing of other fuels. The decrease in peat and other bituminous coal usage in main activity electricity plants was due to record elec-tricity generation from hydro plants.
The first coking plant started operation in 1987, hence imports of coking coal and production of coke oven coke and coke oven gas started in that year. Coal tars used for non-energy purposes are not reported in pro-duction or consumption. The increase of other bitumi-
Chile
Czech Republic
Denmark
Estonia
Finland

COAL INFORMATION (2012 edition) - 59
INTERNATIONAL ENERGY AGENCY
nous coal inputs into main activity producer electricity plants from 1993 to 1994 was due to coal replacing imported electricity and hydro power. Production of gas works gas ceased in April 1994.
Sub-bituminous coal is included in hard coal.
Prior to 1985, consumption of colliery gas is included with the use of coke oven gas by autoproducers. Final consumption in industry is estimated by the Secretariat from 1986 to 2001 for some products. For 1989 to 1998, the IEA Secretariat has estimated industry con-sumption based on Consommations d’Energie dans l‘Industrie, SESSI.
Sub-bituminous coal is included in hard coal.
The German Administration has changed the method-ology for reporting heat. Between 2003 and 2006, autoproducer heat output was provided, but not inputs. Starting in 2007, more information is available on main activity heat plants and additional inputs started to be reported for this category. This causes breaks in series between 2006 and 2007.
Due to the reclassification of several sectors by the German Administration, breaks in series may occur between 1990 and 1992. This particularly affects BKB, lignite and coke oven coke. BKB inputs to gas works plants stopped in 1997. Breaks in time series may occur between 1998 and 1999 for coke oven gas and blast furnace gas. Up to 2003, other bituminous coal includes anthracite. Breaks in the time series for coke oven gas from 2007 are due to a change in statis-tical source. Consumption of non-renewable munici-pal waste and other solid biofuels as a reductant oc-curs in German blast furnaces, but is not currently quantified. Likewise, coal tar is a by-product of coke ovens, but not currently reported.
Sub-bituminous coal is included in brown coal.
Electricity production using hard coal ceased in 1989. A new main activity producer electricity plant using imported bituminous coal was brought on-line in
1991. Production of gas works gas ceased in 1997. Lignite has been used in main activity producer CHP plants since 1997. Production of BKB/peat briquettes ceased in 2009.
Sub-bituminous coal is included in brown coal.
Data are available from 1965.
From 1992, the production of sub-bituminous coal has been included with lignite due to the low quality of the coal. The use of this domestic coal in main activity producer electricity and CHP plants has also been reclassified to lignite. Autoproducer heat and power plants using coke oven gas and blast furnace gas were reclassified in 1998 as main activity power plants.
Sub-bituminous coal is included in brown coal.
Prior to 1970, final consumption includes inputs and outputs to heat production. The industrial classifica-tions used by the Icelandic Administration were changed in 1987. Final consumption increased in 2000 due to a new iron and steel plant coming on-line.
Provisional data for 2011e are estimated by the IEA Secretariat.
Sub-bituminous coal is included in hard coal.
Production data for peat briquettes (BKB) are avail-able from 1975. Low production of peat in 1985 was due to a poor “harvest”. The production of gas works gas ceased in 1987 due to fuel switching to natural gas. Other bituminous coal inputs to main activity producer electricity plants increased from 1986 due to three new generating units at Moneypoint coming on-line. A reclassification causes a break in the time se-ries for peat consumption in the energy industry own use in BKB plants from 1989 to 1990. Patent fuel data and some export data are confidential.
Sub-bituminous coal is included in brown coal.
France
Germany
Greece
Hungary
Iceland
Ireland

I.60 - COAL INFORMATION (2011 Edition) PART I
INTERNATIONAL ENERGY AGENCY
Data are available starting in 1971.
Data reported as lignite are oil shale.
Sub-bituminous coal is included in brown coal.
In the 2011 edition, industry and transformation data were revised for 2004 to 2007 according to the same methodology as used in 2008 and 2009. This led to breaks in series between 2003 and 2004.
From 1986 onwards, figures from lignite are given using the same methodology as in the Bilancio Ener-getico Nazionale. In 1991, all industrial activities were reclassified on the basis of ISTAT/NACE 91. This has implied some transfer of activities which may result in some anomalies between 1991 and ear-lier years. Due to a change in the survey system, breaks in time series may occur between 1997 and 1998 for final consumption. Prior to 2009, sub-bituminous coal used in main activity electricity plants was included with other bituminous coal.
Sub-bituminous coal is included in brown coal.
Between 2004 and 2007, the IEA received a series of revisions from the Japanese Administration. The first set of revisions received in 2004 increased the 1990 supply by 5% for coal, 2% for natural gas and 0.7% for oil compared to the previous data. This led to an increase of 2.5% in 1990 CO2 emissions calculated using the Reference Approach while the Sectoral Approach remained fairly constant. For the 2006 edi-tion, the IEA received revisions to the coal and oil data which had a significant impact on both the en-ergy data and the CO2 emissions. The most significant revisions occurred for coke oven coke, naphtha, blast furnace gas and petroleum coke. These revisions af-fected consumption rather than supply in the years concerned. As a result, the Sectoral Approach CO2 emissions increased for all the years, however at dif-ferent rates. For example, the Sectoral Approach CO2 emissions for 1990 were 4.6% higher than those cal-
culated for the 2005 edition, while the 2003 emissions were 1.1% higher than those of the previous edition.
Due to the impact these successive revisions have had on the final energy balance, as well as on CO2 emis-sions, the IEA was in close contact with the Japanese Administration to better understand the reasons be-hind these changes. These changes were mainly due to the Government of Japan's efforts to improve the in-put-output balances in the production of oil products and coal products in response to inquiries from the UNFCCC Secretariat. To cope with this issue, the Japanese Administration established a working group in March 2004. The working group completed its work in April 2006. Many of its conclusions were incorporated in the 2006 edition, but some further revisions to the time series (especially in industry and other) were submitted for the 2007 edition.
Starting in 1990, data are reported on a fiscal year basis (e.g. April 2009 to March 2010 for 2009).
From 1982, residential use of coke oven coke is in-cluded in commercial/public services sector. Oxygen steel furnace gas data are available from 1982. The inputs of coke oven coke to blast furnaces, as well as the final consumption of coke oven coke in iron and steel, have been estimated by the IEA Secretariat starting in 1990. From 1998, inputs of coke oven gas, blast furnace gas and oxygen steel furnace gas into autoproducer electricity plants include the amount used to produce electricity with TRT technology (Top pressure Recovery Turbines) which was previously included in industry. Since the 2010 edition, the net calorific values for coal have been recalculated by the IEA Secretariat based upon gross values submitted by Japan.
Coal injected in blast furnaces (PCI) is classified as coking coal in order to be consistent with Japanese trade statistics. With the 2008 edition, Japan has re-classified part of the coal inputs to coke ovens as in-puts to blast furnaces.
Asymmetric statistical differences in hard coal since 2004 are primarily due to deliberate stock builds by final consumers.
Sub-bituminous coal is included in hard coal.
Israel
Italy
Japan

COAL INFORMATION (2012 edition) - 61
INTERNATIONAL ENERGY AGENCY
Data are available from 1971.
Data for 2002 onwards have been reported on a dif-ferent basis, causing breaks in series between 2001 and 2002, especially for inputs and outputs to electric-ity generation and consumption in the iron and steel industry. The Korean Administration is planning to revise the historical series as time and resources permit.
Data for coal and coal products from 1971 to 2001 are based on information provided by the Korean Administration, as well as information from the Year-book of Energy Statistics 2002, the Yearbook of Coal Statistics 2001 (both from the Ministry of Commerce, Industry and Energy), and Statistics of Electric Power in Korea 2001 (from the Korea Electric Power Corporation). Data on sub-bituminous coal were esti-mated by the IEA Secretariat based on statistics of the exporting countries. Consumption of imported coke oven coke starting in 2002 is reported under non-specified industry. Consumption of manufactured gases in the iron and steel industry starting in 2002 includes the consumption in blast furnaces, oxygen steel furnaces and other iron and steel processing plants. Blast furnace gas used for energy purposes in blast furnaces prior to 2007 are reported in the iron and steel industry. Coal tar production prior to 2007 is not available at this time.
Sub-bituminous coal is included in hard coal.
Steel production from blast furnaces ceased at the end of 1997. For the 2011 edition, the Luxembourgian Administration revised the time series from 2000 for most coal and coal products. Time series for brown coal briquettes consumption were revised from 1990.
Sub-bituminous coal is included in hard coal.
Data are available starting in 1971 and are partly es-timated based on the publication Balance Nacional - Energía. The Mexican Administration submitted data directly by questionnaire for the first time with 1992 data. As a result, some breaks in time series may oc-cur between 1991 and 1992. In the 2011 edition, the Mexican Administration revised selected historical data.
The time series for blast furnace gas and inputs of coke oven coke to blast furnaces starts in 1991.
Sub-bituminous coal is included in hard coal.
In the national statistical system of the Netherlands, use of fuel in manufacturing industries for CHP production is considered to be consumption in the transformation sector. However, in IEA statistics, this own use for heat production (autoproduced heat) is reported under the relevant industry sub-sector, based on estimates provided by the Central Bureau of Statistics.
For 1984 to 1986, production from other sources of other bituminous coal represents a stock of "smalls" washed for re-use. Prior to 1989, non-energy use is included with industry consumption.
Coal exports consist of re-exported volumes after blending.
Sub-bituminous coal is included in brown coal.
Where data refer to the fiscal year, April 2010 to March 2011 is shown as 2010. In the 2011 edition, the New Zealand Administration has revised some of the coal, natural gas, oil, renewable and electricity time series back to 1990.
A reorganisation of government departments during 1987 leading to the cessation of certain data series has resulted in several breaks in time series between 1987 and 1988.
Korea
Luxembourg
Mexico
Netherlands
New Zealand
I.62 - COAL INFORMATION (2011 Edition) PART I
INTERNATIONAL ENERGY AGENCY
Production of gas works gas ceased in 1988. Peat, although produced in New Zealand, is not used as a fuel. It is used for agricultural purposes only. In fi-nal consumption, some industry data are reported in non-specified industry for confidentiality reasons. Prior to 2009, mining and quarrying is included in agriculture. Prior to 2010, construction is included with commercial/public services. Sub-bituminous coal inputs into autoproducer CHP refers to coal that is merged with iron sands and limestone to form the in-puts for the multi-hearth-furnaces, kilns and melters to produce direct reduced iron (Glenbrook Steel Site), with off-gases and supplemental and natural gas driv-ing the CHP plants. This method, while not a typical iron and steel process, produces similar by-products. The sub-bituminous coal inputs are reported under coke ovens and the resulting off-gases are reported as production of coke oven gas and blast furnace gas. Some transformation efficiencies will appear higher than normal due to non-reporting of certain inputs including some confidential data.
Sub-bituminous coal is included in hard coal.
Production of coking coal, coke oven coke and coke oven gas ceased in the late 1980s. Other bituminous coal includes lignite. The decrease of bituminous coal production in 2005 is due to a fire in one of the coal mines; this entailed a break in the production for a large part of the year.
Sub-bituminous coal is included in brown coal.
For the 2011 edition, the Polish Administration has revised the time series for blast furnace gas, coke oven gas and other bituminous coal from 2001 to 2007. Time series for coke oven coke were revised for the years 1990 to 2001.
Sub-bituminous coal is included in brown coal.
Between 1997 and 2001, gas works gas was gradually replaced by natural gas in the commercial/public ser-
vices and residential sectors. The production of pig iron ceased in the first quarter of 2001, leading to decreases in supply and consumption of coking coal, coke oven coke, coke oven gas and blast furnace gas in 2001.
Sub-bituminous coal is included in hard coal.
Data are available starting in 1971.
There are some breaks in series between 1992 and 1993. A new survey system in 2001 leads to major breaks in series for most products. Commercial/public services includes statistical differences for other bitu-minous coal, lignite, patent fuel and coke oven coke from 1980 onwards and BKB from 1989 onwards.
Sub-bituminous coal is included in brown coal.
Data for Slovenia are available starting in 1990. Prior to that, they are included in Energy Statistics of Non-OECD Countries in Former Yugoslavia. A new energy data collection system was implemented in January 2001, causing some breaks in time series be-tween 1999 and 2000. Sub-bituminous coal is included in brown coal.
Lignite mining was halted indefinitely in 2008. For 1999-2003, anthracite is included in other bituminous coal.
Sub-bituminous coal is included in brown coal.
Other bituminous coal production is coal recovered during the quarrying of clay. Autoproducer inputs to waste heat production that is sold are reported in the respective final consumption sectors and not in transformation.
Sub-bituminous coal is included in brown coal.
Norway
Poland
Portugal
Slovak Republic
Slovenia
Spain
Sweden

COAL INFORMATION (2012 edition) - 63
INTERNATIONAL ENERGY AGENCY
From 1999, data on consumption result from a new survey and are not comparable with data of previous years.
From 1985, industrial consumption of gas works gas is reported in non-specified industry to prevent the disclosure of commercially confidential data. Alloca-tion of consumption data between certain coal types is estimated by the Swiss Administration, as are calorific values.
Sub-bituminous coal is included in brown coal.
Production of gas works gas declined in 1989 due to plant closures; the last plant closed in 1994. Use of gas coke and gas works gas ceased in 1994. Due to government regulations in industry and residential, in particular, there has been a shift from the use of do-mestically produced coal to imported coal and natural gas. The privatisation of state owned coke ovens in recent years results in incomplete information on coke oven gas distribution. Data for 2008 are provided from the results of an improved questionnaire. There-fore, significant changes occur in consumption pat-terns within the iron and steel industry, coal mining as well as across industry, residential and commercial/public services for other bituminous coal. Some coal used in cement kilns is reported under construction instead of non-metallic minerals since 2008. Histori-cal data may be revised in future issues.
Provisional data for 2011e are estimated by the IEA Secretariat.
Sub-bituminous coal is included in brown coal.
Consumption shown for the commercial/public ser-vices includes consumption of some of non-specified other. Prior to 1994, the consumption of substitute natural gas is included with natural gas, while its pro-duction is included with gas works gas.
Sub-bituminous coal is included in brown coal.
Due to problems in reporting, there are numerous breaks in series for the US data, particularly in 1992, 1999, 2001 and 2002. Care should be taken when evaluating consumption by sector since inputs of fuel to autoproducers are included in final consumption for some years. No data are available for most energy products in the construction and mining and quarrying industries.
In 2002, the United States reported “synfuel” produc-tion as patent fuel for the first time. Prior to 2002, the consumption of this fuel was reported with other bi-tuminous coal. Production ceased in 2007 for eco-nomic reasons. Since the Energy Information Admini-stration (EIA) and the US Department of Commerce do not collect separate data on patent fuel exports by country, total exports of patent fuel are included in the exports of other bituminous coal. Coal tar as a by-product of coke ovens is not currently reported.
Sub-bituminous coal is included in hard coal.
Switzerland
Turkey
United Kingdom
United States


COAL INFORMATION (2012 edition) - 65
INTERNATIONAL ENERGY AGENCY
11. GEOGRAPHICAL COVERAGE Australia excludes the overseas territories.
Denmark excludes the Danish Faroes and Greenland.
France includes Monaco, but excludes the following overseas departments and territories: Guadeloupe, Guyana, Martinique, New Caledonia, French Polynesia, Reunion, and St.-Pierre and Miquelon.
Germany includes the new federal states of Germany from 1970 onwards.
The statistical data for Israel are supplied by and un-der the responsibility of the relevant Israeli authori-ties. The use of such data by the OECD is without prejudice to the status of the Golan Heights, East Jerusalem and Israeli settlements in the West Bank under the terms of international law.
Italy includes San Marino and the Vatican.
Japan includes Okinawa.
The Netherlands excludes Suriname and the Netherlands Antilles.
Portugal includes the Açores and Madeira.
Spain includes the Canary Islands.
Switzerland does not include Liechtenstein.
United States includes 50 States and the District of Columbia.
OECD Total comprises Australia, Austria, Belgium, Canada, Chile, the Czech Republic, Denmark, Estonia 1 , Finland, France, Germany, Greece,
1. Estonia and Slovenia are included starting in 1990. Prior to 1990, data for Estonia are included in Former Soviet Union and data for Slovenia in Former Yugoslavia in the publication Energy Statistics of Non-OECD Countries.
Hungary, Iceland, Ireland, Israel, Italy, Japan, Korea, Luxembourg, Mexico, Netherlands, New Zealand, Norway, Poland, Portugal, the Slovak Republic, Slovenia1, Spain, Sweden, Switzerland, Turkey, the United Kingdom and the United States, With the exception of Chile, Estonia, Iceland, Israel, Mexico, and Slovenia, all 34 OECD member coun-tries are also member countries of the IEA. IEA re-gional totals include only IEA Member countries and, therefore, exclude non-IEA Members shown in italics below.
The following countries are included in the regional aggregates. OECD Total is the sum of the three re-gional aggregates.
OECD Americas comprises Canada, Chile, Mexico and the United States.
OECD Asia Oceania comprises Australia, Israel, Japan, Korea and New Zealand.
OECD Europe comprises Austria, Belgium, Czech Republic, Denmark, Estonia, Finland, France, Germany, Greece, Hungary, Iceland, Ireland, Italy, Luxembourg, Netherlands, Norway, Poland, Portugal, the Slovak Republic, Slovenia, Spain, Sweden, Switzerland, Turkey and the United Kingdom.
The European Union - 27 (EU-27) includes Austria, Belgium, Bulgaria, Cyprus, the Czech Republic, Denmark, Estonia, Finland, France, Germany, Greece, Hungary, Ireland, Italy, Latvia, Lithuania, Luxembourg, Malta, the Netherlands, Poland, Portugal, Romania, the Slovak Republic, Slovenia, Spain, Sweden and the United Kingdom. Please note that in the interest of having comparable data, all these countries are included since 1990 despite different entry dates into the European Union.

I.66 - COAL INFORMATION (2011 Edition) PART I
INTERNATIONAL ENERGY AGENCY
Non-OECD Europe and Eurasia includes Albania, Armenia, Azerbaijan, Belarus, Bosnia and Herzegovina, Bulgaria, Croatia, Cyprus 2 , Gibraltar, Kazakhstan, Kosovo3 (from 2000), Kyrgyzstan, Latvia, Lithuania, the Former Yugoslav Republic of Macedonia, Malta, the Republic of Moldova, Montenegro3 (from 2005), Romania, the Russian Federation, Serbia3, the Former Soviet Union 4 , Tajikistan, Turkmenistan, Ukraine, Uzbekistan and Former Yugoslavia4.
Africa includes Algeria, Angola, Benin, Botswana (from 1981), Cameroon, Congo, the Democratic Republic of Congo, Côte d’Ivoire, Egypt, Eritrea, Ethiopia, Gabon, Ghana, Kenya, Libya, Morocco, Mozambique, Namibia (from 1991), Nigeria, Senegal, South Africa, Sudan (including the newly formed Republic of South Sudan), the United Republic of Tanzania, Togo, Tunisia, Zambia, Zimbabwe and Other Africa.
Other Africa includes Botswana (until 1980), Burkina Faso, Burundi, Cape Verde, the Central African Republic, Chad, Comoros, Djibouti, Equatorial Guinea, Gambia, Guinea, Guinea-Bissau, Lesotho, Liberia, Madagascar, Malawi, Mali, Mauritania, Mauritius, Namibia (until 1990), Niger, Reunion, Rwanda, Sao Tome and Principe, Seychelles, Sierra Leone, Somalia, Swaziland, Uganda and Western Sahara (from 1990).
Non-OECD Americas includes Argentina, Bolivia, Brazil, Colombia, Costa Rica, Cuba, the Dominican Republic, Ecuador, El Salvador, Guatemala, Haiti, Honduras, Jamaica, the Netherlands Antilles,5 Nicaragua,
2. Note by Turkey: With respect to the Cyprus question, Turkey reserves its position as stated in its declaration of 1 May 2004. The information in the report under the heading Cyprus relates to the southern part of the Island. There is no single authority representing both Turkish and Greek Cyp-riot people on the Island. Turkey recognises the Turkish Republic of Northern Cyprus (TRNC). Until a lasting and equitable solution is found within the context of United Nations, Turkey shall preserve its position concerning the “Cyprus issue”. Note by all the European Union Member States of the OECD and the European Commission: The Republic of Cyprus is recognised by all members of the United Nations with the exception of Turkey. The information in this report relates to the area under the effective control of the Government of the Republic of Cyprus. 3. Data for Serbia include Montenegro until 2004 and Kosovo until 1999. 4. Data are shown only under Former Soviet Union and Former Yugoslavia until 1989. From 1990 onward, data are shown by country only. 5. The Netherlands Antilles was dissolved on 10 October 2010, re-sulting in two new “constituent countries” of the Netherlands (Curaçao and Saint Maarten), with the other islands joining the Netherlands as “special municipalities”. However, due to a lack of detailed data, the Secretariat’s data and estimates under the “Netherlands Antilles” still
Panama, Paraguay, Peru, Trinidad and Tobago, Uruguay, Venezuela and Other non-OECD Americas.
Other non-OECD Americas includes Antigua and Barbuda, Aruba, Bahamas, Barbados, Belize, Bermuda, the British Virgin Islands, the Cayman Islands, Dominica, the Falkland Islands, French Guyana, Grenada, Guadeloupe, Guyana, Martinique, Montserrat, Puerto Rico6 (for natural gas and electricity), St. Kitts and Nevis, Saint Lucia, Saint Pierre et Miquelon, St. Vincent and the Grenadines, Suriname, and Turks and Caicos Islands.
Asia includes Bangladesh, Brunei Darussalam, Cambodia (from 1995), Chinese Taipei, India, Indonesia, the DPR of Korea, Malaysia, Mongolia (from 1985), Myanmar, Nepal, Pakistan, the Philippines, Singapore, Sri Lanka, Thailand, Vietnam and Other Asia.
Other Asia includes Afghanistan, Bhutan, Cambodia (until 1994), Cook Islands, East Timor, Fiji, French Polynesia, Kiribati, Laos, Macau, Maldives, Mongolia (until 1984), New Caledonia, Palau (from 1994), Papua New Guinea, Samoa, the Solomon Islands, Tonga and Vanuatu.
China includes the People’s Republic of China and Hong Kong (China).
Former Yugoslavia4 includes Bosnia and Herzegovina, Croatia, the Former Yugoslav Republic of Macedonia, Serbia3 (including Kosovo and Montenegro) and Slovenia.
Former Soviet Union4 includes Armenia, Azerbaijan, Belarus, Estonia, Georgia, Kazakhstan, Kyrgyzstan, Latvia, Lithuania, the Republic of Moldova, the Russian Federation, Tajikistan, Turkmenistan, Ukraine, and Uzbekistan.
Middle East includes Bahrain, the Islamic Republic of Iran, Iraq, Jordan, Kuwait, Lebanon, Oman, Qatar, Saudi Arabia, Syria, the United Arab Emirates and Yemen.
Please note that the following countries have not been considered due to lack of data:
• Non-OECD Europe and Eurasia: Liechtenstein7 (except for oil data);
• Africa: Saint Helena; • America: Anguilla; and • Asia and Oceania: Christmas Island, Nauru and Niue.
refer to the whole territory of the Netherlands Antilles as it was known prior to 10 October 2010. 6. Oil statistics as well as coal trade statistics for Puerto Rico are included under the United States. 7. Oil data for Liechtenstein are included under Switzerland.

COAL INFORMATION (2012 edition) - 67
INTERNATIONAL ENERGY AGENCY
12. ABBREVIATIONS, CONVERSION FACTORS AND CALORIFIC VALUES
Units and technical abbreviations
t : metric ton = tonne = 1000 kg kt : thousand tonnes Mt : million tonnes toe : tonne of oil equivalent Mtoe : million tonnes of oil equivalent tce : tonne of coal equivalent (= 0.7 toe) Mtce : million tonnes of coal equivalent kcal : kilocalories (103 calories) MBtu : million British thermal units GWh : million kilowatt hours USD : US dollars
CIF : cost, insurance and freight FAS : free alongside ship FOB : free on board GDP : Gross Domestic Product GCV : gross calorific value PCI : coals for pulverised injection TPES : Total primary energy supply
EU : European Union FSU : Former Union of Soviet Socialist Republics/Soviet Union OECD : Organisation for Economic Co-operation and Development UN : United Nations UNECE : United Nations Economic Commission for Europe
0 or 0.0 : negligible
c : confidential e : estimated .. : not available - : nil x : not applicable

I.68 - COAL INFORMATION (2011 Edition) PART I
INTERNATIONAL ENERGY AGENCY
General conversion factors for energy
To: TJ Gcal Mtoe MBtu GWh
From: multiply by:
TJ 1 238.8 2.388 x 10⁻⁵ 947.8 0.2778
Gcal 4.1868 x 10⁻³ 1 10-7 3.968 1.163 x 10⁻³
Mtoe 4.1868 x 10⁴ 107 1 3.968 x 10⁷ 11630
MBtu 1.0551 x 10⁻³ 0.252 2.52 x 10⁻⁸ 1 2.931 x 10⁻⁴
GWh 3.6 860 8.6 x 10⁻⁵ 3412 1
Conversion factors for mass
To: kg t lt st lb
From: multiply by:
kilogramme (kg) 1 0.001 9.84 x 10⁻⁴ 1.102 x 10⁻³ 2.2046
tonne (t) 1000 1 0.984 1.1023 2204.6
long ton (lt) 1016 1.016 1 1.120 2240
short ton (st) 907.2 0.9072 0.893 1 2000
pound (lb) 0.454 4.54 x 10⁻⁴ 4.46 x 10⁻⁴ 5.0 x 10⁻⁴ 1
Conversion factors for volume
To: gal U.S. gal U.K. bbl ft3 l m3
From: multiply by:
U.S. gallon (gal) 1 0.8327 0.02381 0.1337 3.785 0.0038
U.K. gallon (gal) 1.201 1 0.02859 0.1605 4.546 0.0045
Barrel (bbl) 42.0 34.97 1 5.615 159.0 0.159
Cubic foot (ft3) 7.48 6.229 0.1781 1 28.3 0.0283
Litre (l) 0.2642 0.220 0.0063 0.0353 1 0.001
Cubic metre (m3) 264.2 220.0 6.289 35.3147 1000.0 1
Decimal prefixes
101 deca (da) 10-1 deci (d)
102 hecto (h) 10-2 centi (c)
103 kilo (k) 10-3 milli (m)
106 mega (M) 10-6 micro (µ)
109 giga (G) 10-9 nano (n)
1012 tera (T) 10-12 pico (p)
1015 peta (P) 10-15 femto (f)
1018 exa (E) 10-18 atto (a)
The conversion factors shown above are available online with greater precision at: http://www.iea.org/stats/unit.asp

COAL INFORMATION (2012 edition) - 69
INTERNATIONAL ENERGY AGENCY
2010 COUNTRY SPECIFIC AVERAGE NET CALORIFIC VALUES [kJ/kg]
Anthracite Coking coal
Other bituminous
coal
Sub-bituminous
coal
Lignite Peat Patent fuels
Coke oven coke
Coal tar BKB
Australia - 28 683 25 700 18 478 9 800 - - 25 650 35 714 20 995
Austria 28 033 29 073 27 869 22 200 8 967 8 800 31 000 29 000 41 800 19 303
Belgium 25 184 29 308 25 781 - 8 370 - 29 308 27 696 - 20 000
Canada 26 381 27 720 24 219 18 238 14 286 - - 28 830 - -
Chile - 28 638 22 650 - - - - 28 642 41 366 -
Czech Republic 30 000 28 709 25 131 - 12 682 - - 27 939 36 936 20 740
Denmark - - 24 439 - - - - 29 300 - 18 300
Estonia - - 27 155 - 8 995 9 734 - - - 16 000
Finland - 29 300 25 098 - - 10 190 - 29 300 37 000 -
France - 30 500 26 000 - 17 000 - 32 000 28 000 38 000 -
Germany 28 951 29 000 26 298 - 9 060 - 31 400 28 650 - 21 468
Greece - - 26 906 - 5 418 - - 30 314 - -
Hungary - 31 430 24 750 17 283 7 242 - 22 000 29 971 38 000 20 000
Iceland - 28 050 28 050 - - - - 26 670 - -
Ireland 27 980 - 27 839 - 19 820 8 237 - - - 18 548
Israel - - 25 087 - 2 931 - - - - -
Italy - 30 984 26 587 18 832 10 468 - - 29 000 - -
Japan 26 362 28 130 24 801 - - - - 29 400 35 393 -
Korea 24 198 28 261 24 911 20 934 - - 19 259 29 308 37 000 -
Luxembourg 26 700 - 29 300 - - - - 28 500 - 20 100
Mexico - 23 483 23 483 19 405 14 100 - - 26 521 - -
Netherlands 29 300 28 671 24 824 - 20 000 - - 28 500 41 900 -
New Zealand - 29 647 27 497 20 630 14 531 - - 29 500 - -
Norway - - 28 100 - - - - 28 500 - -
Poland - 29 517 23 086 - 8 563 - 23 180 24 630 37 704 17 479
Portugal 31 783 - 25 605 - - - - 29 398 - -
Slovak Republic 26 990 29 500 25 808 - 11 634 - 28 000 28 268 - 17 000
Slovenia - - 25 226 19 090 11 035 - - 29 531 - -
Spain 19 438 28 978 22 131 8 621 - - - 28 500 38 519 -
Sweden - 30 000 27 400 - - 12 638 - 28 080 - -
Switzerland 28 100 - 28 100 - 20 100 - - 28 100 - -
Turkey - 26 964 26 541 18 321 9 268 - - 27 668 - -
United Kingdom - 28 834 24 914 - - - 30 970 28 310 38 519 -
United States 28 799 29 665 26 816 19 016 13 873 - - 28 842 - -
Source: IEA/OECD Coal Statistics

I.70 - COAL INFORMATION (2011 Edition) PART I
INTERNATIONAL ENERGY AGENCY
Coal classification The IEA collects statistics on coal production, trade and consumption according to a technically precise classification based on the quality of coal as follows: • Anthracite is a high rank, non-agglomerating coal with a gross calorific value not less than 23 865 kJ/kg
(5 700 kcal/kg) on an ash-free but moist basis; • Coking coal is hard coal suitable for the production of coke that can support a blast furnace charge; • Other bituminous coal is an agglomerating coal with a gross calorific value not less than 23 865 kJ/kg
(5 700 kcal/kg) on an ash-free but moist basis; • Sub-bituminous coal is a non-agglomerating coal with a gross calorific value between 23 865 kJ/kg
(5 700 kcal/kg) and 17 435 kJ/kg (4 165 kcal/kg) containing more than 31% volatile matter on a dry mineral matter-free basis; and
• Lignite is a non-agglomerating coal with a gross calorific value less than 17 435 kJ/kg (4 165 kcal/kg) and greater than 31% volatile matter on a dry mineral matter-free basis. Oil shale is included in lignite.
However, when publishing these data, the IEA sometimes adopts a simplified classification of hard coal, steam coal and brown coal. The correspondence is as follows: • Total coal is the sum of hard coal and brown coal; • Hard coal is the sum of coking coal, anthracite and other bituminous coal for all countries, plus sub-bituminous
coal for Australia, Belgium, Chile, Finland, France, Iceland, Japan, Korea, Mexico, New Zealand, Portugal and the United States;
• Brown coal contains lignite for all countries, and sub-bituminous coal for all countries not listed above; and • Steam coal consists of anthracite, other bituminous coal and sub-bituminous coal. The term total coal also refers to the sum of hard coal and brown coal after conversion to a common energy unit (tonne of coal equivalent - tce). The conversion is done by multiplying the calorific value of the coal in question (the conversion factors are submitted by national administrations to the IEA Secretariat each year) by the total volume of hard and brown coal used, measured in physical units, i.e. in tonnes. One tce has an energy content of 29.3 Gigajoules (GJ) or 7 000 kcal and corresponds to 0.7 tonnes of oil equivalent (toe).
Defining coal consumption Energy statistics are compiled and presented to take account of the complexity in the way fuels are used and to avoid double counting. Misunderstandings can arise when statistics on coal consumption are used because of the particular terminology used by energy statisticians.
Coal is used in four possible ways:
• As a primary input to produce electricity or a secondary/tertiary fuel that is used elsewhere or sold - this is referred to as use in transformation processes;
e.g. coking coal used to produce coke in a coke oven, steam coal used to produce electricity. • As a fuel used to support a transformation process - this is referred to as energy industry own use; e.g. coke oven gas used to heat the coke oven, steam coal used to operate the power plant. • As a fuel consumed in manufacturing industry, mining and construction, in transport, in agriculture, in
commercial and public services and in households - this is referred to as use in the final consumption sectors; e.g. steam coal used to produce heat in cement kilns, steam coal used to produce industrial process steam. • As a raw material - this is referred to as non-energy use; e.g. coal used to produce carbon electrodes for the aluminium industry. In the wider community, the term “consumption” is commonly understood to include all of the above end-uses. However, in this book (with the exception of Part II and Part III, Section 2, where consumption denotes national supply) the term “consumption” refers only to use in the final consumption sectors (i.e. in the third item above).