coal industry report q3/2019 - virac...2.4 five force and swot analysis 61 2.5 coal industry...
TRANSCRIPT

1
COAL INDUSTRY REPORT Q3/2019

Content
Abbreviation 3
Executive Summary 4
1. Business Environment 6
1.1 Macroeconomic context 7
1.2 Legal Framework 9
1.3 Trade Agreements 12
2. World Coal Industry 14
2.1.1 Production – Consumption 14
2.1.2 Import – Export 22
2.1.3 Coal Price Movements 25
2.1.4 Current situation of key nations in the industry 26
3. Vietnam Coal Industry 34
2.2.1 Formation and development process 35
2.2.2 Definition and classification 36
2.2.3 Industrial value chain 39
2
2.2.4 Industrial scale and characteristics 40
2.2.5 Current mining and producing situation 42
2.2.6 Coal mining methods 46
2.2.7 Consumption 49
2.2.8 Import 51
2.2.9 Export 54
2.2.10 Inventory 55
2.2.11 Price Movements 56
2.2.12 Distribution and transportation 57
2.3 Risk Analysis 59
2.4 Five force and SWOT Analysis 61
2.5 Coal Industry Planning 65
3. Enterprises Analysis 70
3.1 Enterprises Introduction 71
3.2 Financial Analysis 73
4 Financial Statement Appendix 83

Abbreviation
MNRE Ministry of Natural Resources and Environment
MIT Ministry of Industry and Trade
CNCA China National Coal Association
AE Administration Expenses
SE Selling Expense
CPI Consumer Price Index
LLC Limited Liability Company
JSC Joint Stock Company
CI Commercial Investment
EIA US Energy Information Administration
EVN Vietnam Electricity
GDP Gross Domestic Product
IEA International Energy Agency
PAT Profit after tax
CB Central Bank
PVN Vietnam Oil and Gas Corporation
GDVC General Department of Vietnam Customs
IS Industry Standard
FS Financial Statement
GSO General Statistics Office of Vietnam
VS Vietnamese Standard
TKV Vietnam National Coal – Mineral Industries Group
VICEM Vietnam Cement Industry Corporation
VIRAC VIRAC Joint Stock Company
3

4
WORLD
❖ Reserves: According to a report by global energy company BP, by
the end of 2018, worldwide coal reserves are about xxx billion tons,
❖ Supply: In 2018, coal production reached xxx million tons; xxx%
increase over the same period;
❖ Consumption: coal consumption recovered, reaching xxx million
tons in 2018
❖ Trade: In 2017 global coal exports increased by xxx% over the same
period in 2016, reaching xxx million tons.
❖ Coal price:
VIETNAM
❖ Supply: In the first half of 2019, TKV exploited clean coal reaching
xxx million tons, up by xxx% over the same period.
❖ Consumption: In the first half of 2019, domestic coal consumption
reached xxx million tons, down xxx% over the same period.
Executive Summary
5
❖ Trade:
• Import: In the first half 2019, Vietnam imported xxx million tons of
coal, increased by xxx% over the same period, the import turnover
of coal reached xxx million USD, increased by xxx% over the same
period.
The average price of imported coal in the first 6 months of 2019
reached xxx USD/ton (down xxx% over the same period).
• Export: In the first 6 months of 2019, coal output and export turn to
xxx million tons worth xxx billion USD,
❖ Inventory: Inventory of the first 6 months of 2019 decreased to only
xxx million tons, a deep decrease compared to the end of 2018.
Forecast:
❖ World:
❖ Vietnam:
Enterprises:
• The coal industry enterprises in 2018 had many positive changes, the
average growth rate of industry reached xxx%.
• Most coal industry enterprises have better financial indicators than
the same period,
Executive Summary

1. BUSINESS ENVIRONMENT

7
Sources: VIRAC, GSO
Source: VIRAC, GSO
%
CNY/VND Exchange rate, 1/2016 – 6/2019
Nguồn: VIRAC, SBV
• The gross domestic product (GDP) in the second quarter of 2019 is
estimated to increase by xxx% over the same period last year,
• Since the beginning of 2019, a number of mining products face difficulties
in production, selling prices fluctuate constantly. The structure of the
mining industry's contribution to GDP decreased to xxx%.
• In the first 6 months of 2019, CNY continued to devalue with USD
while VND has stabilized, making VND rise against CNY.
1. Business Environment
1.1 Macroeconomic Context
Quaterly GDP Growth rate, 2016-2019
Mining industry contribution to GDP structure,
2013 – H1/2019

8
Electricity prices in Vietnam are quite low compared to other countries in
the Asia-Pacific region.
The average electricity retail price in 2019 applied from March 20, 2019 is
adjusted to the new price of VND xxx/kWh.
Energy demand of Vietnam has increased rapidly in 15 years since 2001
(average increase of xxx%/year) and is expected to continue to rise quite
high in the next 15 years.
By 2030, when Vietnam reaches xxx billion consumption, only equal to the
world average in 2016.
Sources: VIRAC, Worldbank
Sources: VIRAC, MIT
Electricity price per capita, 7/2007 - 3/2019
VND/ kWh
1. Business Environment
1.1 Macroeconomic Context
Vietnam electricity consumption per capita, 2000 – 2017ekWh/capita

9
Decision No. 2006/QD-TTg of the Prime Minister dated 12/12/2017 approving the Project on restructuring Vietnam Coal and Mineral Industry in the
period of 2017-2020. Specifically:
• According to the arrangement plan, 16 units will maintain the organization and operation mechanism and be in the structure of Parent Company - TKV;
8 units implement merger, consolidation, dissolution, reorganization and reorganization.
• Regarding the charter capital ratio of TKV, the project specifies as follows :
Decision No. 1265/QD-TTg dated August 24th, 2017 of the Prime Minister adjusting and supplementing a number of articles in Decision No. 60/QD-TTg
on the planning on development of Vietnam's coal industry till 2020, with consider prospects to 2030.
• According to the adjustment, by 2020, the coal industry will invest in building new coal screening plants as follow:
• djusting the coordinates of the closed boundary some investment projects to explore coal resources such as:
• Adjusting the list of some Vang Danh mining projects; Nam Mau mine; Suoi Lai mine; Coc Sau mine; Deo Nai mine; Lo Tri mine; Mong Duong mine.
•
1. Business Environment
1.2 Legal Framwork
10
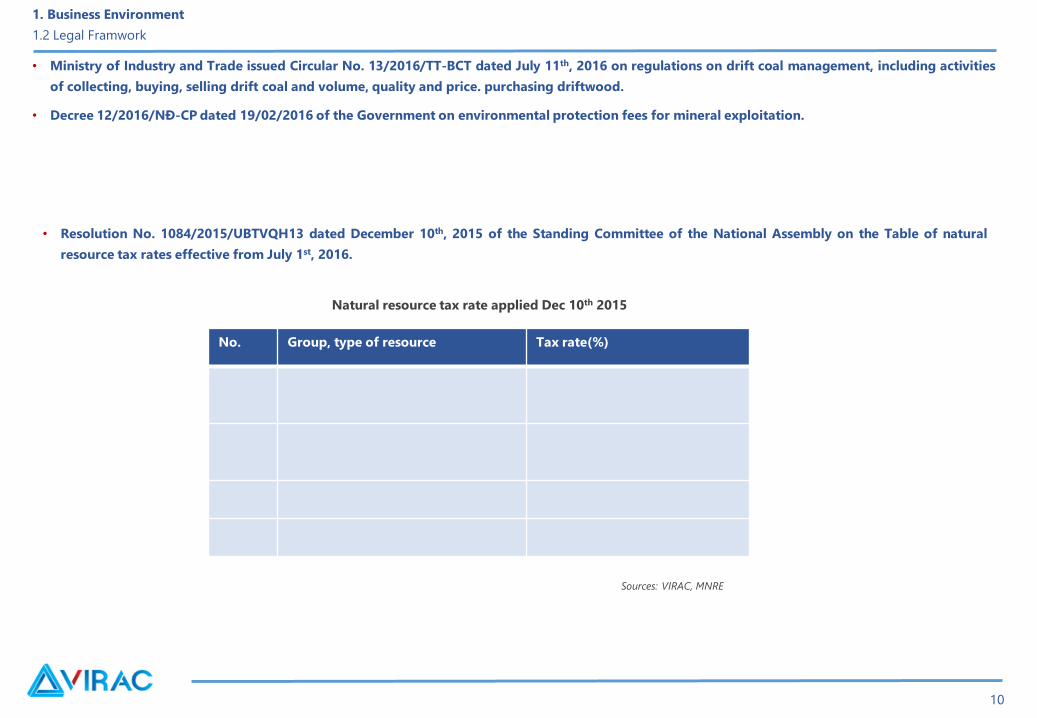
• Ministry of Industry and Trade issued Circular No. 13/2016/TT-BCT dated July 11th, 2016 on regulations on drift coal management, including activities
of collecting, buying, selling drift coal and volume, quality and price. purchasing driftwood.
• Decree 12/2016/NĐ-CP dated 19/02/2016 of the Government on environmental protection fees for mineral exploitation.
No. Group, type of resource Tax rate(%)
• Resolution No. 1084/2015/UBTVQH13 dated December 10th, 2015 of the Standing Committee of the National Assembly on the Table of natural
resource tax rates effective from July 1st, 2016.
Sources: VIRAC, MNRE
1. Business Environment
1.2 Legal Framwork
Natural resource tax rate applied Dec 10th 2015

11
• The Prime Minister issued Directive 21/CT-TTg dated August 26, 2015, requesting ministries, branches, localities, agencies and units to strengthen the
state management of production activities. export and trading coal.
• Decree No. 203/2013/ND-CP of the Government regulating the calculation method, the fee level for granting mineral mining rights starts to take effect
from January 20, 2014.
• Ministry of Industry and Trade issued regulations on list, coal quality standards and coal export conditions in Circular No. 15/2013/TT-BCT dated
01/2013.
Product Code Description Tax rate (%)
Sources: VIRAC, MIT
1. Business Environment
1.2 Legal Framwork

12
1995 1998 2000 2002
2007
2008 2009 2011 2015 20172006 2018 2019
1. Business Environment
1.3 Trade Agreements
Integration process of Vietnam from 1995 until now
By the end of the first quarter of 2019, Vietnam had signed, enforced, and was negotiating a total of 17 free trade agreements (FTAs). Joining
international trade agreements provides opportunities and challenges for domestic businesses.

13
The ASEAN economic community (AEC): completely cuts import duties on goods from the community to 0% including coal.
❖ Opportunities:
❖ Challenges:
ASEAN Trade in Goods Agreement (ATIGA)
Vietnam and the Eurasian Economic Union Free Trade Agreement
The Trans-Pacific Partnership Agreement (TPP) and TPP-11 after the US withdrawal, was renamed the Comprehensive Partnership and Trans-Pacific
Partnership (CPTPP) signed in March 2018 and expected to take effect from the beginning of 2019.
❖ Opportunities::
❖ Challenges:
1. Business Environment
1.3 Trade Agreements

2. WORLD COAL INDUSTRY

15
World Coal Reserves
• According to a report by global energy company BP, by the end of
2018, worldwide coal reserves are about xxx billion tons.
Million ton
World Coal Reserves, 2018
Sources: VIRAC, Statista
Sources: VIRAC, BP statistical review
World coal reserves structure by types, 2018
2. Industry Overview
2.1 World Coal Industry – 2.1.1 Production – Consumption

16
• The period 2016 – 2018 had witnessed the recovery of the coal industry
Million ton
Sources: VIRAC, BP Statistical Review
World Coal Production, 2011-2018
2. Industry Overview
2.1 World Coal Industry – 2.1.1 Production – Consumption

17
❖ Coal production is not uniform across regions: Asia is the region
with the largest coal production in the world,
❖ The Middle East is the world's smallest coal producer
Million ton
❖ In 2018, the top 10 largest coal-producing countries in the world
hardly changed rankings.
❖ Vietnam ranked xxx in the list of the world's largest coal producing
countries with the proportion of xxx% and production volume
reaching xxx million tons in 2018, down by xxx% compared to 2017.
Sources: VIRAC, BP Statistical review
Sources: VIRAC, BP Statistical Review
Top 10 largest coal producing countries, 2018
Coal production structure by regions, 2018
2. Industry Overview
2.1 World Coal Industry – 2.1.1 Production – Consumption

18
• The structure of coal production by product in 2017 did not change much
compared to 2016. In 2017, it is estimated that up to xxx% of coal exploited is
thermal coal
• In 2017, thermal coal production increased again with xxx%, reaching xxx million
tons after 3 consecutive years of decline.
• World coke coal production decreased slightly during the period 2014-2017 but
with a smaller reduction.
• World production of lignite coal in 2017 is estimated at xxx million tons,
increasing again with xxx% compared to 2016
Sources: VIRAC, IEA
Million ton
Coal production structure by products, 2017e
Sources: VIRAC, IEA
Coal production by products, 2014 – 2017e
2. Industry Overview
2.1 World Coal Industry – 2.1.1 Production – Consumption

19
❖ In the 2013-2016 period, witnessed a rapid decline in global coal consumption, mainly due to the effects of tightening production.
❖ In the period 2016-2018, coal consumption recovered, reaching xxx million tons in 2018; contributing the most to growth including China and India.
Million ton
Sources: VIRAC, Enerdata
Coal demand changes by regions, 2010 -2018World coal consumption, 2011 – 2018
Sources: VIRAC, Enerdata
2. Industry Overview
2.1 World Coal Industry – 2.1.1 Production – Consumption

20
Million ton
Sources: VIRAC, IEA
❖ Top 3 countries in coal consumption volume in 2018 remained
unchanged from 2017.
❖ The highest output growth over the previous year was Turkey;
Sources: VIRAC, EnerdataCoal consumption by sectors, 2012 – 2040f
2. Industry Overview
2.1 World Coal Industry – 2.1.1 Production – Consumption
Top 10 largest coal consuming countries by volume, 2018

21
In 2017, the IEA estimates that xxx% of global coal consumption is steam
coal, xxx% is coking coal and xxx% is lignite coal consumption.
Steam coal consumption
Coking coal consumption
Sources: VIRAC, IEALignite coal consumption
Coal consumption structure by products, năm 2017
2. Industry Overview
2.1 World Coal Industry – 2.1.1 Production – Consumption

22
In 2017 global coal exports increased by xxx% over the same period in
2016, reaching xxx million tons.
Sources: VIRAC, IEA
World coal export, 2017
World coal trading 2015-2017
Sources: VIRAC, IEA
Million ton
2. Industry Overview
2.1 World Coal Industry – 2.1.2 Import – Export

23
Sources: VIRAC, IEA
Billion USD Million ton
Sources: VIRAC, IEA
2. Industry Overview
2.1 World Coal Industry – 2.1.2 Import – Export
Top largest coal exporting countries by value, 2017 Top largest coal exporting countries by volume, 2017

24
Sources: VIRAC, IEA
Sources: VIRAC, IEA
2. Industry Overview
2.1 World Coal Industry – 2.1.2 Import – Export
Coal importing structure by countries 2017
Coal exporting structure by countries, 2017
• Regarding coal imports, China is the largest importer of coal with
xxx million tons in 2017, an increase of xxx% compared to 2016,
accounting for xxx% of coal imports worldwide.
• Coke export in 2017 increased by xxx%, reaching xxx million tons.

25
USD/ton
Sources: VIRAC, Indexmundi
Since July 2018, coal prices have started to decline sharply. At the time of October and November 2018, coal prices reached xxx USD/ton; reduced to
xxx USD/ton in January 2019 and as of June 2019 coal price dropped deeply to xxx USD/ton. Reason:
2. Industry Overview
2.1 World Coal Industry – 2.1.3 Coal Price Movements
Thermal Coal price movements in 10/2012 – 6M/2019

26
Sources: VIRAC, NBS of People’s Republic of China
• hina is a super coal importer, coal import is always much higher than
export. In 2018, over the same period, coal imports into China
increased by about xxx% but limited exports, export volumes fell by
xxx%.
Million ton
Million ton
Sources: VIRAC, BP Statistical Review, Enerdata
2. Industry Overview
2.1 World Coal Industry – 2.1.4 Current situation of key nations in the industry
China
• China is both the producer and the largest coal consumer in the world.
Coal production and Consumption in China, 2011 – 2018
Coal Import-Export, 2011 - 2018

27
Sources: VIRAC, EIA
Sources: VIRAC, EIA
Million ton
Million ton
2. Industry Overview
2.1 World Coal Industry – 2.1.4 Current situation of key nations in the industry
Coal consumption by industries, 2015 – Q1/2019
Coal production and consumption in US, 2011 – 2018US
• The US is the second largest coal production market but the
consumption is only the 3rd in the world.

28
Sources: VIRAC, EIA
Oversupply is the cause of America's trade surplus,
❖ Regarding exports, in the first 3 months of 2019, Europe and Asia are the
two main coal export markets of the US,
❖ In terms of imports, in the first 3 months of 2019, coal import
increased by xxx% over the same period in 2018, reaching xxx million
tons.
Million ton
Sources: VIRAC, EIA
Sources: VIRAC, EIA
Million ton Million ton
2. Industry Overview
2.1 World Coal Industry – 2.1.4 Current situation of key nations in the industry
US coal import - export, 2011 – Q1/2019
US Coal Export by region in Q1/2019 US Coal Import by region in Q1/2019

29
Sources: VIRAC, Ministry of coal, WEB
India
• India is the xxx largest coal producer in the world.
• In 2018, India's estimated coal reserves reached xxx billion tons.
Sources: VIRAC, Ministry of Coal, WEC
Million ton
Coal consumption by sectors 2018-19*
2. Industry Overview
2.1 World Coal Industry – 2.1.4 Current situation of key nations in the industry
Coal production and consumption in India in 2013 -2019

30
Million ton
• While India's coal exports tend to decrease and are insignificant,
Indian coal imports also began to rise again from 2016-17. In 2018-
2019, India's imports increased xxx% set xxx million tons, of which
imported coke increased xxx% to xxx million tons.
Billion ton
• Abundant coal reserves are an advantage for India as it is one of the
largest 'coal mines' in the world.
• Mainly producing coal in this country is concentrated in the East
India Coal Import 2013 -2019*
India Coal Reserves 2013 – 2018
Sources: VIRAC, Ministry of coal, WEB
Sources: VIRAC, Ministry of coal, WEB
2. Industry Overview
2.1 World Coal Industry – 2.1.4 Current situation of key nations in the industry

31
Sources: VIRAC, BP Statistical ReviewMillion TOE
Japan
• Japan is in the top 10 most coal consuming countries in the world in
2018.
Million TOE
Sources : VIRAC, BP Statistical Review
Japan Coal Production, 2008-2018
Japan Coal Consumption, 2008-2018
2. Industry Overview
2.1 World Coal Industry – 2.1.4 Current situation of key nations in the industry
32
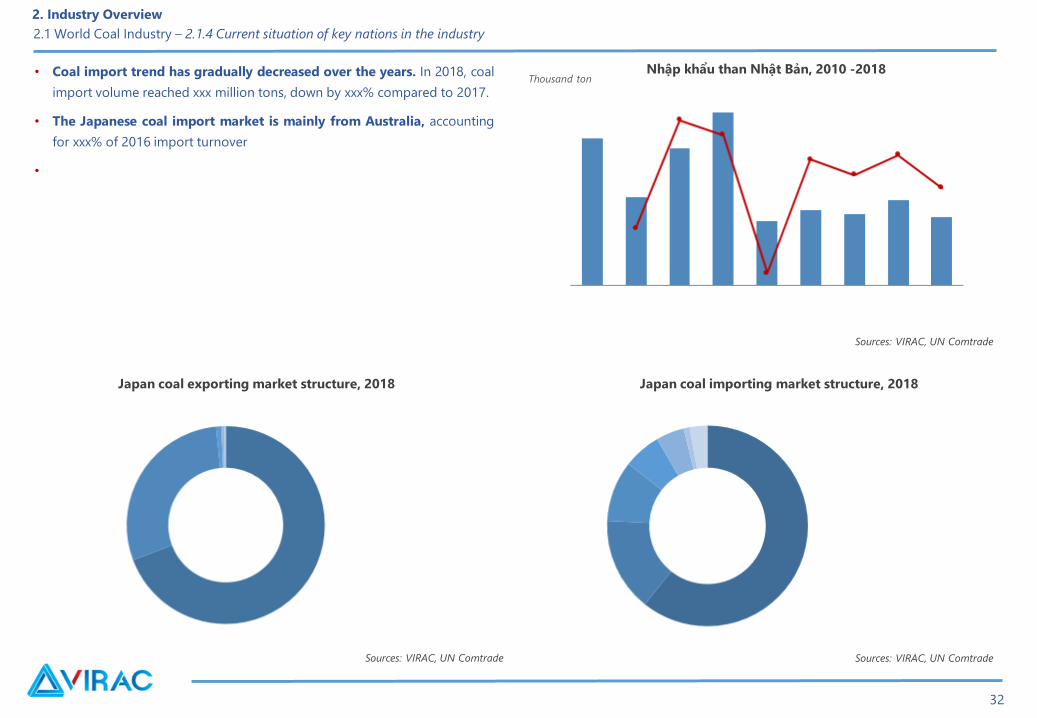
• Coal import trend has gradually decreased over the years. In 2018, coal
import volume reached xxx million tons, down by xxx% compared to 2017.
• The Japanese coal import market is mainly from Australia, accounting
for xxx% of 2016 import turnover
•
Sources: VIRAC, UN Comtrade Sources: VIRAC, UN Comtrade
Thousand ton
Sources: VIRAC, UN Comtrade
Japan coal importing market structure, 2018Japan coal exporting market structure, 2018
Nhập khẩu than Nhật Bản, 2010 -2018
2. Industry Overview
2.1 World Coal Industry – 2.1.4 Current situation of key nations in the industry

Autralian coke exporting market structure by value, 2017-2018
33
Australia
• Australia is the world's largest coal exporter.
• Australia's R/P ratio (reserves/production) is xxx, with the remaining
coal reserves accounting for xxx% of global reserves (according to BP
Statistical Review), Australia will still be a major source of coal during the
next time.
Sources: VIRAC, Australian department of industry, innovation and science
Sources: VIRAC, BP Statistical Review
Million TOE
Australia coal production and consumption, 2008-2018
Sources: VIRAC, Australian department of industry, innovation and science
2. Industry Overview
2.1 World Coal Industry – 2.1.4 Current situation of key nations in the industry
Autralian coke importing market structure by value, 2017-2018

2. THỊ TRƯỜNG THẾ GIỚI
3. VIETNAM COAL INDUSTRY

35
• Vietnam's coal industry has been born and undergone development for more than 120 years.
2. Industry Overview
2.2 Vietnam Coal Industry– 2.2.1 Formation and development process

36
Than ở Việt Nam có 5 loại chính gồm: than anthracite, than mỡ, than bùn, than ngọn lửa dài và than nâu.
• Anthracite coal:
• Fat coal:
• Peat coal:
2. Industry Overview
2.2 Vietnam Coal Industry– 2.2.2 Definition and classification

37
• Long-flame coal:
• Lignite coal:
2. Industry Overview
2.2 Vietnam Coal Industry– 2.2.2 Definition and classification

38
• Coal mining is a capital intensive industry.
• Input:
• Exploitation:
• Transportation:
• Consumption:
2. Industry Overview
2.2 Vietnam Coal Industry– 2.2.3 Industrial value chain
Coal Mining Industry value chain

39
Sources: VIRAC, GSO
Sources: VIRAC, GSO
Million VND
Labor
2. Industry Overview
2.2 Vietnam Coal Industry– 2.2.4 Industrial scale and characteristics
Vietnam Coal Industry Characteristics
• Vietnam's coal industry is fragmented, complicated geological conditions.
Despite the advanced technology, the conditions for application and technology
deployment are limited by scale. By the end of 2017, there are about xxx enterprises
operating in the coal industry, of which 3 leading companies include: Vinacomin,
Vietmindo and Northeast Corporation.
• Currently, the supply of coal nationwide is mainly undertaken by TKV.
Number of enterprises and labor in the coal industry,
2010 - 2017
Coal Industry Revenue and Profit, 2010 - 2017

40
• Currently, technology of exploiting and processing at coal mines is
backward and infrastructure is poor
Sources: VIRAC,GSO
• Over the past years, opencast coal production still plays a key role and accounts for about xxx% of the industry's total coal production.
• Labor in the coal industry is currently very crowded, but mainly as unskilled workers, working in a heavy and hazardous environment, requiring good health and
mostly men. The total number of workers in the coal industry in 2017 is more than xxx thousand people, an increase of xxx% over the same period in
2016.
Billion VND
2. Industry Overview
2.2 Vietnam Coal Industry– 2.2.4 Industrial scale and characteristics
Total investment capital and fixed assets of coal industry, 2010 - 2017

41
According to the report, the estimated total reserves and coal resources
as of December 31, 2016, about xxx billion tons, include about xxx
billion reserves and xxx billion tons of resources, including xxx billion
tons of peat.
Vietnamese coal mining issues:
• Vietnam's coal reserves are becoming less and less.
• The level of exploitation is getting harder and harder.
• Labor productivity is lower than many countries in the region.
Thousand ton
Sources: VIRAC, MIT
2. Industry Overview
2.2 Vietnam Coal Industry– 2.2.5 Current mining and producing situation
Coal reserves and resources by types, 2016

42
2018 is a golden year of coal industry in production and business
activities,
In the first 6 months of 2019, TKV exploited clean coal reaching xxx
million tons, up by xxx% over the same period.
Sources: VIRAC, GSO, TKV
Million ton
2. Industry Overview
2.2 Vietnam Coal Industry– 2.2.5 Current mining and producing situation
Clean coal production in 2010-H1/2019

43
The causes affecting the cost and production and business situation of the
coal industry over the years:
• Part of coal reserves has favorable exploitation conditions, low
production costs have been exhausted,
• The increasing tax policy, which accounts for xxx% of coal price, is
one of the factors pushing up the price of coal in recent years.
Sources: VIRAC, TKV
Thousand VND/ton
Taxes related to coal Payable tax
rates
Average cost
(VND/ton)
Sources: VIRAC synthesized
2. Industry Overview
2.2 Vietnam Coal Industry– 2.2.5 Current mining and producing situation
Charges for domestic coal production
Coal Production Cost, 2001 – 2030F

44
In detail:
✓ According to statistics of countries in the region, Vietnam is a country with a high royalty rate bracket in the world.
✓ In addition to natural resources tax, the coal industry enterprise has to pay the mining right for coal which is xxx%;
✓ Environmental protection fee increases from 6,000 to 10,000 VND/ton of raw coal (Decree74/2011/NĐ-CP dated 25/8/2011).
✓ For export coal:
2. Industry Overview
2.2 Vietnam Coal Industry– 2.2.5 Current mining and producing situation

45
• Advantages of open-cast mining method:
• Weaknesses:
2. Industry Overview
2.2 Vietnam Coal Industry– 2.2.6 Coal mining methods
Process of open pit coal mining

46
Mining underground
• Due to being exhausted coal resources in opencast mines, new construction mines will be underground mines.
• The process of pit mining technology is a collection of many working steps,
• Geological conditions in Vietnam's coal regions are mainly hilly and mountainous, suitable for open-cast mining.
• The application of advanced science and technology into underground mining still faces many difficulties due to complicated geological conditions,
enterprises are not active in spare parts, materials, specialized equipment and depend on imports,...
2. Industry Overview
2.2 Vietnam Coal Industry– 2.2.6 Coal mining methods

47
• Factors that inhibit mechanization in coal mining in Vietnam
2. Industry Overview
2.2 Vietnam Coal Industry– 2.2.6 Coal mining methods

48
❖ n the first 6 months of 2019, domestic coal consumption reached
xxx million tons, down xxx% over the same period.
Coal consumption forecast:
Vietnam's coal demand is expected to increase by xxx million tons in 2020;
xxx million tons in 2025 and xxx million tons in 2030.
Sources: VIRAC, BCT, TKV
Sources: VIRAC, GSO
Million ton
2. Industry Overview
2.2 Vietnam Coal Industry– 2.2.7 Consumption
Coal consuming structure, 2017
Domestic coal consumption, H1/2019

49
• In the first 6 months of 2019, TKV revenue reached xxx billion dong, gaining xxx% of the plan, increasing xxx% compared to the same period in 2018. In which,
coal revenue reached xxx billion dong, gaining xxx% of the year plan, increasing xxx% compared with the same period in 2018. Profit is estimated at xxx billion,
with xxx% of the year plan..
The production and business efficiency of TKV has improved markedly in 2019 due to some main reasons :
• The policy mechanism is thought to have changed in many ways in favor of the coal industry.
• TKV has had many operating solutions, removing difficulties and making efforts to implement business and production plans,
Sources: VIRAC, TKV
Billion VND
TKV business results, 2013 – H1/2019
2. Industry Overview
2.2 Vietnam Coal Industry– 2.2.7 Consumption

50
❖ In the first 6 months of 2019, Vietnam imported xxx million tons of coal
increased by xxx% over the same period, the import turnover of coal
reached xxx million USD, increased by xxx% over the same period.
Million USD
Coal import volume and value, 2013 – H1/2019
Sources: VIRAC, GDVC
Thousand ton
Sources: VIRAC, GDVC
Top largest coal importing countries by volume, H1/2019
Rank Country Volume Market
share
Change over
H1/2018
2. Industry Overview
2.2 Vietnam Coal Industry– 2.2.8 Import

51
❖ The price of Chinese coal exported to Vietnam is quite high:
❖ Vấn đề của giá than nhập khẩu:
Sources: VIRAC, GDVC
Coal import prices by countries, 6T/2019
USD/ton
❖ Causes of coal price differentiation:
2. Industry Overview
2.2 Vietnam Coal Industry– 2.2.8 Import
52
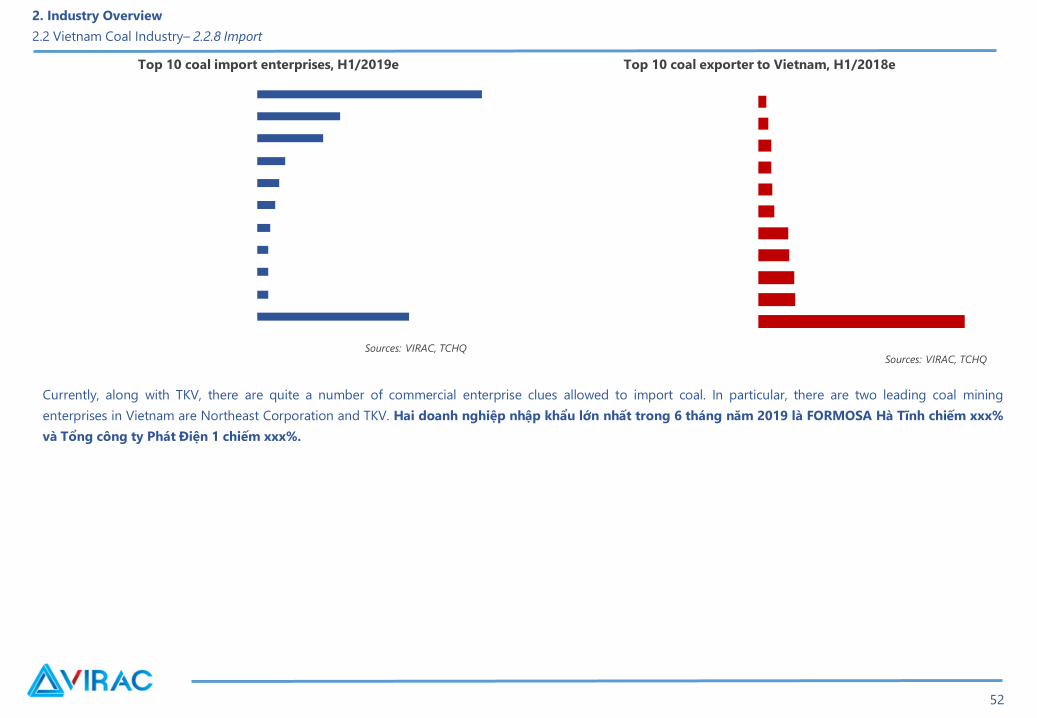
Currently, along with TKV, there are quite a number of commercial enterprise clues allowed to import coal. In particular, there are two leading coal mining
enterprises in Vietnam are Northeast Corporation and TKV. Hai doanh nghiệp nhập khẩu lớn nhất trong 6 tháng năm 2019 là FORMOSA Hà Tĩnh chiếm xxx%
và Tổng công ty Phát Điện 1 chiếm xxx%.
Sources: VIRAC, TCHQ
Top 10 coal import enterprises, H1/2019e Top 10 coal exporter to Vietnam, H1/2018e
Sources: VIRAC, TCHQ
2. Industry Overview
2.2 Vietnam Coal Industry– 2.2.8 Import

53
Sources: VIRAC, GDVC
Million ton
Coal export volume and turnover, 2011 – H1/2019
Billion USD
❖ In the first 6 months of 2019, coal output and turnover reached xxx million tons, worth xxx billion USD, in turn reduced xxx% and xxx% over the same
period.
• n many years ago, the main coal export market of Vietnam was China, however from the beginning of 2017, coal export to China is very low, and instead
are markets such as Laos, Taiwan, and Thailand. Lan due to the impact of the nation's application of regulations on quality barriers to imported coal.
Vietnam coal exporting structure by volume, H1/2019
Rank Country Volume Market
share
Change over
H1/2018
Souces: VIRAC, GDVC
2. Industry Overview
2.2 Vietnam Coal Industry– 2.2.9 Export

54
Inventory of the first 6 months of 2019 decreased to only xxx million tons, a deep decrease compared to the end of 2018. Although production
increased, the demand for coal increased at a high rate, reducing inventory significantly.
• Domestic coal prices are narrowed compared to import prices
• Promoting coal export :
Million ton
Souces: VIRAC, GSO
Coal Inventory, 2010 – H1/2019
2. Industry Overview
2.2 Vietnam Coal Industry– 2.2.10 Inventory

55
Date Price increasing rate
• The increase in coal selling prices is due in part to high taxes and fees, namely: high taxes,
accounting for about xxx%,
Adjust coal selling price for electricity industry
Coal Type Unit Price
Coal selling price for electricity production
(Hon Gai-Cam Pha coal calculated at
01/04/2019)
2. Industry Overview
2.2 Vietnam Coal Industry– 2.2.11 Price Movements
Sources: VIRAC, TKV, EVN
Sources: VIRAC, TKV, EVN

56
Coal selling price for retail households
Coal Type
Current export
price
(USD/ton)
Current import
price (USD/ton)
Current selling
price (VND
thousand/ton)
Estimated
price
(thousand
VND/ton)
Coal typeCurrent export
price (USD/ton)
Current import
price (USD/ton)
Current selling
price (VND
thousand/ton)
Estimated price
(thousand
VND/ton)
Price of coal for cement, fertilizer and paper
2. Industry Overview
2.2 Vietnam Coal Industry– 2.2.11 Price Movements
Sources: VIRAC, TKV
Sources: VIRAC, TKV

57
• Currently, the coal industry is using the main modes of transport including: railway, waterway and road transport with the main means of trucks,
trains and barges.
• From 1/1/2017, Quang Ninh officially prohibits the transportation of coal by road, moving to transport by waterway.
• Currently, the Coal and Mineral Group is still monopolizing in transporting coal to consumers through two forms: delivery at loading port (upstream)
and at the unloading port or buyer's warehouse (end of source).
2. Industry Overview
2.2 Vietnam Coal Industry– 2.2.12 Distribution and transportation

58
❖ Risks during exploitation
❖ Health-related risks
• Coal is a dangerous energy source on the planet; Coal burning process releases a large amount of pollutants including particulate sulfur dioxide (SO2),
nitrous oxide (NOx), carbon dioxide (CO₂), mercury and arsenic.
❖ Labor risks
• As a kind of hard, toxic, dangerous labor, the potential coal industry poses no danger to workers' health.
• The recruitment of kiln workers is considered a key issue, ensuring the completion of coal production targets.
2. Tổng quan ngành
2.3. Phân tích rủi ro

59
❖ Environmental risks
❖ Weather and climate risks
❖ Substitute Risk
❖ Policy risks
2. Industry Overview
2.3. Risk Analysis

60
SWOT Analysis
1. Strengths
2. Weaknesses
3. Opportunities
2. Industry Overview
2.4. Five force and SWOT Analysis

61
4. Challenges
2. Industry Overview
2.4. Five force and SWOT Analysis

62
On August 24, 2017, the Prime Minister issued Decision No. 60 / QD-TTg (Planning 60) on the coal industry development plan until 2020 considering the prospect
of 2030. Accordingly, in time to the coal industry will reduce both capital demand and output.
Adjustments include:
Regarding exploration orientation,
Regarding coal minning,
Regarding coal loss,
Regarding screening and processing coal,
Regarding environment protection,
Regarding coal market,
2. Industry Overview
2.5 Coal Industry Planning – Planning

63
No. Coal Demand 2020 2025 2030
Regarding supply and demand balance :
Regarding investment demand:
According to industry experts, the current coal industry planning is impractical and low feasible, due to :
2. Industry Overview
2.5 Coal Industry Planning – Planning
Forecast of coal consumption demand

64
Million ton
Sources: VIRAC, BMI
USD/tonMillion tonUSD/ton
Sources: VIRAC, BMI
2. Industry Overview
2.5 Coal Industry Planning – Forecast the world coal industry
World coal Forecast
World thermal coal Forecast, 2011-2022f World Coke Forecast, 2011-2022f
Thermal Coal Forecast:

65
Coke Forecast:
2. Industry Overview
2.5 Coal Industry Planning – Forecast the world coal industry

66
Million ton
Source: VIRAC
The domestic market is also seeing positive changes, a series of thermal power
projects have been completed and put into operation, promising to be the "hot
spots" of coal consumption, bringing in great revenue.
It is estimated that production output, exploitation decrease by an
average of xxx%/year and import volume will increase with the average growth rate
of xxx%/year in the period of 2016-2020.
2. Industry Overview
2.5 Coal Industry Planning – Forecast domestic coal Industry
Production and Import Forecast, 2010 – 2020f
The forecast of Vietnam's future coal industry may be through a summary scenario as follows:

3. ENTERPRISE ANALYSIS

68
Enterprises LogoTotal asset
(billion VND)
Mine reserves
(million ton)
Revenue
(billion VND)General Information
3. Enterprises Analysis
3.1. Enterprises Introduction

69
Enterprises LogoTotal asset
(billion VND)
Mine reserves
(million ton)
Revenue
(billion VND)General Information
3. Enterprises Analysis
3.1. Enterprises Introduction

70
Billion VND
Sources: VIRAC, FS of enterprises
Coal enterprises in 2018 had many positive changes, the industry average growth rate reached xxx%. Most businesses have high revenue growth rates.
2018 is considered a "golden" year of the coal industry in production and business activities, overcoming difficulties of many years before coal piles up
in mountains, workers have little work to take turns. The expected higher coal output, consumption volume and average selling price are the reasons
contributing to the growth of the coal industry.
3. Enterprises Analysis
3.2. Financial Analysis
Net revenue and revenue growth 2017 - 2018

71
3. Enterprises Analysis
3.2. Financial Analysis
Sources: VIRAC, FS of enterprises
Gross profit margin, 2017 - 2018
Enterprises in the group have a low gross profit margin because the output is entirely dependent on the parent company, TKV, while the cost of
exploitation is increasing.

72
3. Enterprises Analysis
3.2. Financial Analysis
Sources: VIRAC, FS of enterprises
Selling expenses/net revenue of coal industry enterprises in 2017-2018
The businesses in the group all have very low selling costs, the industry average is only about xxx% in 2018.

73
3. Enterprises Analysis
3.2. Financial Analysis
Sources: VIRAC, FS of enterprises
Enterprise management cost/net revenue of coal industry enterprises 2017-2018
• In contrast to the cost of sales, the enterprises in the group have a higher level of management expenses, the ratio of general and administrative expenses
per industry average reaches xxx% in 2018, a sharp decrease. compared to 2017 thanks to good revenue growth.

74
3. Enterprises Analysis
3.2. Financial Analysis
Sources: VIRAC, FS of enterprises
Financial expenses/net revenue of coal industry enterprises 2017-2018

75
Billion VND
• Due to the characteristics of coal mining activities, most of the enterprises in the group have asset structure leaning on long-term assets, mainly machinery and
equipment for mining activities.
3. Enterprises Analysis
3.2. Financial Analysis
Sources: VIRAC, FS of enterprises
Asset structure and total assets turnover of coal enterprises, 2017

76
• Currently, most of opencast mining enterprises tend to shift to investment to prepare for underground mining.
• THT is the business with the highest debt ratio, up to xxx times the debt to total asset ratio and xxx times the debt to equity ratio,
Billion VND
3. Enterprises Analysis
3.2. Financial Analysis
Sources: VIRAC, FS of enterprises
Debt structure of coal industry enterprises, 2018

77
In 2018, along with the growth of the coal industry, coal industry inventories
decreased significantly, the average number of days of inventory was about
xxx days, a sharp decrease compared to the xxx days of 2017.
Day Day
3. Enterprises Analysis
3.2. Financial Analysis
Sources: VIRAC, FS of enterprises
Inventory turnover, 2017-2018 Receivables turnover, 2017-2018

78
3. Enterprises Analysis
3.2. Financial Analysis
Sources: VIRAC, FS of enterprises
Solvency coefficient, 2018

79
• In 2018, the average performance indicators of coal industry were better
than the previous year, ROS achieved xxx%, ROA and ROE were at xxx
and xxx, respectively. In general, performance indicators of this year are
better than the previous year.
Billion VND
3. Enterprises Analysis
3.2. Financial Analysis
Sources: VIRAC, FS of enterprises
Sources: VIRAC, FS of enterprises
EAT and EAT/Net revenue, 2018
Operational efficiency, 2018
80
4 Financial Statement Appendix
CONTENT

81
BALANCE SHEETS
Unit: VND 2017 2018
I CURRENT ASSETS
1 Cash and cash equivalents
2 Short-term financial investments
3 Short-term receivable
Receivables of customers
5 Inventories
II NON-CURRENT ASSETS
1 Other long-term receivables
2 Fixed assets
3 Tangible fixed assets
Intangible fixed assets
5 Commercial advantage
III TOTAL ASSETS
I LIABILITIES
1 Current liabilities
Current borrowings and liabilities
Receivables of sellers
Taxes and other payables to the State budget
2 Non-current liabilities
II EQUITY
III TOTAL CAPITAL RESOURCES
INCOME STATEMENT
Unit: VND 2017 2018
1 Net revenue
2 Cost of goods sold
3 Gross profit
4 Revenue from financial activities
5 Financial expenses
Loan interest expenses
6 Cost of sales
7 General and administrative expenses
8 Net profit from business activities
9 Before-tax profit
10 Current income tax
11 Deferred income tax
12 After-tax profit
CASH FLOW STATEMENT
Unit: VND 2017 2018
1 Cash flow from operating activities
Net cash flow from operations
2 Cash flow from investing activities
Net cash flow from investing activities
3 Cash flow from financing activities
Net cash flow from financing activities
4 Net cash flow of the year
4. Appendix of Financial Statement
Cao Son Coal JSC

82
BALANCE SHEETS
Unit: VND 2017 2018
I CURRENT ASSETS
1 Cash and cash equivalents
2 Short-term financial investments
3 Short-term receivable
Receivables of customers
5 Inventories
II NON-CURRENT ASSETS
1 Other long-term receivables
2 Fixed assets
3 Tangible fixed assets
Intangible fixed assets
5 Commercial advantage
III TOTAL ASSETS
I LIABILITIES
1 Current liabilities
Current borrowings and liabilities
Receivables of sellers
Taxes and other payables to the State budget
2 Non-current liabilities
II EQUITY
III TOTAL CAPITAL RESOURCES
INCOME STATEMENT
Unit: VND 2017 2018
1 Net revenue
2 Cost of goods sold
3 Gross profit
4 Revenue from financial activities
5 Financial expenses
Loan interest expenses
6 Cost of sales
7 General and administrative expenses
8 Net profit from business activities
9 Before-tax profit
10 Current income tax
11 Deferred income tax
12 After-tax profit
CASH FLOW STATEMENT
Unit: VND 2017 2018
1 Cash flow from operating activities
Net cash flow from operations
2 Cash flow from investing activities
Net cash flow from investing activities
3 Cash flow from financing activities
Net cash flow from financing activities
4 Net cash flow of the year
4. Appendix of Financial Statement
Coc Sau Coal JSC

83
BALANCE SHEETS
Unit: VND 2017 2018
I CURRENT ASSETS
1 Cash and cash equivalents
2 Short-term financial investments
3 Short-term receivable
Receivables of customers
5 Inventories
II NON-CURRENT ASSETS
1 Other long-term receivables
2 Fixed assets
3 Tangible fixed assets
Intangible fixed assets
5 Commercial advantage
III TOTAL ASSETS
I LIABILITIES
1 Current liabilities
Current borrowings and liabilities
Receivables of sellers
Taxes and other payables to the State budget
2 Non-current liabilities
II EQUITY
III TOTAL CAPITAL RESOURCES
INCOME STATEMENT
Unit: VND 2017 2018
1 Net revenue
2 Cost of goods sold
3 Gross profit
4 Revenue from financial activities
5 Financial expenses
Loan interest expenses
6 Cost of sales
7 General and administrative expenses
8 Net profit from business activities
9 Before-tax profit
10 Current income tax
11 Deferred income tax
12 After-tax profit
CASH FLOW STATEMENT
Unit: VND 2017 2018
1 Cash flow from operating activities
Net cash flow from operations
2 Cash flow from investing activities
Net cash flow from investing activities
3 Cash flow from financing activities
Net cash flow from financing activities
4 Net cash flow of the year
4. Appendix of Financial Statement
Vang Danh Coal JSC

84
BALANCE SHEETS
Unit: VND 2017 2018
I CURRENT ASSETS
1 Cash and cash equivalents
2 Short-term financial investments
3 Short-term receivable
Receivables of customers
5 Inventories
II NON-CURRENT ASSETS
1 Other long-term receivables
2 Fixed assets
3 Tangible fixed assets
Intangible fixed assets
5 Commercial advantage
III TOTAL ASSETS
I LIABILITIES
1 Current liabilities
Current borrowings and liabilities
Receivables of sellers
Taxes and other payables to the State budget
2 Non-current liabilities
II EQUITY
III TOTAL CAPITAL RESOURCES
INCOME STATEMENT
Unit: VND 2017 2018
1 Net revenue
2 Cost of goods sold
3 Gross profit
4 Revenue from financial activities
5 Financial expenses
Loan interest expenses
6 Cost of sales
7 General and administrative expenses
8 Net profit from business activities
9 Before-tax profit
10 Current income tax
11 Deferred income tax
12 After-tax profit
CASH FLOW STATEMENT
Unit: VND 2017 2018
1 Cash flow from operating activities
Net cash flow from operations
2 Cash flow from investing activities
Net cash flow from investing activities
3 Cash flow from financing activities
Net cash flow from financing activities
4 Net cash flow of the year
4. Appendix of Financial Statement
Deo Nai Coal JSC

85
BALANCE SHEETS
Unit: VND 2017 2018
I CURRENT ASSETS
1 Cash and cash equivalents
2 Short-term financial investments
3 Short-term receivable
Receivables of customers
5 Inventories
II NON-CURRENT ASSETS
1 Other long-term receivables
2 Fixed assets
3 Tangible fixed assets
Intangible fixed assets
5 Commercial advantage
III TOTAL ASSETS
I LIABILITIES
1 Current liabilities
Current borrowings and liabilities
Receivables of sellers
Taxes and other payables to the State budget
2 Non-current liabilities
II EQUITY
III TOTAL CAPITAL RESOURCES
INCOME STATEMENT
Unit: VND 2017 2018
1 Net revenue
2 Cost of goods sold
3 Gross profit
4 Revenue from financial activities
5 Financial expenses
Loan interest expenses
6 Cost of sales
7 General and administrative expenses
8 Net profit from business activities
9 Before-tax profit
10 Current income tax
11 Deferred income tax
12 After-tax profit
CASH FLOW STATEMENT
Unit: VND 2017 2018
1 Cash flow from operating activities
Net cash flow from operations
2 Cash flow from investing activities
Net cash flow from investing activities
3 Cash flow from financing activities
Net cash flow from financing activities
4 Net cash flow of the year
4. Appendix of Financial Statement
Ha Tu Coal JSC

86
BALANCE SHEETS
Unit: VND 2017 2018
I CURRENT ASSETS
1 Cash and cash equivalents
2 Short-term financial investments
3 Short-term receivable
Receivables of customers
5 Inventories
II NON-CURRENT ASSETS
1 Other long-term receivables
2 Fixed assets
3 Tangible fixed assets
Intangible fixed assets
5 Commercial advantage
III TOTAL ASSETS
I LIABILITIES
1 Current liabilities
Current borrowings and liabilities
Receivables of sellers
Taxes and other payables to the State budget
2 Non-current liabilities
II EQUITY
III TOTAL CAPITAL RESOURCES
INCOME STATEMENT
Unit: VND 2017 2018
1 Net revenue
2 Cost of goods sold
3 Gross profit
4 Revenue from financial activities
5 Financial expenses
Loan interest expenses
6 Cost of sales
7 General and administrative expenses
8 Net profit from business activities
9 Before-tax profit
10 Current income tax
11 Deferred income tax
12 After-tax profit
CASH FLOW STATEMENT
Unit: VND 2017 2018
1 Cash flow from operating activities
Net cash flow from operations
2 Cash flow from investing activities
Net cash flow from investing activities
3 Cash flow from financing activities
Net cash flow from financing activities
4 Net cash flow of the year
4. Appendix of Financial Statement
Ha Lam Coal JSC

87
BALANCE SHEETS
Unit: VND 2017 2018
I CURRENT ASSETS
1 Cash and cash equivalents
2 Short-term financial investments
3 Short-term receivable
Receivables of customers
5 Inventories
II NON-CURRENT ASSETS
1 Other long-term receivables
2 Fixed assets
3 Tangible fixed assets
Intangible fixed assets
5 Commercial advantage
III TOTAL ASSETS
I LIABILITIES
1 Current liabilities
Current borrowings and liabilities
Receivables of sellers
Taxes and other payables to the State budget
2 Non-current liabilities
II EQUITY
III TOTAL CAPITAL RESOURCES
INCOME STATEMENT
Unit: VND 2017 2018
1 Net revenue
2 Cost of goods sold
3 Gross profit
4 Revenue from financial activities
5 Financial expenses
Loan interest expenses
6 Cost of sales
7 General and administrative expenses
8 Net profit from business activities
9 Before-tax profit
10 Current income tax
11 Deferred income tax
12 After-tax profit
CASH FLOW STATEMENT
Unit: VND 2017 2018
1 Cash flow from operating activities
Net cash flow from operations
2 Cash flow from investing activities
Net cash flow from investing activities
3 Cash flow from financing activities
Net cash flow from financing activities
4 Net cash flow of the year
4. Appendix of Financial Statement
Mong Duong Coal JSC

88
BALANCE SHEETS
Unit: VND 2017 2018
I CURRENT ASSETS
1 Cash and cash equivalents
2 Short-term financial investments
3 Short-term receivable
Receivables of customers
5 Inventories
II NON-CURRENT ASSETS
1 Other long-term receivables
2 Fixed assets
3 Tangible fixed assets
Intangible fixed assets
5 Commercial advantage
III TOTAL ASSETS
I LIABILITIES
1 Current liabilities
Current borrowings and liabilities
Receivables of sellers
Taxes and other payables to the State budget
2 Non-current liabilities
II EQUITY
III TOTAL CAPITAL RESOURCES
INCOME STATEMENT
Unit: VND 2017 2018
1 Net revenue
2 Cost of goods sold
3 Gross profit
4 Revenue from financial activities
5 Financial expenses
Loan interest expenses
6 Cost of sales
7 General and administrative expenses
8 Net profit from business activities
9 Before-tax profit
10 Current income tax
11 Deferred income tax
12 After-tax profit
CASH FLOW STATEMENT
Unit: VND 2017 2018
1 Cash flow from operating activities
Net cash flow from operations
2 Cash flow from investing activities
Net cash flow from investing activities
3 Cash flow from financing activities
Net cash flow from financing activities
4 Net cash flow of the year
4. Appendix of Financial Statement
Nui Beo Coal JSC

89
Recommended uses
This report is made Vietnam Industry Research and Consultancy (VIRAC), providing only the industry overview and business analysis. All information, statements
and projections are based on reliable sources with ultimate prudence as of the time of writing. However, due to subjective and objective reasons in terms of
published formation sources, VIRAC does not guarantee or bear any responsibility for information accuracy and no liability for damages on using this report
partly or wholly. All viewpoints and statements in this report are subjected to changes without notice. This publication is protected by copyright owned by
Vietnam Industry Research and Consultancy (VIRAC). Copying, modifying and printing without permission are strictly prohibited.
Recommended uses
Please contact us for more details:
VIETNAM INDUSTRY RESEARCH AND CONSULTANCY
Floor 6, Anh Minh Building, 36 Hoang Cau Street, O Cho Dua Ward, Dong Da District, Hanoi
Website: http://virac.com.vn/
Email: [email protected] | Phone: +84 463289520

Thank you !
90