coache provost's report - middlebury college · leadership and governance 30 ... management...
TRANSCRIPT

COACHE Faculty Job Satisfaction Survey
PROVOST’S REPORT MIDDLEBURY COLLEGE
2012
The Collaborative on Academic Careers in Higher Education
at the Harvard Graduate School of Education

Acknowledgements: Many people and organizations are responsible for making the COACHE project possible. We would especially like to thank the following: The Ford Foundation The Atlantic Philanthropies Harvard Graduate School of Education All of our member institutions Reproduction: No part of this report or its appendices may be reproduced in any form without written permission from the Collaborative on Academic Careers in Higher Education (COACHE), such as that given in a participation agreement signed by representatives of participating institutions and COACHE. Any reproduction of the report material must include a credit line. Contact information: The Collaborative on Academic Careers in Higher Education (COACHE) Harvard Graduate School of Education 8 Story Street, 5th Floor Cambridge, MA 02138 Email: [email protected] URL: http://www.coache.org Voice: 617-495-5285 Fax: 617-496-9350 Copyright © 2012 by The President and Fellows of Harvard College. All Rights Reserved.

The Collaborative on Academic Careers in Higher Education at the Harvard Graduate School of Education
CONTENTS OF YOUR REPORT
Introduction
Preface 3
Guide to your report 5
Results
Response rates and selected peers 13
Your results at a glance 14
The COACHE dashboard 16
Benchmark dashboards
Nature of work in research, teaching, service 18
Facilities, personal/family policies, benefits and salary 20
Interdisciplinary work, collaboration, and mentoring 22
Tenure and promotion 26
Leadership and governance 30
Departmental collegiality, engagement, and quality 32
Appreciation and recognition 34
Retention and negotiations 36
Best and worst aspects 38
Thematic analysis of open-ended questions 40
Demographic characteristics 41
Appendices
Your COACHE results are in your hands… now what? 45
Background and definitions 51
Participating institutions 55


The Collaborative on Academic Careers in Higher Education at the Harvard Graduate School of Education
The Provost’s Report
INTRODUCTION


The Collaborative on Academic Careers in Higher Education at the Harvard Graduate School of Education
PREFACE
The core strength of an institution of higher education is its faculty. A preponderance of evidence supports the notion that college faculty are affected by their perception of the values and rewards in their workplace, and that supportive environments promote faculty satisfaction, which can lead to a greater commitment to and relationship with their home institution. With this understanding, the Collaborative on Academic Careers in Higher Education (COACHE) at the Harvard Graduate School of Education developed the Tenure-track Faculty Job Satisfaction Survey.
Since 2003, COACHE institutions have used data from this survey to leverage improvements in the workplace for pre-tenure faculty. Meanwhile, COACHE and its research partners have analyzed the data more broadly to understand the themes associated with faculty satisfaction and to contribute to the existing literature on faculty. Perhaps one of the most critical lessons learned in the first few years of COACHE’s development is the role that tenured faculty play as catalysts for the success of pre-tenure faculty. Tenured faculty serve as leaders for campus governance and policy decisions, as mentors to pre-tenure faculty, and as the arbiters of campus culture and climate. Simply put, tenured faculty shape nearly every facet of campus life. To understand them better, COACHE expanded its focus in 2010 to include the design and launch of the Tenured Faculty Job Satisfaction Survey.
After a successful pilot study with seven large research universities, the COACHE team merged the two surveys to create a unified instrument (with appropriate branches) attending to the full spectrum of tenure-stream faculty. In 2012-13, COACHE will add an optional survey module to assess the work satisfaction of full-time, non-tenure-track faculty.
This new instrument assesses faculty experiences in several areas deemed critical to their success:
Nature of work in research, teaching, service
Resources in support of faculty work
Benefits, compensation, and work/life
Interdisciplinary work and collaboration
Mentoring
Tenure and promotion practices
Leadership and governance
Departmental collegiality, quality, engagement
Appreciation and recognition
The result is this diagnostic and comparative management tool for college and university leaders. Tailored to each participating institution, the COACHE Faculty Institutional Report pinpoints problem areas, whether within a particular policy, practice, or demographic. This benchmarking report identifies the overall performance of each campus compared to its peers, compares subgroups at your campus to subgroups at other campuses, and describes differences between groups on your campus. Thorough, yet accessible, this report is designed to assist campus leaders to confront concerns and celebrate achievements.
Membership in the Collaborative, however, does not conclude with delivery of this report. Academic leaders use COACHE results to focus attention, spot successes and weaknesses, and then take concrete steps to make policies and practices more effective and more prevalent. Our mission to make the academy a more attractive place to work is advanced only when supported by institutional action. To that end, COACHE is your partner and a resource for maximizing the ability of your data to initiate dialogue, recruit talented scholars, and further the work satisfaction of all faculty at your institution. For our advice on making the most of your participation, please review the supplementary material provided with this report. Then, contact us with any questions or new ideas that have emerged.
3

4

The Collaborative on Academic Careers in Higher Education at the Harvard Graduate School of Education
GUIDE TO YOUR REPORT Introduction
The quality of an academic institution depends heavily on its faculty. As teachers, scholars, participants in shared governance and the purveyors of institutional culture and history, faculty are at the heart of the best work being done in higher education today. Not surprisingly, supporting faculty in all the work they do is a central focus for successful academic leaders.
By enrolling as a member of the Collaborative on Academic Careers in Higher Education, you have already shown a commitment to improving the faculty workplace. In fact, just the act of asking your faculty to participate in the Faculty Job Satisfaction Survey helps communicate concern for and support of your faculty. Today, with the delivery of your institutional report, you take the next step towards improving the academic workplace on your campus.
This report contains the data necessary for you to understand where your institution thrives and where it struggles in the key components of faculty life. Considering faculty satisfaction within your campus as well as comparatively will provide you with a robust sense of where your campus supports faculty well and where there is work to be done.
Given hundreds of survey items disaggregated by race, gender, tenure status and rank for your institution and all others in COACHE, we have used the best of our abilities to synthesize, organize, and prioritize millions of data points in a thorough yet accessible format.
We encourage you to share this report with other senior administrators, faculty leadership, institutional researchers, and other constituents. In fact, your report portfolio includes communication models and milestones to consider in your dissemination strategy. We also recommend that you participate in
one of COACHE’s regularly-scheduled “Guided Tour to Your Report” and other webcasts.
Keeping your audiences in mind, we designed your report with components that can be distributed together or individually around campus. Your COACHE portfolio contains:
the Provost’s Report, summarizing your results overall and according to key subgroups at your institution in comparison to peers and to the faculty labor market writ large;
the COACHE Digital Report Portfolio, which includes an online reporting tool, tables of mean comparisons and frequency distributions, faculty responses to open-ended questions, and results for any custom items appended to the COACHE instrument.
a de-identified unit record data file (for institutions who, when enrolling, selected this IRB-approved option)
supplementary materials to assist you in engaging your campus community in making the most of your investment in this research.
This guide introduces you to each of these portfolio pieces and provides you with recommendations for maximizing the utility of your report.
Just as your work with the data has just begun, so has your work with COACHE. Your three-year membership means that we will continue to support your exploration of the data. We sincerely hope that you will take advantage of COACHE-sponsored opportunities to learn from the most promising practices of your colleagues and to share your plans for using COACHE data to improve faculty workplace satisfaction.
5

Guide to your report
The Provost’s Report Your Provost’s Report is designed to provide the reader with an “at a glance” understanding of where faculty at your campus are thriving and struggling in comparison to peers and the national labor market landscape. It will also help you to understand where subgroups of faculty within your own campus differ. Understanding the balancing act that senior administrators perform on a daily basis, COACHE designed this report with the goal of providing your campus with top-level analysis and some indicators of where to dig deeper. In other words, it is the best place to start, just keep in mind that much more is available. Response rates and peers In this section, you will find the response rates for your campus, your peers, and the faculty labor market. Disaggregation by tenure status, rank, gender, and race will help you to consider non-response generally and within subgroups of your faculty.
Your results at a glance This single chart summarizes the benchmark results for your institution relative to peers and the entire cohort of participating institutions. Each column represents the range of institutional means (not the distribution of individual respondents) along that dimension. Within each chart, you can see your institution’s mean score on the benchmark (), the mean scores of your five peers (), and the distribution of the responses of the entire cohort as signified by the red, grey, and green boxes.
You should be most concerned with the placement of your marker (). A score in the red section of the column indicates that your institution ranked in the bottom 30 percent of all institutions. A mark in the green section indicates your faculty rated a benchmark in the top 30 percent of all institutions. A mark in the grey area indicates a middle-of-the-road result.
This combination of your cohort comparison and peer rank establishes the threshold COACHE uses to identify areas of strength and areas of concern. An area of strength is identified as any benchmark or survey item where your score is in the top two amongst peers and in the top 30 percent across all institutions. An area of concern is any benchmark or item where your campus falls in the bottom two amongst peers and in the bottom 30 percent compared to the entire survey cohort. This two-step criterion allows you to differentiate between results that are typical of your institutional type (and your peers) and those that are out of the ordinary.
The COACHE Dashboard This data display offers a view of your faculty from 10,000 feet. Each benchmark represents the mean score of several items that share a common theme. Thus, the benchmark scores provide a general sense of how faculty feel about a particular aspect of their work/life. The benchmarks include:
Nature of work in research, teaching, service
Resources in support of faculty work
Benefits, compensation, and work/life
Interdisciplinary work and collaboration
Mentoring
Tenure and promotion practices
Leadership and governance
Departmental collegiality, quality, engagement
Appreciation and recognition
For each result, your report will use two adjacent triangles () to compare your faculty’s rating to those of your peer institutions (the left ) and the cohort (the right ). Red triangles () indicate an area of concern relative to the comparison group; green triangles () are areas of strength; grey triangles () suggest unexceptional performance; and empty triangles () signify insufficient data for reporting comparisons.
6

Guide to your report
With this iconography, your dashboard page shows your results relative to peers and the cohort overall, by tenure status, rank, gender, and race/ethnicity. For example, a finding for females might read , meaning that, compared to women elsewhere, your female faculty’s ratings placed your campus in the top two among peers and in the bottom 30 percent among all COACHE institutions. Thus, although you are generally doing well against peers, you and your peers have room for improvement in women’s attitudes along this dimension.
On the right side of the page are your intra-institutional comparisons, which highlight the meaningful differences between subgroups on your own campus. Here, effect sizes are indicated as small (text appears in cell), moderate (text appears in cell with yellow highlight), and large (text appears in the cell with orange highlight). Trivial differences remain blank. The name of the group with the lower rating appears in the cell to indicate the direction of the difference. Ideally, this section of your report would be blank, suggesting parity across subgroups. (We did not design a typical red/yellow/green signal here because a large difference is not necessarily a poor outcome, but depends, instead, on the context of the result.)
Even if your campus performs well compared to other institutions, large differences between subgroups can suggest a problem. For example, it is quite possible for a campus to perform very well overall on a particular benchmark (or individual item) while still having great disparity based on rank, race, or gender. This is especially true when the number of faculty in a particular subgroup is small. The underrepresented group may be less satisfied, but because their numbers are so small, their concerns may get lost in the overall result.
Benchmark dashboards After reviewing the COACHE Dashboard, you will have a sense of where, generally, your faculty are most satisfied, moderately satisfied, and least satisfied. To understand these benchmarks fully, you
must explore the individual items within them. The next pages of your report apply the same organization of data in the COACHE Dashboard to each survey dimension. Using the framework described above, these tables display results for the individual items nested in each benchmark.
For those institutions with prior COACHE data, the tables include comparisons of your new data to your most recent past results. An addition symbol (+) indicates improvement since your last administration. A subtraction symbol (-) indicates a decline in your score. Change over time is only reported for survey items that have not changed since your prior survey administration. With the update that occurred to the instrument in 2011-12, many questions do not track perfectly to prior versions of the survey. If the question changed even slightly since the last time it was administered, the data are not reported here. However, please feel free to contact COACHE for help comparing more items in this year’s report to prior years’ reports.
Other displays of data Some questions in the COACHE Survey do not fit into a benchmark. This happens when an item does not use a five-point Likert scale or when the nature of the question does not lend itself to analysis by a central tendency (i.e., a mean). In most of these exceptions, a separate display highlights those results.
The Retention and Negotiation items are such an example: the COACHE Survey asks faculty about their intent to remain at the institution and details about what, if anything, they would renegotiate in their employment contracts. The Provost’s Report includes two pages dedicated to these items.
The Best and Worst Aspects pages are another example of important survey items that do not fit a benchmark factor scale. The survey asks faculty to identify, from a list of common characteristics of the academic workplace, the two best and two worst aspects of working at your institution. These pages
7

Guide to your report
summarize the results of your faculty’s responses compared to others overall, by tenure status, rank, gender, and race/ethnicity. The top results are highlighted.
Your Provost’s Report also includes COACHE’s Thematic Analysis of Open-ended Questions. The final open-ended question in the COACHE Survey asks respondents to identify the one thing they feel their institutions could do to improve the workplace for faculty. COACHE reviews all comments, redacts any identifying information, and codes them thematically. This table summarizes those themes by rank and provides comparative data. Note that responses often touch upon multiple themes, so the total number of comments reported in this thematic summary is likely to exceed the actual number of faculty who responded to this question. The complete responses are available in your COACHE Digital Report Portfolio.
Finally, the Demographic Characteristics section includes self-reported background information about respondents’ careers, family status, and other personal qualities. Though most of this information is not used explicitly in our analysis of your results, your online reporting tool (see below) and COACHE staff are available for deeper analysis that deploys these and other survey or institutional variables.
Appendix The Provost’s Report concludes with suggestions in your appendix for taking the next steps in your COACHE campus strategy. The appendix also includes information about COACHE’s methods and definitions, including a list of the colleges and universities that comprise the “All Comparable Institutions” cohort used in your report. That list also includes, separately, the names of institutions that have participated in past rounds of COACHE surveys, for whom comparison data (de-identified) are available for subsequent, follow-up analysis.
The COACHE Digital Report Portfolio
Your digital report portfolio includes access to an online tool for survey data analysis and, in both Excel and PDF formats, the Mean Comparisons and Frequency Distributions for all survey results overall, by tenure status, rank, gender, and race/ethnicity. The digital report also includes survey responses to open-ended questions. Use these tools to gain a comprehensive understanding of every result of your survey, to build your own charts or tables, and to tailor your own analyses of the data.
Mean comparisons The mean comparisons are based on results from all survey respondents at your institution, at the five peer institutions you selected, and at all other institutions participating in this study. For each survey dimension, the mean is the unweighted arithmetic average of faculty responses on a particular item. Means and standard deviations are
provided for your institution overall, for your peer institutions individually and overall, for all comparable institutions overall, and—where population size allows—for groups by tenure status, rank, gender, race/ethnicity (i.e., white faculty or faculty of color), and against prior survey results (if your institution has previously participated in a COACHE survey).* Note that your Digital Report Portfolio also contains these data in Excel format. That file provides additional data hidden in the PDF version, as well as the ability to filter and sort the results.
* During prior administrations of the COACHE Survey,
means were weighted based on race and gender. Although means are no longer weighted, your prior data remain weighted to maintain consistency with your records.
8

Guide to your report
Frequency distributions As with the mean comparisons, these frequency distribution tables are based on results from all survey respondents at your institution and at all other institutions participating in this study. Provided here are the unweighted counts and percentages of faculty responses on each survey dimension. We provide comparisons overall and between the same sub-groups identified in the mean comparisons (i.e., by tenure status, rank, gender, race/ethnicity, and over time).
A note on interpreting means and frequencies Relative frequencies of responses for each item can provide crucial information not given by the mean score alone. While a group’s mean score gives valuable information about the group’s central tendency, the frequency can tell you the extent to which the group is polarized in their responses. For example, consider two hypothetical cases: Case #1: Half of a group of pre-tenure faculty chose
“Very dissatisfied” (1) on a 5-point scale, and half chose “Very satisfied” (5);
Case #2: Every respondent in the group chose “Neither satisfied nor dissatisfied” (3).
In both cases, the mean score is 3.0; however, whereas in the second case the mean reflects individuals’ attitudes perfectly, in the first case, the mean value (“Neither satisfied nor dissatisfied”) does not actually reflect the attitude of anyone in the group. Rather, these respondents seem to be made up of two sub-groups with very different attitudes. It is important to take into account the polarization of scores when considering major policy changes in order to accurately anticipate how faculty members will be affected.
Open-ended responses This portion of your report lists the comments written by your faculty in response to open-ended questions, including the final survey item, which
states, “Please use the space below to tell us the number one thing that you, personally, feel your institution could do to improve the workplace.” These results, coded by themes, are also available in Excel format.
Results of custom questions (if applicable) For institutions that appended additional, custom questions to the COACHE survey, the results are displayed here in cross-tabulations and/or open-ended narrative. Online reporting tool (*new*) This new feature allows you to build customized cross-tabulations and charts in a Web browser for simple export into Excel or PDF formats. Use this tool to compare survey responses on any demographic variable or to compare response groups across multiple items. THIS TOOL PROVIDES ACCESS TO YOUR SURVEY RESULTS BY SCHOOL, COLLEGE, OR DIVISION. For access to your online reporting tool, you may need to contact COACHE.
Supplementary material Your digital repository also includes supporting material to help you contextualize your results and to consider policies and practices in response.
The COACHE Survey Instrument 2011-12 includes in detail all of the survey’s items.
Your Results in Context compiles in one document the explanatory pages that accompany the Benchmark Dashboards in your Provost’s Report, but includes also a list of seminal readings.
A t-page review of potential Communication Models and Milestones may help you design a dissemination and engagement strategy around COACHE at your institution.
A folder of Suggested Readings includes an array of COACHE’s prior reports, research, and other materials to support your efforts to make the most of your investment in this project.
9

Guide to your report
10

The Collaborative on Academic Careers in Higher Education at the Harvard Graduate School of Education
The Provost’s Report
RESULTS
11

12

The Collaborative on Academic Careers in Higher EducationFaculty Job Satisfaction Survey 2011-12
RESPONSE RATES AND SELECTED PEERS
Middlebury College
overall tenuredpre-
tenure full assocate men women whitefaculty of
color
population 214 157 57 109 48 131 83 174 39responders 148 104 44 72 32 85 63 119 28
response rate 69% 66% 77% 66% 67% 65% 76% 68% 72%population 0 0 0 0 0 0 0 0 0
responders 0 0 0 0 0 0 0 0 0response rate 0% 0% 0% 0% 0% 0% 0% 0% 0%
population 27660 19888 7772 10618 9711 17710 9950 21332 6269responders 13634 9661 3973 5117 4689 8151 5483 10897 2725
response rate 49% 49% 51% 48% 48% 46% 55% 51% 43%
SELECTED PEER INSTITUTIONS
Prior Cohort Years
No prior administrations
You selected five institutions as peers against whom to compare your COACHE Survey results. The results at these peer institutions are included throughout this report in the aggregate or, when cited individually, in random order. Your peer institutions are:
Middlebury College
Selected peers
All
*Due to some missing gender and race/ethnicity data, the numbers of males and females, and of white faculty and faculty of color, may not sum to the total populations.
If your institution participated in a previous administration of the COACHE Faculty Job Satisfaction Survey, this report will show change over time for any questions that have remained unchanged. For campuses with multiple years of comparative data, users may toggle between cohort years by using the Criteria tab of the Excel report.
DeferredDeferredDeferredDeferredDeferred
13

This
cha
rt s
umm
ariz
es o
ver a
hal
f mill
ion
data
poi
nts
in
benc
hmar
k re
sults
for y
our i
nstit
utio
n re
lativ
e to
pee
rs a
nd
the
full
coho
rt o
f CO
ACH
E’s
part
icip
atin
g in
stitu
tions
.
Each
col
umn
repr
esen
ts th
e ra
nge
of in
stitu
tiona
l mea
ns (n
ot
the
dist
ribut
ion
of in
divi
dual
resp
onde
nts)
alo
ng th
at
dim
ensi
on. W
ithin
eac
h ch
art,
you
can
see
your
inst
itutio
n’s
mea
n sc
ore
on th
e be
nchm
ark
(),
the
mea
n sc
ores
of y
our
five
peer
s (O
), an
d th
e di
strib
utio
n of
the
resp
onse
s of
the
entir
e co
hort
of i
nstit
utio
ns a
s si
gnifi
ed b
y th
e re
d, g
rey,
and
gr
een
boxe
s.
You
shou
ld b
e m
ost c
once
rned
with
the
plac
emen
t of y
our
mar
ker (
). A
sco
re in
the
red
sect
ion
of th
e co
lum
n in
dica
tes
that
you
r ins
titut
ion
rank
ed in
the
bott
om 3
0 pe
rcen
t of a
ll in
stitu
tions
. A m
ark
in th
e gr
een
sect
ion
indi
cate
s yo
ur fa
culty
ra
ted
a be
nchm
ark
in th
e to
p 30
per
cent
of a
ll in
stitu
tions
. A
mar
k in
the
grey
are
a in
dica
tes
a “m
iddl
e-of
-the
-roa
d” re
sult.
COA
CHE
Resu
lts a
t a G
lanc
e
top
30%
of in
stitu
tions
mid
dle
40%
of in
stitu
tions
bott
om 3
0%of
inst
itutio
ns
yo
ur in
stitu
tion
sele
cted
pee
rs
Men
torin
g
5.0
4.0
3.0
2.0
1.0
coho
rt m
ean
14

The
Col
labo
rativ
e on
Aca
dem
ic C
aree
rs in
Hig
her
Edu
catio
nF
acul
ty J
ob S
atisf
actio
n Su
rvey
201
1-12
CO
AC
HE
RE
SUL
TS
AT
A G
LA
NC
E
Mid
dle
bu
ry C
olle
ge
1.0
1.5
2.0
2.5
3.0
3.5
4.0
4.5
5.0
Nature of work: Research
Nature of work: Service
Nature of work: Teaching
Facilities and work resources
Personal and family policies
Health and retirement benefits
Interdisciplinary work
Collaboration
Mentoring
Tenure policies
Tenure clarity
Tenure reasonableness
Promotion
Leadership: Senior
Leadership: Divisional
Leadership: Departmental
Departmental collegiality
Departmental engagement
Departmental quality
Appreciation and recognition15

Her
e, th
e fa
culty
sub
grou
p w
ith
the
low
er ra
ting
appe
ars.
Shad
ing
conv
eys
the
mag
nitu
de o
f sub
-gr
oup
di�e
renc
es: s
mal
l e�e
cts
appe
ar a
s te
xt o
nly,
mod
erat
e e�
ects
are
sha
ded
yello
w, a
nd
larg
e e�
ects
are
sha
ded
oran
ge.
Triv
ial d
i�er
ence
s re
mai
n bl
ank.
Ch
ange
ove
r tim
e ap
pear
s as
+/-
.
Rega
rdle
ss o
f you
r res
ults
com
pare
d to
pe
ers a
nd o
ther
s (on
the
left
), yo
u sh
ould
di
rect
you
r con
cern
to su
bgro
ups w
ho
cons
iste
ntly
app
ear h
ere
in y
ello
w o
r or
ange
shad
ed ce
lls.
m
ean
over
all
tenu
red
pre-
ten
full
asso
cm
enw
omen
whi
tefo
cte
nure
rank
gend
erra
cepr
ior
Hea
lth a
nd re
tirem
ent b
enef
its3.
43
pre-
ten
full
wom
enfo
cIn
terd
isci
plin
ary
wor
k3.
00
pre-
ten
asso
cw
omen
whi
teC
olla
bora
tion
3.46
tenu
red
full
wom
enw
hite
Men
torin
g3.
18
tenu
red
asso
cm
enfo
cTe
nure
pol
icie
s3.
64
N/A
N/A
N/A
N<5
N/A
N/A
wom
enN
<5Te
nure
cla
rity
3.33
N/A
N/A
N/A
N<5
N/A
N/A
men
This
is th
eov
eral
l sco
re(b
etw
een
1 an
d 5)
fo
r all
facu
ltyre
spon
dent
sat
you
r ins
titut
ion.
Thes
e co
lum
ns d
escr
ibe
how
you
r fac
ulty
’s re
spon
ses
com
pare
to s
imila
r fac
ulty
at o
ther
CO
ACH
E in
stitu
tions
: ten
ured
vs.
tenu
red,
m
en v
s. m
en,
facu
lty o
f col
or
vs. f
acul
ty o
f col
or, e
tc.
Thes
e co
lum
ns c
ompa
regr
oups
on
your
cam
pus:
pre-
tenu
re/t
enur
ed,
asso
ciat
e/fu
ll, w
omen
/men
, w
hite
/fac
ulty
of c
olor
.
Wha
t do
thes
e tr
iang
les
mea
n?Th
ese
sym
bols
repr
esen
t res
ults
that
�t C
OAC
HE’
s cr
iteria
(a
djus
tabl
e in
Exc
el) f
or “a
reas
of s
tren
gth”
(in
gree
n) a
nd “a
reas
of
con
cern
” (in
red)
.
You
r ran
king
am
ong
peer
s:
1s
t or 2
nd
3rd
or 4
th
5th
or 6
th
Yo
ur p
erce
ntile
am
ong
all m
embe
rs:
Top
30%
Mid
dle
40%
Bott
om 3
0%
wom
en
This
resu
lt, fo
r exa
mpl
e, sh
ows t
hat y
our f
emal
e fa
culty
are
le
ss sa
tis�e
d th
an a
re w
omen
at y
our p
eers
(),
but m
ore
satis
�ed
than
are
wom
en a
t 70%
of o
ther
inst
itutio
ns (
).
Alth
ough
the
wom
en a
t you
r ins
titut
ion
are
“less
satis
�ed”
th
an w
omen
at p
eers
, the
y st
ill fa
re b
ette
r tha
n m
ost.
asso
cA
nd th
ese
resu
lts?
COA
CHE
Das
hboa
rdG
uide in
su�
cien
t dat
a fo
r rep
ortin
g
2008 +
16

The
Col
labo
rativ
e on
Aca
dem
ic C
aree
rs in
Hig
her
Edu
catio
nF
acul
ty J
ob S
atisf
actio
n Su
rvey
201
1-12
CO
AC
HE
DA
SHB
OA
RD
Mid
dle
bu
ry C
olle
ge
YO
UR
RE
SUL
TS
CO
MP
AR
ED
TO
PE
ER
S
AR
EA
S O
F S
TR
EN
GT
H I
N G
RE
EN
YO
UR
RE
SUL
TS
CO
MP
AR
ED
TO
CO
HO
RT
A
RE
AS
OF
CO
NC
ER
N I
N R
ED
smal
lm
oder
ate
larg
e
mea
nov
eral
lte
nure
dpr
e-te
nfu
llas
soc
men
wom
enw
hite
foc
tenu
rera
nkge
nder
race
Nat
ure
of w
ork:
Res
earc
h3.
81
wom
enfo
cN
atur
e of
wor
k: S
ervi
ce3.
34
tenu
red
asso
cw
omen
Nat
ure
of w
ork:
Tea
chin
g4.
02
pre-
ten
asso
cw
omen
foc
Fac
ilitie
s an
d w
ork
reso
urce
s3.
92
pre-
ten
asso
cw
omen
Per
sona
l and
fam
ily p
olic
ies
3.37
pre-
ten
asso
cw
omen
foc
Hea
lth a
nd r
etire
men
t ben
efits
4.16
pre-
ten
foc
Inte
rdis
cipl
inar
y w
ork
3.18
tenu
red
wom
enw
hite
Col
labo
ratio
n3.
64
tenu
red
asso
cM
ento
ring
3.42
tenu
red
asso
cw
omen
whi
teT
enur
e po
licie
s3.
54
N/A
N/A
N/A
N/A
N/A
wom
enT
enur
e cl
arity
3.44
N/A
N/A
N/A
N/A
N/A
wom
enT
enur
e re
ason
able
ness
3.77
N/A
N/A
N/A
N/A
N/A
wom
enfo
cP
rom
otio
n3.
90
N/A
N/A
asso
cw
omen
foc
Lead
ersh
ip: S
enio
r3.
46
tenu
red
asso
cw
omen
whi
teLe
ader
ship
: Div
isio
nal
N/A
N/A
N/A
N/A
N/A
N/A
N/A
N/A
N/A
N/A
N/A
N/A
N/A
N/A
Lead
ersh
ip: D
epar
tmen
tal
3.86
pre-
ten
asso
cfo
cD
epar
tmen
tal c
olle
gial
ity4.
11
pre-
ten
wom
enfo
cD
epar
tmen
tal e
ngag
emen
t3.
68
pre-
ten
wom
enfo
cD
epar
tmen
tal q
ualit
y3.
96
pre-
ten
asso
cw
omen
foc
App
reci
atio
n an
d re
cogn
ition
3.48
tenu
red
wom
enw
hite
INT
ER
NA
L C
AM
PU
S D
IFF
ER
EN
CE
S
0%
25%
50%
75%
100
%
you
pee
rsa
ll co
mpa
rabl
es
"If
I ha
d it
to d
o al
l ove
r,I
wou
ld a
gain
cho
ose
to w
ork
at th
is in
stitu
tion.
" som
ewha
t or
str
on
gly
agr
ee
nei
ther
/no
r
som
ewha
t or
str
on
gly
dis
agr
ee
0%
25%
50%
75%
100
%
you
pee
rsa
ll co
mpa
rabl
es
If a
can
dida
te f
or a
pos
ition
ask
ed y
ou a
bout
you
r de
part
men
t as
a pl
ace
to w
ork,
wou
ld y
ou... stro
ngl
y re
com
me
nd
you
r de
pa
rtm
ent
as
ap
lace
to
wor
k
reco
mm
end
yo
ur
dep
art
me
nt w
ithre
serv
atio
ns
not
re
com
me
nd y
ou
rd
epa
rtm
en
t as
a p
lace
to w
ork
17
The Collaborative on Academic Careers in Higher Education at the Harvard Graduate School of Education
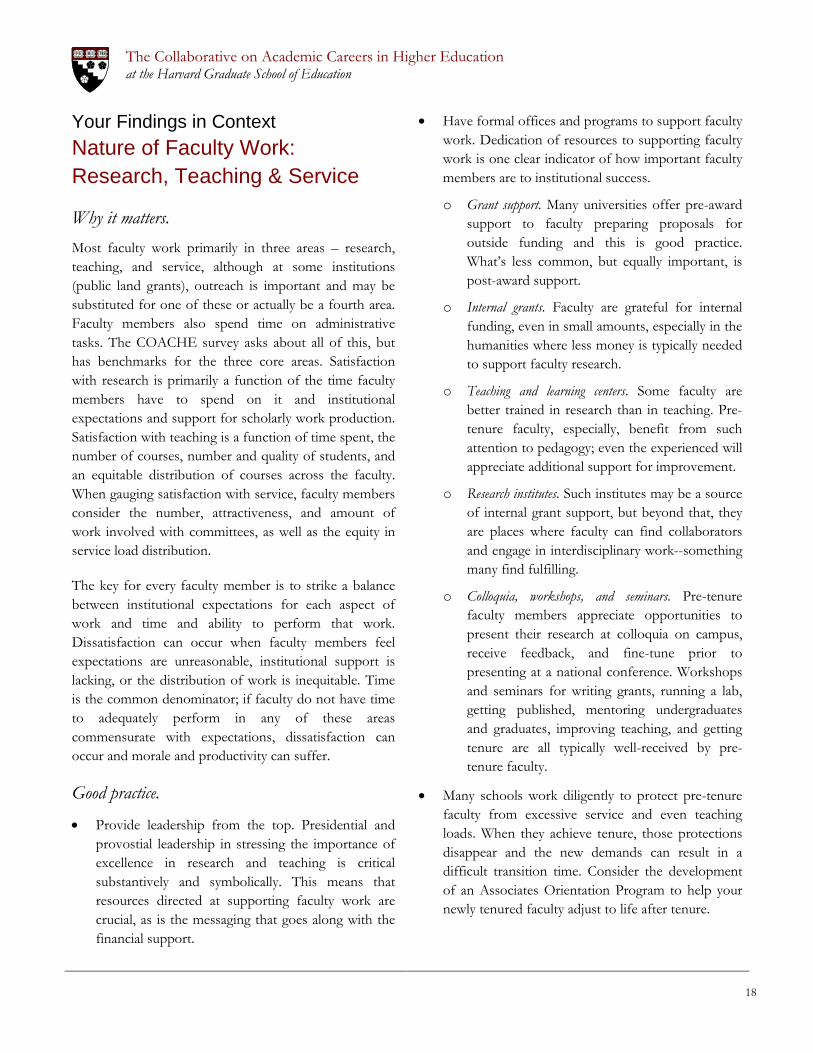
Your Findings in Context
Nature of Faculty Work: Research, Teaching & Service
Why it matters. Most faculty work primarily in three areas – research, teaching, and service, although at some institutions (public land grants), outreach is important and may be substituted for one of these or actually be a fourth area. Faculty members also spend time on administrative tasks. The COACHE survey asks about all of this, but has benchmarks for the three core areas. Satisfaction with research is primarily a function of the time faculty members have to spend on it and institutional expectations and support for scholarly work production. Satisfaction with teaching is a function of time spent, the number of courses, number and quality of students, and an equitable distribution of courses across the faculty. When gauging satisfaction with service, faculty members consider the number, attractiveness, and amount of work involved with committees, as well as the equity in service load distribution.
The key for every faculty member is to strike a balance between institutional expectations for each aspect of work and time and ability to perform that work. Dissatisfaction can occur when faculty members feel expectations are unreasonable, institutional support is lacking, or the distribution of work is inequitable. Time is the common denominator; if faculty do not have time to adequately perform in any of these areas commensurate with expectations, dissatisfaction can occur and morale and productivity can suffer.
Good practice.
• Provide leadership from the top. Presidential and provostial leadership in stressing the importance of excellence in research and teaching is critical substantively and symbolically. This means that resources directed at supporting faculty work are crucial, as is the messaging that goes along with the financial support.
• Have formal offices and programs to support faculty work. Dedication of resources to supporting faculty work is one clear indicator of how important faculty members are to institutional success.
o Grant support. Many universities offer pre-award support to faculty preparing proposals for outside funding and this is good practice. What’s less common, but equally important, is post-award support.
o Internal grants. Faculty are grateful for internal funding, even in small amounts, especially in the humanities where less money is typically needed to support faculty research.
o Teaching and learning centers. Some faculty are better trained in research than in teaching. Pre-tenure faculty, especially, benefit from such attention to pedagogy; even the experienced will appreciate additional support for improvement.
o Research institutes. Such institutes may be a source of internal grant support, but beyond that, they are places where faculty can find collaborators and engage in interdisciplinary work--something many find fulfilling.
o Colloquia, workshops, and seminars. Pre-tenure faculty members appreciate opportunities to present their research at colloquia on campus, receive feedback, and fine-tune prior to presenting at a national conference. Workshops and seminars for writing grants, running a lab, getting published, mentoring undergraduates and graduates, improving teaching, and getting tenure are all typically well-received by pre-tenure faculty.
• Many schools work diligently to protect pre-tenure faculty from excessive service and even teaching loads. When they achieve tenure, those protections disappear and the new demands can result in a difficult transition time. Consider the development of an Associates Orientation Program to help your newly tenured faculty adjust to life after tenure.
18

The
Col
labo
rativ
e on
Aca
dem
ic C
aree
rs in
Hig
her
Edu
catio
nF
acul
ty J
ob S
atisf
actio
n Su
rvey
201
1-12
NA
TU
RE
OF
WO
RK
:R
ESE
AR
CH
, SE
RV
ICE
, TE
AC
HIN
G
Mid
dle
bu
ry C
olle
ge
YO
UR
RE
SUL
TS
CO
MP
AR
ED
TO
PE
ER
S
AR
EA
S O
F S
TR
EN
GT
H I
NG
RE
EN
YO
UR
RE
SUL
TS
CO
MP
AR
ED
TO
CO
HO
RT
A
RE
AS
OF
CO
NC
ER
N I
NR
ED
smal
lm
oder
ate
larg
e
mea
nov
eral
lte
nure
dpr
e-te
nfu
llas
soc.
men
wom
enw
hite
foc
tenu
rera
nkge
nder
race
prio
r
Be
nc
hm
ark
: N
atu
re o
f W
ork
Re
se
arc
h3
.81
ass
oc
wo
me
nfo
cN
/AT
ime
sp
en
t o
n r
ese
arc
h3
.15
pre
-te
na
sso
cw
om
en
N/A
Exp
ect
atio
ns
for
find
ing
ext
ern
al f
un
din
g3
.70
wo
me
nN
/AIn
flue
nce
ove
r fo
cus
of
rese
arc
h4
.68
pre
-te
nfo
cN
/AQ
ua
lity
of
gra
d s
tud
en
ts t
o s
up
po
rt r
ese
arc
hN
/AN
/AN
/AN
/AN
/AN
/AN
/AN
/AN
/AN
/AN
/AN
/AN
/AN
/AN
/AS
up
po
rt f
or
rese
arc
h3
.96
ass
oc
wo
me
nfo
cN
/AS
up
po
rt f
or
en
ga
gin
g u
nd
erg
rad
s in
re
sea
rch
4.0
2
ten
ure
da
sso
cfo
cN
/AS
up
po
rt f
or
ob
tain
ing
gra
nts
(p
re-a
wa
rd)
4.0
4
pre
-te
na
sso
cfo
cN
/AS
up
po
rt f
or
ma
inta
inin
g g
ran
ts (
po
st-a
wa
rd)
3.7
9
ass
oc
foc
N/A
Su
pp
ort
fo
r se
curi
ng
gra
d s
tud
en
t a
ssis
tan
ceN
/AN
/AN
/AN
/AN
/AN
/AN
/AN
/AN
/AN
/AN
/AN
/AN
/AN
/AN
/AS
up
po
rt f
or
tra
vel t
o p
rese
nt/
con
du
ct r
ese
arc
h4
.12
ass
oc
wo
me
nfo
cN
/AA
vaila
bili
ty o
f co
urs
e r
ele
ase
fo
r re
sea
rch
2.7
9
wo
me
nN
/AB
en
chm
ark:
Na
ture
of
Wo
rk:
Ser
vice
3.3
4
ten
ure
da
sso
cw
om
en
N/A
Tim
e s
pe
nt
on
se
rvic
e3
.41
ten
ure
da
sso
cw
om
en
foc
N/A
Su
pp
ort
fo
r fa
culty
in le
ad
ers
hip
ro
les
3.0
6
ten
ure
da
sso
cw
om
en
foc
N/A
Nu
mb
er
of
com
mitt
ee
s3
.60
ten
ure
da
sso
cw
om
en
N/A
Att
ract
ive
ne
ss o
f co
mm
itte
es
3.5
5
ten
ure
da
sso
cN
/AD
iscr
etio
n t
o c
ho
ose
co
mm
itte
es
3.2
2
ten
ure
da
sso
cw
om
en
N/A
Eq
uita
bili
ty o
f co
mm
itte
e a
ssig
nm
en
ts3
.01
ten
ure
da
sso
cw
om
en
foc
N/A
Nu
mb
er
of
stu
de
nt
ad
vise
es
3.5
2
ass
oc
wo
me
nN
/AB
en
ch
ma
rk:
Na
ture
of
Wo
rk:
Te
ac
hin
g4
.02
pre
-te
na
sso
cw
om
en
foc
N/A
Tim
e s
pe
nt
on
te
ach
ing
4.0
5
pre
-te
nw
om
en
foc
N/A
Nu
mb
er
of
cou
rse
s ta
ug
ht
3.6
8
pre
-te
nw
om
en
foc
N/A
Le
vel o
f co
urs
es
tau
gh
t4
.08
pre
-te
na
sso
cw
om
en
foc
N/A
Dis
cre
tion
ove
r co
urs
e c
on
ten
t4
.53
pre
-te
na
sso
cw
om
en
foc
N/A
Nu
mb
er
of
stu
de
nts
in c
lass
es
tau
gh
t3
.87
pre
-te
na
sso
cw
om
en
foc
N/A
Qu
alit
y o
f st
ud
en
ts t
au
gh
t4
.34
pre
-te
na
sso
cw
om
en
foc
N/A
Eq
uita
bili
ty o
f d
istr
ibu
tion
of
tea
chin
g lo
ad
3.5
9
pre
-te
na
sso
cw
om
en
N/A
Qu
alit
y o
f g
rad
stu
de
nts
to
su
pp
ort
te
ach
ing
N/A
N/A
N/A
N/A
N/A
N/A
N/A
N/A
N/A
N/A
N/A
N/A
N/A
N/A
N/A
Rel
ated
sur
vey
item
sT
ime
sp
en
t o
n o
utr
ea
ch3
.43
pre
-te
na
sso
cfo
cN
/AT
ime
sp
en
t o
n a
dm
inis
tra
tive
ta
sks
3.0
8
ten
ure
da
sso
cw
om
en
wh
iteN
/AA
bili
ty t
o b
ala
nce
te
ach
ing
/re
sea
rch
/se
rvic
e3
.05
ten
ure
da
sso
cw
om
en
N/A
INT
ER
NA
L C
AM
PU
S D
IFF
ER
EN
CE
S
19

The Collaborative on Academic Careers in Higher Education at the Harvard Graduate School of Education
Your Findings in Context
Facilities, Personal/Family Policies, Benefits & Salary
Why it matters. Facilities and support. COACHE found a number of facets of the physical workplace for faculty to be especially important to faculty satisfaction, including office, lab, research or studio space, equipment, and classrooms. In addition, many faculty need support for technology, administrative work, and improvements to teaching.
Personal and family policies. The COACHE survey measures faculty beliefs about the effectiveness of various policies—many of them related to work-family balance and support for families. This is especially important because over 70 percent of COACHE respondents are married. Of the assistant professors, 62 percent have children under the age of 18 (32 percent have infants or toddlers); of associate professors, 53 percent have children under the age of 18 (16 percent have infants or toddlers); and of full professors, 33 percent have children under 18 (4 percent have infants or toddlers). A number of faculty are providing care for an elderly, disabled, or ill family members (from 10 percent of assistant to 14 percent of full professors).
Health and retirement benefits. Faculty, of course, require health benefits for themselves and their families. Phased retirement programs have become more prevalent recently; such programs provide benefits to individuals and institutions alike. Individuals enjoy the institutional affiliation, intellectual engagement, and contact with students and colleagues; institutions realize salary savings and can make better staffing projections. Asked for the primary reason they would choose to leave their institutions, 34 percent of full professors and 14 percent of associates reported “to retire”.
Good practice.
• When it comes to facilities, new is nice but equity is best. Faculty understand that not everyone can have
a brand new office or lab because campuses must invest in different areas over time, but everyone should enjoy equity in the distribution of resources and space within a department.
• Hire personnel to staff work-life services offices. This is important not only to get the job done but also for symbolic reasons. Putting physical resources into something signifies that it matters beyond the rhetoric. It is unlikely that universities will need fewer personnel in the future to attend to these matters.
• Have written policies. Platitudes that “This is a family-friendly place” or “There’s plenty of work-life balance here” are no longer enough. In addition to assuring pre-tenure faculty that the institution is doing more than just paying lip-service to work-life balance, written policies provide clarity, consistency, and transparency which leads to greater fairness and equity. Written policies are also the primary indicator of how family-friendly a campus actually is. Such policies include dual-career hiring; early promotion and tenure; parental leave; modified duties; part-time tenure options; and stop-the-tenure-clock provisions.
• Ensure that written policies are communicated to everyone—pre-tenure and tenured faculty members, chairs, heads, and deans. COACHE research indicates that written policies are particularly important to women and under-represented minorities. Make certain the policies are easily accessible online, and provide personnel to assist faculty in choosing the right healthcare option.
• Provide additional accommodations: Childcare, eldercare, lactation rooms, flexibility, and opportunities for social occasions in which kids can be included are all relevant practices that help ensure a viable workplace for the future.
• Offer phased retirement for faculty to ease into retirement gradually. At the same time, institutions have the flexibility to fill the void left by retiring faculty more easily. Retiring faculty can continue their contributions to the institution by developing the teachers, scholars, and leaders who follow them.
20

The
Col
labo
rativ
e on
Aca
dem
ic C
aree
rs in
Hig
her
Edu
catio
nF
acul
ty J
ob S
atisf
actio
n Su
rvey
201
1-12
FA
CIL
ITIE
S, P
ER
SON
AL
/FA
MIL
Y P
OL
ICIE
S,B
EN
EF
ITS,
AN
D S
AL
AR
Y
Mid
dle
bu
ry C
olle
ge
YO
UR
RE
SUL
TS
CO
MP
AR
ED
TO
PE
ER
S
AR
EA
S O
F S
TR
EN
GT
H I
NG
RE
EN
YO
UR
RE
SUL
TS
CO
MP
AR
ED
TO
CO
HO
RT
A
RE
AS
OF
CO
NC
ER
N I
NR
ED
smal
lm
oder
ate
larg
e
mea
nov
eral
lte
nure
dpr
e-te
nfu
llas
soc
men
wom
enw
hite
foc
tenu
rera
nkge
nder
race
prio
r
Ben
chm
ark:
Fac
iliti
es a
nd
wo
rk r
eso
urc
es3.
92
pre-
ten
asso
cw
omen
N/A
Sup
port
for
impr
ovin
g te
achi
ng3.
82
asso
cw
hite
N/A
Offi
ce4.
24
pre-
ten
asso
cm
enw
hite
N/A
Labo
rato
ry, r
esea
rch,
stu
dio
spac
e3.
81
men
foc
N/A
Equ
ipm
ent
4.05
asso
cw
omen
foc
N/A
Cla
ssro
oms
4.01
pre-
ten
asso
cm
enfo
cN
/ALi
brar
y re
sour
ces
4.01
pre-
ten
asso
cw
omen
foc
N/A
Com
putin
g an
d te
chni
cal s
uppo
rt3.
57
pre-
ten
asso
cw
omen
whi
teN
/AC
leric
al/a
dmin
istr
ativ
e su
ppor
t3.
78
tenu
red
full
wom
enw
hite
N/A
Ben
chm
ark:
Per
son
al a
nd
fam
ily p
olic
ies
3.37
pre-
ten
asso
cw
omen
foc
N/A
Hou
sing
ben
efits
3.51
pre-
ten
full
foc
N/A
Tui
tion
wai
vers
, rem
issi
on, o
r ex
chan
ge3.
76
pre-
ten
asso
cw
omen
foc
N/A
Spo
usal
/par
tner
hiri
ng p
rogr
am2.
62
pre-
ten
asso
cw
omen
N/A
Chi
ldca
re2.
82
pre-
ten
asso
cm
enw
hite
N/A
Eld
erca
re2.
67
pre-
ten
full
men
foc
N/A
Fam
ily m
edic
al/p
aren
tal l
eave
3.99
pre-
ten
men
N/A
Fle
xibl
e w
orkl
oad/
mod
ified
dut
ies
3.37
pre-
ten
asso
cw
omen
whi
teN
/AS
top-
the-
cloc
k po
licie
s4.
05
N/A
N/A
N/A
N/A
N/A
men
foc
N/A
Inst
. doe
s w
hat i
t can
for
wor
k/lif
e co
mpa
tibili
t y3.
12
pre-
ten
asso
cw
omen
foc
N/A
Rig
ht b
alan
ce b
etw
een
prof
essi
onal
/per
sona
l3.
09
asso
cw
omen
foc
N/A
Ben
chm
ark:
Hea
lth
an
d r
etir
emen
t b
enef
its
4.16
pre-
ten
foc
N/A
Hea
lth b
enef
its fo
r yo
urse
lf4.
30
pre-
ten
asso
cw
omen
foc
N/A
Hea
lth b
enef
its fo
r fa
mily
4.20
pre-
ten
asso
cw
omen
foc
N/A
Ret
irem
ent b
enef
its4.
18
pre-
ten
asso
cfo
cN
/AP
hase
d re
tirem
ent o
ptio
ns3.
59
tenu
red
asso
cm
enw
hite
N/A
Rel
ated
sur
vey
item
sS
alar
y3.
67
pre-
ten
asso
cN
/A
INT
ER
NA
L C
AM
PU
S D
IFF
ER
EN
CE
S
0%
10%
20%
30%
Hou
sin
g be
nefit
sT
uitio
n w
aive
rsS
pou
sal/p
artn
er
hirin
g pr
ogra
mC
hild
care
Eld
erca
reF
amily
med
ical
leav
eF
lexi
ble
wor
kloa
dS
top-
the-
clo
ckP
has
ed r
etire
men
top
tions
Per
cent
of
resp
onde
nts
indi
catin
g a
prog
ram
or
polic
y is
not
off
ered
at y
our
inst
itutio
n
you
pee
rs
all
com
para
ble
s
21
The Collaborative on Academic Careers in Higher Education at the Harvard Graduate School of Education
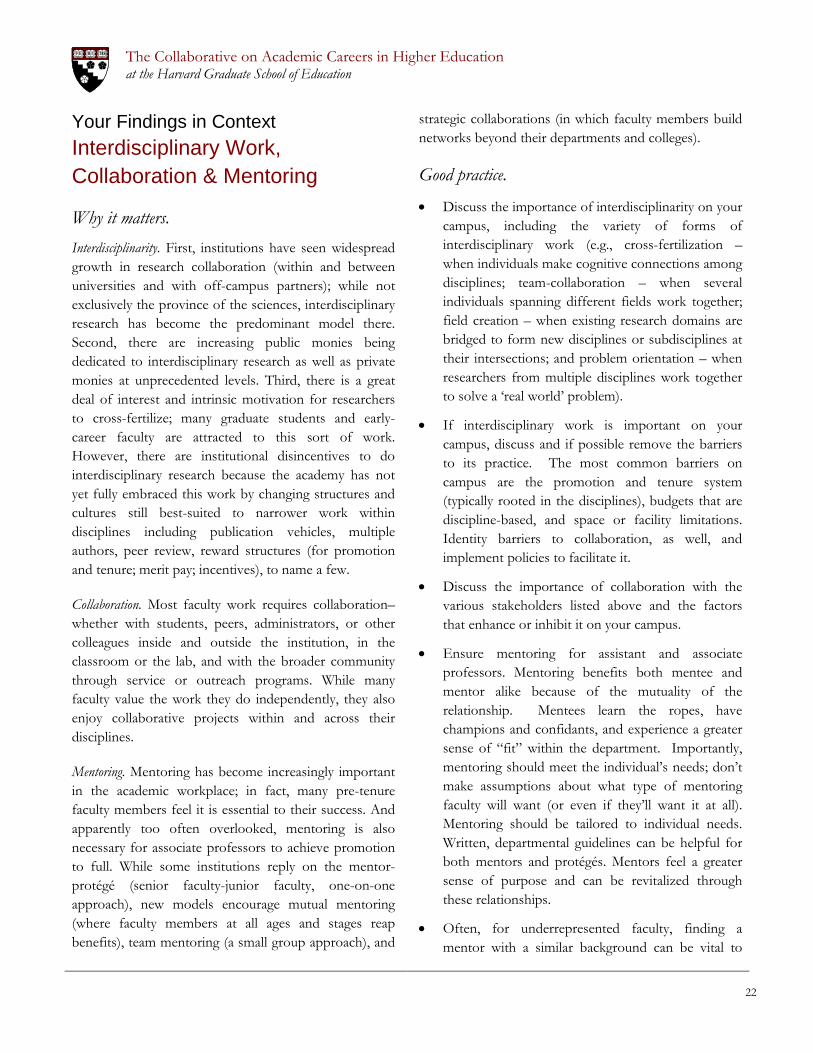
Your Findings in Context
Interdisciplinary Work, Collaboration & Mentoring
Why it matters. Interdisciplinarity. First, institutions have seen widespread growth in research collaboration (within and between universities and with off-campus partners); while not exclusively the province of the sciences, interdisciplinary research has become the predominant model there. Second, there are increasing public monies being dedicated to interdisciplinary research as well as private monies at unprecedented levels. Third, there is a great deal of interest and intrinsic motivation for researchers to cross-fertilize; many graduate students and early-career faculty are attracted to this sort of work. However, there are institutional disincentives to do interdisciplinary research because the academy has not yet fully embraced this work by changing structures and cultures still best-suited to narrower work within disciplines including publication vehicles, multiple authors, peer review, reward structures (for promotion and tenure; merit pay; incentives), to name a few.
Collaboration. Most faculty work requires collaboration–whether with students, peers, administrators, or other colleagues inside and outside the institution, in the classroom or the lab, and with the broader community through service or outreach programs. While many faculty value the work they do independently, they also enjoy collaborative projects within and across their disciplines.
Mentoring. Mentoring has become increasingly important in the academic workplace; in fact, many pre-tenure faculty members feel it is essential to their success. And apparently too often overlooked, mentoring is also necessary for associate professors to achieve promotion to full. While some institutions reply on the mentor-protégé (senior faculty-junior faculty, one-on-one approach), new models encourage mutual mentoring (where faculty members at all ages and stages reap benefits), team mentoring (a small group approach), and
strategic collaborations (in which faculty members build networks beyond their departments and colleges).
Good practice.
• Discuss the importance of interdisciplinarity on your campus, including the variety of forms of interdisciplinary work (e.g., cross-fertilization – when individuals make cognitive connections among disciplines; team-collaboration – when several individuals spanning different fields work together; field creation – when existing research domains are bridged to form new disciplines or subdisciplines at their intersections; and problem orientation – when researchers from multiple disciplines work together to solve a ‘real world’ problem).
• If interdisciplinary work is important on your campus, discuss and if possible remove the barriers to its practice. The most common barriers on campus are the promotion and tenure system (typically rooted in the disciplines), budgets that are discipline-based, and space or facility limitations. Identity barriers to collaboration, as well, and implement policies to facilitate it.
• Discuss the importance of collaboration with the various stakeholders listed above and the factors that enhance or inhibit it on your campus.
• Ensure mentoring for assistant and associate professors. Mentoring benefits both mentee and mentor alike because of the mutuality of the relationship. Mentees learn the ropes, have champions and confidants, and experience a greater sense of “fit” within the department. Importantly, mentoring should meet the individual’s needs; don’t make assumptions about what type of mentoring faculty will want (or even if they’ll want it at all). Mentoring should be tailored to individual needs. Written, departmental guidelines can be helpful for both mentors and protégés. Mentors feel a greater sense of purpose and can be revitalized through these relationships.
• Often, for underrepresented faculty, finding a mentor with a similar background can be vital to
22

Your Findings in Context
their success and yet difficult because of the limited number of underrepresented faculty in some disciplines. Consider building networks beyond the department or division. It may even be beneficial to build and support mentoring networks with other institutions.
• If possible, reward mentors through stipends or course release.
• Evaluate the quality of mentoring. Both mentors and mentees should be part of the evaluative process.
23
The
Col
labo
rativ
e on
Aca
dem
ic C
aree
rs in
Hig
her
Edu
catio
nF
acul
ty J
ob S
atisf
actio
n Su
rvey
201
1-12
INT
ER
DIS
CIP
LIN
AR
Y W
OR
K,
CO
LL
AB
OR
AT
ION
, AN
D M
EN
TO
RIN
G
Mid
dle
bu
ry C
olle
ge
YO
UR
RE
SUL
TS
CO
MP
AR
ED
TO
PE
ER
S
AR
EA
S O
F S
TR
EN
GT
H I
NG
RE
EN
YO
UR
RE
SUL
TS
CO
MP
AR
ED
TO
CO
HO
RT
A
RE
AS
OF
CO
NC
ER
N I
NR
ED
smal
lm
oder
ate
larg
e
mea
nov
eral
lte
nure
dpr
e-te
nfu
llas
soc.
men
wom
enw
hite
foc
tenu
rera
nkge
nder
race
prio
r
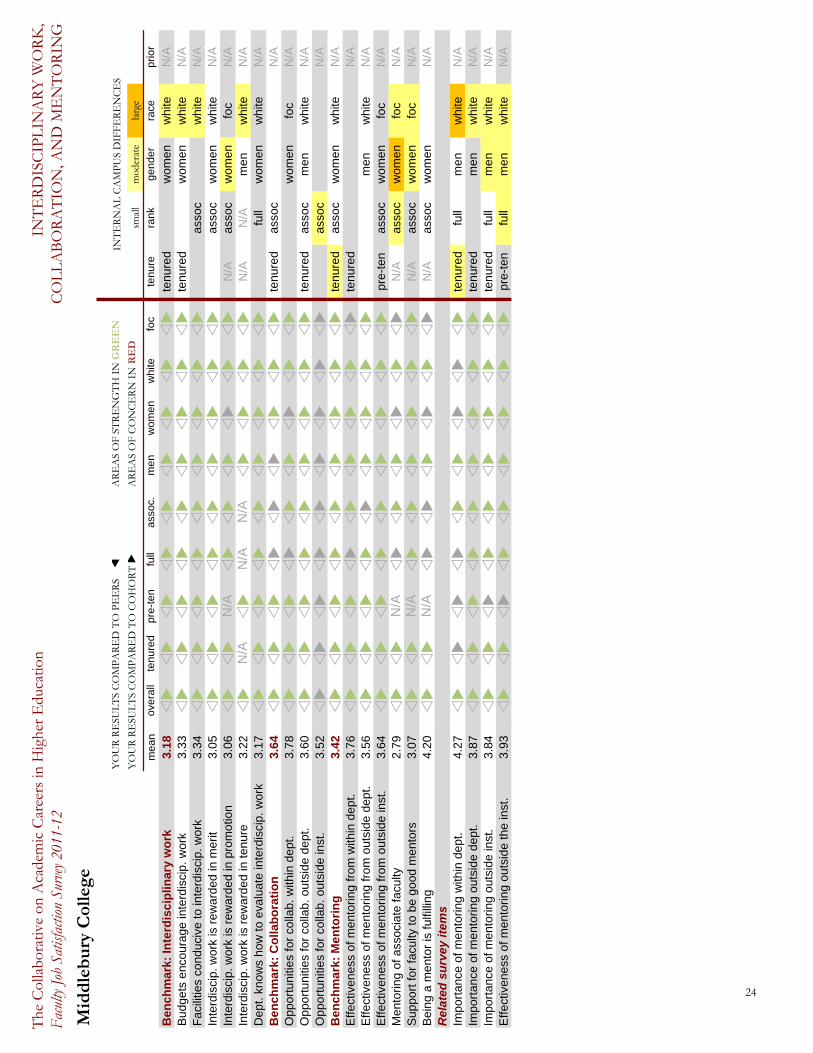
Ben
chm
ark:
Inte
rdis
cip
linar
y w
ork
3.18
tenu
red
wom
enw
hite
N/A
Bud
gets
enc
oura
ge in
terd
isci
p. w
ork
3.33
tenu
red
wom
enw
hite
N/A
Fac
ilitie
s co
nduc
ive
to in
terd
isci
p. w
ork
3.34
asso
cw
hite
N/A
Inte
rdis
cip.
wor
k is
rew
arde
d in
mer
it3.
05
asso
cw
omen
whi
teN
/AIn
terd
isci
p. w
ork
is r
ewar
ded
in p
rom
otio
n3.
06
N/A
N/A
asso
cw
omen
foc
N/A
Inte
rdis
cip.
wor
k is
rew
arde
d in
tenu
re3.
22
N/A
N/A
N/A
N/A
N/A
men
whi
teN
/AD
ept.
know
s ho
w to
eva
luat
e in
terd
isci
p. w
ork
3.17
full
wom
enw
hite
N/A
Ben
chm
ark:
Co
llab
ora
tio
n3.
64
tenu
red
asso
cN
/AO
ppor
tuni
ties
for
colla
b. w
ithin
dep
t.3.
78
wom
enfo
cN
/AO
ppor
tuni
ties
for
colla
b. o
utsi
de d
ept.
3.60
tenu
red
asso
cm
enw
hite
N/A
Opp
ortu
nitie
s fo
r co
llab.
out
side
inst
.3.
52
asso
cN
/AB
ench
mar
k: M
ento
rin
g3.
42
tenu
red
asso
cw
omen
whi
teN
/AE
ffect
iven
ess
of m
ento
ring
from
with
in d
ept.
3.76
tenu
red
N/A
Effe
ctiv
enes
s of
men
torin
g fr
om o
utsi
de d
ept.
3.56
men
whi
teN
/AE
ffect
iven
ess
of m
ento
ring
from
out
side
inst
.3.
64
pre-
ten
asso
cw
omen
foc
N/A
Men
torin
g of
ass
ocia
te fa
culty
2.79
N/A
N/A
asso
cw
omen
foc
N/A
Sup
port
for
facu
lty to
be
good
men
tors
3.07
N/A
N/A
asso
cw
omen
foc
N/A
Bei
ng a
men
tor
is fu
lfilli
ng4.
20
N/A
N/A
asso
cw
omen
N/A
Rel
ated
sur
vey
item
sIm
port
ance
of m
ento
ring
with
in d
ept.
4.27
tenu
red
full
men
whi
teN
/AIm
port
ance
of m
ento
ring
outs
ide
dept
.3.
87
tenu
red
men
whi
teN
/AIm
port
ance
of m
ento
ring
outs
ide
inst
.3.
84
tenu
red
full
men
whi
teN
/AE
ffect
iven
ess
of m
ento
ring
outs
ide
the
inst
.3.
93
pre-
ten
full
men
whi
teN
/A
INT
ER
NA
L C
AM
PU
S D
IFF
ER
EN
CE
S
24
The
Col
labo
rativ
e on
Aca
dem
ic C
aree
rs in
Hig
her
Edu
catio
nF
acul
ty J
ob S
atisf
actio
n Su
rvey
201
1-12
INT
ER
DIS
CIP
LIN
AR
Y W
OR
K,
CO
LL
AB
OR
AT
ION
, AN
D M
EN
TO
RIN
G
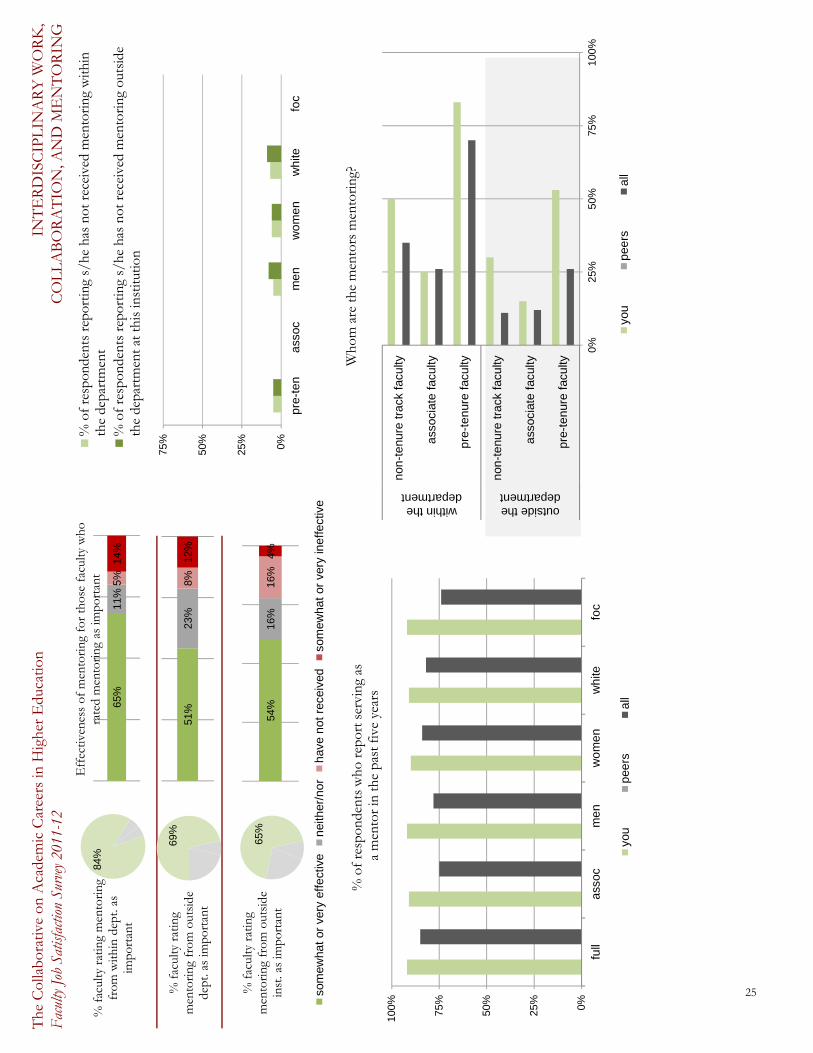
65%
11%
5%14
%
54%
16%
16%
4%
som
ewha
t or
ver
y ef
fect
ive
nei
ther
/no
rh
ave
no
t re
ceiv
edso
mew
hat
or v
ery
ine
ffect
ive
0%25%
50%
75%
100%
full
ass
ocm
en
wo
me
nw
hite
foc
% o
f re
spon
dent
s w
ho r
epor
t ser
ving
as
a m
ento
r in
the
past
five
yea
rs
you
pee
rsa
ll
65%
0%25%
50%
75%
pre
-te
na
ssoc
me
nw
om
en
wh
itefo
c
% o
f re
spon
dent
s re
port
ing
s/he
has
not
rec
eive
d m
ento
ring
with
inth
e de
part
men
t%
of
resp
onde
nts
repo
rtin
g s/
he h
as n
ot r
ecei
ved
men
tori
ng o
utsi
deth
e de
part
men
t at t
his
inst
itutio
n
69%
% f
acul
ty r
atin
g m
ento
ring
fro
m o
utsi
de
inst
. as
impo
rtan
t
84%
51%
23%
8%12
%
% f
acul
tyra
ting
men
torin
g fr
om w
ithin
dep
t. as
im
port
ant
% f
acul
ty r
atin
g m
ento
ring
fro
m o
utsi
de
dept
. as
impo
rtan
t
Eff
ectiv
enes
s of
men
tori
ng f
or th
ose
facu
lty w
ho
rate
d m
ento
ring
as
impo
rtan
t
0%25
%50
%75
%10
0%
pre
-te
nur
e f
acu
lty
ass
ocia
te f
acul
ty
non
-te
nure
tra
ck f
acu
lty
pre
-te
nur
e f
acu
lty
ass
ocia
te f
acul
ty
non
-te
nure
tra
ck f
acu
lty
outside thedepartment
within thedepartment
Who
m a
re th
e m
ento
rs m
ento
ring
?
you
pee
rsa
ll
25

The Collaborative on Academic Careers in Higher Education at the Harvard Graduate School of Education
Your Findings in Context
Tenure & Promotion
Why it matters. For tenure. While it is impossible to wipe anxiety from the psyche of pre-tenure faculty members, or the stress from their lives while working during the probationary period en route to tenure, it is in everyone’s best interest to be as clear as possible about the institutional expectations for research, teaching, advising, colleagueship and service to the institution and the broader community (if those factors matter in the tenure bid). There should also be clarity about the tenure process (who needs to do what by when), criteria (what counts), standards (the performance threshold), and the body of evidence to be presented (what goes into the tenure dossier). Ideally, pre-tenure faculty should receive consistent messages (one reason for having written criteria and standards) about what is required for tenure and should have reasonable assurance that tenure decisions are fair and equitable in that they are based on performance (e.g., research/creative work, teaching, and service) rather than on other factors like demographics, relationships, or departmental politics.
In addition to being clear, what’s expected of tenure-track faculty should be reasonable. Administrators and faculty alike acknowledge that, at most institutions, the bar to achieve tenure has risen over the years. While that may be good for the academy—and in fact, most pre-tenure faculty report that they do not mind high standards—it is important to be cognizant of the workload on pre-tenure faculty members and attempt to ensure reasonably, not impossibly, high expectations. It is possible to be both rigorous and reasonable.
For promotion. To clarity about the process, criteria, standards, and body of evidence, and some semblance of reasonableness, for associate professors, we add two factors of importance: 1) clarity about the timeframe for putting oneself forward for promotion to full; and 2) a departmental culture that encourages faculty to seek promotion to full rather than languish forever at the associate level.
Good practice. For Assistant Professors…
• Tell tenure-track faculty what to expect at the outset—during the interview stage—and then reinforce that prior to their arrival on campus and again upon arrival.
• Set weights or priorities with tenure-track faculty members so that they know what counts most and can focus their work in those areas.
• If collegiality, outreach, and service count in the tenure process, provide definitions, say how it counts, and state how it will be measured.
• Provide relevant written information. Pre-tenure faculty members should be informed about where to find all the information they need to get started and feel comfortable on campus and also about how to get tenure. They appreciate clear websites with easy links to relevant policies and people.
• Provide new faculty orientation as well as workshops to support effective teaching and research throughout the pre-tenure years.
• Host Q&A sessions or provide other venues where pre-tenure faculty can safely ask difficult questions and have them answered by those who know.
• Provide plenty of feedback all along the way—annually and more thoroughly still in a third- or fourth-year review. Annual reviews, in writing, are very helpful and midpoint reviews with specific guidance are crucial to pre-tenure faculty clarity, satisfaction, and success.
• Provide sample dossiers to pre-tenure faculty and sample feedback letters to those responsible for writing them.
• Provide education sessions, as needed, for new chairs to learn how to deliver clear performance feedback to pre-tenure faculty annually and more comprehensively at mid-point.
26

Your Findings in Context
• Hire tenure-track faculty with the expectation that they will achieve tenure. This may sound obvious, but it isn’t always, and it should be explicit. After all, hiring on the tenure-track is an expensive proposition and, if all goes well, the faculty member may stay for their entire career.
• Ensure open doors to the chair and senior faculty members. The most clear and satisfied junior faculty have access to the chair and other senior colleagues not only for questions about tenure but also for feedback, opportunities to collaborate, and colleagueship.
For Associate Professors…
• Be cognizant of the workload that is placed on associate professors. They often find themselves suddenly buried with service, mentoring of tenure-track faculty, and more student advising, as well as more leadership/administrative duties that may actually get in the way of their continued trajectory to full.
• While the academy has provided numerous policies for assistant professors (e.g., research leave; stop-the-tenure-clock; part-time tenure-track), it has done far less for associates. Some ideas include: modified duties; leave; sabbatical planning and other workshops; workload shifts (more teaching or more research); improved communication about timing/nudge to stand for full; small grants to support mid-career faculty (e.g., matching funds, travel support); a trigger mechanism (e.g. 9th year review); and broader, more inclusive criteria.
• Provide mentors; just because a faculty member gets tenure and promoted to the associate rank does not mean that s/he no longer needs or wants a mentor.
27

The
Col
labo
rativ
e on
Aca
dem
ic C
aree
rs in
Hig
her
Edu
catio
nF
acul
ty J
ob S
atisf
actio
n Su
rvey
201
1-12
TE
NU
RE
AN
D P
RO
MO
TIO
N
Mid
dle
bu
ry C
olle
ge
YO
UR
RE
SUL
TS
CO
MP
AR
ED
TO
PE
ER
S
AR
EA
S O
F S
TR
EN
GT
H I
NG
RE
EN
YO
UR
RE
SUL
TS
CO
MP
AR
ED
TO
CO
HO
RT
A
RE
AS
OF
CO
NC
ER
N I
NR
ED
smal
lm
oder
ate
larg
e
mea
nov
eral
lte
nure
dpr
e-te
nfu
llas
soc.
men
wom
enw
hite
foc
tenu
rera
nkge
nder
race
prio
r
Be
nc
hm
ark
: T
en
ure
po
lic
ies
3.5
4
N/A
N/A
N/A
N/A
N/A
wo
me
nN
/AC
lari
ty o
f te
nu
re p
roce
ss3
.70
N/A
N/A
N/A
N/A
N/A
wo
me
nN
/AC
lari
ty o
f te
nu
re c
rite
ria
3.7
9
N/A
N/A
N/A
N/A
N/A
wo
me
nN
/AC
lari
ty o
f te
nu
re s
tan
da
rds
3.1
9
N/A
N/A
N/A
N/A
N/A
wo
me
nw
hite
N/A
Cla
rity
of
bo
dy
of
evi
de
nce
fo
r d
eci
din
g t
en
ure
4.0
5
N/A
N/A
N/A
N/A
N/A
wo
me
nw
hite
N/A
Cla
rity
of
wh
eth
er
I w
ill a
chie
ve t
en
ure
3.5
1
N/A
N/A
N/A
N/A
N/A
wo
me
nw
hite
N/A
Co
nsi
ste
ncy
of
me
ssa
ge
s a
bo
ut
ten
ure
3.1
2
N/A
N/A
N/A
N/A
N/A
N/A
Te
nu
re d
eci
sio
ns
are
pe
rfo
rma
nce
-ba
sed
3.5
9
N/A
N/A
N/A
N/A
N/A
wo
me
nfo
cN
/AB
en
ch
ma
rk:
Te
nu
re c
lari
ty3
.44
N/A
N/A
N/A
N/A
N/A
wo
me
nN
/AC
lari
ty o
f e
xpe
cta
tion
s: S
cho
lar
3.5
6
N/A
N/A
N/A
N/A
N/A
wo
me
nw
hite
N/A
Cla
rity
of
exp
ect
atio
ns:
Te
ach
er
4.0
9
N/A
N/A
N/A
N/A
N/A
wo
me
nfo
cN
/AC
lari
ty o
f e
xpe
cta
tion
s: A
dvi
sor
3.4
7
N/A
N/A
N/A
N/A
N/A
wo
me
nN
/AC
lari
ty o
f e
xpe
cta
tion
s: C
olle
ag
ue
3.3
5
N/A
N/A
N/A
N/A
N/A
wh
iteN
/AC
lari
ty o
f e
xpe
cta
tion
s: C
am
pu
s ci
tize
n3
.33
N/A
N/A
N/A
N/A
N/A
N/A
Cla
rity
of
exp
ect
atio
ns:
Bro
ad
er
com
mu
nity
2.7
8
N/A
N/A
N/A
N/A
N/A
wo
me
nN
/AB
en
ch
ma
rk:
Te
nu
re r
ea
so
na
ble
ne
ss
3.7
7
N/A
N/A
N/A
N/A
N/A
wo
me
nfo
cN
/AR
ea
son
ab
le e
xpe
cta
tion
s: S
cho
lar
3.7
6
N/A
N/A
N/A
N/A
N/A
wo
me
nN
/AR
ea
son
ab
le e
xpe
cta
tion
s: T
ea
che
r4
.00
N/A
N/A
N/A
N/A
N/A
wo
me
nfo
cN
/AR
ea
son
ab
le e
xpe
cta
tion
s: A
dvi
sor
3.8
3
N/A
N/A
N/A
N/A
N/A
N/A
Re
aso
na
ble
exp
ect
atio
ns:
Co
llea
gu
e3
.93
N/A
N/A
N/A
N/A
N/A
foc
N/A
Re
aso
na
ble
exp
ect
atio
ns:
Ca
mp
us
citiz
en
3.7
1
N/A
N/A
N/A
N/A
N/A
wo
me
nfo
cN
/AR
ea
son
ab
le e
xpe
cta
tion
s: C
om
mu
nity
me
mb
er
3.4
6
N/A
N/A
N/A
N/A
N/A
wo
me
nw
hite
N/A
Be
nc
hm
ark
: P
rom
oti
on
3.9
0
N/A
N/A
ass
oc
wo
me
nfo
cN
/AR
ea
son
ab
le e
xpe
cta
tion
s: P
rom
otio
n4
.03
N/A
N/A
ass
oc
wo
me
nfo
cN
/AD
ep
t. c
ultu
re e
nco
ura
ge
s p
rom
otio
n3
.90
N/A
N/A
ass
oc
wo
me
nfo
cN
/AC
lari
ty o
f p
rom
otio
n p
roce
ss3
.88
N/A
N/A
wo
me
nfo
cN
/AC
lari
ty o
f p
rom
otio
n c
rite
ria
3.7
8
N/A
N/A
wo
me
nfo
cN
/AC
lari
ty o
f p
rom
otio
n s
tan
da
rds
3.5
3
N/A
N/A
ass
oc
wo
me
nfo
cN
/AC
lari
ty o
f b
od
y o
f e
vid
en
ce f
or
pro
mo
tion
3.9
9
N/A
N/A
wo
me
nfo
cN
/AC
lari
ty o
f tim
e f
ram
e f
or
pro
mo
tion
4.2
4
N/A
N/A
ass
oc
wo
me
nN
/AC
lari
ty o
f w
he
the
r I
will
be
pro
mo
ted
3.7
5
N/A
N/A
N/A
N/A
wo
me
nfo
cN
/A
INT
ER
NA
L C
AM
PU
S D
IFF
ER
EN
CE
S
28

The
Col
labo
rativ
e on
Aca
dem
ic C
aree
rs in
Hig
her
Edu
catio
nF
acul
ty J
ob S
atisf
actio
n Su
rvey
201
1-12
TE
NU
RE
AN
D P
RO
MO
TIO
N
Mid
dle
bu
ry C
olle
ge
0%25
%50
%75
%10
0%
me
n
wo
me
n
wh
ite foc
Whe
n do
you
pla
n to
sub
mit
your
dos
sier
for
prom
otio
n to
full
prof
esso
r?
nev
er
in t
en
year
s or
mo
reI
don
't kn
ow
in m
ore
tha
n f
ive
yea
rs b
ut
less
tha
n te
n y
ea
rsin
fiv
e y
ea
rs o
r le
ss
0%25
%50
%75
%10
0%
0%25
%50
%75
%10
0%
you
pee
rs all
no
yes
0%25
%50
%75
%10
0%
you
pee
rs all
Hav
e yo
u re
ceiv
ed fo
rmal
feed
back
on
your
pro
gres
s to
war
ds
prom
otio
n to
full
prof
esso
r?H
ave
you
rece
ived
for
mal
feed
back
on
your
pro
gres
s to
war
ds te
nure
?
0%
25%
50%
75%
100
%
you
pee
rs all
My
deci
sion
to r
emai
n at
this
inst
itutio
n fo
r th
e re
st o
f my
care
er d
epen
ds o
n w
heth
er I
am
pro
mot
ed to
ful
l pro
fess
or.
som
ewha
t or
str
on
gly
dis
ag
ree
nei
ther
/no
rso
mew
hat
or s
tro
ng
ly a
gre
e
you
peer
s
0%25
%50
%75
%10
0%
all
29

The Collaborative on Academic Careers in Higher Education at the Harvard Graduate School of Education
Your Findings in Context
Leadership & Governance
Why it matters. Academic leaders—especially the provost, dean, and department chair—play major roles in shaping the satisfaction or dissatisfaction of faculty members. From the administration, faculty desire: 1) a clearly articulated mission and vision for the institution that does not change frequently in ways that affect faculty work (e.g., focus on research over teaching or vice versa; importance of generating outside grants); 2) clear expectations for the mix of research, teaching, and service or outreach that remain consistent over time; 3) a sense that their work is valued; and 4) support for research (pre- and post-award) and teaching (adapted from COACHE Report, June 2010).
The president affects faculty, especially, through the stated priorities s/he sets, how well those priorities are communicated, and the pace of decision-making. As Chief Academic Officer, the provost has an impact on faculty work and morale in those same ways, but also by ensuring opportunities for faculty input and supporting the faculty in adapting to changes to mission and/or priorities. Deans or divisional leaders affect the faculty in the same categories as the provost. In addition to these factors, we add fairness in faculty evaluation to the list of things that are important to faculty when they judge department head or chair leadership.
Good practice.
• Ideally, the institution’s mission should remain stable for long periods of time; however, it is unrealistic to think that missions are permanent.
• If the mission needs to change, consult with the faculty to seek their views and assistance in ensuring that changes are implemented smoothly.
• Make sure that all faculty members understand how the shifts in institutional mission affect strategic priorities and the work that faculty do.
• Ensure that resources are allocated effectively to support changes in faculty work.
• Be careful to not let tenure-track faculty get caught unaware, unsuspecting, or unprepared for shifts in priorities. The guidelines for tenure and promotion should not be changed midstream; commitments should be honored.
• Allow senior faculty members grace periods to adjust to new expectations.
• It is almost impossible to over-communicate with faculty about changes to mission, institutional priorities, and resource allocation.
• Consistent messaging is pivotal to strong leadership. Work diligently to ensure that senior, divisional, and departmental leaders are hearing and communicating the same message about institutional priorities.
• Institutional priorities need to be communicated via multiple mediums and venues. A blanket email or a change to a section of the webpage does not adequately ensure broad communication of institutional priorities. Develop a communication plan that considers how the majority (and the minority) of faculty get information.
• Provide training and ongoing educational sessions for department chairs; their role is pivotal in the success of faculty and departments.
• Provide web portals with “one stop shopping” for department chairs.
30
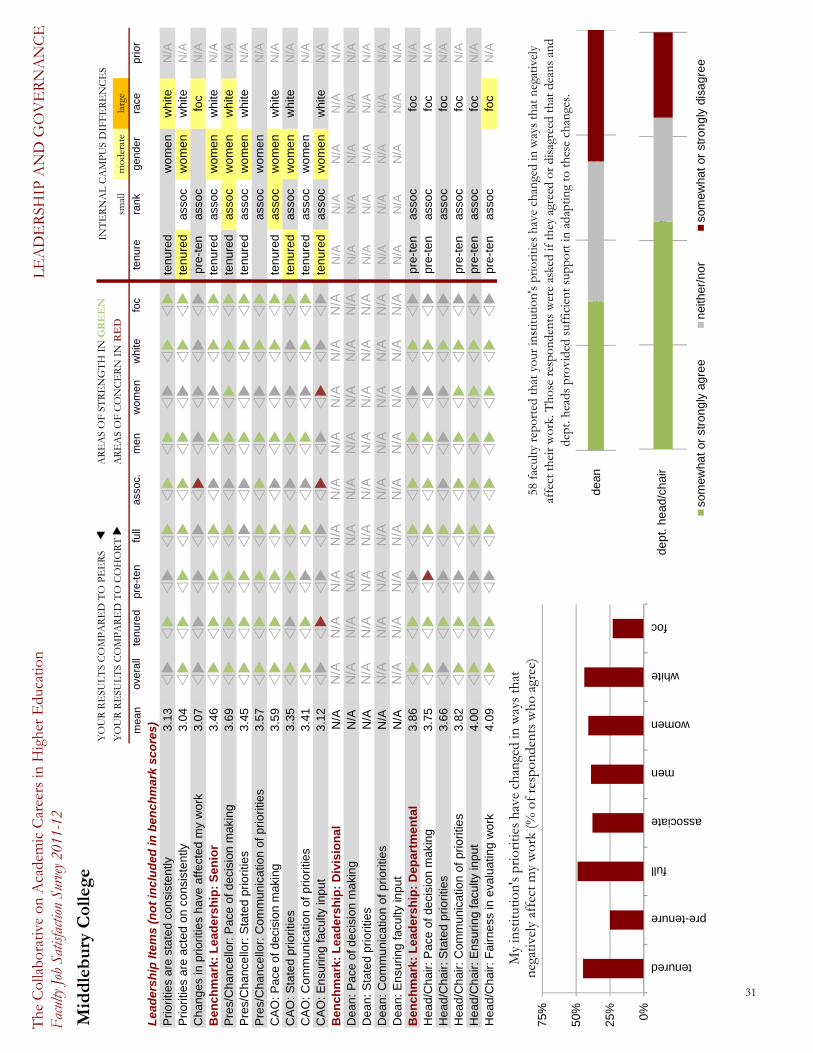
The
Col
labo
rativ
e on
Aca
dem
ic C
aree
rs in
Hig
her
Edu
catio
nF
acul
ty J
ob S
atisf
actio
n Su
rvey
201
1-12
LE
AD
ER
SHIP
AN
D G
OV
ER
NA
NC
E
Mid
dle
bu
ry C
olle
ge
YO
UR
RE
SUL
TS
CO
MP
AR
ED
TO
PE
ER
S
AR
EA
S O
F S
TR
EN
GT
H I
NG
RE
EN
YO
UR
RE
SUL
TS
CO
MP
AR
ED
TO
CO
HO
RT
A
RE
AS
OF
CO
NC
ER
N I
NR
ED
smal
lm
oder
ate
larg
e
mea
nov
eral
lte
nure
dpr
e-te
nfu
llas
soc.
men
wom
enw
hite
foc
tenu
rera
nkge
nder
race
prio
r
Lead
ersh
ip It
ems
(not
incl
uded
in b
ench
mar
k sc
ores
)P
riorit
ies
are
stat
ed c
onsi
sten
tly3.
13
tenu
red
wom
enw
hite
N/A
Prio
ritie
s ar
e ac
ted
on c
onsi
sten
tly3.
04
tenu
red
asso
cw
omen
whi
teN
/AC
hang
es in
prio
ritie
s ha
ve a
ffect
ed m
y w
ork
3.07
pre-
ten
asso
cfo
cN
/AB
ench
mar
k: L
ead
ersh
ip:
Sen
ior
3.46
tenu
red
asso
cw
omen
whi
teN
/AP
res/
Cha
ncel
lor:
Pac
e of
dec
isio
n m
akin
g3.
69
tenu
red
asso
cw
omen
whi
teN
/AP
res/
Cha
ncel
lor:
Sta
ted
prio
ritie
s3.
45
tenu
red
asso
cw
omen
whi
teN
/AP
res/
Cha
ncel
lor:
Com
mun
icat
ion
of p
riorit
ies
3.57
asso
cw
omen
N/A
CA
O: P
ace
of d
ecis
ion
mak
ing
3.59
tenu
red
asso
cw
omen
whi
teN
/AC
AO
: Sta
ted
prio
ritie
s3.
35
tenu
red
asso
cw
omen
whi
teN
/AC
AO
: Com
mun
icat
ion
of p
riorit
ies
3.41
tenu
red
asso
cw
omen
N/A
CA
O: E
nsur
ing
facu
lty in
put
3.12
tenu
red
asso
cw
omen
whi
teN
/AB
ench
mar
k: L
ead
ersh
ip:
Div
isio
nal
N/A
N/A
N/A
N/A
N/A
N/A
N/A
N/A
N/A
N/A
N/A
N/A
N/A
N/A
N/A
Dea
n: P
ace
of d
ecis
ion
mak
ing
N/A
N/A
N/A
N/A
N/A
N/A
N/A
N/A
N/A
N/A
N/A
N/A
N/A
N/A
N/A
Dea
n: S
tate
d pr
iorit
ies
N/A
N/A
N/A
N/A
N/A
N/A
N/A
N/A
N/A
N/A
N/A
N/A
N/A
N/A
N/A
Dea
n: C
omm
unic
atio
n of
prio
ritie
sN
/AN
/AN
/AN
/AN
/AN
/AN
/AN
/AN
/AN
/AN
/AN
/AN
/AN
/AN
/AD
ean:
Ens
urin
g fa
culty
inpu
tN
/AN
/AN
/AN
/AN
/AN
/AN
/AN
/AN
/AN
/AN
/AN
/AN
/AN
/AN
/AB
ench
mar
k: L
ead
ersh
ip:
Dep
artm
enta
l3.
86
pre-
ten
asso
cfo
cN
/AH
ead/
Cha
ir: P
ace
of d
ecis
ion
mak
ing
3.75
pre-
ten
asso
cfo
cN
/AH
ead/
Cha
ir: S
tate
d pr
iorit
ies
3.66
asso
cfo
cN
/AH
ead/
Cha
ir: C
omm
unic
atio
n of
prio
ritie
s3.
82
pre-
ten
asso
cfo
cN
/AH
ead/
Cha
ir: E
nsur
ing
facu
lty in
put
4.00
pre-
ten
asso
cfo
cN
/AH
ead/
Cha
ir: F
airn
ess
in e
valu
atin
g w
ork
4.09
pre-
ten
asso
cfo
cN
/A
INT
ER
NA
L C
AM
PU
S D
IFF
ER
EN
CE
S
Insu
ffien
t num
ber
of r
espo
nden
ts to
rep
ort
dean
dept
. hea
d/ch
air
Insu
ffien
t num
ber
of r
espo
nden
ts to
rep
ort
58 f
acul
ty r
epor
ted
that
you
r in
stitu
tion'
s pr
iorit
ies
have
cha
nged
in w
ays
that
neg
ativ
ely
affe
ct th
eir
wor
k. T
hose
res
pond
ents
wer
e as
ked
if th
ey a
gree
d or
dis
agre
ed th
at d
eans
and
de
pt. h
eads
pro
vide
d su
ffic
ient
sup
port
in a
dapt
ing
to th
ese
chan
ges.
0%
25%
50%
75%
tenured
pre-tenure
full
associate
men
women
white
foc
My
inst
itutio
n's
prio
ritie
s ha
ve c
hang
ed in
way
s th
at
nega
tivel
y af
fect
my
wor
k (%
of
resp
onde
nts
who
agr
ee)
som
ewha
t or
str
on
gly
ag
ree
nei
ther
/no
rso
mew
hat
or s
tro
ng
ly d
isa
gre
e
31

The Collaborative on Academic Careers in Higher Education at the Harvard Graduate School of Education
Your Findings in Context
The Department
Why it matters. While faculty work at institutions, they work in departments; therefore, it is the departmental culture that has the most impact on faculty satisfaction and morale. There are three broad areas in which faculty judge the departments in which they work: collegiality, engagement, and quality.
Collegiality. While many factors comprise faculty members’ opinions about departmental collegiality, COACHE has discovered that faculty are especially cognizant of how well they feel they “fit” in with their colleagues, their personal interactions with colleagues, whether their colleagues “pitch in” when needed, and colleague support for work/life balance (among others). There really is no substitute for a collegial department when it comes to faculty satisfaction, so how well faculty get along with each other cannot be over-emphasized.
Engagement. It is increasingly common to talk about student engagement but perhaps less so faculty engagement. But it is difficult to imagine an engaged student population without ensuring engaged faculty. COACHE measures the engagement of faculty by having them rate their discussions about undergraduate and graduate learning, pedagogy, the use of technology, research methodology, and professional interactions among colleagues.
Quality. Departmental quality is a function of the intellectual vitality of its faculty, the scholarship that is produced, the effectiveness of teaching, how well the department does recruiting and retaining excellent faculty, and whether and how poor faculty performance is handled.
Good practice.
• Chairs especially are well-served to pay attention to departmental collegiality. Have an open-door policy
so that faculty members can stop in and chat about departmental issues. Intervene when necessary.
• Be especially cognizant to ensure that those who are in the minority—whether by gender, race/ethnicity, age, subfield, political views or some other factor—are not excluded or marginalized in the department; one person’s autonomy might be another’s isolation.
• Create forums for faculty to play together – schedule some social activities; be sure that everyone knows about important milestones in each other’s lives. Celebrate!
• Create forums for faculty to work together, to discuss research, methodology, interdisciplinary ideas, pedagogy, and technology.
• Provide chair training for handling performance feedback for tenure-track faculty members (e.g., annual reviews, mid-probationary period reviews), tenured faculty members (e.g., post-tenure review, annual or merit review, informal feedback); and non-tenure-track faculty.
• Discuss the vitality of the department using benchmarks and analytical data when possible to keep these matters from becoming overly personalized.
• Encourage faculty to participate in activities in the campuses’ center for teaching and learning, as appropriate.
• Use department meetings as more than just an opportunity to review a list of chores. Enlist colleagues to discuss new teaching and research methods or to present case studies for faculty to problem-solve. Using this structured time to initiate departmental engagement will encourage the habits outside of departmental meetings. An even better approach is to ask departmental colleagues to co-present.
32
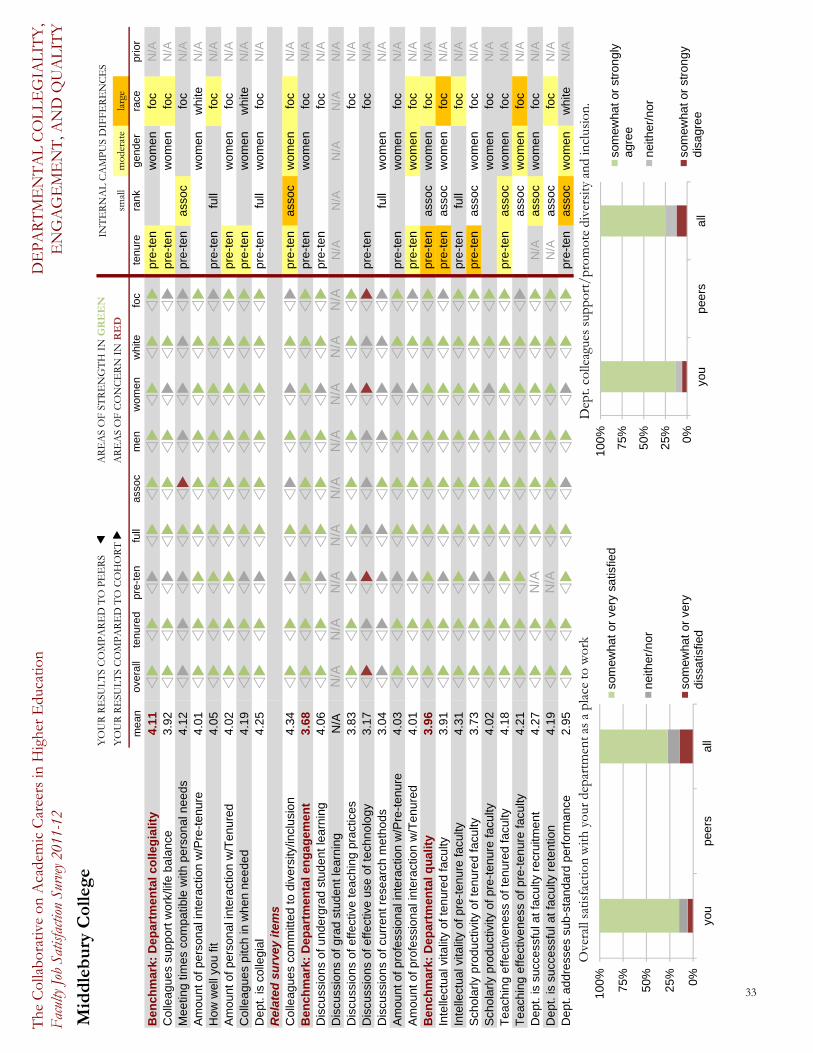
The
Col
labo
rativ
e on
Aca
dem
ic C
aree
rs in
Hig
her
Edu
catio
nF
acul
ty J
ob S
atisf
actio
n Su
rvey
201
1-12
DE
PA
RT
ME
NT
AL
CO
LL
EG
IAL
ITY
,E
NG
AG
EM
EN
T, A
ND
QU
AL
ITY
Mid
dle
bu
ry C
olle
ge
YO
UR
RE
SUL
TS
CO
MP
AR
ED
TO
PE
ER
S
AR
EA
S O
F S
TR
EN
GT
H I
NG
RE
EN
YO
UR
RE
SUL
TS
CO
MP
AR
ED
TO
CO
HO
RT
A
RE
AS
OF
CO
NC
ER
N I
NR
ED
smal
lm
oder
ate
larg
e
mea
nov
eral
lte
nure
dpr
e-te
nfu
llas
soc
men
wom
enw
hite
foc
tenu
rera
nkge
nder
race
prio
r
Ben
chm
ark:
Dep
artm
enta
l co
lleg
ialit
y4.
11
pre-
ten
wom
enfo
cN
/AC
olle
ague
s su
ppor
t wor
k/lif
e ba
lanc
e3.
92
pre-
ten
wom
enfo
cN
/AM
eetin
g tim
es c
ompa
tible
with
per
sona
l nee
ds4.
12
pre-
ten
asso
cfo
cN
/AA
mou
nt o
f per
sona
l int
erac
tion
w/P
re-t
enur
e4.
01
wom
enw
hite
N/A
How
wel
l you
fit
4.05
pre-
ten
full
foc
N/A
Am
ount
of p
erso
nal i
nter
actio
n w
/Ten
ured
4.02
pre-
ten
wom
enfo
cN
/AC
olle
ague
s pi
tch
in w
hen
need
ed4.
19
pre-
ten
wom
enw
hite
N/A
Dep
t. is
col
legi
al4.
25
pre-
ten
full
wom
enfo
cN
/AR
elat
ed s
urve
y ite
ms
Col
leag
ues
com
mitt
ed to
div
ersi
ty/in
clus
ion
4.34
pre-
ten
asso
cw
omen
foc
N/A
Ben
chm
ark:
Dep
artm
enta
l en
gag
emen
t3.
68
pre-
ten
wom
enfo
cN
/AD
iscu
ssio
ns o
f und
ergr
ad s
tude
nt le
arni
ng4.
06
pre-
ten
foc
N/A
Dis
cuss
ions
of g
rad
stud
ent l
earn
ing
N/A
N/A
N/A
N/A
N/A
N/A
N/A
N/A
N/A
N/A
N/A
N/A
N/A
N/A
N/A
Dis
cuss
ions
of e
ffect
ive
teac
hing
pra
ctic
es3.
83
foc
N/A
Dis
cuss
ions
of e
ffect
ive
use
of te
chno
logy
3.17
pre-
ten
foc
N/A
Dis
cuss
ions
of c
urre
nt r
esea
rch
met
hods
3.04
full
wom
enN
/AA
mou
nt o
f pro
fess
iona
l int
erac
tion
w/P
re-t
enur
e4.
03
pre-
ten
wom
enfo
cN
/AA
mou
nt o
f pro
fess
iona
l int
erac
tion
w/T
enur
ed4.
01
pre-
ten
wom
enfo
cN
/AB
ench
mar
k: D
epar
tmen
tal q
ual
ity
3.96
pre-
ten
asso
cw
omen
foc
N/A
Inte
llect
ual v
italit
y of
tenu
red
facu
lty3.
91
pre-
ten
asso
cw
omen
foc
N/A
Inte
llect
ual v
italit
y of
pre
-ten
ure
facu
lty4.
31
pre-
ten
full
foc
N/A
Sch
olar
ly p
rodu
ctiv
ity o
f ten
ured
facu
lty3.
73
pre-
ten
asso
cw
omen
foc
N/A
Sch
olar
ly p
rodu
ctiv
ity o
f pre
-ten
ure
facu
lty4.
02
wom
enfo
cN
/AT
each
ing
effe
ctiv
enes
s of
tenu
red
facu
lty4.
18
pre-
ten
asso
cw
omen
foc
N/A
Tea
chin
g ef
fect
iven
ess
of p
re-t
enur
e fa
culty
4.21
asso
cw
omen
foc
N/A
Dep
t. is
suc
cess
ful a
t fac
ulty
rec
ruitm
ent
4.27
N/A
N/A
asso
cw
omen
foc
N/A
Dep
t. is
suc
cess
ful a
t fac
ulty
ret
entio
n4.
19
N/A
N/A
asso
cfo
cN
/AD
ept.
addr
esse
s su
b-st
anda
rd p
erfo
rman
ce2.
95
pre-
ten
asso
cw
omen
whi
teN
/A
INT
ER
NA
L C
AM
PU
S D
IFF
ER
EN
CE
S
0%
25%
50%
75%
100
%
you
pee
rsa
ll
Ove
rall
satis
fact
ion
with
you
r de
part
men
t as
a pl
ace
to w
ork
som
ewha
t or
ver
y sa
tisfie
d
nei
ther
/no
r
som
ewha
t or
ver
yd
issa
tisfie
d0
%
25%
50%
75%
100
%
you
pee
rsa
ll
Dep
t. co
lleag
ues
supp
ort/
prom
ote
dive
rsity
and
incl
usio
n.
som
ewha
t or
str
on
gly
agr
ee
nei
ther
/no
r
som
ewha
t or
str
on
gy
dis
agr
ee
33

The Collaborative on Academic Careers in Higher Education at the Harvard Graduate School of Education
Your Findings in Context
Appreciation & Recognition
Why it matters. Faculty, at all ranks, are just like everyone else when it comes to wanting to be appreciated by colleagues and recognized for doing good work. Focus group research conducted by COACHE showed that while many senior faculty members feel valued by students, they do not receive much recognition from the upper-level administration. They reported that research relationships, with undergraduate and graduate students, were especially gratifying.
“Senior faculty members, especially at the less intensive research institutions, felt that external service that increased the reputation of their institution was not recognized and went unrewarded. Being engaged in the local community or on the board of a nationally recognized association does not get the senior faculty members recognition or appreciation from their home institution. Although they did not feel valued for external service, senior faculty members said that it is expected of them. This disconnection between expectations and appreciation was dissatisfying for many senior faculty members and provided a disincentive for them to serve their institution in this way” (COACHE Report, 2010, pp. 5-6).
The COACHE survey measures levels of faculty satisfaction with the recognition they receive for the primary aspects of their work (e.g., scholarship, teaching, advising, service, and – where applicable – outreach) from colleagues, the chief academic officer, the dean, and the department head. Also part of this benchmark is a measure of whether or not faculty members feel as though their school/college and department are valued by the institution and whether they feel as though the chief academic officer cares about the faculty of one’s rank.
Good practice.
• The chief academic officer should get to know the faculty in a variety of forums including brown bag lunches, speaker’s series, workshops, and seminars that engage faculty members in appealing topics and current issues.
• Likewise, deans and chairs should make opportunities to showcase faculty work and offer kind words and a “pat on the back” from time to time.
• Take note of what faculty are doing and celebrate faculty work in each school or college at some point every year; such occasions do not have to be costly to be meaningful.
• One of the most substantial obstacles to recognizing faculty work is simply knowing what faculty have done that warrants recognition. Cultivate a culture of recognition by offering opportunities for students, faculty, and campus leaders to highlight the accomplishments of your faculty. Create a physical and a virtual drop box so others can comment on the good work of your faculty.
34

The
Col
labo
rativ
e on
Aca
dem
ic C
aree
rs in
Hig
her
Edu
catio
nF
acul
ty J
ob S
atisf
actio
n Su
rvey
201
1-12
AP
PR
EC
IAT
ION
AN
D R
EC
OG
NIT
ION
Mid
dle
bu
ry C
olle
ge
YO
UR
RE
SUL
TS
CO
MP
AR
ED
TO
PE
ER
S
AR
EA
S O
F S
TR
EN
GT
H I
NG
RE
EN
YO
UR
RE
SUL
TS
CO
MP
AR
ED
TO
CO
HO
RT
A
RE
AS
OF
CO
NC
ER
N I
NR
ED
smal
lm
oder
ate
larg
e
mea
nov
eral
lte
nure
dpr
e-te
nfu
llas
soc
men
wom
enw
hite
foc
tenu
rera
nkge
nder
race
prio
r
Ben
chm
ark:
Ap
pre
ciat
ion
an
d r
eco
gn
itio
n3.
48
tenu
red
wom
enw
hite
N/A
Rec
ogni
tion:
For
teac
hing
3.62
pre-
ten
wom
enfo
cN
/AR
ecog
nitio
n: F
or a
dvis
ing
3.14
tenu
red
wom
enN
/AR
ecog
nitio
n: F
or s
chol
arsh
ip3.
58
asso
cw
omen
N/A
Rec
ogni
tion:
For
ser
vice
3.29
tenu
red
asso
cw
omen
whi
teN
/AR
ecog
nitio
n: F
or o
utre
ach
3.11
tenu
red
wom
enw
hite
N/A
Rec
ogni
tion:
Fro
m c
olle
ague
s3.
83
pre-
ten
wom
enN
/AR
ecog
nitio
n: F
rom
CA
O3.
35
N/A
N/A
asso
cw
omen
whi
teN
/AR
ecog
nitio
n: F
rom
Dea
n3.
51
N/A
N/A
asso
cw
hite
N/A
Rec
ogni
tion:
Fro
m H
ead/
Cha
ir3.
81
full
wom
enN
/AS
choo
l/col
lege
is v
alue
d by
Pre
s/P
rovo
stN
/AN
/AN
/AN
/AN
/AN
/AN
/AN
/AN
/AN
/AN
/AN
/AN
/AN
/AN
/AD
ept.
is v
alue
d by
Pre
s/P
rovo
st3.
34
N/A
N/A
wom
enw
hite
N/A
CA
O c
ares
abo
ut fa
culty
of m
y ra
nk3.
62
asso
cw
omen
N/A
*The
aca
dem
ic a
reas
wer
e de
velo
ped
base
d on
a r
evie
w o
f st
ruct
ural
des
igna
tions
(i.e
., sc
hool
s an
d co
llege
s, w
hich
diff
er f
rom
cam
pus
to c
ampu
s) a
nd C
lass
ifica
tion
of I
nstit
utio
nal P
rogr
ams
(CIP
) cod
es, w
hich
are
of
ten
too
narr
owly
def
ined
for
IR
B-a
ppro
ved
repo
rtin
g. Y
our
inst
itutio
n as
sign
ed f
acul
ty to
one
of
thes
e tw
elve
gro
ups.
Thi
s ta
ble
may
incl
ude
blan
k ro
ws
depe
ndin
g up
on th
e di
scip
linar
y ch
arac
teris
tics
of y
our
inst
itutio
n an
d re
spon
se r
ates
. The
CO
AC
HE
Onl
ine
Rep
ortin
g T
ool c
an p
rovi
de a
dditi
onal
ana
lysi
s by
aca
dem
ic a
rea,
INT
ER
NA
L C
AM
PU
S D
IFF
ER
EN
CE
S
0%
25%
50%
75%
100
%
ass
ista
nt
ass
ocia
tefu
ll
The
per
son
who
ser
ves
as m
y ch
ief
acad
emic
off
icer
see
ms
to c
are
abou
t the
qua
lity
of li
fe f
or f
acul
ty o
f m
y ra
nk.
som
ewha
t or
str
on
gly
dis
agr
ee
I do
n't
kno
w
nei
ther
/no
r
som
ewha
t or
str
on
gly
agr
ee
1.0
2.0
3.0
4.0
5.0
Hu
ma
niti
es
So
cia
l Sci
en
ces
Ph
ysic
al S
cie
nce
s
Bio
log
ical
Sci
en
ces
Vis
ual &
Per
form
ing
Art
s
En
gin
eer
ing/
Co
mp
Sci
/Mat
h/S
tats
He
alth
& H
uma
n E
colo
gy
Agr
icu
lture
/Nat
Res
/Env
Sci
Bu
sin
ess
Ed
uca
tion
Me
dic
al S
choo
ls &
He
alth
Pro
fess
ion
s
Oth
er
Pro
fess
ion
s
I fe
el th
at m
y d
epar
tmen
t is
valu
ed b
y th
is in
stitu
tion'
s P
resi
dent
/Cha
ncel
lor
and
Pro
vost
by
Aca
dem
ic A
rea*
. (1=
Stro
ngly
di
sagr
ee 5
=St
rong
ly A
gree
)
35

The
Col
labo
rativ
e on
Aca
dem
ic C
aree
rs in
Hig
her
Edu
catio
nF
acul
ty J
ob S
atisf
actio
n Su
rvey
201
1-12
RE
TE
NT
ION
AN
D N
EG
OT
IAT
ION
S
Mid
dle
bu
ry C
olle
ge
you
peer
sal
lyo
upe
ers
all
you
peer
sal
lyo
upe
ers
all
you
peer
sal
lyo
upe
ers
all
you
peer
sal
l
base
sal
ary
26%
N/A
40%
29%
N/A
40%
18%
N/A
39%
32%
N/A
42%
18%
N/A
37%
28%
N/A
39%
14%
N/A
42%
supp
lem
enta
l sal
ary
(e.g
., su
mm
er, i
nter
sess
1%N
/A4%
1%N
/A4%
0%N
/A4%
1%N
/A4%
0%N
/A4%
1%N
/A4%
0%N
/A3%
tenu
re c
lock
0%N
/A2%
0%N
/A0%
0%N
/A5%
0%N
/A1%
0%N
/A2%
0%N
/A1%
0%N
/A2%
teac
hing
load
(e.
g., c
ours
e re
leas
e)30
%N
/A14
%29
%N
/A14
%32
%N
/A13
%26
%N
/A11
%34
%N
/A17
%27
%N
/A14
%38
%N
/A13
%ad
min
istr
ativ
e re
spon
sibi
litie
s3%
N/A
4%4%
N/A
5%0%
N/A
2%4%
N/A
4%2%
N/A
4%4%
N/A
5%0%
N/A
2%le
ave
time
0%N
/A1%
0%N
/A2%
0%N
/A1%
0%N
/A1%
0%N
/A2%
0%N
/A2%
0%N
/A1%
equi
pmen
t2%
N/A
2%1%
N/A
2%3%
N/A
2%3%
N/A
2%0%
N/A
2%2%
N/A
2%0%
N/A
2%la
b/re
sear
ch s
uppo
rt5%
N/A
10%
6%N
/A9%
3%N
/A13
%5%
N/A
11%
5%N
/A9%
5%N
/A10
%5%
N/A
11%
empl
oym
ent f
or s
pous
e/pa
rtne
r10
%N
/A4%
3%N
/A3%
26%
N/A
7%8%
N/A
4%13
%N
/A4%
9%N
/A4%
14%
N/A
5%sa
bbat
ical
or
othe
r le
ave
time
3%N
/A7%
4%N
/A8%
0%N
/A3%
0%N
/A6%
7%N
/A7%
3%N
/A7%
5%N
/A6%
you
peer
sal
lyo
upe
ers
all
you
peer
sal
lyo
upe
ers
all
you
peer
sal
lyo
upe
ers
all
you
peer
sal
l
to im
prov
e yo
ur s
alar
y/be
nefit
s6%
N/A
15%
3%N
/A15
%14
%N
/A16
%5%
N/A
16%
8%N
/A14
%6%
N/A
15%
8%N
/A18
%to
find
a m
ore
colle
gial
wor
k en
viro
nmen
t1%
N/A
4%0%
N/A
4%2%
N/A
4%0%
N/A
3%2%
N/A
5%0%
N/A
4%4%
N/A
4%to
find
an
empl
oyer
who
pro
vide
s m
ore
reso
u9%
N/A
11%
9%N
/A10
%7%
N/A
13%
10%
N/A
10%
7%N
/A11
%9%
N/A
11%
4%N
/A12
%to
wor
k at
an
inst
itutio
n w
hose
prio
ritie
s m
atc
13%
N/A
10%
13%
N/A
10%
12%
N/A
10%
10%
N/A
10%
17%
N/A
9%12
%N
/A10
%13
%N
/A9%
to p
ursu
e an
adm
inis
trat
ive
posi
tion
in h
ighe
r3%
N/A
4%4%
N/A
5%0%
N/A
3%2%
N/A
5%3%
N/A
4%3%
N/A
4%0%
N/A
5%to
pur
sue
a no
naca
dem
ic jo
b3%
N/A
2%2%
N/A
1%5%
N/A
2%5%
N/A
2%0%
N/A
2%3%
N/A
2%0%
N/A
1%to
impr
ove
the
empl
oym
ent o
ppor
tuni
ties
for
10%
N/A
4%7%
N/A
2%17
%N
/A8%
9%N
/A3%
12%
N/A
5%10
%N
/A4%
8%N
/A5%
for
othe
r fa
mily
or
pers
onal
nee
ds5%
N/A
6%6%
N/A
5%2%
N/A
9%5%
N/A
5%5%
N/A
7%5%
N/A
6%4%
N/A
7%to
impr
ove
your
qua
lity
of li
fe11
%N
/A8%
9%N
/A7%
14%
N/A
11%
11%
N/A
7%10
%N
/A10
%9%
N/A
8%21
%N
/A9%
to r
etire
17%
N/A
20%
23%
N/A
26%
2%N
/A4%
21%
N/A
22%
12%
N/A
16%
21%
N/A
22%
0%N
/A10
%to
impr
ove
your
pro
spec
ts fo
r pr
omot
ion
0%N
/A1%
0%N
/A1%
0%N
/A3%
0%N
/A1%
0%N
/A1%
0%N
/A1%
0%N
/A2%
to m
ove
to a
pre
ferr
ed g
eogr
aphi
c lo
catio
n11
%N
/A7%
6%N
/A6%
21%
N/A
10%
11%
N/A
7%10
%N
/A7%
8%N
/A7%
25%
N/A
7%
White
FOC
If y
ou c
ould
neg
otia
te a
dju
stm
ents
to
you
r em
plo
ymen
t, w
hic
h o
ne
of t
he
follo
win
g it
ems
wou
ld y
ou m
ost
like
to a
dju
st?
Ove
rall
Ten
ured
Pre
-ten
ured
Men
Wom
en
If y
ou w
ere
to c
hoo
se t
o le
ave
you
r in
stit
uti
on, w
hat
wou
ld b
e yo
ur
pri
mar
y re
ason
?
Ove
rall
Ten
ured
Pre
-ten
ured
Men
Wom
enWhite
FOC
0%25
%50
%
activ
ely
soug
ht a
n o
utsi
de
job
offe
r
rece
ived
a fo
rmal
job
offe
r
rene
gotia
ted
the
term
s of
you
r e
mpl
oym
ent
In th
e pa
st fi
ve y
ears
, hav
e yo
u...
you
peer
sal
l0%25
%
50%
75%
100%
you
peer
sal
l
"Out
side
off
ers
are
nece
ssar
y fo
r ne
gotia
tions
."
agre
e
neith
er/
nor
disa
gree
36

The
Col
labo
rativ
e on
Aca
dem
ic C
aree
rs in
Hig
her
Edu
catio
nF
acul
ty J
ob S
atisf
actio
n Su
rvey
201
1-12
RE
TE
NT
ION
AN
D N
EG
OT
IAT
ION
S
0%25
%50
%75
%10
0%
for
no
mo
re th
an fi
ve y
ears
aft
er e
arni
ngte
nur
e
mo
re th
an fi
ve y
ears
bu
t les
s th
an te
n
ten
ye
ars
or
mor
e
I don
't kn
ow
Ass
umin
g yo
u ac
hiev
e te
nure
, how
long
do
you
plan
to r
emai
n at
this
in
stitu
tion?
(Pre
-tenu
re F
acul
ty O
nly)
you
peer
sal
l
0%25
%50
%75
%10
0%
for
no
mo
re th
an fi
ve y
ears
mo
re th
an fi
ve y
ears
bu
t les
s th
an te
n
ten
ye
ars
or
mor
e
I don
't kn
ow
How
long
do
you
plan
to r
emai
n at
this
inst
itutio
n? (T
enur
ed F
acul
ty O
nly)
you
peer
sal
l
0%25
%50
%75
%10
0%
me
n
wom
en
whi
te foc
How
long
do
you
plan
to r
emai
n at
you
r in
stitu
tion?
for
no
mo
re th
an fi
ve y
ears
mo
re th
an fi
ve y
ears
bu
t les
s th
an te
nI d
on't
know
ten
ye
ars
or
mor
e
0%25
%50
%75
%10
0%0%
25%
50%
75%
100%
allc
ompa
rabl
e ins
titut
ions
peer
syo
u
37

The
Col
labo
rativ
e on
Aca
dem
ic C
aree
rs in
Hig
her
Edu
catio
nF
acul
ty J
ob S
atisf
actio
n Su
rvey
201
1-12
BE
ST A
SPE
CT
S
Mid
dle
bu
ry C
olle
ge
you
peer
all
(56)
you
peer
all
(56)
you
peer
all
(56)
you
peer
all
(56)
you
peer
all
(56)
you
peer
all
(56)
you
peer
all
(56)
qual
ity o
f col
leag
ues
29%
050
31%
048
24%
047
31%
048
25%
051
32%
050
13%
041
supp
ort o
f col
leag
ues
8%0
377%
034
10%
046
6%0
2310
%0
447%
037
13%
038
oppo
rtun
ities
to c
olla
bora
te w
ith c
olle
ague
s0%
03
0%0
40%
04
0%0
30%
04
0%0
40%
02
qual
ity o
f gra
duat
e st
uden
ts0%
02
0%0
40%
01
0%0
30%
03
0%0
20%
03
qual
ity o
f und
ergr
adua
te s
tude
nts
73%
010
78%
011
62%
014
79%
011
65%
012
75%
011
61%
012
qual
ity o
f the
faci
litie
s9%
00
11%
02
2%0
110
%0
27%
00
10%
03
0%0
0su
ppor
t for
res
earc
h/cr
eativ
e w
ork
(e.g
., le
ave)
6%0
07%
00
5%0
08%
00
5%0
07%
00
4%0
0su
ppor
t for
teac
hing
9%0
45%
03
19%
010
6%0
313
%0
75%
04
26%
010
supp
ort f
or p
rofe
ssio
nal d
evel
opm
ent
4%0
04%
00
2%0
21%
01
7%0
23%
00
4%0
1as
sist
ance
for
gran
t pro
posa
ls1%
00
1%0
00%
00
0%0
02%
00
1%0
00%
01
child
care
pol
icie
s/pr
actic
es1%
00
0%0
02%
01
0%0
02%
00
0%0
04%
00
avai
labi
lity/
qual
ity o
f chi
ldca
re fa
cilit
ies
1%0
01%
00
0%0
00%
00
2%0
01%
00
0%0
0sp
ousa
l/par
tner
hiri
ng p
rogr
am0%
00
0%0
00%
00
0%0
00%
00
0%0
00%
00
com
pens
atio
n8%
00
4%0
117
%0
38%
00
8%0
26%
01
17%
03
geog
raph
ic lo
catio
n21
%0
3223
%0
3314
%0
3024
%0
3217
%0
3225
%0
320%
030
dive
rsity
0%0
50%
05
0%0
30%
04
0%0
40%
03
0%0
8pr
esen
ce o
f oth
ers
like
me
1%0
01%
00
0%0
00%
00
2%0
11%
00
0%0
1m
y se
nse
of "
fit"
here
11%
040
11%
040
12%
031
9%0
4215
%0
3710
%0
4217
%0
27pr
otec
tions
from
ser
vice
/ass
ignm
ents
1%0
01%
00
0%0
00%
00
2%0
00%
00
4%0
0co
mm
ute
1%0
00%
00
2%0
31%
00
0%0
21%
00
0%0
1co
st o
f liv
ing
0%0
140%
015
0%0
220%
020
0%0
160%
016
0%0
25re
sear
ch r
equi
rem
ents
for
t and
p0%
00
0%0
00%
00
0%0
00%
00
0%0
00%
00
teac
hing
load
2%0
01%
00
5%0
11%
01
3%0
31%
00
9%0
2te
nure
/pro
mot
ion
requ
irem
ents
in g
ener
al1%
00
0%0
05%
00
1%0
02%
00
1%0
04%
01
tenu
re/p
rom
otio
n cr
iteria
cla
rity
0%0
00%
00
0%0
10%
00
0%0
00%
00
0%0
0te
nure
/pro
mot
ion
proc
ess
clar
ity0%
00
0%0
00%
00
0%0
00%
00
0%0
00%
00
man
agea
ble
pres
sure
to p
erfo
rm1%
02
2%0
10%
03
3%0
30%
02
2%0
10%
010
acad
emic
free
dom
9%0
347%
036
14%
024
8%0
3812
%0
239%
032
13%
040
othe
r (p
leas
e sp
ecify
)1%
N/A
N/A
2%N
/AN
/A0%
N/A
N/A
3%N
/AN
/A0%
N/A
N/A
2%N
/AN
/A0%
N/A
N/A
decl
ine
to a
nsw
er1%
N/A
N/A
1%N
/AN
/A0%
N/A
N/A
1%N
/AN
/A0%
N/A
N/A
1%N
/AN
/A0%
N/A
N/A
ther
e ar
e no
pos
itive
asp
ects
1%N
/AN
/A0%
N/A
N/A
2%N
/AN
/A0%
N/A
N/A
2%N
/AN
/A0%
N/A
N/A
4%N
/AN
/A
Fac
ulty
wer
e as
ked
to id
entit
y th
e tw
o (a
nd o
nly
two)
bes
t as
pec
ts o
f w
orki
ng a
t you
r in
stitu
tion.
The
top
four
res
pons
es f
or y
our
inst
itutio
n ar
e sh
own
in r
ed a
nd
disa
ggre
gate
d by
tenu
re s
tatu
s, g
ende
r, an
d ra
ce. T
he c
olum
ns la
bled
Pee
r sh
ow th
e to
tal n
umbe
r of
tim
es a
n ite
m a
ppea
red
as a
top
four
item
am
ongs
t any
of
your
fiv
e pe
er
inst
itutio
ns. T
he A
ll c
olum
n re
flect
s th
e nu
mbe
r of
tim
es a
n ite
m a
ppea
red
in th
e to
p fo
ur a
t any
of
the
inst
itutio
ns in
the
curr
ent c
ohor
t. W
hen
a be
st a
spec
t at y
our
inst
itutio
n is
als
o sh
own
as a
bes
t asp
ect f
or y
our
peer
s an
d/or
the
coho
rt, t
he is
sue
may
be
seen
as
com
mon
in th
e fa
culty
labo
r m
arke
t. B
est a
spec
ts th
at a
re u
niqu
e to
you
r ca
mpu
s ar
e m
arke
t diff
eren
tiato
rs f
or y
our
inst
itutio
n w
hich
can
be
high
light
ed in
rec
ruitm
ent a
nd r
eten
tion
effo
rts.
Ove
rall
Ten
ured
Pre
-ten
ure
Men
Wom
enW
hite
Fac
ulty
of C
olor
38

The
Col
labo
rativ
e on
Aca
dem
ic C
aree
rs in
Hig
her
Edu
catio
nF
acul
ty J
ob S
atisf
actio
n Su
rvey
201
1-12
WO
RST
ASP
EC
TS
Mid
dle
bu
ry C
olle
ge
you
peer
sal
l (5
6)yo
upe
ers
all
(56)
you
peer
sal
l (5
6)yo
upe
ers
all
(56)
you
peer
sal
l (5
6)yo
upe
ers
all
(56)
you
peer
sal
l (5
6)
qual
ity o
f col
leag
ues
3%0
54%
011
0%0
54%
08
2%0
33%
06
0%0
11su
ppor
t of c
olle
ague
s6%
00
7%0
12%
04
6%0
15%
05
6%0
24%
04
oppo
rtun
ities
to c
olla
bora
te w
ith c
olle
ague
s1%
00
1%0
12%
00
3%0
00%
01
2%0
00%
00
qual
ity o
f gra
duat
e st
uden
ts0%
04
0%0
20%
07
0%0
60%
03
0%0
40%
013
qual
ity o
f und
ergr
adua
te s
tude
nts
1%0
211%
023
2%0
130%
024
3%0
121%
022
4%0
19qu
ality
of t
he fa
cilit
ies
1%0
192%
017
0%0
193%
017
0%0
182%
021
0%0
14la
ck o
f sup
port
for
rese
arch
/cre
ativ
e w
ork
(e.
5%0
425%
039
5%0
428%
042
2%0
404%
043
9%0
39la
ck o
f sup
port
for
teac
hing
2%0
12%
03
2%0
31%
01
3%0
13%
01
0%0
1la
ck o
f sup
port
for
prof
essi
onal
dev
elop
men
t2%
02
3%0
60%
03
1%0
53%
05
2%0
34%
05
lack
of a
ssis
tanc
e fo
r gr
ant p
ropo
sals
1%0
02%
00
0%0
13%
00
0%0
02%
00
0%0
2ch
ildca
re p
olic
ies/
prac
tices
(or
lack
ther
eof)
2%0
01%
00
5%0
10%
00
5%0
23%
00
0%0
2av
aila
bilit
y/qu
ality
of c
hild
care
faci
litie
s1%
00
0%0
12%
01
0%0
02%
00
1%0
00%
03
spou
sal/p
artn
er h
iring
pro
gram
(or
lack
ther
e14
%0
39%
01
24%
013
14%
04
13%
01
15%
03
9%0
9co
mpe
nsat
ion
11%
051
11%
052
10%
046
13%
054
8%0
4613
%0
520%
048
geog
raph
ic lo
catio
n18
%0
1312
%0
1231
%0
2115
%0
1422
%0
1412
%0
1043
%0
25la
ck o
f div
ersi
ty13
%0
210
%0
419
%0
711
%0
215
%0
910
%0
222
%0
18ab
senc
e of
oth
ers
like
me
9%0
08%
00
12%
02
9%0
010
%0
09%
00
9%0
8m
y la
ck o
f "fit
" he
re6%
01
8%0
02%
02
9%0
03%
01
5%0
013
%0
3to
o m
uch
serv
ice/
too
man
y as
sign
men
ts19
%0
3527
%0
392%
021
19%
028
20%
040
22%
038
9%0
19co
mm
ute
1%0
11%
03
0%0
41%
01
0%0
21%
02
0%0
5co
st o
f liv
ing
4%0
74%
05
5%0
85%
07
3%0
63%
07
9%0
8re
sear
ch r
equi
rem
ents
for
t and
p1%
00
0%0
12%
03
0%0
12%
00
1%0
00%
00
teac
hing
load
25%
020
27%
022
21%
022
19%
021
33%
023
25%
020
26%
019
tenu
re/p
rom
otio
n re
quire
men
ts in
gen
eral
2%0
01%
01
5%0
31%
01
3%0
12%
00
4%0
2te
nure
/pro
mot
ion
crite
ria c
larit
y2%
00
2%0
02%
03
0%0
25%
00
3%0
10%
02
tenu
re/p
rom
otio
n pr
oces
s cl
arity
0%0
10%
00
0%0
20%
01
0%0
10%
01
0%0
1un
rele
ntin
g pr
essu
re to
per
form
11%
03
8%0
217
%0
59%
01
13%
04
11%
03
9%0
2ac
adem
ic fr
eedo
m0%
00
0%0
00%
00
0%0
00%
00
0%0
00%
00
othe
r (p
leas
e sp
ecify
)11
%N
/AN
/A11
%N
/AN
/A12
%N
/AN
/A14
%N
/AN
/A8%
N/A
N/A
14%
N/A
N/A
0%N
/AN
/Ade
clin
e to
ans
wer
5%N
/AN
/A4%
N/A
N/A
7%N
/AN
/A5%
N/A
N/A
5%N
/AN
/A4%
N/A
N/A
9%N
/AN
/Ath
ere
are
no n
egat
ive
aspe
cts
6%N
/AN
/A9%
N/A
N/A
0%N
/AN
/A10
%N
/AN
/A2%
N/A
N/A
7%N
/AN
/A4%
N/A
N/A
Fac
ulty
wer
e as
ked
to id
entit
y th
e tw
o (a
nd o
nly
two)
wor
st a
spec
ts o
f w
orki
ng a
t you
r in
stitu
tion.
The
top
four
res
pons
es f
or y
our
inst
itutio
n ar
e sh
own
in r
ed a
nd
disa
ggre
gate
d by
tenu
re s
tatu
s, g
ende
r, an
d ra
ce. T
he c
olum
ns la
bled
Pee
r sh
ow th
e to
tal n
umbe
r of
tim
es a
n ite
m a
ppea
red
as a
top
four
item
at a
ny o
f yo
ur f
ive
peer
in
stitu
tions
. The
All
col
umn
show
s th
e nu
mbe
r of
tim
es a
n ite
m a
ppea
red
in th
e to
p fo
ur a
t any
of
the
inst
itutio
ns in
the
curr
ent c
ohor
t. W
hen
a w
orst
asp
ect a
t you
r in
stitu
tion
is a
lso
show
n as
a w
orst
asp
ect b
y yo
ur p
eers
and
/or
the
coho
rt, t
he is
sue
may
be
seen
as
com
mon
in th
e fa
culty
labo
r m
arke
t. M
ore
atte
ntio
n sh
ould
be
paid
to th
e w
orst
asp
ects
that
are
uni
que
to y
our
inst
itutio
n. T
hese
dis
tinct
ions
cas
t the
inst
itutio
n in
a n
egat
ive
light
.
Ove
rall
Ten
ured
Pre
-ten
ure
Men
Wom
enW
hite
Fac
ulty
of C
olor
39

The
Col
labo
rativ
e on
Aca
dem
ic C
aree
rs in
Hig
her
Edu
catio
nF
acul
ty J
ob S
atisf
actio
n Su
rvey
201
1-12
TH
EM
AT
IC C
OD
ING
OF
OP
EN
-EN
DE
D C
OM
ME
NT
S
Mid
dle
bu
ry C
olle
ge
Ple
ase
use
th
e sp
ace
bel
ow t
o te
ll u
s th
e n
um
ber
on
e th
ing
that
you
, per
son
ally
, fee
l you
r in
stit
uti
on c
ould
do
to im
pro
ve y
our
wor
kpla
ce.
0%
10%
20%
30%
Appreciation and Recognition
Collaboration and Interdiscplinary Work
Compensation and Benefits
Culture
Departmental Collegiality
Departmental Engagement
Departmental Quality
Diversity
Facilities and Resources for Work
Leadership (Departmental)
Leadership (Divisional)
Leadership (General)
Leadership (Senior)
Mentoring
Nature of Work: General
Nature of work: Research
Nature of Work: Service
Nature of work: Teaching
Other
Professional Development
Promotion
Tenure
Work and Personal Life Balance
full
asso
cia
teas
sist
ant
all c
om
para
ble
inst
itutio
ns
40
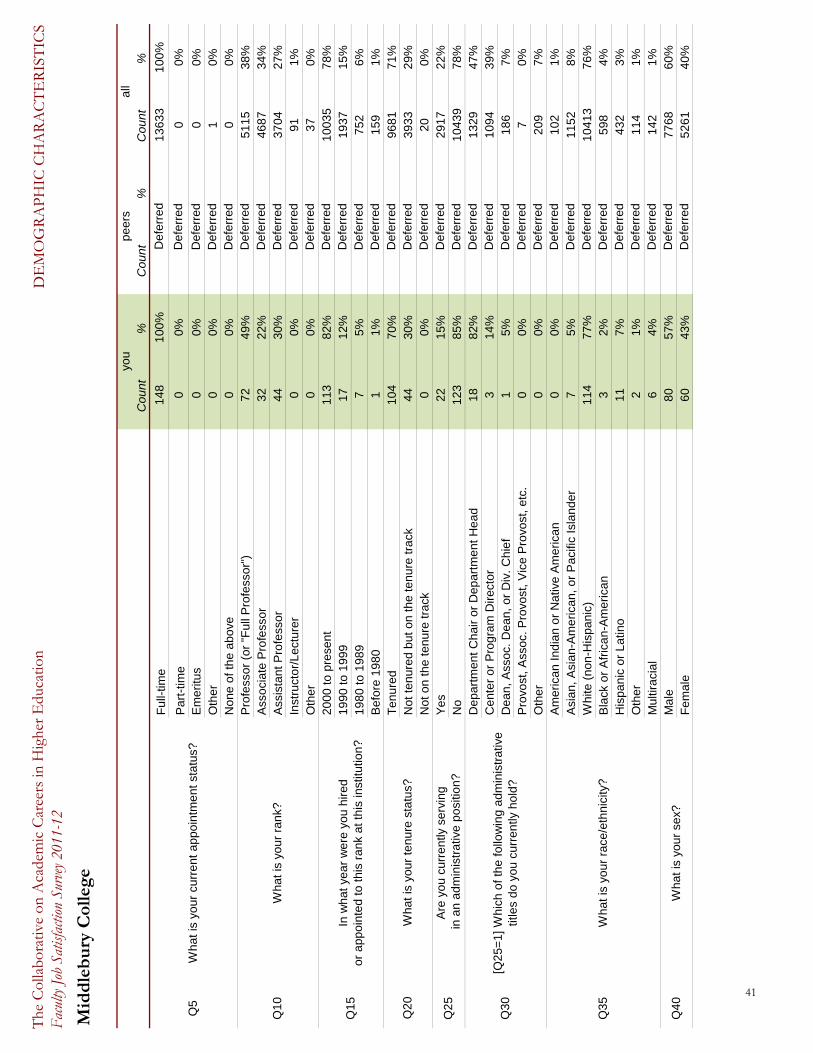
The
Col
labo
rativ
e on
Aca
dem
ic C
aree
rs in
Hig
her
Edu
catio
nF
acul
ty J
ob S
atisf
actio
n Su
rvey
201
1-12
DE
MO
GR
APH
IC C
HA
RA
CT
ER
IST
ICS
Mid
dle
bu
ry C
olle
ge
Co
un
t%
Co
un
t%
Co
un
t%
Fu
ll-tim
e1
48
10
0%
13
63
31
00
%
Pa
rt-t
ime
00
%0
0%
Em
eri
tus
00
%0
0%
Oth
er
00
%1
0%
No
ne
of
the
ab
ove
00
%0
0%
Pro
fess
or
(or
"Fu
ll P
rofe
sso
r")
72
49
%5
11
53
8%
Ass
oci
ate
Pro
fess
or
32
22
%4
68
73
4%
Ass
ista
nt
Pro
fess
or
44
30
%3
70
42
7%
Inst
ruct
or/
Le
ctu
rer
00
%9
11
%O
the
r0
0%
37
0%
20
00
to
pre
sen
t1
13
82
%1
00
35
78
%1
99
0 t
o 1
99
91
71
2%
19
37
15
%1
98
0 t
o 1
98
97
5%
75
26
%B
efo
re 1
98
01
1%
15
91
%T
en
ure
d1
04
70
%9
68
17
1%
No
t te
nu
red
bu
t o
n t
he
te
nu
re t
rack
44
30
%3
93
32
9%
No
t o
n t
he
te
nu
re t
rack
00
%2
00
%Y
es
22
15
%2
91
72
2%
No
12
38
5%
10
43
97
8%
De
pa
rtm
en
t C
ha
ir o
r D
ep
art
me
nt
He
ad
18
82
%1
32
94
7%
Ce
nte
r o
r P
rog
ram
Dir
ect
or
31
4%
10
94
39
%D
ea
n,
Ass
oc.
De
an
, o
r D
iv.
Ch
ief
15
%1
86
7%
Pro
vost
, A
sso
c. P
rovo
st,
Vic
e P
rovo
st,
etc
.0
0%
70
%O
the
r0
0%
20
97
%A
me
rica
n I
nd
ian
or
Na
tive
Am
eri
can
00
%1
02
1%
Asi
an
, A
sia
n-A
me
rica
n,
or
Pa
cific
Isl
an
de
r7
5%
11
52
8%
Wh
ite (
no
n-H
isp
an
ic)
11
47
7%
10
41
37
6%
Bla
ck o
r A
fric
an
-Am
eri
can
32
%5
98
4%
His
pa
nic
or
La
tino
11
7%
43
23
%O
the
r2
1%
11
41
%M
ulti
raci
al
64
%1
42
1%
Ma
le8
05
7%
77
68
60
%F
em
ale
60
43
%5
26
14
0%
Q3
0[Q
25
=1
] W
hic
h o
f th
e f
ollo
win
g a
dm
inis
tra
tive
tit
les
do
yo
u c
urr
en
tly h
old
?
Q3
5W
ha
t is
yo
ur
race
/eth
nic
ity?
Q4
0W
ha
t is
yo
ur
sex?
all
Q2
0W
ha
t is
yo
ur
ten
ure
sta
tus?
Q1
0W
ha
t is
yo
ur
ran
k?
you
pe
ers
Q5
Wh
at
is y
ou
r cu
rre
nt
ap
po
intm
en
t st
atu
s?
Q1
5In
wh
at
yea
r w
ere
yo
u h
ire
d
or
ap
po
inte
d t
o t
his
ra
nk
at
this
inst
itutio
n?
Q2
5A
re y
ou
cu
rre
ntly
se
rvin
g in
an
ad
min
istr
ativ
e p
osi
tion
?
Def
erre
d
Def
erre
d
Def
erre
dD
efer
red
Def
erre
dD
efer
red
Def
erre
dD
efer
red
Def
erre
dD
efer
red
Def
erre
dD
efer
red
Def
erre
dD
efer
red
Def
erre
dD
efer
red
Def
erre
dD
efer
red
Def
erre
dD
efer
red
Def
erre
dD
efer
red
Def
erre
dD
efer
red
Def
erre
dD
efer
red
Def
erre
dD
efer
red
Def
erre
dD
efer
red
Def
erre
dD
efer
red
Def
erre
d
41
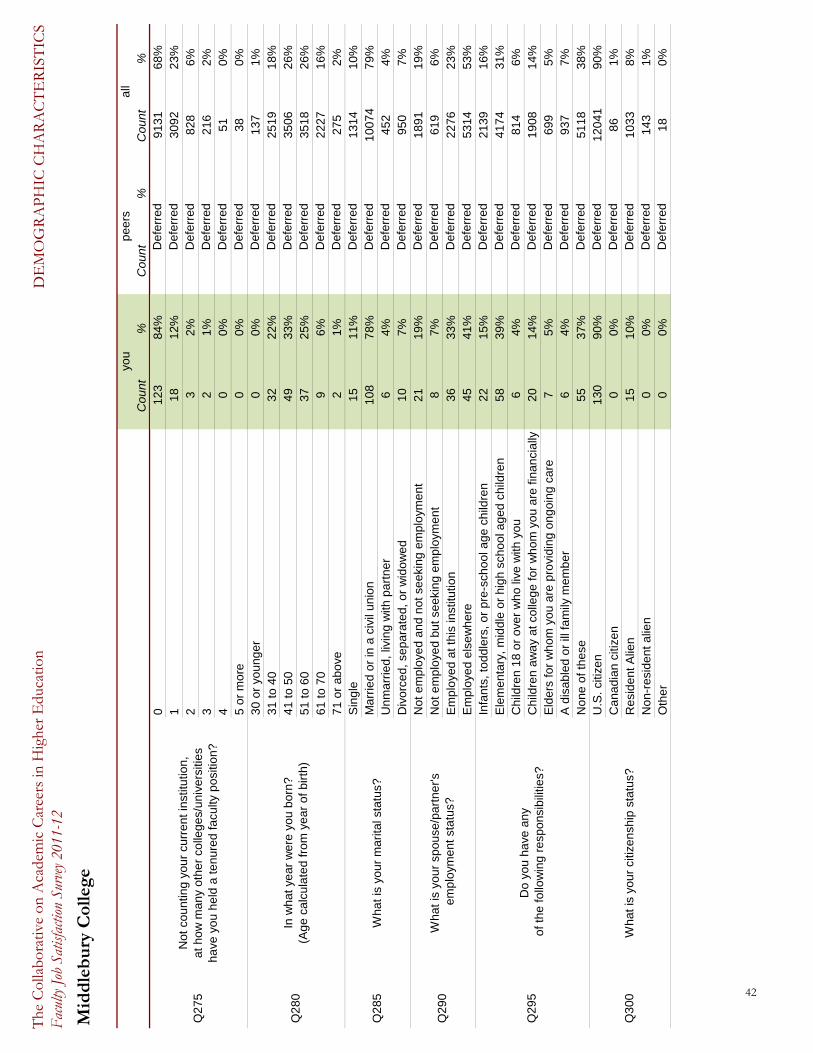
The
Col
labo
rativ
e on
Aca
dem
ic C
aree
rs in
Hig
her
Edu
catio
nF
acul
ty J
ob S
atisf
actio
n Su
rvey
201
1-12
DE
MO
GR
APH
IC C
HA
RA
CT
ER
IST
ICS
Mid
dle
bu
ry C
olle
ge
Co
un
t%
Co
un
t%
Co
un
t%
all
you
pe
ers
01
23
84
%9
13
16
8%
11
81
2%
30
92
23
%2
32
%8
28
6%
32
1%
21
62
%4
00
%5
10
%5
or
mo
re0
0%
38
0%
30
or
you
ng
er
00
%1
37
1%
31
to
40
32
22
%2
51
91
8%
41
to
50
49
33
%3
50
62
6%
51
to
60
37
25
%3
51
82
6%
61
to
70
96
%2
22
71
6%
71
or
ab
ove
21
%2
75
2%
Sin
gle
15
11
%1
31
41
0%
Ma
rrie
d o
r in
a c
ivil
un
ion
10
87
8%
10
07
47
9%
Un
ma
rrie
d,
livin
g w
ith p
art
ne
r6
4%
45
24
%D
ivo
rce
d,
sep
ara
ted
, o
r w
ido
we
d1
07
%9
50
7%
No
t e
mp
loye
d a
nd
no
t se
eki
ng
em
plo
yme
nt
21
19
%1
89
11
9%
No
t e
mp
loye
d b
ut
see
kin
g e
mp
loym
en
t8
7%
61
96
%E
mp
loye
d a
t th
is in
stitu
tion
36
33
%2
27
62
3%
Em
plo
yed
els
ew
he
re4
54
1%
53
14
53
%In
fan
ts,
tod
dle
rs,
or
pre
-sch
oo
l ag
e c
hild
ren
22
15
%2
13
91
6%
Ele
me
nta
ry,
mid
dle
or
hig
h s
cho
ol a
ge
d c
hild
ren
58
39
%4
17
43
1%
Ch
ildre
n 1
8 o
r o
ver
wh
o li
ve w
ith y
ou
6
4%
81
46
%C
hild
ren
aw
ay
at
colle
ge
fo
r w
ho
m y
ou
are
fin
an
cia
lly
20
14
%1
90
81
4%
Eld
ers
fo
r w
ho
m y
ou
are
pro
vid
ing
on
go
ing
ca
re7
5%
69
95
%A
dis
ab
led
or
ill f
am
ily m
em
be
r6
4%
93
77
%N
on
e o
f th
ese
55
37
%5
11
83
8%
U.S
. ci
tize
n1
30
90
%1
20
41
90
%C
an
ad
ian
citi
zen
00
%8
61
%R
esi
de
nt
Alie
n1
51
0%
10
33
8%
No
n-r
esi
de
nt
alie
n0
0%
14
31
%O
the
r0
0%
18
0%
Q2
95
Do
yo
u h
ave
an
y o
f th
e f
ollo
win
g r
esp
on
sib
ilitie
s?
Q2
80
In w
ha
t ye
ar
we
re y
ou
bo
rn?
(A
ge
ca
lcu
late
d f
rom
ye
ar
of
bir
th)
Q2
85
Wh
at
is y
ou
r m
ari
tal s
tatu
s?
Q2
90
Wh
at
is y
ou
r sp
ou
se/p
art
ne
r's e
mp
loym
en
t st
atu
s?
Q2
75
Wh
at
is y
ou
r ci
tize
nsh
ip s
tatu
s?Q
30
0
No
t co
un
ting
yo
ur
curr
en
t in
stitu
tion
, a
t h
ow
ma
ny
oth
er
colle
ge
s/u
niv
ers
itie
s h
ave
yo
u h
eld
a t
en
ure
d f
acu
lty p
osi
tion
?
Def
erre
dD
efer
red
Def
erre
dD
efer
red
Def
erre
dD
efer
red
Def
erre
dD
efer
red
Def
erre
dD
efer
red
Def
erre
dD
efer
red
Def
erre
dD
efer
red
Def
erre
dD
efer
red
Def
erre
dD
efer
red
Def
erre
dD
efer
red
Def
erre
dD
efer
red
Def
erre
dD
efer
red
Def
erre
dD
efer
red
Def
erre
dD
efer
red
Def
erre
dD
efer
red
Def
erre
dD
efer
red
42

The Collaborative on Academic Careers in Higher Education at the Harvard Graduate School of Education
The Provost’s Report
APPENDIX
43

44

The Collaborative on Academic Careers in Higher Education at the Harvard Graduate School of Education
YOUR RESULTS ARE IN YOUR HANDS… NOW WHAT?
YOUR FIRST STEPS By Kiernan Mathews, Director This COACHE Provost’s Report is the culmination of our work since 2003 with faculty focus groups, two pilot studies, and ongoing dialog with institutional researchers and chief academic officers at our member institutions. With so many perspectives on report design, we aim to provide the information you and your campus stakeholders need to translate these COACHE results into substantive, constructive actions. At first glance, the report can be daunting. How does one begin to turn so much data into ideas to improve your institution? To paraphrase Carl Sandburg, this report is like an onion: you peel it off one layer at a time, and sometimes you weep. The Provost’s Report, like the skin of the onion, gives you a glimpse of what lies within, but is the beginning, not the end. It is colored—literally, red and green—by your comparisons to other institutions and to differences between subgroups within your institution. The Results at a Glance and COACHE Dashboard will show you, within 10 minutes or so, the broad themes of your survey results and the areas deserving of immediate scrutiny. Take note of our criteria for determining “areas of strength” and “areas of concern.” COACHE analysts have identified comparative “strengths” as those survey dimensions where your campus ranks first or second among your six peers. A comparative “concern,” on the other hand, means your campus ranked fifth or sixth among your peers. Differences by gender, race, rank, and tenure status are highlighted when mean results differ by a moderate or large effect.
The digital files accompanying this report contain faculty responses to open-ended questions, including their opinions on the one thing your college can do to improve the workplace for faculty. Our members find this qualitative, personal component of the report helpful in illustrating the faculty story in ways that quantitative data cannot. Your rich dataset tells many stories, and review of the means comparisons and frequency distributions will yield some important nuances that defy easy summary. Institutional researchers find these tables particularly useful in organizing data for special constituents’ needs (e.g., for a committee on the status of women or the chief diversity officer), but these crosstabs can be useful to anyone looking for more detail. For example, you can sort the Excel version of these data tables to identify quickly the degree to which your faculty are more or less satisfied than faculty at your six peers. You can also use the Criteria tab in your Excel report to raise or lower the threshold for areas of strength and weakness. If your report is overrun with highlighted differences between men’s and women’s levels of satisfaction, you can easily raise the threshold for highlighting, and the report will adjust itself accordingly. Changing the criteria for “top-level” results, then, allows you to reorganize your report around your biggest successes and most pressing problems. Soon, you will discover that many faculty concerns can be dealt with immediately and inexpensively, while others present themselves as opportunities for broad involvement in designing collaborative solutions. Build a communication plan. If you have not yet developed a “COACHE communication plan,” do so now. Use the
45

Your results are in your hands… now what?
COACHE Communication Models and Milestones charts in your supplementary materials to help you consider where your campus (or your leadership style) fits now on the range of transparency and shared governance, and perhaps where it should be in the future. Of course, this framework is not designed to suggest that one approach is always better than another, but instead, to assist in your determination of which approach is best given your institution’s culture—and given also what your faculty want from you, their leaders, as expressed through the COACHE survey. To inform your communication strategy, review the campus calendar for the most effective venues to discuss COACHE participation, such as faculty senate meetings, collective bargaining group meetings, opening convocations and/or retreats (for deans, chairs, and/or faculty), and new faculty orientations.* Consider print and electronic media outlets (e.g., campus newspapers, HR and provostial newsletters, faculty job postings) for communicating your COACHE enrollment and results. When you have decided on a course of action, prepare and distribute a letter for communicating your plan. Disseminate broadly. Whatever model you feel fits best, do not delay sharing your institutional report, in part or in full, with key constituents on your campus. Consider forming a task force or ad hoc committee. If you choose to do so, you should designate its members as the conduit for all information about COACHE and mention this group in all communication with faculty. Put your data into play with pre-tenure and tenured faculty, the faculty senate, collective bargaining groups, campus committees (e.g., Promotion & Tenure, Status of Women, Diversity), deans, department
* Although COACHE does not survey new hires, these faculty are likely to communicate with their colleagues. Additionally, even though they did not participate in the survey, they will benefit from your responses to the findings.
chairs, the executive council and/or senior administrators, including the Chief Diversity Officer, and the board of trustees (see more on this below). It is particularly important to disseminate your results to the faculty who each spent about 20 minutes completing the survey. Failure to demonstrate action in response to their contribution of time may result in reduced response rates in future surveys. Many COACHE members have posted some or all of their results on their web sites to highlight institutional strengths and demonstrate their commitment to transparency in improving the areas of concern. Many colleges and universities hold workshops and forums with constituents, together or separately, to discuss interpretations of and policy responses to their COACHE findings. When meeting with these groups, ask questions to organize and catalyze the conversations around COACHE. For example: What confirmed (or defied) conventional wisdom? What are the surprises? Disparities? Lessons? Implications? Take ownership. You must take ownership of the results, or insist that people in a position to make change are held accountable for doing so. Our colleagues, Cathy Trower and Jim Honan, cited a provost in The Questions of Tenure (ed. R. Chait, 2002) who said: “Data don’t just get up and walk around by themselves… they only become potent when somebody in charge wants something to happen.” Without the catalyst of responsibility, good intentions may not produce desired results. Consider forming, for example, a mid-career faculty task force that would identify the COACHE findings particularly germane to local concerns of associate professors, then would present a range of policy recommendations emerging from their analysis. As an alternative, ask administrators in academic affairs, faculty development, diversity, and
46

Your results are in your hands… now what?
human resources to read the report and identify the top three things they would recommend as a result. The responses might be broad (e.g., “Demystify the promotion process”) or specific (e.g., “Increase availability of eldercare options”). Naturally, expectations ought to be set so that recommendations are realistic and align with your strategic plan and priorities. Through COACHE, we have seen this accountability exemplified by a provost who memorably signaled a “buck stops here” attitude (not to mention a sense of humor) to improving faculty work/life by donning a shirt imprinted with “C-A-O” in big, bold letters. He understood that the actions suggested by his COACHE report—whether highlighting strengths or addressing concerns—align with the will of policymakers and faculty, and that it must be someone’s responsibility to see the recommendations through to outcomes. Just giving constituents—and in particular, the faculty—some part in the COACHE conversation gives them a stake in advancing better recruiting, retention, and development. Engage with peer institutions. We named this project the Collaborative because only by gathering together the agents for change in faculty work/life will we understand what works well, where, and why. Several times each year, COACHE sends invitations to key contacts at each member institution to participate in conference-based special events and workshops. There, participants share innovative strategies for using COACHE data and tackling the challenges we all have in common. Out of these discussions have emerged more comprehensive data-sharing agreements among peers, site visits to exemplary institutions, and lasting contacts for free advice and consultation. (“We’re thinking about implementing this new program. Has anyone else ever tried it?”)
In addition to bringing COACHE members together for these special events, we continually seek out other ways to support our collaborative spirit: hosting our annual Leaders’ Workshop; highlighting member institutions in our newsletter; trying out new policy and program ideas on the COACHE ListServ (sign up at www.coache.org); and offering to conduct site visits to member campuses. Thanks to these collaborations, we all gain actionable insight into making colleges campuses great places to work. Call us. Think of COACHE as your hotline for suggestions in faculty recruitment, development and success. For the duration of your three-year COACHE membership, please call us (617-495-5285) if you have any questions about how you can make the most of your investment in this project. Also, recommend to anyone working with or presenting COACHE data (such as institutional research staff) to call us for advice and tools to simplify the work. If your COACHE report is collecting dust on the shelf, then we have failed. Let us help you cultivate your data—and your faculty—as a renewable resource. WHAT’S A DEAN TO DO? by Cathy Trower, Research Director Not long ago, after addressing a group of academic deans about the barriers to interdisciplinary scholarship and changes needed to overcome them, a dean asked, “But what’s a dean to do? We are seen as ‘middle meddlers!’” He elaborated by saying that it is difficult to manage or effect change from the decanal vantage point because of the organizational hierarchy and power structure; there’s a provost and president above him and senior, department chairs and tenured faculty in various departments around him.
47

Your results are in your hands… now what?
Since that question was posed to me, I have met with several academic administrators and here is what I’ve learned about what deans can do to bring about improvements on any issue, whether it is promoting interdisciplinary scholarship and supporting such scholars for success, increasing the numbers, status, and success of women in STEM disciplines and of faculty of color, or creating a great place to work for faculty. I hope these suggestions will prove helpful for COACHE member institutions as they focus on the issues related to faculty recruitment, retention and development on their campuses as uncovered by our survey. Focus attention. Most issues have low salience for most people most of the time. In addition, there are always multiple concerns on college campuses and all too often the ‘crisis de jour’ can distract us from persistent, systemic problems. Deans can help focus the attention of faculty and other administrators by spending time, over time, on the issue upon which s/he wishes to influence. Be accountable. Gather data. Deans are in a prime position to call attention to issues or problems by bringing data to bear on them. Research shows that what gets measured gets done. In some cases, the data are quantitative and in others help will come in the form of stories and anecdotes. In any case, marshal the evidence to make the case. Engage colleagues up, down, and across campus. Build alliances with other deans by discussing areas of mutual concern, defining the problems, and thinking of possible solutions. Involve the faculty in those conversations. One administrator with whom I spoke recently said that he plans to form an Advisory Task Force of key senior faculty to figure out how to make progress recruiting and retaining scholars of color. Take the ideas to the provost; in other words, make your best case and make it known that you have support on multiple fronts. Offer solutions, not more problems.
Don’t accept the status quo. In other words, persist. Some decisions in academic institutions are made by accretion and just because one’s proposal is rejected today doesn’t mean that it won’t be accepted later. Deans can persist until progress, even incremental, is made. An effective strategy is not only to anticipate the costs of policy implementation (e.g., modified duties, flextime, stop-the-clock, dual career hires), but also to discuss the cost of maintaining the status quo. Ask questions. Instead of feeling the need to have all the answers all of the time, pose questions in a variety of forums where you already have people’s attention. As one dean said to me, “I lead by asking relevant questions at a variety of tables with various constituencies. Most often, those questions have no easy answers, but I am able to put the issue effectively into play. Raising issues as questions puts academics in a mindset of problem solving. This is, after all, how we all approach our own scholarship – with questions, not with answers.” COACHE & GOVERNANCE by Richard Chait, Research Professor Academic administrators regularly and rightly remind boards of trustees that the quality of a college or university and the vitality of the faculty are very tightly linked. In turn, most trustees recognize that the vitality of the faculty requires that institutions create an attractive and supportive work environment. In particular, colleges must be able to recruit and retain a talented and diverse stream of “new blood” for the faculty. Despite the importance administrators and trustees assign to this objective, boards rarely discuss the topic. COACHE reports offer presidents, provosts, and deans the opportunity to engage trustees at an appropriate policy level in conversations about the quality of work life for the faculty that represent the
48

Your results are in your hands… now what?
institution’s academic future and its current reality. There are two potentially productive lines of inquiry. In the first mode, management educates the board about major themes that emerged from COACHE data and from benchmark comparisons with the institution’s peer group. The Provost’s Report can be further distilled to highlight for trustees the overall or global levels of satisfaction; specific aspects of work/life that faculty consider most agreeable and most problematic; significant disparities by race, gender, or rank; and critical “policy gaps,” areas respondents rated important in principle and unsatisfactory in practice. In short order, trustees will have keener insight into the organizational environment and personal experiences of faculty, as well as a deeper appreciation for management’s commitment and game plan to make the college a great place to work. The second mode, which may be even more profitable, turns the tables. Here, trustees educate the administration. As academic leaders contemplate appropriate responses to the challenges and concerns that faculty confront, board members can be a valuable resource. Whether as corporate executives or senior partners in firms (e.g., law, medicine, consulting, and engineering), many trustees also have to create, if only for competitive reasons, attractive work environments responsive to the preferences and lifestyles of new generations of professionals. While the circumstances are not identical, the fundamental challenges are not terribly different: clarity of performance expectations; professional fulfillment; work-family balance; collegial culture; and diversity, to name a few. With COACHE data as context, trustees can share successful (and unsuccessful) strategies, policies, and practices intended to improve work satisfaction and vitality, whether for relatively young newcomers or seasoned veterans at the company or firm. What did you try, and to what effect? What did you learn? This line of inquiry could well yield some innovative and effective initiatives that can be adapted to
academe, and the discussion will reinforce the board’s role as a source of intellectual capital and as active participants in consequential conversations.
49

Your results are in your hands… now what?
50

The Collaborative on Academic Careers in Higher Education at the Harvard Graduate School of Education
BACKGROUND & DEFINITIONS
Background
The principal purposes of the Collaborative on Academic Careers in Higher Education (COACHE) survey are two-fold: (1) to enlighten academic leaders about the experiences and concerns of full-time, faculty; and (2) to provide data that lead to informed discussions and appropriate actions to improve the quality of work/life for those faculty. Over time, we hope these steps will make the academy an even more attractive and equitable place for talented scholars and teachers to work.
The core element of COACHE is a web-based survey designed on the basis of extensive literature reviews; of themes emerging from multiple focus groups; of feedback from senior administrators in academic affairs; and of extensive pilot studies and cognitive tests in multiple institutional contexts. While there are many faculty surveys, the COACHE instrument is unique in that it was designed expressly to take account of the concerns and experiences faculty on issues with direct policy implications for academic leaders.
This COACHE Faculty Job Satisfaction Survey provides academic leaders with a lever to enhance the quality of work-life for faculty. The report portfolio provides not only interesting data, but also actionable diagnoses—a springboard to workplace improvements, more responsive policies and practices, and an earned reputation as a great place for faculty to work.
Survey Design The chief aim in developing the COACHE Faculty Job Satisfaction Survey was to assess, in a comprehensive and quantitative way, faculty’s work-related quality of life. The survey addresses multiple facets of job satisfaction and includes specific questions that would yield unambiguous, actionable data on key policy-relevant issues.
The COACHE instrument was developed and validated in stages over a period of several years. Focus groups were conducted with faculty to learn how they view certain work-related issues, including specific institutional policies and practices, work climate, the ability to balance professional and personal lives, issues surrounding tenure, and overall job satisfaction.
Drawing from the focus groups, prior surveys on job satisfaction among academics and other professionals, and consultation with subject matter and advisory board experts on survey development, COACHE researchers developed web-based survey prototypes that were then tested in pilot studies across multiple institutions.
COACHE solicited feedback about the survey by conducting follow-up interviews with a sub-sample of the respondents of the pilot study. Cognitive interviews were conducted with faculty from a broad range of institutional types to test the generalizability of questions across various institutional types. The survey was revised in light of this feedback. The current version of the survey was revised further, taking into account feedback provided by respondents in survey administrations annually since 2005. Survey administration All eligible subjects at participating institutions were invited to complete the survey. Eligibility was determined according to the following criteria:
Full-time Not hired in the same year as survey
administration Not clinical faculty in such areas as Medicine,
Dentistry, Nursing, Pharmacy, and Veterinary Medicine
Not in terminal year after being denied tenure
51

Background and definitions
Subjects first received a letter about the survey from a senior administrator (e.g., president, provost, or dean) at their institution. Next, subjects received an email from COACHE inviting them to complete the survey. Over the course of the survey administration period, three automated reminders were sent via email to all subjects who had not completed the survey.
Participants accessed a secure web server through their own unique link provided by COACHE and, and agreeing to an informed consent statement, responded to a series of multiple-choice and open-ended questions (see Supplemental Materials). Generally, respondents completed the survey in less than twenty-five minutes; the mode (most frequent) completion time was approximately 21 minutes.
Data conditioning For a participant’s responses to be included in the data set, s/he had to provide at least one meaningful response beyond the initial demographic section of the instrument. The responses of faculty who either
terminated the survey before completing the demographic section or chose only N/A or Decline to Respond for all questions were removed from the data set. The impact of such deletions, however, is relatively small: on average, greater than 90 percent of respondents who enter the COACHE survey go on to complete it in its entirety.
When respondents completed the survey in an inordinately short time or when the same response was used for at least 95% of items, the respondents were removed from the population file.
In responses to open-ended questions, individually-identifying words or phrases that would compromise the respondent’s anonymity were either excised or emended by COACHE analysts. Where this occurred, the analyst substituted that portion of the original response with brackets containing an ellipsis or alternate word or phrase (e.g., […] or [under-represented minority]). In the case of custom open-ended questions, comments were not altered in any way.
Definitions All comparable institutions, “All comparables,” or “All” Within the report, comparisons between your institution and the cohort group provide context for your results in the broader faculty labor market. While the experiences, demands, and expectations for faculty vary by institutional type—reflected in your peers selections—this comparison to the entire COACHE cohort can add an important dimension to your understanding of your faculty. The institutions included in this year’s “all comparables” group are listed in the appendix of your Provost’s Report. Data weighting or “weight scale” In prior reports, a weighting scale was developed for each institution to adjust for the under- or over-representation in the data set of subgroups defined by race and gender (e.g., White males, Asian females,
etc.). Applying these weights to the data thus allowed the relative proportions of subgroups in the data set for each institution to more accurately reflect the proportions in that institution’s actual population of pre-tenure faculty.
However, the use of weights poses some methodological challenges. First, and foremost, the actual application of weights in the COACHE report only produced very small changes in results. Because COACHE does not use samples the respondent group typically is representative of the full population. Also, weights applied to an overall mean are less useful when comparing subgroups of the respondent population. When weighted data is disaggregated, the utility of the weights is compromised. For these reasons and other, the use
52
Background and definitions
of weights for this type of large scale analysis is becoming less common.
Effect size Put simple, effect size is means for quantifying the difference between two groups. In the COACHE Provost’s Report, effect size is used to compare the difference between subgroups within a campus (e.g. men to women, tenured to pre-tenure, etc.).
Effect size is calculated using the formula below where:
x1-x2
√ (sd12)-(sd22)
It considers both the central tendency and the variance in the calculation which helps to counter concerns about differences in group sizes. Also, unlike other measures of differences between groups, effect size shows both direction and magnitude.
Faculty of color or “foc” Any respondent identified by his or her institution or self-identifying in the survey as non-White. n < 5 To protect the identity of respondents and in accordance with procedures approved by Harvard University’s Committee on the Use of Human Subjects, cells with fewer than five data points (i.e., mean scores for questions that were answered by fewer than five faculty from a subgroup within an institution) are not reported. Instead, “n < 5” will appear as the result. Response rate The percent of all eligible respondents, by tenure status, rank, gender and by race, whose responses, following the data conditioning process, were deemed eligible to be included in this analysis. Thus, your response rate counts as nonrespondents those faculty who were “screened out” by the survey application or by later processes.
Please feel free to contact COACHE with any additional questions about our research design, methodology, or definitions; about survey administration; or about any aspects of our reports and available data.
53
Background and definitions
54

The Collaborative on Academic Careers in Higher Education at the Harvard Graduate School of Education
* Pre-tenure faculty only; ** Tenured faculty only
PARTICIPATING INSTITUTIONS
Faculty from the following institutions comprise the COACHE database for this 2011-12 Provost’s Report.
Auburn University** Christopher Newport University* Clemson University The College of the Holy Cross* Florida International University** Georgia State University** Hamilton College* Hobart & William Smith Colleges** James Madison University* Johns Hopkins University Kansas State University Kenyon College Lincoln University (MO) Loyola University Maryland Merrimack College Middlebury College Mount Holyoke College** New Mexico State University** North Dakota State University Purdue University Saint Mary's College of Maryland Saint Olaf College Stonehill College Tulane University* University of Alabama** University of Kansas University of Memphis** University of North Texas** University of Saint Thomas (MN) University of Tennessee University of Wisconsin - Parkside West Virginia University** The City University of New York:
College of Staten Island** Hunter College** John Jay College Criminal Justice** Lehman College** New York City College of Technology** Queens College**
The State University of New York: Alfred State College Binghamton University Buffalo State College Farmingdale State College Maritime College Morrisville State College Purchase College Stony Brook University University at Albany University at Buffalo State University of New York:
at Canton at Cobleskill at Cortland at Brockport at Delhi at Fredonia at Geneseo at New Paltz at Old Westbury at Oneonta at Oswego at Plattsburgh at Potsdam College of Env. Science and Forestry Institute of Technology at Utica/Rome
The University of North Carolina: Appalachian State University East Carolina University Elizabeth City State University Fayetteville State University North Carolina A&T State University North Carolina Central University North Carolina State University University of North Carolina - Chapel Hill University of North Carolina - Charlotte University of North Carolina - Greensboro University of North Carolina - Pembroke Western Carolina University Winston-Salem State University
55

Participating institutions
The following table lists the previous members of the Collaborative. Pre-tenure faculty at these institutions have completed a prior version of COACHE’s survey instrument; their data are not included in this report’s analysis, but are available for custom reporting. Albright College Amherst College Arizona State University Auburn University Ball State University Barnard College Bates College Boston University Bowdoin College Brown University Carleton College Case Western Reserve University Clemson University Colgate University College of Saint Benedict / Saint John's University The College of Wooster Connecticut College Dartmouth College Davidson College Delaware State University Denison University DePauw University Drexel University Duke University Emerson College Gonzaga University Goucher College Hampshire College Harvard University Hendrix College Hobart & William Smith Colleges Hofstra University Indiana University Iowa State University Ithaca College Kansas State University Lafayette College Lehigh University Loyola Marymount University Loyola University Maryland
Macalester College Manhattanville College McGill University Michigan State University Mississippi State University Montana State University Montclair State University Northeastern University Oberlin College Occidental College The Ohio State University Ohio University Ohio Wesleyan University Old Dominion University Pacific Lutheran University Pomona College Richard Stockton College of New Jersey Rowan University Skidmore College Stanford University Susquehanna University Syracuse University Texas Tech University Trinity College (CT) Tufts University Tulane University Union College University of Alabama University of Arizona University of Arkansas University of Baltimore University of Chicago University of Cincinnati University of Connecticut University of Houston University of Illinois at Urbana-Champaign University of Iowa University of Kentucky University of Massachusetts Amherst University of Massachusetts Lowell
56

Participating institutions
University of Memphis University of Michigan - Flint University of Minnesota University of North Carolina at Asheville University of North Carolina at Wilmington University of North Texas University of Notre Dame University of Puget Sound University of Richmond University of Rochester University of South Carolina University of Texas at Dallas University of Toronto University of Virginia University of Wisconsin Parkside University of Wyoming Virginia Commonwealth University Virginia Polytechnic Institute and State University Wabash College Washington State University Wayne State University Wellesley College Wesleyan University West Virginia University Wheaton College Whitman College California State University:
Cal Poly Pomona Cal Poly San Luis Obispo California State University - Fullerton California State University - Long Beach California State University - San Bernardino California State University - San Marcos Sonoma State University
The City University of New York Bernard M Baruch College Brooklyn College City College College of Staten Island Hunter College John Jay College Criminal Justice Lehman College Medgar Evers College New York City College of Technology Queens College
York College The University of Missouri System:
Missouri University of Science and Technology University of Missouri - Columbia University of Missouri - Kansas City University of Missouri - St. Louis
57


The Collaborative on Academic Careers in Higher Education (COACHE)
at the Harvard Graduate School of Education 8 Story Street, Fifth Floor
Cambridge, Massachusetts 02138 Telephone: (617) 495-5285
E-mail: [email protected] Web: http://www.coache.org