co4-1 study of intense terahertz light source based on ... · study of intense terahertz light...
TRANSCRIPT

Study of Intense Terahertz Light Source Based on Superimposing
Coherent Diffraction Radiation
N. Sei and T. Takahashi1
Research Institute of Instrumentation Frontier, National
Institute of Advanced Industrial Science and Technology 1Research Reactor Institute, Kyoto University
INTRODUCTION: Terahertz (THz) wave applications
have developed dramatically by compact THz-wave
sources based on a femtosecond laser. However, it is still
difficult to identify the intermolecular vibrational modes
with existing THz-wave sources, so that a THz-wave
source based on an electron accelerator, which can gen-
erate an intense THz wave, has been studied flourishingly.
We have planned to develop an intense THz-wave source
based on a superimposing coherent diffraction radiation
(CDR), which could generate a tunable-wavelength and
monochromatic THz wave.
EXPERIMENTS: When a relativistic electron beam
passes through a circular aperture of a metric screen, dif-
fraction radiation (DR) is generated from the edge of the
metric screen [1]. In case the wavelength of DR is longer
than a bunch length of the electron beam, the DR emitted
from each electron in the bunch interferes, and then in-
tensity of the whole DR emitted from the bunch increases
remarkably. Such an intense DR is called CDR. Because
an electron beam is not lost by generating CDR, multiple
diffraction elements can be inserted into an orbit of the
electron beam to obtain intense CDR. If the multiple
diffraction elements are arranged periodically, CDR
emitted from each diffraction element is superimposing
and the intensity of CDR emitted from the whole ele-
ments is much higher at a wavelength corresponding to
the period of the elements. This is superimposing CDR
that we propose.
We have conducted demonstration experiments of the
superimposing CDR with an L-band electron linear ac-
celerator at the Kyoto University Research Reactor Insti-
tute [2]. The electron-beam energy was 32 MeV and the
electron charge was 0.7 nC per micropulse. The diffrac-
tion element made of brass had an aperture with a diame-
ter of 30 mm and a depth of 0.1 mm. It also had four
holes to mount itself on four poles of a diffraction ele-
ment holder. A period of the diffraction elements could be
adjusted by changing the widths of washers which were
mounted on the poles, as shown in figure 1. When the
period was 3 mm, the holder could attach the diffraction
elements of 20 or less sheets. The holder was located 0.5
m upper stream from an aluminum foil. To avoid the
electron beam colliding with the diffraction elements, an
iron aperture which has a hole of 30 mm diameter and a
width of 40 mm, was installed behind a titanium window.
A permanent bending magnet was also installed at 0.2 m
downstream from the holder, and it deflected the electron
beam by 7.5 degrees. The CDR beam generated by the
diffraction elements was transported by mirrors to the
experimental room, and a spectrum of the CDR beam
was measured by a Martin-Puplett-type interferometer.
Figure 2 shows the observed spectra when the number of
the diffraction elements was 1, 4, and 16. The interval of
the diffraction elements was 2.9 mm. Radiation power
around a wavelength of the interval became larger as the
number of the diffraction elements increased. This ex-
perimental result suggests that the CDR emitted from
each diffraction element was superimposed. However,
total radiation power hardly depended on the number of
the diffraction elements. It is noted that the CDR power
was much smaller than coherent transition radiation
power emitted from the titanium window.
CONCLUSIONS: The superimposing CDR has been
observed by multiple diffraction elements. We will ex-
amine an optical pass which will extract only the CDR
beam efficiently, and demonstrate wavelength tunability
of the CDR.
REFERENCES: [1] Y. Shibata et al., Phys. Rev. E., 52 (1995) 6787.
[2] T. Takahashi and K. Takami, Infrared Phys. Technol.,
51 (2008) 363-366.
採択課題番号 25009 重畳的コヒーレント回折放射による高強度テラヘルツ光源 共同通常
(産総研)清 紀弘(京大・原子炉)高橋 俊晴
Fig. 1 Photograph of the diffraction element holder.
0.5 0.6 0.7 0.8 0.9 1 2 3 4 50.0
0.2
0.4
0.6
0.8
1.0
Ra
dita
ion
in
ten
sity [
a.u
. ]
Wavelength [mm]
1 Sheet 4 Sheets 16 Sheets
Fig. 2 Spectra of the radiation from the diffraction ele-
ments.
CO4-1

一般通常 採択課題番号 25012 イオン浮選に伴うナノ構造変化関する中性子小角散乱による研究
(九大院·工)原 一広、宮崎智博
(京大·原子炉)杉山正明、佐藤信浩、大場洋次郎
Metal Ion Adsorption by Acrylic Acid Grafted PET Films Prepared by γ Irradiation
N. Rahman, N. Sato1, Y. Oba1, M. Sugiyama1,
T. Miyazaki, Y. Hidaka, H. Okabe and K. Hara
Department of Applied Quantum Physics and Nuclear
Engineering, Kyushu University 1Research Reactor Institute, Kyoto University
INTRODUCTION: In recent years discharge of
hazardous heavy metals in industrial effluents and their
removal have received much public attention [1]. But the
conventional methods used for heavy metal waste water
treatment such as precipitation, ion exchange, activated
carbon adsorption, electrolytic method etc. have
limitations like high cost, low removal rate or difficulty
for regeneration and reuse. Therefore many researches
focused on the study of alternative low cost effective
adsorbents. In the present work AAc grafted PET films
were prepared by γ irradiation and after hydrolysis
through KOH treatment the grafted films were used to
study the adsorption of Cu(II), Co(II) and Ni(II).
EXPERIMENTS: The dry PET films weighing Wpristine
were taken into glass bottles containing different
concentration (20- 40 wt %) of AAc aqueous solutions.
FeCl3 at a constant concentration (1 wt %) was added to
the AAc solutions to minimize homopolymer formation.
The contents of the glass bottles were then irradiated with
different doses (20-100 kGy) of γ rays with a dose rate of
1.0 kGy/h in air (γ-ray irradiation of the PET films was
carried out at the 60Co γ-ray irradiation facility of
Research Reactor Institute, Kyoto University). The
obtained grafted films were washed in distilled water at
60°C for 24 h to remove the homopolymers. Then the
films were dried in a vacuum oven at 60°C for 24 h and
were weighed (WAAc grafted ). The graft yield was
determined by the percent increase in the weight as
follows:
Graft yield:
δWAAc grafted (%) = (WAAc grafted - Wpristine ) / Wpristine×100 .
The AAc grafted films with 40 % graft yield (obtained at
40 % AAc concentration and 100 kGy dose) were
modified by treatment with 2.5 % KOH for 2 min at 25 °C.
The modified AAc grafted films of 60 mg were soaked
into the 10 ml aqueous solutions including of Cu(II), Ni(II)
and Co(II) at a definite metal ion concentration and pH for
60 min at room temperature (25 °C). pH of the solutions
were adjusted using HCl and NaOH solution. Metal
loaded films were washed and dried. The metal-ion
concentrations of the solutions were analyzed by ICP-MS.
The metal ion uptake capacity of the film was calculated
as follows:
Q = V(C1-C2)/W ,
where Q is the adsorption amount (mg/g), W the weight of
the film (g), V the volume of solution (L), and C1 and C2
are the concentrations (mg/L) of metal ion before and after
adsorption respectively.
RESULTS: The prepared AAc grafted films (G- 40 %)
were modified by treatment with KOH which increased
the metal ion adsorption capacity of the films largely,
almost 10 times than the AAc grafted films. The
adsorption capacity of Cu(II), Co(II) and Ni(II) ions
obtained in the present study are presented in Table 1. The
modified AAc grafted PET films after adsorption of
Cu(II), Co(II) and Ni(II) ions are shown in Figure 1.
Table 1. Cu(II), Co(II) and Ni(II) adsorption capacity of
AAc grafted and hydrolyzed AAc grafted PET film (From
single metal solutions)
Fig. 1: (a) AAc grafted PET (b) AAc grafted PET after
modification by KOH treatment (c) Modified AAc grafted
PET film after Cu(II) loading (d) Modified AAc grafted
PET film after Co(II) loading (e) Modified AAc grafted
PET film after Ni(II) loading.
REFERENCES:
[1] J. Ui (Ed.), Industrial Pollution in Japan (The Japanese
Experience Series), United Nations University Press,
Tokyo, 1992
(Full text is also available at
http://www.unu.edu/unupress/unupbooks/uu35ie/
uu35ie00.htm.).
Adsorbent
film
Cu(II)
adsorption
capacity
(mg/g)
Co(II)
adsorption
capacity
(mg/g)
Ni(II)
adsorption
capacity
(mg/g)
AAc graft
PET
10.0 7.0 8.0
Hydrolyzed
AAc graft
PET
100.0 67.0 85.0
CO4-2

採択課題番号 25017 小角中性子線散乱実験を行う自己組織化錯体試料の 共同通常
極小角光散乱による構造決定
(東北大・WPI-AIMR)佐藤宗太(京大・原子炉)佐藤信浩、杉山正明
Structural Determination by Ultra Small Angle Light Scattering of Self-Assembled
Complexes to Perform Small Angle Neutron Scattering Experiments
S. Sato, N. Sato1 and M. Sugiyama1
WPI-AIMR, Graduate School of Science, and ERATO
(JST) at Tohoku University 1Research Reactor Institute, Kyoto University
INTRODUCTION: Self-assembled metal-organic com-
plexes have advantages that huge, well-defined structures
can be synthesized in simple synthetic methods with de-
signable substituents introduced by precise organic syn-
theses. Our group has focused on the construction of new
molecular frameworks of metal-organic complexes and
reported the first stellated polyhedral structures [1],
sphere-in-sphere structures [2], extended spherical struc-
tures [3], and so on. In the course of one-step syntheses
of self-assembled complexes, we noticed that step-wise
assembly can be also designed through the peripheral
functional groups on complexes.
Self-assembled complexes with -stacked motifs [4]
are interesting targets not only from the viewpoints of
their unique structures but also from those of NMR ap-
plications based on their magnetic behaviors. We found
that the complexes show magnetic aligning dynamics due
to the parallel accumulation of large -moieties in a mol-
ecule [5]. Here, we envisioned that the introduction of
hydrophilic substituents on the complexes would improve
the solubility of the complexes in water and accellerate
the further intermolecular -stacking in solution. The
assembled structures could be analyzed by small angle
neutron scattering (SANS) and the preliminary structural
information could be derived from ultra small angle light
scattering measurements on lab equipments.
RESULTS: A series of -stacked complexes with variety
of hydrophilic substituents were synthesized as showin in
Fig. 1. The structures were detemined by NMR and the
framework with stacked -moieties was unambiguously
determined by single crystal X-ray diffraction studies.
When we compared the solubility of the newly synthe-
sized complexes with that of proviously reported struc-
ture with less hydrophilic substitutents, significant im-
provement of the solubiity was confirmed, proving that
the molecular design was successful. We found that the
complexes show larger assembled structures in more
concentrated solution presumably due to intermolecular
-stacking. The more assembled structures showed
smaller diffusion coefficients estimated by 2D NMR
measurements. Rough size was estimated by ultra small
angle light scattering, showing consistent structures with
NMR analyses. The detailed assembled structures would
be determined by precise SNAS methods, which will also
give the conformational information of the attached sub-
stituents.
EXPERIMENTS: The building blocks of the
self-assembled products were purchased from chemical
company or synthesized according to basic organic
synthtic procedures which will be reported elsewhere.
The building blocks were mixed in a stoichiometric mo-
lar ratio and dissolved in D2O. The structures of the
products were determined mainly by NMR and by other
analytical methods. The diluted samples were prepared
with water, and the solution was checked by NMR to
confirm the maintenance of the frameworks.
REFERENCES: [1] Q.-F. Sun et al., Nature Chem., 4 (2012) 330-333.
[2] Q.-F. Sun et al., Angew. Chem. Int. Ed., 50 (2011)
10318-10321.
[3] Q.-F. Sun et al., Science, 328 (2010) 1144-1147.
[4] Y. Yamauchi et al., J. Am. Chem. Soc., 132 (2010)
9555–9557.
[5] S. Sato et al., J. Am. Chem. Soc., 132 (2010)
3670–3671.
Fig. 1. Representative scheme for the
self-assembly of -stacked complexes from six bi-
dentate ligands (red), four tridentate ligand (purple),
twelve palladium (II) ions with 90°–corner cap, and
three guest organic molecules. The twenty five
components disolved in water assemble into a met-
al-organic complex with a single structure in 100%
yield. A variety of substituent groups, R, was intro-
duced by the organic functionalization on the biden-
tated ligand, affording the correspoinding function-
alized metal-organic complexes, where the position
and number of the funcioal groups are clearly de-
fined by the mother framework of the assembled
complexes.
CO4-3

採択課題番号 25018 材料研究および中性子検出器開発を目的とした 共同通常
小型多目的中性子回折装置の建設
(京大・原子炉)森 一広、吉野泰史、福永俊晴、川端祐司(高エネ研)佐藤節夫、平賀晴弘
(東北大・金研)山口泰男(茨城大・工)岩瀬謙二
Current Status of B–3 Beam Port of KUR
K. Mori, H. Yoshino, T. Fukunaga, Y. Kawabata, S. Sato1, H. Hiraka1, Y. Yamaguchi2 and K. Iwase3
Research Reactor Institute, Kyoto University (KURRI) 1High Energy Accelerator Research Organization (KEK) 2Institute for Materials Research, Tohoku University 3Department of Materials and Engineering, Ibaraki Uni-versity
INTRODUCTION: The B–3 beam port of Kyoto Uni-versity Research Reactor (KUR) had long been used as a four-circle single-crystal neutron diffractometer (4CND). For the last decade, however, the 4CND was so old that its research activity on neutron science was quite low. Therefore, the 4CND needed to be replaced and the in-creasing demand for a new neutron diffractometer (Compact multipurpose neutron diffractometer) calls for the structural investigations using neutron diffraction. Here, we report the current status of the B-3 beam port of KUR.
NEUTRON DIFFRACTION: The compact multi-purpose neutron diffractometer is now being installed on the B–3 beam port. The neutron wavelength (λ), which is monochromatized by the (220) plane of a Cu single crys-tal, is 1 Å. To cover the detector area (6 º ≤ 2θ ≤ 150 º), 24 3He tube detectors (1/2 inch in diameter) have been prepared. The distances from the monochromator to the sample and from the sample to the detector will be 1.9 m and 1.2 m, respectively. To assess the neutron beam properties of the B-3 beam port, the preliminary neutron diffraction experiments using Ni powder were performed. As shown in Fig. 1, we observed their several Bragg re-flections, which could be indexed on the basis of λ = 1 Å.
4000
3500
3000
2500
2000
1500
1000
500
0
Inte
nsity
/ co
unts
6055504540353025
2 / °
1 1
1
2 0
0
2 2
0
3 1
12
2 2
Observed data Calculated data
Fig. 1. Neutron diffraction data of Ni powder collected at the B-3 beam port of KUR.
NEUTRON DETECTOR SYSTEM: The data acquisi-tion group of the neutron science division of KEK
(KEK–KENS DAQ group) has used the B–3 beam port to assess their new 6Li-glass neutron detector system, LiTA12. The LiTA12 system consists of a 6Li-glass neu-tron detector with a multianode photo multiplier tube (MA–PMT), an amplifier, and an analog-to-digital con-verter (ADC) board. The B–3 beam port has a wide space around the sample position; therefore we can easily in-stall any other system like the LiTA12 system (see Fig. 2).
Fig. 2. New 6Li-glass neutron detector system, LiTA12, developed by the KEK–KENS DAQ group. The “K” was made of cadmium plates.
NEUTRON MONOCHROMATOR: The development of large crystal monochromators for a polarized neutron beam has been conducted by the KEK–Tohoku Univer-sity group. To assess their crystal monochromators, they have used the B–3 beam port. Figure 3 shows the neutron rocking curve of the cold-pressed Cu single crystal ((200) plane). The further investigations are now in progress.
Fig. 3. Neutron rocking curve of the cold-pressed Cu sin-gle crystal – (200) plane.
CO4-4
採択課題番号 25021 超イオン導電体におけるコヒーレントミリ波誘起イオン伝導の検証 共同通常
(東北学院大・工)淡野照義
(京大・原子炉)高橋俊晴
Sub-Terahertz Absorption of Ionic Liquid
T. Awano and T. Takahashi1
Faculty of Engineering, Tohoku Gakuin University 1Research Reactor Institute, Kyoto University
INTRODUCTION: We have observed millimeter wave absorption bands
around 6 and 8 cm-1 in AgI-superionic conductive glasses. These bands were also observed in CuI-superionic
ones[1-3]. These bands seems to be due to collective mo-
tion of conductive ions, although how conduction ions
moves in correlation is not clear.
Ionic liquid is molten salt at room temperature. It is in-
teresting to compare ionic motion in ionic liquids with
those in superionic conductor.
EXPERIMENTS: Ionic liqids N,N-Diethyl-N-methyl-N-(2-methoxyethl)
ammonium tetrafluoroborate ([DEME][BF4]) and
N,N-Diethyl-N-methyl-N-(2-methoxyethl)ammonium
bis(trifluoromethanesulfonyl)imide ([DEME][TFSI])
(Kanto Chem. co., inc.) were spread into filter paper.
Transmission spectra of single and double papers with
ionic liquids were measured at room temperature and low
temperatures. Absorption spectra were obtained by sub-
traction of them.
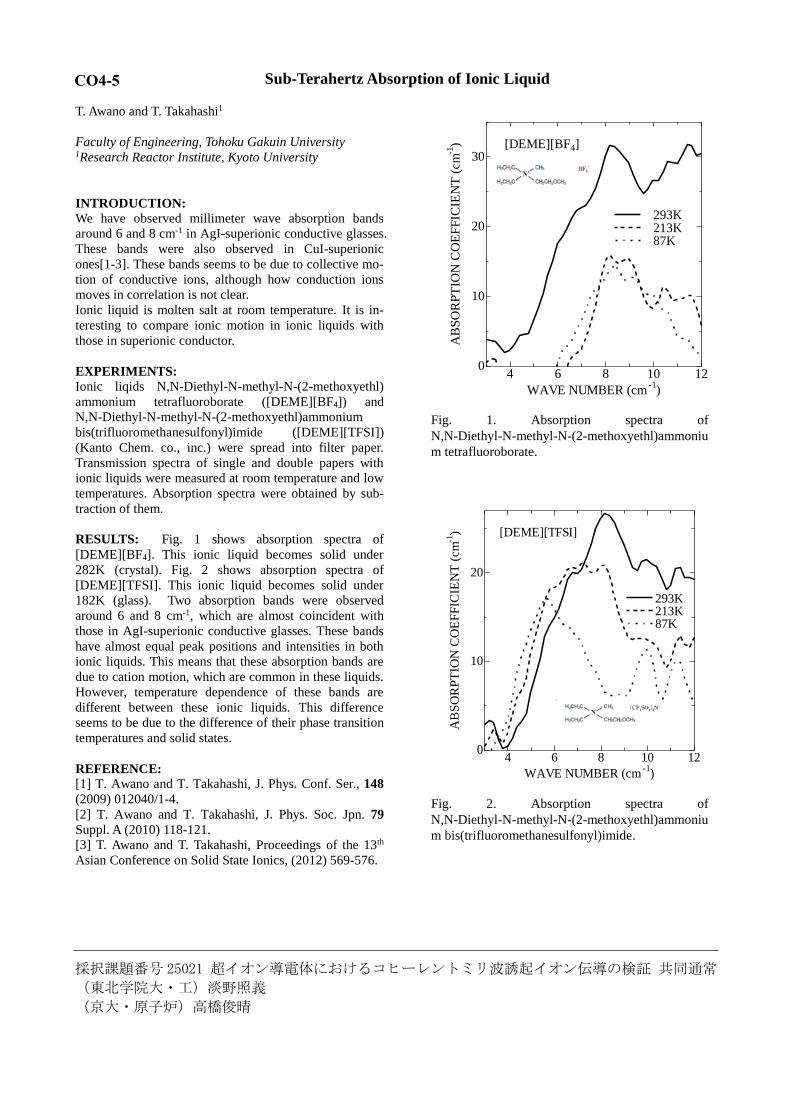
RESULTS: Fig. 1 shows absorption spectra of
[DEME][BF4]. This ionic liquid becomes solid under
282K (crystal). Fig. 2 shows absorption spectra of
[DEME][TFSI]. This ionic liquid becomes solid under
182K (glass). Two absorption bands were observed
around 6 and 8 cm-1, which are almost coincident with
those in AgI-superionic conductive glasses. These bands
have almost equal peak positions and intensities in both
ionic liquids. This means that these absorption bands are
due to cation motion, which are common in these liquids.
However, temperature dependence of these bands are
different between these ionic liquids. This difference
seems to be due to the difference of their phase transition
temperatures and solid states.
REFERENCE: [1] T. Awano and T. Takahashi, J. Phys. Conf. Ser., 148
(2009) 012040/1-4.
[2] T. Awano and T. Takahashi, J. Phys. Soc. Jpn. 79
Suppl. A (2010) 118-121.
[3] T. Awano and T. Takahashi, Proceedings of the 13th
Asian Conference on Solid State Ionics, (2012) 569-576.
4 6 8 10 120
10
20
AB
SO
RP
TIO
N C
OE
FF
ICIE
NT
(cm
-1)
WAVE NUMBER (cm-1
)
[DEME][TFSI]
293K213K87K
Fig. 2. Absorption spectra of
N,N-Diethyl-N-methyl-N-(2-methoxyethl)ammoniu
m bis(trifluoromethanesulfonyl)imide.
4 6 8 10 120
10
20
30
AB
SO
RP
TIO
N C
OE
FF
ICIE
NT
(cm
-1)
WAVE NUMBER (cm-1
)
[DEME][BF4]
293K 213K 87K
Fig. 1. Absorption spectra of
N,N-Diethyl-N-methyl-N-(2-methoxyethl)ammoniu
m tetrafluoroborate.
CO4-5

採択課題番号 25022 ガンマ線照射還元を利用した貴金属ナノ微粒子の創成 共同通常
(阪府大・工)堀史説、永田光一郎、堀達朗、小林直暉、岩瀬彰宏
(京大・原子炉)坂本雅昭
Synthesis of Metal Nanoparticles under the Gamma-ray Irradiation Field
F. Hori, K. Nagata, T. Hori, N. Kobayashi, A. Iwase and
M. Sakamoto2
Dept. of Mater. Sci., Osaka Prefecture University 1Research Reactor Institute, Kyoto University
INTRODUCTION: Metal nanoparticles have different
properties from bulk ones are known. Therefore, the
nanoparticles are excellent optical properties, thermal
properties, and so on. In particular, the development of
new functional nanoparticles with different properties
depending on the purpose is expected. Au nanoparticles
with rod shape have two surface plasmon resonance
(SPR) absorption peaks in the visible and infrared range.
Moreover, the multi component alloy nanoparticles may
have different characteristic features compared to that for
pure elemental nanoparticles. There are many reports for
synthesis and characterization of pure Au nanorods, but it
is difficult to control the size, aspect ratio and alloy
mixing structure for multi-alloy nanorods. On the other
hand, unique structural of nanoparticles have been
synthesized in metallic ions solutions under various kinds
of irradiation fields, such as ultrasonic, electron,
gamma-ray and heavy ion [1]. Au nanorods have often
been synthesized by the seed-mediated chemical
reduction method for Au ions in their water solution. We
have reported that synthesis of Au nanorods by using
gamma-ray irradiation without any seed materials [2]. In
this study, therefore, we tried synthesis of Au-Pd binary
alloy nanorod under gamma-ray irradiation reduction
field.
EXPERIMENTS: Aqueous solutions including
NaAuCl4・2H2O (Au3+ ion), silver nitrate, dilute sulfuric
acid, ascorbic acid and cetyl trimethyl ammonium
bromide (CTAB) were argon purged and sealed into
polystyrene vessel. They were irradiated by gamma-ray
from 60Co radioactive source with total dose of 6.0 kGy
at about 298 K (the first step: (a)), followed by the
adding of PdCl2 ・ 2NaCl ・ 3H2O (Pd2+ ion) and the
irradiation of the solution with total dose of 6.0 kGy
again (the second step: (b)). The dose rate was fixed to
5.3 kGy/h. Generated nanoparticles were investigated by
UV/vis absorption spectroscopy and transmission
electron microscope (TEM). UV–vis absorption spectra
were measured by using Shimadzu UV-2550
spectrophotometer in the wavelength range in 300–800
nm. Also, the structure and chemical analysis of
nanoparticles were examined by conventional TEM
JEOL JEM-200CX, 2000FX, and Scanning-TEM with
energy dispersive X-ray analysis (EDX) apparatus.
Samples for TEM observations were made by putting a
drop of colloidal solutions on a carbon film with a Mo
mesh and dried them in a vacuum.
RESULTS: Figure 1 shows that rod shape of
nanoparticles were fabricated by gamma-ray irradiation
for the solutions containing only gold ions and for after
added of palladium ions into them and irradiated
continually. The Au nanorods have an average length of
14 nm and an average aspect ratio is about 3. The
nanorods after Pd ion reduction have an average length
of 13 nm and an average aspect ratio is about 3. No
growth of nanorods can be observed between (a) and
(b). On the other hand, optical feature of these nanorods,
which is characterized by a SPR peak at 740 nm in
absorption spectra for Au nanorods, move to 700 nm.
As shown in Fig. 2, the result of EDX analysis clearly
shows that nanorod is constructed by Au nanorod
surrounded by thin Pd surface layers, even though the
size and aspect ratio does not change. Taking into
account for these results, SPR band of nanorods changes
only by coverd by 0.7 nm Pd layrs.
Acknowledgments
We would like to express great thanks to staff of
UBIQEN group at AIST for EDX-STEM analysis.
REFERENCES:
[1] N. Taguchi et al., Appl. Surf. Sci. vol.255 (2008) 164–166.
[2] A. Okamoto et al., Jap. J. Appl. Phys. 51 (2012) 1049–1053.
Fig. 2 EDX mapping for Au-Pd nanorods synthesized by two step -ray irradiation reduction.
Fig. 1 TEM images of (a) Au nanorods and (b) Au-Pd nanorods.
CO4-6

採択課題番号 25024 緊急時被ばく線量測定を目指した放射線誘起ルミネッセンスの 共同通常
基礎的研究
(原子力機構、核サ研)藤田博喜、(京大・原子炉)阪本雅昭、齊藤毅
Radiation-Induced Luminescence for Applying to Retrospective Dosimetry
H. Fujita, M. Sakamoto1 and T. Saito1
Nuclear Fuel Cycle Engineering Laboratories, JAEA 1Research Reactor Institute, Kyoto University
INTRODUCTION: An irradiated quartz emits radia-
tion induced luminescence such as thermoluminescence
(TL) and optically stimulated luminescence (OSL). The
luminescence phenomena have been used for retrospec-
tive dosimetry [1, 2] and dating of sediments, etc. How-
ever, the luminescence emission mechanism from Japa-
nese natural quartz has not yet been well explained. In
this study, the emission mechanisms of TL and OSL were
investigated in conjunction with various radia-
tion-induced phenomena after annealing treatments of
quartz samples, involving TL, OSL and electron spin
resonance (ESR) measurements.
EXPERIMENTS: Natural quartz grains (150~250 m)
were extracted from surface soils by a general treatment
of 6M hydrochloric acid (HCl), 6M sodium hydroxide
(NaOH) and concentrated hydrofluoric acid (HF) with
hand selection for the sake of elimination of feldspar
grains as low as possible under a microscope. The quartz
samples were annealed at 800ºC for 24 hours in an elec-
tric furnace. The annealed quartz samples were irradiated
a dose of 1 kGy with 60Co source at room temperature at
Kyoto University Research Reactor Institute (KURRI).
The irradiated sample was stored at room temperature for
one day to eliminate afterglow emission in dark room.
The ESR measurement was carried out using an ESR
spectrometer (Jeol Ltd., JES-TE 200) at room tempera-
ture and −196ºC, respectively. Prior to the ESR meas-
urements, the quartz samples were annealed for 1 min at
50ºC intervals ranging from 150 to 300ºC as preheat
treatment. After the ESR measurements, all luminescence
measurements were performed using a JREC automated
TL/OSL-reader system installed with a small X-ray irra-
diator (Varian, VF-50J tube). All preparations were car-
ried out under dim red light.
RESULTS: In this research, the ESR signals of
Ti-centers ([TiO4/H+]0, [TiO4/Li+]0 and [TiO4/Na+]0),
Al-centers and RT-centers were detected in the annealed
quartz samples. Both ESR signal intensities of Ti-centers
and Al-centers were decreased with the preheating tem-
peratures depended on their centers as shown in Fig.1. On
the other hand, intensities of RT-centers were disappeared
with the preheat treatment. Their results agreed to our
previous results.
It is suggested that Al-center and RT-center are
hole-trapped centers and Ti-centers are electron-trapped
centers. In TL glowcurve, some electron-trapped centers
should control peak position and some hole-trapped cen-
ter should control emission wavelength. In TL measure-
ment results, ultra-violet TL (UVTL) and red TL (RTL)
intensities integrated in all glowcurve area decreased with
preheating temperature. Finally, their TL emissions were
disappeared at 300ºC. The results agreed to tendency of
the Ti-center and Al-center intensities. On the other hand,
OSL intensity was not related to the tendency of the ESR
centers at all. The reason why the tendency of OSL inten-
sity showed different from the tendency of TL intensity
would be the re-trapping effect influenced by the preheat
treatment.
In this research, the luminescence emission mechanism
could not be identified. Therefore, further work is neces-
sary to identify luminescence mechanism using ESR
measurement and annealing experiment.
REFERENCES:
[1] H. Fujita et al., Radiation Measurements, 46 (2011)
565–572.
[2] Hiroki Fujita, Radiation Physics and Chemistry, DOI:
http://dx.doi.org/10.1016/j.radphyschem.2014.01.001.
Fig.1.
Tendency of ESR signal intensity with preheating
temperature.
CO4-7

Absorption Spectroscopy with the Coherent THz Radiation
from Linac Electron Beams
S. Okuda, H. Saito and T. Takahashi1
Radiation Research Center, Osaka Prefecture University 1Research Reactor Institute, Kyoto University
INTRODUCTION: The coherent transition radiation
(CTR) from electron bunches of a linear accelerator (lin-
ac) have continuous spectra in a submillimeter to milli-
meter wavelength range and extremely high
peak-intensities. The light sources using the CTR have
been applied to absorption spectroscopy [1-4]. However,
the number of such light sources is very limited. The light
source system using the CTR from the electron beams of
the 45 MeV L-band electron linac has been established at
KURRI [5]. The CTR light sources developed have been
applied to absorption spectroscopy especially for matters
with relatively strong light absorbance such as water.
In the present work the light path of the CTR light
source has been modified and absorption spectroscopy
has been carried out for water and aqueous solutions.
CHARACTERISTICS OF THE CTR: The CR is
emitted as a pulsed and polarized light. The pulse struc-
ture of the CR corresponds to that of the electron beam
from the linac. The light can produce the intense pulsed
electric field and would cause the excitation in a matter.
The spectrum of the CTR is determined by the micro-
pulse shape of the electron bunch.
EXPERIMENTAL METHOD: The experimental
configurations for the absorption spectroscopy are sche-
matically shown in Fig. 1. The output CTR light from a
Mirror system
Sample
Mirror system
Detector
Lock-in Amp.
Linac trigger
Interferometer
Experimental room Linac room
Shielding wall
Light Source
Accelerator
Collimator
Fig. 1. Schematic diagram showing the configurations
for absorption spectroscopy using the CTR.
light source chamber was transported out from the accel-
erator room. The spectrum of the light after passing
through the sample was measured with a Martin-Puplett
type interferometer and a liquid-He-cooled silicon bo-
lometer. The sample was located on the light path be-
tween the interferometer and the detector [5]. The light
was focused at a light collimator 8 mm in diameter lo-
cated before the sample. In this experiment the diameter
of the light after the sample was measured and the sample
holder was modified not to interrupt the transmission of
light through the holder.
The spectrum was sufficiently stable during the meas-
urements within ±1-1.5% in a wavenumber range of 3-13
cm-1. The wavenumber resolution was 0.2 cm-1. The de-
tails of the measurements are described in ref. 5.
The samples were water and aqueous solutions of
NaCl and glucose.
RESULTS AND DISCUSSION: The wavenumber
dependence of the transmittance of light measured for
water obtained by averaging over four measurements is
shown in Fig. 2 along with the schematical configurations
around the sample. The thickness of the water sample
was about 120 m, which was sandwiched with two an-
hydrous quartz plates 3 mm thick.
0
0.1
0.2
0.3
0.4
0.5
3 5 7 9 11 13
Tran
smit
tan
ce
Wavenumber [cm-1 ]
Light
Anhydrous quartz
Sample
Fig. 2. Wavenumber dependence of the transmittance of
the CTR light for water and the schematic configurations
around the sample.
The periodical oscillation on the curve can be attribut-
ed to the interference between the incident and reflected
lights as shown in this figure. The refractive index and
the absorbance of water can be obtained by analyzing the
results.
The new system for the pump-probe experiments by
using the 16 MeV S-band linac in Osaka Prefecture
Uiversity has been developed [6]. This will be applied to
investigating the transient phenomena induced by the
pulsed CTR or electron beams using the CTR as probe.
REFERENCES: [1] T. Takahashi et al., Rev. Sci. Instrum. 69 (1998) 3770.
[2] K. Yokoyama, Y. Miyauchi, S. Okuda, R. Kato and T.
Takahashi, Proc. 20th Int. Free-Electron Laser Conf.
(1998, Williamsburg, USA) II 17-18.
[3] S. Okuda, M. Nakamura, K. Yokoyama, R. Kato and
T. Takahashi, Nucl. Instrum. Meth. A445 (2000) 267.
[4] S. Okuda et al., Radiat. Phys. Chem. 75 (2006) 903.
[5] S. Okuda and T. Takahashi, Infrared Phys. Technol. 51 (2008) 410.
[6] S. Okuda, T. Kojima, R. Taniguchi, Proc. XXV Linear Accelerator Conf. (2010, Tsukuba, Japan) 79-81.
採択課題番号 25032 ライナック電子線からのコヒーレントテラヘルツ放射による 共同通常
吸収分光
(阪府大・地域連携)奥田修一、斉藤秀輝(京大・原子炉)高橋俊晴
CO4-8

共同通常 採択課題番号 25033 メスバウワ分光法による重い電子系の解析
(京大・原子炉)瀬戸誠、北尾真司
(慶應義塾大・理工)藤乘優治郎、中村哲朗、的場正憲、神原陽一
57Fe Mössbauer Studies of Superconducting Sr2VFeAsO3-d and
Heavy Fermion CeRu1-xFexPO
Y. Tojo, T. Nakamura, M. Matoba, S. Kitao1, M. Seto
1 and Y. Kamihara
Department of Applied Physics and Physico-Informatics,
Keio University 1Research Reactor Institute, Kyoto University
INTRODUCTION: A hyperfine fields Bhf experienced
by nuclei of atoms at crystallographic sites in magnetic
and/or antiferromagnetic metals are of interest in view
point of hyperfine interactions and important for their use
in the determinations of nuclear magnetic dipole mo-
ments by a variety of methods including those based on
low-temperature nuclear orientation. Guang-Han Cao et
al reported that Sr2VFeAsO3-d is an FeAs-based super-
conductor, which reveals antiferromagnetic under 150 K
originating in local d-electron moments of vanadium, and
the superconducting transition temperature Tc is 24 K.[1]
In Sr2VFeAsO3-phase, surplus electrons that come from
oxygen defects in block layers become conduction elec-
trons in FeAs layers, which turn into cooper pairs in su-
perconducting phase. In the meantime, C. Krellner et al
reported that CeRuPO is a heavy fermion, which reveals
ferromagnetism under 15 K.[2] Our group reported that
CeFePO is a paramagnetic heavy fermion, which has no
magnetic transition down to 2 K.[3]
In this report, element-specific magnetism and electron-
ic phase of Fe sublattice in Sr2VFeAsO3-d are elucidated
using 57
Fe Mössbauer spectroscopy.[4] We also demon-
strate the several physical properties near ferromagnetic
quantum critical point applying 57
Fe Mössbauer spec-
troscopy to the samples of x=0.25, 0.50, 0.80, 0.85, 0.87,
0.95 of CeRu1-xFexPO.[5]
EXPERIMENTS: Polycrystalline samples of
Sr2VFeAsO3-d were prepared by the solid-state reac-
tions in a sealed silica tube using dehydrated SrO, FeAs,
V2O5, V as starting materials, reported previously.[6]
Polycrystalline sample of CeFe1-xRuxPO (x = 0.00, 0.05,
0.10, 0.20, 0.25, 0.50, 0.75) was prepared by a two-step
solid-state reaction, similar to LnFePO (Ln = La, Ce)[7,8]
using dehydrated CeO2 and two mixtures of compounds,
Ce-2Fe-2P and Ce-2Ru-2P powders as starting materials.
The dehydrated CeO2 was prepared by heating commer-
cial CeO2 powder (Nippon Yttrium; 99.9 wt.%) at 800 °C
for 5 h in air. To obtain Ce-2Fe[Ru]-2P powder, Ce
(Nippon Yttrium; 99.9 wt.%), Fe (Kojundo Chemical
Laboratory; 99.99 wt.%) [Ru (Nilaco; 99.9+ wt.%)], and
P (Kojundo Chemical Laboratory; 99.999 wt.%) were
mixed in a stoichiometric ratio of 1:2:2 and heated at
400 °C for 40 h and 800 °C for 10 h in an evacuated sili-
ca tube. Then, a mixture of the three powders (dehydrated
CeO2, Ce-2Fe-2P, and Ce-2Ru-2P powders) was pressed
into pellet and heated in doubly sealed silica tubes at
~1300 °C for 40 h. All procedures were carried out in an
Ar-filled glove box (MIWA Mfg; O2, H2O < 1 ppm). The
first process was effective in preventing the selective
oxidation of the Ce metal. The silica tube in the second
heat treatment was filled with 0.16-0.2 atm pressure of
high-purity Ar gas at room temperature to prevent an im-
plosion of the silica tube. Ru content x is determined by
nominal value. The crystal phase of the obtained product
was examined by powder X-ray diffraction
(XRD;RigakuRINT-2500) using CuK radiation. Almost
all the diffraction peaks are assigned to the CeFe1-xRuxPO
phase. Electrical resistivity measurements were per-
formed at 2–300 K by a dc four-probe technique using
silver paste as electrodes. Magnetization measurements
were performed for polycrystalline samples using a
Quantum Design magnetic properties measurement sys-
tem (MPMS). The 57
Fe Mössbauer (MS) experiment on
the two series of compounds, Sr2VFeAsO3-d and
CeRu1-xFexPO, was performed with conventional 57
Fe
MS equipment using 14.4 keV -rays from a 57
Co source
in an Rh matrix.
RESULTS: 57
Fe MS to the samples of d=0.20, 0.50,
0.70 of Sr2VFeAsO3-d were measured and analyzed for
obtaining quantitative value of Bhf. As a result, the ex-
istence of spin density wave phase near superconducting
phase was clarified and elucidated. The result indicates
that spin fluctuations developed at the boundary of the
spin density wave may be driving force behind super-
conductivity in Sr2VFeAsO3-d. 7Fe MS of the samples of CeRu1-xFexPO were measured
and analyzed for obtaining both of isomer shift (IS) and
Debye temperature (D). Both of IS-x and D-x curves
show an anomaly at quantum critical points x~0.13. The-
se results indicate that the dimensionality of the system is
tuned from 3 to 2 by Fe-doping driving to paramagnetic
phase, and that Kondo breakdown occurs at the quantum
critical point reconstructing Fermi surface. [9] Though
there are reports that demonstrate anomaly of physical
properties at antiferromagnetic quantum critical point,
this is the first report that demonstrates anomaly of (IS &
D) at ferromagnetic quantum critical point using 57
Fe
MS.
REFERENCES: [1] G. H. Cao et al., Phys. Rev. B 82, 104518 (2010).
[2] C. Krellner et al., Phys. Rev. B 76, 104418 (2007).
[3] T. Nakamura et al., J. Phys. Soc. Jpn. 81, 064714
(2012).
[4] Y. Tojo, Y. Kamihara et al., unpublished.
[5] T. Okano, T. Nakamura, Y. Kamihara, M. Matoba et
al., unpublished.
[6] Y. Tojo et al., J. Appl. Phys. 113, 17E157 (2013).
[7] Y. Kamihara et al., J. Am. Chem. Soc. 128, 10012
(2008).
[8] Y. Kamihara et al., J. Phys. Chem. Solid 69, 2916(2008).
[9] S. Kitagawa et al., J. Phys. Soc. Jpn. 82, 033704
(2013).
CO4-9
採択課題番号 25034 高エネルギー粒子線による有機系太陽電池の動的挙動に関する研究 共同通常
(岡山大・保)笈田将皇(東京理科大・理工)中田一弥(京大・原子炉)櫻井良憲
Characterizations of Dynamic Behavior for Organic Solar Cells under High-Energy Photons and Secondary Electrons by 60Co Beams
M. Oita, K. Nakata1 and K. Sakurai2
Graduate School of Health Sciences, Okayama Universi-
ty 1Department of Applied Biological Science, Faculty of
Science and Technology, Tokyo University of Science 2Research Reactor Institute, Kyoto University
INTRODUCTION: The development of solar cells has
been expected to make important contributions of the
solution of the energy problem. Photovoltaics has been
dominated by solid-state junction devices, usually made
from crystalline or amorphous silicon. In recent years,
the possible advantages of organic semiconductors are
remarked as low cost fabrication and roll-to-roll manu-
facturing on flexible substrat [1-4]. Many applications
of these devices are expected to use for not only energy
solutions but for radiation dosimetry. Si-based semi-
conductor detectors are often used for medical applica-
tions of radiation dosimetry [5,6]. Therefore, organic
solar cells (OSC) would be possible for the evaluation of
radiation dose such as radiation examinations and radio-
therapy. In this work, the authors investigated the deg-
radations and tolerance of two types of OSCs compared
to single-crystal Si-based solar cells (Si-SCs) under
high-energy secondary electrons by 60Co beams.
EXPERIMENTS: The samples used in this work are
Si-SCs (#0906005B, Mimatsu Audio Corp, Japan) and
OSCs. The surfaces of Si-SCs are coated with epoxy
resin. OSCs fabricated by TiO2 photoelectrodes which
were prepared by screen-printing TiO2 paste
(Ti-Nanoxide T/SP, Solaronix SA) on fluorine-doped
indium tin oxide/glass (FTO) substrates (Solaronix SA).
The TiO2 photoelectrodes were annealed at 200 °C for 10
min, and then at 500 °C for 30 min, resulting in anatase
films. Multiple heating steps were performed to avoid
cracking of the TiO2 layer. The above TiO2 photoelec-
trode was soaked in a solution of dyes, which were deri-
vatized with ruthenium (N719) [7] or metal-free indoline
(D149) [8] and then dried under an air flow. A
50-μm-thick Himilan (R) film was used to assemble the
TiO2 electrode with a Pt-sputtered FTO electrode (the
thickness of the Pt layer was 100 nm). The space be-
tween the electrodes was filled with a mixed electrolyte
in acetonitrile. All of the samples were irradiated by 60Co beams ranged from 50 Gy to 150 kGy at KUR 60Co
Gamma-ray Irradiation facility. To evaluate the degra-
dation of the samples, the conversion efficiencies and
other electrical characteristics were measured by a solar
simulator (YSS-T150A, YAMASHITA DENSO Corp.).
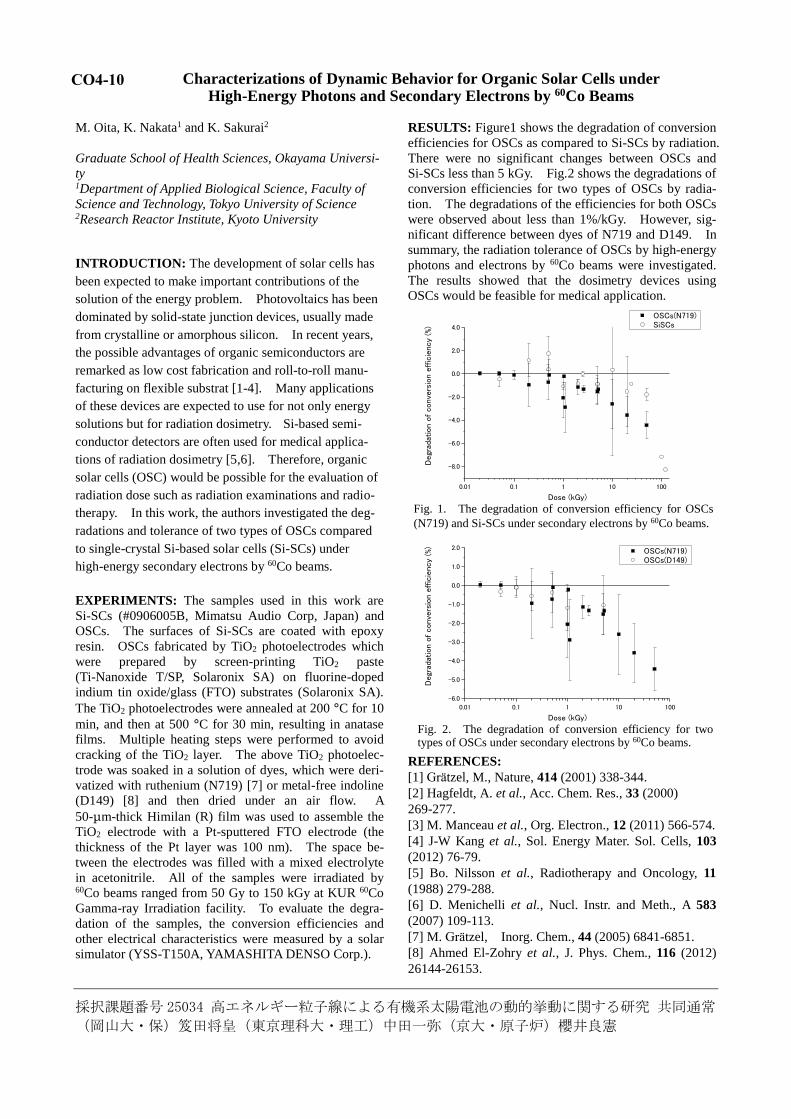
RESULTS: Figure1 shows the degradation of conversion
efficiencies for OSCs as compared to Si-SCs by radiation.
There were no significant changes between OSCs and
Si-SCs less than 5 kGy. Fig.2 shows the degradations of
conversion efficiencies for two types of OSCs by radia-
tion. The degradations of the efficiencies for both OSCs
were observed about less than 1%/kGy. However, sig-
nificant difference between dyes of N719 and D149. In
summary, the radiation tolerance of OSCs by high-energy
photons and electrons by 60Co beams were investigated.
The results showed that the dosimetry devices using
OSCs would be feasible for medical application.
0.01 0.1 1 10 100
-8.0
-6.0
-4.0
-2.0
0.0
2.0
4.0
OSCs(N719) SiSCs
Degr
adat
ion
of
conv
ers
ion e
ffic
ienc
y (%
)
Dose (kGy)
0.01 0.1 1 10 100
-6.0
-5.0
-4.0
-3.0
-2.0
-1.0
0.0
1.0
2.0 OSCs(N719) OSCs(D149)
Degr
adat
ion
of
conv
ers
ion e
ffic
ienc
y (%
)
Dose (kGy)
REFERENCES:
[1] Gratzel, M., Nature, 414 (2001) 338-344.
[2] Hagfeldt, A. et al., Acc. Chem. Res., 33 (2000)
269-277.
[3] M. Manceau et al., Org. Electron., 12 (2011) 566-574.
[4] J-W Kang et al., Sol. Energy Mater. Sol. Cells, 103
(2012) 76-79.
[5] Bo. Nilsson et al., Radiotherapy and Oncology, 11
(1988) 279-288.
[6] D. Menichelli et al., Nucl. Instr. and Meth., A 583
(2007) 109-113.
[7] M. Gratzel, Inorg. Chem., 44 (2005) 6841-6851.
[8] Ahmed El-Zohry et al., J. Phys. Chem., 116 (2012)
26144-26153.
Fig. 1. The degradation of conversion efficiency for OSCs
(N719) and Si-SCs under secondary electrons by 60Co beams.
Fig. 2. The degradation of conversion efficiency for two types of OSCs under secondary electrons by 60Co beams.
CO4-10

採択課題番号 25045 核融合炉トリチウム増殖材料および中性子増倍材料からの 一般通常
トリチウムの放出挙動の解明
(秋田大・工学資源)宗像健三、和田考平、中村彩乃 (九大・工学研究員)竹石敏治
10000ppm
H2/N2Gas
I.C.1I.C.2
Bubbler
Cold Trap
(Molecular sieve-5A)
1000ppmH2/N2gas
or dry N2 gas
Sample BedCuO
Volumes of ionization
chambers are 66cm3 each other.
10000ppm
H2/N2Gas
I.C.1I.C.2
Bubbler
Cold Trap
(Molecular sieve-5A)
1000ppmH2/N2gas
or dry N2 gas
Sample BedCuO
Volumes of ionization
chambers are 66cm3 each other.
Fig.1 Schematic diagram of experimental apparatus
Fig. 2 Tritium release curves
(a) KALOS31 Li4SiO4 ceramic breeder material
(b) KALOS34C Li4SiO4 ceramic breeder material
Tritium Release from Li4SiO4 Ceramic Breeder Materials Prepared by
Melt-Spraying Method
K. Munakata, K. Wada, A. Nakamura and T. Takeishi1
Department Faculty of Engineering and Resource Sci-
ence, Akita University 1Graduate School of Engineering Science, Kyushu Uni-
versity
INTRODUCTION: Tritium release from new-types of
Li4SiO4 ceramic breeder material was investigated. The
Li4SiO4 breeder materials were prepared by the fabrica-
tion process called melt-spraying method. Tritium release
curves were obtained in a series of experiments carried
out using the out-of-pile temperature programmed de-
sorption (TPD) technique. Tritium release curves ob-
tained for solid breeders were compared.
EXPERIMENTS: The Li4SiO4 ceramic breeder materi-
als (KALOS31 and KALOS34C) were prepared and
supplied by Karlsruhe Institute of Technology (KIT).
These ceramic breeders encapsulated in a quartz tube
were irradiated in Kyoto University Research Reactor
(KUR) in the thermal neutron with the flux of 5. 51012
cm-2s-1 in the He atmosphere for 30 min.
Release curves of bred tritium from the breeder peb-
bles were obtained using the out-of-pile temperature
programmed desorption techniques. The experimental
apparatus is schematically shown in Figure 1. The vol-
umes of ionization chambers are 66 cc, which corre-
sponds to residence time, the chambers [volume] / [flow
rate], 40 seconds. The first ionization chamber was used
to measure the total tritium (HT and HTO) concentration
and the second chamber placed after a water bubbler was
used to measure that of molecular form tritium (HT) in
the purge gas, respectively.
Water vapor was introduced to the purge gas just be-
fore the inlet of the first ionization chamber in order to
minimize the memory effects on the ionization chambers.
Dry argon gas or argon gas containing hydrogen was
used as the sweep gas to investigate the effect of differ-
ence in sweep gas compositions.
RESULTS: Figure 2 shows comparison of experi-
mental tritium release curves for the Li4SiO4 sample
(KALOS31 and KALOS34C) irradiated for 30 minutes
with neutron flux with 5. 51012 cm-2s-1 [1/cm2s]. The
sweep gases of 1,000 ppm H2/Ar gas were used in the
experiments. Peak tritium concentrations were observed
at 400 K for KALOS31, whereas it was observed at 800
K for KALOS34C, Comparison of Figs. 2(a) and (b) in-
dicates that tritium was released at lower temperatures
from the KALOS31 breeder material.
CO4-11

Polarization Degree of Linearly Polarized Coherent Transition Radiation Emitted from Wire-Grid Radiators
T. Takahashi
Research Reactor Institute, Kyoto University
INTRODUCTION: In recent years various types of coherent radiation emitted from a short bunch of relativistic electrons have attracted a considerable attention as a bright light source in the THz-wave and millimeter wave regions for the spectroscopic purpose. Coherent transition radiation (CTR), which is emitted from a boundary between two media, is one of such a coherent light source. The electric vector of transition radiation (TR) emitted from a metallic screen is axially symmetric with respect to the trajectory of an electron beam, whereas synchrotron radiation has linear polarization along an electron orbit. Therefore, CTR is usually utilized as a non-polarized light source in the present spectroscopic application. However, circularly polarized light has been useful in the circular dichroism spectroscopy. Shibata et al. has developed a technique of generation of circularly polarized millimeter-wave radiation with the phase difference between the forward TR and the backward one [1]. However, it was difficult to control the polarization degree in that technique. In my previous report [2] the property of CTR emitted from a pair of wire-grid radiators with the different polarization was experimentally investigated in order to develop a new technique of generation of circular polarized THz radiation. In this report the polarization degree has been experimentally investigated in order to confirm the purity of polarization. EXPERIMENTAL PROCEDURES: The experiment was performed at the coherent radiation beamline [3] at the L-band linac of the Research Reactor Institute, Kyoto University. The energy, the width of the macro pulse, and the repetition rate of the electron beam were 42 MeV, 47 ns, and 60 Hz, respectively. The average current of the electron beam was 3 A. The schematic arrangement of the experiment is shown in Fig. 1. As the radiator of forward and backward CTR, wire-grid polarizers 10 m thick with 25 m spacing were used, respectively. The direction of grid of the first polarizer was horizontal and that of the second one was vertical. The CTR was detected by a liquid-helium-cooled Si bolometer. In order to measure the polarization degree a wire-grid polarizer with a rotary holder was used in front of the detector. RESULTS: The distance between the forward and
backward radiators is usually called the emission length. The polarization degree was calculated using the horizontal component (IH) and the vertical one (IV) of observed CTR intensity as
.
The results are shown in Table 1 with changing the emission length. The observed CTR was not perfectly polarized (PL=1). The reason seems to be the stray light in the vacuum chamber. However, the decrease of polarization degree is not affected to the development of the circular polarization because the rate of the stray light is very low and the observed polarization degree was independent of the emission length. REFERENCES: [1] Y. Shibata et al., Rev. Sci. Instrum. 72 (2001) 3221. [2] T. Takahashi, et al., KURRI-PR 2012 CO4-15. [3] T. Takahashi et al., Rev. Sci. Instrum. 69 (1998)
3770.
Table 1. The polarization degree of observed CTR.
Emission Length Polarization Degree
200 mm 0.85
500 mm 0.86
780 mm 0.86
採択課題番号 25054 コヒーレント遷移放射を用いたミリ波領域円偏光制御と 共同通常
近接場分光法に関する研究
(京大・原子炉)高橋俊晴、窪田卓見
Fig.1. The schematic layout of the experiment.
Accelerator Room
Experimental Room
Shield Wall
fromL-band Linac
electronbeam
Ti window
Interferometer
Al foil
M1
M2
M3
M4
1st WG 2nd WG
Polarizer
Detector
CO4-12

採択課題番号 25055 高融点金属における水素吸蔵特性に及ぼす 共同通常
高エネルギー粒子線照射効果
(九大・応力研)徳永和俊、荒木邦明(九大・総理工)尾崎浩詔(京大・原子炉)徐 虬、佐藤紘一
Effects of High Energy Particle Irradiation on Hydrogen Retention in
Refractory Metals
K. Tokunaga, M. Matsuyama1, S. Abe
1, S. Nagata
2,
B. Tsuchiya3, M. Tokitani
4, H. Osaki
5, K. Araki,
T. Fujiwara, M. Hasegawa, K. Nakamura, K. Hanada,
H. Zushi, Q. Xu6 and K. Sato
6
Research Institute for Applied Mechanics, Kyushu Uni-
versity 1Hydrogen Isotope Research Center, University of Toya-
ma 2Institute for Materials Research, Tohoku University
3Faculty of Science and Technology, Meijo University
4National Institute for Fusion Science
5Interdisciplinary Graduate School of Engineering Sci-
ences, Kyushu University 6Research Reactor Institute, Kyoto University
INTRODUCTION: It is of importance to clarify phe-
nomena of implantation, retention, diffusion and permea-
tion of tritium on surface of the armor materials of the
first wall/blanket and the divertor on fusion device from a
viewpoint of precise control of fuel particles, reduction of
tritium inventory and safe waste management of materi-
als contaminated with tritium. Refractory metals such as
tungsten is potential candidate for an armor of the first
wall and the divertor plate of the fusion reactor because
of its low erosion yield and good thermal properties. The
armor material will be subjected to heavy thermal loads
in the steady state or transient mode combined with high
energy neutron irradiation that will cause serious material
degradation. In addition, high energy runaway electrons
would bombard the armor materials along the equatorial
plane in fusion device. It is considered that these cause
radiation damage and enhance tritium retention. In the
present works, tritium exposure experiments have been
carried out for long term installed samples on a high
temperature plasma experimental device. In addition,
high energy electrons irradiation has been carried out to
investigate effects of high energy electrons irradiation on
tritium retention of tungsten using LINAC in Research
Reactor Institute, Kyoto University.
EXPERIMENTS: Samples have been installed on
vacuum chamber of spherical tokamak QUEST in Kyu-
shu University. The vacuum vessel, and an armor of di-
vertor and center stack of QUEST are made of SUS316L
and tungsten, respectively. After the plasma discharge
experiments, the samples have been examined using XPS,
RBS and ERD. In addition, tritium exposure experiments
have been carried out using a tritium (T) exposure device
in University of Toyama. Pressure of the T gas was 1.3
kPa and T exposure was kept for 4 h in all examinations.
T concentration in the gas was about 5 %. After thermal
exposure to T gas, T amount retained in surface layers of
the sample was evaluated by -ray-induced X-ray spec-
trometry (BIXS) and imaging plate (IP) measurements.
RESULTS: Results from XPS analyses on the
SUS316L sample which was installed in the 3rd cycle
(from 2009/11 to 2010/4) showed that re-deposited layer
was formed and main composition was C. BIXS neas-
urement which temperatures of pre-heating and T expo-
sures were 400 oC and 350
oC, respectively showed that
Fe(K) etc. peaks originated from composition of
SUS6316L in addition to Ar(K) peak, originated from
ray on T near surface of SUS316L, were detected. IP
measurement indicated that amount of T on the
re-deposied sample at RT and 350 oC exposure was 4.6
and 2.5 times higher that that of non-exposure sample in
QUEST. On the other hand, re-deposited layer, which
main composition was Fe, Cr, W and O, was formed on
SUS316L sample which was installed in the 7 th cycle
(from 2011/10 to 2012/4). Amount of T on the
re-deposited sample which temperatures of pre-heating
and T exposures were both 100 oC (same temperature of
wall during plasma discharge experiment in QUEST) was
8.5 times higher tthat of non-exposure sample in QUEST.
In addition, results from T exposure experiment is sum-
marized in Fig. 1. These results indicate that formation on
re-deposited layer enhances T retention, and amount of T
must be evaluated taking into account the re-deposited
layer. In addition, high energy electrons with 10 MeV
have been irradiated on two kinds of tungsten samples
using LINAC in Research Reactor Institute, Kyoto Uni-
versity. Total fluence of electron was 4.6 x 10²³
/m2. Trit-
ium exposure experiment will be carried out next fiscal
year.
Fig. 1. Amount of T retention of various sample. (a) Plasma un-exposed sample, pre-heating:23
oC, and T
exposure : 23oC.
(b) 3rd plasma exposed sample, pre-heating:23oC, T
exposure : 23oC.
(c) Plasma un-exposed sample, pre-heating:400oC, and T
exposure : 350oC.
(d) 3rd plasma exposed sample, pre-heating:400oC, T
exposure : 350oC.
(e) Plasma un-exposed sample, pre-heating:100oC, and T
exposure : 23oC.
(f) 7th plasma exposed sample, pre-heating:100oC, T
exposure : 100oC.
(g) 7th plasma exposed sample after sputtering, pre-heating:100
oC, T exposure : 100
oC.
CO4-13

採択課題番号 25062 かご型シルセスキオキサン骨格を有する種々の金属 共同通常
錯体へのガンマ線照射効果
(九大院・理)岡上吉広、横山拓史(九大・基幹教育院)大橋弘範(九大院・理)吉村富治郎
γ-Ray Irradiation Effects for Various Metal Complexes with Cage-Type Silsesquioxane
Y. Okaue, T. Yokoyama, H. Ohashi1 and F. Yoshimura
Department of Chemistry, Faculty of Sciences, Kyushu University 1Faculty of Arts and Science, Kyushu University
INTRODUCTION: Upon 60Co γ-ray irradiation at room temperature on Q8M8 ([(CH3)3SiO]8(SiO1.5)8) with a double four-ring (D4R) cage structure as illustrated in Fig. 1, hydrogen atom is encapsulated in the D4R cage and is stable for periods of several years. The encapsulation of hydrogen atom can be confirmed by ESR spectroscopy. Hydrogen atom encapsulated in D4R cage of silsesqui-oxane interacts magnetically with paramagnetic oxygen molecules outside D4R cage to change ESR signal inten-sity and saturation behavior[1]. The purpose of this study was the preliminary research for interactions be-tween metal ions and encapsulated hydrogen atom within single molecule by introducing coordination sites for metal ion to silsesquioxane with D4R cage structure. In this study, Schiff base ligand (L1 in Fig. 1) was prepared by condensation of T8
iBu7Ap and salicylaldehyde.
EXPERIMENTS: Various metal complexes of L1 were synthesized as follows: In the presence of excess triethylamine, metal acetate (Mn(II), Co(II), Ni(II), Cu(II), Zn(II)) and L1 were stirred in methanol at 60 °C for 2 h. The resulting solution was concentrated under reduced pressure and cooled to room temperature. Powder with characteristic color for the aimed metal complex was obtained. In the case of oxovanadium(IV) complex, oxovanadium(IV) sulfate was used as metal source instead of metal acetate. Characterizations were made by IR spectroscopy, 1H NMR spectroscopy, and elemental analyses. Powder samples of metal complex-es were irradiated with γ-ray under air at room tempera-ture in 60Co γ-Ray Irradiation Facility at Kyoto Universi-ty Research Reactor Institute. Irradiated samples were recrystallized from hexane. X-band ESR spectra for the recrystallized powder samples under air or nitrogen at-mosphere were measured on JEOL JES-FA200 spec-trometer at room temperature.
RESULTS: All metal complexes were obtained as
M(L1)2 (M = V(IV)O, Mn(II), Co(II), Ni(II), Cu(II), Zn(II)). The colors and yields for these metal complex-es were listed in Table 1.
Table 1. Colors and yields for M(L1)2 Metal Color Yield / %
V(IV)O green white 54 Mn(II) brown 70 Co(II) yellow 68 Ni(II) light green 79 Cu(II) dark green 77 Zn(II) yellowish white 54
ESR spectra of all metal complexes showed the charac-teristic two hyperfine lines separated with about 50 mT due to hydrogen atom nucleus attributed to the encapsu-lated hydrogen atom in the D4R cage of silsesquioxane unit. For example, ESR spectrum of the irradiated Ni(L1)2 was shown in Fig. 2. In the case of ESR spec-trum for the irradiated VO(L1)2 or Cu(L1)2, typical spec-tral pattern due to metal ion (V(IV) or Cu(II)) was shown and the signals for the encapsulated hydrogen atom were very small. Under nitrogen atmosphere, ESR signals due to the encapsulated hydrogen atom were observed for the irradiated metal complexes except VO(L1)2 and Cu(L1)2. In hexane solution, the signals due to the en-capsulated hydrogen atom were also shown under air and nitrogen atmosphere for the irradiated metal complexes except VO(L1)2 and Cu(L1)2. From these results, it was concluded that three types of interactions between metal ions and encapsulated hydro-gen atom were observed: 1) Large interaction for para-magnetic VO(L1)2 and Cu(L1)2, 2) Small interaction for paramagnetic Mn(L1)2 and Co(L1)2, 3) No interaction for diamagnetic Ni(L1)2 and Zn(L1)2.
REFERENCE: [1] R. Sasamori, Y. Okaue, T. Isobe and Y. Matsuda,
Science, 265 (1994) 1691-1694.
Fig. 2. ESR spectrum of irradiated Ni(L1)2. Magnetic Field / mT
286 336 386
Fig. 1. D4R cage structure of silsesquioxane.
Si
O
Si
O Si
O
SiO
O Si OSi
OSi
O
O
R1 R1
R1
R2R1
R1
O
OSi O
R1
R
Q8M8 ; R1, R2 = OSi(CH3)3
L1 ; R1 = CH2CH(CH3)2R2 =
T8iBu7Ap ; R1 = CH2CH(CH3)2
R2 = CH2CH2CH2NH2
N
HO
CO4-14

採択課題番号 25069 核融合炉トリチウム増殖材中トリチウムの移行過程に及ぼす照射効果 共同通常
(静岡大・理・放射研)奥野 健二、大矢 恭久、小林 真、内村 大道、戸田 健介、佐藤 美咲
(京大・原子炉)山名 元、藤井 俊行、上原 章寛、徐 虬
Dependence of Irradiation Damage Density on
Tritium Migration Behaviors in Li2TiO3
K. Okuno, Y. Oya, M. Kobayashi, H. Uchimura, K. Toda,
M. Sato, T. Fujii1 and H. Yamana1
Graduate School of Science, Shizuoka University 1Research Reactor Institute, Kyoto University
INTRODUCTION:
For the development of D-T fusion reactors, it is im-
portant to establish an effective fuel recycling system
and a comprehensive model of tritium (T) migration
processes in solid T breeding materials. In the test
blanket module for ITER, lithium titanate (Li2TiO3) is
thought to be one of candidates as T breeding materi-
als. T trapping/detrapping by irradiation damages
would make a large influence on T migration with in-
creasing neutron fluence. In this study, T release be-
havior for Li2TiO3 with various neutron fluences were
studied by means of Thermal Desorption Spectroscopy
(TDS). The effect of purge gas condition was also
examined to demonstrate the actual tritium recovery
environment in fusion reactor.
EXPERIMENTAL:
Powder of Li2TiO3 purchased from Kaken Co. was
used as samples. The Pn-2 was used to irradiate by
thermal neutron with the fluence of 3.3 x 10¹⁴ (sample
A), 3.3 x 10¹⁵ (sample B), 1.7 x 10¹⁶ (sample C), 3.3 x
1016 (sample D) n cm-2 at the Kyoto University Re-
search Reactor Institute (KURRI). The other samples
were introduced into the inner side of reactor, namely
the core region of reactor for higher neutron fluence
(Long Irradiation, LI), where the neutron fluence was
2.2 × 10¹⁹ n cm−2 (sample E). After neutron irradiation,
the density of irradiation damages introduced in
Li2TiO3 by neutron irradiation, was measured by Elec-
tron Spin Resonance (ESR) at liquid nitrogen temper-
ature. Out-of-pile T release experiments were per-
formed in T-TDS system at Shizuoka University.
RESULTS&DISCUSSION:
The irradiation damages of F+-centers and
O−-centers were formed by neutron irradiation, and
their damage densities were increased with increasing
neutron fluence. T release temperature was clearly
shifted toward higher temperature side with increasing
neutron fluence, i.e. increasing damage density. The
rate determining process for tritium release was clearly
changed, depending on the damage density. T release
was mainly controlled by T diffusion process in crys-
talline grain of Li2TiO3 at lower neutron fluence. The
apparent T diffusivity was reduced as the damage den-
sity in Li2TiO3 increased due to the introduction of T
trapping/detrapping sites for diffusing T. Therefore, T
trapping/detrapping processes began to control the
overall T release with further damage introductions as
the amount of T trapping sites increased enough to trap
most of T in Li2TiO3. The kinetics analysis of T release
for highly damaged Li2TiO3 showed that the rate de-
termining process of T release was the detrapping
process of T formed as hydroxyl groups. The rate of T
detrapping as hydroxyl groups was determined by the
kinetic analysis, and was comparable to T release ki-
netics for Li2O, LiOH and Li4TiO4. The dangling oxy-
gen atoms (O−-centers) formed by neutron irradiation
would strongly contribute on the formation of hydrox-
yl groups. The efficiency of T trapping/detrapping by
the dangling oxygen atoms was clearly increased with
increasing damage density due to the stabilization of
damages by neighboring irradiation damages and/or
the lithium burn-up which produces lithium vacancy
acting as a pass way of T to the dangling oxygen at-
oms.
300 400 500 600 700 800 9000
4
8
12
Sample A (x 1)
Sample B (x 1/10)
Sample C (x 1/50)
Sample D (x 1/100)
Sample E (x 1/5x104)
Tri
tiu
m r
elea
se r
ate
/ B
q s
-1 g
-1
Temperature / K
Fig. T-TDS spectra for Li2TiO3
with various neutron fluences
CO4-15

採択課題番号 25071 親水性高分子-金属塩ナノコンポジットの調製と構造 共同通常
(京大・原子炉)川口昭夫、森本幸生(信州大・繊維)後藤康夫
Complex Structure of Ions Coordinated with Hydrophilic Polymer. 14.
A. Kawaguchi , Y. Gotoh1 and Y. Morimoto
Research Reactor Institute, Kyoto University 1Faculty of Text. Sci. and Tech., Shinshu Univ.
INTRODUCTION: We have reported composite
structure brought by in situ preparation through "second-
ary doping" by diffusion of metallic ions into io-
dine-doped hydrophilic polymers. Polyiodide ions, Inm-
(m, n: integer, n ≠ 1 ), which have been as solutes in
aqueous solution, can be doped into the polymers without
modification of the matrixes. And, furthermore, the
polymer matrix previously iodine-doped enhances fol-
lowing diffusion of other molecules or ions into matrix
polymer; if the additional ion makes precipitates of inor-
ganic salt with iodide, hybrid composite can be achieved
without melting, nor casting, nor synthesizing.[1-3]
Such process for "iodine (first) doping" and for following
“secondary (or more) doping” of additional ions can be
achieved depending on diffusion of the ions into the resin
matrixes. Then, ionic diffusion process without modi-
fication of macroscopic shapes of the samples means
merits for arbitrariness of hybrid composite without plas-
ticization; their shapes or (often) chain orientation are
maintained in the composites in the final stage, and it
provides preparation methods for hybridization of poly-
meric matrixes which can not be solved in solution nor be
melt above Tm, such as natural materials [3].
EXPERIMENTS: Bamboo fiber (phyllostachys hetero-
cycla, maybe) which had grown naturally in ground of
KURRI (Kumatori, Osaka, JAPAN) was prepared as
starting matrix for doping. A branch of bamboo was
manually crushed and cut to short pieces (D:3-5mm x
L:15-20mm). The divided pieces were immersed in
methanol (for 1 week, at R.T.) to reduce impurities and,
next, were aged in vacuum in a heater at 150°C for 2
weeks.
Iodine doping was achieved with I2-KI(aq)/0.8N (for 2
months, at R.T.) and secondary doping was done with
AgNO3(aq)/1M (for 78 hrs., at R.T.). Electric conduc-
tion was measured with DMM as "two probe method".
Some samples were observed with wide-angle X-ray dif-
fraction (WAXD) by MoK incident.
RESULTS AND DISCUSSION: Generally, main com-
ponent as polymeric fiber in the bamboo sample is cellu-
lose (phase-I) which is not soluble in water nor methanol
at R.T. [4] Neither our "iodine doping" showed degrada-
tion of fiber in the samples, as macroscopic shapes and
diffraction with X-rays. (Fig.)
On the other hand, iodine doping process colored the
samples dark brown or black explicitly and increase in
mass (m) on iodine doping was c.a. 50-90%. And, on
following "secondary doping" with Ag+ ion, the samples
were colored gray and m was c.a. 100-140% after im-
mersing them into AgNO3(aq).(Fig.(a)) Further, electric
conductivity showed anisotropy for fiber axis. For ex-
ample, DC resistance parallel to a sample of bamboo fi-
ber was 5-10M against 15-25M for one normal to the
axis; as conductivity, the former parallel to fiber axis was
several times or tenfold larger than latter normal to
it.(Fig.(a)) However, considering behavior on each
process, situation in micro structure of the bamboo fiber
was different from hydrophilic polymers previously re-
ported such as polyamide-6 (PA6); while slight anisotro-
py of AgI precipitates as inorganic fillers was observed
for fiber axis, no explicit modification of cellulose crys-
tallites or its chain orientation as host matrix was ob-
served on “iodine doping” nor on “Ag secondary dop-
ing”.[5]
These results is regarded as deep permeation of poly-
iodide ions and following precipitation of AgI salt, which
is also accepted with WAXD pattern. Non-negligible
amount of AgI precipitates explicitly exist in the bamboo
composite(Fig.(c)), but, in the case of the bamboo matrix,
polyiodide ions are considered to induce ionic diffusion
into intermediate region among cellulose crystallites.
Consequently, even if the samples had not indicated ex-
plicit precipitation of AgI after "Ag secondary doping" in
microscopic appearance, traffic of iodine or metal ions
(and precipitation of AgI salt) might not advance at cel-
lulose crystallites.
Fig. Macroscopic appearance(a: left), optical microscope image (b: center, x40)
and WAXD pattern (c: right) of bamboo matrix prepared by "secondary doping"
with Ag+ following “iodine doping”.
REFERENCES:
[1] A. Kawaguchi, Sens. Actuators B, 73 (2001) 174-178.
[2] Y. Gotoh, et.al., Polym. Prep. Jpn., 51 (2002),
2259-2259.
[3] patent. JPN-5444559 (2014).
[4] “Sen’i-Bin’ran”, 3rd ed., ch.1 (in Japanese, Ed. by Soc.
Fiber Sci. Tech, Jpn., Maruzen, 2004).
[5] A. Kawaguchi, et.al., Polym. Prep. Jpn., 52 (2003),
577-577.
CO4-16

採択課題番号 25083 放射線誘起合成した多成分系高分子ゲルの熱的挙動と構造解析 共同通常
(京大・原子炉)佐藤 信浩、杉山 正明、大場洋次郎(福岡大・理)平松 信康、中村 忠嗣
Thermoresponsive Porous Binary Gels Prepared through -Irradiation
N. Sato, Y. Oba, R. Inoue and M. Sugiyama
Research Reactor Institute, Kyoto University
INTRODUCTION: Polymer gels are known to consist
of the three-dimensional network of crosslinking polymer
chains. These network can contain a large amount of
liquids, especially water in the most cases, within its
structure while keeping its solid form. This unique
property contributes to the biocompatibility of polymer
gels, and therefore they are widely used for medical, hy-
giene, food products like diapers, contact lenses, wound
dressing, and food additives. The various properties of
gels such as swelling, mechanical strength and elasticity
are strongly dependent on its network structure, which
have been attracting scientific interest of researchers in
various fields. The quality and function of polymer gels
can be further improved by understanding a variety of
factors which affect the molecular structure of the gels:
crosslink density, physical and chemical nature of com-
ponent polymer chains, electronic charges, and structural
imhomogeneities.
The most common method for gel preparation is
chemical crosslinking. Typically, polyfunctional mon-
omers are mixed together with monofunctional mono-
mers and then polymerized together to form crosslinking
polymer network. Crosslink density can be controlled
by changing the concentration of the polyfunctional
monomers. Radiation-induced gel preparation method
is another well-employed technique to prepare polymer
gels. In this method, gels can be synthesized only by
irradiating -rays to polymer solutions and no chemical
crosslinkers or reaction initiators are required. Cross-
link density can be controlled by the concentration of the
polymer solution and the condition of -irradiation. In
comparison with chemical-crosslinking gels, radia-
tion-crosslinking gels have advantages in reduced impu-
rities remaining in the final product gels as well as more
homogeneous structure of three-dimensional network.
Thus radiation-crosslinking gels have potential to show
quality superior to chemical-crosslinking gels.
Another merit of radiation preparation of polymer gels
is the easy preparation of gels with special structure.
We have already succeeded in preparing porous gels and
multicomponent gels by simple procedures including
-irradiation. It is expected to be applicable to other
designed structure of polymer gels aiming at intelligent
gel materials.
In this report, we describe the radiation preparation of
nonporous and porous hydrogels composed of two dif-
ferent classes of polymers: poly(ethylene glycol) (PEG)
and poly(N-isopropylacrylamide) (PNIPAm). The for-
mer is known as a common hydrogel polymer; the latter
as a typical thermoresponsive polymer whose gels show
volume transition around 34°C. Another report of ours
addresses microscopic structure of these gels as revealed
by small-angle scattering measurement. This report
deals with details of synthesis and macroscopic changes
of swelling status on temperature change.
EXPERIMENTS: PEG/PNIPAm binary porous gels
were prepared by the following procedures. Silica mi-
croparticles (200 and 1000 nm in diameter) were mixed
with a PEG aqueous solution (10 wt%) under ultrasonic
irradiation followed by N2 bubbling for deoxygenation.
After sealed in a glass vial, the solution was irradiated
with -rays for 60 kGy at a dose rate of 1.0 kGy/h at
Co-60 Gamma-ray Irradiation Facility of Research Reac-
tor Institute, Kyoto University. The silica microparticles
in the crude gel were decomposed with 20% hydrofluoric
acid for 24 h, and then fully washed with water. The
PEG matrix gels thus obtained were immersed in a
NIPAm monomer aqueous solution (10 wt%) and irradi-
ated with -rays again for 3 kGy at a dose rate of 1.0
kGy/h. Unreacted monomers were washed out by rins-
ing with water after irradiation, and purified product gels
were finally obtained.
RESULTS AND DISCUSSION: Incorporation of
PNIPAm chains into PEG matrix gels by -irradiation
was confirmed from IR spectra as shown in Fig. 1. Af-
ter irradiation of -rays to a PNIPAm-impregnated gel, a
new absorption peak appeared around 1700 cm-1, which
can be assigned to C=O stretching for the carbonyl group.
PEG/PNIPAm binary gels swollen in cold water
shrunk when the temperature was raised to 40 °C. This
result proves that thermoresponsive property was inher-
ited by the binary gels from -ray induced preparation.
The degree of the shrinkage for the porous gel was lower
than that for the nonporous gels. This indicates that
PNIPAm chains were highly localized in the pore space.
-10
120
0
50
100
3800 3002000 1000
%T
Wavenumber [cm-1]
Wavenumber / cm-1
Fig. 1. IR spectrum of a nonporous PEG/PNIPAm binary
gel. Absorption of the carbonyl group found around
1700 cm-1 is a proof of incorporation of PNIPAm chains.
CO4-17

採択課題番号 25088 イオン液体|電極界面における電気二重層構造の解明を目指した 共同通常
中性子反射率測定セルの作成
(京大院・工)西 直哉、池田陽一(京大・原子炉)日野正裕
Design and Preparation of the Electrochemical Cell for the Study of the
Electrical Double Layer at the Electrochemical Interfaces of Ionic Liquids
Using Neutron Reflectometry
N. Nishi, Y. Ikeda and M. Hino1
Graduate School of Engineering, Kyoto University 1Research Reactor Institute, Kyoto University
INTRODUCTION: Ionic liquids (ILs), which are liq-
uid salts entirely composed of cations and anions, have
potential applications to electrochemical devices because
of their several characteristics such as negligible volatili-
ty and wide potential window at the IL/electrode inter-
face. The knowledge of the molecular-level structure at
IL/electrode interface is important to optimize the per-
formance of the IL electrochemical devices. Theoretical
studies have revealed several unique features of the dis-
tribution of ions at IL/electrode interface, such as over-
screening effect and lattice-saturation effect, while ex-
perimental studies that shed light on such features are
limited to a few. In this study, we aimed to investigate
the electrical double layer at the IL/electrode interface
using neutron reflectometry. In this report, we will
show the results of the design and the preparation of the
cell, which is crucial for sensitive detection of the ion
distribution in the electrical double layer.
EXPERIMENTS: Thin-layer Al4Ti, as a film electrode,
was prepared on a silicon wafer using a sputter apparatus.
For IL, trioctylmethylammonium bis(trifluoromethane-
sulfonyl)amide ([TOMA+][C1C1N−]) was prepared from
the hydrophilic salts of the IL-constituent ions ([TO-
MA+]Cl− and Li+[C1C1N−]). Another IL, [DEME+]
[C1C1N−] (DEME+: diethyl-2-methoxyethylmethylam-
monium), was purchased. The two ILs were purified
using column chromatography. Cyclic voltammograms
were recorded at the film/IL/film two-electrode electro-
chemical cell.
RESULTS: Figure 1 shows the electrochemical cell
designed and prepared for neutron reflectometry. IL
was sandwiched with two Al4Ti electrode films that were
sputtered on the surface of silicon wafers. The surface
of the bottom silicon wafer was polished and the surface
roughness evaluated using x-ray reflectometry was ~3 Å.
The interface between IL and the Al4Ti electrode film on
this polished silicon surface (bottom interface) will be
“target” interface in neutron reflectometry. The bottom
silicon wafer is thick, with a thickness of 1 cm, to shine
the neutron beam from the edge of the wafer. The sur-
face of the upper silicon wafer was non-polished because
we do not want to see reflected beam from this surface
and thus want to minimize and neglect the reflectivity
from this surface. To prevent short circuit of the cell
due to unintended contact of the two electrodes, thin lay-
er glass sheet with a thickness of 50 m was inserted as a
spacer between the two electrodes. The area of the
electrode was 3050 mm2 in order to keep the sufficient
area to cover a long footprint of neutron beam with a
grazing incident angle.
We tested the electrochemical polarizability of the cell
using cyclic voltammetry. Figure 2 shows the cyclic
voltammogram with a scan rate of 0.1 V s−1. One can
see electrochemical window over 1 V available for the
cell depending on the IL, which indicates that we can
perform neutron reflectivity measurements of the interfa-
cial structure at various electrode potentials within the
electrochemical window.
-1 0 1
E / V
(a)
(b)
5 A
I
Fig. 2. Cyclic voltammogram for the electrochem-ical cell shown in Fig.1. Scan rate: 0.1 V s−1; elec-trode surface area: 15 cm2; ionic liquid layer spac-ing: 50 m. IL: (a) [TOMA+][C1C1N−] and (b) [DEME+][C1C1N−] containing 1 mol/kg Li+[C1C1N−]. Fig. 1. Electrochemical cell for neutron reflectivity
measurements.
CO4-18

採択課題番号 25098 多孔性金属錯体へのゲスト導入による鉄イオン及び 共同通常
ゲスト分子の電子状態変化の解析
(京大院・工)堀毛悟史、Kanokwan Kongpatpanich、杉本雅行、(京大・iCeMS)北川 進
(京大・原子炉)北尾真司、瀬戸 誠
57Fe Mössbauer Study of a Reactive Diiron Paddlewheel Unit in a
Porous Coordination Polymer
K. Kongpatpanich1, S. Horike1,2, M. Sugimoto1, S. Kitao3,
M. Seto3 and S. Kitagawa1,4
Graduate School of Engineering, Kyoto University 1Department of Synthetic Chemistry and Biological
Chemistry, Kyoto University 2Japan Science and Technology Agency, PRESTO 3Research Reactor Institute, Kyoto University 4Institute for Integrated Cell-Material Science (iCeMS),
Kyoto University
INTRODUCTION: Porous coordination polymer (PCP)
has been broadly studied for its adsorptive functions [1,2].
One of the current challenges in this area is the incorpo-
ration of the reactive metal unit into the structure. Dirron
paddlewheel unit, [Fe2(μ-O2C-R)4], is redox-reactive due
to the variable chemical state of the two iron ions in the
unit. In this work, we synthesized porous coordination
polymer containing the diiron paddlewheel unit,
[Fe2(1,4-BDC)2(dabco)]·(1), and studied on the chemical
state of iron by using 57Fe Mössbauer spectroscopy.
EXPERIMENTS: Due to the air-sensitive nature of a
sample, we prepared the sample as a pallet in an Ar-filled
glovebox. 57Fe Mossbauer spectroscopy was performed
under dynamic vacuum by using a 57Co source with a
nominal activity of 1.85 GBq. Velocity scale was cali-
brated as isomer shifts relative to α-Fe foil. Initial param-
eters for the least-square of 1 obtained from fitted param-
eters of the air-exposed sample of 1. All measurements
were carried out at 77 K and the measurements were re-
peated at 150 K.
RESULTS: [Fe2(1,4-BDC)2(dabco)]·(1) is air-sensitive
as noticeable from its color change, suggesting the trans-
formation via redox reaction. We measured 57Fe Möss-
bauer spectra of 1 before and after air-exposure to inves-
tigate on the oxidation state of Fe ions in the sample. The
spectrum of 1 collected at 77 K (Fig. 1) is fitted into two
quadrupole-split doublet signals, which are characteristic
of high-spin Fe2+ and Fe3+. The relative absorption areas
of the two subspectra correspond to 91.6% of Fe2+ and
8.4% of Fe3+. Mössbauer spectroscopy of the same sam-
ple was measured again at 150 K to confirm the reliabil-
ity of the least-square fitting and the peak assignment.
The dominant doublet with isomer shift value at 1.25
mms-1 and quadrupole-splitting value of 2.72 mms-1 is
typical for high-spin Fe2+. It is determined that the com-
pound contains diiron paddlewheel unit in +2 oxidation
state from the characteristic doublet peak in the Möss-
bauer spectrum. On the other hand, the other minor dou-
blet signal with isomer shift at 0.56 mms-1 and quadru-
pole-splitting value of 0.90 mms-1 corresponds to
high-spin Fe3+ species. It is supposed that Fe3+ ions come
from the air-contamination in 1 occurred during sample
transfer for the measurement of the Mössbauer effect,
because of the high reactivity of 1 to the air. We oxidized
1 by air-exposure for 12 hours at 298 K and measured
Mössbauer spectrum. As expected, Mössbauer spectrum
of the air-exposed sample dominantly shows doublet of
high-spin Fe3+ (92.4% of relative peak area) from the
framework oxidation along with the collapse of the
framework. This indicates water molecules in air would
replace ligands in 1 and subsequently Fe2+ ions in the
paddlewheel unit are oxidized to Fe3+.
-6 -4 -2 0 2 4 6
90
95
100
Velocity / mms-1
Perc
enta
ge tra
nsm
issio
n
REFERENCES: [1] O. M. Yaghi et al., Nature, 423 (2003) 705-714.
[2] S. Kitagawa et al., Angew Chem. Int. Ed., 43 (2004)
2334-2375.
[3] K. Kongpatpanich et al., Chem. Commun., 50 (2014)
2292-2294.
Fig. 1. 57Fe Mössbauer spectrum of 1 measured at 77
K. The wide doublet corresponds to high-spin Fe2+,
while the narrow doublet is assigned to high-spin
Fe3+ [3].
CO4-19

採択課題番号 25103 ヨウ化銀ナノ粒子の相挙動の評価 共同通常
(京大院・理)北川 宏、大坪主弥、山本貴之(京大・原子炉)北尾真司、瀬戸 誠
129I Mössbauer Spectroscopy of Silver Iodide Quantum Dots
T. Yamamoto, K. Otsubo, H. Kitagawa, S. Kitao1 and M. Seto1
Graduate School of Science, Kyoto University 1Research Reactor Institute, Kyoto University
INTRODUCTION: Nanomaterials have been exten-sively studied in the fields of science and technology due to their unique properties arising from high sur-face area-to-volume ratios and quantum size effects. Silver iodide (AgI) has been used as photosensitizers and for cloud seeding. AgI is also a superionic Ag+ conductor in the high-temperature α-phase, and has been studied as a solid electrolyte for solid-state bat-teries[1]. In addition, AgI is a direct bandgap semi-conductor in the low-temperature β- and γ-phases, and its optical properties have been investigated in both bulk and nanomaterials. There are a variety of methods to synthesize AgI nanoparticles, for example AgI nanoparticles in glass matrix were fabricated by a quenching technique from high temperature over 500 °C[2]. Polymer-based liq-uid-phase techniques have also been adopted as facile and effective methods for the preparation of size-controlled AgI nanoparticles[3]. Although AgI nanoparticles in the size range of 4 - 41 nm have been obtained as a solid phase and well characterized so far[4-6], the development of a facile synthetic method for AgI quantum dots smaller than 4 nm is still re-quired. Very recently, we have reported a facile low-temperature liquid-phase synthesis method of small AgI quantum dots with a diameter of 3.0 nm[7]. Here we report 129I Mössbauer spectroscopy of AgI quantum dots to investigate their electric states.
EXPERIMENTS: The AgI quantum dots were pre-pared by a liquid-phase method. In order to avoid photo-reduction of AgI, the synthesis was carried out with an apparatus covered with aluminum foil. AgNO3 (0.067 mmol) and poly(N-vinyl-2-pyrrolidone) (PVP, 1.243 mmol) were dissolved in 60 mL of cold methanol and stirred for several minutes at the ice temperature. Then 3.4 mL of Na129I aqueous solution (1.61 µCi / mL) was added quickly and stirred for 2 h at the ice temperature. The synthesized quantum dots were collected by centrif-ugation and dried in air. 129I Mössbauer spectroscopy on the prepared AgI quantum dots was performed at 50 K. Mg3
129mTeO6 was used as the γ-ray source, which was prepared by neutron irradiation of Mg3
128TeO6. The source velocity was cali-brated by using pure α-Fe as the control material.
RESULTS: The observed data (dots) and the fitting curve are shown in Fig. 1. The fitting gives the hyperfine
interaction parameters (isomer shift IS, line width W, quadrupole coupling constant QCC, and asymmetry pa-rameter η). IS is 3.30 mm/s relative to the Mg3
129mTeO6 source. The slightly large W value (1.23 mm/s) indicates that QCC has some distribution, and QCC is estimated at -408.5 MHz. Interestingly, the fitting gives better results with taking η as 0.21 rather than zero. From these pa-rameters, it is supposed that the iodine in the AgI quan-tum dots has a charge slightly more positive than -1, alt-hough that in bulk AgI has -1. It is conceivable that this charge change derives from an interaction between the surface of the quantum dots and PVP.
REFERENCES: [1] B. B. Owens, J. Power Sources, 90 (2000) 2-8. [2] M. Tatsumisago, Y. Shinkuma and T. Minami, Nature, 354 (1991) 217-218. [3] M. I. Vucemilović and O. I. Micić, Int. J. Radiat. Appl. Instrum., Part C, 32 (1988) 79-83. [4] R. Makiura, T. Yonemura, T. Yamada, M. Yamauchi, R. Ikeda, H. Kitagawa, K. Kato and M. Takata, Nat. Ma-ter., 8 (2009) 476-480. [5] S. Yamasaki, T. Yamada, H. Kobayashi and H. Kita-gawa, Chem. Asian J., 8 (2013) 73-75. [6] B. Xu and X. Wang, Small, 7 (2011) 3439-3444. [7] T. Yamamoto, H. Kobayashi and H. Kitagawa, Chem. Lett., DOI: 10.1246/cl.140409
Fig. 1. The 129I Mössbauer spectrum for AgI quantum dots using a Mg3
129mTeO6 source at 50 K. The obtained hyperfine interaction parameters are IS = 3.30 mm/s, W = 1.23 mm/s, QCC = -408.5 MHz, and η = 0.21.
CO4-20

採択課題番号 25107 高密度 MoO3ペレットの照射効果に関する研究 共同即時
(京大・原子炉)佐野 忠史、藤原 靖幸、張 倹
(JAEA)西方 香緒里、石田 卓也、米川 実、加藤 佳明、黒澤 誠、木村 明博、松井 義典、
土谷 邦彦
1.0E+12
1.0E+11
1.0E+10
1.0E+09
1.0E+08
4 h
24 h
1.0E+071.0E+051.0E+031.0E+011.0E-011.0E-03
Energy (eV)
1.0E+09
1.0E+07
1.0E+05
1.0E+03
(Bq
/let
har
gy)
Irradiation time
(a) Neutron Spectrum
(b) 99Mo production
(n/c
m2/s
ec/l
ethar
gy)
Neutron Irradiation Effect of High-Density MoO3 pellets for Mo-99 Production
K. Nishikata, T. Ishida, M. Yonekawa, Y. Kato,
M. Kurosawa, A. Kimura, Y. Matsui, K. Tsuchiya,
T. Sano1, Y. Fujihara1 and J. Zhang1
Neutron Irradiation and Testing Reactor Center, JAEA 1Research Reactor Institute, Kyoto University
INTRODUCTION: As one of effective applications of
the Japan Materials Testing Reactor (JMTR), JAEA has a
plan to produce 99Mo by (n, γ) method ((n, γ)99Mo
production), a parent nuclide of 99mTc[1]. In this study,
preliminary irradiation tests were carried out with the
high-density MoO3 pellets in the KUR and the 99Mo
production amount was evaluated between the calculation results and measurement results.
EXPERIMENTS: The high-density MoO3 pellets were
fabricated by the Plasma Sintering Method[2]. Theoretical
Density (T.D.) of sintered MoO3 pellets was targeted in a
range from 90 to 97%. The high-density MoO3 pellets
were irradiated in the SLANT of KUR. Before the
irradiation tests, neutron flux in the SLANT was
measured with the dosimeters (In foil and In-Ni foil with
Cd canning), and neutron spectrum and 99Mo production
amount was evaluated by MVP2.0 (Monte-Calro
calculation cord) and JENDL-4.0 (nuclear data library). Table 1 shows the irradiation conditions of MoO3 pellets
in the SLANT of KUR. After the irradiation tests, the
irradiated MoO3 pellets were transported from KUR to
JMTR-HL. The PIEs were carried out such as XRD
analysis and SEM observation and the irradiated pellets
were dissolved with 6M-NaOH solution in the Lead Cell.
RESULTS: Figures 1 show the neutron spectrum and 99Mo production in the SLANT of KUR.
Table 1 Irradiation condition of MoO3 pellets
Items Values
Thermal power 1 MW
Irradiation hole SLANT
Thermal flux 1.8 × 10¹⁷ m-2s-1
Fast flux 8.8 × 10¹⁶ m-2s-1
Irradiation Temp. about 50 °C
Table 2 Results of 99Mo production amounts
Irradiation
Time
(h)
99Mo production amounts
(Bq/g-MoO3) Measured
value/
Calculated value
Measured
value
Calculated
value
4 9.0 × 10⁶ 7.0 × 10⁶ 1.3
24 4.8 × 10⁷ 4.5 × 10⁷ 1.1
In this result, thermal neutron flux was about 3% bigger
than KUR nominal value in this test. The total 99Mo
production amounts were 7.0×10⁶ Bq/g for 4 h and
3.3×10⁷
Bq/g for 24 h, respectively. From the PIE results by the XRD and SEM, it was found that no
change of crystal structure and grain size was observed in
the MoO3 pellets irradiated at low temperature and
fluence. The irradiated pellets could be dissolved
sufficiently in 6M-NaOH solution within 3 h. After the
dissolution of the irradiated MoO3 pellets, radioactive
nuclides were measured by the γ-ray spectrometer. Table
2 shows the results of 99Mo production amounts. In this
result, experimental values of 99Mo were 9.0×10⁶ Bq/g
for 4 h and 4.5×10⁷ Bq/g for 24 h, respectively, and
measured values were almost the same as the calculated values.
CONCLUSION: As part of the development of the 99Mo production by (n, γ) method, the high-density MoO3
pellets were irradiated in the KUR and 99Mo production
amounts were currently evaluated by the neutron
spectrum in the irradiation field and neutron capture
cross-section of 98Mo. In the PIEs, no change of crystal
structure and grain size was observed in the MoO3 pellets
irradiated at low temperature and low fluence.
REFERENCES: [1] K. Nishikata, et al., Fabrication and Characterization
of High-Density MoO3 Pellets, Proceedings of 2012
Powder Metallurgy World Congress & Exhibition
(2012) CD-ROM.
[2] K. Tsuchiya, et al., Status of 99Mo-99mTc Production
Development by (n, γ) Reaction, JAEA-Conf
2011-003(2011).
Fig. 1 Neutron spectrum and 99Mo production
rate in the SLANT of KUR
CO4-21

採択課題番号 25118 スピネル酸化物 Fe2TiO4の磁場中メスバウアー分光 共同即時
(帝京大・理工)中村真一(京大・原子炉)瀬戸誠、北尾真司、小林康浩
Mössbauer Spectroscopy of Spinel Oxide Fe2TiO4 in Applied Magnetic Field
S. Nakamura, Y. Kobayashi1, S. Kitao1 and M. Seto1
Department of Science and Engineering, Teikyo University 1Research Reactor Institute, Kyoto University
INTRODUCTION: The ulvöspinel Fe2TiO4 has a cubic spinel structure (Fd-3m) with the lattice constants of a=8.5469Å at room temperature. The A-site is occupied by Fe2+ ion, whereas the B-site is occupied equally by Fe2+ and Ti4+ ions. The high spin Fe2+ ion on the tetrahedral site is a Jahn-Teller active ion and induces cubic-tetragonal phase transition at Tt =163K [1]. The low temperature tetragonal structure (I41/amd) has lattice constants of a=6.0129Å and c=8.5237Å at 123K, slightly elongated along the c-axis (c/a√2=1.0024). The magnetic structure is a Néel type antiferromagnet (TN~130K) with a weak ferromagnetic moment along the c-axis [2, 3]. The Mössbauer spectrum of this compound consists of broad and complicated spectrum due to the B-site ion disorder and the domain structure below Tt [4]. In this research, we have conducted Mössbauer spectroscopy by using a single crystal specimen squeezed along [001] below Tt. As a result, a single domain state is realized and a better-resolved spectrum can be obtained.
EXPERIMENTS: The single crystal of Fe2TiO4 was prepared by FZ method in a controlled oxygen pressure. The (001) plane disk of about 6 mm diameter and 40µm thickness was used as an absorber. The edge of the disk was surrounded by epoxy resin. When the specimen was cooled through Tt, it was squeezed along the [001] direction and thus the tetragonal c-axis was specified. 57Fe Mössbauer spectroscopy was conducted in conventional transmission geometry by using 57Co-in-Rh (50mCi) as the γ ray source. The spectra were measured at T=15 K in applied magnetic field (Hex) up to 14T. The directions of the γ ray and the magnetic field were both parallel to the tetragonal c-axis. The Doppler velocity was calibrated by using Fe metal foil. Lorentzian line shapes were assumed for the analysis.
RESULTS: In Fig.1, Mössbauer spectra of Fe2TiO4 at T=15 K in applied magnetic field are shown. We have analyzed the spectra by a four-subspectra model,
corresponding to two A-sites (A1 and A2) and two B-sites (B1 and B2), which is based on the local arrangement of the B-site ions [4]. At Hex=0 T, the hyperfine fields (Hhf) are 33.9, 28.7, 28.7, and 22.2 T, respectively. Due to the local B-site arrangement, the principal axes of electric field gradient (EFG) of each Fe2+ are different from those expected from the crystal symmetry (e.g. the z-axis of A-site is the c-axis). However, the angles between Hhf and the incident γ ray are about 90º, which indicates that the magnetic moments align in the c-plane. The spectra in applied magnetic field can be interpreted by the canting of the magnetic moments. At Hex=5 T, the observed fields (Hobs) are 30.3, 27.6, 27.4, and 17.9 T, respectively, suggesting that all the moments incline toward the applied magnetic field. With increasing applied magnetic field, the magnetic moments of B-site Fe incline upward, whereas those of A-site incline downward.
-15 -10 -5 0 5 10 15
14T
v (mm/s)
5T
0T
fitB2B1A2A1
Ab
sorp
tio
n (
au)
10T
Fig.1. Môssbauer spectra of single domain Fe2TiO4 at 15 K in applied magnetic field.
REFERENCES: [1] T. Yamanaka et al., Phys. Rev. B,80 (2009) 134120. [2] Y. Ishikawa, et al., J. Phys. Soc. Jpn. 31 (1971) 452. [3] K. Kose, et al., J. Phys. Soc. Jpn. 47 (1979) 77. [4] S. Nakamura et al., Hyperfine Int. 226 (2014) 267.
CO4-22