co2 conversion to fuels - columbia university
TRANSCRIPT

CO2 Conversion to Fuels
A Progress Report on Liquid Light Inc.
Columbia University, April 2014
CO2
Oil, Gas
(CHx)
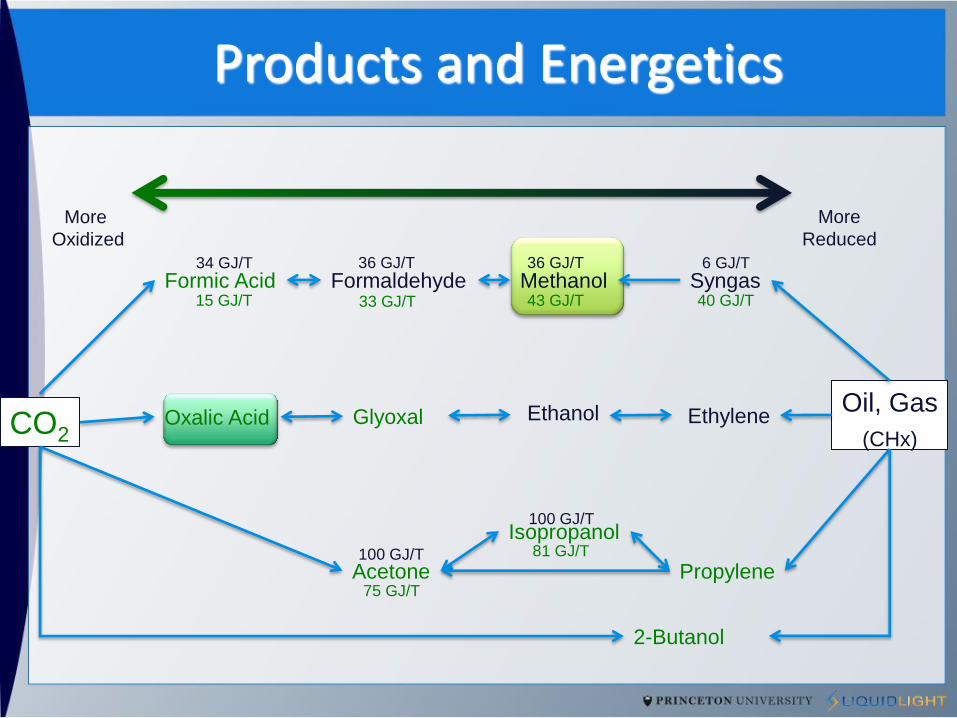
More
Oxidized
More
Reduced
Products and Energetics
Ethylene Oxalic Acid Ethanol Glyoxal
75 GJ/T Propylene
Isopropanol
Acetone
100 GJ/T
81 GJ/T 100 GJ/T
2-Butanol
Syngas Methanol Formaldehyde Formic Acid 6 GJ/T 36 GJ/T
15 GJ/T 33 GJ/T 43 GJ/T
36 GJ/T 34 GJ/T
40 GJ/T

One Cannot Achieve the Electrochemical Energy Goals without an Efficient Catalyst
N+
H
Aromatic Amines Drop the Activation Overpotential to ~200mV

MeOH Evolving PEC Using p-GaP
CO2 + 6e- + 6H+ CH3OH + H2O pH 5.2, 10mM pyridine
465nm
96% Faradaic Yield of MeOH @ 200mV UNDERpotential
N+
H

CO2 to Formate at an In Surface

The Liquid Light Process
Renewable Energy Source
Waste CO2
CO2 Generating Source
Water
CO2 + xH+ + xe-
product
2H2O 4H+ + 4e- + O2
e- e-
e-
Product Extraction
Chemicals & Fuels
Abundant cathode materials
Efficient and
selective catalysts
Low cell voltages (energy efficient)
Stability
Highlights

Solar Panel Provided By
and
Solar Fuel is Here!

System Runs Utilize Real Sunlight (AM 1.5)
0.00%
0.50%
1.00%
1.50%
2.00%
2.50%
3.00%
3.50%
0
200
400
600
800
1000
1200
0.00 20.00 40.00 60.00 80.00 100.00 120.00
The
rmio
nic
Eff
icie
ncy
Inte
nsi
ty (
W/m
2)
Time (minutes)
Insolation vs. Cell Response 4/22/13
Cloud Cover

Liquid Light’s 100cm2 scale electrochemical cell test bench
Photo shows 100cm2 active area electrochemical cell for conversion of CO2 to multi-carbon product along with test bench used to operate and control electrochemical cell. System includes control of electrolyte feed and circulation and instrumentation for process monitoring and control.
Test bench Controls
Cell

They Did It! Anyone want a good deal on Oxalate?

Acknowledgement
Advancing CO2 Chemistry

A Complex Synergy
GaInP2 @465nm
0
5
10
15
20
25
30
PY1 PY2 PY3 PY4 PY5
Catalyst
Relative P
ercen
t P
ro
du
ct
Acetone
Methanol
Isopropanol
Quantum Yield
GaP @ 365nm
0
10
20
30
40
50
60
PY2 PY3 PY4 PY5 PY6
Catalyst
Relative P
ercen
t P
ro
du
ct
Acetone
Methanol
Isopropanol
Quantum Yield

p-GaP MeOH Evolving Cell
CO2 + 6e- + 6H+ CH3OH + H2O pH 5.2, 10mM pyridine
465nm

Currently producing target chemicals at grams/day with product concentration streams > 3% and CD > 100 mA/cm2 and 1000 hr stability testing, now scaling up to kg/day over the
next year
Formic Acid System Scale-Up

What should we do with CO2?
Schematic diagram of possible CCS systems
SRCCS Figure TS-1
CO2 Utilization
Sequestration
Utilization:
Polymers, Solid-State Products
Fuels
7%
93%

Carbon-Carbon Coupling is Possible!
GaP @ 365nm
0
10
20
30
40
50
60
PY2 PY3 PY4 PY5 PY6
Catalyst
Relative P
ercen
t P
ro
du
ct
Acetone
Methanol
Isopropanol
Quantum Yield
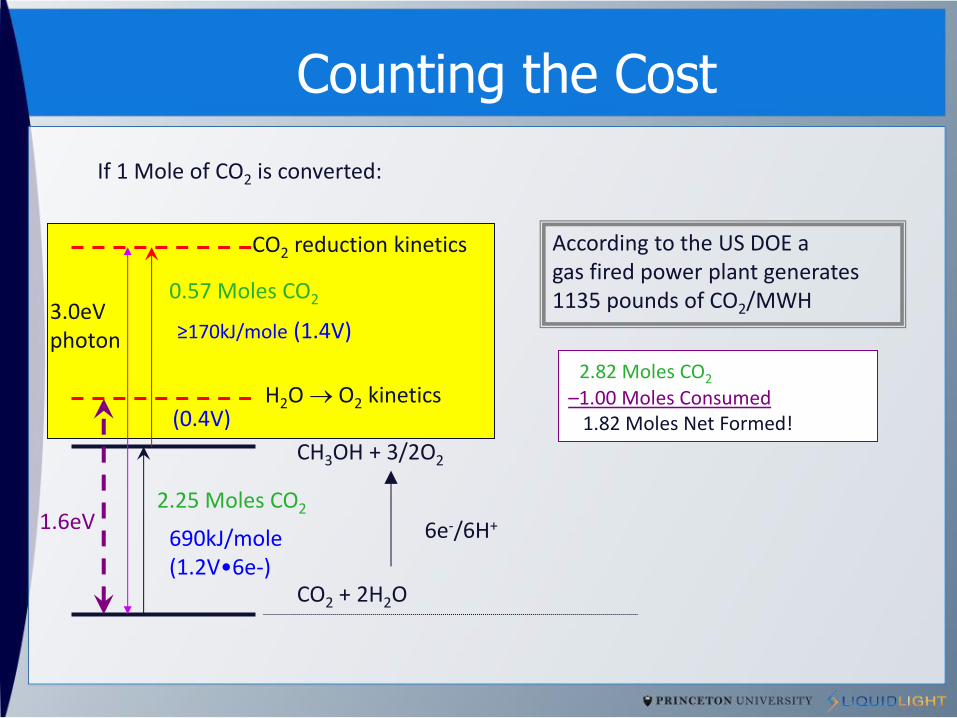
Counting the Cost
CO2 + 2H2O
CH3OH + 3/2O2
H2O O2 kinetics
CO2 reduction kinetics According to the US DOE a gas fired power plant generates 1135 pounds of CO2/MWH
2.25 Moles CO2
If 1 Mole of CO2 is converted:
0.57 Moles CO2
2.82 Moles CO2
–1.00 Moles Consumed 1.82 Moles Net Formed!
690kJ/mole (1.2V•6e-)
≥170kJ/mole (1.4V)
(0.4V)
1.6eV
3.0eV photon
6e-/6H+