co-evolution of climate and life - cgd · co-evolution of climate and life 20 october 2010 ......
TRANSCRIPT

Gordon BonanNational Center for Atmospheric ResearchBoulder, Colorado
Co-evolution of Climate and Life
20 October 2010Center for Astrobiology University of Colorado Boulder, Colorado
Thomas Cole – “View from Mount Holyoke, Northampton, Massachusetts, after a Thunderstorm (The Oxbow)”, 1836
NCAR is sponsored by the National Science Foundation
2
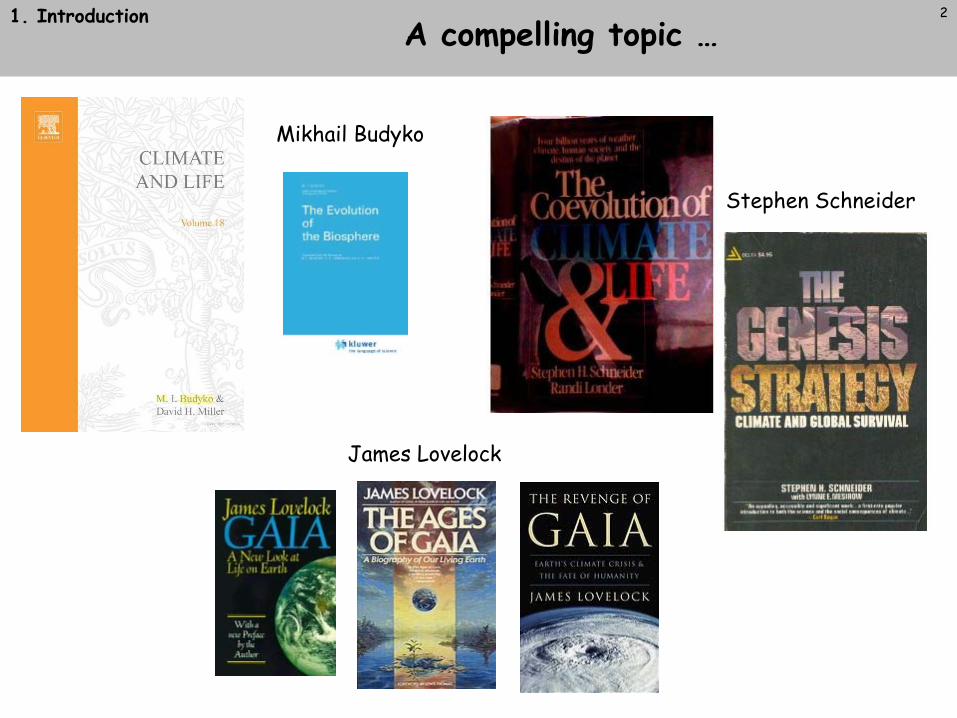
A compelling topic … 1. Introduction
Mikhail Budyko
Stephen Schneider
James Lovelock
Outline of talk
1. Introduction
2. Key ecosystem processes that affect climateAlbedo, evapotranspiration, carbon-nitrogen biogeochemistry
3. Paleoclimate examples Boreal forest, North Africa
4. Anthropogenic climate change (20th and 21st centuries)
5. Earth system models
6. Carbon cycle and climateConcentration–carbon feedback (CO2 fertilization)Climate–carbon feedback (temperature)Nitrogen cycle
7. Land use and land cover change
7a. Biogeochemical 7b. BiogeophysicalLand use carbon flux Albedo and evapotranspiration
8. Conclusions
1. Introduction 3

Amplify or dampen system responseWater vaporCloudsIce albedoOcean heat uptake and circulationCarbon cycleLand use/land cover change
4
Forcings
Feedbacks
Natural variability
Response
Global temperature
Understanding Earth’s climate system
External drivers of system changeSolar irradianceVolcanic aerosolsAnthropogenic aerosolsCO2 concentrationLand use/land cover change
El Niño-Southern Oscillation
1. Introduction
280300320340360380
CO2
(ppm
)
1860
1880
1900
1920
1940
1960
1980
2000
Atmospheric CO2
?
5
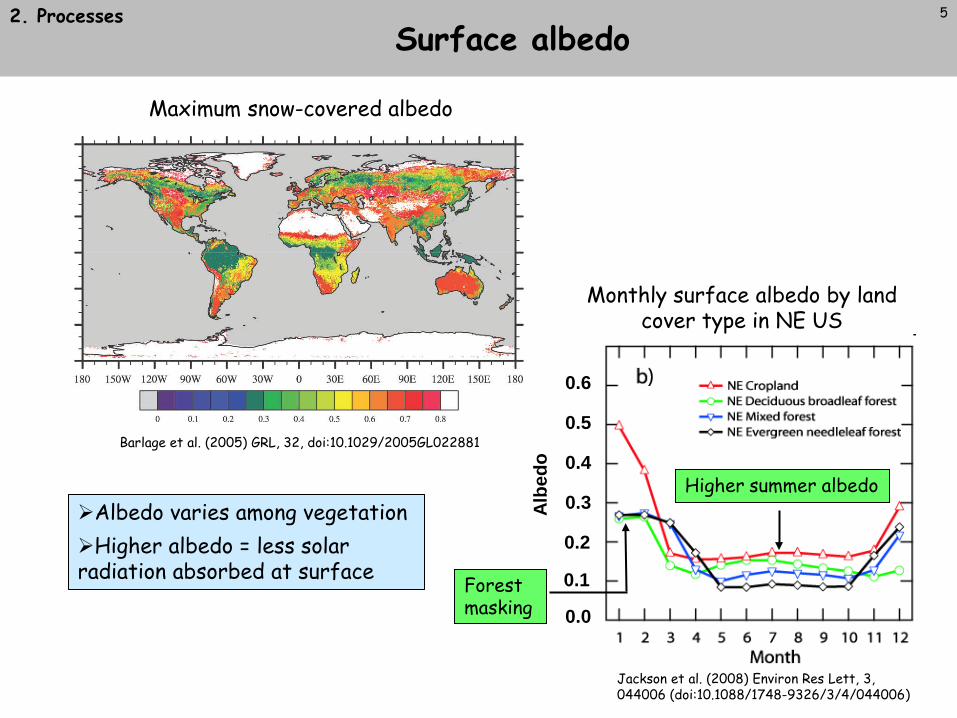
Maximum snow-covered albedo
Barlage et al. (2005) GRL, 32, doi:10.1029/2005GL022881
Surface albedo2. Processes
Higher summer albedo
Forest masking 0.0
0.1
0.2
0.3
0.4
0.5
0.6
Albe
do
Jackson et al. (2008) Environ Res Lett, 3, 044006 (doi:10.1088/1748-9326/3/4/044006)
Monthly surface albedo by land cover type in NE US
Albedo varies among vegetationHigher albedo = less solar radiation absorbed at surface
6
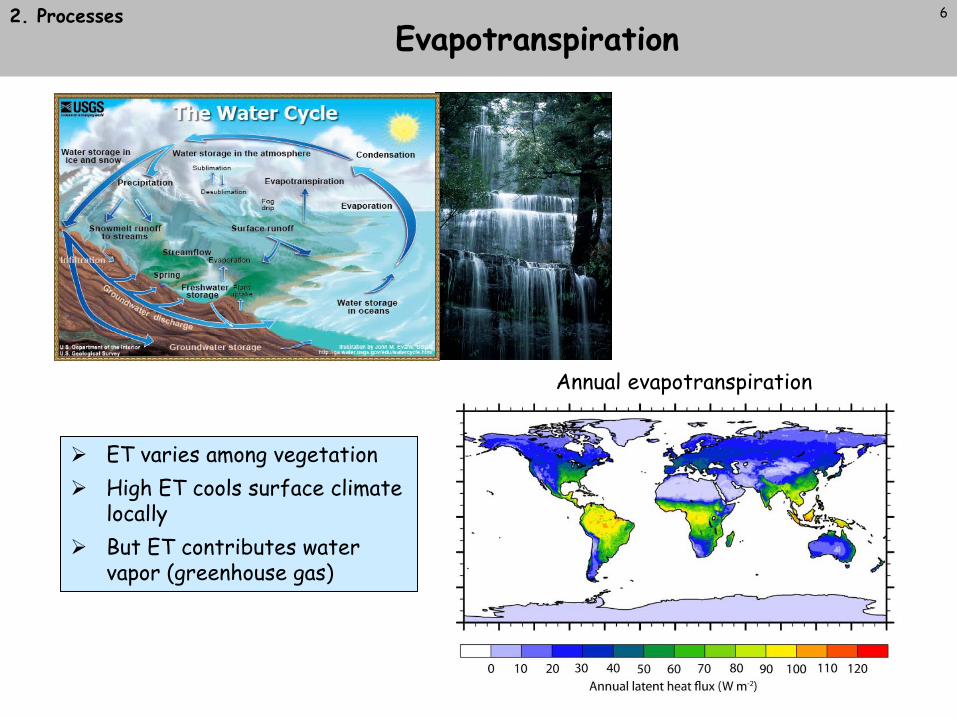
Evapotranspiration2. Processes
ET varies among vegetation High ET cools surface climate
locally But ET contributes water
vapor (greenhouse gas)
Annual evapotranspiration
7
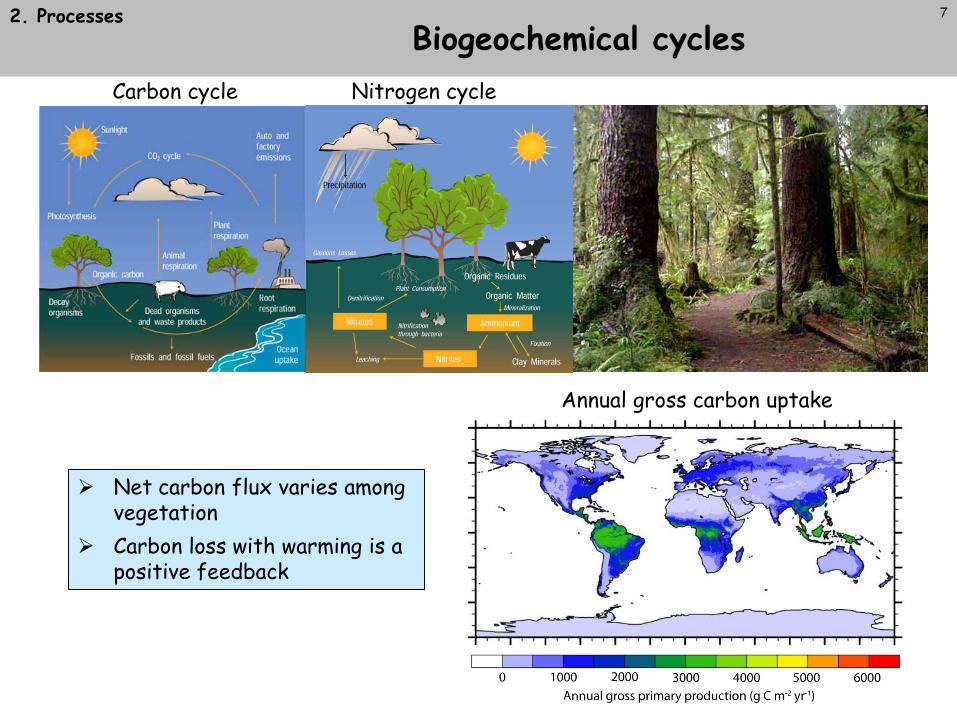
Biogeochemical cycles 2. Processes
Net carbon flux varies among vegetation
Carbon loss with warming is a positive feedback
Annual gross carbon uptake
Carbon cycle Nitrogen cycle
Bonan (2008) Science 320:1444-1449
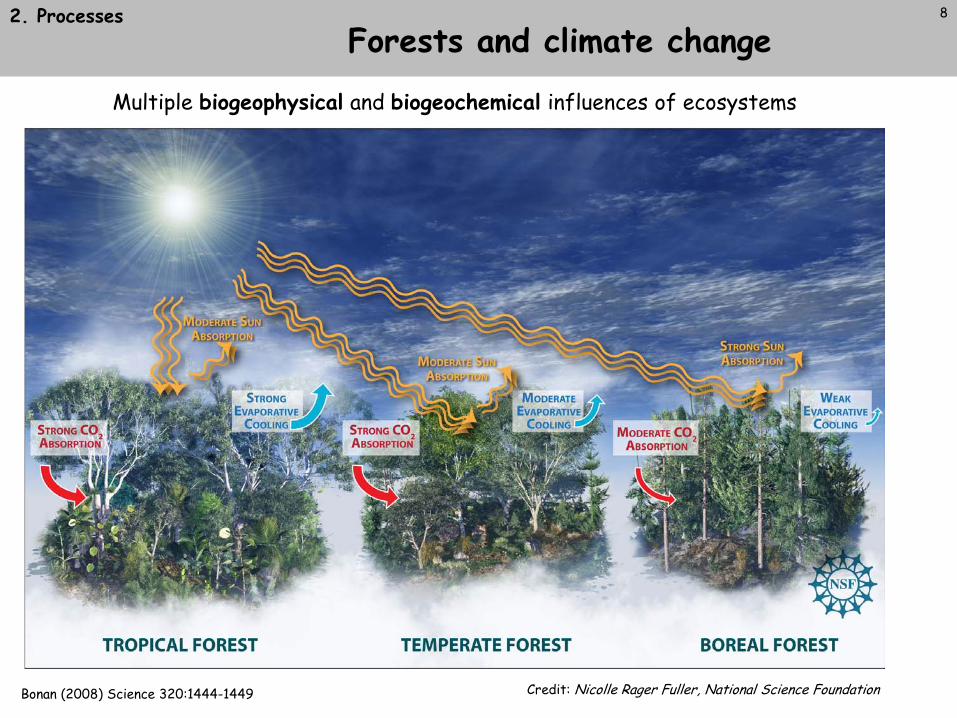
Forests and climate change
Multiple biogeophysical and biogeochemical influences of ecosystems
Credit: Nicolle Rager Fuller, National Science Foundation
2. Processes 8

Evapotranspiration cools climate locally
Juang et al. (2007) GRL, 34, doi:10.1029/2007GL031296
OF to PP OF to HW
Albedo +0.9ºC +0.7ºC
Ecophysiology and aerodynamics
-2.9ºC -2.1ºC
Annual mean temperature changeForestLower albedo (+)
Greater leaf area index, aerodynamic conductance, and latent heat flux (-)
92. Processes

10
Annual mean surface temperature change (°C)
Davin & de Noblet-Ducoudré (2010) J Climate 23:97–112
Forests influences on global climate2. Processes
Prevailing biogeophysical paradigmBoreal and temperate forests warm climateTropical forests cool climate
11
Ice
Forest Tundra
Tundra
Boreal Forest
Mixed Forest
Deciduous Forest
Aspen Parkland
Prairie
Southeast Forest
No Analog
No Data
18000 12000
9000 6000
3000 Modern
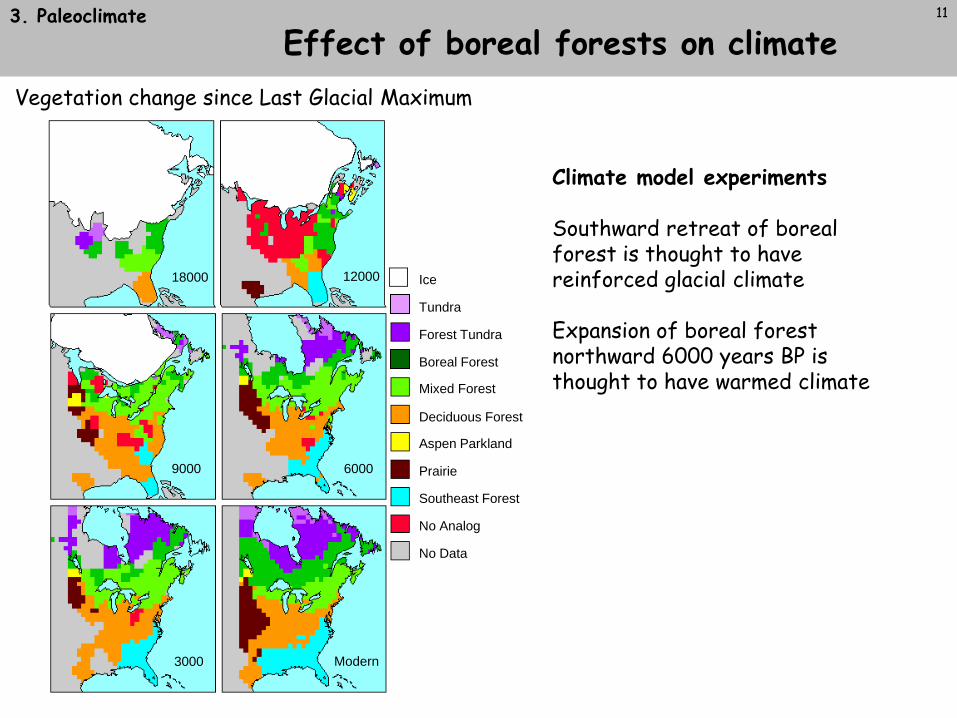
Vegetation change since Last Glacial Maximum
Climate model experiments
Southward retreat of boreal forest is thought to have reinforced glacial climate
Expansion of boreal forest northward 6000 years BP is thought to have warmed climate
Effect of boreal forests on climate3. Paleoclimate
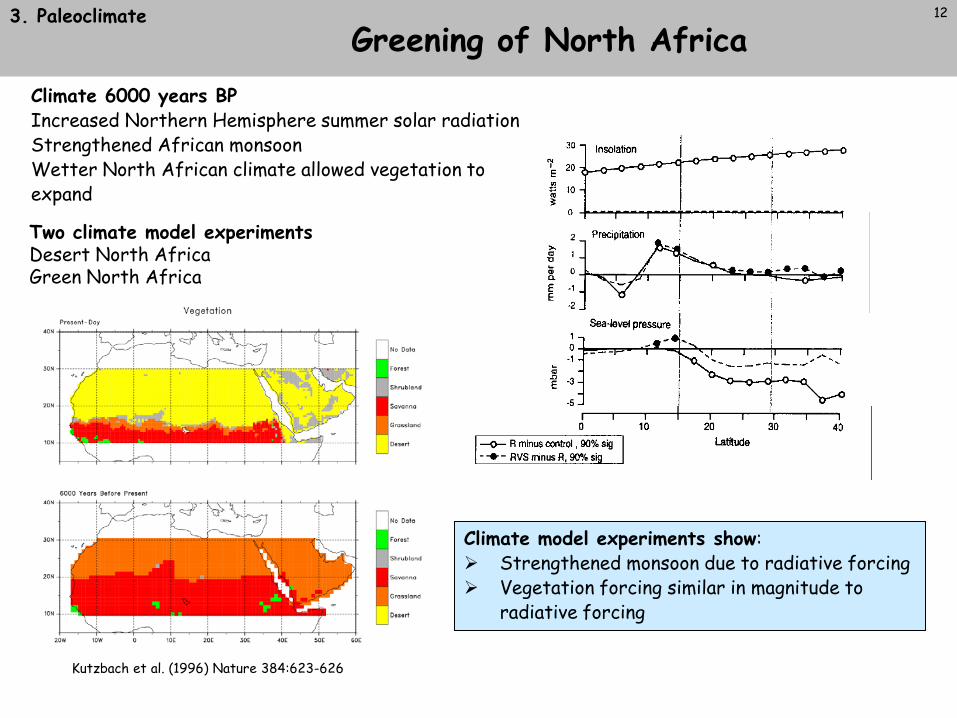
Climate 6000 years BPIncreased Northern Hemisphere summer solar radiation Strengthened African monsoonWetter North African climate allowed vegetation to expand
Greening of North Africa
Kutzbach et al. (1996) Nature 384:623-626
Climate model experiments show: Strengthened monsoon due to radiative forcing Vegetation forcing similar in magnitude to
radiative forcing
Two climate model experimentsDesert North AfricaGreen North Africa
3. Paleoclimate 12
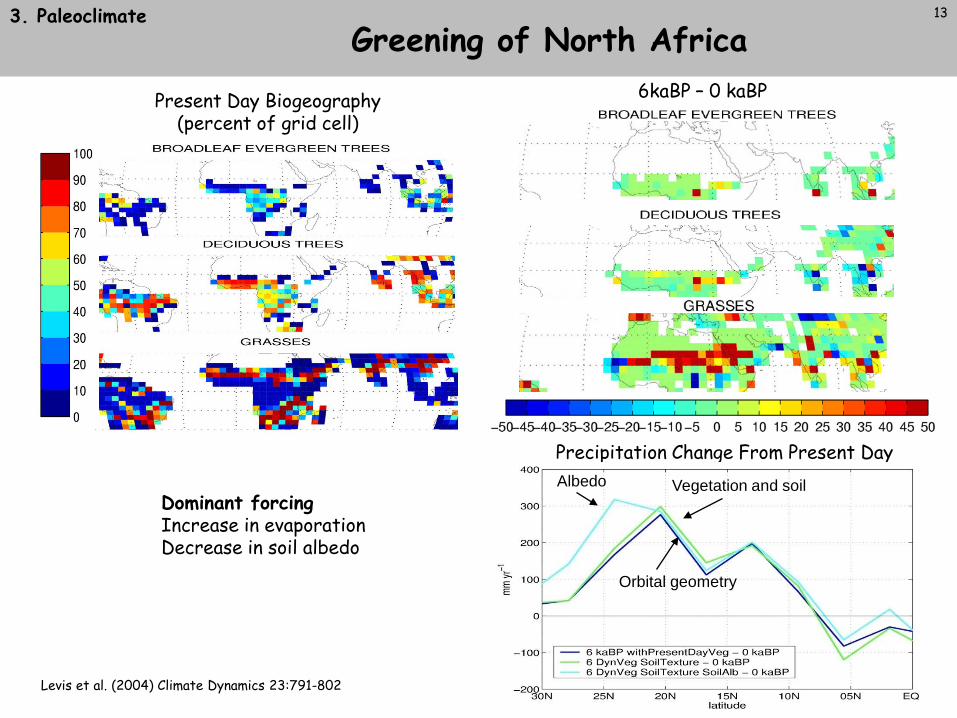
6kaBP – 0 kaBP
Precipitation Change From Present Day
Dominant forcingIncrease in evaporationDecrease in soil albedo
Present Day Biogeography(percent of grid cell)
Orbital geometry
Vegetation and soilAlbedo
Levis et al. (2004) Climate Dynamics 23:791-802
3. Paleoclimate 13
Greening of North Africa
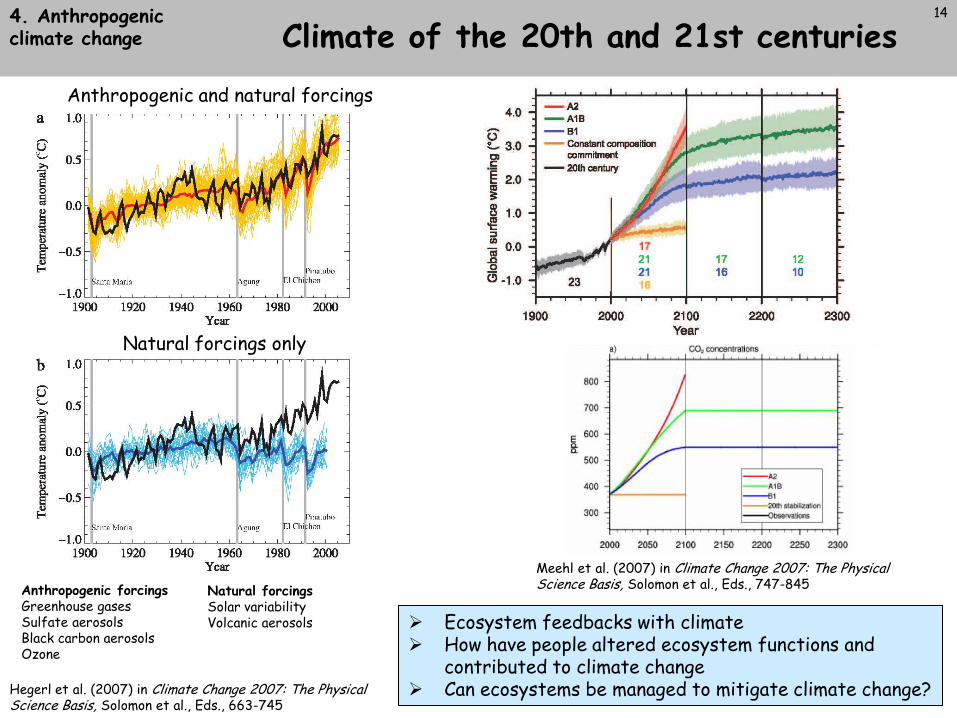
14
Climate of the 20th and 21st centuries
Hegerl et al. (2007) in Climate Change 2007: The Physical Science Basis, Solomon et al., Eds., 663-745
Natural forcings only
Anthropogenic and natural forcings
Anthropogenic forcingsGreenhouse gases Sulfate aerosolsBlack carbon aerosolsOzone
Natural forcingsSolar variability Volcanic aerosols
4. Anthropogenicclimate change
Ecosystem feedbacks with climate How have people altered ecosystem functions and
contributed to climate change Can ecosystems be managed to mitigate climate change?
Meehl et al. (2007) in Climate Change 2007: The Physical Science Basis, Solomon et al., Eds., 747-845
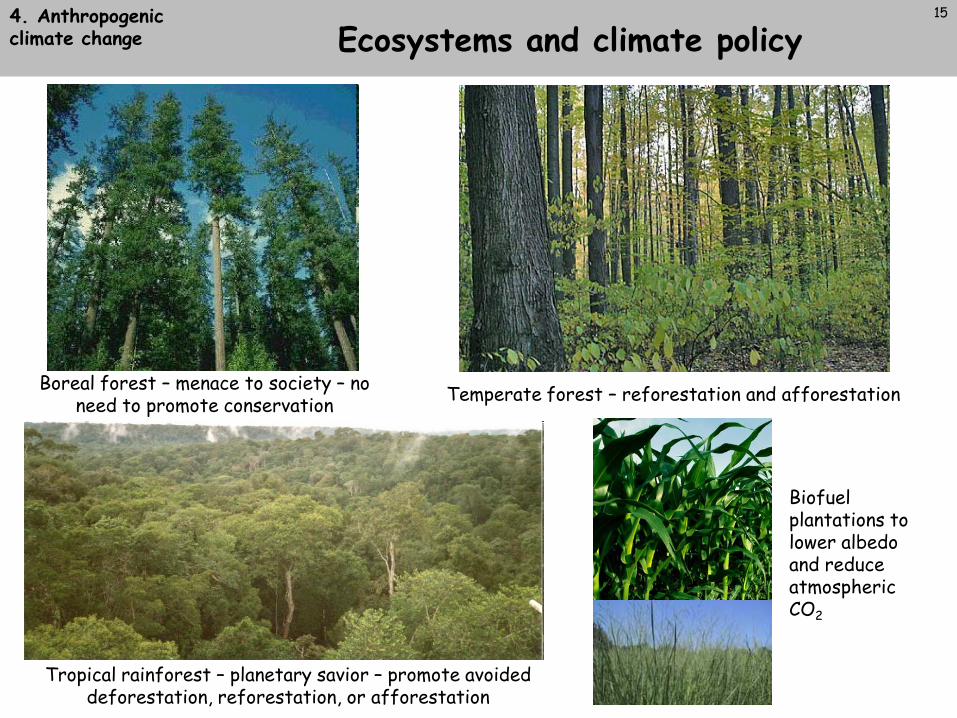
Tropical rainforest – planetary savior – promote avoided deforestation, reforestation, or afforestation
Boreal forest – menace to society – no need to promote conservation Temperate forest – reforestation and afforestation
Ecosystems and climate policy
Biofuel plantations to lower albedo and reduce atmospheric CO2
154. Anthropogenicclimate change

Climate models use mathematical formulas to simulate the physical, chemical, and biological processes that drive Earth’s climate
A typical climate model consists of coupled models of the atmosphere, ocean, sea ice, and land
Land is represented by its ecosystems, watersheds, people, and socioeconomic drivers of environmental change
The model provides a comprehensive understanding of the processes by which people and ecosystems affect, adapt to, and mitigate global change
(IPCC 2007)
Earth system models5. Models 16
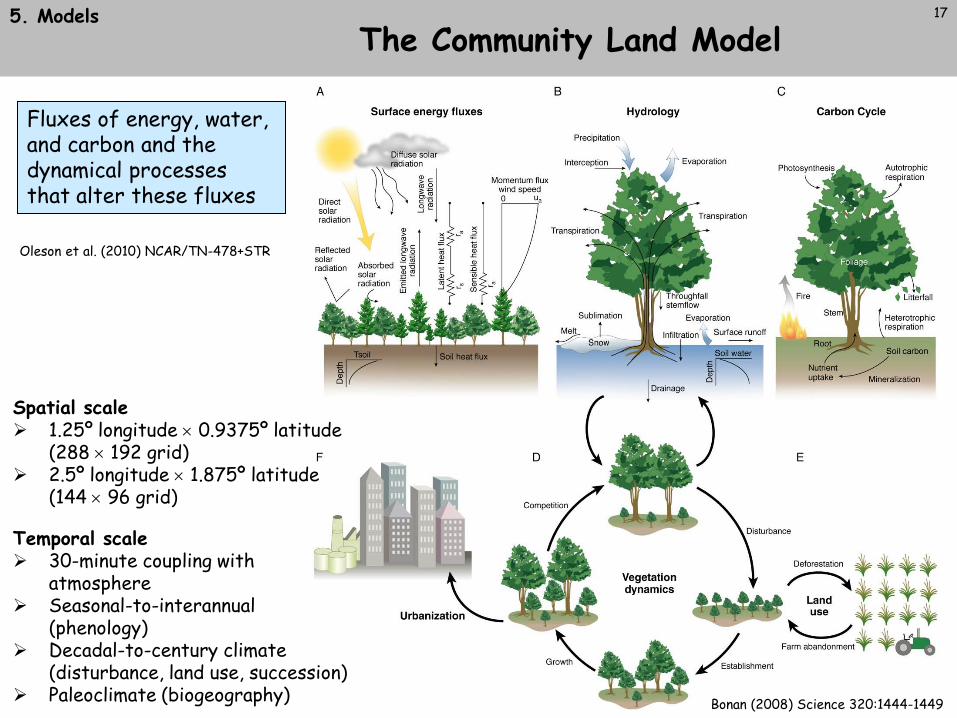
Bonan (2008) Science 320:1444-1449
The Community Land Model
Fluxes of energy, water, and carbon and the dynamical processes that alter these fluxes
Oleson et al. (2010) NCAR/TN-478+STR
Spatial scale 1.25º longitude × 0.9375º latitude
(288 × 192 grid) 2.5º longitude × 1.875º latitude
(144 × 96 grid)
Temporal scale 30-minute coupling with
atmosphere Seasonal-to-interannual
(phenology) Decadal-to-century climate
(disturbance, land use, succession) Paleoclimate (biogeography)
5. Models 17

CLM represents a model grid cell as a mosaic of up to 6 primary land cover types. Vegetated land is further represented as a mosaic of plant functional types
Bonan et al. (2002) GBC, 16, doi:10.1029/2000GB001360
Land surface heterogeneity
Glacier16.7%
Lake16.7%
Urban8.3%
Wet-land8.3%
Vegetated43.8%
Subgrid land cover and plant functional types
Crop 6.2%
1.25º in longitude (~100 km)
0.93
75º
in la
titu
de (~
100
km)
5. Models 18
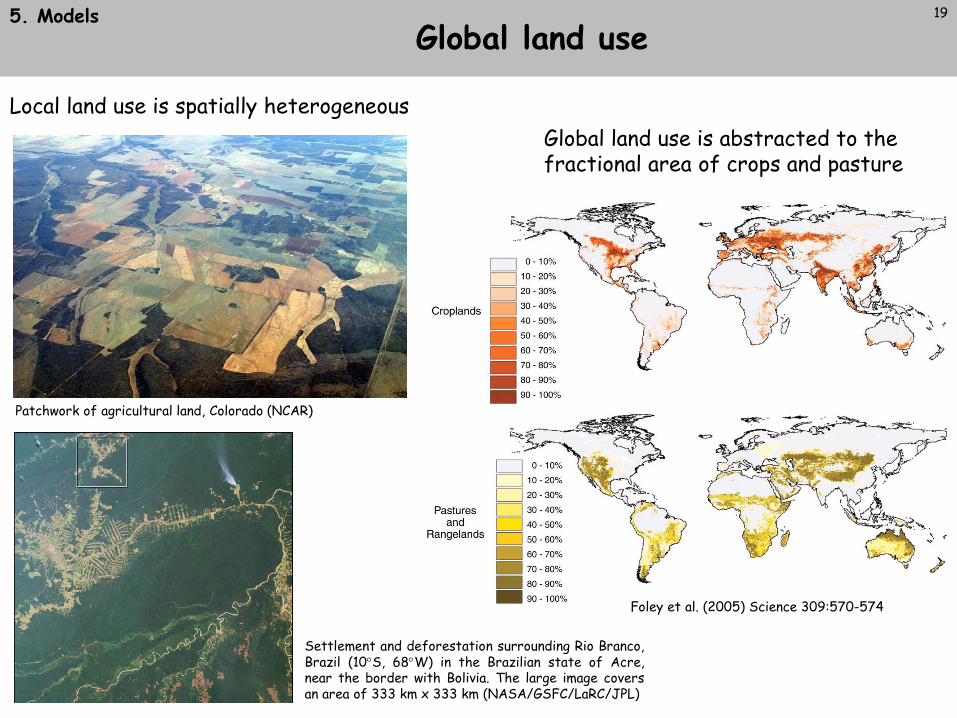
Global land use
Local land use is spatially heterogeneous
Patchwork of agricultural land, Colorado (NCAR)
Global land use is abstracted to the fractional area of crops and pasture
Foley et al. (2005) Science 309:570-574
Settlement and deforestation surrounding Rio Branco,Brazil (10°S, 68°W) in the Brazilian state of Acre,near the border with Bolivia. The large image coversan area of 333 km x 333 km (NASA/GSFC/LaRC/JPL)
5. Models 19

Stöckli et al. (2008) JGR, 113, doi:10.1029/2007JG000562
Flux tower measurements –temperate deciduous forest
Morgan Monroe State Forest, Indiana
5. Models 20
CLM3.0 – dry soil, low latent heat flux, high sensible heat flux
CLM3.5 – wetter soil, higher latent heat flux, lower sensible heat flux
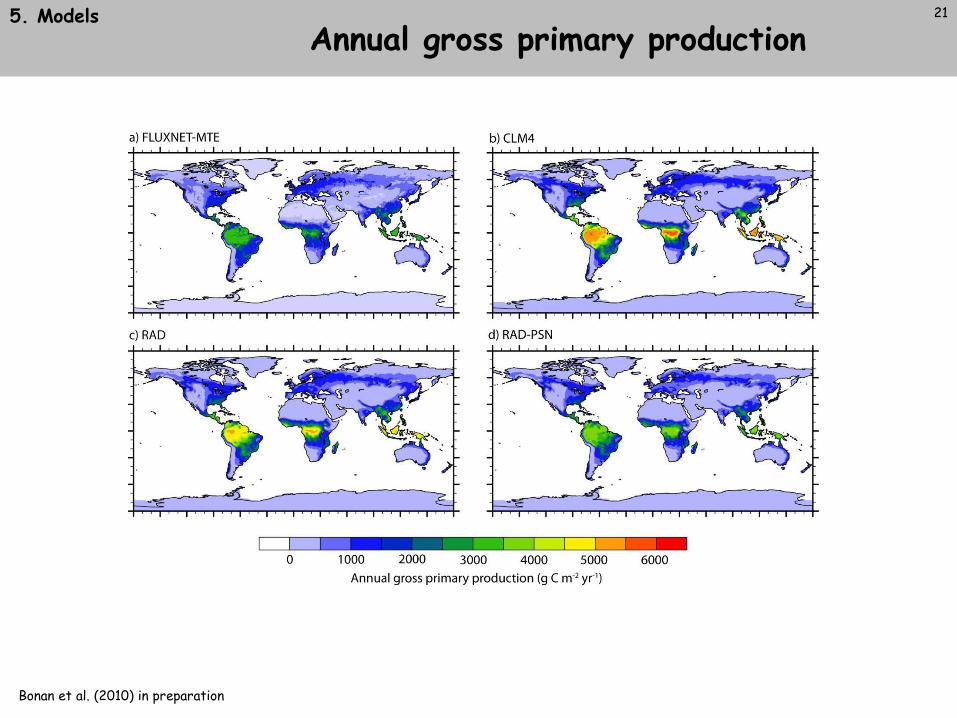
215. ModelsAnnual gross primary production
Bonan et al. (2010) in preparation

Annual net primary production
Randerson et al. (2009) GCB 15:2462-2484
Ecosystem Model-Data Intercomparison (EMDI) compilation of observations
•Class A (81 sites)•Class B (933 sites)
NPP extracted for each model grid cell corresponding to a measurement location
5. Models 22

Eddy covariance flux tower(courtesy Dennis Baldocchi)
Hubbard Brook Ecosystem Study
Environmental Monitoring Experimental Manipulation
Soil warming, Harvard Forest
CO2 enrichment, Duke Forest
Planetary energeticsPlanetary ecologyPlanetary metabolism
Integrate ecological studies with earth system models
Test model-generated hypotheses of earth system functioning with observations
5. Models
CO2 × N enrichment, Cedar Creek
23
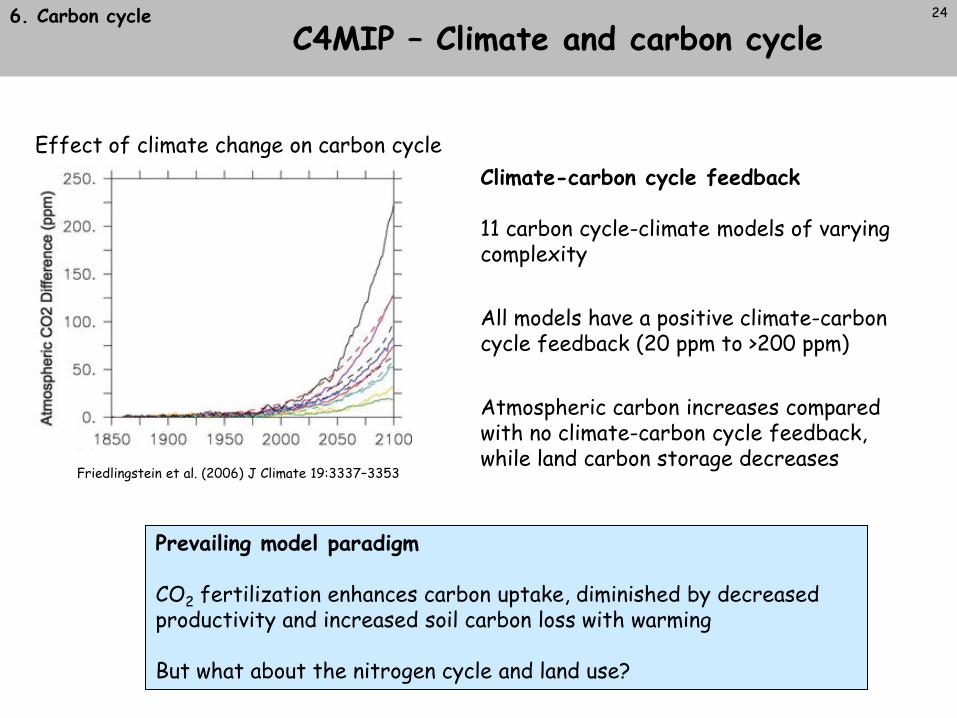
Effect of climate change on carbon cycleClimate-carbon cycle feedback
11 carbon cycle-climate models of varying complexity
All models have a positive climate-carbon cycle feedback (20 ppm to >200 ppm)
Atmospheric carbon increases compared with no climate-carbon cycle feedback, while land carbon storage decreases
Friedlingstein et al. (2006) J Climate 19:3337–3353
Prevailing model paradigm
CO2 fertilization enhances carbon uptake, diminished by decreased productivity and increased soil carbon loss with warming
But what about the nitrogen cycle and land use?
C4MIP – Climate and carbon cycle6. Carbon cycle 24
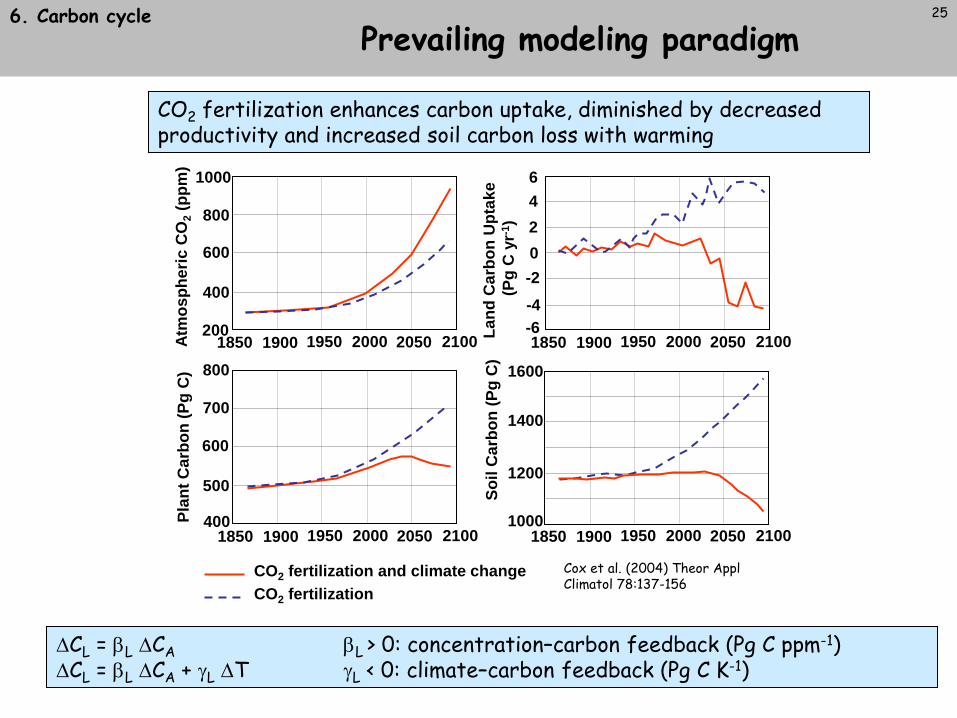
CO2 fertilization enhances carbon uptake, diminished by decreased productivity and increased soil carbon loss with warming
Atm
osph
eric
CO
2(p
pm)
1850 1900 1950 2000 2050 2100 1850 1900 1950 2000 2050 2100200
400
600
800
1000
Land
Car
bon
Upt
ake
(Pg
C y
r-1)
0246
-2-4-6
1850 1900 1950 2000 2050 2100 1850 1900 1950 2000 2050 2100
Plan
t Car
bon
(Pg
C)
400
500
600
700
800
1000
1200
1400
1600
Soil
Car
bon
(Pg
C)
CO2 fertilization and climate changeCO2 fertilization
Cox et al. (2004) Theor Appl Climatol 78:137-156
Prevailing modeling paradigm6. Carbon cycle
∆CL = βL ∆CA βL > 0: concentration–carbon feedback (Pg C ppm-1)∆CL = βL ∆CA + γL ∆T γL < 0: climate–carbon feedback (Pg C K-1)
25

Carbon-nitrogen interactions
Land biosphere response to CO2
Thick solid line is with preindustrial nitrogen depositionThick dashed line is with anthropogenic nitrogen depositionThin gray lines are C4MIP models
Land biosphere response to temperature
Thornton et al. (2009) Biogeosci 6:2099–2120
6. Carbon cycle
Reduces concentration–carbon feedback (βL) Nitrogen limitation reduces the CO2 fertilization gain in productivity
Changes sign of climate–carbon feedback (γL) Greater N mineralization with warming stimulates plant growth
Sokolov et al. (2008) J Climate 21:3776-3796 Thornton et al. (2009) Biogeosci 6:2099–2120
26

27
Population of the world, 1950-2050, according to different projection
variants (in billion)
Source: United Nations, Department of Economic and Social Affairs, Population Division (2009): World Population Prospects: The 2008 Revision. New York
The Anthropocene7. Land use
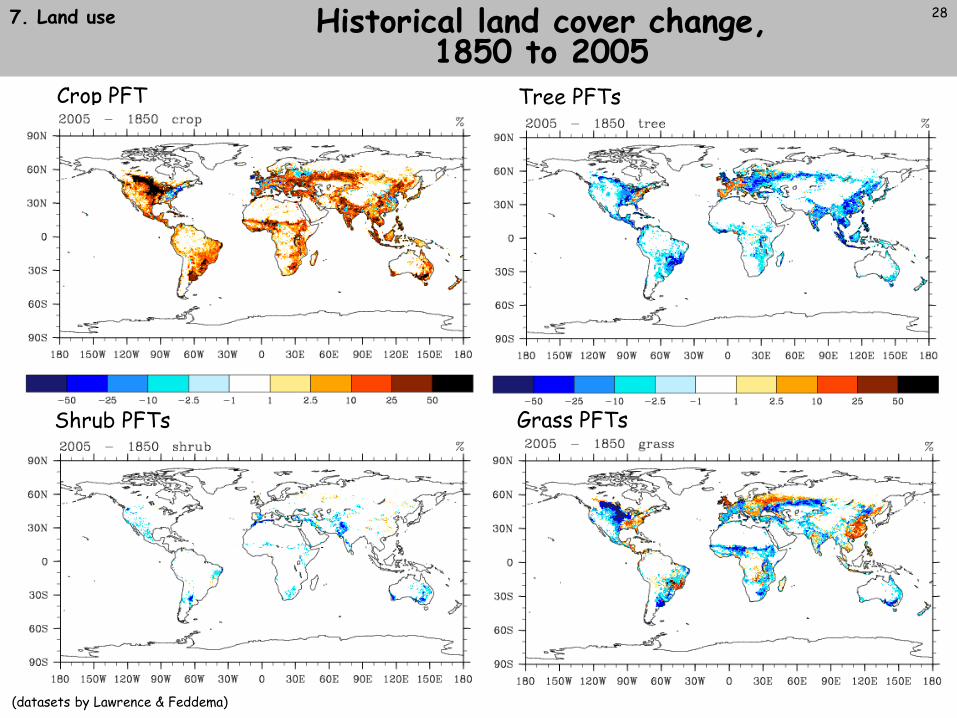
Grass PFTs
Crop PFT
Shrub PFTs
Historical land cover change, 1850 to 2005
(datasets by Lawrence & Feddema)
7. Land use 28
Tree PFTs
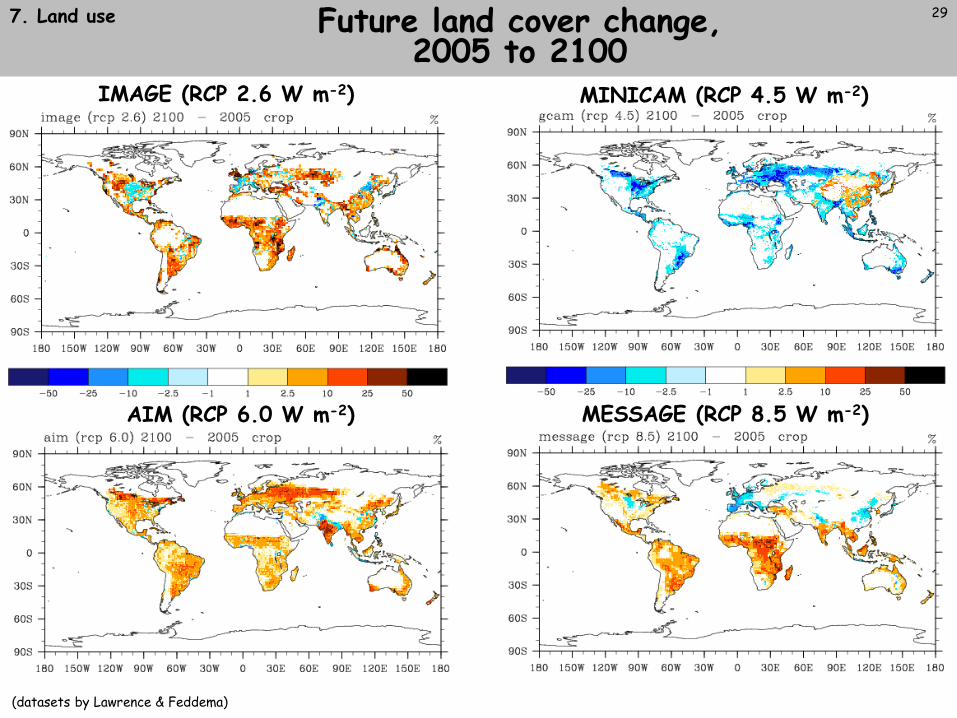
MINICAM (RCP 4.5 W m-2)
MESSAGE (RCP 8.5 W m-2)
IMAGE (RCP 2.6 W m-2)
AIM (RCP 6.0 W m-2)
7. Land use
(datasets by Lawrence & Feddema)
29Future land cover change, 2005 to 2100

Future land cover change, 2005 to 2100
7. Land use
(datasets by Lawrence & Feddema)
30
MINICAM (RCP 4.5 W m-2)
MESSAGE (RCP 8.5 W m-2)
IMAGE (RCP 2.6 W m-2)
AIM (RCP 6.0 W m-2)
(datasets by Lawrence & Feddema)
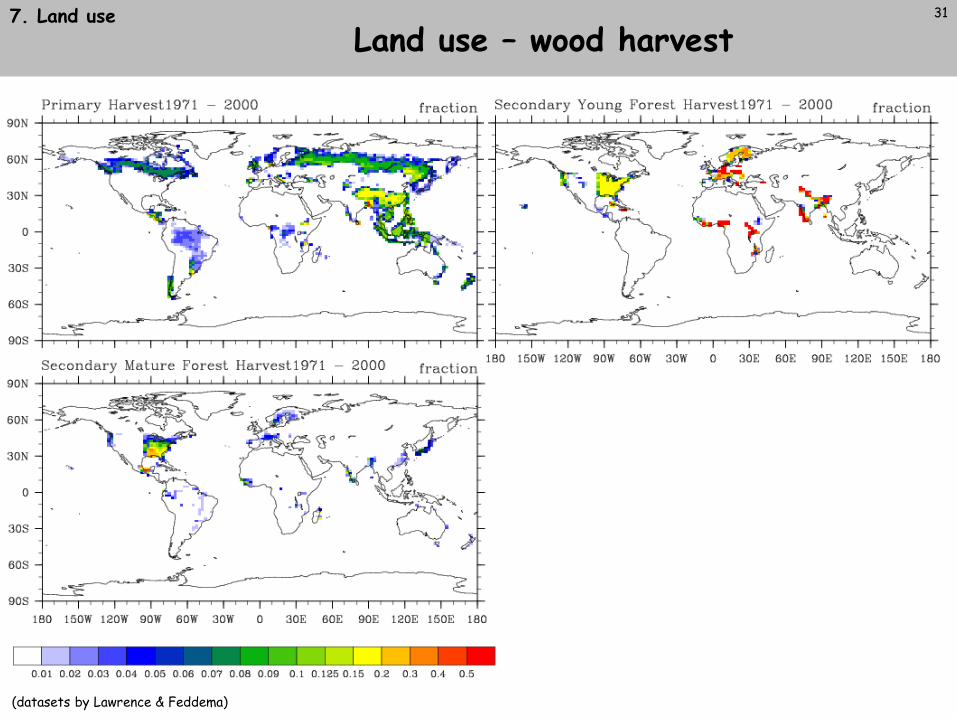
Land use – wood harvest7. Land use 31
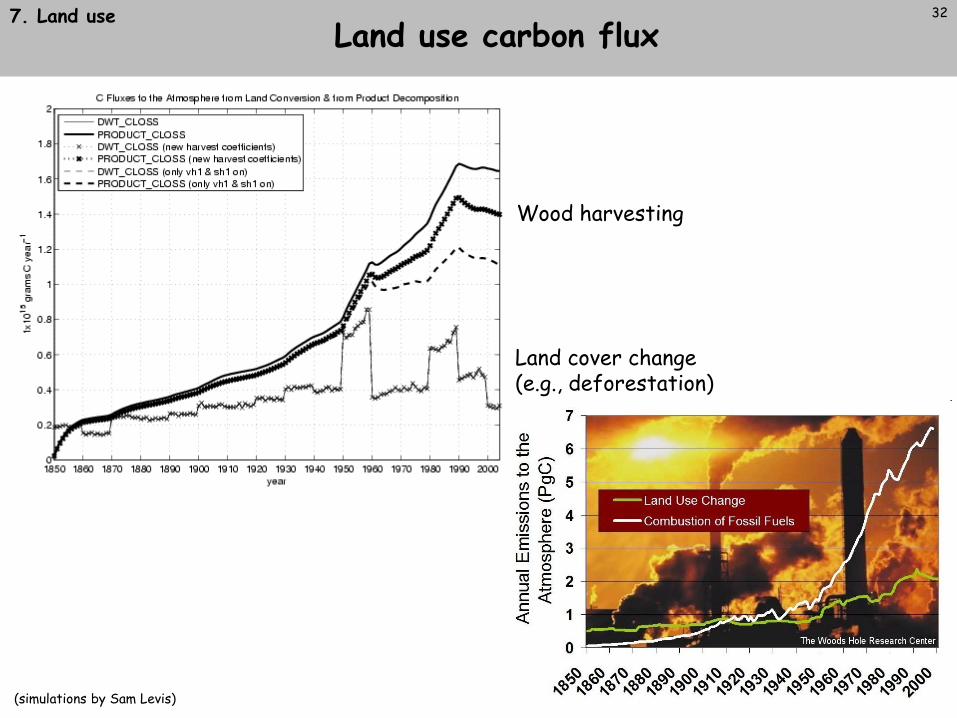
(simulations by Sam Levis)
7. Land useLand use carbon flux
Land cover change(e.g., deforestation)
Wood harvesting
32

7. Land useLand use carbon flux
Global Carbon Project (www.globalcarbonproject.org)
Three different harvest algorithms
(simulations by Sam Levis)
33
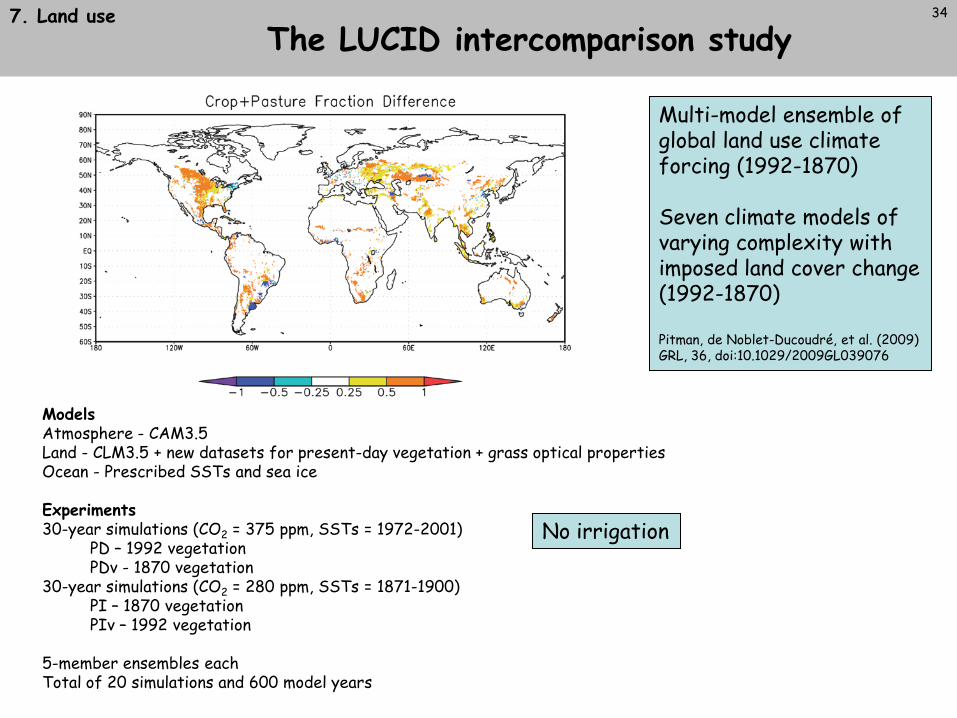
ModelsAtmosphere - CAM3.5Land - CLM3.5 + new datasets for present-day vegetation + grass optical propertiesOcean - Prescribed SSTs and sea ice
Experiments30-year simulations (CO2 = 375 ppm, SSTs = 1972-2001)
PD – 1992 vegetationPDv - 1870 vegetation
30-year simulations (CO2 = 280 ppm, SSTs = 1871-1900)PI – 1870 vegetationPIv – 1992 vegetation
5-member ensembles eachTotal of 20 simulations and 600 model years
Multi-model ensemble of global land use climate forcing (1992-1870)
Seven climate models of varying complexity with imposed land cover change (1992-1870)
Pitman, de Noblet-Ducoudré, et al. (2009) GRL, 36, doi:10.1029/2009GL039076
No irrigation
The LUCID intercomparison study7. Land use 34
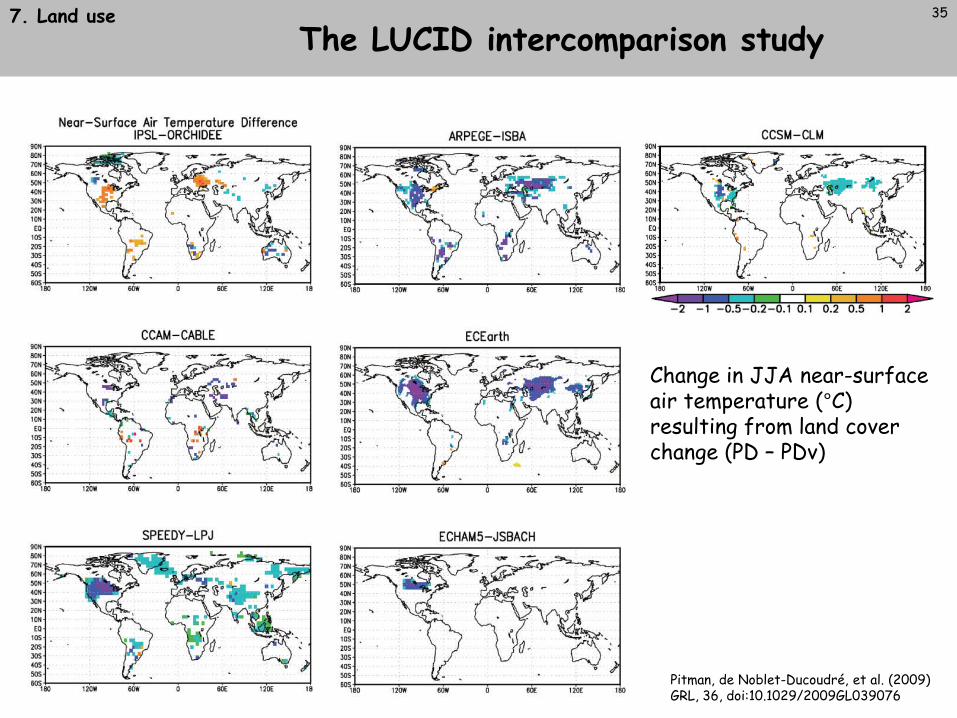
Change in JJA near-surface air temperature (°C) resulting from land cover change (PD – PDv)
The LUCID intercomparison study
Pitman, de Noblet-Ducoudré, et al. (2009) GRL, 36, doi:10.1029/2009GL039076
7. Land use 35

Change in JJA latent heat flux (W m-2) resulting from land cover change (PD – PDv)
The LUCID intercomparison study7. Land use 36
Pitman, de Noblet-Ducoudré, et al. (2009) GRL, 36, doi:10.1029/2009GL039076
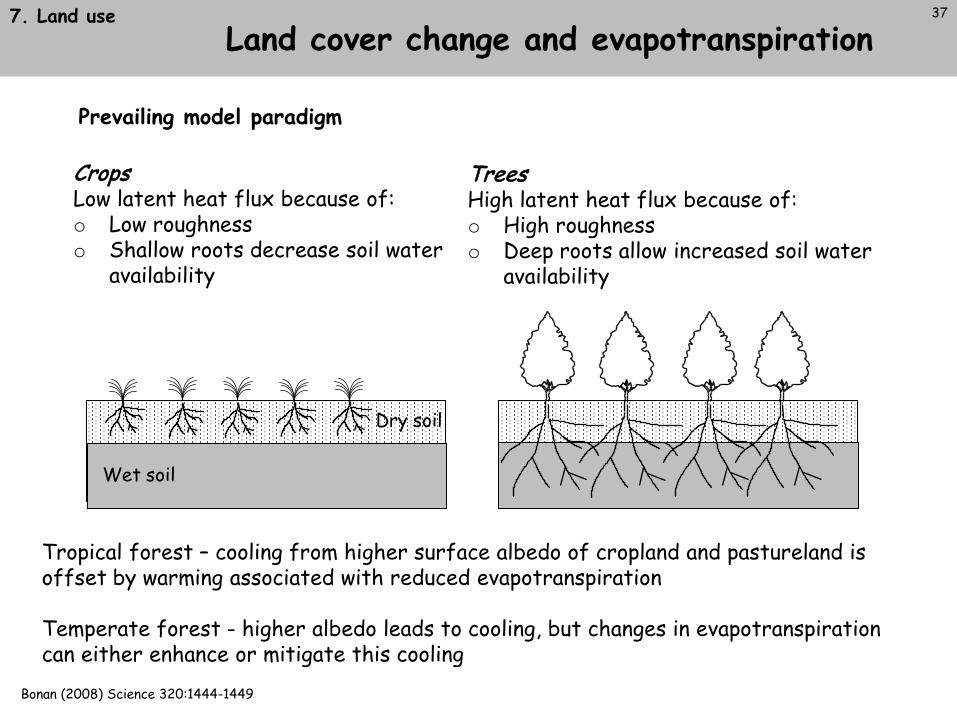
TreesHigh latent heat flux because of:o High roughness o Deep roots allow increased soil water
availability
CropsLow latent heat flux because of:o Low roughness o Shallow roots decrease soil water
availability
Wet soil
Dry soil
Tropical forest – cooling from higher surface albedo of cropland and pastureland is offset by warming associated with reduced evapotranspiration
Temperate forest - higher albedo leads to cooling, but changes in evapotranspiration can either enhance or mitigate this cooling
Land cover change and evapotranspiration
Prevailing model paradigm
Bonan (2008) Science 320:1444-1449
7. Land use 37
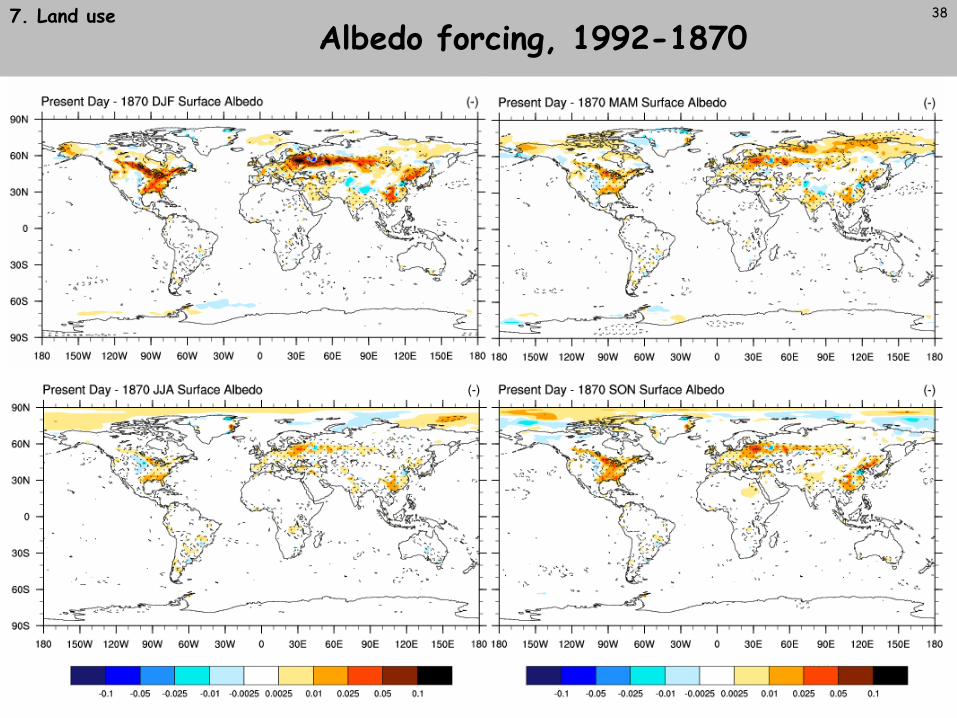
Albedo forcing, 1992-18707. Land use 38
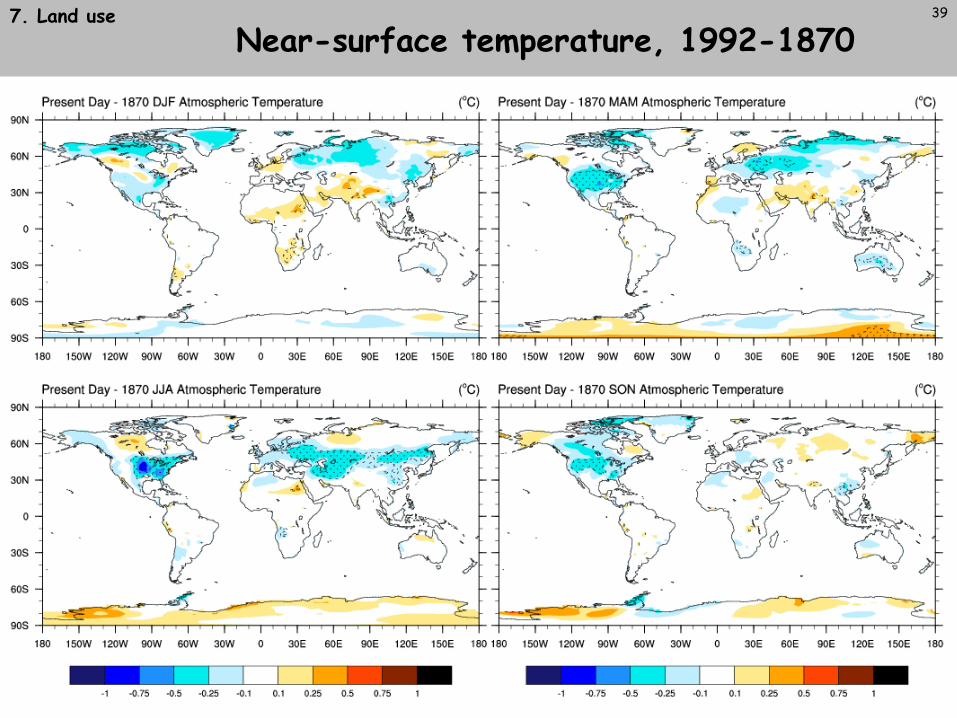
Near-surface temperature, 1992-18707. Land use 39

Carbon cycle
o CO2 fertilization enhances carbon gain, diminished by carbon loss with warming
o N cycle reduces the concentration–carbon gain and decreases climate–carbon loss
o The CO2 fertilization effect is larger than the climate feedback effect
Human influences on the biosphere - land use and land cover change
Biogeochemistryo Land use flux is important, especially the wood harvest flux o Uncertainty in land use flux may be greater than the N-cycle feedback
Biogeophysicso Higher albedo of croplands cools climateo Less certainty about role of evapotranspirationo Implementation of land cover change (spatial extent, crop
parameterization) matters
ConclusionsThe ecology of climate models
o Detailed representation of ecosystemso Allows exploration of ecological feedbacks and mitigation options,
principally related to albedo, evapotranspiration, and carbon
408. Conclusions

41
Conveys the views Americans at that time felt toward forests. The forest on the left is threatening. The farmland on the right is serene.
Climate benefits of forests
Thomas Cole – “View from Mount Holyoke, Northampton, Massachusetts, after a Thunderstorm (The Oxbow)”, 1836
8. Conclusions
42
Bonan (2008) Ecological Climatology. 2nd ed (Cambridge Univ. Press)
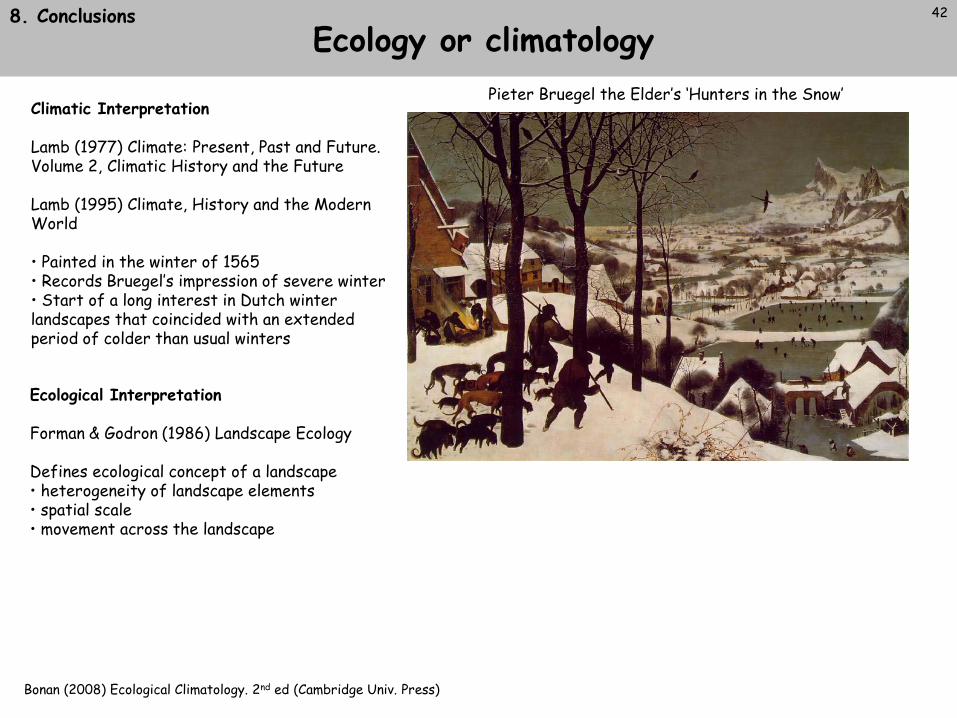
Pieter Bruegel the Elder’s ‘Hunters in the Snow’Climatic Interpretation
Lamb (1977) Climate: Present, Past and Future. Volume 2, Climatic History and the Future
Lamb (1995) Climate, History and the Modern World
• Painted in the winter of 1565• Records Bruegel’s impression of severe winter• Start of a long interest in Dutch winter landscapes that coincided with an extended period of colder than usual winters
Ecological Interpretation
Forman & Godron (1986) Landscape Ecology
Defines ecological concept of a landscape• heterogeneity of landscape elements• spatial scale• movement across the landscape
Ecology or climatology8. Conclusions