cnr institute for coastal marine environment, …cnr ‐ institute for coastal marine environment,...
TRANSCRIPT
CNR CNR ‐‐
Institute for Coastal Marine Environment, TarantoInstitute for Coastal Marine Environment, Taranto
Fernando RUBINO, Laura GIORDANO, Paride BISCI, Carmela CAROPPOFernando RUBINO, Laura GIORDANO, Paride BISCI, Carmela CAROPPO
University of MoliseUniversity of Molise
Nadia PALMIERI, Marina FORLEONadia PALMIERI, Marina FORLEO
University of SalentoUniversity of Salento
Giovanna BELLIO, Anna TRONOGiovanna BELLIO, Anna TRONO
Stazione Zoologica, NaplesStazione Zoologica, Naples
Vincenzo BOTTEVincenzo BOTTE
Thessaloniki Cluster Meeting , 20‐21 October 2009
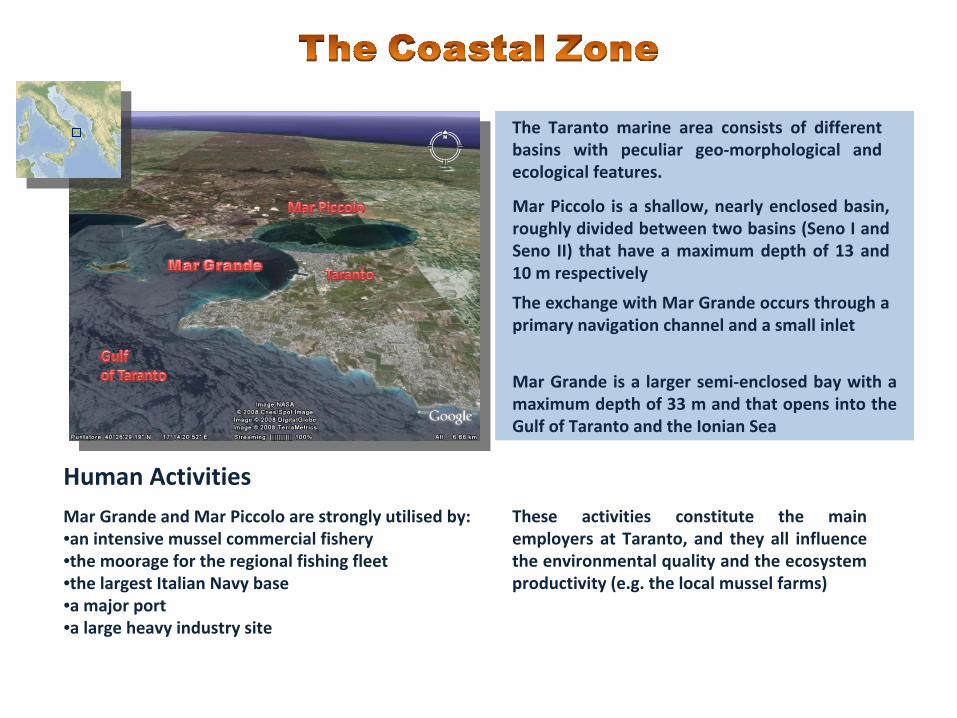
The
Taranto
marine
area
consists
of
different
basins
with
peculiar
geo‐morphological
and
ecological features.
Human ActivitiesMar Grande and Mar Piccolo are strongly utilised by:•an intensive mussel commercial fishery•the moorage for the regional fishing fleet•the largest Italian Navy base•a major port•a large heavy industry site
Mar
Piccolo
is
a
shallow,
nearly
enclosed
basin,
roughly divided between two basins (Seno I and
Seno
II)
that
have
a
maximum
depth
of
13
and
10 m respectively
The exchange with Mar Grande occurs through a
primary navigation channel and a small inlet
Mar
Grande
is
a
larger
semi‐enclosed
bay
with
a
maximum depth of 33 m and that opens into the
Gulf of Taranto and the Ionian Sea
These
activities
constitute
the
main
employers
at
Taranto,
and
they
all
influence
the environmental quality and the ecosystem
productivity (e.g. the local mussel farms)

The
circulation
is
driven
by
a
positive
water
balance
(runoff
+
precipitation
–
evaporation >0) of ~40 million m3/yr.
The estuarine flushing (~ 2‐3 mos)
due to the exchange through the inlet
is moderate and varies seasonally
depending on the pressure
differences with the Mar Grande.
During summer season a weak
stratification develops that
induces hypoxia in the lower
layer.
Most of the water input derives from 34 submarine freshwater springs (locally called "Citri") and the discharge
from small drainage
ditchs
that carry agricultural chemicals.
In addition, there is the combined discharge of 14 sewage pipes coming from the northern area of Taranto and
from 8 nearby towns. These discharges account for about 18,272 m3 d‐1 (of which 85% at the Second Inlet),
with organic matter equal to 6,767 kg d‐1 of BOD5.
Wind mixing is low due to the limited fetch and tidal‐mixing is low due to the limited tidal range of ~ 30‐40 cm
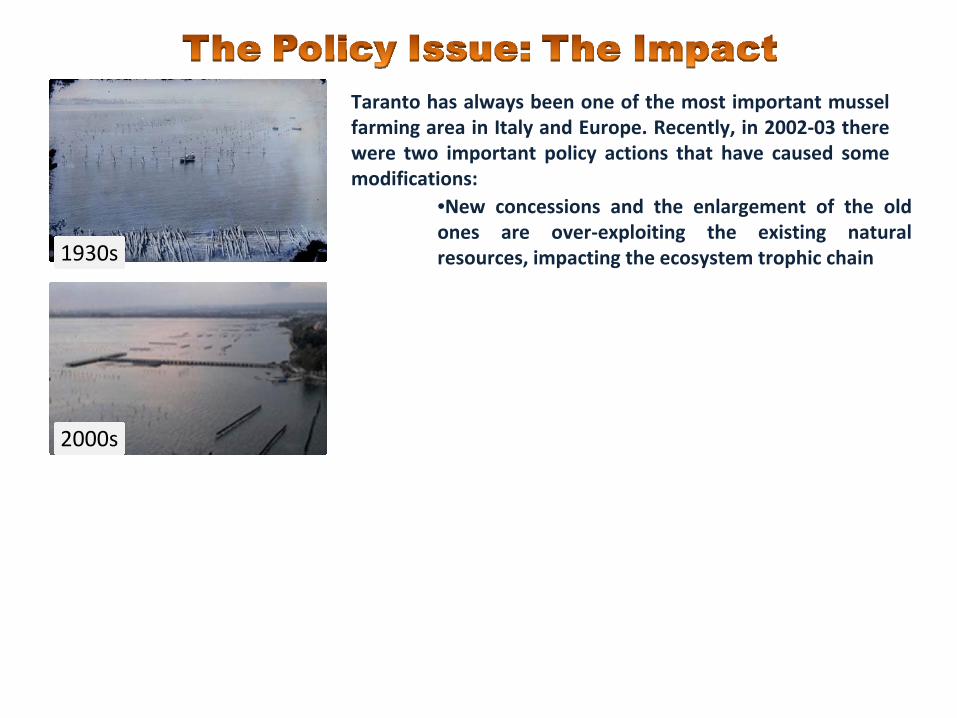
Taranto has
always
been
one
of
the
most important
mussel
farming area in Italy and Europe. Recently, in 2002‐03 there
were
two
important
policy
actions
that
have
caused
some
modifications:
1930s
2000s
•New
concessions
and
the
enlargement
of
the
old
ones
are
over‐exploiting
the
existing
natural
resources, impacting the ecosystem
trophic
chain

Before 2000 Today Not permitted area
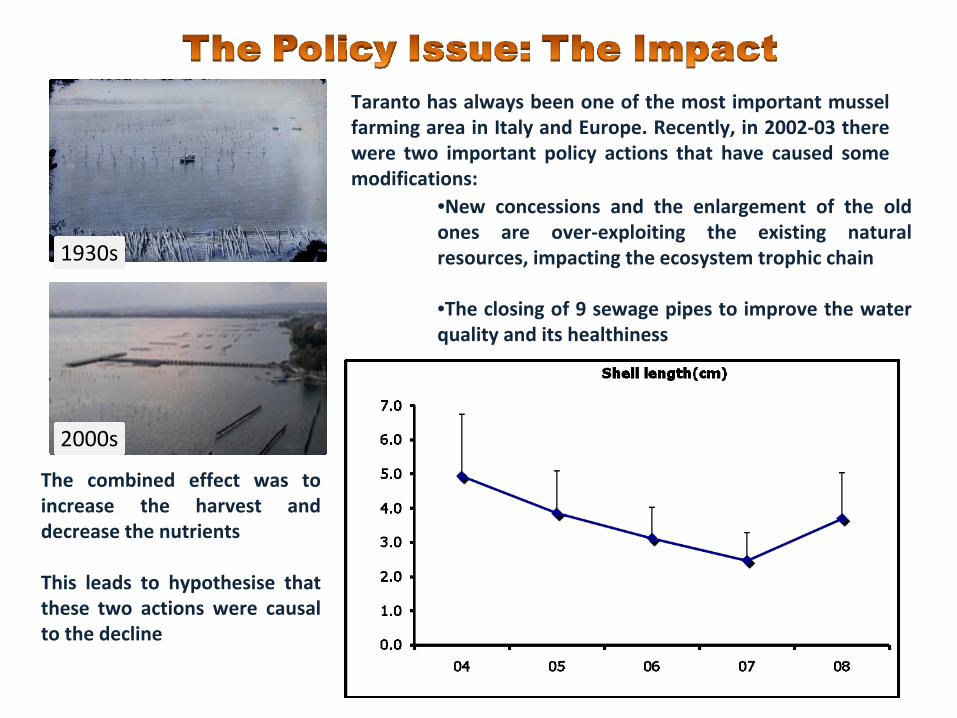
Taranto has
always
been
one
of
the
most important
mussel
farming area in Italy and Europe. Recently, in 2002‐03 there
were
two
important
policy
actions
that
have
caused
some
modifications:
1930s
2000s
•New
concessions
and
the
enlargement
of
the
old
ones
are
over‐exploiting
the
existing
natural
resources, impacting the ecosystem
trophic
chain
•The
closing
of
9
sewage
pipes to improve
the
water
quality and its healthiness
The
combined
effect
was
to
increase
the
harvest
and
decrease the nutrients
This
leads
to
hypothesise
that
these
two
actions
were
causal
to the decline
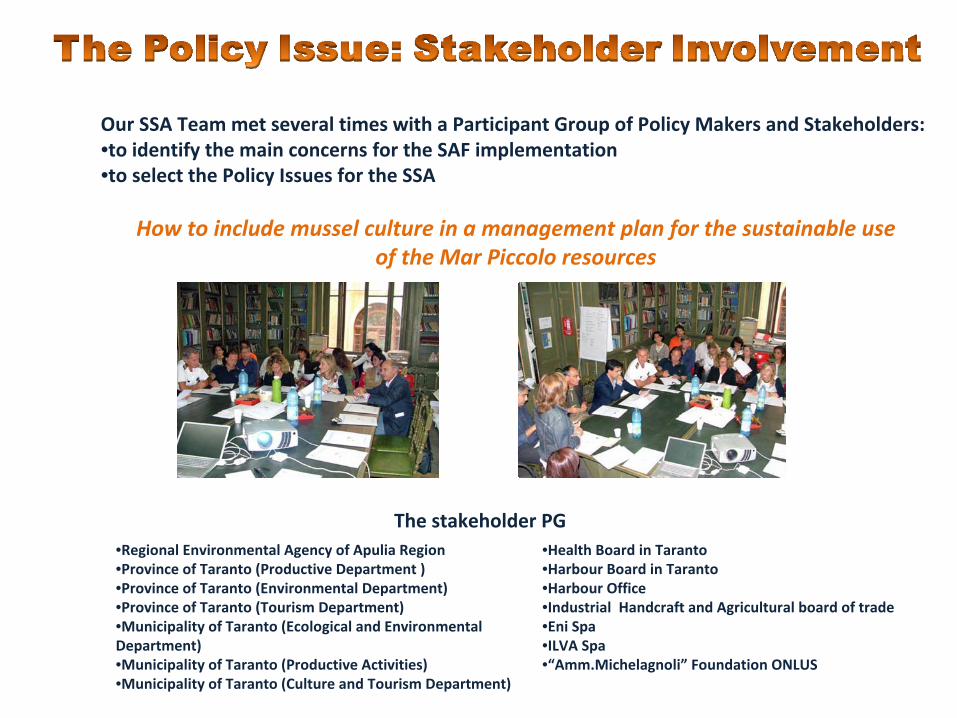
Our SSA Team met several times with a Participant Group of Policy Makers and Stakeholders:•to identify the main concerns for the SAF implementation•to select the Policy Issues for the SSA
How to include mussel culture in a management plan for the sustainable useof the Mar Piccolo resources
•Regional Environmental Agency of Apulia Region •Province of Taranto (Productive Department )•Province of Taranto (Environmental Department)•Province of Taranto (Tourism Department)•Municipality of Taranto (Ecological and Environmental
Department)•Municipality of Taranto (Productive Activities)•Municipality of Taranto (Culture and Tourism Department)
The stakeholder PG•Health Board in Taranto•Harbour Board in Taranto•Harbour Office•Industrial Handcraft and Agricultural board of trade •Eni Spa•ILVA Spa•“Amm.Michelagnoli”
Foundation ONLUS

Major aimDecision‐making
information on
policy options
Improvement of the
quantity and quality of
mussel culture
•How do different stakeholders perceive water quality?
•What are their demands with respect to water quality?
•Can a “good”
water quality be reached in such impacted basin?
•If no what would be the alternatives?•What are the sustainable policy options for reducing the decline
of the productivity and
quality of the mussels?
•How can this be done to the best long‐term interest of the end‐users and preserve the bio‐
productivity of the Mar Piccolo?
•What trade‐offs and options would minimize such policy decisions?
To outline the approach:
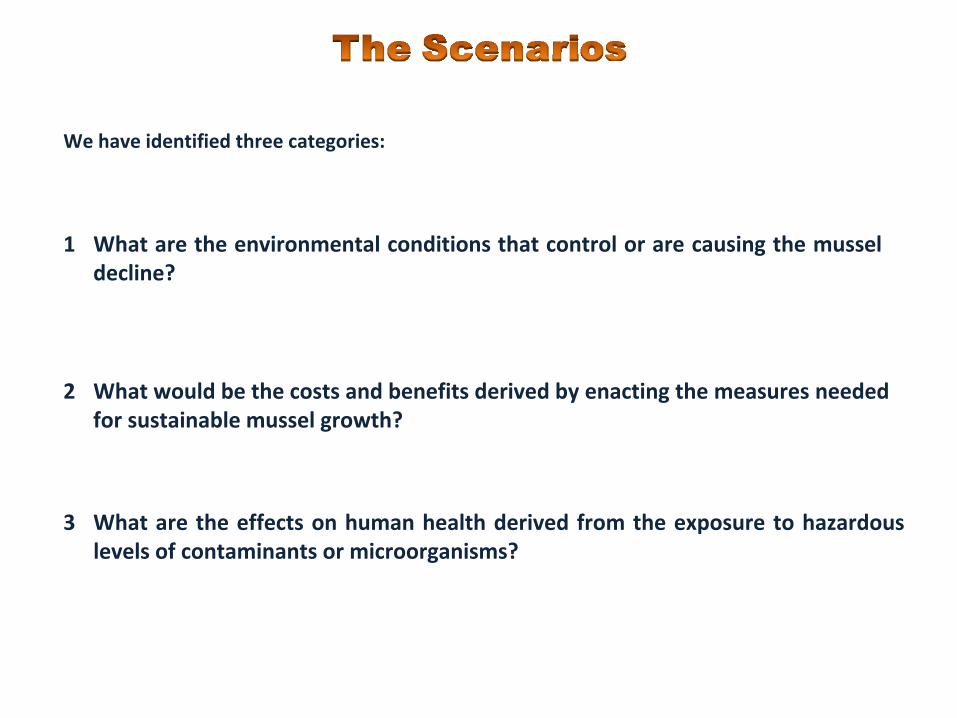
We have identified three categories:
What are the environmental conditions that control or are
causing
the
mussel
decline?
1
2 What would be the costs and benefits derived by enacting the measures needed
for sustainable mussel growth?
3 What
are
the
effects
on
human
health
derived
from
the
exposure
to
hazardous
levels of contaminants or microorganisms?

The VS functionality with regard to the Impact (reduction in mussel size) and the causal
set of environmental conditions driven by its waste discharges

Scarce Information on:
•Geo‐Chem‐Bio‐Physical Variables
•Ecosystem Functioning and Carrying Capacity
•Freshwater Fluxes from Streams, Land Drainage, and Aquifers
•Input Data on Waste Discharge (nutrients, particulate matter, synthetic chemicals)
Lacking Data on:
•Observational Sampling: e.g. Time Series, Depth Profiles, Spatial Coverage
•Process Observations: e.g. Primary Productivity, Sedimentation Rates, Mussel Filtration
Rates and Assimilation
Ecological Data

MARKET DATA•Official prices were not available (maybe inexistent) for the Taranto market•Official harvest figures were also not available (maybe inexistent)•Quantitative estimate of Illegal production was not available
Lacking of Socio‐Economic Data
FINANCIAL BUDGET OF THE MUSSEL FARMS•None of the major operation costs were available yet (!)•Distribution of revenue was not available yet (!)•We are waiting for the data from Chamber of Commerce
HEALTH COSTS•Were not available for the public costs concerning exposure to mercury and PAHs due
to mussel consumption
WILLINGNESS TO PAY•At present we have not completed the analysis of questionnaires
on willingness to pay
and public perceptions

Forcing Data Inputs
Fresh-WaterBalance
Circulation -Exchange
2-layer, 2-basin
VerticalDiffusion
SaltBudget
NitrogenBudget
Phosphate& SilicateBudgets
PrimaryProduction3 size classes
OxygenBudget
Zooplankton ParticulateOrganic MatterLight
Mussel GrowthLarva-Juvenile-Adult
Mussel Harvest
Mar Piccolo Ecological Model by ComponentsGreen arrows are primary mass fluxes , Red arrows are primary feedbacks
Sediment &Regeneration
EconomicComponent
The major components of the Ecological Component model (Extend) for the Mar Piccolo
Only the primary interactions are shown

Fresh Water discharges into Seno II, Mar Piccolo in 2003
0 45.625 91.25 136.875 182.5 228.125 273.75 319.375 3650
11500
23000
34500
46000
57500
69000
80500
92000
Time
Volume flux, m3/dFW sorces for Seno II
The various runoff components freshwater input to Seno II, Mar PiccoloThese were derived from annual means using simple land‐runoff block
Annual MeansAyedda
Channel,
Obs: 6,600 Mod: 6,629
Riso & Cervaro River, Obs: 19,267 Mod: 19,195Le
Copre
Aquifer, Obs: 8640 Mod: 8718 Taranto urban runoff,
Obs: ?? Mod:9491

-0.6218058 45.00319 90.62819 136.2532 181.8782 227.5032 273.1282 318.7532 364.37820
30
60
90
120
150
180
210
240
Time
Fllushing time,daysFlushing of total system
Mean = 78 days
The daily flushing value (outflow/volume) for Seno II
0 45.625 91.25 136.875 182.5 228.125 273.75 319.375 3650
250000
500000
750000
1000000
1250000
1500000
1750000
2000000
Time
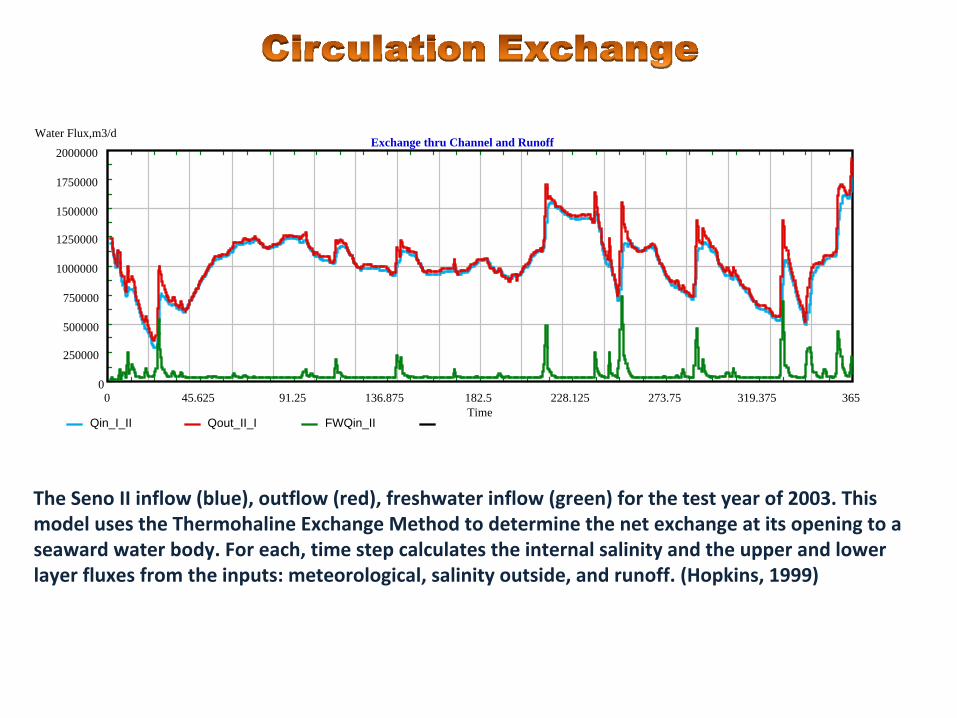
Water Flux,m3/dExchange thru Channel and Runoff
Qin_I_II Qout_II_I FWQin_II
The Seno II inflow (blue), outflow (red), freshwater inflow (green) for the test year of 2003. This
model uses the
Thermohaline
Exchange Method to determine the net exchange at its opening to
a
seaward water body. For each, time step calculates the internal salinity and the upper and lower
layer fluxes from the inputs: meteorological, salinity outside, and runoff. (Hopkins, 1999)
0 60.83333 121.6667 182.5 243.3333 304.1667 36532
33
34
35
36
37
38
39
40
Time
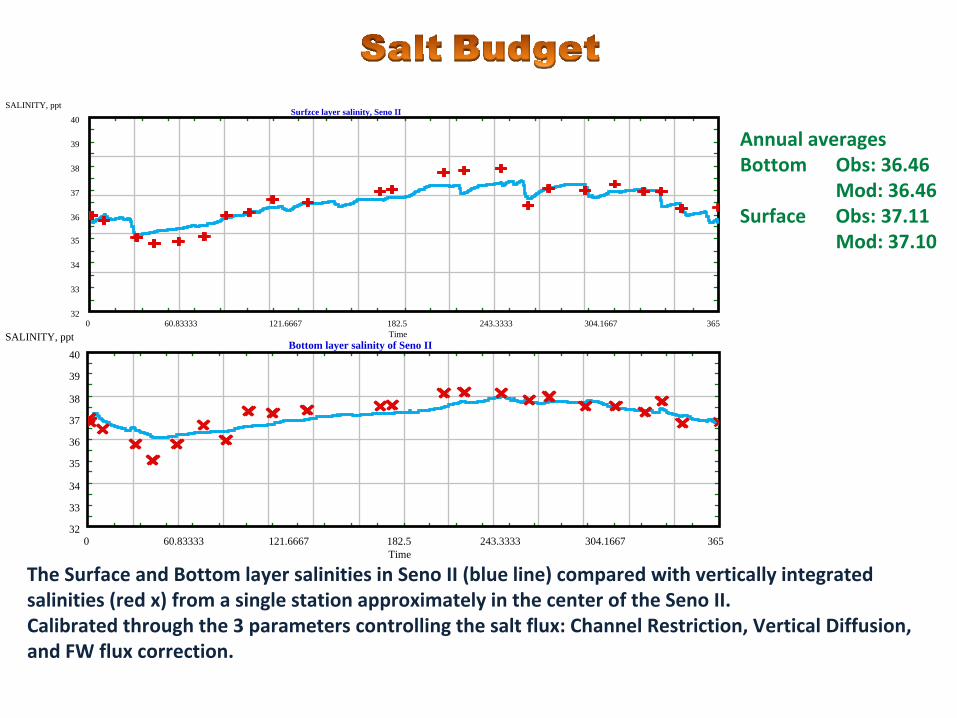
SALINITY, pptSurfzce layer salinity, Seno II
The Surface and Bottom layer salinities in Seno II (blue line) compared with vertically integrated
salinities (red x) from a single station approximately in the center of the Seno II. Calibrated through the 3 parameters controlling the salt flux: Channel Restriction, Vertical Diffusion,
and FW flux correction.
0 60.83333 121.6667 182.5 243.3333 304.1667 36532
33
34
35
36
37
38
39
40
Time
SALINITY, pptBottom layer salinity of Seno II
Annual averagesBottom
Obs: 36.46
Mod: 36.46
Surface
Obs: 37.11
Mod: 37.10

0 60.83333 121.6667 182.5 243.3333 304.1667 3652
5.5
9
12.5
16
Time
OXYGEN, mg/lSurface Layer Oxygen, Seno II
0 60.83333 121.6667 182.5 243.3333 304.1667 3652
5.5
9
12.5
16
Time
OXYGEN, mg/lBottom Layer Oxygen, Seno II
The Surface and Bottom layer Oxygen in Seno II (blue line) compared with vertically
integrated oxygen (red x) from a single station approximately in
the center of the Seno II. Fine
tuning of calibration has not been done yet awaiting refinements
in the Nitrogen and
Phytoplankton Components.
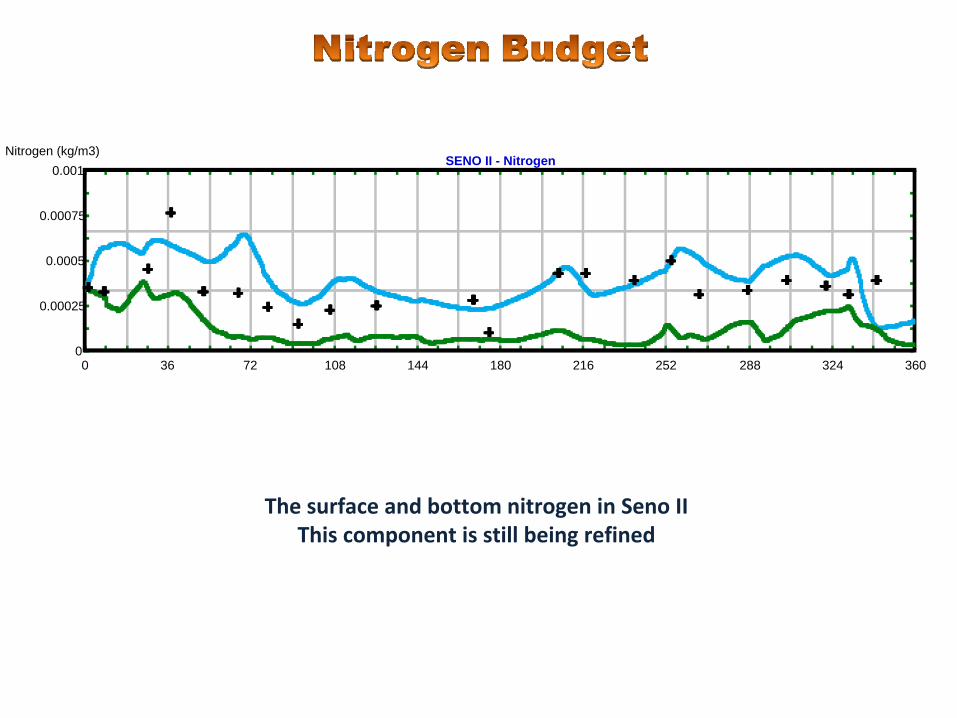
The surface and bottom nitrogen in Seno IIThis component is still being refined
0 36 72 108 144 180 216 252 288 324 3600
0.00025
0.0005
0.00075
0.001Nitrogen (kg/m3)
SENO II - Nitrogen
6/1/2003 26/4/2003 14/8/2003 2/12/2003 21/3/2004 9/7/2004 27/10/2004692043.1
1.80190e+07
3.53460e+07
5.26730e+07
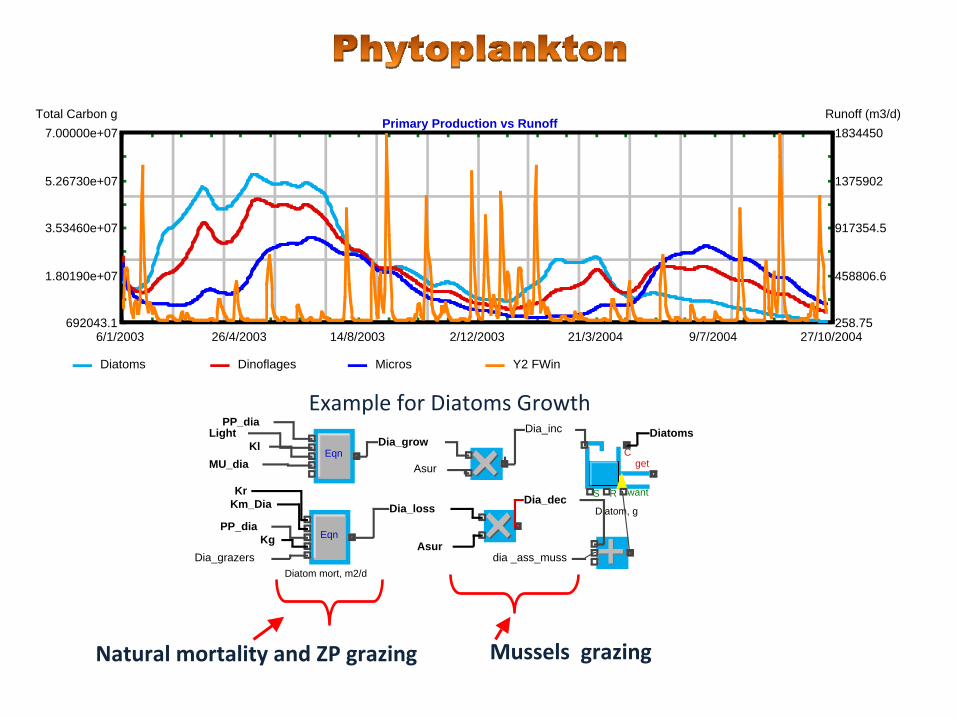
7.00000e+07Total Carbon g
Primary Production vs Runoff
258.75
458806.6
917354.5
1375902
1834450Runoff (m3/d)
Diatoms Dinoflages Micros Y2 FWin
getC
RS want
Diatom, g
Diatoms
Eqn
PP_dia
Dia_grow
Dia_grazers
KlLight Dia_inc
Asur
Kr
Eqn
Diatom mort, m2/d
Km_Dia
PP_diaKg
Dia_lossDia_dec
Asur
MU_dia
dia _ass_muss
Example for Diatoms Growth
Natural mortality and ZP grazing Mussels grazing

wrap distance
number of lines
Mussels Farm
8000
0
8000
line length
2
0
2
250
0
247.5
wrap leng
4
2
3.72
Mussels FarmControls
Help
Dimensional parameters:– farming area
– line length (min:max)
– number of lines (min:max)
– wrap distance (min:max)
– wrap length (min:max)
– Initial stock (seeds):1/7 of the final production
These controls will allow
to test the carrying
capacity of mussel
farming for MP

wrap distance
number of lines
Mussels Farm
8000
0
8000
line length
2
0
2
Mussels Growth
250
0
247.5
wrap leng
4
2
3.72
Muss_init
Micro_pom
Diat_pom
Dino_pom
dia _ass_muss
Top POM
Tw
Pom _ass_class2Pom _ass_class1
Muss_bio1
Muss_bio2
dino _ass_muss
micro _ass_muss
Mussels FarmControls
POM_escr_muss
Help Two generational classes considering a 18 months life‐cycle including harvesting phase

Empirical curves used to formulate
three critical processes:
A.
Filtration Rate
B.
Ingestion Rate
C.
Absorption Rate
(depending on POM composition)
from van haren & kooijman'93
0
0.005
0.01
0.015
0.02
0.025
0.03
0.035
0.04
0 1 2 3 4 5 6
L(cm)
Filtr
atio
n ra
te (m
^3/d
ay)
0
0.00001
0.00002
0.00003
0.00004
0.00005
0.00006
0.00007
0.00008
0 0.5 1 1.5 2
POM conc (mg/dm3)In
gest
ion
rate
(mg
POM
/h)
from van haren & kooijman'93L=4,8 cm
L=2,5 cm
A
B
data from Bayne et al. '89
0
0.1
0.2
0.3
0.4
0.5
0.6
0.7
0 0.5 1 1.5 2 2.5
mg POM/h
Abso
rptio
n Ef
ficien
cy
C
Mussels Growth
Micro_pom
Diat_pom
Dino_pom
dia _ass_muss
Top POM
Tw
Pom _ass_class2Pom _ass_class1
Muss_bio1
Muss_bio2
dino _ass_muss
micro _ass_muss
POM_escr_muss
Growth parameters according to a
bioenergetic
model by Van
Haren
&
Kooijman, 1993

1/1/2003 24/3/2003 15/6/2003 5/9/2003 27/11/2003 17/2/2004 10/5/2004 31/7/2004 22/10/20040
62500
125000
187500
250000
312500
375000
437500
500000TOP POM (kg of C)
Plotter I/O
0
0.0625
0.125
0.1875
0.25
0.3125
0.375
0.4375
0.5Absorpion efficien
Y2 Eps_POM Top POM Green Black
Three coefficients were used to represent the absorption efficiency due to POM
composition:
A. Diatom Efficiency (45%)B.
Dinoflagellate
Efficiency (30%)C.
Nanoplankton
Efficiency (25%)

1/1/2003 11/2/2003 24/3/2003 4/5/2003 15/6/2003 26/7/2003 5/9/2003 16/10/2003 27/11/2003 7/1/2004 17/2/2004 29/3/2004 10/5/2004 20/6/2004 31/7/2004 10/9/2004 22/10/20040
1250000
2500000
3750000
5000000
6250000
7500000
8750000
1.00000e+07Kg of Carbon
1st & 2nd generation
0
2.50000e+07
5.00000e+07
7.50000e+07
1.00000e+08
1.25000e+08
1.50000e+08
1.75000e+08
2.00000e+08Kg of Carbon
1st generation Y2 2nd generation
1st generation
2nd generation
Mussels Growth depends on
Temperature (Q10), Ingestion rate,
Absorption Eff. and POM
getC
RS want
class 1 Mussels Kg of C
Eqn
growth
Eqn
losses
Eqn
spawning
Muss_bio1
Muss_bio1
Muss_bio1
Muss_init
Oxigen cons
Imax
mortality1
Pom _ass_class1
Muss_Class1
Temp
Top POMEps_POM
RS
C
class 2 Mussels Kg of C
Muss_bio1
class2
spaw
harvesting
Muss_bio1
Con6InCon6In
1st Generation
Con3outCon3out
Con1outCon1out
stock1
muss_numb1
SR
Mussels Growth
Muss_init
Micro_pom
Diat_pom
Dino_pom
dia _ass_muss
Top POM
Tw
Pom _ass_class2Pom _ass_class1
Muss_bio1
Muss_bio2
dino _ass_muss
micro _ass_muss
POM_escr_muss

0 175 350 525 7000
0.1125
0.225
0.3375
0.45
Days
Mortality rate 2nd genInput Data
Y Output
0 187.5 375 562.5 7500
0.0875
0.175
0.2625
0.35
Days
Mortality rate 1st genInput Data
Y Output
Biomass loss due to spawning
0 250 500 750 10000
0.15
0.3
0.45
0.6
Days
Harvest rate Input Data
Y Output
Biomass loss due to Harvest
0 175 350 525 7000
0.05
0.1
0.15
0.2
Days
Biomass loss rate Input Data
Y Output

1/1/2003 21/4/2003 9/8/2003 27/11/2003 16/3/2004 4/7/2004 22/10/20040
10
20
30
40
50
60
70
80Shell Length (mm)
Plotter I/O
0
375000
750000
1125000
1500000
1875000
2250000
2625000
3000000
length fit Y2
1/1/2003 0:00
8/3/2003 0:00
13/5/2003 0:00
18/7/2003 0:00
22/9/2003 0:00
27/11/2003 0:00
1/2/2004 0:00
7/4/2004 0:00
12/6/2004 0:00
17/8/2004 0:00
22/10/2004 0:00
0
2500000
5000000
7500000
1.00000e+07
1.25000e+07
1.50000e+07
1.75000e+07
2.00000e+07Mussels (Kg of C)
Plotter I/O
0
250000
500000
750000
1000000
1250000
1500000
1750000
2000000POM (kg of C)
Muss_bio1 Y2 Top POM Y2 Y2
LarvaeGrowth
Spawning Harvesting
POM
The MP mussels life cycle simulation is based on 18 months, including harvesting
Commercial size
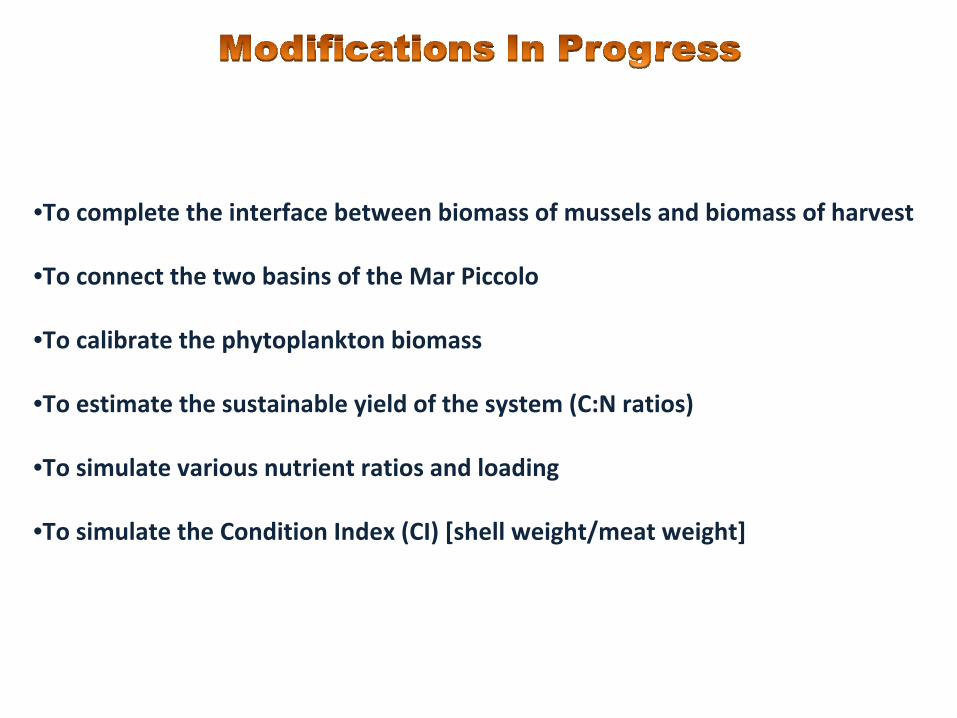
•To complete the interface between biomass of mussels and biomass
of harvest
•To connect the two basins of the Mar Piccolo
•To calibrate the phytoplankton biomass
•To estimate the sustainable yield of the system (C:N ratios)
•To simulate various nutrient ratios and loading
•To simulate the Condition Index (CI) [shell weight/meat weight]

The socioeconomic dimension of SSA 14 is Focused on some of the socio‐
economic responses related to the decline of the mussel culture
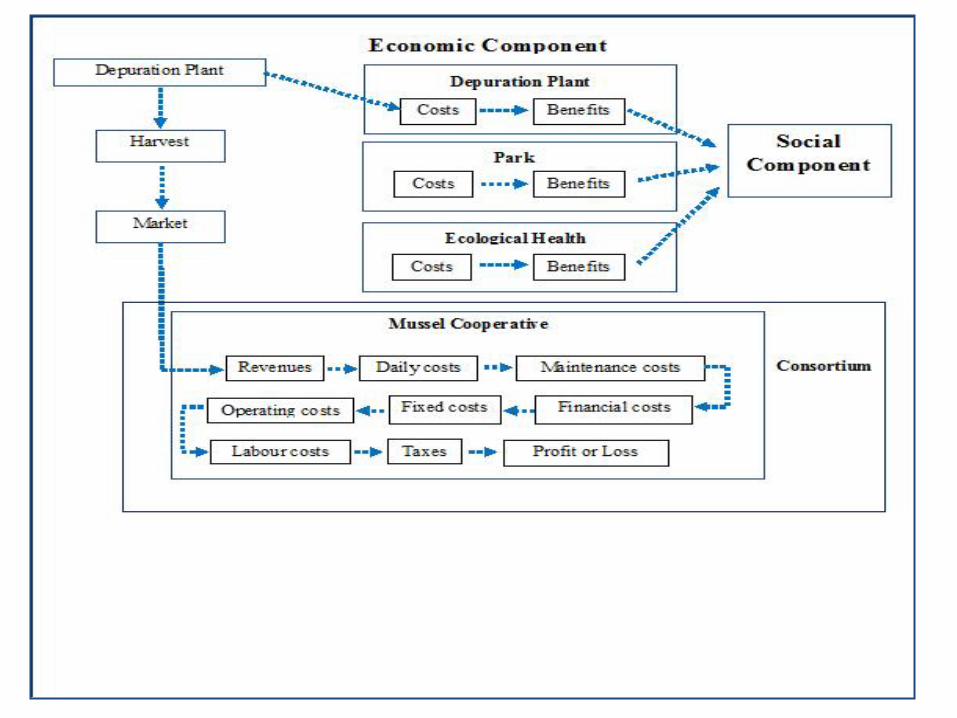
Mussel Farm Socio‐Economy
Relation with Coastal Zone Socio‐Economy

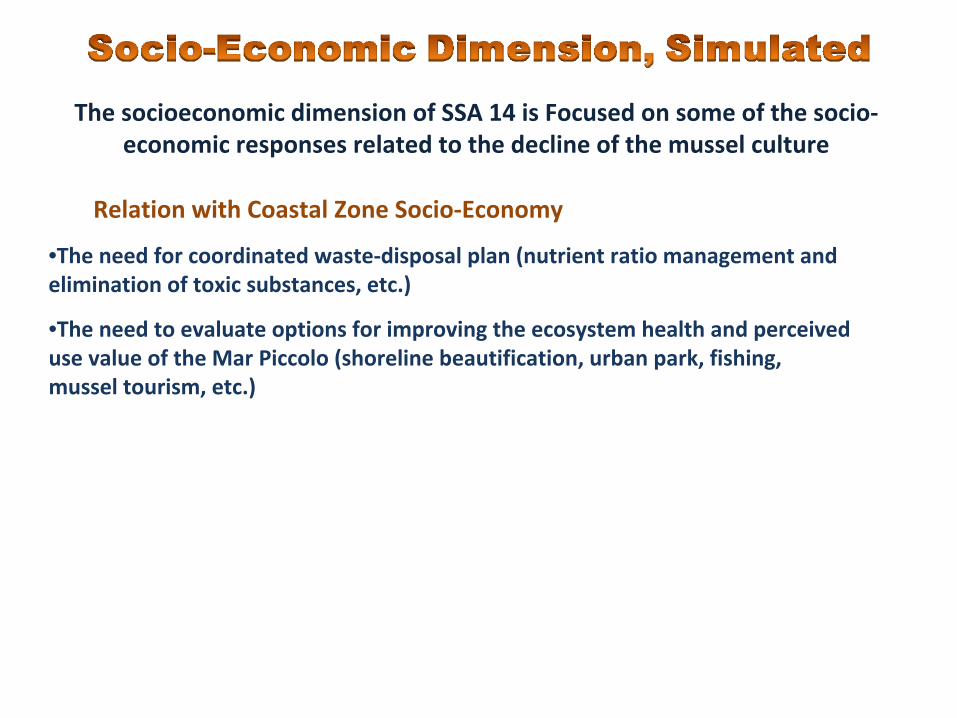
The socioeconomic dimension of SSA 14 is Focused on some of the socio‐
economic responses related to the decline of the mussel culture
•In Taranto the mussel farms are mostly managed as Cooperatives (about 80%)
•The mean age of employees has increased progressively because of
failure of
generational turnover, characteristic of traditional family‐run enterprises
•The “illegal”
employment consists of family members of the managers of each
cooperative, who are utilised during the harvest. This is a cultural tradition typical of
farming in southern Italy
•Evidence exists that a Consortium of the Cooperatives would be a
better way to
manage the mussel farming
•As a Consortium there will be advantages in terms of employment benefits and net
revenue
Mussel Farm Socio‐Economy
The socioeconomic dimension of SSA 14 is Focused on some of the socio‐
economic responses related to the decline of the mussel culture
Relation with Coastal Zone Socio‐Economy
•The need for coordinated waste‐disposal plan (nutrient ratio management and
elimination of toxic substances, etc.)
•The need to evaluate options for improving the ecosystem health and perceived
use value of the Mar Piccolo (shoreline beautification, urban park, fishing,
mussel tourism, etc.)
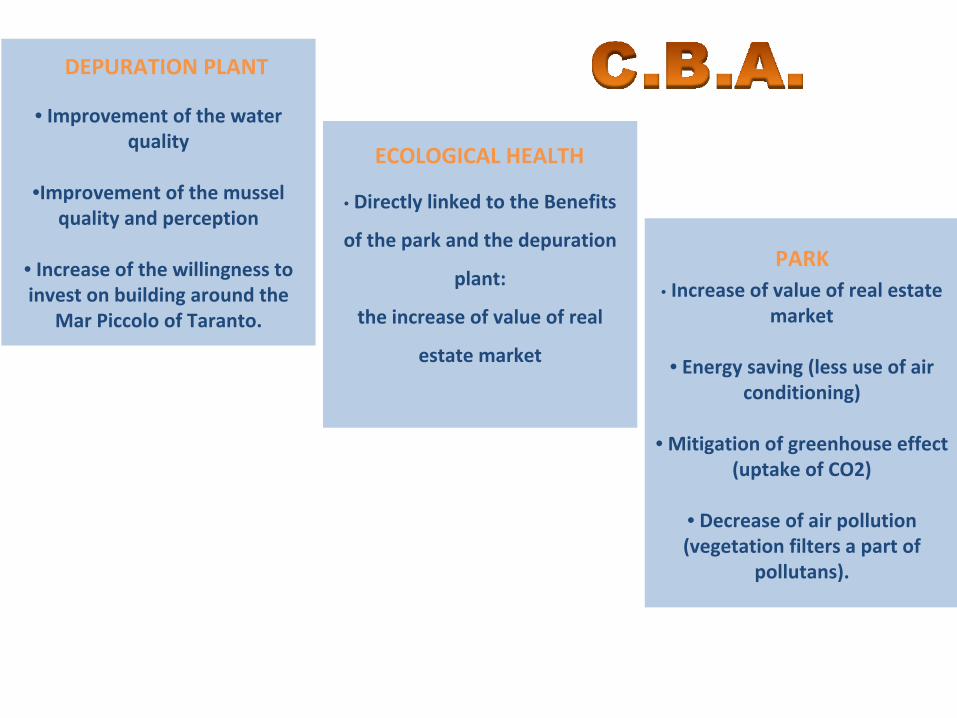
• Improvement of the water
quality
•Improvement of the mussel
quality and perception
• Increase of the willingness to
invest on building around the
Mar Piccolo of Taranto.
DEPURATION PLANT
• Directly linked to the Benefits
of the park and the depuration
plant:
the increase of value of real
estate market
ECOLOGICAL HEALTH
• Increase of value of real estate
market
• Energy saving (less use of air
conditioning)
• Mitigation of greenhouse effect
(uptake of CO2)
• Decrease of air pollution
(vegetation filters a part of
pollutans).
PARK
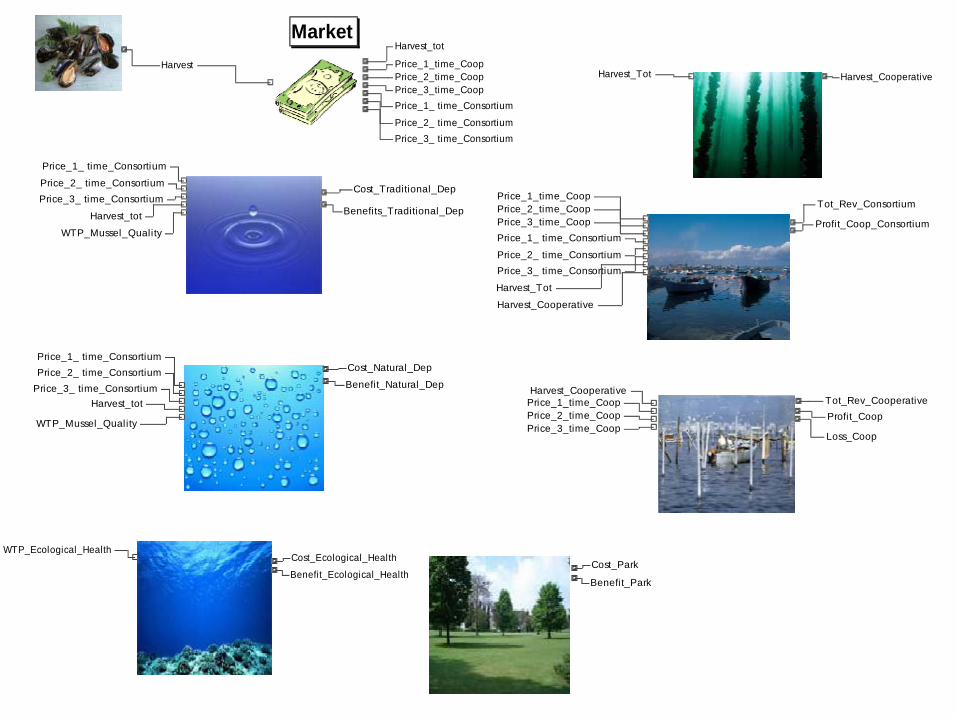
Cost_Traditional_Dep
Benefits_Traditional_DepHarvest_tot
Cost_Natural_Dep
Benefit_Natural_Dep
Harvest_tot
Price_1_ time_Consortium
Price_2_ time_ConsortiumPrice_3_ time_Consortium
Price_1_ time_ConsortiumPrice_2_ time_Consortium
Price_3_ time_Consortium
WTP_Mussel_Quality
WTP_Mussel_Quality
MarketHarvest
Harvest_Tot Harvest_Cooperative
Harvest_tot
Price_1_time_CoopPrice_2_time_CoopPrice_3_time_CoopPrice_1_ time_Consortium
Price_2_ time_ConsortiumPrice_3_ time_Consortium
Cost_Ecological_Health
Benefit_Ecological_Health
WTP_Ecological_HealthCost_Park
Benefit_Park
Price_1_time_CoopPrice_2_time_CoopPrice_3_time_CoopPrice_1_ time_Consortium
Price_2_ time_ConsortiumPrice_3_ time_Consortium
Tot_Rev_Consortium
Harvest_Tot
Harvest_Cooperative
Profit_Coop_Consortium
Price_1_time_CoopPrice_2_time_CoopPrice_3_time_Coop
Harvest_Cooperative
Loss_Coop
Profit_CoopTot_Rev_Cooperative
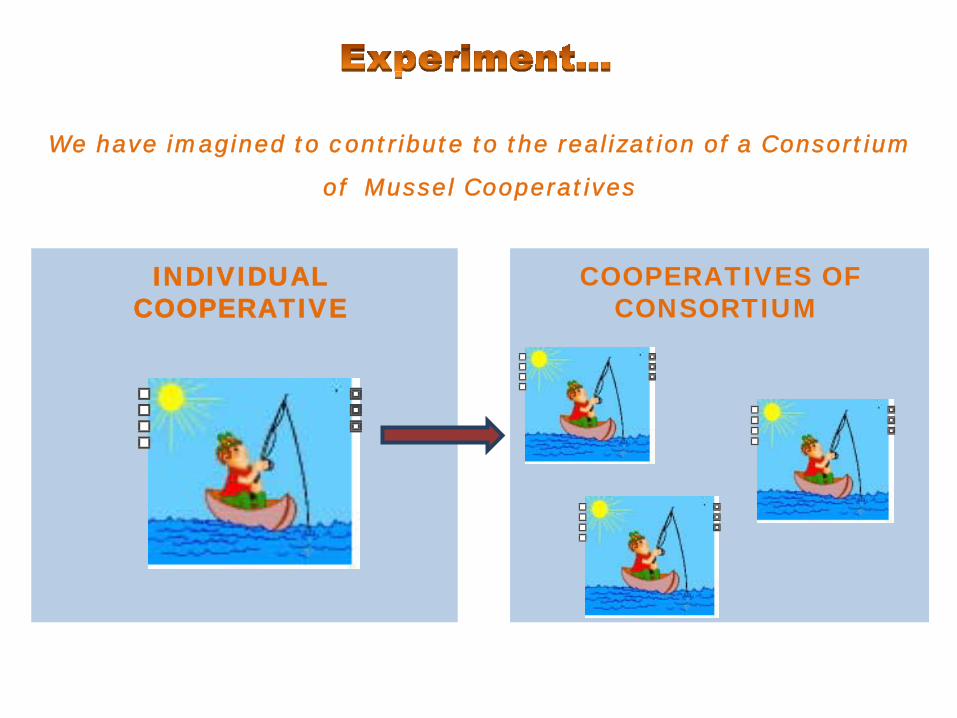
We have imagined to contribute to the realization of a Consortium
of Mussel Cooperatives
INDIVIDUAL COOPERATIVE
COOPERATIVES OF CONSORTIUM

TotCost
insurance
II Acconto
Interest loan
Maintenance
Daily cost
Interest pas banK
Amortize
Cost equipment
Pay VAT
Saldo e acconto
Dir Cam
INAIL
Inps Coop
LabHarvest_Cooperative_InHarvest_Cooperative_In
Price_1_time_Coop_InPrice_1_time_Coop_In
Price_2_time_Coop_InPrice_2_time_Coop_In
Price_3_time_Coop_InPrice_3_time_Coop_In
Tot_Rev_Coop_outTot_Rev_Coop_out
Price_1_time_CoopPrice_2_time_CoopPrice_3_time_Coop
Harvest_Cooperative
Loss_Coop
Profit_CoopTot_Rev_Cooperative
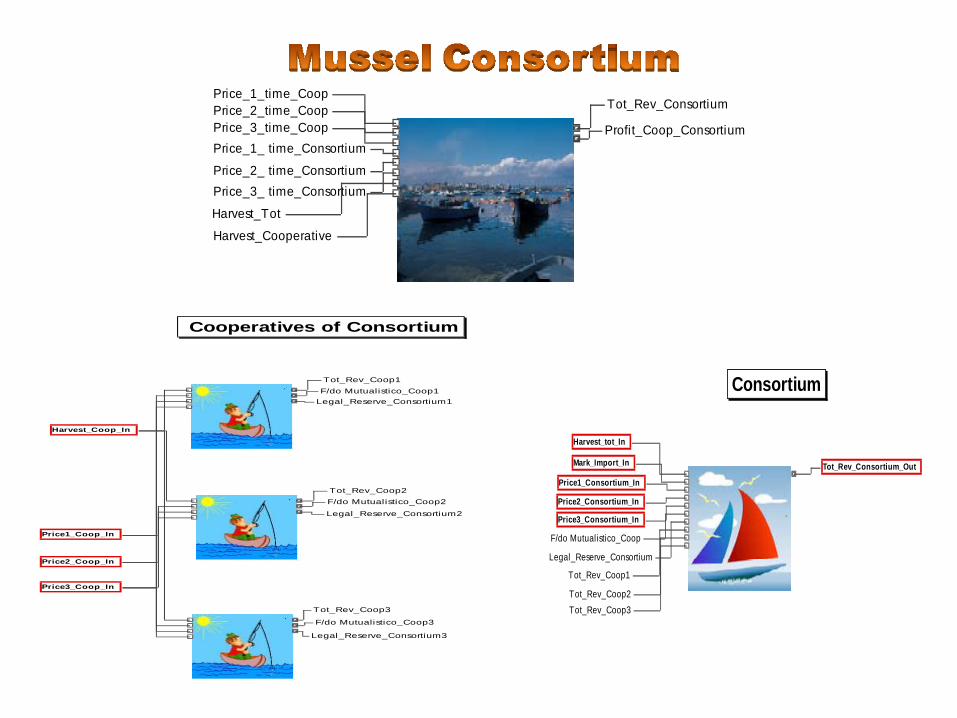
Cooperatives of Consortium
Tot_Rev_Coop1F/do Mutualistico_Coop1
Legal_Reserve_Consortium1
Tot_Rev_Coop2F/do Mutualistico_Coop2
Legal_Reserve_Consortium2
Tot_Rev_Coop3
F/do Mutualistico_Coop3
Legal_Reserve_Consortium3
Price1_Coop_InPrice1_Coop_In
Price2_Coop_InPrice2_Coop_In
Price3_Coop_InPrice3_Coop_In
Harvest_Coop_InHarvest_Coop_In
Tot_Rev_Consortium_OutTot_Rev_Consortium_Out
Consortium
Tot_Rev_Coop1
Tot_Rev_Coop2Tot_Rev_Coop3
F/do Mutualistico_Coop
Legal_Reserve_Consortium
Price1_Consortium_InPrice1_Consortium_In
Price2_Consortium_InPrice2_Consortium_In
Price3_Consortium_InPrice3_Consortium_In
Harvest_tot_InHarvest_tot_In
Mark_Import_InMark_Import_In
Price_1_time_CoopPrice_2_time_CoopPrice_3_time_CoopPrice_1_ time_Consortium
Price_2_ time_ConsortiumPrice_3_ time_Consortium
Tot_Rev_Consortium
Harvest_Tot
Harvest_Cooperative
Profit_Coop_Consortium
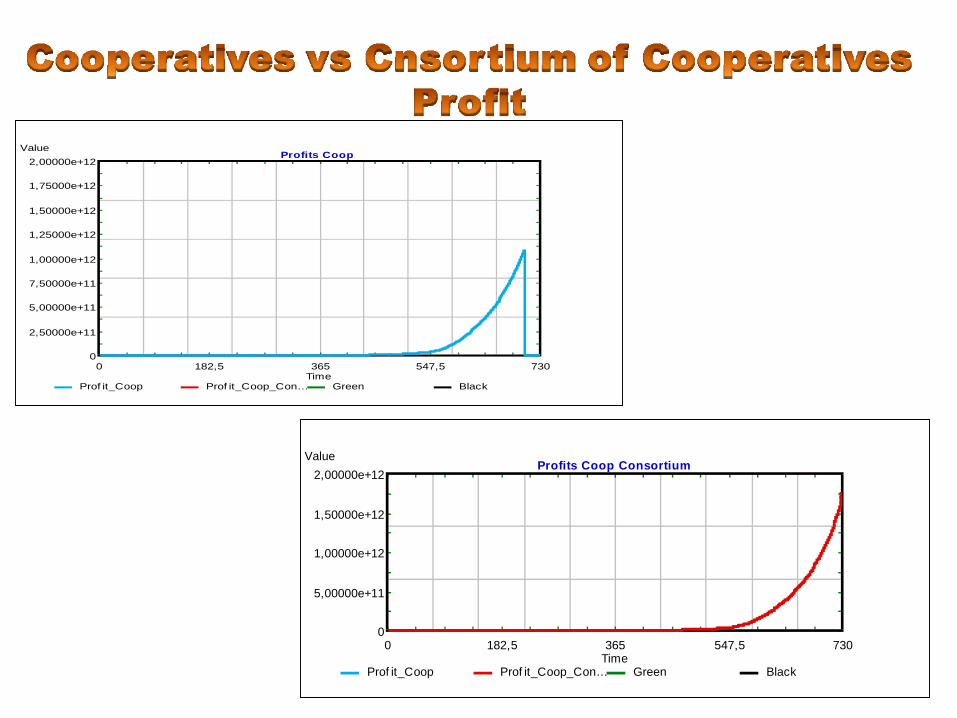
0 182,5 365 547,5 7300
5,00000e+11
1,00000e+12
1,50000e+12
2,00000e+12
Time
ValueProfits Coop Consortium
Prof it_Coop Prof it_Coop_Con… Green Black
0 182,5 365 547,5 7300
2,50000e+11
5,00000e+11
7,50000e+11
1,00000e+12
1,25000e+12
1,50000e+12
1,75000e+12
2,00000e+12
Time
ValueProfits Coop
Prof it_Coop Prof it_Coop_Con… Green Black

Cost_Traditional_Dep
Benefits_Traditional_DepHarvest_tot
Price_1_ time_Consortium
Price_2_ time_ConsortiumPrice_3_ time_Consortium
WTP_Mussel_Quality
Price1_InPrice1_In
Price2_InPrice2_In
Price3_InPrice3_In
WTP_InWTP_In
Harvest_tot_InHarvest_tot_In
Social aspect
Benefit_Trad_dep_outBenefit_Trad_dep_out
Cost_Trad_Dep_OutCost_Trad_Dep_Out
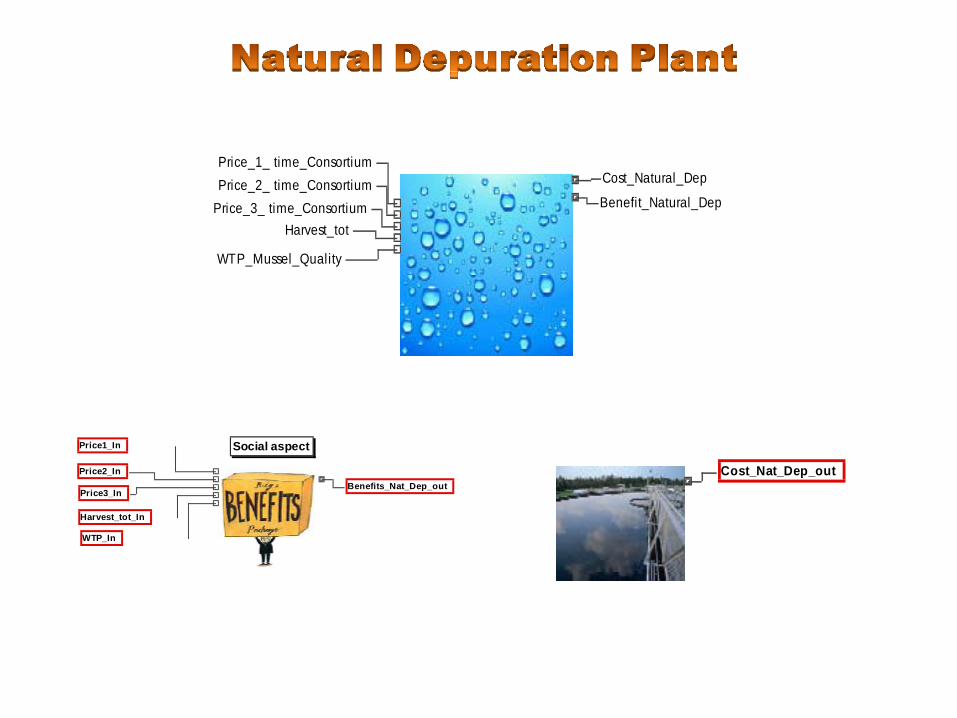
Cost_Natural_Dep
Benefit_Natural_Dep
Harvest_tot
Price_1_ time_ConsortiumPrice_2_ time_Consortium
Price_3_ time_Consortium
WTP_Mussel_Quality
Harvest_tot_InHarvest_tot_In
Price1_InPrice1_In
Price2_InPrice2_In
Price3_InPrice3_In
Social aspect
WTP_InWTP_In
Benefits_Nat_Dep_outBenefits_Nat_Dep_outCost_Nat_Dep_outCost_Nat_Dep_out

0 91,25 182,5 273,75 365 456,25 547,5 638,75 7300
5000000
1,00000e+07
1,50000e+07
2,00000e+07
Time
ValueCost Trad and Natural Dep
0
750000
1500000
2250000
3000000Y2
Y2 Cost_Traditiona… Cost_Natural_Dep

Cost_Ecological_Health
Benefit_Ecological_Health
WTP_Ecological_Health
Social aspect
WTP_Ec_Health_InWTP_Ec_Health_InBenefit_Ecological_Health_outBenefit_Ecological_Health_out
Cost_Ecological_Health_OutCost_Ecological_Health_Out
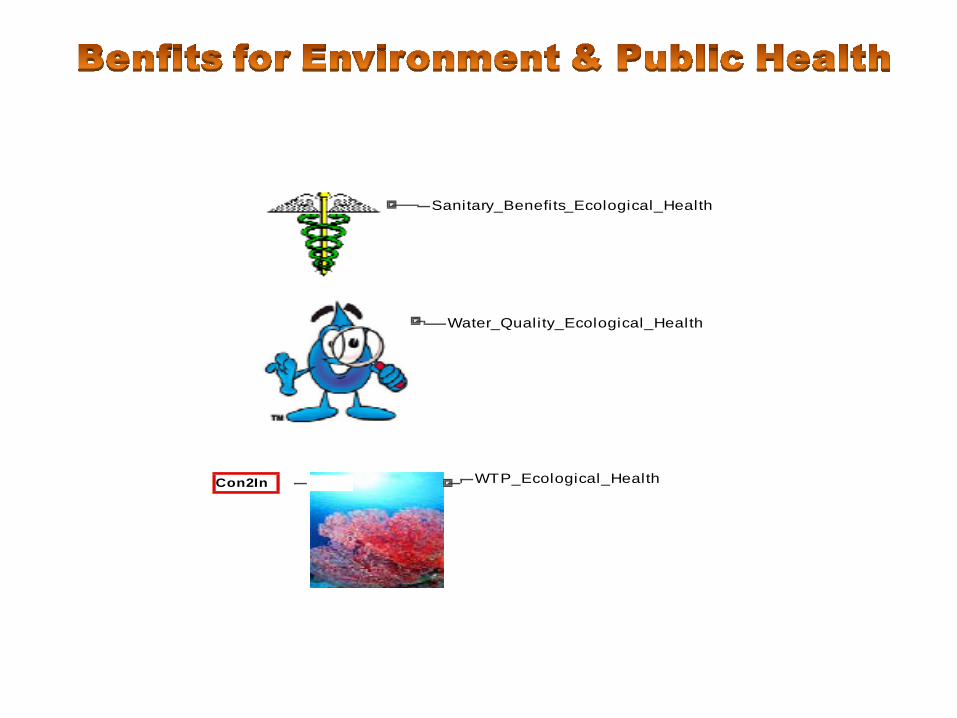
Water_Quality_Ecological_Health
Sanitary_Benefits_Ecological_Health
WTP_Ecological_HealthCon2InCon2In
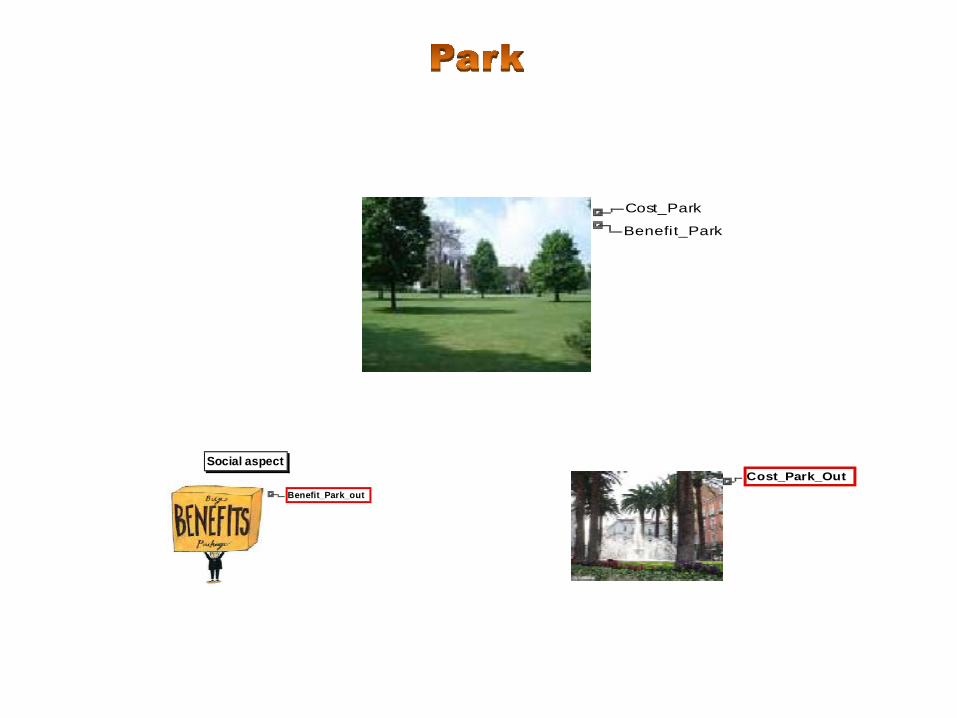
Cost_Park
Benefit_Park
Benefit_Park_outBenefit_Park_out
Social aspectCost_Park_OutCost_Park_Out
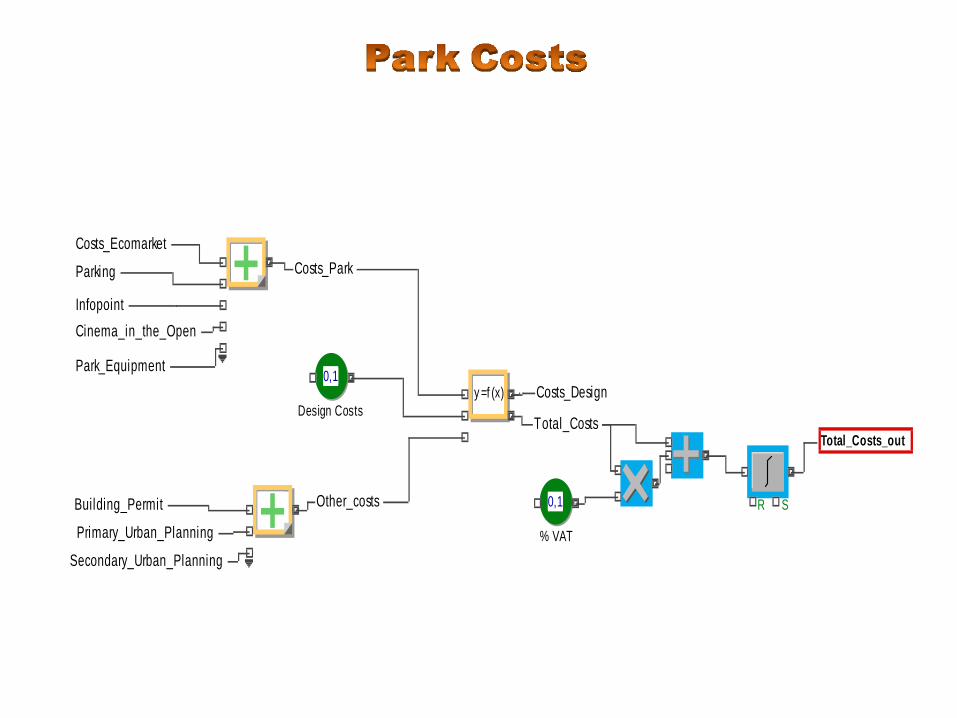
Total_Costs
Infopoint
Total_Costs_outTotal_Costs_out
Building_Permit 0,1
% VATPrimary_Urban_Planning
Secondary_Urban_Planning
Parking
Costs_Ecomarket
Cinema_in_the_Open
Park_Equipment
Costs_Park
0,1
Design Costsy =f (x) Costs_Design
Other_costs SR
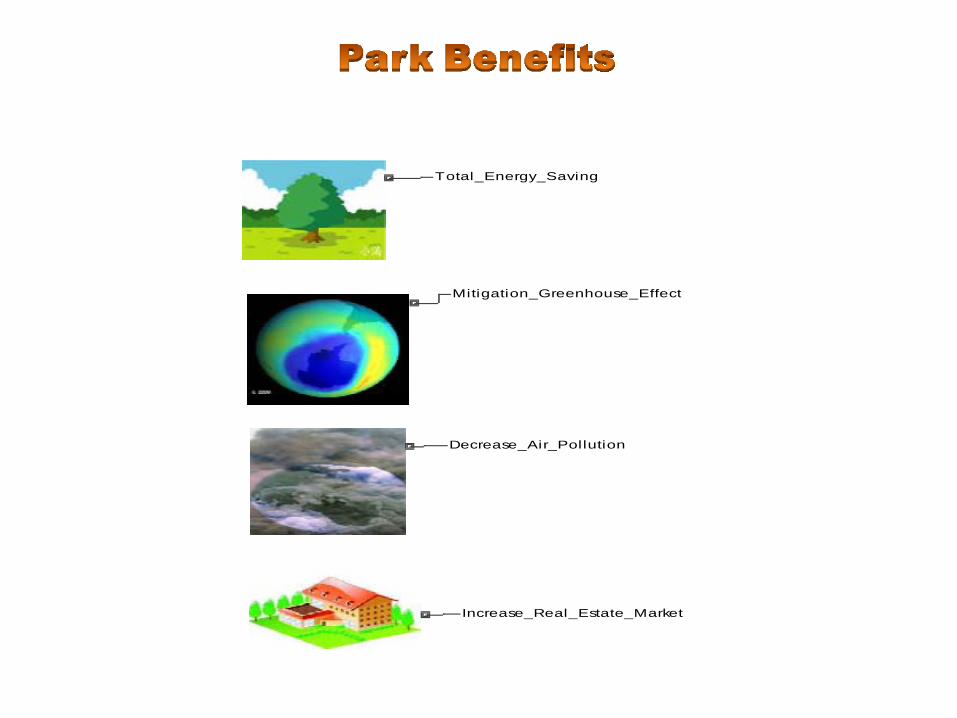
Mitigation_Greenhouse_Effect
Increase_Real_Estate_Market
Decrease_Air_Pollution
Total_Energy_Saving

0 121,6667 243,3333 365 486,6667 608,3333 7300
1,12500e+09
2,25000e+09
3,37500e+09
4,50000e+09
5,62500e+09
6,75000e+09
7,87500e+09
9,00000e+09
Time
ValueCost Benefit Park
0
2500
5000
7500
10000
12500
15000
17500
20000Y2
Y2 Cost_Park Benef it_Park