cml i - university of toronto · international trends in housing tenure and mortgage finance cml i...
TRANSCRIPT
International trends inhousing tenure and mortgage finance
CML IResearchCouncil of Mortgage Lenders
3 Savile Row, London W1S 3PB
International trends in housing tenure and
mortgage finance
Kathleen Scanlon and Christine Whitehead
London School of Economics
November 2004
ISBN: 0-9544578-6-2

Acknowledgements The research was conducted in collaboration with senior housing researchers in each of the countries studied, and we are
very grateful for all the work done by:
Judy Yates, Australia; Wolfgang Amann and Sandra Bauernfeind, Austria; Pascal de Decker, Belgium; Andre Asselin and
Greg Goy, Canada; Martin Lux, Czech Republic; Jens Lunde, Denmark; Timo Tahtinen, Finland; Alain Jacquot and Claude
Taffin, France; Horst Tomann, Germany; Dimitrios Frangopoulos, Greece; Jozsef Hegedus, Hungary; Jon Runar Sveinsson
and Magnus Arni Skulason, Iceland; Michael Lee and Eduardas Kazakevicius, Lithuania; Kees Dol, The Netherlands; Pedro
Guedes de Carvalho, Portugal; Natasha Pichler-Milanovic and Andreja Cirman, Slovenia; Tommy Berger, Sweden;
Rebecca Tunstall, USA.
The Council of Mortgage Lenders The Council of Mortgage Lenders (CML) is the trade association representing the mortgage industry. Its members comprise banks, building societies, insurance companies and other specialist residential mortgage lenders, which together represent around 98% of the UK mortgage assets. This publication forms part of the research programme commissioned by the CML on issues related to the mortgage and housing market. A list of recent research reports and CML publications can be found at the end of this report. Copyright 2004 Council of Mortgage Lenders. All rights reserved. No part of this publication may be reproduced, stored in a retrieval system, or transmitted in any form or by any means, electronic or mechanical. Photocopying or other means of recording are forbidden without the prior written permission of the publishers. The Council of Mortgage Lenders, 3 Savile Row, London, W1S 3PB Telephone: 020 7437 0075 Fax: 020 7434 3791 Web: www.cml.org.uk ISBN 0-9544578-6-2 Every effort has been made to ensure the accuracy of information contained within the report but the CML cannot be held responsible for any inaccuracies that remain. The opinions expressed in this report are those of the authors alone and are not necessarily the views of the CML.

International trends in housing tenure and mortgage finance
NovemberNovemberNovemberNovember 2004200420042004 1
Contents Executive Summary 3
Chapter 1
Introduction and aims 7 Research aims 8 Methodology 9 Chapter 2
Tenure patterns 10 Owner-occupation dominates tenure choice and continues to grow 11 Social renting declines compared to private renting 15 Tenure choices of young and middle-aged households 16 Future prospects: has owner-occupation reached a plateau? 19 Chapter 3
Household expenditure on housing 21 Relative housing expenditure for Young Entrant households 21 Relative housing expenditure for Mid-Life households 22 Housing expenditure gap narrows between tenures 23 Chapter 4
Taxes and subsidies 24 Is the favourable position of owner-occupation beginning to change? 24 Mixed trends in support for social and private renting 26 Chapter 5
Mortgage systems 27 Borrowers benefit from low interest rates 28 Mortgage terms and LTVs beginning to increase 28 Increasing variety in mortgage products 30 Growing competition helps to increase access to home-ownership 31 Chapter 6
Risk mitigation 32 State guarantees 33 Private mortgage insurance 34 State help with mortgage payments 35
CML Research
2 NovemberNovemberNovemberNovember 2004200420042004
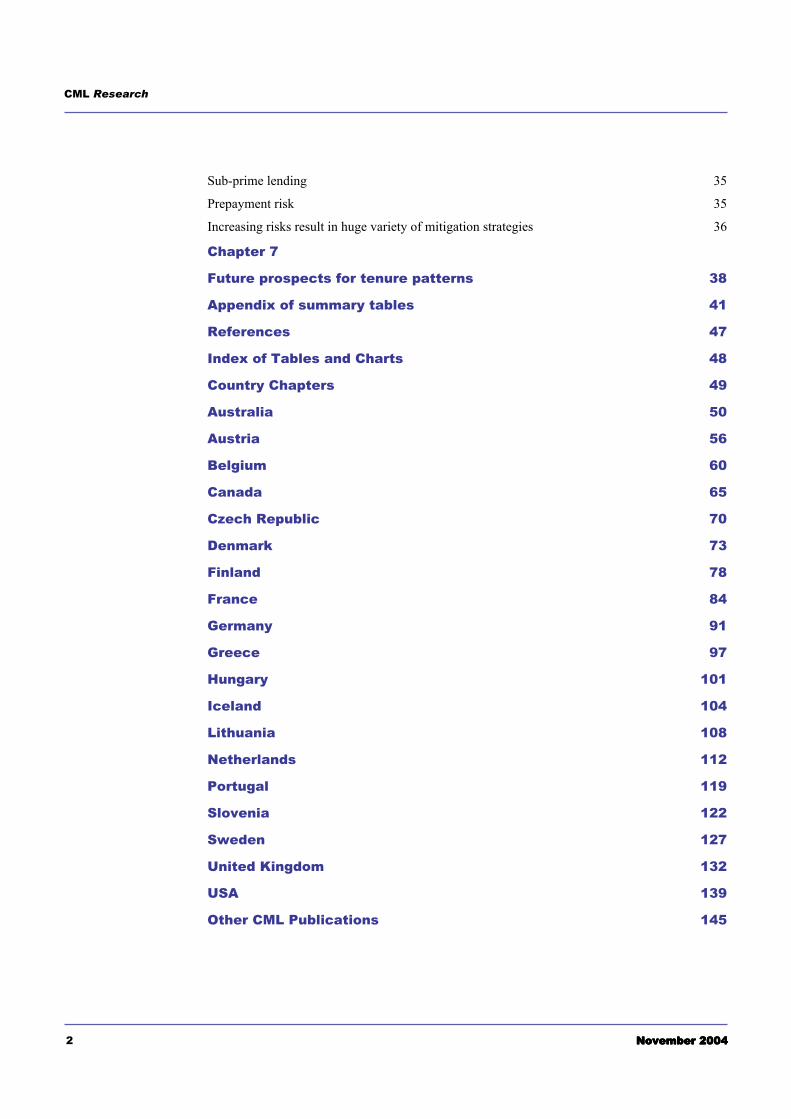
Sub-prime lending 35 Prepayment risk 35 Increasing risks result in huge variety of mitigation strategies 36 Chapter 7
Future prospects for tenure patterns 38
Appendix of summary tables 41
References 47
Index of Tables and Charts 48
Country Chapters 49
Australia 50
Austria 56
Belgium 60
Canada 65
Czech Republic 70
Denmark 73
Finland 78
France 84
Germany 91
Greece 97
Hungary 101
Iceland 104
Lithuania 108
Netherlands 112
Portugal 119
Slovenia 122
Sweden 127
United Kingdom 132
USA 139
Other CML Publications 145

m39*73&9.43&1 97*3)8 .3 -4:8.3, 9*3:7* &3) 2479,&,* +.3&3(*
r4;*2'*7r4;*2'*7r4;*2'*7r4;*2'*7 vTT9vTT9vTT9vTT9 (
==*(:9.;* w:22&7>x7*3)8 .3 9*3:7* '*9<**3 4<3*714((:5&9.43 &3) 7*39.3,
< ).]#)1n``,�>+gn] g* +V# ;>)E#*+ +#],)# g] >;; `n,]+)g#* *+,qg#q #/`#�+ _#)L>]02
< ~V# �#)`#]+>E# n4 n.]#)1n``,�g#)* V>* `n]+g],#q +n g]`)#>*# g] +V# L>xn)g+0 n4 `n,]+)g#*
g]`;,q#q g] +V# *+,q00 O,+ ]n. *##L* +n O# *+>Og;g*g]E2 RV#)# 4>;;* V>-# O##] nO*#)-#q0
+V#0 E#]#)>;;0 )#4;#`+ `0`;g`>; `V>]E#* g] +V# Vn,*g]E L>)*#+2
< ~V# �)n�n)+gn]* n4 0n,]E#) Vn,*#Vn;q* #]+#)g]E n.]#)1n``,�>+gn] >)#0 Vn.#-#)0 *+>O;# n)
4>;;g]E0 n4+#] O0 (,g+# *gE]g4g`>]+ >Ln,]+*2
< _)n.+V g] `n)# Lgqq;#1>E#q0 Lgqq;#1g]`nL# n.]#)1n``,�>+gn] >;*n >��#>)* +n )#>`V#q >
�;>+#>,2 :#n�;# >)# O#`nLg]E n.]#)1n``,�g#)* ;>+#)0 >]q *;gEV+;0 4#.#) L>g]*+)#>L
Lgqq;#1>E#q Vn,*#Vn;q* >)# n.]#)*2
< ~V#*# )#q,`+gn]* >)# n44*#+ O0 `nVn)+ #44#`+* >* Vn*,#Vn;q* E#+ n;q#) >]q Ln-# g]+n
n.]#)1n``,�>+gn]2
< ~V# L>g] )#>*n] Eg-#] 4n) 0n,]E#) Vn,*#Vn;q* ]n+ #]+#)g]E n.]#)1n``,�>+gn] g*
>44n)q>Og;g+00 >;+Vn,EV g] *nL# `n,]+)g#* ,]n+>O;0 +V# 0D-0 +V# g]`)#>*#q >->g;>Og;g+0 n4
Ln)# >��)n�)g>+# �)g->+# )#]+#q >``nLLnq>+gn] g* >;*n *##] >* )#;#->]+2
< _g-#] +V>+ g]+#)#*+ )>+#* V>-# 4>;;#] g] >;; `n,]+)g#*0 >]q Ln)+E>E# `n]qg+gn]* V>-# #>*#q0
>44n)q>Og;g+0 �)nO;#L* >)# L>g];0 +V# )#*,;+ n4 g]`)#>*#q Vn,*# �)g`#*2
< mnL# `n,]+)g#* V>-# g]+)nq,`#q �n;g`g#* +n V#;� >;; 4g)*+1+gL# O,0#)* ,X,*+)>;g>- n) +Vn*#
g] �>)+g`,;>) Vn,*#Vn;q* ,0D0 0mX-2 "] n+V#) `n,]+)g#* 0n,]E Vn,*#Vn;q* g]`)#>*g]E;0
)#;0 n] V#;� 4)nL 4>Lg;0 L#LO#)* ,,#]L>)*0 w#+V#);>]q*-2
< ).]#)1n``,�>+gn] g] +V# `n,]+)g#* *+,qg#q g* #/�#`+#q +n g]`)#>*# *;gEV+;0 4)nL `,))#]+
;#-#;* O#`>,*# n4 `nVn)+ 4>`+n)* >]q > +#]q#]`0 g] *nL# `n,]+)g#* +n Eg-# g]`)#>*#q
)#*�n]*gOg;g+0 +n +V# �)g->+# *#`+n)2
< =/1`nLL,]g*+ `n,]+)g#* V>-# #/�#)g#]`#q *,qq#] )g*#* g] n.]#)1n``,�>+gn]0 +>*g]E +V#L
+n �)n�n)+gn]* >On-# +Vn*# 4n,]q #;*#.V#)# g] =,)n�# ,#/`#�+ g] z1#`V \#�,O;g`-2 "]
+V#*# `n,]+)g#*0 L>)*#+* L>0 *+>Og;g*# >)n,]q ;n.#) ;#-#;* n4 n.]#)1n``,�>+gn] n-#) +V#
]#/+ 4#. q#`>q#*2
< mn`g>; )#]+g]E >`)n** =,)n�# g* E#]#)>;;0 q#`;g]g]E >* > �#)`#]+>E# n4 +V# )#]+#q *#`+n)2
RV#)# +V# �#)`#]+>E#* V>-# g]`)#>*#q0 >* ]n+>O;0 g] +V# 0mX0 g+ >��#>)* +n O# +V#
n,+`nL# n4 �n*g+g-# En-#)]L#]+ �n;g`0 ' ]n+ x,*+ `V>]E#* g] n+V#) +#],)#*2
z425&7.3, 7*1&9.;* -4:8.3, (4898 '*9<**3 9*3:7*8
< ).]#)1n``,�>+gn] V>* E#]#)>;;0 O#`nL# `V#>�#) >* `nL�>)#q +n )#]+g]E0 �>)+g`,;>);0
CML Research
4 NovemberNovemberNovemberNovember 2004200420042004
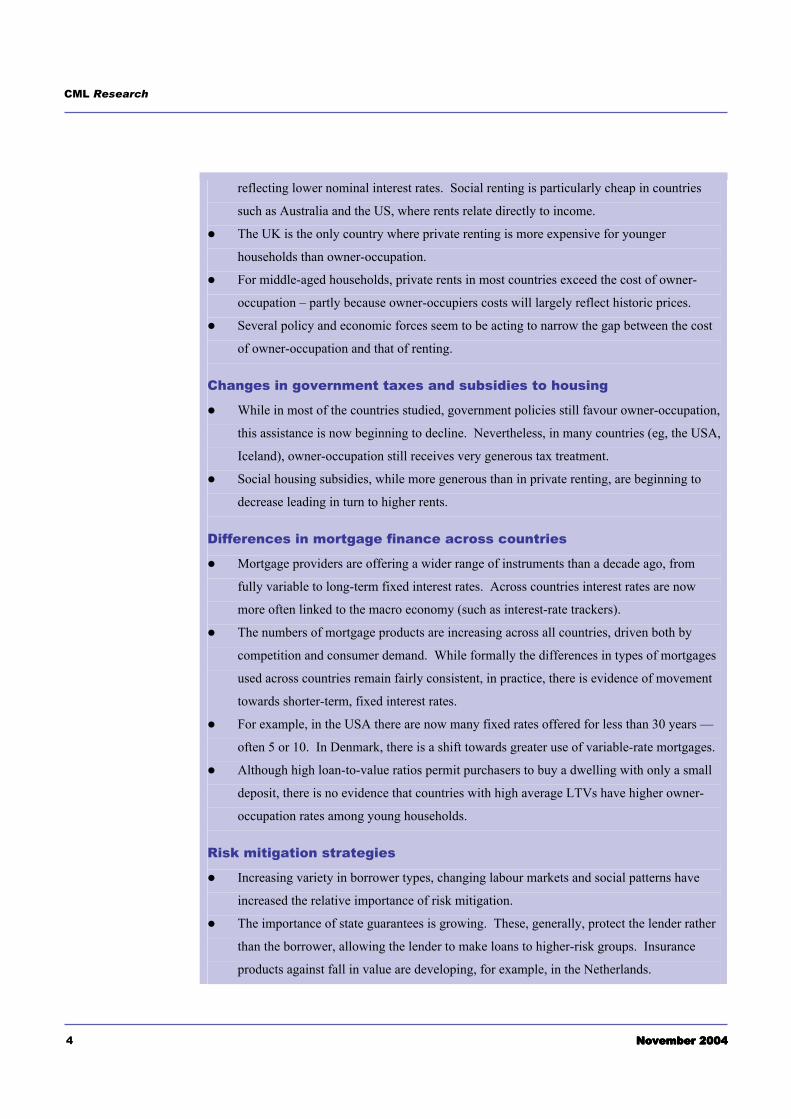
reflecting lower nominal interest rates. Social renting is particularly cheap in countries
such as Australia and the US, where rents relate directly to income.
! The UK is the only country where private renting is more expensive for younger
households than owner-occupation.
! For middle-aged households, private rents in most countries exceed the cost of owner-
occupation � partly because owner-occupiers costs will largely reflect historic prices.
! Several policy and economic forces seem to be acting to narrow the gap between the cost
of owner-occupation and that of renting.
Changes in government taxes and subsidies to housing
! While in most of the countries studied, government policies still favour owner-occupation,
this assistance is now beginning to decline. Nevertheless, in many countries (eg, the USA,
Iceland), owner-occupation still receives very generous tax treatment.
! Social housing subsidies, while more generous than in private renting, are beginning to
decrease leading in turn to higher rents.
Differences in mortgage finance across countries
! Mortgage providers are offering a wider range of instruments than a decade ago, from
fully variable to long-term fixed interest rates. Across countries interest rates are now
more often linked to the macro economy (such as interest-rate trackers).
! The numbers of mortgage products are increasing across all countries, driven both by
competition and consumer demand. While formally the differences in types of mortgages
used across countries remain fairly consistent, in practice, there is evidence of movement
towards shorter-term, fixed interest rates.
! For example, in the USA there are now many fixed rates offered for less than 30 years �
often 5 or 10. In Denmark, there is a shift towards greater use of variable-rate mortgages.
! Although high loan-to-value ratios permit purchasers to buy a dwelling with only a small
deposit, there is no evidence that countries with high average LTVs have higher owner-
occupation rates among young households.
Risk mitigation strategies
! Increasing variety in borrower types, changing labour markets and social patterns have
increased the relative importance of risk mitigation.
! The importance of state guarantees is growing. These, generally, protect the lender rather
than the borrower, allowing the lender to make loans to higher-risk groups. Insurance
products against fall in value are developing, for example, in the Netherlands.

International trends in housing tenure and mortgage finance
NovemberNovemberNovemberNovember 2004200420042004 5
! The availability of private mortgage insurance is also increasing with the development of
both insurance to cover borrowers loss of income and insurance to cover lenders against
loss of principal. The UK, Canada, Australia and the USA have the most developed
private insurance markets.
! More sophisticated risk mitigation strategies have enabled the growth in non-conforming
lending � partly through transferring risk to insurers or through securitisation.
! State help towards mortgage payments when the mortgagor's circumstances change is
limited or, in some countries, non-existent. The UK appears unique in having both
continuing, if limited, state support and well-developed insurance products to cover loss of
income.
Future prospects for tenure patterns
! In the short term, attitudes to the housing market have been shaped by the relatively easy
conditions of the last few years. While risks remain, there is now some evidence of lower
prices and lower activity in housing markets which were thought to be overheating. This
may in turn help to alleviate the access problems faced by younger households.
! Over the longer-term, the evidence is that across most of Europe owner-occupation is
maturing. It is, therefore, not expected to grow as rapidly over the next decade as it has
done in earlier decades.

CML Research
6 NovemberNovemberNovemberNovember 2004200420042004
International trends in housing tenure and mortgage finance
November 2004 7
Chapter 1 Introduction and aims In the mid-1990s, the Council of Mortgage Lenders funded a project to examine why the UK
housing market is so different from that of other advanced industrial countries. This difference
was manifested through the rapid growth of owner-occupation, the extent to which younger
households were choosing ownership rather than private renting, and the risks associated with the
structure of finance and subsidy in the country (Freeman, Holmans and Whitehead, 1996).
This and other research revealed the extent of mortgage market liberalisation during the 1980s
and 1990s across many of the countries studied. Governments were cutting back on subsidies to
owner-occupation, and that new legal arrangements and housing finance instruments were
beginning to emerge that were aimed at making markets more robust and better able to meet
consumer demands. The research also concluded that the UK was, indeed, different, particularly
in terms of the high proportion of younger households entering owner-occupation and the
relatively high costs of being a private tenant (a related issue). However, in Europe and other
industrialised countries, it was clear that owner-occupation was the tenure of choice for the stable
middle-income, middle-aged household in all the countries studied � including countries such as
Germany, where renting was still the majority tenure.
Since the mid-1990s there have been many changes in the macroeconomic environment, in
government attitudes to tenure and housing assistance, in the choices available to consumers, and
in approaches to risk sharing and reduction. Housing and housing-finance markets have
continued to develop within a more liberal regulatory environment, and there have been
continuing pressures toward integration of markets within the European Community. New trends
and challenges are emerging, particularly that of affordability of housing for younger households
and, in some countries, notably the UK, equity withdrawal by older owner-occupier households.
It, therefore, seems appropriate to take another look at whether and how the fundamentals are
changing. In particular, we ask whether the UK remains different, how government policies and
markets are developing across Europe and, at a more qualitative level, what experts in the
different countries think about the robustness of the housing and housing-finance systems in their
countries � and the likely future trends.
Previous studies
have shown that
the UK housing
market is different
to other countries,
in having larger
numbers of young
people in owner
occupation and
higher private
rental costs.
But, does the UK
remain different
and what are likely
future trends?

CML Research
8 November 2004
Research aims
This report, therefore, brings together information about recent international trends in housing
tenure, mortgage systems, and housing taxes and subsidies. It updates the 1996 study of patterns
of housing tenure, housing cost, and taxes and subsidies in twelve countries, and also examines
some of the questions about instruments and risk. The nineteen countries covered in this report
include the main European countries with differing housing traditions, but we also discuss
several non-European countries, see Table 1.
Table 1: Countries included in study
Australia Denmark Hungary Slovenia
Austria Finland Iceland Sweden
Belgium France Lithuania UK
Canada Germany Netherlands USA
Czech Republic Greece Portugal Note: The three countries covered in the 1996 report and not in this one are Japan, (excluded due to its very different economic and social environment); Ireland and Spain, (where experts were not able to respond within the required timetable). The majority of new countries included are transition economies, which adds an interesting new dimension to the analysis as these countries are becoming more integrated into the European Community.
The report is made up of two elements: a comparative analysis that makes up the first part of this
report and the individual country summaries, which provide a cameo of each country.
In the cross-country analysis section, we bring together the statistical and qualitative information
provided by experts in the different countries to address the following questions:
! What are the patterns of housing tenure and how are they changing? Is there an
international trend towards increased levels of owner-occupation? Is the proportion of
social renting falling compared to private renting?
! What is the relative cost of housing across different tenures? Have these relative costs
changed in the last decade?
! What important changes have occurred in tax and subsidy frameworks recently, and what
are the implications of these changes?
! What are the principal characteristics of the mortgage system in each country, from the
point of view of the borrower?
! What mechanisms are in place to handle risks faced by lenders and borrowers alike?
This report aims to
identify trends in
owner-occupation,
comparing
expenditure,
mortgage system
developments and
risk mitigation
between countries

International trends in housing tenure and mortgage finance
November 2004 9
The second part of the report summarises the material for each country within a common
structure. These sections put flesh on the comparisons, and enable a more detailed understanding
of how housing and mortgage systems are developing across the nineteen countries.
Methodology
We sent a standard questionnaire to a housing expert in each of the countries in mid-2003. Nine
of the nineteen countries were also studied in the 1996 research. The survey questionnaire
closely followed that used in the previous research, to facilitate comparisons where possible.
Additional questions were included covering mortgage systems, and going into greater depth
about tax and subsidy systems. Information from the housing experts was supplemented by
material from published and online sources; references are given at the end of each country
cameo in the Annex. The summary cameos were checked with the experts in each country.
A particularly important aspect of our methodology is that we look at two distinct points in
housing careers � young entrants to the housing market and households at a stable mid-life stage.
Our aim was to allow greater understanding of the conditions faced by individuals, and greater
consistency in comparisons across countries.
! The Young Entrant household was defined as a two-adult household without children, with
the main respondent aged around 25 years, and an average income for the age group.
! The Mid-Life household was defined as a two-adult household with two children, with the
main respondent aged around 45 years, and an average income for that age group.
These household types were specified because they represent two points in a fairly typical
household housing career. They do not, however, make up a particularly large percentage of
households � in the UK in 2001/02, for example, of the 19,901 households that participated in
the Survey of English Housing; only 12% were Young Entrant and Mid-Life households. These
groups do, however, tend to be seen as the leading indicators of change in behaviour.
Our definitions were ideals, and in practice, we found that for most countries the data did not
permit such levels of disaggregation. In several countries, we could distinguish between younger
and older households, but not between those with and without children; in a few countries, the
reverse was true. Further selection of households by income levels was rarely possible. Each
country chapter gives details of the data used.
Together with
general trends the
research examines
two key housing
career stages:
Young Entrants
and Mid-Life
households
CML Research
10 November 2004
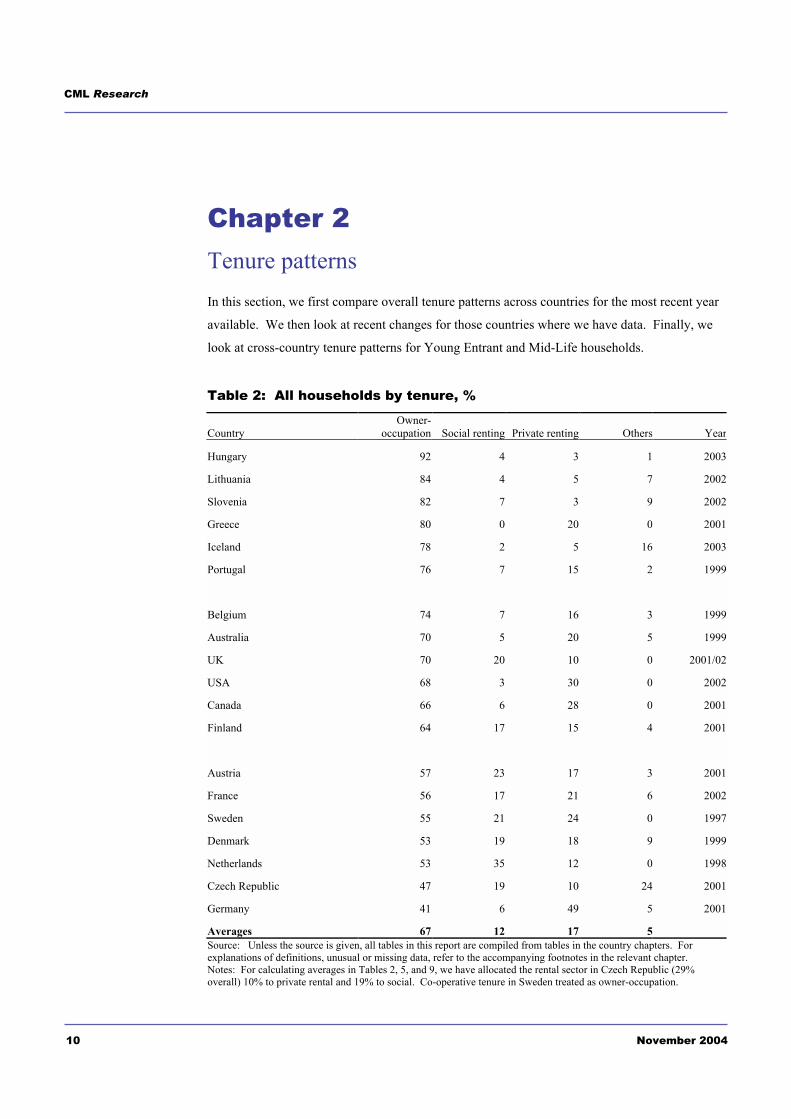
Chapter 2 Tenure patterns In this section, we first compare overall tenure patterns across countries for the most recent year
available. We then look at recent changes for those countries where we have data. Finally, we
look at cross-country tenure patterns for Young Entrant and Mid-Life households.
Table 2: All households by tenure, %
Country
Owner-occupation Social renting Private renting Others Year
Hungary 92 4 3 1 2003
Lithuania 84 4 5 7 2002
Slovenia 82 7 3 9 2002
Greece 80 0 20 0 2001
Iceland 78 2 5 16 2003
Portugal 76 7 15 2 1999
Belgium 74 7 16 3 1999
Australia 70 5 20 5 1999
UK 70 20 10 0 2001/02
USA 68 3 30 0 2002
Canada 66 6 28 0 2001
Finland 64 17 15 4 2001
Austria 57 23 17 3 2001
France 56 17 21 6 2002
Sweden 55 21 24 0 1997
Denmark 53 19 18 9 1999
Netherlands 53 35 12 0 1998
Czech Republic 47 19 10 24 2001
Germany 41 6 49 5 2001
Averages 67 12 17 5 Source: Unless the source is given, all tables in this report are compiled from tables in the country chapters. For explanations of definitions, unusual or missing data, refer to the accompanying footnotes in the relevant chapter. Notes: For calculating averages in Tables 2, 5, and 9, we have allocated the rental sector in Czech Republic (29% overall) 10% to private rental and 19% to social. Co-operative tenure in Sweden treated as owner-occupation.

International trends in housing tenure and mortgage finance
November 2004 11
The information presented here allows us to identify general trends, but does not permit precise
comparisons. Within countries different sources sometimes give different percentages for the
same indicator, especially if one source is a survey and another is a census. Also, there are often
separate figures for the tenure of dwellings and that of households. In the UK, Germany and the
Netherlands, a household is defined in such a way that two or more households can live in one
dwelling. But in the USA and France, a household is defined as all persons usually resident in a
separate dwelling, so the number of households in total and by tenure necessarily equals the
number of occupied residences. The UK is unique in having estimates of tenure as a proportion
of the whole housing stock, including second residences and vacant dwellings. Other countries'
figures are for the tenure of occupied dwellings. Overall tenure statistics are shown in Table 2.
Owner-occupation dominates tenure choice and continues to grow
In all countries studied, except Germany, owner-occupation is the largest single tenure category.
Overall, percentages of owner-occupation range from Germany (41%) to Hungary (92%). The
mean is 67% � only a little below the UK figure of 70%.
The 1996 study of tenure patterns identified three distinct country-groupings by size of owner-
occupied sector. Spain and Finland had the highest proportions of owner-occupation at over
75%; a second group (predominantly English-speaking countries) had 60�70% of households in
owner-occupation; and the remainder had fewer than 60% of households in owner-occupation.
This last group included France, the Netherlands, Sweden, and Germany.
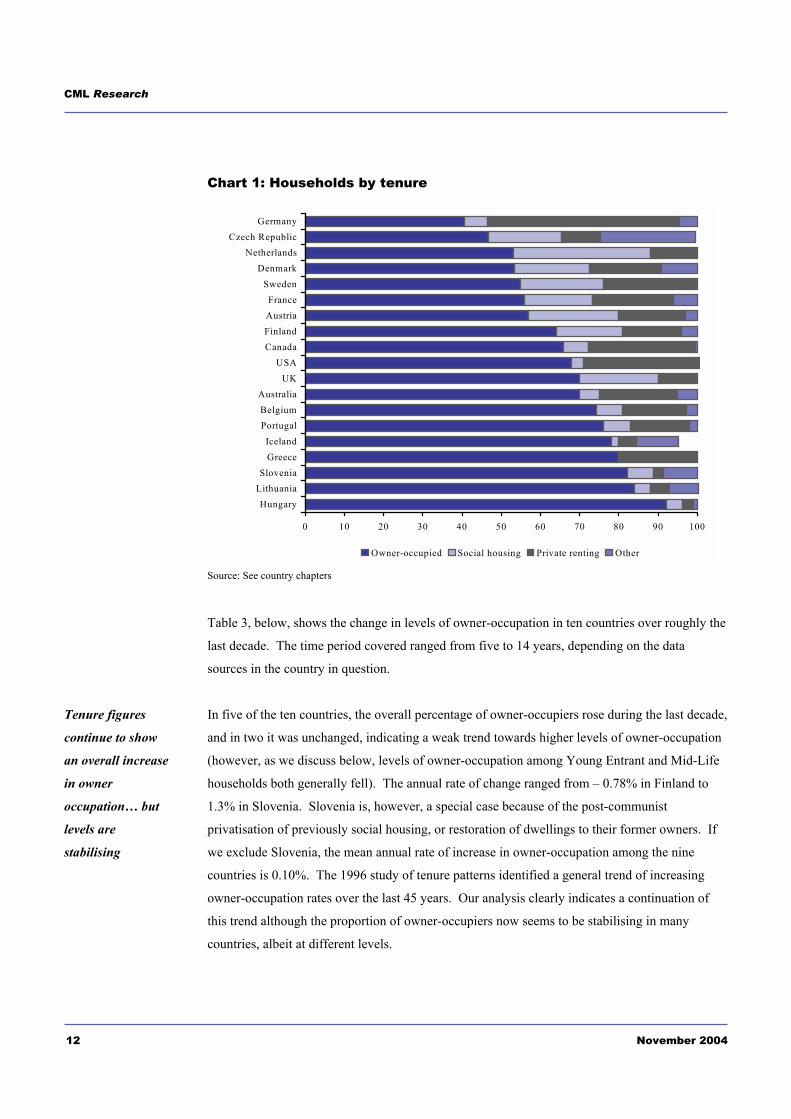
Using the latest available figures, we can again divide our nineteen countries into three groups
(see Chart 1):
! Low Owner-occupation: Germany, Czech Republic, the Netherlands, Denmark, Sweden,
France and Austria have levels of owner-occupation below 60%. These countries (except
Germany) are characterised by rather large social rented sectors.
! Mid-level Owner-occupation: Finland, the USA, Australia, the UK, Canada and Belgium
have levels of owner-occupation between 60 and 75%. All the English-speaking countries
studied fall into this group.
! High Owner-occupation: Slovenia, Lithuania, Hungary, Greece, Iceland and Portugal, all
have owner-occupation levels of 75% or above. The first three are former Eastern bloc
countries, where the post-communist economic changes included a mass transfer of state
housing to the private sector. Greece is unique in having no social rented sector at all.
Owner-occupation
is the largest
tenure in all
countries except
Germany
CML Research
12 November 2004
Chart 1: Households by tenure
0 10 20 30 40 50 60 70 80 90 100
HungaryLithuaniaSlovenia
GreeceIceland
PortugalBelgiumAustralia
UKUSA
CanadaFinlandAustriaFrance
SwedenDenmark
NetherlandsCzech Republic
Germany
Owner-occupied Social housing Private renting Other
Source: See country chapters
Table 3, below, shows the change in levels of owner-occupation in ten countries over roughly the
last decade. The time period covered ranged from five to 14 years, depending on the data
sources in the country in question.
In five of the ten countries, the overall percentage of owner-occupiers rose during the last decade,
and in two it was unchanged, indicating a weak trend towards higher levels of owner-occupation
(however, as we discuss below, levels of owner-occupation among Young Entrant and Mid-Life
households both generally fell). The annual rate of change ranged from � 0.78% in Finland to
1.3% in Slovenia. Slovenia is, however, a special case because of the post-communist
privatisation of previously social housing, or restoration of dwellings to their former owners. If
we exclude Slovenia, the mean annual rate of increase in owner-occupation among the nine
countries is 0.10%. The 1996 study of tenure patterns identified a general trend of increasing
owner-occupation rates over the last 45 years. Our analysis clearly indicates a continuation of
this trend although the proportion of owner-occupiers now seems to be stabilising in many
countries, albeit at different levels.
Tenure figures
continue to show
an overall increase
in owner
occupation� but
levels are
stabilising

International trends in housing tenure and mortgage finance
November 2004 13
Table 3: Change in owner-occupation in the last decade, all households
Owner-occupation
Country Earlier year %
Latest year %
Annual % change
Year of data sources
Slovenia 68 82 1.3 1991; 2002
Australia 70 70 0 1994; 1999
UK 68 70 0.34 1994/95; 2001/02
USA 64 68 0.34 1991; 2002
Canada 63 66 0.32 1991; 2001
Finland 71 64 -0.78 1992; 2001
France 54 56 0.13 1990; 2002
Sweden 55 55 0 1991; 1997
Denmark 55 53 -0.13 1990; 1999
Netherlands 47 53 1.14 1993; 1998
Germany 38 41 0.18 1987; 2001
Average 0.26
Average excluding Slovenia 0.15 Source: See country chapters
Rising levels of owner-occupation can be the result of one or more of the following factors:
! Government policy changes (increased tax breaks, grants to buyers, transfer of housing
formerly owned by the government into private hands);
! Demographic and lifestyle changes (baby-boom age cohort reaching property-buying age;
rise of two-income households);
! Falling interest rates; and
! Increased access to mortgage finance.
Major reasons for falling levels of owner-occupation include:
! Government policy changes (removal of tax breaks, imposition of new taxes); and
! Rising interest rates.

CML Research
14 November 2004
The property-market cycle also affects levels of owner-occupation; but its effects are not always
straightforward. On the one hand, during a period of generally rising property prices, some
buyers bring forward purchases in order to buy before prices rise further. Others choose owner-
occupation because of the potential for capital gains. In these ways, rising property prices can
lead to an increase in owner-occupation. On the other hand, a rising property market, also, can
take prices beyond the range of many potential buyers, leading to a fall or levelling off in owner-
occupation.
Similarly, falling property prices can lead potential first-time buyers to delay in the hope of
further falls. Price falls can result in negative equity for existing borrowers, who may return to
the rental sector. These effects can result in lower owner-occupation levels. However, falling
prices can also make home-ownership affordable for more households (resulting in higher owner-
occupation levels). The net effect of the property-market cycle on owner-occupation depends on
the levels of property prices and incomes in the market, and the stage of the cycle that has been
reached. Consumer confidence, the extent of flexibility in mortgage lending criteria and pace of
innovation in product development and competition will also play a role.
As shown in Table 3, in the English-speaking countries (Australia, Canada, the UK and USA),
owner-occupation rates were high at the start of the decade and, in all except Australia, they
continued to increase over the period. This reflects their shared cultural bias in favour of owner-
occupation, cyclical factors, lower interest rates, and easier access to mortgage finance. The
effect of government policies seems to have been less important: Australia had the strongest pro-
ownership policy change, with the introduction of a grant for first-time buyers, but the overall
owner-occupation rate was unchanged (although data on tenure rates in Australia varies
according to source - see country chapter).
In three countries � Denmark, Finland and Germany � the proportion of owner-occupiers fell
during the period studied. Again, Germany represents a special case because the data for the
earlier period apply only to former West Germany, whereas the more recent data are from the
entire post-unification country. It is unclear whether, comparing like with like, owner-
occupation has in fact fallen in former West Germany.
Of those countries where owner-occupation has fallen, Denmark and Finland experienced strong
cyclical downward movement in house prices during the period between 1980 and 2000, causing
owner-occupation rates to fall. Owner-occupation rates are expected to rise again if current
conditions to prevail. In both Germany and Austria, temporary government policies were put in
Owner-occupation
rates tended to
increase in
countries with
cyclical house price
rises, low interest
rates and easy
access to mortgage
finance. But
owner occupation
fell in countries
experiencing either
cyclical house price
falls or government
policies working
against home-
ownership
International trends in housing tenure and mortgage finance
November 2004 15
place during the 1990s to increase the supply of rental housing. These policies destabilised the
housing markets in these countries; again, owner-occupation rates will likely recover in future.
In some countries, such as the UK and Finland, problems of affordability for young aspiring
owners and a lack of alternative tenures between owner-occupation and renting have led to calls
for an 'intermediate tenure'. The box below explains how a new type of tenure works in Finland.
A number of low cost home-ownership options exist in the UK and new schemes are emerging to
fill demand for these aspiring owners.
Intermediate tenure � an example in Finland
In the 1990s, a hybrid ownership rental tenure emerged, using a model first devised in Sweden.
In a �right of occupancy� dwelling, the inhabitant initially pays 10-15% of the market value of
the dwelling and then a monthly �charge for use�, covering capital and maintenance costs. The
basic idea is that as long as you meet your obligations the owner cannot give you notice to quit.
The construction of such dwellings is state subsidised. The �right of occupancy� can be sold to
a third party at a regulated price determined by construction costs (Ball, 2003).
Overall, there is evidence of continued growth in owner-occupation. Several countries with
higher-than-average levels of owner-occupation owe these to the transition from collective to
market economies. Yet it is also clear that the average rate of growth of owner-occupation is
slowing and in some cases decreasing. To examine these trends in more detail we look first at
the rented sector and then at different stages in housing careers.
Social renting declines compared to private renting
Table 4 shows changes in the proportion of social as compared to private renting over the period
studied. The second and fourth columns show social renting as a percentage of all renting (which
is 100%). Over the period studied, social renting as a percentage of all renting fell in seven of
the ten countries for which we have data. The fall was most marked in Slovenia, where 97% of
renting households were in social rental in 1991, and only 71% in 2002.
Even excluding Slovenia as atypical, the data show a trend towards a fall in the percentage of
renting households in social rental. A widespread move towards more market-orientated
provision of social housing has seen a fall in the number of publicly-owned dwellings, and
increased use of vouchers and allowances that can be spent on privately-owned accommodation.
While the ultimate goal of such policies is still to ensure that the most needy are adequately
housed, they result in a fall in the level of social housing as defined here. In some countries,
including the UK (and, of course, the former communist countries), dwellings that had been
Over the last
decade, social
renting as a
percentage of all
renting fell in
seven of the ten
countries

CML Research
16 November 2004
rented from social landlords have been sold or given to their occupants, moving them to the
category of owner-occupation. Table 4: Change in social renting as a percentage of all renting, all households (all renting = 100%)
Country Social as % of all rental Annual Year of Earliest year Latest year % change data sources
Slovenia 97 71 -2.36 1991; 2002
Germany 26 11 -1.07 1987; 2001
Australia 24 20 -0.8 1994; 1999
Netherlands 78 74 -0.8 1993; 1998
Finland 58 53 -0.56 1992; 2001
United Kingdom 70 67 -0.43 1994/95; 2001/02
Sweden 49 47 -0.33 1991; 1997
Canada 18 19 0.1 1991; 2001
United States 6 9 0.27 1991; 2002
Denmark 48 51 0.33 1990; 1999
France 38 45 0.58 1990; 2002Average -0.46 Average excluding Slovenia -0.27 Source: See country chapters
Tenure choices of young and middle-aged households
Table 5 gives the tenure breakdown for Young Entrant and Mid-Life households in the most
recent year for which data were available. In almost every country, the proportion of owner-
occupiers is higher amongst Mid-Life than Young Entrant households. The range of owner-
occupation rates among Young Entrant households is very broad, from 17% in France to 95% in
Hungary. The spread is narrower for Mid-Life households, ranging from a low of 48% in Czech
Republic to 96% in Hungary. If we exclude the countries from the former Eastern bloc and
Germany, we still find a wide range of owner-occupation proportions for Young Entrants (17-
72%) and a narrower range for Mid-Life households (64-90%).
Although overall owner-occupation rates are general increasing, different patterns emerge when
we focus specifically on Young Entrant and Mid-Life households. Table 6 shows the change in
tenure of Young Entrant households over the period studied. Data were available for nine
countries, spanning periods from three to twelve years.
In almost every
country, the
proportion of
owner-occupiers is
higher amongst
Mid-Life than
Young Entrant
households
International trends in housing tenure and mortgage finance
November 2004 17
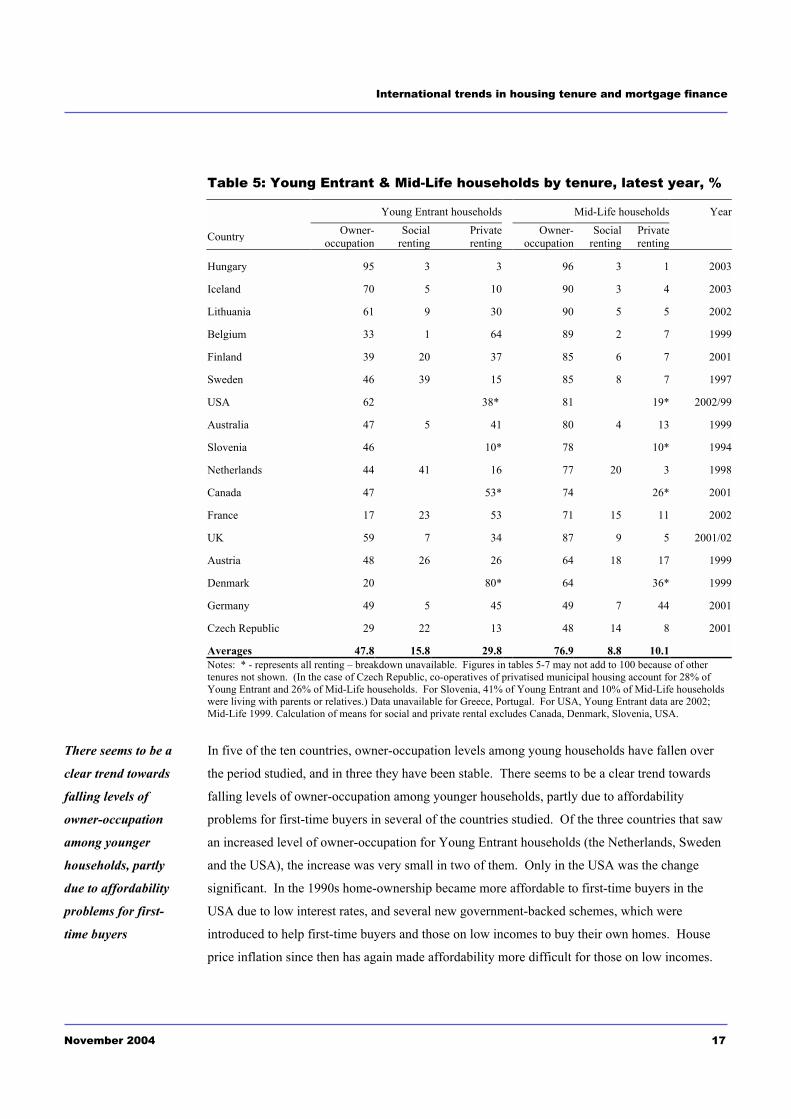
Table 5: Young Entrant & Mid-Life households by tenure, latest year, %
Young Entrant households Mid-Life households Year
Country Owner-occupation
Social renting
Private renting
Owner-occupation
Social renting
Private renting
Hungary 95 3 3 96 3 1 2003
Iceland 70 5 10 90 3 4 2003
Lithuania 61 9 30 90 5 5 2002
Belgium 33 1 64 89 2 7 1999
Finland 39 20 37 85 6 7 2001
Sweden 46 39 15 85 8 7 1997
USA 62 38* 81 19* 2002/99
Australia 47 5 41 80 4 13 1999
Slovenia 46 10* 78 10* 1994
Netherlands 44 41 16 77 20 3 1998
Canada 47 53* 74 26* 2001
France 17 23 53 71 15 11 2002
UK 59 7 34 87 9 5 2001/02
Austria 48 26 26 64 18 17 1999
Denmark 20 80* 64 36* 1999
Germany 49 5 45 49 7 44 2001
Czech Republic 29 22 13 48 14 8 2001
Averages 47.8 15.8 29.8 76.9 8.8 10.1 Notes: * - represents all renting � breakdown unavailable. Figures in tables 5-7 may not add to 100 because of other tenures not shown. (In the case of Czech Republic, co-operatives of privatised municipal housing account for 28% of Young Entrant and 26% of Mid-Life households. For Slovenia, 41% of Young Entrant and 10% of Mid-Life households were living with parents or relatives.) Data unavailable for Greece, Portugal. For USA, Young Entrant data are 2002; Mid-Life 1999. Calculation of means for social and private rental excludes Canada, Denmark, Slovenia, USA.
In five of the ten countries, owner-occupation levels among young households have fallen over
the period studied, and in three they have been stable. There seems to be a clear trend towards
falling levels of owner-occupation among younger households, partly due to affordability
problems for first-time buyers in several of the countries studied. Of the three countries that saw
an increased level of owner-occupation for Young Entrant households (the Netherlands, Sweden
and the USA), the increase was very small in two of them. Only in the USA was the change
significant. In the 1990s home-ownership became more affordable to first-time buyers in the
USA due to low interest rates, and several new government-backed schemes, which were
introduced to help first-time buyers and those on low incomes to buy their own homes. House
price inflation since then has again made affordability more difficult for those on low incomes.
There seems to be a
clear trend towards
falling levels of
owner-occupation
among younger
households, partly
due to affordability
problems for first-
time buyers

CML Research
18 November 2004
Table 6: Change in tenure of Young Entrant households, last decade, %
Earlier Year Latest YearCountry
Owner-occupation All rental
Owner-occupation All rental
Direction of change
for owner-occupation
Years of data
sources
Australia 50 46 47 46 Down 1994; 1999
Canada 47 53 47 53 Stable 1991; 2001
Denmark 23 77 20 80 Down 1990; 1999
Finland 41 54 39 57 Down 1992; 1995
France 21 72 17 76 Down 1990; 2002
Netherlands 43 55 44 57 Stable 1993; 1998
Sweden 45 55 46 54 Stable 1991; 1997
UK 74 26 59 41 Down1994/95;
2001/02
USA 56 44 62 38 Up 1991; 2001Source: See country chapters
In the UK young people are tending to delay entry into home-ownership � partly because of
affordability issues but also because of lifestyle choices. While data is rather sketchy and not
available for all countries Table 7 shows the latest available average ages for first-time buyers.
In some countries this is quite high for cultural reasons (ie in Slovenia young people commonly
to continue living with parents/relatives) while in others such as the UK average age has been
increasing over time due to affordability, delay in marriage, and other lifestyle issues.
Table 7: Average age of first-time buyer, selected countries
Age Year / trend
UK 34 2003 - Increasing
Australia 32-33 1999 - Increasing
Germany 38 1994 - Decreasing
Netherlands 34 1998
Portugal 25-30 Latest
Slovenia 30-40 LatestSource: See country chapters
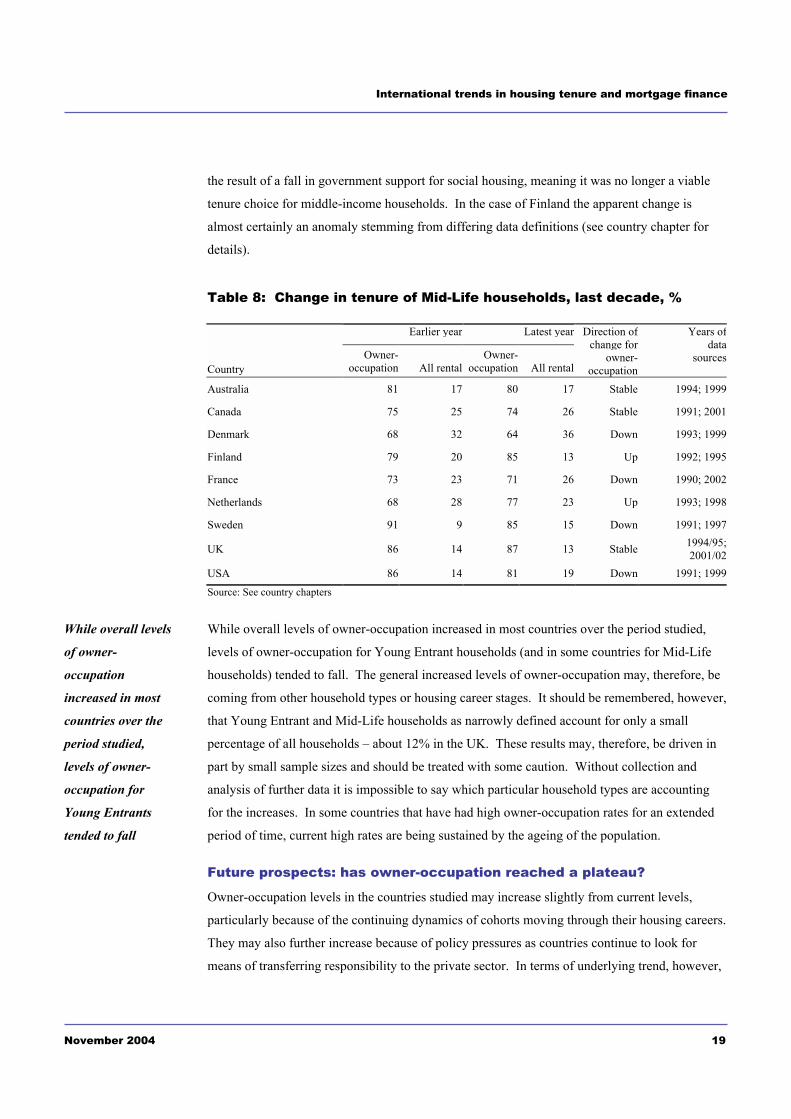
Table 8 shows the change in tenure (owner-occupation vs all rental) of Mid-Life households over
the period. In four of nine countries the percentage of owner-occupiers among middle-aged
households with children has fallen over the last decade, and in three countries it has remained
stable. The exceptions are Finland and Netherlands. In the Netherlands the increase was partly
International trends in housing tenure and mortgage finance
November 2004 19
the result of a fall in government support for social housing, meaning it was no longer a viable
tenure choice for middle-income households. In the case of Finland the apparent change is
almost certainly an anomaly stemming from differing data definitions (see country chapter for
details).
Table 8: Change in tenure of Mid-Life households, last decade, %
Earlier year Latest year
Country Owner-
occupation All rentalOwner-
occupation All rental
Direction of change for
owner-occupation
Years of data
sources
Australia 81 17 80 17 Stable 1994; 1999
Canada 75 25 74 26 Stable 1991; 2001
Denmark 68 32 64 36 Down 1993; 1999
Finland 79 20 85 13 Up 1992; 1995
France 73 23 71 26 Down 1990; 2002
Netherlands 68 28 77 23 Up 1993; 1998
Sweden 91 9 85 15 Down 1991; 1997
UK 86 14 87 13 Stable 1994/95;2001/02
USA 86 14 81 19 Down 1991; 1999Source: See country chapters
While overall levels of owner-occupation increased in most countries over the period studied,
levels of owner-occupation for Young Entrant households (and in some countries for Mid-Life
households) tended to fall. The general increased levels of owner-occupation may, therefore, be
coming from other household types or housing career stages. It should be remembered, however,
that Young Entrant and Mid-Life households as narrowly defined account for only a small
percentage of all households � about 12% in the UK. These results may, therefore, be driven in
part by small sample sizes and should be treated with some caution. Without collection and
analysis of further data it is impossible to say which particular household types are accounting
for the increases. In some countries that have had high owner-occupation rates for an extended
period of time, current high rates are being sustained by the ageing of the population.
Future prospects: has owner-occupation reached a plateau?
Owner-occupation levels in the countries studied may increase slightly from current levels,
particularly because of the continuing dynamics of cohorts moving through their housing careers.
They may also further increase because of policy pressures as countries continue to look for
means of transferring responsibility to the private sector. In terms of underlying trend, however,
While overall levels
of owner-
occupation
increased in most
countries over the
period studied,
levels of owner-
occupation for
Young Entrants
tended to fall
CML Research
20 November 2004
the popularity of owner-occupation appears to have reached a plateau. This plateau is at different
levels in different countries, reflecting social attitudes to home-ownership, legal and tax systems,
and government policies. In the former communist countries, where very high levels of owner-
occupation are seen (except in Czech Republic), markets and/or governments may work to
reduce them somewhat over the next few decades.
International trends in housing tenure and mortgage finance
November 2004 21
Chapter 3 Household expenditure on housing The objective of this section is to examine the extent to which costs differ between tenures across
the different countries. This is important in itself, but can also help to explain tenure patterns and
how they are changing. We look only at households' actual payments � not at imputed costs or
the impact of capital gains, so results are only indicative.
In comparing the expenditure on housing in different countries, we compared payments on
housing in each tenure within each country. Ratios of expenditure are calculated on housing in
the private and social rental sectors to that on owner-occupation, which was set to 100%. In the
text we refer to these ratios as relative expenditures. This allows comparisons of the relative
costs of different tenures within each country, to be made between countries - see Table 9. It is
not meaningful to compare absolute costs between countries, because different data sources use
different definitions of housing costs - some include only rent or mortgage payments, while
others include heating, local taxes, and/or utilities. Detailed data on absolute costs in national
currencies, and housing cost definitions, are included in the individual country cameos. Here, we
examine actual average housing expenditures in the most recent years for which data were
available, and compare them with expenditure patterns in the early 1990s.
On average across countries, housing costs in the social sector are about 60% of costs in the
owner-occupied sector, reflecting both subsidies and rent-control policies. Private rents, on the
other hand, are about 80% of owner-occupation costs. This might be predicted on the grounds
that the tenants are only purchasing occupancy rights rather than an asset. The cost differential
may also, however, reflect differences in the housing itself, with rental units being smaller and
perhaps poorer quality than owner-occupied dwellings.
Relative housing expenditure for Young Entrant households
For Young Entrant households, private renting is cheaper than owner-occupation everywhere but
in the UK. This echoes findings seen in the study carried out a decade ago and in Table 9 the UK
clearly stands out as the most significant cost differential for Young Entrant households.
Young households pay more to rent in the private sector than in the social sector in all countries
except Sweden (where rents for privately owned rental units are set in relation to municipally
The relative costs
of different
housing tenures
can help to explain
tenure patterns and
how they are
changing

CML Research
22 November 2004
owned units, and there is no "social rented sector" in the strictest sense). The particularly low
social rents in Australia and the USA are associated with the fact that rents are set in relation to
the incomes of their occupants � and so reflect income distribution rather than housing costs.
Table 9: Relative household expenditures on housing, latest year (owner-occupation = 100%)
Young Entrant Mid-Life Year
Social renting Private renting Social renting Private renting
Australia 30 69 57 132 1999
Belgium n/a 74 88 110 1999
Czech Republic 77 78 114 101 2001
Finland 64* 97* 2001
France 65 88 71 108 2002
Germany 75 84 50 57 2001
Hungary n/a n/a 95 104 2003
Netherlands 66 67 95 104 1998
Sweden 75 73 79 90 1997
United Kingdom 51 124 64 104 2001/02
USA 23 70 20 73 2001
Average 58 79 75 98 Average from 1996 report 52 74 65 89 Notes: Data unavailable for Denmark, Greece, Lithuania, Portugal and Slovenia. * Finland data cannot be broken down.
Relative housing expenditure for Mid-Life households
Relative expenditure on private and social renting is higher on average for Mid-Life than Young
Entrant households. The social sector tends still to be the least expensive, at 75% of the cost of
owner-occupation, while private rents in most countries now exceed the cost of owner-
occupation for these older households. This pattern was also found in the report published a
decade ago - average Mid-Life expenditure in the social rental sector in the mid-1990s was 65%,
and in the private rented sector 89%. The higher costs for renting reflect the fact that Mid-Life
owner-occupiers often purchase homes many years ago, so their costs are a function of historic
prices, while private rents in most cases reflect current prices. Equally, many owner-occupiers
have large equity shares by this time in their lives, so there are imputed costs that are not
included here. The Czech Republic is the only country where Mid-Life households pay more for
social than for private rental.
For Young Entrant
households, private
renting is cheaper
than owner-
occupation
everywhere but in
the UK. But in
many countries
private renting is
more expensive
than owning for
Mid-Life
households

International trends in housing tenure and mortgage finance
November 2004 23
Calculations for this report show that US relative expenditure on social renting is extremely low
for both Young Entrant and Mid-Life households�23% compared with an international average
of 58% for Young Entrant households, and only 20% compared with an average of 75% for Mid-
Life households. This is perhaps because the social rented sector in the USA, strictly defined,
consists only of municipally-owned housing that is rented to the very poorest people; there is no
equivalent of housing associations. As noted above social rent levels are also set according to
incomes rather than costs. However, these figures must be treated with some caution because of
data limitations.
Housing expenditure gap narrows between tenures
Across countries, social renting is always the cheapest tenure option for either household type.
For Young Entrant households, private renting is cheaper than owner-occupation, but for Mid-
Life households it is more expensive. This is the same pattern as was observed ten years ago.
Several policy and economic forces seem to be acting to narrow the gap between the cost of
owner-occupation and that of renting. Low interest rates have reduced the cost of owner-
occupation for many households (although this effect can be offset by higher house prices). At
the same time a number of governments have cut their involvement in social housing in an
attempt to liberalise the rented sectors and reduce government subsidies�thus raising the cost of
renting (social renting in particular). However, social rents have not risen everywhere; in many
countries (including Denmark, Portugal, Canada and the US) they are based on household
incomes or historic costs. The data do show a mixed picture�in some countries (eg, Finland)
the gap between owners� and renters� costs has closed somewhat over the last ten years, while in
others (Australia) it has widened.
Several policy and
economic forces
seem to be acting to
narrow the gap
between the cost of
owner-occupation
and that of renting

CML Research
24 November 2004
Chapter 4 Taxes and subsidies An important factor determining tenure patterns is the extent to which governments assist one
tenure or another through subsidy and tax relief. There have been considerable changes in the
patterns of such assistance over the last decade (notably in the UK with the removal of mortgage
tax relief), which can be expected to have impacted on both actual tenure patterns and
expenditures and on attitudes to different tenures (Holmans et al, 2002).
There is almost no difference in the tax and subsidy frameworks surrounding housing between
Young Entrant and Mid-Life households, so this discussion refers to all households. In countries
where tax relief is given at the marginal tax rate, income determines how much relief a household
receives. Since incomes differ between Young Entrant and Mid-Life households, there will be
differences in the amount of tax relief obtained. However, we are more interested in the
characteristics and composition of the tax and subsidy frameworks than in the amount of tax
relief or subsidy available to each household.
Is the favourable position of owner-occupation beginning to change?
In most of the countries studied, government policies generally still favour owner-occupation.
Tables 11 and 12 in the Appendix summarise the current situation with regard to taxes on and
subsidies for owner-occupation. The most valuable right for most households is the ability to
deduct from their income, for tax purposes, all or part of the interest paid on their mortgage.
Most countries allow this; Belgium also permits deduction of part of the principal. Iceland's tax
treatment is notably generous � see below.
Iceland: Tax treatment of mortgage interest
Through its tax treatment of mortgage interest payments, the Icelandic government basically
pays all interest over six per cent of household income. Owner-occupiers list housing-loan
interest on their tax returns, and from this amount deduct six per cent of total family income. If
the result is positive (that is, if the amount of interest paid is geater than six per cent of
household income), the Icelandic tax authorities send the household a cheque for this amount at
the end of the tax year. This very generous tax treatment encourages borrowing, and means that
nominal interest rates are not very meaningful.
In most of the
countries studied,
government
policies generally
still favour owner-
occupation
International trends in housing tenure and mortgage finance
November 2004 25
There have been changes in several countries over the last ten years that have tended to lessen the
favourable tax treatment of owner-occupation.
! Five countries have recently changed the tax treatment of mortgage payments; in all
countries it appears that the end result will be less favourable for owner-occupiers.
! France and the UK have abolished tax relief on mortgages for owner-occupiers (France in
1997/98, the UK in 2000). Previously, French owner-occupiers with mortgages received a
tax credit equal to 25% of the interest paid on the mortgage, subject to certain ceilings.
! In Finland the percentage of mortgage interest that can be subtracted from tax payable was
increased in 1995, from 25% to 29%. However, this form of tax relief is due to be
reformed shortly, to target the benefit to first-time buyers and families with children.
Existing owner-occupiers will not be affected, but new buyers who fall outside the targeted
groups will be.
! In 1998 Denmark reduced the tax rate at which mortgage interest can be deducted, and
Greece in 2002 limited full mortgage-interest tax relief to dwellings under a certain size.
In the former communist countries studied, on the other hand, tax treatment of owner-occupiers
has grown more favourable over the last ten years. Hungary made tax deductibility for owner-
occupiers significantly more generous in 2001 and 2002, and Lithuania introduced mortgage-
interest deductibility in 2002.
In almost all the countries studied, sales of owner-occupied housing are free from capital gains
tax if certain criteria are met. These may include value ceilings and minimum holding periods
(Germany, for instance, increased the holding period from two to ten years in 1998). Greece is
the exception here, charging capital gains tax against which the owner-occupier can claim
depreciation.
The most common form of subsidy to owner-occupiers is subsidised mortgage interest rates,
often following the German Bausparen model, see details of the Slovenian scheme below.
Eligibility for such schemes is often limited to buyers of new homes, young people, and/or first-
time buyers (as in Finland). Some countries, such as France and Portugal, have recently
tightened regulations on the use of house-savings accounts to ensure that they are in fact used to
purchase housing. Sweden and Lithuania did have subsidised-interest schemes, but have now
abolished them.
Many countries
are, however, now
lessening
favourable tax
treatment for
owner occupation

CML Research
26 November 2004
Subsidised mortgage interest rates in Slovenia
Under the Slovenian scheme, savers contract to save a set amount monthly for five or ten years.
They are paid below-market interest rates, but their deposit is topped up by a state-funded
premium. At the end of the savings period, the saver is entitled to a loan with a below-market
interest rate, which must be spent on housing.
Mixed trends in support for social and private renting
Tables 13 and 14 in the Appendix provide a summary of the current tax and subsidy framework
for private and social renting. Private rental property is treated as an investment good in most
countries, as it was at the time of the previous report. Expenses (including mortgage interest) are
generally deductible from rental income for tax purposes. Capital gains are taxed in most
countries; Finland is an exception � here income from rental properties is taxed, but capital gains
are not. Social landlords generally receive more favourable tax treatment than private landlords,
and often benefit from government grants for construction of social housing or other subsidies.
Recent changes with respect to private renting have generally been relatively minor. The most
important changes have been in Germany, which has made its depreciation allowances for private
landlords less generous, and has extended the holding period for capital-gains-tax-free sales of
rental properties from two to ten years. In contrast the tax treatment of private renting in
Australia was improved for investors in 1999 and this contributed to a boom in the housing
market since 2000. There is also evidence of government encouragement of private renting in
the UK with a HM Treasury consultation in 2004 on introducing Property Investment Funds
(similar in format to American Real Estate Investment Trusts). The stated aim of these new
funds is to boost investment in property and in the private rented sector specifically.
Overall, therefore, there is a mixed picture. Many governments continue to reduce their
involvement in social housing, either by trimming the size of the social sector and/or by cutting
subsidies and raising rents. At the same time, a few governments have introduced policies to
encourage investment in private renting, which have helped revitalise this sector.
Social housing
subsidies are
becoming less
generous leading
in turn to higher
social rents
International trends in housing tenure and mortgage finance
November 2004 27
Chapter 5 Mortgage systems In the next section we examine how each country's mortgage system operates, from the point of
view of the consumer, in order to explore whether and how this might affect tenure choices and
the age at which households can access owner-occupation (see ECB, 2003; Mercer Oliver
Wyman, 2003; Miles, 2003/2004, for detailed comparisons of mortgage systems). This section
mainly, though not exclusively, covers mortgages for individual households rather than investor
or buy-to-let mortgages. We summarise the available information in Table 15 in the Appendix.
Mortgage systems in the countries studied vary widely - as is to be expected, given that in some
of these countries the housing finance system is only a few years old, see box on Slovenia below.
Home lending not secured on the dwelling: the case of Slovenia
Mortgage lending, in the sense of a house-purchase loan secured on the dwelling, was only
introduced in Slovenia in 1997. Prior to that, housing loans were secured by guarantors or on
loan insurance. The loan period was limited to ten years because insurers would only issue
insurance for this period. The mortgage system is still in its infancy, and only about 20% of
housing loans are secured on the dwelling. The banks still prefer insurance as collateral,
because possession is a lengthy, difficult procedure (it takes a minimum of two years and, until
recently, if the bank foreclosed the borrower had the legal right to stay in the house as a tenant).
This leads to high up-front costs, with redemption costs of up to five per cent of the loan value.
Even within the EU, though, the mortgage systems are very different. The differences reflect,
! national legal frameworks - for instance, loan-to-value ratios are limited by law in some
countries; in others, interest rates must be indexed to underlying central bank rates,
! economies � for example, Dutch loan-to-income ratios are rising due to high house prices,
! local habits and preferences � for example, UK home buyers expect to own a series of
homes of increasing size, topping up their mortgage with each purchase, while French
owner-occupiers expect to live in their home for the rest of their lives.
Despite this variation, there are similarities in trends across countries that we now turn to.
Mortgage systems
vary widely
according to
differences in legal
frameworks,
economies and
cultural factors

CML Research
28 November 2004
Borrowers benefit from low interest rates
Interest rates have fallen globally over the last ten years, and mortgage interest rates have fallen
in all the countries studied. In countries where most loans are at variable rates of interest all
buyers, including those with existing mortgages, have benefited from these new lower interest
rates - in Finland, for example, 97% of mortgages are on variable rates. In countries where fixed
rates predominate, new borrowers benefit from rate falls, but holders of existing mortgages may
be locked into higher rates. In some cases holders of fixed-rate mortgages can remortgage
without prepayment penalties, but in others they must compensate lenders for their losses if they
pay off the mortgage before the end of its term - in Canada mortgages known as "closed" carry a
prepayment penalty, while "open" ones do not.
If interest rates were to rise from today's levels this picture would be inverted -holders of fixed-
rate loans would clearly benefit compared to holders of variable-rate loans. The USA is the best-
known example of a country where interest rates on most mortgages are fixed for the term of the
loan (normally 30 years). In Iceland mortgage interest rates are indexed to inflation -that is, the
borrower pays a determined real interest rate, plus inflation. The current mortgage interest rate,
at 5.1% plus inflation, is significantly higher than in most of the other countries studied but � as
described in the box earlier - interest rates are effectively capped relative to income. Across
countries more interest rates are now linked to the macro-economy (for example, products that
track the base rate set by the central bank). This may prove more risky in theory as borrowers are
exposed to changes in interest rates more quickly, although in practice it is not clear whether this
will actually prove to be the case.
Mortgage terms and LTVs beginning to increase
There is a general tendency for mortgage terms to lengthen. This has been the case not only in
countries where terms were formerly very short (eg, in Lithuania, ten-year terms were common;
now the average is 20-25 years), but also in countries such as the USA, where 63% of first
mortgages in 2001 were for 30 years. Finland is an interesting example, illustrated below.
Variable-term mortgages in Finland
In Finland the typical mortgage is a variable-rate loan where the monthly payment remains the
same and, when the interest rate varies, the loan term varies accordingly. A rapid increase in
house prices in Finland in recent years, coupled with a decline in interest rates, has led to a
lengthening in loan terms. The typical term is 15-20 years - still short by European standards.
There is a general
tendency for
mortgage terms to
lengthen and in
some countries
LTV ratios are also
increasing

International trends in housing tenure and mortgage finance
November 2004 29
Longer term loans generally go hand-in-hand with higher loan-to-value ratios (LTVs). The
European Central Bank points out that "concerning LTV ratios, most EU countries have in place
some mechanism that makes it costly for both the borrower and the lender to agree on LTV ratios
above 75-80%. Beyond this threshold, capital adequacy ratios are higher, the use of mortgage-
backed bonds is restricted and the buyer may be requested to post extra guarantees." (ECB,
2003). In spite of this there is evidence that borrowers in a number of countries are able to get
higher LTV ratios than ten years ago. This is the case in Australia, Netherlands, Sweden and
Denmark. In some countries, such as Belgium, even where regulations limit LTV ratios,
borrowers are able to achieve effective LTVs of 100% by topping up with unsecured loans.
One might expect countries where LTVs are low to have low owner-occupation rates among
young households, because they would not have had time to accumulate a large deposit.
Conversely, we might expect that countries with high average LTVs would also have high
owner-occupation rates for young households. Table 10, below, shows typical LTVs and owner-
occupation rates for Young Entrant households.
Table 10: LTVs and Young Entrant owner-occupation
Country Average LTVYoung householdsowner-occupation
rate
Australia 95 47
Netherlands 87 44
Sweden 85 46
Belgium 83 33
Lithuania 82 61
Denmark 80 20
Germany 70-80 49
Finland 77 39
USA 76 62
UK 75* 61
Iceland 70 70
Hungary 70 95
France 60 17
Czech Republic 40 29Source: See country chapters Note: Denmark: 80% LTV is legal maximum for mortgage banks, but young entrants normally get loans from commercial banks where higher LTVs�up to 115%--are common. * UK rises to 89% for FTBs

CML Research
30 November 2004
When plotted in Chart 2 it is clear that the relationship is at best a very weak one, indicating that
LTVs alone do not explain much of the observed variation in owner-occupation rates.
Differences may be due to cultural factors such as a large involvement in the family in the
provision of housing in some countries; particularly in the south of Europe.
Chart 2: Relationship between average loan to value ratios and Young Entrant owner-occupation rates
0102030405060708090
100
0 10 20 30 40 50 60 70 80 90 100
Typical LTVs
Ow
ner-
occu
patio
n ra
tes
Australia
CzechFrance
Germany
USA
Finland
Denmark
UK
Hungary
Iceland
Source: See country chapters
Increasing variety in mortgage products
The variety of mortgage products offered has burgeoned in recent years. Important product
innovations are summarised in Table 16 in the Appendix. At one extreme, former communist
countries such as Slovenia now have functioning, albeit undeveloped, mortgage systems. At the
other, the UK, where the consumer already had a wide choice of mortgage types, has seen a
steady introduction of new products. These include flexible mortgages (which permit over- and
underpayments, as well as payment 'holidays') and offset mortgages (where mortgage and
savings are in the same or linked accounts, and savings are offset against the mortgage balance).
Similarly, in Australia new loan products have included home equity loans and deposit bonds.
Under this scheme, in exchange for a fee an insurance company guarantees that the deposit will
be paid at settlement, so the purchaser does not have to pay a deposit when contracts are
exchanged.
In Slovenia, Austria and Denmark foreign-currency mortgages are important. In Austria the
currencies concerned are the Japanese yen and the Swiss franc; in Slovenia and Denmark Euro-
denominated mortgages are available. An Icelandic bank has just introduced a mortgage
denominated in a basket of foreign currencies. These mortgages appeal to some consumers
The range of
choice in products
is increasing in
most countries,
driven by
competition and
consumer demand

International trends in housing tenure and mortgage finance
November 2004 31
because interest rates are lower than on national currencies, but borrowers must bear the
exchange-rate risk.
Growing competition helps to increase access to home-ownership
Competition forces lenders to develop new products and to price keenly (and perhaps
differentially), particularly in those countries with active re-mortgage markets. Strong
competition between lenders can lead to a relaxation of entry thresholds, allowing younger and
less well-off households to borrow to enter owner-occupation. All else being equal, increased
lender flexibility can clearly widen access to home-ownership. However, affordability problems
have meant that the average age of first-time buyers in some countries is increasing rather than
falling.
The general picture is one of increased borrowing in the face of declining money interest rates
and of increasing availability of a wider range of mortgage instruments. Competition is strong
and pricing is perceived to be keen in most of the countries analysed. If anything, the movement
is towards shorter-term fixed rates and towards higher levels of borrowing, both of which from
the outset increase exposure to potential risks. Equally, there is little evidence of standardisation
across countries. Culture and tradition continue to dominate, although the range of choices for
consumers has clearly widened.
There is a general
movement to
shorter-term fixed
rates and higher
borrowing levels,
but little evidence
of standardisation
across countries
CML Research
32 November 2004
Chapter 6 Risk mitigation In this chapter we ask how different housing finance systems have been addressing the issue of
risk -both the individual risks associated with the mortgage borrower, and the more general
systemic and policy risks usually arising from changes in the wider economy. Many countries
are experiencing an increase in different borrower types in owner-occupation as well as changing
social and economic conditions, such as changes in the labour market and increasing
divorce/relationship breakdown. In this environment, therefore, risk mitigation becomes
relatively more important.
There are several types of risk associated with lending on housing, including:
! Credit risk � the risk to the lender that the borrower will default on his loan
! Investment risk � the risk to the owner-occupier that the value of the home will fall, and
with it the value of the owner-occupier's equity
! Interest-rate risk � the risk to either party to a loan that the interest rate will move against
them
! Prepayment risk � the risk to the lender that the borrower will repay a loan (particularly a
fixed-rate loan) before the end of its term.
We are particularly interested in how the countries studied deal with credit risk. What
mechanisms do they use to insure borrowers and/or lenders against the risk of default? Is public
money available to prevent default by private borrowers? Risk management takes place not only
through these mechanisms, of course, but also through the operation of the mortgage system as a
whole. Credit risk is affected by regulations in each country governing loan-to-income ratios,
interest arrangements and loan duration, all of which, as shown in Chapter 5, can vary
considerably. It is also affected by the operation of the social security system: in some countries
the social security system makes some contribution to mortgage payments for workers who lose
their jobs. Credit risk mitigation mechanisms across countries are shown in Table 17 in the
Appendix.
More varied
borrower types,
changing labour
markets and social
shifts have
increased the
relative importance
of risk mitigation
International trends in housing tenure and mortgage finance
November 2004 33
State guarantees
In Finland, Greece, Hungary and the former East Germany state agencies offer mortgage
guarantees in some form. These are often limited to certain types of households � those with
low incomes, those in receipt of housing subsidies, or members of certain groups (eg, immigrants
from former communist countries in Greece). Increasingly, however, state-based mortgage
insurance is available to all owner-occupiers (as, for example, in Sweden). This insurance
protects the lender against default-related risks � that is, if the purchaser defaults, the lender will
still receive its money. In some cases the state guarantor will (or can) then pursue the borrower
for the amount lost.
State guarantees normally protect the lender rather than the borrower. There are some state
schemes that do protect the borrower, for example in the case of unemployment - see box below.
Belgium: Flanders insurance against income loss
Since June 1998 purchasers in Flanders have been eligible for Flemish government insurance
against income loss. When concluding a mortgage, a household can get ten years' free
insurance. If the earner(s) involuntarily becomes unemployed or unemployable, the insurance
will make a part-contribution to the repayment of the mortgage (waiting period six months;
maximum duration of payments three years, maximum payments apply). During the second
and third years benefit levels fall. The scheme is managed by a large insurance company on
behalf of the government, which pays the cost of this insurance.
Netherlands: State insurance against fall in value of dwelling
The borrower pays 0.3% of the mortgage amount for a guarantee from the Netherlands National
Mortgage Guarantee scheme (NHG). This money goes into a fund to meet potential losses.
Under its terms, the NHG will pay if the borrower should be unable to meet interest and
repayment obligations. (If the borrower is at fault for defaulting, he/she then owes this sum to
NHG.) Moreover, the borrower receives a discount of 20 to 50 basis points on the market
interest rate, because the credit risk for banks of NHG loans is practically nil. In addition to
indemnifying the lender against default by the borrower, since 1998 the NHG also insures
purchasers against a fall in house prices: if the borrower is forced to sell the house by long-term
illness, unemployment, divorce, etc, the NHG will make up the difference of the debt.
Many countries
offer state based
mortgage
guarantees to
protect the lender

CML Research
34 November 2004
In Germany, the government introduced guarantees of mortgage payments for low-income
households in former East Germany only. Lithuania offers an interesting hybrid - the Lithuania
Mortgage Interest Company is government owned, but operates without government guarantees.
It offers insurance covering a variety of losses, which aims to improve housing affordability by
making low deposits possible.
Private mortgage insurance
Private mortgage insurance is increasingly widespread, though in many countries it is a very
minor player compared to state agencies. The English-speaking countries studied - the UK,
Canada, the USA and Australia - are those with the most developed private insurance markets.
In a few countries (Canada, for example) state and private insurers compete in the same market,
but generally private insurers cover households or risks that are excluded from state cover. As
with state mortgage guarantee schemes, there are two types of private mortgage insurance: that
which protects lenders against loss of principal, and that which protects borrowers when faced
with loss of income.
In the UK, some lenders insure high LTV loans using mortgage indemnity insurance (MII). This
protects the lender against losses arising from foreclosure, but is paid for by the borrower. They
are a way of allowing consumers to get high gearing without paying increased interest rates. MII
premiums or other high lending charges are more likely to be applied on loans with an LTV of
over 90%, although some lenders charge these on loans with an LTV above 75%. Other methods
of credit risk mitigation used by lenders in the UK include self-insurance, excess of loss
insurance, securitisation and use of captives.
In addition, borrowers can often purchase private insurance against loss of income, which will
cover their mortgage payments (at least for a certain period). In the Netherlands such policies
generally have a term of only one or two years, not the full term of the mortgage. In the UK,
Mortgage Payment Protection Insurance (MPPI) can last the full term of the loan, but payouts are
usually limited in duration and a waiting period often applies.
Mortgage lenders often require borrowers to take out certain kinds of insurance as a condition of
the loan. Insurance is normally required on the dwelling itself, and often on the borrower's life.
In Belgium and the Netherlands lenders require borrowers to take out life insurance, and in
Germany mortgages for first-time buyers are combined with life insurance.
UK, Canada, USA
and Australia have
the most developed
private insurance
markets

International trends in housing tenure and mortgage finance
November 2004 35
State help with mortgage payments
Governments (often local governments) in several countries pay all or part of borrowers'
mortgage costs under certain circumstances. In the UK, the government provides some means-
tested support to borrowers who become unemployed, through the Income Support for Mortgage
Interest programme. The government pays mortgage interest, but only after the borrower has
been unemployed for nine months. In Australia such payments are made by state governments,
and are of limited duration. In the Netherlands if owner-occupiers get into arrears with their
mortgage payments they can get a means-tested temporary subsidy from the municipality to
cover their housing costs. Recipients are obliged to move within a certain time (generally a year)
to cheaper accommodation (normally rented).
Sub-prime lending
Credit risk is of course particularly an issue in the case of sub-prime lending. The UK and
Australia both have significant high-risk lending markets. In Australia, new lenders known as
non-conforming lenders specialise in lending to borrowers who do not meet banks' normal
lending criteria � who, for example, have a bad credit history or are seeking a loan with a very
high loan-to-value ratio. In the UK the non-conforming sector has grown considerably over the
last decade with loans available to those with credit-impaired history, and those who need to self-
certify/are self-employed. There is also limited availability of products for consumers:
! with credit impaired history in Denmark, France and Netherlands,
! who have previously been bankrupt in Denmark,
! who self-certify their loans in the Netherlands, and
! who are self-employed in most countries.
Mercer Oliver Wyman find that access to mortgage insurance can enable the market to offer
higher risk products. This is because the insurer can take on the risk rather than the lender, and
can do this more efficiently due to the greater diversification of risk. Markets where mortgage
insurance is more common such as the UK have shown greater willingness to offer higher LTV
products and loans to higher risk borrower groups (Mercer Oliver Wyman, 2003).
Prepayment risk
Prepayment risk is the risk to the lender that the borrower will repay a loan (particularly a fixed-
rate loan) before the end of its term. Assuming there are no prepayment penalties, a rational
borrower will want to pre-pay a fixed-rate mortgage if interest rates have fallen since the loan
was taken out, because the borrower could then secure another mortgage at the new, lower
More sophisticated
risk mitigation has
enabled the growth
of non-conforming
lending

CML Research
36 November 2004
interest rate. The lender will suffer a fall in its income stream, as it can only re-lend the money at
this lower rate of interest.
Lenders can limit pre-payment risk in several ways (for a full discussion of ways of limiting
prepayment risk, see Miles 2003 and 2004). They may hedge it, using swaps and derivatives.
They may pass the risk on to borrowers by imposing penalties for early repayment of loans.
These penalties may be pre-determined fees, or may reflect the cost to the lender of breaking the
contract (known as "mark-to-market" charges). Pre-determined fees are common in the UK; for
example, a borrower with a five-year fixed-rate loan might have to pay a fee of 5% of the
principal for breaking the contract in the first year, 4% in the second year, and so on. Mark-to-
market fees are used in Germany. Prepayment penalties are limited by law in some countries and
regulations often require that lenders can prove that the prepayment fee relates to losses incurred.
Another option is for the lender to require all borrowers to pay a higher interest rate over the life
of their mortgages in order to compensate for the risk that some will prepay their loans. Where
mortgages are financed by fixed-rate debt, lenders can make that debt callable, as is the case in
Denmark. When mortgages are prepaid, the lender can call (repay) the debt. Investors in
callable debt need to be compensated for this possibility, so yields on callable debt are higher
than on comparable non-callable issues.
In the USA the typical mortgage is a 30-year fixed-rate loan with no prepayment penalties. Pre-
payment risk here is handled by the use of mortgage-backed securities (MBS). Mortgages are
bundled by lenders and sold on to investors, who receive the income from the mortgages and
therefore assume the prepayment risk. As with callable bonds, investors in MBS demand a
higher yield in order to compensate for this risk. Thus fixed-rate mortgages with no prepayment
penalties will generally carry higher interest rates than those with prepayment penalties.
Increasing risks result in huge variety of mitigation strategies
It is clear that different countries use very different mortgage and savings instruments, which
allocate the risks of changes in cost, value and ability to pay in quite different ways. Increasing
lending, shorter-term fixed interest rates and greater use of variable-rate mortgages, together with
increasing lending to less traditional households, tend to heighten potential risks, especially those
associated with changes in macroeconomic variables.
Some new insurance products are beginning to emerge, addressing variations in value and loss of
income, with the help and sometimes the guarantee of governments. Yet this type of
In some countries,
risk mitigation has
focused on
protecting the
lenders and the
financial system.
But there is now
pressure to find
ways of more fully
addressing the
risks to consumers

International trends in housing tenure and mortgage finance
November 2004 37
encouragement has, in many countries, generally focused more on the risk to lenders than to
borrowers. As borrowers also face an increasingly risky environment there is clearly pressure in
many countries to find ways of addressing these risks specifically and consumers' financial
capability more generally.

CML Research
38 November 2004
Chapter 7 Future prospects for tenure patterns The patterns of tenure, household expenditure and subsidy discussed in this report are mainly
consistent with our understanding in the mid-1990s. But there are also differences � and some
concerns.
Owner-occupation rates have in general increased and are now on average around 66%. But the
rate of increase outside the transition countries has slowed considerably and there is real evidence
of stabilisation. The increases that are occurring tend to be the result of cohort effects � because
the oldest households had lower rates of owner-occupation � or among non-traditional types of
household.
Younger households tend to be entering owner-occupation later. This is in part a reflection of the
general trend towards higher house prices and access problems which is a matter of concern in
many countries. Increasingly though, changing lifestyles are also playing a role.
It is also worth noting that many of the highest rates of owner-occupation have been achieved in
societies that do not make extensive use of mortgage finance; indeed, some do not have highly
developed housing-finance systems. In the transition countries this is particularly true - high
owner-occupation rates come from the transfer of equity to individuals. Equally they are
sometimes the result of self-build or individual equity, often in rural areas. In the UK the
relatively high owner-occupation rate would not have been achieved without the Right to Buy
policy, which mixed equity transfer with the use of mortgage finance.
In terms of expenditure, there is some evidence that although house prices have increased (often
rapidly), outgoings have declined as a result of falling inflation and nominal interest rates. This
in turn has fed demand for housing and further increased prices. In many countries movement
towards longer-term mortgages, and sometimes to variable-rate mortgages, which have lower
initial costs, has reinforced this process. In deregulated markets - and there is evidence across
most of the countries examined of liberalisation and increases in the range of products available -
this allows households to borrow more. Together with a changing social and economic
environment it also increases the risks associated with both interest-rate rises and loss of income.
Although owner-
occupation is
generally
increasing,
younger
households are
none the less
entering home-
ownership later
due to high costs
and lifestyle
changes

International trends in housing tenure and mortgage finance
November 2004 39
New risk mitigation products have mainly focused on protecting lending institutions rather than
borrowers. This has further extended the potential lending market, but may again have left the
borrower more exposed. The unexpectedly slow progress with respect to protecting borrowers is
probably associated with the macro-economic environment of the second half of the 1990s.
There has been very little incentive to take account of risk because of falling interest rates and
generally stable economies. However, this situation could change quite quickly, resulting in
considerable problems, if unemployment, inflation and interest rates were to rise together.
Britain is almost alone in developing mortgage insurance to protect against loss of income, but
the Netherlands, interestingly, is developing insurance against loss of value. This type of
insurance has also been discussed with government guarantees in regeneration and low-demand
areas in the UK and in Finland.
The situation with respect to the rented sector appears to continue past trends: the proportion of
social rented housing is declining and rents are generally rising in relative terms. Neither Young
Entrant nor Mid-Life households � as defined in this study - are likely to be in the sector. In
most of the countries studied this sector tends to cater for the old and for the disadvantaged. It is
not usually, therefore, a tenure of choice. Private renting is generally cheaper than owner-
occupation for younger households, reflecting both high entry costs to owner-occupation and
perhaps the smaller size of privately rented units. The UK still stands out as having higher costs
of private renting.
Mid-Life households still pay less in owner-occupation remain than in private renting, in part
because most such households will have significant equity in their homes. We have not
attempted a full economic cost comparison as this depends on data that were not available,
especially with regard to capital gains.
In terms of government expenditures it is clear that the emphasis on reducing subsidies and tax
relief for owner-occupiers continues. This is associated with greater targeting, especially on
first-time buyer, family households. The growing focus in the UK on developing an intermediate
tenure is mirrored, with differences in emphasis, across a range of countries.
There is also some interesting evidence of government interest in supporting investment in the
privately rented sector through subsidies to provision (USA, UK), attempts to ensure land
provision (Finland, UK), and tax transparent vehicles.
Further risk
mitigation
strategies to protect
borrowers need to
be developed in
many countries

CML Research
40 November 2004
In terms of longer-term trends, the evidence is that across most of Europe owner-occupation is
maturing. It is therefore not expected to grow as rapidly over the next decade as it has done in
earlier decades. In many national housing markets younger entrants have been facing growing
access problems because of rapidly rising house prices in high pressure areas.
In the shorter term, attitudes to the housing market have been shaped by the relatively easy
conditions of the last few years. Some of the housing experts consulted for this research were
concerned that these might have led to overconfidence. They felt that households and
governments in their countries might be relying too heavily on housing debt and are not taking
full account of the potential risks if macro-economic conditions were to worsen. At the time of
writing, however, markets seem to be stabilising, with some evidence of lower prices and lower
activity in markets which were thought to be overheating. This may in turn help to alleviate the
access problems faced by younger households.
The owner-
occupied market is
now maturing in
many countries
and is not expected
to grow
significantly over
the next decade

International trends in housing tenure and mortgage finance
November 2004 41
Appendix of summary tables
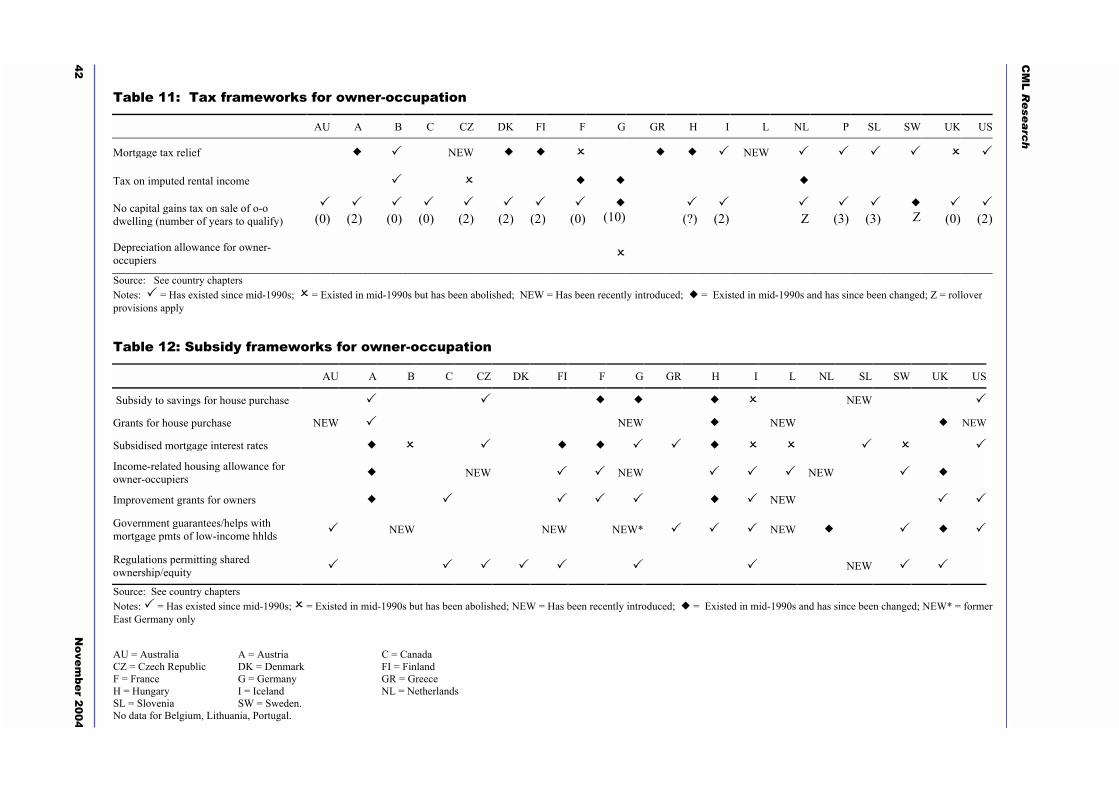
42 N
ovember
2004
CM
L Re
se
arc
h
Table 11: Tax frameworks for owner-occupation
AU A B C CZ DK FI F G GR H I L NL P SL SW UK US
Mortgage tax relief ! " NEW ! ! # ! ! " NEW " " " " # "
Tax on imputed rental income " # ! ! !
No capital gains tax on sale of o-o dwelling (number of years to qualify)
"(0)
"(2)
"(0)
"(0)
"(2)
"(2)
"(2)
"(0)
!(10)
"(?)
"(2)
"Z
"(3)
"(3)
!Z
"(0)
"(2)
Depreciation allowance for owner-occupiers #
Source: See country chapters Notes: " = Has existed since mid-1990s; # = Existed in mid-1990s but has been abolished; NEW = Has been recently introduced; ! = Existed in mid-1990s and has since been changed; Z = rollover provisions apply
Table 12: Subsidy frameworks for owner-occupation
AU A B C CZ DK FI F G GR H I L NL SL SW UK US
Subsidy to savings for house purchase " " ! ! ! # NEW "
Grants for house purchase NEW " NEW ! NEW ! NEW
Subsidised mortgage interest rates ! # " ! ! " " ! # # " # "
Income-related housing allowance for owner-occupiers ! NEW " " NEW " " " NEW " !
Improvement grants for owners ! " " " " ! " NEW " "
Government guarantees/helps with mortgage pmts of low-income hhlds " NEW NEW NEW* " " " NEW ! " ! "
Regulations permitting shared ownership/equity " " " " " " " NEW " "
Source: See country chapters Notes: " = Has existed since mid-1990s; # = Existed in mid-1990s but has been abolished; NEW = Has been recently introduced; ! = Existed in mid-1990s and has since been changed; NEW* = former East Germany only
AU = Australia A = Austria C = Canada CZ = Czech Republic DK = Denmark FI = Finland F = France G = Germany GR = Greece H = Hungary I = Iceland NL = Netherlands SL = Slovenia SW = Sweden. No data for Belgium, Lithuania, Portugal.
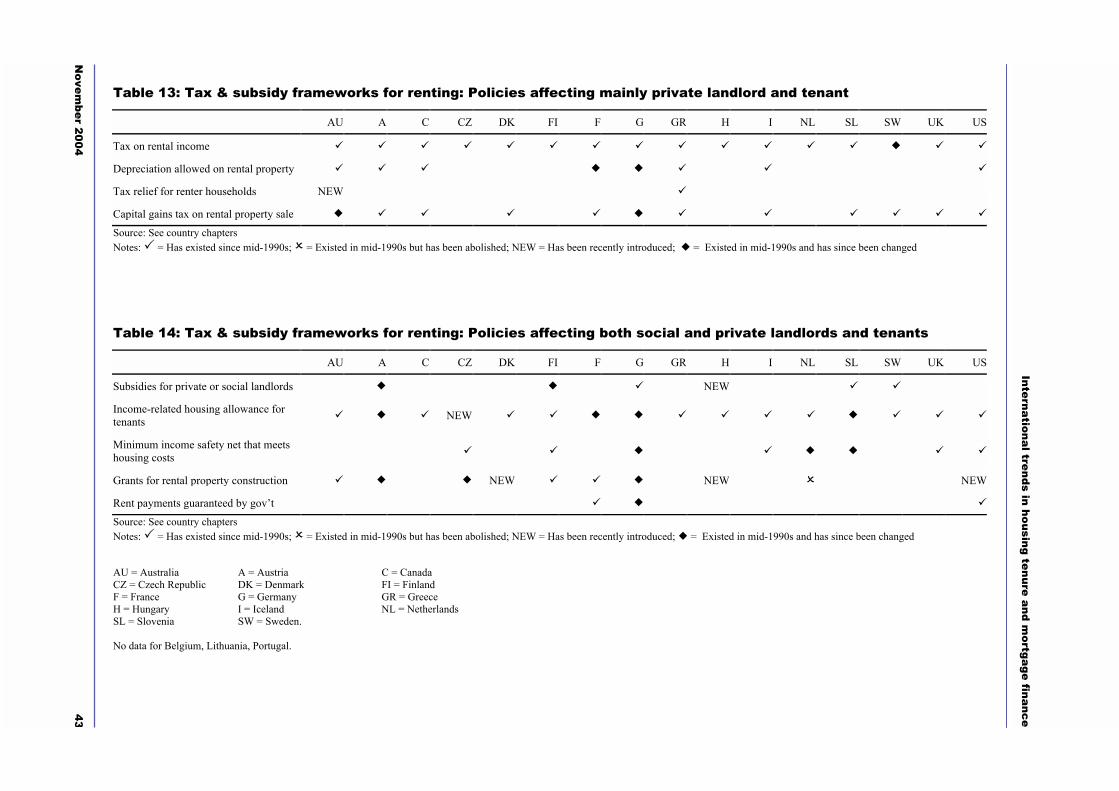
Novem
ber 2004 43
Internationaltrendsin
housingtenure and m
ortgagefinance
Table 13: Tax & subsidy frameworks for renting: Policies affecting mainly private landlord and tenant
AU A C CZ DK FI F G GR H I NL SL SW UK US
Tax on rental income # # # # # # # # # # # # # ! # #
Depreciation allowed on rental property # # # ! ! # # #
Tax relief for renter households NEW #
Capital gains tax on rental property sale ! # # # # ! # # # # # #
Source: See country chapters Notes: " = Has existed since mid-1990s; # = Existed in mid-1990s but has been abolished; NEW = Has been recently introduced; ! = Existed in mid-1990s and has since been changed
Table 14: Tax & subsidy frameworks for renting: Policies affecting both social and private landlords and tenants
AU A C CZ DK FI F G GR H I NL SL SW UK US
Subsidies for private or social landlords ! ! # NEW # #
Income-related housing allowance for tenants # ! # NEW # # ! ! # # # # ! # # #
Minimum income safety net that meets housing costs
# # ! # ! ! # #
Grants for rental property construction # ! ! NEW # # ! NEW # NEW
Rent payments guaranteed by gov�t # ! #
Source: See country chapters Notes: " = Has existed since mid-1990s; # = Existed in mid-1990s but has been abolished; NEW = Has been recently introduced; ! = Existed in mid-1990s and has since been changed
AU = Australia A = Austria C = Canada CZ = Czech Republic DK = Denmark FI = Finland F = France G = Germany GR = Greece H = Hungary I = Iceland NL = Netherlands SL = Slovenia SW = Sweden. No data for Belgium, Lithuania, Portugal.
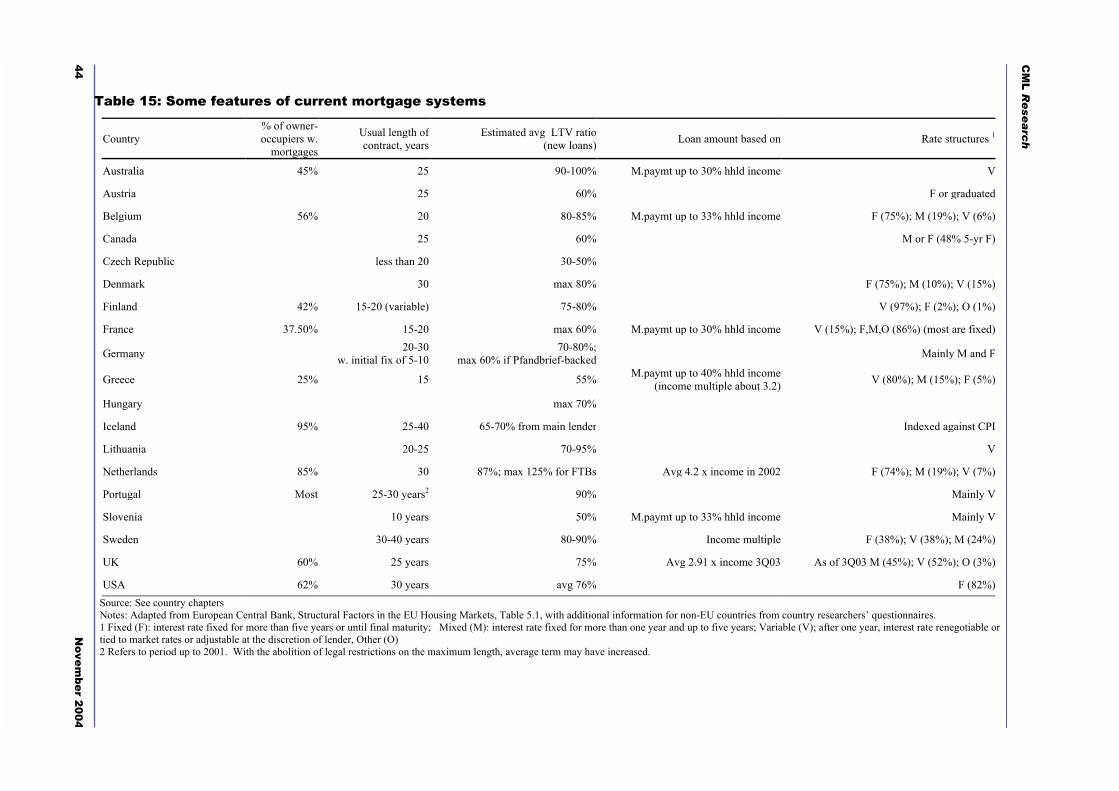
44 N
ovember
2004
CM
L Re
se
arc
h
Table 15: Some features of current mortgage systems
Country % of owner-occupiers w.
mortgages
Usual length of contract, years
Estimated avg LTV ratio (new loans) Loan amount based on Rate structures 1
Australia 45% 25 90-100% M.paymt up to 30% hhld income V
Austria 25 60% F or graduated
Belgium 56% 20 80-85% M.paymt up to 33% hhld income F (75%); M (19%); V (6%)
Canada 25 60% M or F (48% 5-yr F)
Czech Republic less than 20 30-50%
Denmark 30 max 80% F (75%); M (10%); V (15%)
Finland 42% 15-20 (variable) 75-80% V (97%); F (2%); O (1%)
France 37.50% 15-20 max 60% M.paymt up to 30% hhld income V (15%); F,M,O (86%) (most are fixed)
Germany 20-30 w. initial fix of 5-10
70-80%; max 60% if Pfandbrief-backed Mainly M and F
Greece 25% 15 55% M.paymt up to 40% hhld income (income multiple about 3.2) V (80%); M (15%); F (5%)
Hungary max 70%
Iceland 95% 25-40 65-70% from main lender Indexed against CPI
Lithuania 20-25 70-95% V
Netherlands 85% 30 87%; max 125% for FTBs Avg 4.2 x income in 2002 F (74%); M (19%); V (7%)
Portugal Most 25-30 years2 90% Mainly V
Slovenia 10 years 50% M.paymt up to 33% hhld income Mainly V
Sweden 30-40 years 80-90% Income multiple F (38%); V (38%); M (24%)
UK 60% 25 years 75% Avg 2.91 x income 3Q03 As of 3Q03 M (45%); V (52%); O (3%)
USA 62% 30 years avg 76% F (82%) Source: See country chapters Notes: Adapted from European Central Bank, Structural Factors in the EU Housing Markets, Table 5.1, with additional information for non-EU countries from country researchers� questionnaires. 1 Fixed (F): interest rate fixed for more than five years or until final maturity; Mixed (M): interest rate fixed for more than one year and up to five years; Variable (V); after one year, interest rate renegotiable or tied to market rates or adjustable at the discretion of lender, Other (O) 2 Refers to period up to 2001. With the abolition of legal restrictions on the maximum length, average term may have increased.

Novem
ber 2004 45
Internationaltrendsin
housingtenure and m
ortgagefinance
Table 16: Recent mortgage product innovations in selected countries
Country Recent innovations
Australia Flexible mortgages with variable repayments; Home equity loans; Split-purpose loans (splits loan into two sub-accounts, giving tax advantages); Deposit bonds (insurance company guarantees payment of deposit at settlement); Non-conforming loans; Redraw facilities and offset accounts; New providers including mortgage originators and brokers
Austria Loans denominated in non-Euro currencies, particularly Swiss franc and Japanese yen
Belgium Loans available for up to 30 years
Denmark �Interest-adjusted� loans: interest rate set at regular intervals by sale of bonds; Capped-rate loans; BoligXloans: interest adjusted every 6 months with reference to 10-day average of CIBOR; Interest-only loans since 2003.
Finland Lengthening mortgage terms; Introduction of state guarantee for mortgages
France Variable-payment mortgages
Greece Mortgages with one-year low fixed rates, reverting to variable; 30-year mortgages; Euribor trackers.
Iceland Housing Financing Fund increases maximum loan term to 40 years; Main bank offers loan denominated in basket of foreign currencies.
Lithuania Increase in average term from 10 years to 20-25.
Netherlands Savings or equity mortgages: part of payment covers interest, part goes into fixed-interest savings account or equity account (confers tax advantages).
Portugal Loans can now run until borrower is 70 years old.
Slovenia Loans secured on dwellings introduced in 1997; Foreign-owned banks offer Euro-denominated loans.
UK Flexible mortgages; Offset mortgages (savings and mortgage held in same/linked accounts, with savings offset against mortgage balance); Base rate trackers.
Source: See country experts
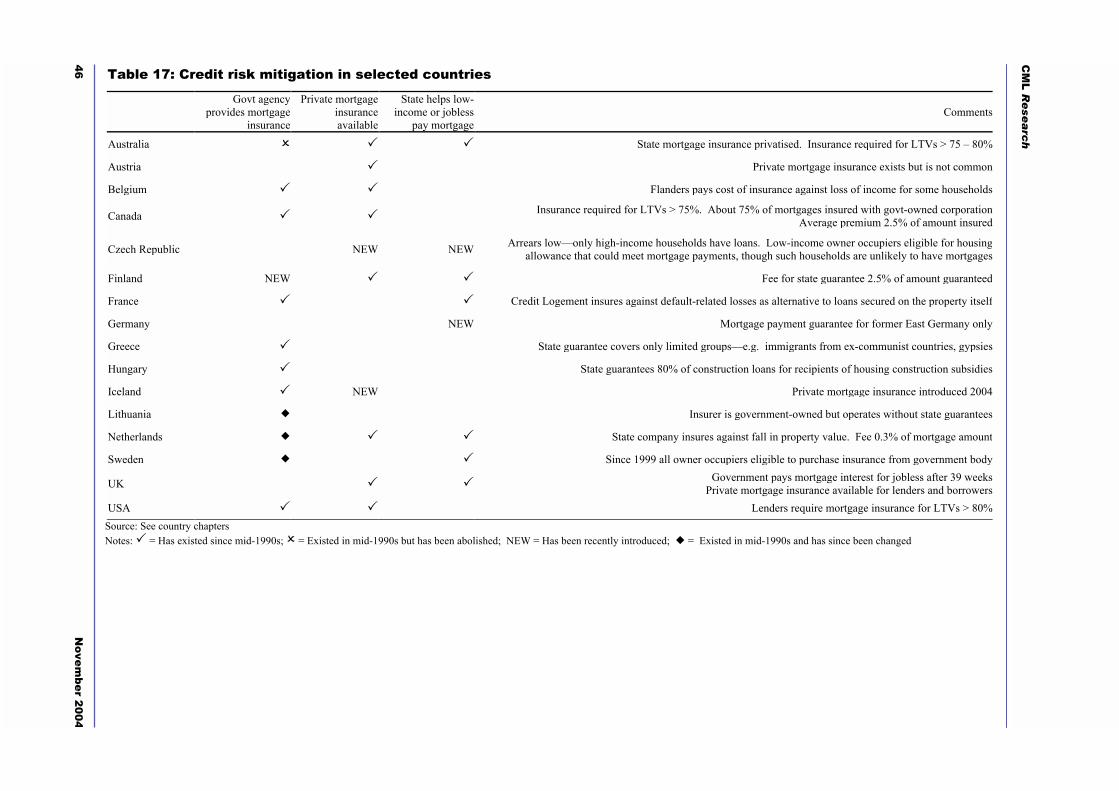
46 N
ovember
2004
CM
L Re
se
arc
h
Table 17: Credit risk mitigation in selected countries
Govt agency
provides mortgage insurance
Private mortgage insurance available
State helps low-income or jobless
pay mortgageComments
Australia # " " State mortgage insurance privatised. Insurance required for LTVs > 75 � 80%
Austria " Private mortgage insurance exists but is not common
Belgium " " Flanders pays cost of insurance against loss of income for some households
Canada " " Insurance required for LTVs > 75%. About 75% of mortgages insured with govt-owned corporation Average premium 2.5% of amount insured
Czech Republic NEW NEW Arrears low�only high-income households have loans. Low-income owner occupiers eligible for housing allowance that could meet mortgage payments, though such households are unlikely to have mortgages
Finland NEW " " Fee for state guarantee 2.5% of amount guaranteed
France " " Credit Logement insures against default-related losses as alternative to loans secured on the property itself
Germany NEW Mortgage payment guarantee for former East Germany only
Greece " State guarantee covers only limited groups�e.g. immigrants from ex-communist countries, gypsies
Hungary " State guarantees 80% of construction loans for recipients of housing construction subsidies
Iceland " NEW Private mortgage insurance introduced 2004
Lithuania ! Insurer is government-owned but operates without state guarantees
Netherlands ! " " State company insures against fall in property value. Fee 0.3% of mortgage amount
Sweden ! " Since 1999 all owner occupiers eligible to purchase insurance from government body
UK " " Government pays mortgage interest for jobless after 39 weeksPrivate mortgage insurance available for lenders and borrowers
USA " " Lenders require mortgage insurance for LTVs > 80% Source: See country chapters Notes: " = Has existed since mid-1990s; # = Existed in mid-1990s but has been abolished; NEW = Has been recently introduced; ! = Existed in mid-1990s and has since been changed
International trends in housing tenure and mortgage finance
November 2004 47
References Ball, M (2003) RICS Review of European Housing Market 2003, RICS, London
Blood, R (1998) A Brief Overview of Mortgage Insurance in Other Countries prepared for US
Agency for International Development, Washington DC:
www.usaid.gov/locations/europe_eurasia/ dem_gov/local_gov/pdf_docs/annexc.pdf
Doling, J. and Ford, J., eds (2003) Globalisation and Home Ownership, Delft University Press,
Delft.
European Central Bank (2003) Structural Factors in the EU Housing Markets, Frankfurt.
European Mortgage Federation (2002) The Cost of Housing Study, Brussels.
European Mortgage Federation Hypostat 1992-2002, Brussels.
Freeman, A., Holmans, A., and Whitehead, C. (1996) Is the UK Different? International
Comparisons of Tenure Patterns Council of Mortgage Lenders, London
Holmans, A., Scanlon, K. and Whitehead, C. (2002) Fiscal Policy Instruments to Promote
Affordable Housing, Research Report VII, Cambridge Centre for Housing and Planning
Research, Cambridge
Mercer Oliver Wyman (2003) Study on the Financial Integration of European Mortgage
Markets, European Mortgage Federation, Brussels.
Miles, D. (2003) The UK Mortgage Market: Taking a Longer-Term View � Interim Report, TSO,
London.
Miles, D. (2004) The UK Mortgage Market: Taking a Longer-Term View � Final Report, TSO,
London.
Whitehead, C. (1996) Trends in the Provision of Housing Finance in Sixteen Countries,
European Mortgage Review, CML, July

CML Research
48 November 2004
Index of Tables and Charts Table 1: Countries included in study ............................................................................................... 8 Table 2: All households by tenure, %........................................................................................... 10 Table 3: Change in owner-occupation in the last decade, all households .................................... 13 Table 4: Change in social renting as a percentage of all renting, all households (all renting =
100%) ............................................................................................................................................. 16 Table 5: Young Entrant & Mid-Life households by tenure, latest year, % ................................... 17 Table 6: Change in tenure of Young Entrant households, last decade, %..................................... 18 Table 7: Average age of first-time buyer, selected countries ........................................................ 18 Table 8: Change in tenure of Mid-Life households, last decade, %............................................. 19 Table 9: Relative household expenditures on housing, latest year (owner-occupation = 100%).22 Table 10: LTVs and Young Entrant owner-occupation................................................................ 29 Table 11: Tax frameworks for owner-occupation ........................................................................ 42 Table 12: Subsidy frameworks for owner-occupation................................................................... 42 Table 13: Tax & subsidy frameworks for renting: Policies affecting mainly private landlord and
tenant .............................................................................................................................................. 43 Table 14: Tax & subsidy frameworks for renting: Policies affecting both social and private
landlords and tenants...................................................................................................................... 43 Table 15: Some features of current mortgage systems .................................................................. 44 Table 16: Recent mortgage product innovations in selected countries ......................................... 45 Table 17: Credit risk mitigation in selected countries ................................................................... 46
Chart 1: Households by tenure....................................................................................................... 12 Chart 2: Relationship between average loan to value ratios and Young Entrant owner-occupation
rates ................................................................................................................................................ 30

International trends in housing tenure and mortgage finance
November 2004 49
Country Chapters Australia 50
Austria 56
Belgium 60
Canada 65
Czech Republic 70
Denmark 73
Finland 78
France 84
Germany 91
Greece 97
Hungary 101
Iceland 104
Lithuania 108
Netherlands 112
Portugal 119
Slovenia 122
Sweden 127
United Kingdom 132
USA 139

CML Research
50 November 2004
Australia
Tenure
Australian households are predominantly home-owners, with around 70% in owner-occupation.
This figure has remained relatively stable since 1960, although different sources do paint slightly
different pictures. For example, the 2001 census puts the tenure at around 66% with a slight fall
since 1986. Of owner-occupiers, 55% currently own their property outright, and 45% have a
mortgage.
While the overall percentage of owner-occupiers has remained relatively stabled for 20 years,
there has been some change in the proportions of our Young Entrant households that own their
own homes, see summary in Table 1. While in 1994 50% of Young Entrant households were
home-owners, by 1999 this had fallen slightly to 47%. Census data also supports this indicating
that the fall in home-ownership rates of those aged 25-34, may be up to 10% over the last 20
years. The proportion of owner-occupiers amongst Young Entrant households remains
considerably lower than in the population at large (47% vs. 70%). The proportion of households
in social renting has remained the same, at five per cent, but private renting is twice as prevalent
among younger people as in the overall population (41% vs. 20%).
Table 1: Households by tenure, %
All households Young Entrants Mid-Life
1994 1999 1994 1999 1994 1999
Owner-occupation 70 70 50* 47 81** 80
Social renting 6 5 3 5 1 4
Private renting 19 20 43 41 16 13
Shared ownership/equity 1 0 0
Other (rent-free, life tenure, not stated, rent-to-buy, n.e.c.)
55
47
23
Sources: All households from Australian Housing Survey 1994 and 1999; Young Entrant Mid-Life households from ABS Household Expenditure Survey unit record files (1994) and unpublished data from Australian Housing Survey 1999 confidentialised unit record file Notes: *45% for all 25-29 year olds; 55% for all 30-34 year olds; **81% for all 45-64 year olds, but incidence does not change much after 45. In 1994: couples without children, where the main respondent is 25 to 34. 1999: all 25- to 34-year-olds. In 1994: couples with children, where the main respondent is 45 to 64; 1999: all 45- to 54-year-olds
In the last decade the aggregate home-ownership rate in Australia has remained relatively stable.
This is turn is due to the offsetting effect of an increase in the number of outright owners due to
the ageing of the population, and a fall in the number of households purchasing with a mortgage.
International trends in housing tenure and mortgage finance
November 2004 51
The decline in mortgaged households is attributed to decreasing affordability and an increasing
polarisation of incomes, partly because of the rising number of single-adult households.
Our Young Entrant household is defined as a two-adult household without children, with the
main respondent aged around 25 years and of average household income for that age group. In
Australia, however, the typical first-time buyer in this age group was just as likely to have
children as not (43% of all 25- to 34-year-old first-time buyers in 1999 had children, compared
with 36% of the age group generally). The average age of the Australian first-time buyer has
increased very slightly over time and is now around 32-33 years.
In the past five years there has been an increasing proportion of younger households remaining in
the private rental sector. This was temporarily halted by the introduction of a generous First
Home Owners Grant of $A7,000 in 2000 (see below for details). The grant was expected to
bring forward house purchases that would otherwise have occurred somewhat later, but will not
otherwise affect the tenure split amongst young households.
Turning to older households, Mid-Life households are defined as two-adult households with
children, with the main respondent aged around 45 years, and of average household income for
that age group. The percentage of such households in owner-occupation has remained relatively
stable at 80%. Of those who are not owner-occupiers, most are private rather than social tenants.
Housing costs
Tables 2 and 3 show the actual and relative expenditures on housing for Young Entrant and Mid-
Life households. For Young Entrant households, owner-occupation was the most costly tenure in
1999, as it was in 1994. Young Entrant households renting privately paid 69% of the amount
paid by owner-occupiers, while social tenants paid 30%.
For Mid-Life households the picture is slightly different. In 1994 owner-occupation was the
most expensive tenure for these households as well, though the difference between owner-
occupation and renting was smaller than for Young Entrant households. By 1999, however,
private renting had become 32% more expensive than owner-occupation. This perhaps reflects
the fact that these households generally purchased their dwellings before the recent sustained
period of house-price inflation, and their mortgage payments reflect purchase prices that are low
by current standards. It also reflects an increased proportion of households who own their
dwellings outright and so have no mortgage payments.
The average income of the Young Entrant household in Australia was $A1,042 per week in 1999.

CML Research
52 November 2004
Some 48% of all 25- to 34 year-olds lived in a dual-income household (including 80% of couples
and 55% of couples with children). Average incomes for Mid-Life households were higher, at
$A1,600 p.w. For both household types, about half had two incomes.
Table 2: Actual expenditures on housing, $A/month
Young Entrant Mid-Life
1994 1999 1994 1999
Owner-occupier 975 1,092 805 572
Social tenant 329 325 624 325
Private tenant 619 758 754 754Sources: Landt, J (1994); unpublished data from Australian Housing Survey 1999 confidentialised unit record file. Table 3: Relative expenditures on housing (owner-occupation = 100%)
Young Entrant Mid-Life
1994 1999 1994 1999
Social tenant 34 30 78 57
Private tenant 64 69 94 132Source: Authors' calculations Table 4 shows that, as expected, Mid-Life households tend to occupy more expensive houses
than Young Entrant households. Their mortgage payments, however, are lower than those of
Young Entrant households, because most Mid-Life households are paying a mortgage on a house
bought some years ago, when house prices were lower, and because many have paid off a high
proportion of their mortgage.
Table 4: Housing costs for owner-occupiers in 1999, $A
Young Entrant Mid-Life
Average house price 185,000 243,000Average down payment on a mortgage 22,000 N/A: Average equity 196,000
Average mortgage payment 242/week 228/week (for those with mortgage)Source: Experts' estimates
Mortgage system
The typical mortgage is a 25-year repayment mortgage with a variable rate, but lately there has
been increasing use of flexible mortgages with variable repayments. New purchasers generally
take out a mortgage covering about 90% or, more recently, 100% of the price of the house.
Lenders require purchasers to take out mortgage insurance for loans with high loan-to-value
ratios. There are no regulatory constraints on LTVs, and 100% mortgages are becoming more

International trends in housing tenure and mortgage finance
November 2004 53
popular. Lenders have traditionally calculated affordability on the basis of repayment
constraints, allowing for mortgage payments of 30% of income and take both incomes into
account for dual-income households.
There has been a growth in non-conforming lenders in the Australian market since 1997. These
are mortgage originators that specialise in lending to borrowers who do not meet banks normal
lending criteria�who, for example, have a bad credit history or are seeking a loan with a very
high loan-to-value ratio. Non-conforming loans accounted for between two and four per cent of
loans written as of the end of 2002 (Reserve Bank of Australia, 2002a).
New loan products have included home equity loans and deposit bonds (where in exchange for a
fee an insurance company guarantees that the deposit will be paid at settlement, so the purchaser
does not have to pay a deposit when contracts are exchanged).
In general, interest rates have fallen from about 10-12% ten years ago to six to seven per cent
now. The benefit of declining interest rates has been largely offset by increases in mortgage debt
due to equity withdrawal and trading up for older households, and higher house prices and the
resulting higher debt for younger households. Some experts are concerned that commercial
lending institutions are not imposing strict enough credit criteria, and are failing to allow for
problems if interest rates increase or house prices turn down. Similarly, the Governor of the
Reserve Bank has expressed concern that household borrowers have not realised that in a lower-
inflation environment, high repayment burdens will not be reduced by inflation.
Taxes and subsidies
Since 1995 there have been some changes in the Australian system of taxes and subsidies that,
taken together, have tended to increase the incentives in favour of owner-occupation.
Owner-occupation
Housing is treated as a consumption good for tax purposes in Australia, with no tax on imputed
rental income or capital gains for owner-occupiers. This makes housing a more attractive
investment than some other sectors of the economy. However, owner-occupiers get no tax relief
on mortgage costs and receive no government subsidies apart from the First Home Owners Grant
(see below). Some lenders do offer one to two per cent discounts on mortgage rates to first-time
buyers for the first 6-12 months of their mortgage. Young Entrant households with incomes
below a certain floor will receive mortgage assistance for 12-24 months if their household
income falls, but this assistance is not available to Mid-Life households. There is no housing
allowance for owner-occupiers.

CML Research
54 November 2004
A First Home Owner's Grant was introduced in July 2000, ostensibly to offset a predicted
increase in the cost of housing as a result of the introduction of a goods and services tax. The
grant, initially set at $A7,000, was available to any first-time buyer. It was increased to
$A14,000 in March 2001, reduced to $10,000 in January 2002, and again brought down to
$A7,000 from July 2002. The impact has apparently been to bring forward purchases by
households who would probably have become home-owners eventually anyway. In addition, the
increase in activity is likely to have had an impact on fuelling a rising housing market since 2000.
Private renting
Private rental sector landlords receive tax relief for nominal interest costs, which are fully
deductible from taxable income, and a 2.5% depreciation allowance on new property. Until
1999, real realised capital gains on properties bought after 1985 were taxed. Private rental
housing was treated like any other investment, which put it at a disadvantage compared to owner-
occupation, where capital gains were not taxed. The capital gains tax regime changed in 1999
from taxation of real, realised gains to taxation of nominal realised gains with a 50% discount for
individuals. This change has encouraged investors to borrow to invest in residential property.
The principal place of residence had been, and still is, exempt.
Many private-sector tenants receive no housing allowances or income support. Rent assistance in
the private rental sector is available only for social security recipients, who generally have
incomes in the lower quartile of the income scale and form a minority of private rental tenants.
Public sector rental
Public-sector landlords � that, is, the state housing authorities � do not have to pay any tax. They
receive capital grants from government to build housing although in most cases these grants are
insufficient to meet maintenance costs for the existing public rental stock. Social-sector tenants
receive housing allowances, which allow for expenditure of 20-25% of household gross income
on rent.
In 2000 a 10% tax on goods and services was introduced. Housing is exempt � that is, home-
owners and renters do not pay tax on their housing expenditure, but they cannot deduct any sales-
tax component of costs they incur.
Problems accessing housing
Over the past five years, Australia's economy has been robust and unemployment has declined.
Nominal house prices have gone up at a rate of over nine per cent per annum nationally in the
five years to 2002, Reserve Bank of Australia (2002b). At the same time, interest rates have
fallen, so those able to access finance have reduced problems making mortgage repayments. In

International trends in housing tenure and mortgage finance
November 2004 55
general, however, affordability of median priced dwellings has worsened. Moderate-income
households in high-cost areas in particular are having problems entering home-ownership. There
are no specific schemes to assist households in high-cost areas.
Risk reduction
There are limited state-based temporary mortgage assistance schemes for lower-income
households in trouble with mortgage repayments.
Private mortgage insurance is available and is a relatively well-developed market. The
government-sponsored mortgage insurer dominated the market until 1997, when it was sold to
the US-based GE Capital Corporation (which also owns the major Canadian private insurer �
now Genworth). Premiums increase with the LTV.
References
Information provided by J. Yates
Blood, R (1998) A Brief Overview of Mortgage Insurance in Other Countries prepared for US
Agency for International Development, Washington DC: www.usaid.gov/locations/europe_
eurasia/ dem_gov/local_gov/pdf_docs/annexc.pdf
Freeman, A, Holmans, A, and Whitehead, CME (1996) Is the UK Different? International
Comparisons of Tenure Patterns Council of Mortgage Lenders, London
Landt, J (1994) Modelling Housing costs and benefits, STINMOD Technical Paper No. 6,
National Centre for Social and Economic Modelling, Cranberra
Reserve Bank of Australia (2002a) Innovations in the Provision of Finance for Investor Housing,
Reserve Bank of Australia Bulletin, December 2002a
Reserve Bank of Australia (2002b) Recent Developments in Housing: Prices, Finance and
Investor Attitudes, Reserve Bank of Australia Bulletin, July 2002b
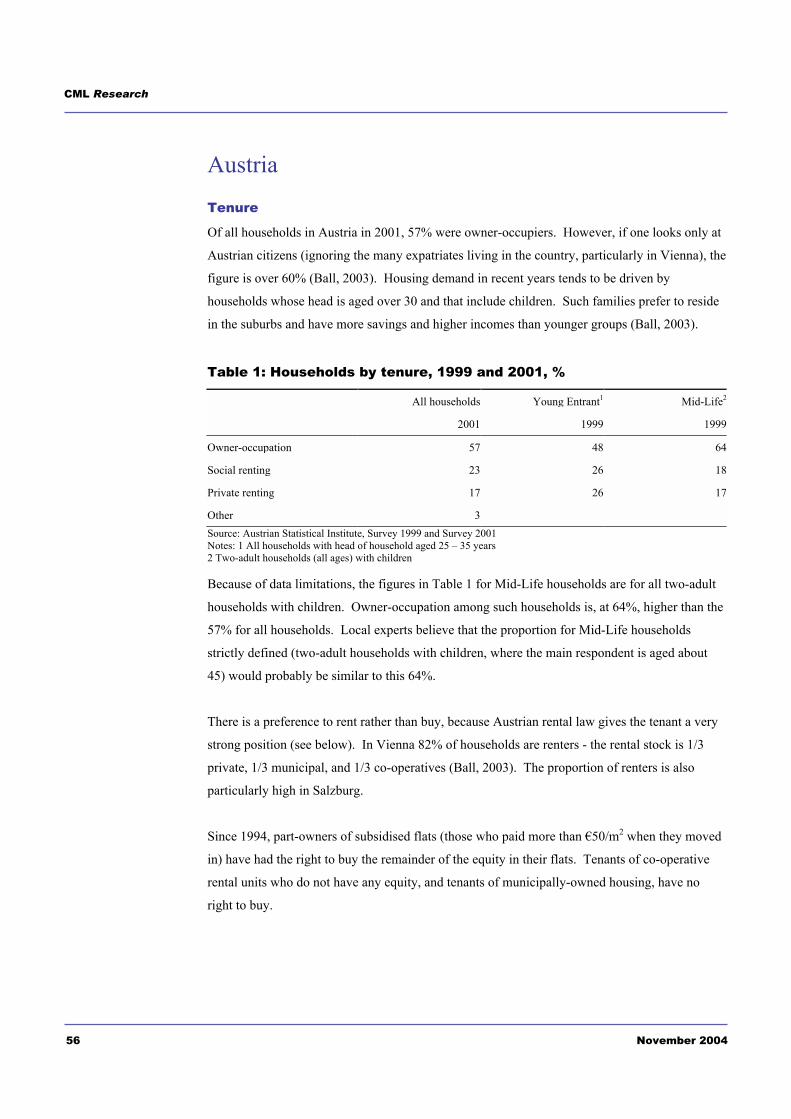
CML Research
56 November 2004
Austria
Tenure
Of all households in Austria in 2001, 57% were owner-occupiers. However, if one looks only at
Austrian citizens (ignoring the many expatriates living in the country, particularly in Vienna), the
figure is over 60% (Ball, 2003). Housing demand in recent years tends to be driven by
households whose head is aged over 30 and that include children. Such families prefer to reside
in the suburbs and have more savings and higher incomes than younger groups (Ball, 2003).
Table 1: Households by tenure, 1999 and 2001, %
All households Young Entrant1 Mid-Life2
2001 1999 1999
Owner-occupation 57 48 64
Social renting 23 26 18
Private renting 17 26 17
Other 3Source: Austrian Statistical Institute, Survey 1999 and Survey 2001 Notes: 1 All households with head of household aged 25 � 35 years 2 Two-adult households (all ages) with children Because of data limitations, the figures in Table 1 for Mid-Life households are for all two-adult
households with children. Owner-occupation among such households is, at 64%, higher than the
57% for all households. Local experts believe that the proportion for Mid-Life households
strictly defined (two-adult households with children, where the main respondent is aged about
45) would probably be similar to this 64%.
There is a preference to rent rather than buy, because Austrian rental law gives the tenant a very
strong position (see below). In Vienna 82% of households are renters - the rental stock is 1/3
private, 1/3 municipal, and 1/3 co-operatives (Ball, 2003). The proportion of renters is also
particularly high in Salzburg.
Since 1994, part-owners of subsidised flats (those who paid more than �50/m2 when they moved
in) have had the right to buy the remainder of the equity in their flats. Tenants of co-operative
rental units who do not have any equity, and tenants of municipally-owned housing, have no
right to buy.

International trends in housing tenure and mortgage finance
November 2004 57
Housing costs
Approximately 80% of young entrant households in Austria have two incomes. For two-adult
households with children, the percentage with two incomes is lower, at around 65%. The mean
income for both household types is �2,300/month, including social transfers (eg, for children).
Young Entrant tenants, both private and social, pay less for housing than Young Entrant owner-
occupiers. Whilst, Mid-Life private tenants pay more than owner-occupiers, while social tenants
pay less (though still more than Young Entrant tenants of either tenure).
Table 2: Actual expenditures on housing, �/month, 1999
Young Entrant Mid-Life
Owner-occupier 360 400
Social tenant 320 373
Private tenant 340 420Source: Austrian Statistical Institute, Survey 1999 Table 3: Relative expenditures on housing (owner-occupation = 100%)
Young Entrant Mid-Life
Social tenant 89 93
Private tenant 94 105Source: Authors' estimates Average house prices rose one per cent in 2002 after a fall of three per cent in 2001, which was a
consequence of overbuilding in the late 1990s. House-price data in Table 4 are from 2002;
current figures are about �200/m2 higher in each category.
Table4: Average house prices, 2002
All household types
Houses (to purchase existing or build new) �1400/m2
Old flats �1400/m2
New flats �2300/m2
Source: Austria Immobilienindex
Mortgage system
The current average gross interest rate on mortgages is four to five per cent; interest on loans
from building and loan associations is limited to six per cent (ECB, 2003). Of mortgages on
newly built homes, 55% are from commercial banks, 15% from Bausparkassen (housing-specific
CML Research
58 November 2004
savings institutions), and 30% are low-interest loans issued by government bodies. The typical
mortgage term is 25 years, but the low-interest loans often have terms of 30 years or more.
The average loan-to-value ratio for new loans is 60%. Interest rates are generally either fixed or
graduated, with lower rates for the first few years. Loans denominated in non-Euro currencies,
particularly the Swiss franc and the Japanese yen, have been popular. International interest rates
are charged, and the exchange-rate risk is borne by the borrower.
Taxes and subsidies
Owners-occupiers
For owner-occupiers, there is income-tax relief on mortgage interest, though at a very low level,
and owner-occupiers with incomes of over �50,000 are ineligible. There is no tax on imputed
rental income. Owner-occupiers who sell their dwellings after a two-year period of ownership
are not subject to capital gains tax; investors and second-home owners must hold their properties
for ten years in order to sell them free of capital-gains tax.
Until 1989 the federal government dispensed housing subsidies. After that, responsibility passed
to local governments, who each have their own programmes and systems. In general, Austrian
housing subsidy is targeted at new housing rather than housing in general. The government
subsidises savings for the purpose of purchasing a dwelling through the Bausparkassen system.
In all provinces these savings may be used for purchasing new homes; in some provinces they
can also be used to buy existing dwellings.
There are schemes in some provinces to subsidise mortgage-interest rates. These are normally
targeted at families (particularly young and single-parent families) from lower- and middle-
income groups. Income-related housing allowances for owner-occupiers are given in a growing
number of provinces. Purchase subsidies and improvement grants for owners are also available
in some areas.
Rental sector
In the rental market, state subsidies are available for landlords in some cases, as are subsidies for
construction of rental property. The eligibility rules for these subsidies vary by province. Until
the 1990s some provinces gave grants, but now all such subsidies are in the form of loans,
interest-rate subsidies and personal allowances to reduce loan payments. Tenants can qualify for
an income-related housing allowance, as in most countries; in addition, the minimum income
safety net could be expected to meet housing costs.

International trends in housing tenure and mortgage finance
November 2004 59
Austrian law governing rentals is rather complicated. New contracts for rents on pre-1945 stock
are regulated by a system of benchmarks, in an attempt to combine market forces with price
controls. Rents on some newer housing stock are subject to comparative-rent regulations, some
to regulations connected with public loans, and some are not regulated. It is almost impossible
for a landlord to break a lease.
Risk reduction
Private mortgage insurance exists but is not common. Since 1997 the Property Developer
Contract Act has applied, which requires developers to provide guarantees that if they go
bankrupt before a development is finished, purchasers will get their money back or another firm
will complete construction.
References
Information provided by W. Amann and S. Bauernfeind
Ball, Michael (2003) RICS European Housing Review 2003 RICS, London
European Central Bank (2003) Structural factors in the EU housing markets, ECB, Frankfurt
EMF (2003) Hypostat 1992-2002, European Mortgage Federation, Brussels

CML Research
60 November 2004
Belgium
Tenure
Belgium has a relatively high overall level of owner-occupation, at 74%. In this section we use
data from the 1999 Panel Study on Belgian Households, which permits comparisons of different
household types. According to more recent data, from the 2001 census, the overall owner-
occupation rate is somewhat lower: 68% owner-occupiers, 6% social renting, and the remainder
private renting.
The rental market is heavily weighted towards the private sector, housing 16% of all households,
while the social rented sector houses only 7%. In nearly all countries studied, levels of owner-
occupation are higher among middle-aged Mid-Life households than Young Entrant households,
but in Belgium this difference is particularly striking. Only 33% of Young Entrant households
were owner-occupiers in 1999. Fully 89% of Mid-Life households owned their own homes. The
private sector housed the overwhelming majority of both types of household, with social renting
accounting for fewer than 2% of Young Entrant or Mid-Life households.
Table 1: Households by tenure, 1999, %
All households Young Entrant Mid-Life
Owner-occupation 74 33 89
Social renting 7 1 2
Private renting 16 64 7
Shared ownership/equity N/A
Other (free in exchange for service) 3
Source: Panel Study on Belgian Households, 1999 (wave 8), subsequent calculations Notes: Young Entrants: Couples without children, head of household aged 20 to 29 years. Mid-Life: Couples with children, head of household aged 40 to 49 years
Of owner-occupiers, 56% are buying with a mortgage, while 44% are outright owners (some
having already paid off their mortgage).
Housing costs
The discussion of house prices is limited to the Flanders region due to lack of additional
information. House prices in Flanders have increased significantly in the last 20 years. "Survey
data show that the average monthly mortgage repayment in Flanders was 73% higher in 1997
than in 1976 in real terms" (De Decker and Geurts, 2003). During this period real disposable
incomes grew by 5.9%. House prices have increased since 1997 at a rate of approximately 10%

International trends in housing tenure and mortgage finance
November 2004 61
per annum (Hypostat, 2002). Home-ownership also became more polarised, increasing among
couples with higher incomes and higher education, and falling among unskilled workers and
those with only primary education.
In 1999, Young Entrant households had a median monthly net household income of �1400.
Young Entrant owner-occupiers spent on average �470/month on housing, excluding utilities, or
34% of average Young Entrant income. Some 90% of Young Entrant households were dual-
income.
Mid-Life owner-occupiers spent, on average, 21% less than younger owner-occupiers (�372 vs
�471), reflecting the fact that they purchased their properties earlier. Older private renters,
however, spent more than younger ones (�410 vs �347), and more than older owner-occupiers.
Table 2: Median actual expenditures on housing, � / month, 1999
Young Entrant Mid-Life
Owner-occupier 471 372
Social tenant N/A (only one observation) 328
Private tenant 347 410Source: Panel Study on Belgian Households (wave 8), subsequent calculations Note: Figures exclude utilities Table 3: Relative expenditures on housing (owner-occupation = 100%)
Young Entrant Mid-Life
Social tenant N/A 88
Private tenant 74 114Source: Authors' calculations
Because of high sales taxes and duties, transactions costs for owner-occupiers are very high,
averaging over 20% of the cost of a medium-sized dwelling (Ball, 2003). Recent political
initiatives have aimed to lower transactions costs in order to speed up mobility, but the changes
are, in financial terms, marginal.
Mortgage system
Private universal banks provide about 95% of mortgages. They are most often structured as 20-
year loans, where the interest rate is fixed for the first ten years but can thereafter be revised
every five. In 1999 such fixed-rate mortgages accounted for over 80% of the market, although
this percentage has since fallen to around 50%. Capped-rate mortgages are also common. The
number of new mortgages more than tripled between 1990 and 1999; many were remortgages

CML Research
62 November 2004
taken out to withdraw equity or to take advantage of falling interest rates.
Under the affordability test normally applied by Belgian banks, borrowers may devote no more
than 33% of their income to housing costs. Loan-to-value ratios are not typically used; there are
regulations limiting the loan to 80-90% of the assessed value of the dwelling, but it is relatively
easy for the borrower to get more by adding a personal loan to the mortgage, thus borrowing over
100% of assessed value.
Historically most mortgages in Belgium have been used to finance house construction rather than
purchase of an existing dwelling, but this changed in the mid 1980s. In 2000 banks lent roughly
three times as much for purchase as for new construction (De Decker and Geurts, 2003).
Taxes and subsidies
Belgium is a federal state and according to its constitution, housing is a matter for the regions:
Flanders (prosperous), the Brussels capital region, and Wallonia (less prosperous). Most
households in Belgium are eligible for some sort of housing subsidy, but these subsidies are
generally rather small amounts, probably too small to affect tenure choices.
Federal level measures
At the federal level, mortgage payments are tax deductible. Interest payments are deductible in
two categories: the basic tax deduction is limited to the imputed rental income on the house,
while the additional tax deduction, for principal homes with a mortgage of at least ten years,
allows taxpayers to deduct all mortgage interest from household income up to a maximum of
80%. The deduction is taken at the taxpayer's marginal rate. This maximum decreases gradually
after year six, and the additional tax deduction ends after ten years. Certain ceilings apply,
depending on whether the loan is for construction of a new home or for purchase of an existing
dwelling.
In addition, capital payments on principal homes are in some cases tax deductible. For
mortgages of at least ten years with special insurance entered into after 1989 (or before 1989 if
the house is a social or mid-sized dwelling), some capital payments are deductible. Like the
interest-payment deductions, there are two types of capital deductions, basic and additional.
Mortgage insurance premiums are also deductible.
Regional level measures
For owner-occupiers in Flanders, there were subsidies for individual households who built new
houses, and grants for those purchasing existing dwellings; four times as many construction
grants were given as existing-dwelling grants. These grants were replaced by interest subsidies

International trends in housing tenure and mortgage finance
November 2004 63
in 1993, which themselves were gradually abolished over the 1990s, as the region's housing
budget was directed more towards the construction and renovation of social rented housing.
There are still social loans for owner-occupation (with subsidised interest rates) provided by the
Flemish Housing Association or the Flemish Housing Fund for Large Families. These
institutions receive interest subsidies from the Flemish government. The interest rates they
charge are means-tested and correspond to the number of children in a family. In principle the
loans are for low-income households, but in practice the target group has never been large, so
upper and middle-income households can also access the loans. There are household income
limits, which have changed frequently.
For renters in the private sector, the Flemish government has a rent allowance scheme. Low-
income tenants who move from a low-quality dwelling to a better one are eligible for a subsidy.
The subsidy lasts for 15 years, but is re-assessed every three. The amounts involved are very
small.
Wallonia and Brussels offer a number of small subsidies for owner-occupiers (for repair as well
as purchase), as well as social loans for big households. There are no rent allowances in these
regions of Belgium.
Problems accessing housing
The steady increase in the price of owner-occupied housing and the relative costliness of the
private rental sector mean that many one-income households face affordability problems. Social
renting is often inaccessible as well; the sector is small in Belgium, and waiting lists are long �
families, in particular, must often wait for years.
Risk reduction
Mortgage arrears fell from 25,966 new cases in 1994/95 to 16,146 in 1999/2000, and then rose to
20,154 in 2000/01 (De Decker and Geurts, 2003). De Decker and Geurts go on to estimate that
about six per cent of households with mortgages are in arrears; Hypostat says "the total amounts
unpaid on contracts on which the arrears had not been settled came to less than one per cent of
total outstanding mortgage credit in mid-2002."
Most Belgian lenders require borrowers to take out life insurance. Until recently such insurance
was also a requirement for tax-deductibility of mortgage interest, but given that insurers were
increasingly refusing to insure people with certain medical conditions, this government abolished
this condition in 2001.
CML Research
64 November 2004
Since the late 1990s, anyone making use of subsidies for house purchase has also received
government mortgage insurance, which insures the lender against non-payment of the mortgage.
In addition, the Flemish government in 1998 introduced an insurance scheme for those with non-
subsidised mortgages. De Decker and Geurts give details:
In June 1998, the Flemish government introduced an insurance against income loss in order to
minimise the financial risks of purchase, new construction, or renovation. When concluding a
mortgage, a household can get a free assurance from the Flemish government. From the
moment a mortgage is concluded, the assurance lasts for 10 years. If during that period a
household becomes unemployed or unemployable involuntarily, it can get, after a waiting
period of six months, a monthly contribution to the repayment of the mortgage, for a maximum
of three years. This contribution does not cover the whole sum. The household still needs to
pay �247,89. The contribution is directly paid by the managing authority, which is a large
public assurance company that won the contract, to the lender. This sum can be a maximum of
�495,78 per month. Normally, it will be smaller since it depends on the household income and
the size of the mortgage. During the second year, the benefiting households get 80% of the
awarded sum. In year three, this decreases further to 60%. The Flemish government pays the
cost of the assurance.
Certain income and dwelling-size limits apply, and applicants need to be in work. Only
mortgages over �50,000 are eligible; the average mortgage covered is �87,495. It should also be
noted that unemployment benefit is generous in Belgium, and could often be expected to cover
mortgage payments.
References
Information provided by P. De Decker
Ball, Michael (2003) RICS European Housing Review 2003 RICS, London
De Decker, Pascal (2000) Who Benefits from Public Money for Housing in Flanders (Belgium)?
Paper for ENHR conference
De Decker, P. and Guerts, V. (2003) 'Belgium', in Globalisation and Home-ownership (Doling, J.
and Ford, J., eds); Delft University Press, Delft.
EMF (2003) Hypostat 1992-2002, European Mortgage Federation, Brussels
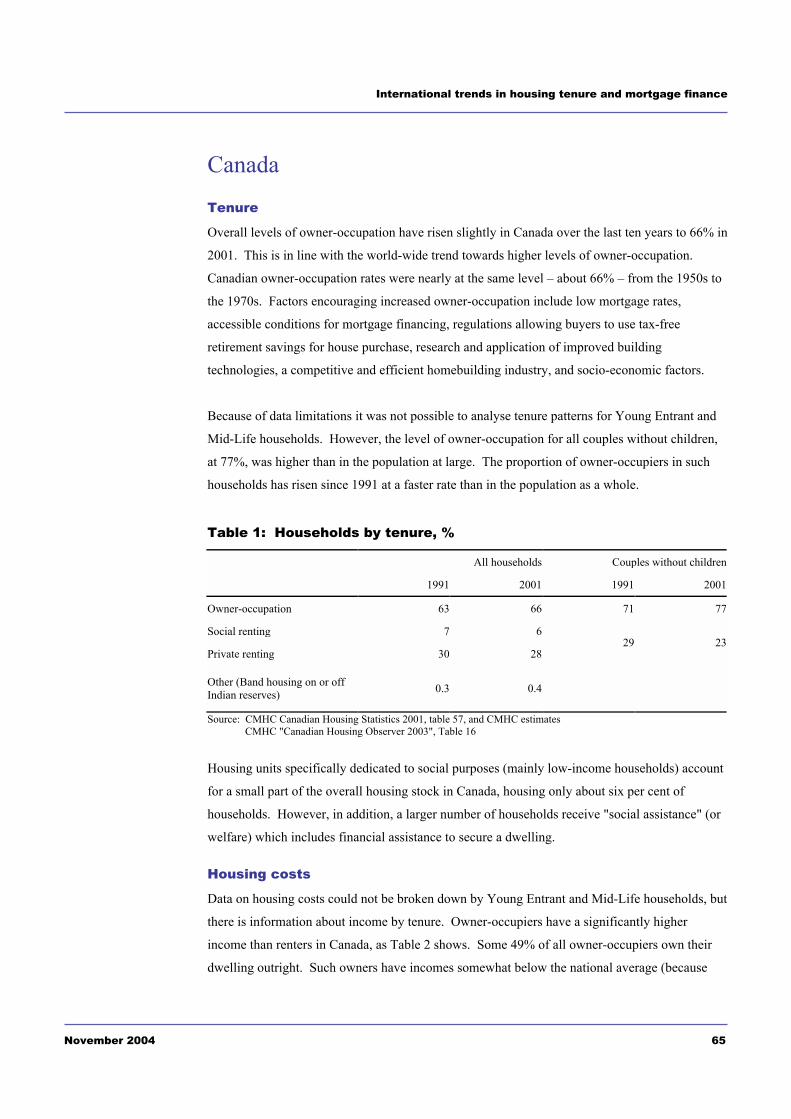
International trends in housing tenure and mortgage finance
November 2004 65
Canada
Tenure
Overall levels of owner-occupation have risen slightly in Canada over the last ten years to 66% in
2001. This is in line with the world-wide trend towards higher levels of owner-occupation.
Canadian owner-occupation rates were nearly at the same level � about 66% � from the 1950s to
the 1970s. Factors encouraging increased owner-occupation include low mortgage rates,
accessible conditions for mortgage financing, regulations allowing buyers to use tax-free
retirement savings for house purchase, research and application of improved building
technologies, a competitive and efficient homebuilding industry, and socio-economic factors.
Because of data limitations it was not possible to analyse tenure patterns for Young Entrant and
Mid-Life households. However, the level of owner-occupation for all couples without children,
at 77%, was higher than in the population at large. The proportion of owner-occupiers in such
households has risen since 1991 at a faster rate than in the population as a whole.
Table 1: Households by tenure, %
All households Couples without children
1991 2001 1991 2001
Owner-occupation 63 66 71 77
Social renting 7 6
Private renting 30 2829 23
Other (Band housing on or off Indian reserves) 0.3 0.4
Source: CMHC Canadian Housing Statistics 2001, table 57, and CMHC estimates CMHC "Canadian Housing Observer 2003", Table 16
Housing units specifically dedicated to social purposes (mainly low-income households) account
for a small part of the overall housing stock in Canada, housing only about six per cent of
households. However, in addition, a larger number of households receive "social assistance" (or
welfare) which includes financial assistance to secure a dwelling.
Housing costs
Data on housing costs could not be broken down by Young Entrant and Mid-Life households, but
there is information about income by tenure. Owner-occupiers have a significantly higher
income than renters in Canada, as Table 2 shows. Some 49% of all owner-occupiers own their
dwelling outright. Such owners have incomes somewhat below the national average (because
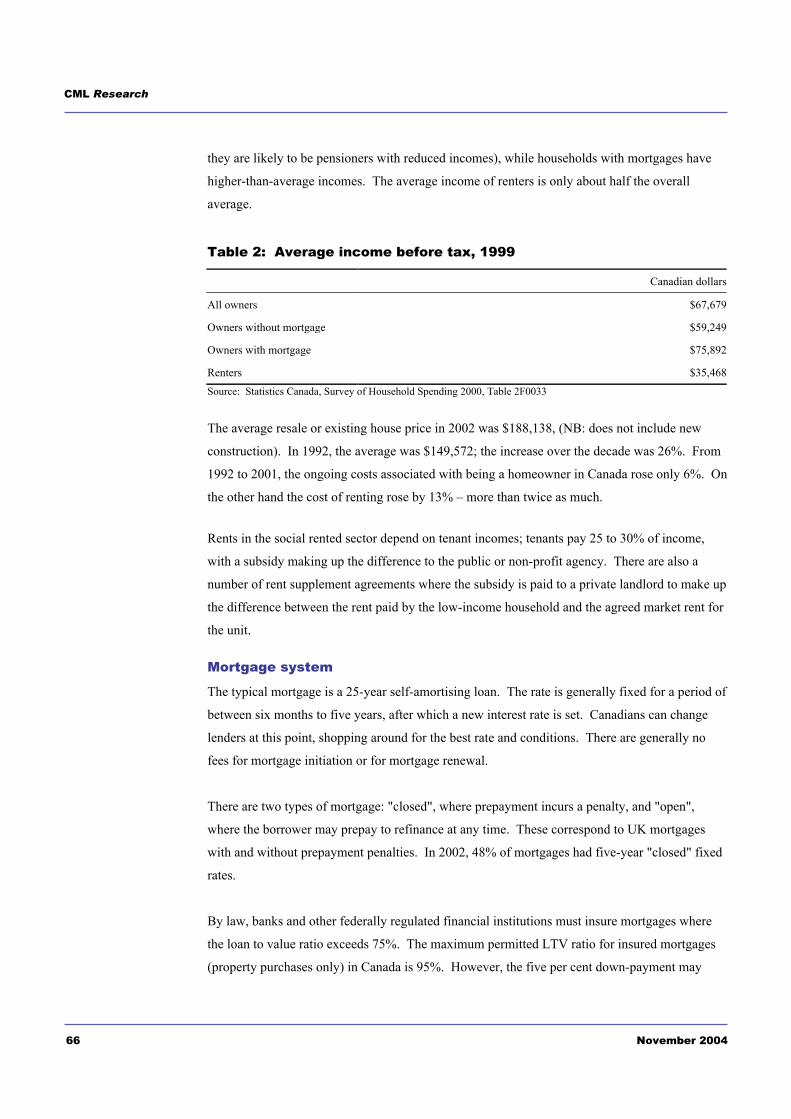
CML Research
66 November 2004
they are likely to be pensioners with reduced incomes), while households with mortgages have
higher-than-average incomes. The average income of renters is only about half the overall
average.
Table 2: Average income before tax, 1999
Canadian dollars
All owners $67,679
Owners without mortgage $59,249
Owners with mortgage $75,892
Renters $35,468Source: Statistics Canada, Survey of Household Spending 2000, Table 2F0033
The average resale or existing house price in 2002 was $188,138, (NB: does not include new
construction). In 1992, the average was $149,572; the increase over the decade was 26%. From
1992 to 2001, the ongoing costs associated with being a homeowner in Canada rose only 6%. On
the other hand the cost of renting rose by 13% � more than twice as much.
Rents in the social rented sector depend on tenant incomes; tenants pay 25 to 30% of income,
with a subsidy making up the difference to the public or non-profit agency. There are also a
number of rent supplement agreements where the subsidy is paid to a private landlord to make up
the difference between the rent paid by the low-income household and the agreed market rent for
the unit.
Mortgage system
The typical mortgage is a 25-year self-amortising loan. The rate is generally fixed for a period of
between six months to five years, after which a new interest rate is set. Canadians can change
lenders at this point, shopping around for the best rate and conditions. There are generally no
fees for mortgage initiation or for mortgage renewal.
There are two types of mortgage: "closed", where prepayment incurs a penalty, and "open",
where the borrower may prepay to refinance at any time. These correspond to UK mortgages
with and without prepayment penalties. In 2002, 48% of mortgages had five-year "closed" fixed
rates.
By law, banks and other federally regulated financial institutions must insure mortgages where
the loan to value ratio exceeds 75%. The maximum permitted LTV ratio for insured mortgages
(property purchases only) in Canada is 95%. However, the five per cent down-payment may
International trends in housing tenure and mortgage finance
November 2004 67
consist of borrowed funds, gifts or cash incentives from the lender. There are no good statistics
on average LTV of new loans, but one survey of 946 mortgage holders put the mortgage/value
ratio at 47%. However, a majority of those surveyed had owned their home and paid down their
mortgage for some time.
Taxes and subsidies
In Canada, housing is treated as a consumption good with no taxation of imputed rental income
nor capital gains, and no mortgage tax relief. This could theoretically favour both housing
investment and financing through equity rather than debt. However, OECD statistics show that
Canada's Mortgage Financing to GDP ratio (41%) is similar to the 44% ratio found in the USA
where housing is treated as an investment. There is no tax relief on mortgage payments, but
owner-occupiers are exempt from capital gains tax on the sale of dwellings.
Measures targeting owner-occupiers
The only form of federal assistance for home-buyers is a fiscal arrangement, the Home Buyers'
Plan, introduced by the federal government in 1992. It allows Canadians who meet certain
eligibility conditions (essentially first-time homebuyers) to withdraw up to $20,000 tax-free from
their Registered Retirement Saving Plans (RRSPs) for house purchase. (Under the RRSP
scheme, each year an individual may set aside a certain amount for retirement; the amount saved
is deducted from income for tax purposes. At retirement age, any RRSP contributions withdrawn
from a RRSP are taxed at the contributor's current marginal rate.) The money withdrawn for
house purchase remains tax exempt if it is repaid within 15 years. In 1999 the programme was
changed to widen accessibility to disabled people or their carers.
About 144,000 people made use of this regulation in 2002, withdrawing more than $1.5 billion in
RRSP funds to purchase homes. Since its inception in 1992, some 1.2 million people have
participated in the programme, channelling $12.0 billion to the housing market.
Rental sector measures
Landlords are taxed on their income from rental property, and can offset depreciation against this
(but not against other income). Some tenants are eligible for income-related housing allowances.
The federal government stopped funding new social housing supply in the early 1990s but
continues providing CAD$1.9 billion per year assistance to units supplied in prior years and
continues to subsidise the production of new additional housing units on Indian Reserves (First
Nations Communities). Some provinces continue to fund new social housing supply.
CML Research
68 November 2004
Since 2001, under the Affordable Housing Program, the Government of Canada also provides
financial assistance for the supply of new affordable rental housing. By the end of 2007-2008,
the Federal Government's investment in this program will total CAD$1 billion, an amount that
will be matched by provincial and territorial governments.
Other subsidies
Assistance for home repairs (Residential Rehabilitation Assistance Program � RRAP) is also
provided to qualifying households. CMHC's recently enhanced renovation programs, which help
low-income Canadians, have been extended by $384 million over three years.
Canada has no national housing allowances. Some provinces have housing allowance
programmes targeting older low-income tenants. Others have 'rent supplement' programmes
where private rental units are leased to tenants from the public-housing waiting list; the rent
supplement covers the difference between the market rent and what the tenant can afford. All
provinces have a means-tested income-support programme. Some provinces include a specific
estimate of housing costs in their assistance ("shelter component" of social assistance) while
others include housing in their formulae in a non-specific fashion.
Risk reduction
Housing loans can be insured against default with the government-owned Canada Mortgage and
Housing Corporation (CMHC), or with its private-sector competitor, General Electric Mortgage
Insurance Company of Canada (GEMICO). Both organisations generally offer similar premium
rates and programme conditions. CMHC has a larger market share.
Insurance is required on loans with an LTV of 75% or above. The buyer pays an insurance
premium that varies according to anticipated risks. For instance, with a LTV of 90% the
premium is two per cent of the loan amount. With a LTV of 95% the premium amounts to
3.25%.
Several privately capitalised mortgage insurance firms operated in Canada during the 1970s and
1980s. However, the dominant government mortgage insurer possessed various market
advantages, including the ability to assume more marginal risks and avoid adverse risk selection,
which make it difficult for private insurers to compete effectively. In 1996, the last domestic
Canadian mortgage insurer ceased doing business. GE Capital Corporation, a leading US-based
mortgage insurance parent company, recently re-started the private insurance business in Canada.
This new program, similarly to previous private programs, closely resembles the government's
own policy in terms of coverage features and premium pricing. It remains to be seen whether

International trends in housing tenure and mortgage finance
November 2004 69
private sector insurance will succeed in the face of advantaged government competition (Blood,
1998).
References
Information provided by A. Asselin and G. Goy
Blood, R (1998) A Brief Overview of Mortgage Insurance in Other Countries prepared for US
Agency for International Development, Washington DC:www.usaid.gov/locations/europe_
eurasia/ dem_gov/local_gov/pdf_docs/annexc.pdf
Canada Mortgage and Housing Corporation (2003) Comparison of Provincial and Territorial
Rental Practices Research Highlights, October 2003
Canada Mortgage and Housing Corporation (2003) Canadian Housing Observer 2003
Freeman, A, Holmans, A, and Whitehead, CME (1996) Is the UK Different? International
Comparisons of Tenure Patterns Council of Mortgage Lenders, London
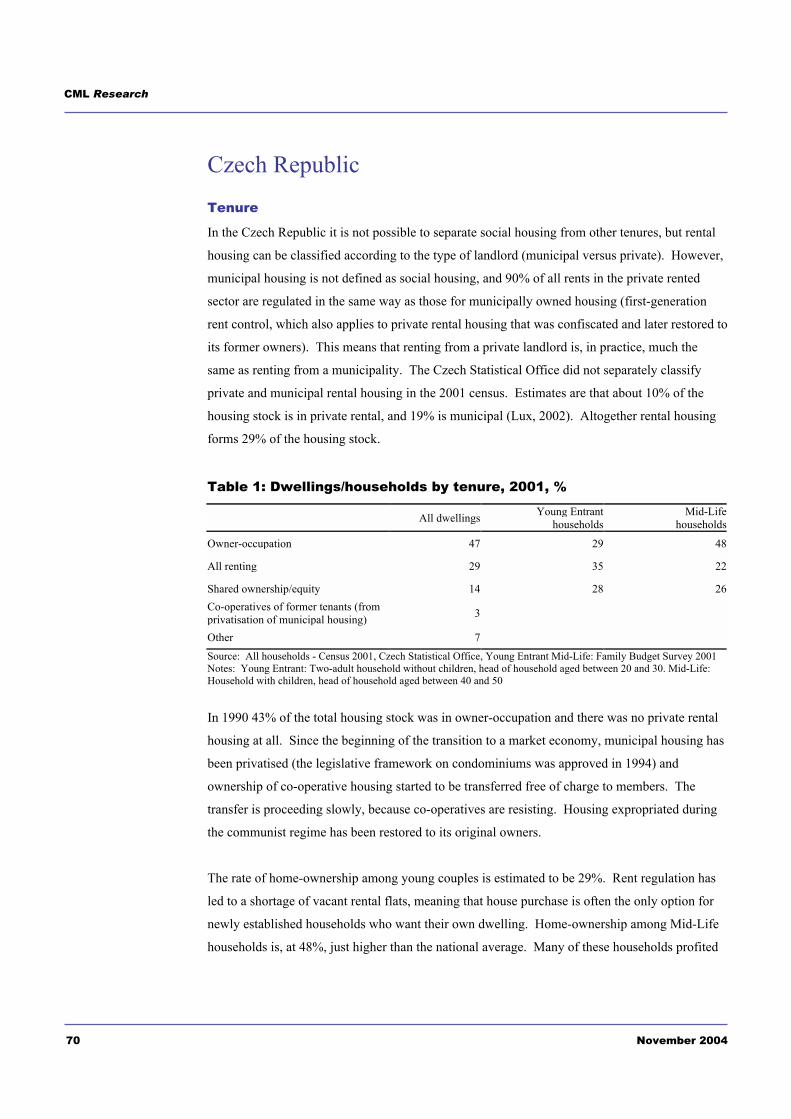
CML Research
70 November 2004
Czech Republic
Tenure
In the Czech Republic it is not possible to separate social housing from other tenures, but rental
housing can be classified according to the type of landlord (municipal versus private). However,
municipal housing is not defined as social housing, and 90% of all rents in the private rented
sector are regulated in the same way as those for municipally owned housing (first-generation
rent control, which also applies to private rental housing that was confiscated and later restored to
its former owners). This means that renting from a private landlord is, in practice, much the
same as renting from a municipality. The Czech Statistical Office did not separately classify
private and municipal rental housing in the 2001 census. Estimates are that about 10% of the
housing stock is in private rental, and 19% is municipal (Lux, 2002). Altogether rental housing
forms 29% of the housing stock.
Table 1: Dwellings/households by tenure, 2001, %
All dwellings Young Entrant households
Mid-Life households
Owner-occupation 47 29 48
All renting 29 35 22
Shared ownership/equity 14 28 26Co-operatives of former tenants (from privatisation of municipal housing) 3
Other 7Source: All households - Census 2001, Czech Statistical Office, Young Entrant Mid-Life: Family Budget Survey 2001 Notes: Young Entrant: Two-adult household without children, head of household aged between 20 and 30. Mid-Life: Household with children, head of household aged between 40 and 50
In 1990 43% of the total housing stock was in owner-occupation and there was no private rental
housing at all. Since the beginning of the transition to a market economy, municipal housing has
been privatised (the legislative framework on condominiums was approved in 1994) and
ownership of co-operative housing started to be transferred free of charge to members. The
transfer is proceeding slowly, because co-operatives are resisting. Housing expropriated during
the communist regime has been restored to its original owners.
The rate of home-ownership among young couples is estimated to be 29%. Rent regulation has
led to a shortage of vacant rental flats, meaning that house purchase is often the only option for
newly established households who want their own dwelling. Home-ownership among Mid-Life
households is, at 48%, just higher than the national average. Many of these households profited

International trends in housing tenure and mortgage finance
November 2004 71
from the privatisation of municipal housing, because of the discounted price at which they
acquired their dwellings.
Housing costs
The average monthly income for a Young Entrant household was CZK 22,610, net of taxes,
social and health insurance. The typical Young Entrant household has two incomes, as does the
typical Mid-Life household. Average monthly net income for a Mid-Life household was CZK
27,041.
Table 2: Actual expenditures on housing 2001, Czech Koruna/month
Young Entrant Mid-Life
Owner-occupier 4,750 4,000
Social /private tenant 3,663 4,571
Co-operative tenant 3,708 4,048Source: Family Budget Survey 2001
Table 3: Relative expenditures on housing (owner-occupation = 100%)
Household type Tenure Young Entrant Mid-Life
Social/private tenant 77 114
Co-operative tenant 78 101Source: Authors' calculations
Owner-occupation is the most expensive tenure for Young Entrant households, but the cheapest
for Mid-Life households. This is because many Mid-Life households benefited from price
discounts when they purchased their housing, but Young Entrant households have generally had
to pay market rates. Renting of any kind is about 23% cheaper than owner-occupation for Young
Entrant households, while for Mid-Life households it is more expensive.
The Czech Republic has experienced a swift rise in housing prices since the early 1990s. Last
year (2002) house prices rose by an average of 10% nationally, and 15% in Prague. At the same
time interest rates fell, leaving affordability much the same.
Mortgage system
The typical mortgage is an annuity loan. The maximum term is 20 years, but the average is
lower. Although there are no official figures, loan-to-value ratios are estimated to average 30-
50% � very low compared to those in other countries. One bank offers a deferred-payment
mortgage.
CML Research
72 November 2004
Taxes and subsidies
Mortgage interest payments are tax deductible up to a limit of CZK 300,000 (£6,818). Owner-
occupiers can sell their dwellings without paying capital gains tax after a two-year holding period
(five if it is not permanently occupied by the owner and is a rental property). There is a subsidy
for house purchase, for which only young people have been eligible hitherto. From 2004,
however, there will be an interest-rate subsidy for those acquiring their first home, and the
subsidy for young people will be abolished. An income-related housing allowance was
introduced in 1996. Both renters and home-owners are eligible, if their income is lower than a
set floor. There is a transfer tax with a flat rate of five per cent (falling to three per cent in 2004).
Owners of rental property are taxed on the income from that property. The state offers grants for
the construction of new municipal housing. About 33% of the cost is covered by state subsidy.
There were no limits on construction costs and no income targeting, and the system has been
abused for the construction of quasi-owner-occupied housing. Because of this some restrictions
were introduced in 2002.
Rents have historically been subject to rent regulation, which was introduced after World War II
and strengthened during the Communist period. Rents are regulated by government decree, and
while the constitutional court has overturned two decrees, they have since been replaced by
similar regulations. Parliament is now discussing the question, but there is little political will to
liberalise rents.
Problems accessing housing
Young households often have problems because of a shortage of rental housing, yet most single-
income and young households are unable to take out a mortgage. Their incomes are too low to
meet bank lending criteria � a Czech buyer would need to earn almost ten times the average
annual income to cover the mortgage on the median-priced owner-occupied dwelling.
Risk reduction
Arrears are not significant (estimated at around 1% of outstanding loans) because only higher-
income households take out loans. A system of private mortgage insurance is being developed.
References
Information provided by M. Lux
Lux M. (2002) Bydlení � věc veřejná (Housing � Res Publica). Prague: SLON. p131, Table 4

International trends in housing tenure and mortgage finance
November 2004 73
Denmark
Tenure
Slightly more than half of Danish dwellings house owner-occupiers. Dwellings in social and
private rental are almost evenly split, each accounting for slightly less than 20% of all dwellings.
Social housing is owned by non-profit, untaxed housing associations. Municipalities do own
some housing, but in general it is dedicated housing for people in particular occupational groups
(nurses, doctors, army officers). Rental units are on average smaller than owner-occupied
dwellings.
Private co-operatives are a minor tenure in Denmark as a whole (6% of all dwellings in 1999),
but important in Copenhagen, where they make up 32% of dwellings. A co-operative is a private
company formed by a single block or group of houses. The residents are tenants of the company
of which they own a part. The percentage that they own is normally the same as the proportion
of their dwelling's floor area in relation to the total. This ownership can be sold on, but the
market is not free � regulations govern the calculation of prices for co-operatives. The maximum
prices for old private co-operatives are only 25-30% of the price for similar owner-occupied flats,
although newer co-operatives sell for closer to market rates. The tenure has an advantage over
standard owner-occupation in that owners do not have to pay the new property tax (see below).
In the last ten years there has been a trend towards transforming private rental dwellings into
private co-operative units. In addition, the municipality of Copenhagen has sold about 20,000
dwellings, most of which have become private co-operatives.
Table 1: Dwellings/households by tenure, %
All dwellings Young Entrants Mid-Life
1990 1999 1990 1999 1993 1999
Owner-occupation 55 53 23 20 68 64
Social renting 18 19
Private renting 19 18Other: private co-operatives, public authorities, other
54
63
77 80 32 36
Source: All households calculated from Statistic Denmark figures on dwellings, ownership and tenure Young Entrant and Mid-Life households from press release by Okonomiministeriet, entitled "Opdatering af tal vedr. andelen af familier med ejerandele", 13 June 2001. Notes: Young Entrants: All households whose oldest member is under 30 years of age. Mid-Life: All households whose oldest member is aged 40-49 years
Levels of owner-occupation for Young Entrant and Mid-Life households fell slightly in the
period 1990 �1999, and even more markedly since 1987. In 1987 27% of households headed by

CML Research
74 November 2004
someone under 30 were owner-occupiers; this had fallen to 20% by 1999. In 1987 69% of
households headed by someone aged 40-49 were owner-occupiers, but by 1999 this was down to
64%. Given that the overall rate of owner-occupation remained almost level (53% in 1987, 52%
in 1999), it follows that there were corresponding increases in the rate of owner-occupation in
other age groups; the overall rate is maintained because of the aging of Danish society. In fact all
age groups under the age of 49 witnessed a decrease in the rate of owner-occupation after 1987,
while the rate for households headed by someone aged 50 or over increased.
Last year the government announced proposals (which have been heavily debated) to begin
selling social housing units to tenants. In October 2003 it was announced that pilot projects
would run for tenants of a number of municipalities and housing associations. Rent and other
conditions will remain unchanged for those tenants who do not buy. Experts expect that few, if
any, social dwellings will in fact be sold.
A typical housing career for an owner-occupier might involve the purchase of a freehold flat
between the ages of 20 and 30, and a house between 30 and 40. There are no statistics about the
proportion of owner-occupiers with a mortgage. At exchange rate of 1 DKK = 0.1345 euros
Housing costs
There is little information available about housing expenditure by owner-occupiers. The average
house price in the first half of 2002 was DKK 1,146,423. The average price was highest in
Frederiksberg, in Copenhagen (DKK 3,436,091) and lowest in Bornholm at DKK 557,908 (Told
& Skat, 2003). Real housing expenditures have in general increased during the last ten years, as
the fall in interest rates has been more than offset by a remarkable increase in house prices. The
highest price rises have been for flats in Copenhagen and other cities.
Social rents, on the other hand, are cost-based, and have hardly changed in real terms over the
past decade.
Mortgage system
Specialist mortgage banks have 90% of the mortgage market in Denmark; the other 10% belongs
to universal banks (Hypostat, 2003). The most common form of mortgage has until recently
been a fixed-interest annuity loan with a term of 30 (or occasionally 20) years. Such loans
generally carry no prepayment penalties; this is virtually unique in Europe, and is possible
because the loans are funded via callable bonds (Mercer Oliver Wyman, 2003). In recent years,
though, long-term fixed-rate mortgages have not dominated the market as they once did.

International trends in housing tenure and mortgage finance
November 2004 75
The maximum legal loan-to-value ratio for principal residences is 80% (or 60% for summer
cottages), and loans for most first-time buyers have high LTVs. Purchasers who need to
borrower a higher percentage of the property price can get a normal commercial bank loan or a
private mortgage (a loan directly from the old owner to the new owner, which can then be sold
on).
In 1996 'interest-adjusted' loans were introduced. The interest rate on such loans changes
periodically (every six months to five years). The new interest rate is determined by the sale of
bonds on the open capital market on a certain day, which is announced in advance. There is
generally no prepayment option for this type of loan, which accounted for about 28% of total
mortgage lending in 2002.
Recent product innovations include loans with interest-rate caps and a new loan type known as
BoligXloans. The interest rate on BoligXloans is adjusted every six months with reference to the
ten-day average of CIBOR (Copenhagen Interbank Offer Rate), so they carry an even lower
interest rate than annually adjusted loans when the yield curve is increasing. In 2003 laws were
passed allowing for the introduction of interest-only loans. These will allow the borrower to
choose at any time during the term of the loan to pay only interest for a period of up to ten years.
There has also been a rise in the number of foreign-currency loans since Denmark rejected Euro
membership in 2000.
For social housing, the 84% of financing costs can come from mortgage banks. The municipality
where the property is situated contributes 14%, and the tenants make up the last two per cent (but
can get a loan from the municipality to cover this).
Taxes and subsidies
Owner-occupiers
Until 1998, the Danish government taxed the imputed rental income of owner-occupiers. With
the so-called "Whitsun package" of tax reforms in 1998 (which took effect in 2000), this was
replaced by a property tax set at one per cent of the dwelling's assessed value. At current (low)
assessed values, this new tax is a few percent higher than the tax on imputed rental income.
Those who were owners before 1 July 1998 receive a discount of 20%. When imputed rental
income was taxed, owner-occupiers over 67 years old received a 50% discount. Under the new
system this discount is available only for low-income pensioners; those with average and higher
incomes pay the full property tax. In November 2001 the government decreed a tax freeze,
fixing both property tax and rateable values at 2001 levels.

CML Research
76 November 2004
Mortgage interest, like other private interest expenditures, is tax deductible in Denmark but this
so-called 'negative capital income' is not deductible at the taxpayer's marginal rate. The 1998
tax-reform package reduced the rate at which interest could be deducted from an average of 46%
to 32-33%, while tax rates for positive capital income were nearly unchanged. Sale of owner-
occupied property is free from capital gains tax, except for the first-time sale of a formerly rented
dwelling and a very few owner-occupied houses (on big plots). Overall the changes increased
the tax burden for owner-occupiers significantly.
Tenants
In the rental sector, a small programme of grants for construction of private rental dwellings was
started in 2003. The government subsidises the building of and guarantees mortgages on social
housing. Housing benefits for renters go to around 20% of households, including 58% of social
tenants and 32% of those renting privately (Ball, 2003). Private rents are controlled, except for
dwellings built after 1991. There is increasing pressure for reform of rent control.
Problems accessing housing
There are no government programmes to assist first-time buyers or other discrete groups. Young
households are increasingly depending on their parents (whose equity, if they are owner-
occupiers, has increased because of house-price inflation) to help them purchase a dwelling.
Estate agents have promoted the idea of parents buying small flats for their children.
Risk reduction
Foreclosures and arrears are currently stable at a low level. The number of foreclosures in the
worst year (1990) approached 20,300 properties, of which about two-thirds were owner-
occupied; by 1999 the total number was 2,400. Arrears in 1990 were near 2.75%, but this figure
fell to 0.23% in 1999.
Danish mortgage credit institutions are restricted by law (the balance principle) to funding their
lending activities by issuing mortgage bonds with a profile matching the repayment profile of the
loan portfolio � (This) and the structure of the market restrict mortgage lenders' risk to credit
risk only. These risks have been very low historically and every mortgage bond has been fully
paid off. Borrower defaults run at very low levels � and in most cases the collateral will cover
any losses (Mercer Oliver Wyman, 2003).
Danish mortgage bonds are callable, so that if borrowers pre-pay their loans the credit institutions
can repay bond investors, limiting prepayment risk.

International trends in housing tenure and mortgage finance
November 2004 77
Unemployed borrowers do not receive state benefits to cover mortgage payments. It is possible
to purchase life insurance that would cover mortgage payments for a short period, but this is not
usual. Some experts feel that the current situation, with highly leveraged owner-occupiers facing
possible house-price falls, could be a precursor of real problems in the financial system.
References
Information provided by J. Lunde
Ball, Michael (2003) RICS European Housing Review 2003 RICS, London
EMF (2003) Hypostat 1992-2002, European Mortgage Federation Brussels.
EMF (2003) Country fact sheet 2002, European Mortgage Federation Brussels
Mercer Oliver Wyman (2003) Study on the Financial Integration of European Mortgage Markets
European Mortgage Federation, Brussels.
Miles D. (2003) The UK Mortgage Market: Taking a Longer-Term View � Interim Report
HMSO, London.
Told & Skat: Ejendomssalg 1. halvar 2002 January 2003, Tables 2 and 15.

CML Research
78 November 2004
Finland
Tenure
As Table 1 shows, owner-occupation in Finland has fallen from 71% in 1992 to a level of 64% in
2001, below the average for European countries. This change was due to a historically severe
recession, with a large increase in unemployment and foreclosures. The trend is now towards an
increase in owner-occupation, with low interest rates, longer loan periods and rents that are high
in comparison to loan costs
Table 1: Households by tenure, %
All households Young Entrant Mid-Life
1992 2001 1992 1995 1992 1995
Owner-occupation 71 64 41 39 79 85
Social renting 15 17 27 20 11 6
Private renting 11 15 27 37 9 7
Shared ownership/equity 1
Other/unknown 2
33 4 1 2
Source: 1992: Census � Housing 1994:4, Statistics Finland; 2001: Statistics Finland, end 2001, unpublished; 1995: "Toimivatko tulorajat", Jukka Hirvonen, ymparisto 208 Notes: Young Entrants: 1992: couples of all income levels with children, where the main respondent is under 30. 1995: couples under 35 without children. Mid-Life: 1992: All couples with two children from all age groups and income levels. 1995: Couples of all ages where youngest child is between 7 and 17 years old.
While the data on the overall tenure split allow us to look at developments over about 10 years,
data for Young Entrant and Mid-Life households are not as recent. They do show that in the
three years from 1992 to 1995 there was a fall in the percentage of Young Entrant households
who were owner-occupiers, from 41% to 39%. Over the same period there was a fall in the
percentage of social renters and a rise in private renting.
For settled Mid-Life households the change was in the opposite direction � a rise in the
percentage of owner-occupiers from 79% to 85%. This may, however, simply reflect the
somewhat different definitions of Mid-Life households that were used in the two years. The
households covered by the 1995 definition (couples of all ages where youngest child is between
seven and 17 years old) would on average be older than those covered by the 1992 definition (all
couples with two children, from all age groups and income levels), and we would therefore
expect a higher percentage of owner-occupiers in the 1995 group.
In the 1990s, a hybrid ownership rental tenure emerged, using a model first devised in Sweden.
In a 'right of occupancy' dwelling, the inhabitant initially pays 10-15% of the market value of the
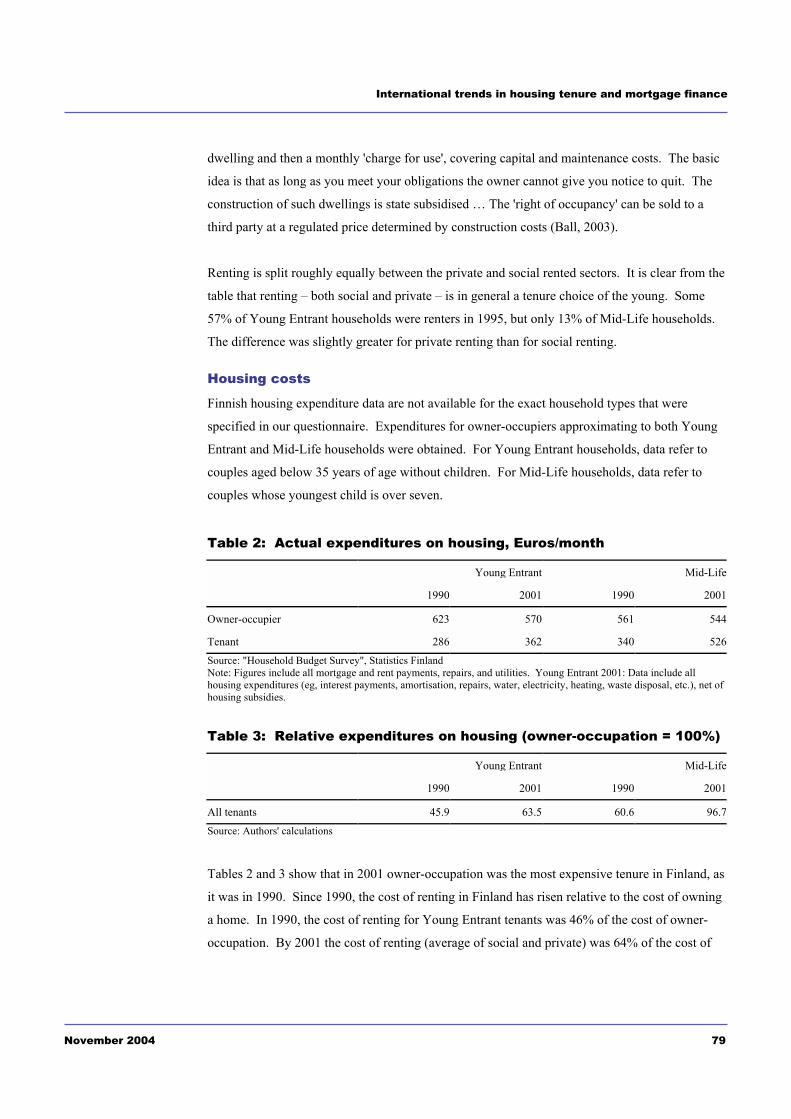
International trends in housing tenure and mortgage finance
November 2004 79
dwelling and then a monthly 'charge for use', covering capital and maintenance costs. The basic
idea is that as long as you meet your obligations the owner cannot give you notice to quit. The
construction of such dwellings is state subsidised � The 'right of occupancy' can be sold to a
third party at a regulated price determined by construction costs (Ball, 2003).
Renting is split roughly equally between the private and social rented sectors. It is clear from the
table that renting � both social and private � is in general a tenure choice of the young. Some
57% of Young Entrant households were renters in 1995, but only 13% of Mid-Life households.
The difference was slightly greater for private renting than for social renting.
Housing costs
Finnish housing expenditure data are not available for the exact household types that were
specified in our questionnaire. Expenditures for owner-occupiers approximating to both Young
Entrant and Mid-Life households were obtained. For Young Entrant households, data refer to
couples aged below 35 years of age without children. For Mid-Life households, data refer to
couples whose youngest child is over seven.
Table 2: Actual expenditures on housing, Euros/month
Young Entrant Mid-Life
1990 2001 1990 2001
Owner-occupier 623 570 561 544
Tenant 286 362 340 526Source: "Household Budget Survey", Statistics Finland Note: Figures include all mortgage and rent payments, repairs, and utilities. Young Entrant 2001: Data include all housing expenditures (eg, interest payments, amortisation, repairs, water, electricity, heating, waste disposal, etc.), net of housing subsidies.
Table 3: Relative expenditures on housing (owner-occupation = 100%)
Young Entrant Mid-Life
1990 2001 1990 2001
All tenants 45.9 63.5 60.6 96.7
Source: Authors' calculations
Tables 2 and 3 show that in 2001 owner-occupation was the most expensive tenure in Finland, as
it was in 1990. Since 1990, the cost of renting in Finland has risen relative to the cost of owning
a home. In 1990, the cost of renting for Young Entrant tenants was 46% of the cost of owner-
occupation. By 2001 the cost of renting (average of social and private) was 64% of the cost of

CML Research
80 November 2004
owner-occupation for Young Entrant households. For Mid-Life households, the cost of renting
had risen so much that by 2001 average rents were 97% of average costs for owner-occupation.
Table 4: Household disposable incomes in 2001 currency, Euros/month
Young Entrant Mid-Life
1990 2001 1990 2001
Owner-occupier 2,634 2,852 3,185 3,396
Tenant 2,097 1,908 3,148 2,534Source: "Household Budget Survey", Statistics Finland.
It is notable that over the period 1990-2001, the disposable incomes of owner-occupiers rose (by
eight per cent for Young Entrant households and seven per cent for Mid-Life households), while
the incomes of tenants fell (by 9% for Young Entrant households and 20% for Mid-Life
households). This suggests that the composition of the groups of owner-occupiers and tenants
changed over the period.
Mortgage system
The typical form of mortgage is a variable-rate loan where the monthly payment remains the
same and, when the interest rate varies, the loan term varies accordingly. There has been a rapid
increase in house prices in Finland in recent years, coupled with a decline in interest rates,
leading to a lengthening of loan terms. The typical term is 15-20 years. Practically all housing
loans have variable interest rates, tied to Euribor or to banks' prime rates, and mortgage interest
rates change quickly.
Mortgages generally cover up to 70% of the market value of the house. It is possible to get a
loan covering up to 85% of the value of the house by taking out a state guarantee (see below).
All households are eligible for this guarantee, which costs 2.5% of the guaranteed amount.
Lenders will also give loans with higher loan-to-value ratios if, for example, parents guarantee
their children's loans or other additional collateral is offered.
The key change in the mortgage system has been the continuous decline in the interest rate since
1995. There has also been a significant decrease in the margins of housing loans (both loans to
households and commercial loans for social housing), a lengthening of terms for mortgages (in
the early 1990s the average was ten years), and the introduction of the state guarantee for
mortgages. The net result has been a lowering of repayments for any given loan size, allowing
households to take on larger mortgages. The increase in house prices has, however, diluted these
gains. In the social sector, borrowers have benefited from lower interest rates and margins.
International trends in housing tenure and mortgage finance
November 2004 81
Taxes and subsidies
Owner-occupation
Housing is treated as a consumption good for tax purposes, and is thus favoured over other
investment goods. Housing investor's pay no capital gains tax if the house has been owned for
more than two years, and imputed rental income from owner-occupation is not included in a
household's taxable income. Property taxes are low.
Owner-occupiers receive mortgage tax relief. Some 29% of interest payments (up from 25% in
1995) can be deducted from tax payable subject to certain limits, which rarely bite at the current
low interest levels. First-time buyers receive a slightly higher deduction of 30%. The average
subsidy for a Young Entrant household in 1998 was �50/month. There will be a minor change in
tax relief in 2005, when the general deduction is lowered to 28%. The first-time buyers'
deduction will remain in 30%, and the limits for deductions for families with children will be
increased.
In the 1990s owner-occupiers were eligible for the ARAVA programme, which provided housing
loans at interest rates subsidised by the state, subject to household size and income criteria.
Demand for these loans, which were allocated by the municipalities, was low. They were
replaced by an interest-subsidy scheme for buyers of new single-family homes. Purchasers can
apply to their municipalities for these loans, which are allocated on social criteria. There are just
under 1,000 new loans annually. Subsidy is paid on that part of the interest rate above 4.5%.
During the first five years the rate of subsidy is 70%, falling to 50% in the next five years. In a
low-interest environment the value of such a programme can be negligible � in May 2003 the
average mortgage rate in Finland was 4.04%, and this programme currently pays no subsidy at
interest rates below 4.5%.
A separate savings scheme operates for young people buying their first home. The ASP
programme is for people between 18 and 30 who do not own a home. They must save at least
15% of the acquisition price over a period of at least two years. The interest paid on the savings,
which is tax free, consists of a basic rate of one per cent, plus an additional two to four per cent
agreed with the bank. Interest on the ASP loan is subsidised by the state during the first six
years. The subsidy is 70% of the interest rate over 4.5%. The loan is eligible for the mortgage
interest tax deduction. The loan amount is subject to a maximum; the country is split into four
geographical sectors for this purpose.

CML Research
82 November 2004
Owner-occupiers who meet certain income and family-size criteria are eligible to receive housing
allowance, though about 85% of these allowances go to tenants. Many of those eligible are
pensioners.
Rental sector
Private rents were controlled until the early 1990s, when this control was gradually lifted.
Private landlords must pay capital income tax (income streams deriving from investments and
labour income are taxed separately), but they can deduct interest payments and other costs from
their taxable income. They pay no capital gains tax. Private-sector tenants are eligible for
housing allowances. The tax treatment of owner-occupiers and landlords and tenants in the
private sector is thus very similar. However, private landlords in Finland receive no depreciation
allowances.
Non-profit housing companies are taxed in the same way as other limited companies, but because
all expenses can be deducted, in practice they rarely pay taxes. They pay no capital gains tax, are
eligible for the ARAVA loan scheme (which still exists for social housing) and their tenants are
eligible for housing allowance. Unlike private-sector landlords they do receive depreciation
allowances, as do other limited companies.
There are two systems for social housing production. Originally those dwellings financed with
state loans had cost rents, while those financed with commercial loans did not. In the beginning
of 2002, cost rents were applied to all new projects in the social rental sector.
Risk mitigation
A partial state guarantee for loans for owner-occupied housing was introduced in spring 1996,
with the aim of eliminating the need for personal sureties (typically, parents guaranteeing their
children's loans). The state guarantees housing loans granted to private persons for the
construction or purchase of a single-family house, or for the purchase of shares or an interest
conferring possession of an apartment. There is no application procedure, only a requirement
that the general conditions for the guarantee are fulfilled. If the lender forecloses and the
property is sold at auction for less than the outstanding amount of the loan, the state will make up
the difference (up to 20% of the outstanding loan value).
The loan can cover no more than 85% of the purchase price. The guarantee covers a maximum
of 20%, to a limit of �25,250, of the outstanding principal. The primary collateral consists of the
dwelling or other real collateral providing equivalent security. A fee of 2.5% of the amount
guaranteed is paid to the state. No fee is paid if the loan receives an interest subsidy from the
International trends in housing tenure and mortgage finance
November 2004 83
state. This guarantee currently applies to 25% of new mortgages; the stock is about 120,000
guarantees. In the six years of the programme's existence there have been only 20 defaults.
Commercial mortgage insurance policies for borrowers have been very popular in recent years.
Unlike the state programme, which offers no protection against the borrower losing his house,
commercial insurance will service the mortgage for a limited period of time (typically a year or
two) if the borrower falls ill, lose his job, etc.
In addition, home-owners who become unemployed may become eligible for means-tested
housing allowance if their income falls below a certain level. However, the means-testing
procedure also includes assessment of household wealth, and few owner-occupiers would be
likely to qualify. The allowance covers 55% of loan interest or, in the case of pensioners, 100%.
A compulsory arbitration system is in force for all debt problems:
For any kinds of debt problems, not only those caused by housing loans, there is a debt
adjustment system that has been operating since 1993. This is � a legally enforced system
through which the creditor and debtor can negotiate a payment plan by which the debt is paid. If
the parties concerned cannot agree on the plan, the court can make a decision about it. Between
1993 and 1998 42,000 payment plans have been confirmed � Only two per cent of the cases are
due to problems caused by housings (Ruonavaara, 2003).
References
Information provided by T. Tahtinen
Ball, Michael (2003) RICS European Housing Review 2003 RICS, London
Freeman A, Holmans A, and Whitehead CME (1996) Is the UK Different? International
Comparisons of Tenure Patterns Council of Mortgage Lenders, London
Ruonavaara H (2003) 'Finland', in Globalisation and Home-ownership (Doling, J. and Ford, J.,
eds); Delft University Press, Delft.

CML Research
84 November 2004
France
Tenure
The proportion of all households that were owner-occupiers in 2002 was, at 56%, slightly higher
than in 1992 and eleven percentage points higher than in 1970. The social rented sector
(predominantly organismes d'habitations à loyer modéré, or HLMs � some of which are similar
to housing associations, and some to council housing) accommodated 17% of households in
2002, up from 15% in 1990. Over the same period, private renting fell from 25% of households
in 1990 to 21% in 2002.
A high proportion of owner-occupiers - some 63% - are outright owners. This figure has risen
from 56% in 1992. The high proportion is explained primarily by the age structure of owner-
occupiers, of whom nearly 60% were aged 50 or over in 1992 (as compared with 47% of all
households).
In terms of Young Entrant and Mid-Life households, the tenure pattern in 2002 was broadly
similar to the position twelve years earlier. Young households were most likely to be renting
privately (53%), and the proportion of young owner-occupiers had fallen from 21% to 17%.
Table 1: Households by tenure, %
All households Young Entrant Mid-Life
1990 2002 1990 2002 1990 2002
Owner-occupation 54 56.0 21 17.2 73 71.1
Social renting 15 17.2 20 23.1 9 14.5
Private renting 25 20.7 52 53.3 14 11.2
Shared ownership/equity 0 0 0
Other 6
6.17
6.44
3.2Source: 1990: Recensement de la Population de 1990: Logements � Inmeubles, Table 43; 2002 data: Bessiere (2003): table 3, Insee-Premiere, No 880 http://www.insee.fr/fr/ffc/docs_ffc/IP880.pdf ; unpublished data from 2002 French Housing Survey Notes: Young Entrant: 1990: Couples where the main respondent is less than 40 years of age with no children; 2002: Couples with no children, where head of household is under 30 and not a student. Mid-Life: 1990: Couples where the main respondent is aged 40-64 with 1 or 2 children; 2002: Couples with at least one child, where head of household is between 30 and 39. Other: Sub-renting, furnished accommodation, hotels, tenant farming and sharecropping Mature households with children were predominantly owner-occupiers (71%). Both household
types were somewhat more likely to be in the social rented sector in 2002 than in 1990. In 1997,
55% of rental units were privately rented at market rates; just two per cent were subject to rent
control. Municipalities owned 21% of all rental dwellings, while other social landlords (basically
HLMs) owned 22%.
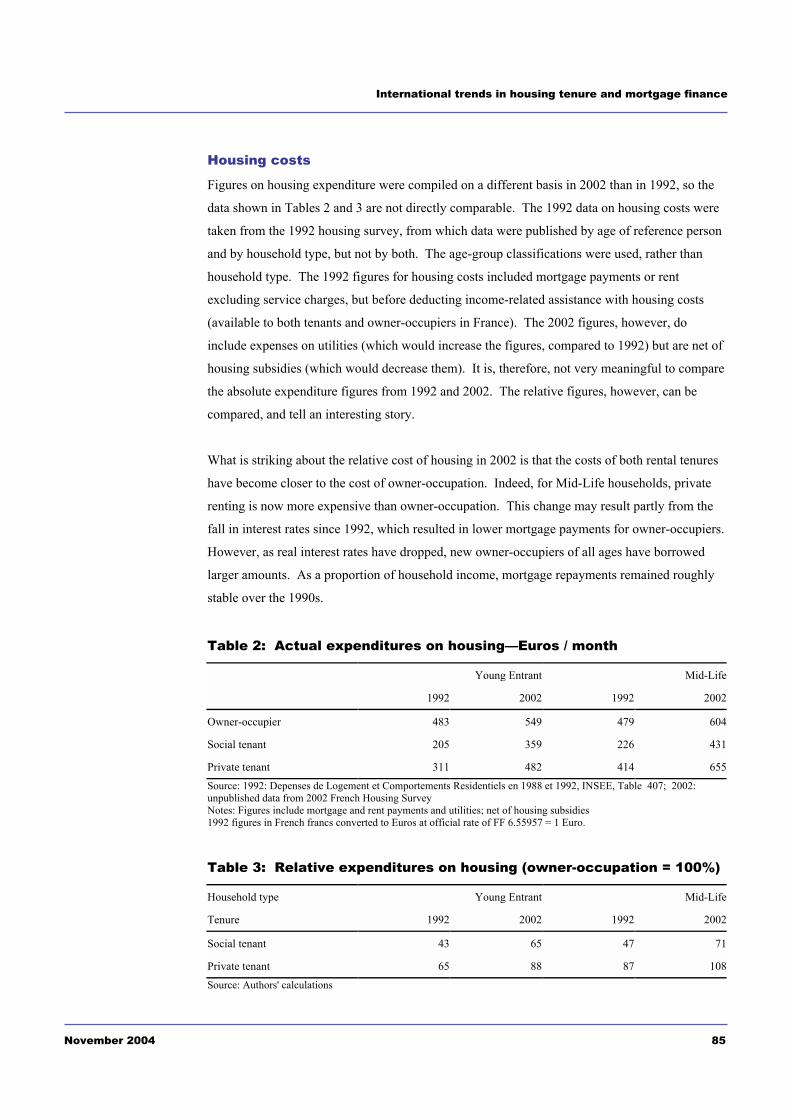
International trends in housing tenure and mortgage finance
November 2004 85
Housing costs
Figures on housing expenditure were compiled on a different basis in 2002 than in 1992, so the
data shown in Tables 2 and 3 are not directly comparable. The 1992 data on housing costs were
taken from the 1992 housing survey, from which data were published by age of reference person
and by household type, but not by both. The age-group classifications were used, rather than
household type. The 1992 figures for housing costs included mortgage payments or rent
excluding service charges, but before deducting income-related assistance with housing costs
(available to both tenants and owner-occupiers in France). The 2002 figures, however, do
include expenses on utilities (which would increase the figures, compared to 1992) but are net of
housing subsidies (which would decrease them). It is, therefore, not very meaningful to compare
the absolute expenditure figures from 1992 and 2002. The relative figures, however, can be
compared, and tell an interesting story.
What is striking about the relative cost of housing in 2002 is that the costs of both rental tenures
have become closer to the cost of owner-occupation. Indeed, for Mid-Life households, private
renting is now more expensive than owner-occupation. This change may result partly from the
fall in interest rates since 1992, which resulted in lower mortgage payments for owner-occupiers.
However, as real interest rates have dropped, new owner-occupiers of all ages have borrowed
larger amounts. As a proportion of household income, mortgage repayments remained roughly
stable over the 1990s.
Table 2: Actual expenditures on housing�Euros / month
Young Entrant Mid-Life
1992 2002 1992 2002
Owner-occupier 483 549 479 604
Social tenant 205 359 226 431
Private tenant 311 482 414 655Source: 1992: Depenses de Logement et Comportements Residentiels en 1988 et 1992, INSEE, Table 407; 2002: unpublished data from 2002 French Housing Survey Notes: Figures include mortgage and rent payments and utilities; net of housing subsidies 1992 figures in French francs converted to Euros at official rate of FF 6.55957 = 1 Euro.
Table 3: Relative expenditures on housing (owner-occupation = 100%)
Household type Young Entrant Mid-Life
Tenure 1992 2002 1992 2002
Social tenant 43 65 47 71
Private tenant 65 88 87 108Source: Authors' calculations

CML Research
86 November 2004
Both Young Entrant and Mid-Life households are normally dual-income (71% for Young
Entrant; 70% for Mid-Life). Average income for Young Entrant households in 2002 was
�2204/month, while Mid-Life average household income was �3368/month. (These figures
include income from salaries or self-employment, pensions, minimum income support schemes,
unemployment benefits, and the yields on stocks and bonds. Housing subsidies are not
included.)
Table 4: Housing costs for owner-occupiers in 2002, Euros
Young Entrant Mid-Life
Average house price 88,471 150,887Average down payment on a mortgage 16,591 56,045
Average mortgage payment 490/month 648/monthSource: Local experts' estimates
Table 4 gives information on average house prices and mortgage payments for owner-occupiers.
Caution must be exercised in interpreting figures for Young Entrant households, because they
were computed on a very small sample size since most households under 30 years of age are not
owner-occupiers.
Real estate prices fell in the early 1990s in the main cities, then have risen since 1997. Outside
of the cities house prices rose throughout the 1990s. In the last five years of the 1990s the house
prices rose by 23%, but the price of flats went up only 12%.
Mortgage system
The purchase of a house in France is not necessarily funded by a mortgage strictly defined � that
is, by a loan secured on the property:
For purchasing housing, the traditional mortgage in France is a personal loan. The lender is
interested in the ability of the borrower to repay, rather than in the value of the mortgaged
property. As a rule, the price of the property being purchased is not estimated, and a mortgage is
not necessarily demanded, it can be replaced by a mutual guarantee. This sort of guarantee is
more advantageous than a mortgage for the lender, because the risk of loss is then covered by the
guarantor. It is less costly for the borrower - particularly for those who repay the loan quickly.
But it depends on acceptance by one of the guarantors whose selection criteria are more stringent
than those of lenders (Bosvieux and Vorms, 2003).
The principal guarantor is Credit Foncier, of which the state owns most of the equity. For a

International trends in housing tenure and mortgage finance
November 2004 87
one-off payment of about two per cent of the insured amount, Credit Foncier will insure the loan
against 100% of any default-related losses. The insurance is used as an alternative to registering
a claim on the property, which in France is a costly and time-consuming process.
Borrowers usually get a housing loan from the bank they already save with; this is often
accompanied by a requirement that they move all their other accounts to that bank.
In France the mortgage generally runs for a term of 15 to 20 years at a fixed rate of interest.
There is evidence that mortgage terms fell in the 1990s, but have been increasing since 2000 as
they have in other countries. By law variable-rate products must be indexed to underlying
interest rates. The usual form is a constant annuity with progressive amortisation; interest-only
mortgages with separate repayment vehicles are rarely used. Lenders normally require a down
payment of 20% of the purchase price and calculate affordability on the basis that mortgage
payments should make up no more than 30% of the household's disposable income. Most buyers,
though, have a much larger down payment, as the average loan-to-value ratio is 60%. The
average income multiple in 1999 was 3.05.
The typical mortgage interest rate paid by Mid-Life owner-occupiers in 2002 was 6.39%,
somewhat higher than the 5.34% paid by Young Entrant owner-occupiers. This reflects the fact
that Mid-Life owner-occupiers were more likely to have arranged their mortgage some years ago,
when rates were higher, and are now locked into these higher rates despite subsequent falls in
interest rates; they are also less likely to have benefited from PTZ (see below). For example, the
fixed mortgage rate in December 1994 was 9.07%.
There is a state-backed scheme, the pret pour l'accession sociale (PAS), to allow low-income
households to borrow at reasonable cost (see below), but take-up has been low. Most financial
institutions are reluctant to suggest it to buyers because of its rigorous regulation.
Specialist lenders and retail banks accounted for 97% of mortgages to households in 1999; the
rest were loans financed by a compulsory contribution of employers to construction. Most social
rented housing was financed by the state-owned Caisse des Depots et Consignations.
Taxes, subsidies, and regulations
The tax system is biased in favour of owner-occupation, because imputed rent is exempt from
income tax, whereas landlords pay income tax on their property revenue. (The bias is less strong
than it was, though, because of the abolition of tax relief for owner-occupiers�see below.)
Capital gains tax is not charged on the main residence and there is a general exemption after 15
CML Research
88 November 2004
years. There is an additional capital tax, "Impot sur la Fortune" (IGF), which is levied on any
capital of more than � 600,000, in which housing is included whether it is the main residence or
not.
Tax relief on mortgages
Tax relief on mortgages for owner-occupiers ended in 1997-98 (it is still available for owners of
rental property). Previously, owner-occupiers with mortgages received a tax credit equal to 25%
of the interest paid on the mortgage. There was a ceiling on this credit, which varied according
to the size of the family and was significantly higher for newly constructed dwellings. If
household income was below a certain level, the taxpayer could choose between a zero-interest
loan (see below) and tax deductibility.
The Pret d'Accession a la Propriete (PAP) was a programme administered by a single state-
linked institution, through which low-income households could finance the purchase of a newly
built home at below-market rates. It was replaced in 1995 by the Pret a Taux Zero (PTZ),
available through all financial institutions, which is an interest-free mortgage covering up to 20%
of the price of a new house. Only first-time buyers are eligible; income ceilings are higher than
for the PAP. This zero-interest-rate loan can be combined with more traditional mortgages, and
effectively reduces the average interest rate paid by the beneficiaries by 1.23%. This PTZ can be
combined with housing benefit.
Limiting such assistance to new houses distorts the market:
'Assisted' purchases are the first in line when it comes to loss of value, because of the difference
in treatment between new and old properties. The priority attribution of public aid to new
construction has a perverse effect: first-time buyers on modest incomes being pushed towards
new housing that is too expensive for them; a sharp drop in price when subsidised housing is sold
on for the first time; and lack of market fluidity. This comes about because, when these
properties are resold, they can no longer be bought under the special conditions that are attributed
to their initial purchase. What is more, such properties are often found in undesirable areas,
where land is cheap, and can be difficult to sell (Bosvieux and Vorms, 2003).
House purchase savings plan
The state also has a house-purchase savings plan, known as the Plan d'Epargne Logement (PEL).
Every month, for a period of 4-10 years, the household saves a certain amount. The interest paid
by the bank includes a government-financed enhancement. At the end of the savings period, the
household qualifies for a subsidised-rate mortgage the amount of which is calculated using a ratio

International trends in housing tenure and mortgage finance
November 2004 89
of 2.5 between the amount of interest received on the savings and paid on the loan. The interest
on the savings, and the mortgage rate, are those in force when the account is opened. Its
attractiveness depends on the relative level of interest rates. Its appeal is low at the moment,
because market rates are low. In 2003 this programme was modified so that the state-financed
enhancement will now be paid only to those households that buy a home at the end of the savings
period.
Rental property
Turning to rental property, private rents may be freely agreed for new and renovated dwellings,
but subsequent rent increases are tied to the construction price index. Rents for existing
dwellings are regulated. Income tax is charged on the rental income of private landlords, net of
expenses (including loan interest) and a depreciation allowance. Landlords may deduct from
their taxable income up to 65% of the purchase price of a newly constructed home over fifteen
years. Rents could not exceed certain limits. The scheme was recently reviewed by the
government. Previously, there was a requirement that the dwelling be rented to a low-income
household for at least nine years. After the review, the government removed income ceilings on
tenants, and raised the rent limits. If expenses are greater than rental income the deficit may be
offset against income from other sources, as long as interest costs are not greater than gross rental
income and the deficit is below a set limit. If the deficit exceeds this amount, the difference can
be deducted from rental income over the following five years.
Means tested housing subsidy
As in most countries, renters are entitled to a means-tested housing subsidy. Since 2001, this
allowance has been computed using the same formula for social-sector and private sector tenants.
In France, owner-occupiers with mortgages also can qualify for housing subsidy. The amount
depends on household income, household size, and the household's housing expenditure. There
are maximum reckonable amounts of rent or mortgage interest, which vary with geographical
area. The proportion of rent or mortgage interest met from assistance at the margin is always less
than 100%, and substantially so except for those on very low incomes. Owner-occupiers
purchasing a newly constructed home are entitled to a larger housing subsidy than renters, and
renters are entitled to a higher subsidy than owner-occupiers purchasing an existing dwelling.
HLM organisations in the social rented sector are financed by subsidised loans known as PLUS's.
These are part grant, and part low-interest loan from Caisse des depots, funded by dedicated
savings institutions. Construction and renovation works also benefit from a reduced rate of VAT
(5.5%) and newly built social housing is exempt from property tax for 15 years (rather than two).
Grants are also made towards the cost of improvements to existing dwellings.

CML Research
90 November 2004
Risk reduction
The PAS, or social access mortgage, was set up in 1993 to allow low-income households to
borrow at a reasonable interest rate. Mortgages are guaranteed through a fund paid for by the
state and the credit institutions that participate in the scheme. If a borrower defaults, the fund
covers principal and interest as well as fees owed to the lender. In 1999 the guarantees were
broadened to cover the involuntary loss of the main or co-borrower's job. The PAS mortgage has
a very small market share.
Lenders generally ask borrowers to take out insurance against death, accident, and sickness, but
rarely against loss of employment. This insurance is often issued by a company suggested by the
lender, so the mortgagor has no choice. Low-income borrowers are also eligible for housing
subsidies, which is a form of implicit mortgage insurance.
References
Information provided by A. Jacquot and C. Taffin
Ball Michael (2003) RICS European Housing Review 2003 RICS, London
Blood R (1998) A Brief Overview of Mortgage Insurance in Other Countries prepared for US
Agency for International Development, Washington DC: www.usaid.gov/locations/europe_
eurasia/ dem_gov/local_gov/pdf_docs/annexc.pdf
Bessiere, Sabine (2003) La proportion de logements vacants la plus faible depuis trente ans
Bosvieux, J. and Vorms, B. (2003) 'France', in Globalisation and Home-ownership (Doling, J.
and Ford, J., eds); Delft University Press, Delft
Freeman A, Holmans A, and Whitehead, CME (1996) Is the UK Different? International
Comparisons of Tenure Patterns Council of Mortgage Lenders, London
Mercer Oliver Wyman (2003) Study on the Financial Integration of European Mortgage
Markets, European Mortgage Federation, Brussels.

International trends in housing tenure and mortgage finance
November 2004 91
Germany
Tenure
Although German tenure statistics are available from about a decade ago (1987 and 1993) and
more recently (2001), one must exercise great care when comparing them. Table 1, therefore,
splits out 1987 and 1993 data for the former West Germany only. A minority 38% of households
in the former West Germany were owner-occupiers in 1987, although owner-occupation was the
majority tenure amongst Mid-Life households. (These were defined as four-person households
with net incomes of between DM5,000 and DM10,000 per month; average household income in
1993 was well below DM5,000/month, so the figures are for a small sample of upper middle-
class households.)
Amongst Young Entrant households, however (defined as all those below the age of 35 years
regardless of household type), only 17% were in owner-occupation in 1993.
In former West Germany, 58% of all households were tenants in 1987, 43% in the private rental
sector and 15% in social renting. The proportion of tenants in the private rented sector was
higher for Mid-Life than for Young Entrant households.
Table 1: Households by tenure, former West Germany 1987 & 1993, %
All households Young Entrants1 Mid-Life2
1987 1993 1993
Owner-occupation 38 17 77
Social renting 15 17 9
Private renting 43 66 14Shared ownership/equity "Genossenschaften"* Other
4 0 0
Source: Census 1987, Table 1.1; Income and Expenditure Survey 1993, Table 1 Note: 1 - All those below the age of 35 regardless of household type; 2 - Four-person households of all age groups with net incomes of DM5,000 � 10,000/month
The 2001 figures are for all Germany. Former West Germany accounts for about 80% of the
population of the reunited country. These figures are panel data, rather than census data.
From 1987 to 2001 there was a five per cent rise in owner-occupation in the area of former West
Germany. The figure for the entire country was, at 41%, somewhat higher in 2001 than the 38%
registered in West Germany in 1987.

CML Research
92 November 2004
Tenure by household type
The breakdown by household type for all Germany in Table 2 shows an owner-occupation rate
for Young Entrants of 49%. This is significantly higher than the figure for West Germany alone
in 1993, although the data are not strictly comparable. This apparent increase may be partly
explained by a fall in the availability of social housing, and by the introduction of a generous
grant for first-time homebuyers in 1996 (the Eigenheim-Zulage, described below).
Table 2: Households by tenure all Germany 2001, %
All households Young Entrants1 Mid-Life2
West: 43 East: 31Owner-occupation
4149 49
Social renting 6 5 7
Private renting 49 45 44
Shared ownership/equity "Genossenschaften"* 5 0 0
Other 0 0 0Source: Federal Office of Statistics; Bundesamt fur Bauwesen und Raumordnung (2001): Wohnungsprognose 2015. Band 10, Bonn. ("BBR 2001"); Bundesverband deutscher Wohnungsunternehmen e.V. (2002: Wohnungswirtschaftliche Daten und Trends 2002/2003, Berlin ("GdW 2002"); Socio-Economic Panel, Waves M & R (SOEP); calculations based on above Notes: 1 - Two-adult households without children, adults aged 20-29 years; 2- Two-adult households with children, adults aged 40-49 years * Non-profit housing associations which are jointly owned by the "tenants" ("Genossen") who also exert a democratic control of their management.
The 2001 owner-occupation rate for Mid-Life households was 49% for the country as a whole�
lower than the 77% registered in 1993 for West Germany. But local experts agree that the Mid-
Life owner-occupation rate has risen in Germany since 1993, not fallen. The decline that Tables
1 and 2 indicate seems to stem entirely from non-comparability of the data � in particular from
the fact that the earlier data referred to higher-income households.
Also, the incorporation of former East Germany has had a huge effect on the statistics. Without
detailed analysis, though, it is impossible to know to what extent the dramatic differences in the
two sets of figures represent real changes in tenure patterns in former West Germany, or simply
the incorporation of statistics for former East Germany.
The typical homebuyer in Germany in 1994 was 38 years old (Expert Commission on Housing ,
1994). Owner-occupiers typically build their own homes on plots they purchase, with the
intention of living there for a long time. The introduction of first-time homebuyer grants in 1996
reduced the financial burden for the first-time buyer and presumably the average age of first-time
buyers has fallen since then, though no figures are available.
International trends in housing tenure and mortgage finance
November 2004 93
Social and private renting
There has been a marked decrease in social renting, particularly for younger households, because
of the expiration of social housing programmes, which are not replaced at the same rate. Social
housing built in the 1980s was funded by subsidised loans, in return for which housing providers
were required to set low rents. When the loans were repaid the housing providers were free to
revert to market rents, so as the terms of these subsidised loans have expired, social rents have
increased relative to private rents. Private renting has risen somewhat overall, and in particular
for Mid-Life households. In West Germany in 1993 14% of Mid-Life households rented
privately; the 2001 figure for all of Germany was 44%. Rent differentials between private and
social rental have narrowed in the last ten years.
The population of western Germany has risen in the last decade because of migration from east to
west, but also because of immigration from Eastern Europe and the former USSR and the
reunification of Turkish families. There is currently a large oversupply of housing in the east.
This is partly due to this migration to the west, and partly to suburbanisation and the very
generous depreciation allowances that applied pre-1999 for new rental buildings in the former
East Germany to stimulate construction. The housing in 'oversupply' is mainly substandard.
The regional länder have responsibility for housing policy and, hence, have an important
influence on the mix of housing tenures.
Housing costs
Given the limitations of the data, we can only make broad generalisations about the patterns of
housing cost and tenure in Germany, shown in Tables 3 and 4. In our last survey, private renting
was shown to be significantly cheaper than owner-occupation for both Young Entrant and Mid-
Life households. (Although figures were not available, it was suggested that costs for social
tenants were generally about 20% lower than private rental sector costs.) The 2001 figures
suggest that while Mid-Life private renters continue to pay about 56% as much as owner-
occupiers, the cost differential has narrowed for Young Entrant households. For these young
households private renting now costs about 84% as much as owner-occupation. Social renting is
somewhat cheaper, but still costs more relative to owner-occupation than did private renting ten
years ago. A large stock of empty dwellings in eastern Germany, and adequate supply elsewhere,
keeps prices down. House prices fell in 2001 and were static in 2002, in contrast to other EU
countries.
The average income for a Young Entrant household in 2001 was DM4,363 per month net of tax.
59% of Young Entrant households were single-income in 2001, and 41% dual income. The
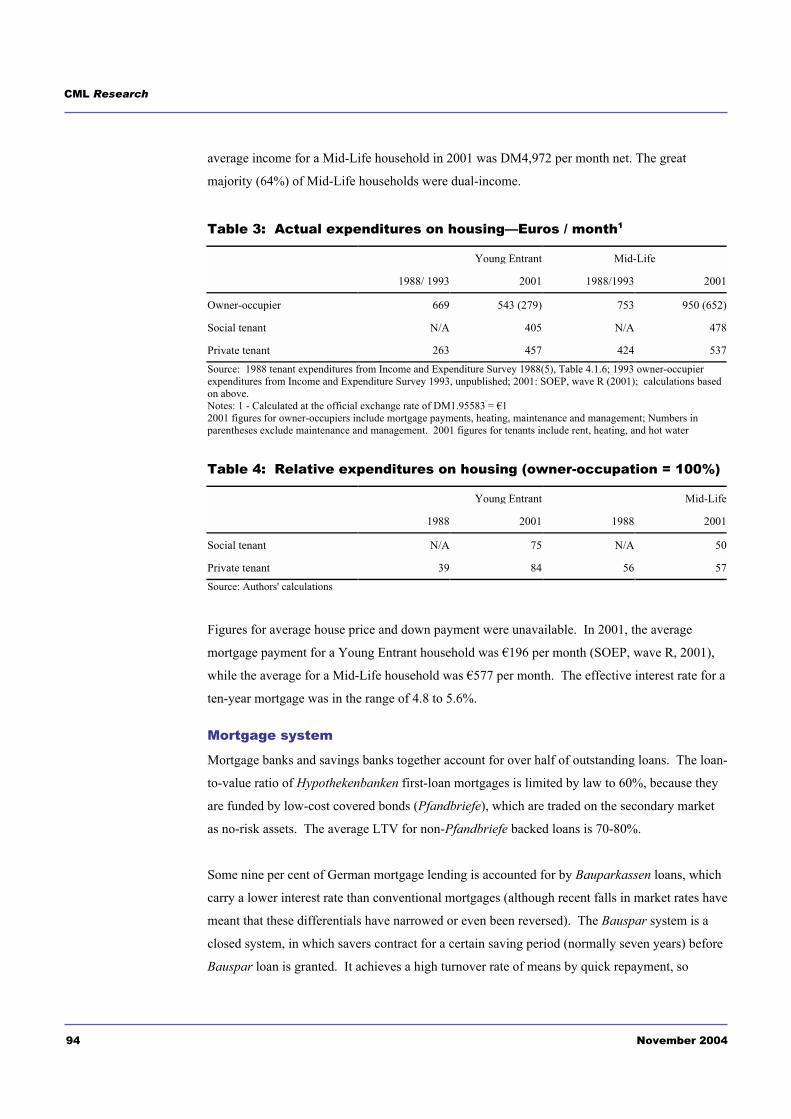
CML Research
94 November 2004
average income for a Mid-Life household in 2001 was DM4,972 per month net. The great
majority (64%) of Mid-Life households were dual-income.
Table 3: Actual expenditures on housing�Euros / month1
Young Entrant Mid-Life
1988/ 1993 2001 1988/1993 2001
Owner-occupier 669 543 (279) 753 950 (652)
Social tenant N/A 405 N/A 478
Private tenant 263 457 424 537Source: 1988 tenant expenditures from Income and Expenditure Survey 1988(5), Table 4.1.6; 1993 owner-occupier expenditures from Income and Expenditure Survey 1993, unpublished; 2001: SOEP, wave R (2001); calculations based on above. Notes: 1 - Calculated at the official exchange rate of DM1.95583 = �1 2001 figures for owner-occupiers include mortgage payments, heating, maintenance and management; Numbers in parentheses exclude maintenance and management. 2001 figures for tenants include rent, heating, and hot water
Table 4: Relative expenditures on housing (owner-occupation = 100%)
Young Entrant Mid-Life
1988 2001 1988 2001
Social tenant N/A 75 N/A 50
Private tenant 39 84 56 57Source: Authors' calculations
Figures for average house price and down payment were unavailable. In 2001, the average
mortgage payment for a Young Entrant household was �196 per month (SOEP, wave R, 2001),
while the average for a Mid-Life household was �577 per month. The effective interest rate for a
ten-year mortgage was in the range of 4.8 to 5.6%.
Mortgage system
Mortgage banks and savings banks together account for over half of outstanding loans. The loan-
to-value ratio of Hypothekenbanken first-loan mortgages is limited by law to 60%, because they
are funded by low-cost covered bonds (Pfandbriefe), which are traded on the secondary market
as no-risk assets. The average LTV for non-Pfandbriefe backed loans is 70-80%.
Some nine per cent of German mortgage lending is accounted for by Bauparkassen loans, which
carry a lower interest rate than conventional mortgages (although recent falls in market rates have
meant that these differentials have narrowed or even been reversed). The Bauspar system is a
closed system, in which savers contract for a certain saving period (normally seven years) before
Bauspar loan is granted. It achieves a high turnover rate of means by quick repayment, so

International trends in housing tenure and mortgage finance
November 2004 95
although the interest rate is fixed and may be low compared to market rates, the repayment rate
of the loan is high and borrowers are affected by liquidity constraints. About 80% of new
mortgages have a five- to fifteen-year period of fixed interest, which is then renegotiated. The
typical term is 20-30 years.
Taxes, subsidies and regulations
Home-ownership
Housing is treated as a consumption good in Germany. Owner-occupiers and landlords are not
taxed on capital gains as long as the property has been owned for more than ten years (increased
from two in 1998), but they receive no tax relief on mortgage payments. They may deduct a
percentage of the house price from their taxable income for the first eight years as depreciation,
subject to certain limits. One-time taxes include a transactions tax of 3.5% of value.
The Eigenheimzulage grant scheme was introduced in 1996, replacing a depreciation allowance.
The grant is paid to first-time buyers during the first eight years after purchase, and amounts to
�1,250 per year for new construction or for purchase of an existing dwelling. In addition, family
grants of �800 per year, per child, are paid over the same period. The income ceiling is generous
(�70,000 in two years for single people, and �140,000 for married couples, plus �30,000 per
child), and a large majority of home-buyers are therefore eligible. Experts regard the scheme as
too expensive and not well targeted. The amount payable under the programme and income
ceiling were cut in December 2003 by 30%, effective 2004. (The figures above reflect the new
arrangements.)
Individual German states also have programmes to subsidise home-ownership, see box below.
Ten German states support home-ownership within the scope of publicly assisted housing
(Eigenheimforderung im Rahmen des Sozialen Wohnungsbaus). In contrast to the allowance for
home-ownership and building society funding � there is no right to this kind of subsidy.
Individual decisions by state authorities prevail in cases where applications meet all
requirements. Depending on the policy and cash balance of each state, several programmes
based upon the second housing act � are offered. In principle, long-term loans with interest
rates below the market level are given as well as short-term loans for first-time buyers. Both
have the effect of decreasing monthly mortgage repayments. Eligibility is dependent upon
household size and income (Pfau, 2003, p107).
Rent controls
Rents are freely negotiated at the time when a household rents a dwelling. After that, however,
rent controls apply which are linked to rent levels in comparable dwellings, which are determined

CML Research
96 November 2004
by the sheer weight of existing tenancies rather than by the relatively small number of current
market transactions. This means that overall rent levels lag way behind current market rents
(Ball 2003 p. 55).
Private landlords may deduct their costs from taxable income, and may set losses from housing
against income from other sources. Different depreciation rates apply for new and old buildings;
landlords can choose straight-line or accelerated depreciation. Until 1998 depreciation rules for
private rental housing in eastern Germany were particularly generous, but the allowances
(Sonderabschreibungen) have now been reduced. The minimum holding period, after which
sales of such properties are free of capital-gains tax, has been increased from two to ten years.
Owner-occupiers and tenants alike are eligible to receive housing allowance if their income falls
below a certain level. This assistance is tenure neutral.
Risk reduction
Mortgages for first-time buyers can be combined with life insurance; households can also take
out private insurance against disability. German banks minimise risk in residential lending
through prudent valuation. Also, loan-to-value ratios are low. Pre-payment fees are imposed for
early payment of mortgages. These are determined by calculating the market cost to the bank of
breaking the mortgage contract. In 1996 the government introduced guarantees of mortgage
payments for low-income households in former East Germany only.
References
Information provided by H. Tomann
Ball, Michael (2003) RICS European Housing Review 2003 RICS, London
EMF (2003) Hypostat 1992-2002 European Mortgage Federation, Brussels
Freeman A, Holmans A, and Whitehead CME (1996) Is the UK Different? International
Comparisons of Tenure Patterns Council of Mortgage Lenders, London
Mercer Oliver Wyman (2003) Study on the Financial Integration of European Mortgage
Markets, European Mortgage Federation, Brussels.
Miles D. (2003) The UK Mortgage Market: Taking a Longer-Term View � Interim Report
HMSO, London.
Pfau J. (2003) 'Germany', in Globalisation and Home-ownership (Doling, J. and Ford, J., eds);
Delft University Press, Delft.
Expert Commission on Housing (1994) Report to the Federal Government, 1994, Chapter 7

International trends in housing tenure and mortgage finance
November 2004 97
Greece
Tenure
Owner-occupation is the overwhelming tenure in Greece, with a figure of 80% commonly
quoted. This is up from about 76% ten years ago. Provisional data from the 2001 census put the
percentage as high as 83%, although the numbers on which this figure is based apparently do not
include immigrants (approximately 700,000 currently reside in Greece). There is virtually no
social rented sector in Greece any longer; ownership of almost all social rented dwellings was
transferred to their tenants in the 1990s.
Table1: Households by tenure, 2001, %
All households
Owner-occupation 80
Social renting 0
Private renting 20
Other 0Source: Economic and Market Analysis, National Bank of Greece, June/July 2003
Most owner-occupiers are outright owners. Reliable figures are not available, but experts
estimate that only about 25% of all households acquired their property with a mortgage � the
lowest rate in Europe. Until recently interest rates were very high, and buyers relied on help
from their families rather than bank loans. Traditionally, owner-occupiers would build their own
houses on plots of land, and live in them for the rest of their lives. This is still how a third of
owner-occupiers acquire their properties � more outside big cities.
There are no data that would allow us to look at the tenure split for Young Entrant and Mid-Life
households. The average age of the first-time buyer in Greece is significantly higher than our
Young Entrant household; according to the National Bank of Greece, the average age of
applicants for housing loans is between 40 and 45, and the typical first-time buyer household
would have two adults plus one or two children.
Housing costs
The only available on housing costs in Greece are estimates that refer to owner-occupiers as a
whole, not specifically to Young Entrant or Mid-Life. The average house price is �100,000, and
the average mortgage payment is �450/month. House prices in urban areas rose 15% in 2001 and
13% in 2002 (Hypostat, 2002), but figures for the first half of 2003 show that price inflation has
slowed to 4.5%.

CML Research
98 November 2004
Mortgage system
Greece is one of the few countries in Europe without specialised mortgage credit institutions,
although this is a relatively recent development. Ten years ago there were three institutions
through which the government-channelled mortgage-interest subsides, and for that reason they
dominated the mortgage market. In the 1990s the rules were changed so that any bank could
offer subsidised loans. In consecutive mergers in 1997 and 1998, two of the mortgage banks, the
National Housing Bank and the National Mortgage Bank, merged with the National Bank of
Greece. Aspis Bank, the last remaining mortgage bank, changed its status to commercial in
2001. Commercial banks have 67% of the mortgage market; the remainder is covered by
specialised credit institutions that cater for public-sector employees.
The typical mortgage in Greece is a repayment mortgage with a 15-year term. There are
generally penalties for prepayment. There has recently been a spate of innovation in the Greek
mortgage market, including the introduction of mortgages with a one-year low fixed rate, which
then reverts to variable; 30-year mortgages; and Euribor trackers. The current average gross
interest rate on a mortgage is 5.5%, down from around 15% in 1998. Some banks offer slightly
lower interest rates on mortgage loans to buyers who have held a savings account for at least six
months before taking out the loan. The fall in mortgage interest rates and the diversity of
products on offer have contributed to a huge increase in mortgage finance, with loan volumes
increasing at a rate of over 30% over the past four years as owner-occupiers take out mortgages
to cover renovation, etc.
Estimates are that on average, mortgages cover 55% of the market value of the house.
Affordability is calculated on the basis of repayments of 40% of family income. Most banks will
lend a maximum of 75%. Loan-to-value ratios are low compared to other European countries,
partly because purchasers pay a housing sales tax based on the "objective value" of the dwelling.
This "objective value" figure is entered in the sales contract, although the market value (and real
selling price) is generally 30-40% higher. Because banks cannot lend more than 100% of the
value on the contract, this limits LTVs. "Bank of Greece research shows that borrowing is
concentrated among the richest households and that the outstanding balance does not exceed
annual income, even in the lowest income brackets." (Hypostat, 2002).
Taxes and subsidies
Home-ownership
In Greece home-ownership is treated as an investment good, with taxation of imputed rental
income for properties of a certain size (which depends on the size of the family, but in general

International trends in housing tenure and mortgage finance
November 2004 99
only affects very large houses). At the same time, however, there is tax relief on mortgage
interest�15% of the interest paid annually is deducted from the homeowner's total tax bill. In
2002 the full relief was limited to houses not exceeding 120 m2 (1,292 square feet); for larger
properties the amount deducted is 15% of that fraction of the interest that corresponds to 120 m2
of the house. Capital gains tax was introduced in the early nineties for individuals but
subsequently changed, and now applies only to the sale of property by companies.
Interest subsidy for first-time buyers
There are two types of interest-rate subsidy for first-time buyers. Every individual or family is
entitled to a "single" subsidy, provided their annual family income and house purchase price are
below certain thresholds (which depend on family size). Subsidies on the loan interest range
from 18% for unmarried people to 44% for families with four or more children, and are given for
7.5 years for 15-year loans or eight years for loans with a longer term.
"Double" subsidies are given by the state and the Organisation for Social Housing (OEK), which
has an annual quota of beneficiaries. OEK subsidies range from 34% for unmarried people to
56% for families with four or more children; these subsidies are only available for the first nine
years of 15-year loans.
Five years ago, when interest rates were high, subsidised loans accounted for about 70% of the
mortgage market; now the figure is less than 20% and experts say that such loans are generally
only worthwhile for families with more than two children.
Minority groups such as gypsies and repatriated Greeks from former Communist countries
benefit from special loan subsidies of 80-100%, as do victims of natural disasters.
Purchasers pay a sales tax of 9% to 11% of the "objective value" of the dwelling. First-time
buyers are exempt from this tax on the first �15,000 in value. Property taxes are very low.
Rental property
Rental property is treated as an investment good, as in most countries. Rental property is taxed,
and capital gains tax is payable when it is sold. For tenants, the government provides income-
related housing allowances and tax relief for renting households. Rent paid can be deducted from
taxable income up to Euros 750 annually per family, plus a similar sum per child studying at a
Greek university in another town. On balance, tax relief on interest paid by owner-occupiers is
probably on average greater than the tax relief provided for renters.

CML Research
100 November 2004
Risk reduction
Experts say that loans are performing better in the last few years than previously, largely because
of the downward trend in interest rates. Lenders require owner-occupiers to insure against
earthquakes and fire, but all other forms of insurance are optional.
The following categories of loan are covered by a state guarantee for the duration of the loan:
loans of up to �60,000 to repatriated Greeks from the former Soviet Union; loans of up to
�60,000 to Gypsies, and loans to victims of natural disasters.
References
Information provided by D. Frangopoulos
Ball, Michael (2003) RICS European Housing Review 2003 RICS, London
EMF(2003)Country fact sheet 2002 European Mortgage Federation, Brussels
EMF (2002) Hypostat European Mortgage Federation, Brussels

International trends in housing tenure and mortgage finance
November 2004 101
Hungary
Tenure
In Hungary housing was privatised between 1989 and 1997. During this period 15-20% of the
housing stock moved from state ownership (which previously owned 25% of dwellings) to the
owner-occupied sector. This change was most important in urban areas, where privatisation
caused a dramatic change in the tenure structure. The privatisation was basically a give-away,
where households paid prices of only 10-15% of market value. As a consequence, in 2000 the
estimated share of the rental sector was eight per cent, of which five per cent was public. By
2003 this had fallen still further, to 3.9%. In the period between 1996 and 2003, 36% of
purchases or construction of dwellings were partly financed by loans, while 65% used no loan.
Because of the recent housing privatisation, even Young Entrant households are very likely to be
owner-occupiers � some 95% of Young Entrant households fall into this category. It should be
noted, though, that in Hungary people live with their parents for longer than is the norm in the
West � the average age upon forming an independent household is 24 years old. The Young
Entrant tenure figures in Table 1 show only the tenures of those young people already living in
their own households; they do not reflect the tenure of those still living with parents.
Table 1: Households by tenure 2003, %
All households Young Entrant1 Mid-Life2
Owner-occupation 92 95 96
Social renting 4 3 3
Private renting 3 3 1
Other 1Source: Central Statistical Office Housing Survey 2003 (unpublished in this form) Notes: 1 - Household whose head is aged between 18 and 35, individual or couple; 2 - Couples with children where the head of household is aged between 36 and 50. Housing mobility is generally low in Hungary. Of Young Entrant households, 32% moved in the
seven years up to 2003; this is higher than the overall rate of 20%. Currently the share of the
rental sector in the Hungarian housing market is tiny. The government has launched a
programme to try to increase the size of the public rented sector, but it has had little effect so far.
Housing costs
Young Entrant households enjoy an average income of �558/month, 10% higher than the overall
average. Young Entrant owner-occupiers spend about 20% of their household income on
housing (which includes electricity, gas, water, maintenance, heating, garbage collection, and

CML Research
102 November 2004
insurance, as well as payments on housing loans).
Mid-Life households have an average income of �708/month, 33% higher than the overall
average. In 90% of these households the head of household is an active earner. As Table 2
shows, average expenditures on housing vary little by tenure. Data were not available for Young
Entrant renters, but data for Mid-Life renters show that social tenants pay a little less than owner-
occupiers, while private tenants pay slightly more�but the differences are small.
Table 2: Actual expenditures on housing, Euros / month
Young Entrant Mid-Life
Owner-occupier 114 114
Social tenant n.a. 108
Private tenant n.a. 118Source: Housing Survey 2003 Note: Figures include mortgage and rent payments, heat, utilities, maintenance, garbage collection & insurance Table 3: Relative expenditure on housing (owner-occupation = 100)
Young Entrant Mid-Life
Social tenant n.a. 95
Private tenant n.a. 104Source: Authors'calculations
The average price paid by a current Young Entrant owner-occupier for his dwelling was �30,000
to �35,000, while Mid-Life owner-occupiers paid �42,000 to �46,000. Prices have been rising
though, and those who have moved in the last few years have paid more � the current overall
average price is estimated at around �50,000.
Table 4: Housing costs for owner-occupiers in 2003, Euros
Young Entrant Mid-Life
Average house price 32,000 � 35,000 42,000 � 46,000Average down payment on a mortgage 20,000 � 25,000 20,000 � 25,000
Average mortgage payment 800 � 850/month 800 � 850/monthSource: Experts' estimates
Mortgage system
The mortgage market continues to be dominated by the National Savings and Commercial Bank,
the country's largest financial institution, which has over half of the mortgage market. Loan
International trends in housing tenure and mortgage finance
November 2004 103
terms are generally short (under 10 years), as nominal interest rates are high. The maximum
loan-to-value ratio is 70%.
Taxes and subsidies
Mortgage interest tax relief was introduced in 1994. Some 20% of the total mortgage payment
(amortisation plus interest) could be deducted from personal income tax payable, up to a limit of
35,000 forints/year (245 forints = �1). Only mortgages for new construction were eligible. In
2001 the amount deductible was increased to 40% of total mortgage payments, up to a total of
240,000 forints. In 2002, eligibility was widened to include mortgages on existing properties.
In 1996, the government introduced a scheme to subsidise contract savings, modelled on the
German Bausparen scheme. This replaced a tax allowance for housing savings that started in
1988. The subsidy was 30% of the amount saved, which was added annually to the saver's
account, up to a maximum of 36,000 forints (�147) per year. The ceiling was increased in 2002
to 72,000 forints (�294). Savings must be used for housing purposes, and each household
member is allowed to have a separate account. The total amount of savings contracts stood at
about 787,000 in 2001, and the size of the average contract was 671,000 forints (�2,739).
Risk reduction
For borrowers in receipt of housing construction subsidies, the state guarantees up to 80% of the
amount of new construction loans. Only families with children are eligible for the subsidies (and
thus for the loan guarantee). The cost of this is met from the budget.
References
Information provided by J. Hegedus
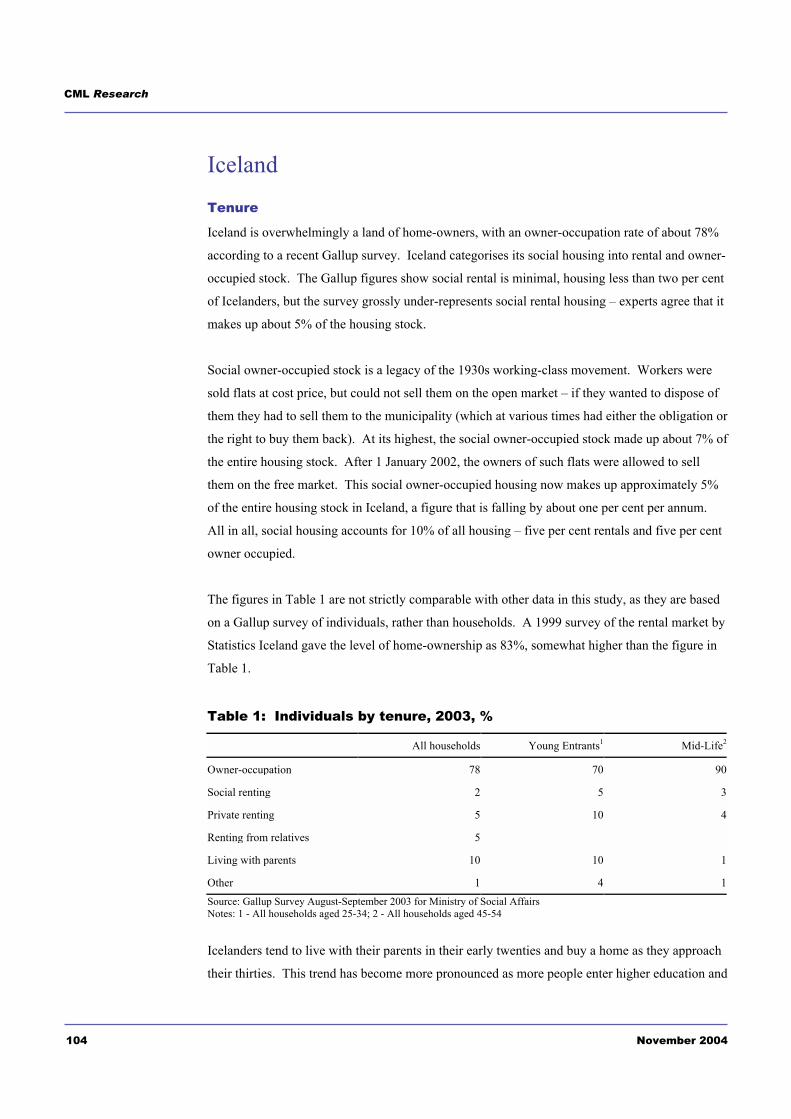
CML Research
104 November 2004
Iceland
Tenure
Iceland is overwhelmingly a land of home-owners, with an owner-occupation rate of about 78%
according to a recent Gallup survey. Iceland categorises its social housing into rental and owner-
occupied stock. The Gallup figures show social rental is minimal, housing less than two per cent
of Icelanders, but the survey grossly under-represents social rental housing � experts agree that it
makes up about 5% of the housing stock.
Social owner-occupied stock is a legacy of the 1930s working-class movement. Workers were
sold flats at cost price, but could not sell them on the open market � if they wanted to dispose of
them they had to sell them to the municipality (which at various times had either the obligation or
the right to buy them back). At its highest, the social owner-occupied stock made up about 7% of
the entire housing stock. After 1 January 2002, the owners of such flats were allowed to sell
them on the free market. This social owner-occupied housing now makes up approximately 5%
of the entire housing stock in Iceland, a figure that is falling by about one per cent per annum.
All in all, social housing accounts for 10% of all housing � five per cent rentals and five per cent
owner occupied.
The figures in Table 1 are not strictly comparable with other data in this study, as they are based
on a Gallup survey of individuals, rather than households. A 1999 survey of the rental market by
Statistics Iceland gave the level of home-ownership as 83%, somewhat higher than the figure in
Table 1.
Table 1: Individuals by tenure, 2003, %
All households Young Entrants1 Mid-Life2
Owner-occupation 78 70 90
Social renting 2 5 3
Private renting 5 10 4
Renting from relatives 5
Living with parents 10 10 1
Other 1 4 1Source: Gallup Survey August-September 2003 for Ministry of Social Affairs Notes: 1 - All households aged 25-34; 2 - All households aged 45-54
Icelanders tend to live with their parents in their early twenties and buy a home as they approach
their thirties. This trend has become more pronounced as more people enter higher education and
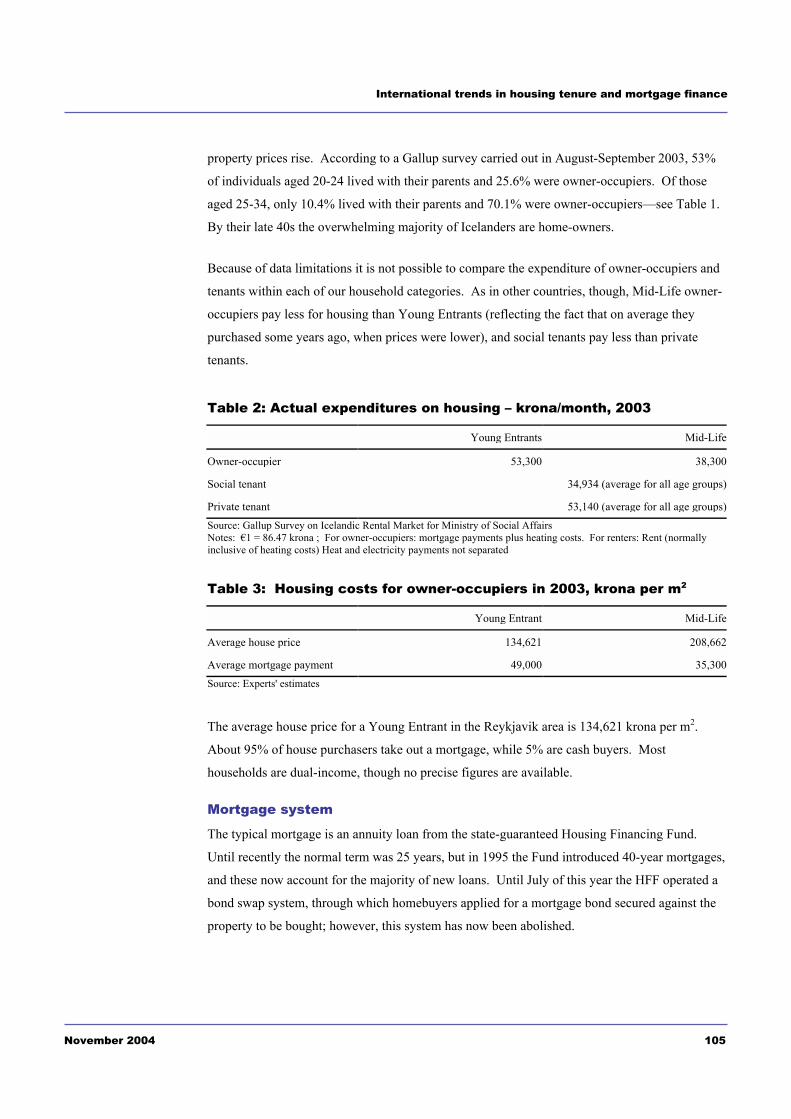
International trends in housing tenure and mortgage finance
November 2004 105
property prices rise. According to a Gallup survey carried out in August-September 2003, 53%
of individuals aged 20-24 lived with their parents and 25.6% were owner-occupiers. Of those
aged 25-34, only 10.4% lived with their parents and 70.1% were owner-occupiers�see Table 1.
By their late 40s the overwhelming majority of Icelanders are home-owners.
Because of data limitations it is not possible to compare the expenditure of owner-occupiers and
tenants within each of our household categories. As in other countries, though, Mid-Life owner-
occupiers pay less for housing than Young Entrants (reflecting the fact that on average they
purchased some years ago, when prices were lower), and social tenants pay less than private
tenants.
Table 2: Actual expenditures on housing � krona/month, 2003
Young Entrants Mid-Life
Owner-occupier 53,300 38,300
Social tenant 34,934 (average for all age groups)
Private tenant 53,140 (average for all age groups)Source: Gallup Survey on Icelandic Rental Market for Ministry of Social Affairs Notes: �1 = 86.47 krona ; For owner-occupiers: mortgage payments plus heating costs. For renters: Rent (normally inclusive of heating costs) Heat and electricity payments not separated
Table 3: Housing costs for owner-occupiers in 2003, krona per m2
Young Entrant Mid-Life
Average house price 134,621 208,662
Average mortgage payment 49,000 35,300Source: Experts' estimates
The average house price for a Young Entrant in the Reykjavik area is 134,621 krona per m2.
About 95% of house purchasers take out a mortgage, while 5% are cash buyers. Most
households are dual-income, though no precise figures are available.
Mortgage system
The typical mortgage is an annuity loan from the state-guaranteed Housing Financing Fund.
Until recently the normal term was 25 years, but in 1995 the Fund introduced 40-year mortgages,
and these now account for the majority of new loans. Until July of this year the HFF operated a
bond swap system, through which homebuyers applied for a mortgage bond secured against the
property to be bought; however, this system has now been abolished.

CML Research
106 November 2004
The HFF loans up to 70% of purchase price for first-time buyers and 65% for subsequent
purchases. Under a separate programme the HFF will lend up to 90% LTV to low-income
families. The maximum loan amount is ISK 8 million for older housing and ISK 9 million for
new housing. Purchasers who need to borrow more than these amounts (which would not be
enough to finance a house in Reykjavik) get top-up loans from banks. Pension funds also lend to
their members.
The current government has pledged to increase HFF maximum loan amounts. However, EFTA
competition authorities are currently scrutinising the domination of the mortgage market by the
HFF, and are expected to report in late 2004. If the report concludes that HFF practices are anti-
competitive, the entire system will need to be reformed. As of end-2003, Icelandic government
institutions (the HKK and the Student Loan fund) accounted for 60% of the loan market to
individuals.
Most mortgages are indexed, generally against the consumer price index. The average interest
rate on a Housing Fund mortgage is currently 5.1% plus inflation, while pension fund mortgages
are more expensive at 6.1% plus inflation. Although interest rates have fallen, they are high by
international standards, and the purchaser has to bear the inflation risk. However, the extremely
generous tax treatment of mortgage interest (see below) means that interest costs are effectively
capped at six per cent of household income. Nominal interest rates are thus to some extent
irrelevant�economists estimate that effective after-tax interest rates are only three to four per
cent.
In early 2004 all the Icelandic banks introduced a new mortgage product, denominated in a
basket of foreign currencies.
House prices have soared in Iceland in the last five years, but the increased length of mortgages
and lower interest rates for top-up bank loans have partly offset this rise, so that owner-occupiers'
housing expenditure is largely unchanged. However, first-time buyers do have problems
accumulating a down payment in this high-cost housing market.
Taxes and subsidies
Through its tax treatment of mortgage interest payments, the Icelandic government basically pays
all interest over six per cent of household income. Owner-occupiers list housing-loan interest on
their tax returns, and from this amount deduct six per cent of total family income. If the result is
positive (that is, if the amount of interest paid is greater than six per cent of household income),
the Icelandic tax authorities send the household a cheque for this amount at the end of the tax

International trends in housing tenure and mortgage finance
November 2004 107
year. This very generous tax treatment encourages borrowing, and means that nominal interest
rates are not very meaningful.
Sales of owner-occupied properties are free from capital gains tax after two years of ownership.
The state gives an implicit interest-rate subsidy through its mortgage guarantee system.
Improvement grants are available for older houses. There was a programme for subsidising
house-purchase savings, but this was recently abolished.
In the rental market, landlords are taxed on the income from rental property. Private landlords
cannot claim depreciation, but social landlords can. Housing benefit for renters is assessed with
regard to the claimant's income and assets.
Risk reduction
The State Housing Fund guarantees mortgages; the default rate is very low. In early 2004 the
main banks introduced mortgage insurance. A fairly comprehensive government-run assistance
programme for home-buyers in distress operated from 1985 to 1999, when it was replaced with a
government-run advisory bureau which helps people re-schedule their debts in co-operation with
the banks and the Housing Financing Fund.
References
Information provided by J R Sveinsson and M A Skulason
Housing Financing Fund website: www.ils.is
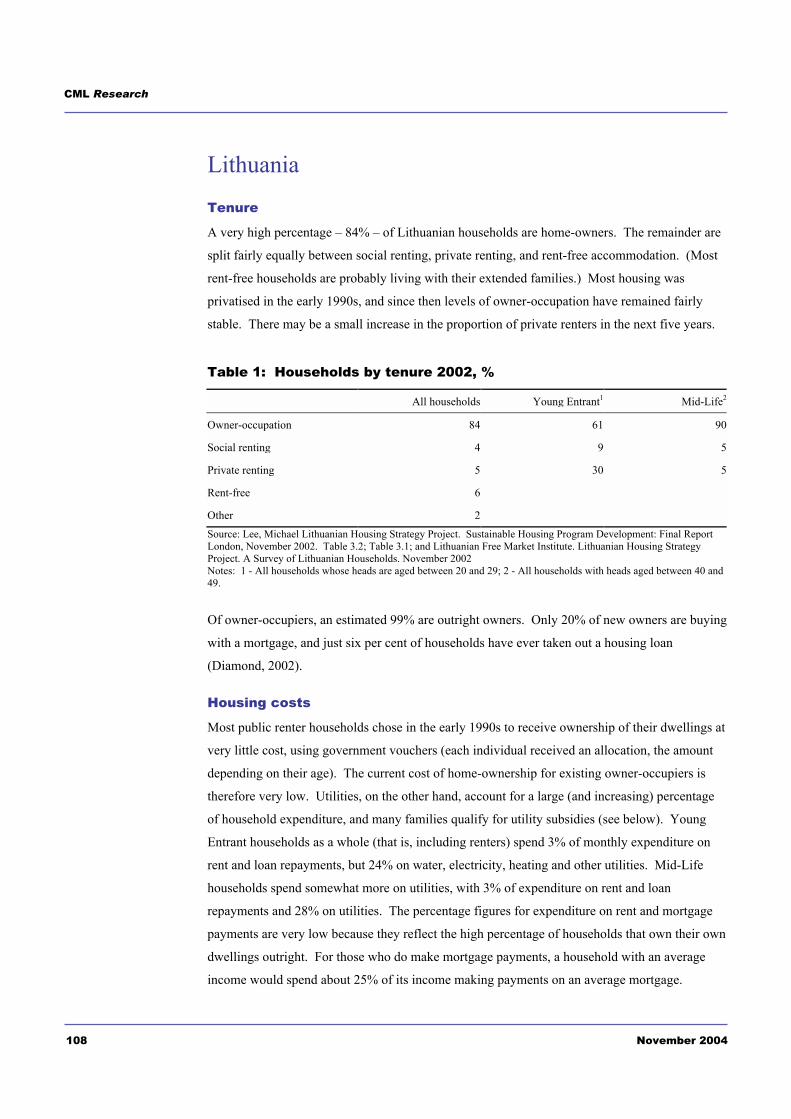
CML Research
108 November 2004
Lithuania
Tenure
A very high percentage � 84% � of Lithuanian households are home-owners. The remainder are
split fairly equally between social renting, private renting, and rent-free accommodation. (Most
rent-free households are probably living with their extended families.) Most housing was
privatised in the early 1990s, and since then levels of owner-occupation have remained fairly
stable. There may be a small increase in the proportion of private renters in the next five years.
Table 1: Households by tenure 2002, %
All households Young Entrant1 Mid-Life2
Owner-occupation 84 61 90
Social renting 4 9 5
Private renting 5 30 5
Rent-free 6
Other 2Source: Lee, Michael Lithuanian Housing Strategy Project. Sustainable Housing Program Development: Final Report London, November 2002. Table 3.2; Table 3.1; and Lithuanian Free Market Institute. Lithuanian Housing Strategy Project. A Survey of Lithuanian Households. November 2002 Notes: 1 - All households whose heads are aged between 20 and 29; 2 - All households with heads aged between 40 and 49.
Of owner-occupiers, an estimated 99% are outright owners. Only 20% of new owners are buying
with a mortgage, and just six per cent of households have ever taken out a housing loan
(Diamond, 2002).
Housing costs
Most public renter households chose in the early 1990s to receive ownership of their dwellings at
very little cost, using government vouchers (each individual received an allocation, the amount
depending on their age). The current cost of home-ownership for existing owner-occupiers is
therefore very low. Utilities, on the other hand, account for a large (and increasing) percentage
of household expenditure, and many families qualify for utility subsidies (see below). Young
Entrant households as a whole (that is, including renters) spend 3% of monthly expenditure on
rent and loan repayments, but 24% on water, electricity, heating and other utilities. Mid-Life
households spend somewhat more on utilities, with 3% of expenditure on rent and loan
repayments and 28% on utilities. The percentage figures for expenditure on rent and mortgage
payments are very low because they reflect the high percentage of households that own their own
dwellings outright. For those who do make mortgage payments, a household with an average
income would spend about 25% of its income making payments on an average mortgage.
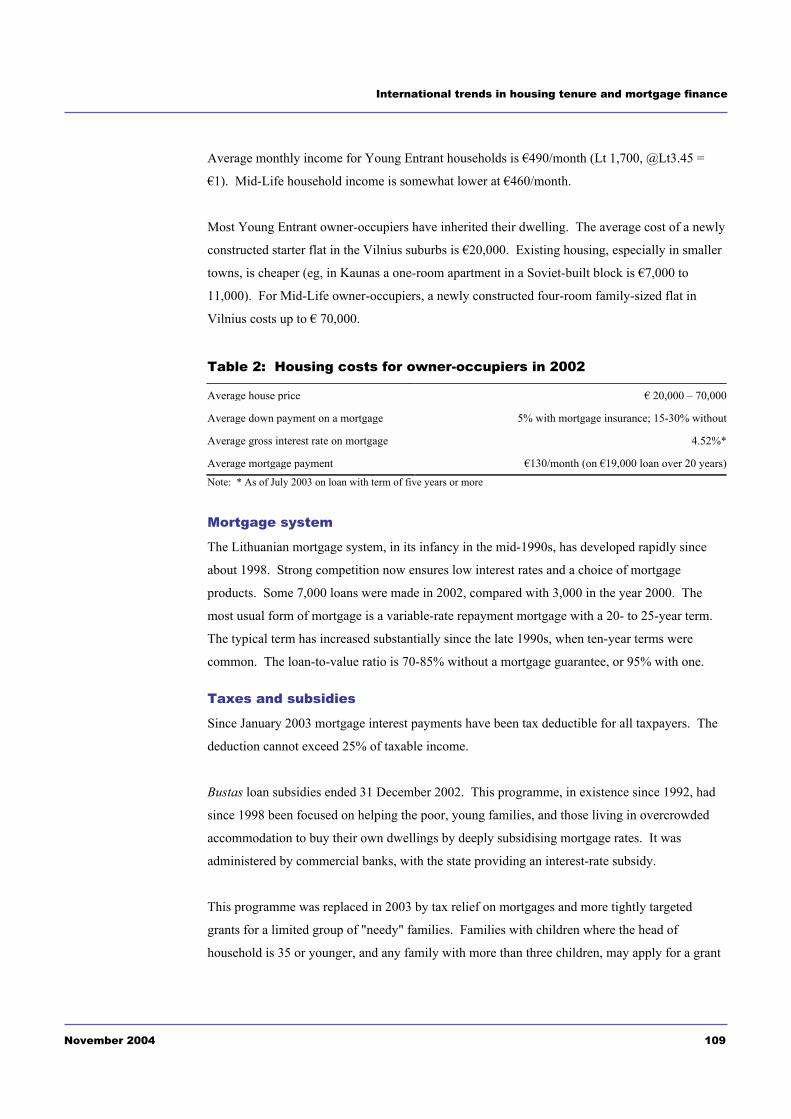
International trends in housing tenure and mortgage finance
November 2004 109
Average monthly income for Young Entrant households is �490/month (Lt 1,700, @Lt3.45 =
�1). Mid-Life household income is somewhat lower at �460/month.
Most Young Entrant owner-occupiers have inherited their dwelling. The average cost of a newly
constructed starter flat in the Vilnius suburbs is �20,000. Existing housing, especially in smaller
towns, is cheaper (eg, in Kaunas a one-room apartment in a Soviet-built block is �7,000 to
11,000). For Mid-Life owner-occupiers, a newly constructed four-room family-sized flat in
Vilnius costs up to � 70,000.
Table 2: Housing costs for owner-occupiers in 2002
Average house price � 20,000 � 70,000
Average down payment on a mortgage 5% with mortgage insurance; 15-30% without
Average gross interest rate on mortgage 4.52%*
Average mortgage payment �130/month (on �19,000 loan over 20 years)Note: * As of July 2003 on loan with term of five years or more
Mortgage system
The Lithuanian mortgage system, in its infancy in the mid-1990s, has developed rapidly since
about 1998. Strong competition now ensures low interest rates and a choice of mortgage
products. Some 7,000 loans were made in 2002, compared with 3,000 in the year 2000. The
most usual form of mortgage is a variable-rate repayment mortgage with a 20- to 25-year term.
The typical term has increased substantially since the late 1990s, when ten-year terms were
common. The loan-to-value ratio is 70-85% without a mortgage guarantee, or 95% with one.
Taxes and subsidies
Since January 2003 mortgage interest payments have been tax deductible for all taxpayers. The
deduction cannot exceed 25% of taxable income.
Bustas loan subsidies ended 31 December 2002. This programme, in existence since 1992, had
since 1998 been focused on helping the poor, young families, and those living in overcrowded
accommodation to buy their own dwellings by deeply subsidising mortgage rates. It was
administered by commercial banks, with the state providing an interest-rate subsidy.
This programme was replaced in 2003 by tax relief on mortgages and more tightly targeted
grants for a limited group of "needy" families. Families with children where the head of
household is 35 or younger, and any family with more than three children, may apply for a grant

CML Research
110 November 2004
that covers 10% of the mortgage principal. Orphans up to 35 years old and certain disabled
people qualify for a 20% grant. Certain income and house-price restrictions apply.
Improvement loans and grants for owners were introduced as a component of the World Bank-
funded Energy Efficiency for Housing Pilot Project in 1997. These were given to homeowner
associations for the improvement of space heating of multi-family apartment buildings.
Members of such associations tend to have higher incomes and live in better quality
accommodation than non-members.
Because the main component of housing cost for most Lithuanians is utility payments, the
extensive Utilities Compensation programme can be seen as a form of housing allowance.
It subsidises the cost of heat, hot water, cold water, and sewage, and is one of two main means-
tested benefit programs available to low-income households. The UC program is large and
expensive. About 13.5% of the country's population (470,100 people) benefited from the UC
program in 2001 � One of the oft-mentioned criticisms of the UC program is that the benefit is
structured in a way that discourages conservation for consumption up to, but not exceeding, the
established norms. A household must pay the full price of any consumption beyond the norms,
but as long as it does not exceed the norms, it only pays a fixed share of its income regardless of
how much it consumes (Urban Institute and Lithuanian Free Market Institute, 2002).
Problems accessing housing
Affordability is low for first-time buyers, the supply of affordable housing is heavily constrained,
and the housing market itself is relatively newly established outside the capital.
Risk reduction
Mortgage insurance is available through the Lithuania Mortgage Insurance Company (LMIC).
"LMIC is government-owned� but is operated on a commercial basis without government
guarantees. The insurance covers a variety of losses including: up to 25 per cent of the principal;
up to four months of lost interest; and the cost of property insurance, the appraisal, and the
financed portion of the insurance premium. The main goal of the insurance is to improve
housing affordability by making low down payments possible (as low as five percent instead of
the typical thirty percent demanded by banks). Banks are willing to make loans that they
normally would not consider because some of the risk is shifted to the insurer. Affordability also
improves because most lenders offer an interest rate discount on insured loans. [There is a
subsidy] that covers up to 50% of the MIP.
International trends in housing tenure and mortgage finance
November 2004 111
"The MIP subsidy [has been] available to all borrowers who meet the general criteria for state
housing support (i.e., no previous ownership, or occupy a unit that is overcrowded, dilapidated,
or improperly equipped for the disabled). At the moment it is not clear who among these will be
able to take advantage of the [new] MIP subsidy. The new law introduces maximum income and
property limits for the first time�" (Urban Institute and Lithuanian Free Market Institute , 2002).
Unemployed borrowers are not eligible for benefits to cover mortgage payments outside the
mortgage insurance program.
References
Information provided by M. Lee and E. Kazakevicius
Diamond, D.B. (2002) Lithuanian Housing Strategy Project. Contemplated Programs Project:
Final Report.
Urban Institute and Lithuanian Free Market Institute (2002), Lithuanian Housing Strategy
Project, Program Evaluation and Redevelopment Study Vilnius.

CML Research
112 November 2004
Netherlands
Tenure
The overall level of owner-occupation rose in the Netherlands from 47% in 1993 to 53% in
1998�a rise of nearly six percentage points in only five years. This proportion has been rising
continuously since the end of the Second World War, when only 28% of households were owner-
occupiers. The rise in owner-occupation in the 1990s was matched by a decline in social renting,
partly as a result of the sale of some social rented dwellings. Levels of private renting have
further declined since the 1998 housing needs survey (from which the information in Table 1 is
drawn) to 10% of households.
The tenure pattern for Young Entrant households changed little over the period, but Mid-Life
households were more likely to be in owner-occupation in 1998 (77%) than in 1993 (68%).
Some of the increase in owner-occupation may also be attributed to changes in government
policy towards social housing. The European Mortgage Federation explains:
In the mid 1990s the involvement of the government in social housing decreased � production
subsidies were abolished, housing associations became financially independent, etc. The loss of
production subsidies resulted in a strong increase in the rent for new dwellings. Although rent
subsidies were maintained, it became more expensive to live in new social housing. This
development made it attractive for the middle-income groups to purchase an owner occupied
dwelling (EMF Country factsheets 2002, p.26).
In the Netherlands social renting used to be a viable tenure choice for middle-class households.
Now, though, most such households prefer to buy their own homes, and government policy has
allowed the sale of up to 50,000 housing association units per annum to private owners (although
in fact from 1998 to 2002 not more than 15,000 dwellings annually were sold). Before 1998,
associations sold some of their higher priced stock because of lack of demand by renters. The
top end of the rental market then revived due to high price increases in owner occupied stock,
and more households who normally would buy turned to renting. Because of this increase in
demand, associations became reluctant to sell.
Some 70% of new homes are now destined for owner-occupation; until 1995 this figure was only
about 30%. The social rented sector is shrinking in size as increasingly strict income limits are
imposed and is now becoming the tenure of low-income households. In 1998 the average first-
time buyer was 34 years old. Of first-time buyers, 65% had two incomes, while 35% had one.

International trends in housing tenure and mortgage finance
November 2004 113
Table 1: Households by tenure, %
All households Young Entrant1 Mid-Life2
1993 1998 1993 1998 1993 1998
Owner-occupation 47 53 43 44 68 77
Social renting 40 35 40 41 23 20
Private renting 11 12 15 16 5 3
Shared ownership/equity
Other 1 2 4
Source: 1993: Housing Need Survey 1993/94; 1998: Housing Need Survey 1998; Ministry of Housing and Central Statistics Bureau Notes: 1 - 1993: Couples of average income with no children, where main respondent between 20 and 30 yrs 1998: Households with incomes within 10% of the average, where main respondent between 20 and 30 yrs. 2 - 1993: Couples of average income with children, where the main respondent between 40 and 50 yrs. 1998: Households whose income is within 10% of the average, where the main respondent between 40 and 50 yrs.
Housing costs
In the 1990s, and particularly after 1998, house prices rose sharply in the Netherlands, making it
much harder for Young Entrant households (who made up about 27% of all households in the
1998 housing demand survey) to buy a dwelling. Average dwelling prices in 2000 were 2.5
times the level of 1990. As a result, pressure on the rental market has risen. Social dwellings are
mostly rented to lower income groups; so the private rental market (which is more expensive) is
often the only tenure option for Young Entrant households. As Table 3 shows, owner-occupation
in 1998 was half again as expensive as social or private tenancy, whereas in 1993 the difference
was much smaller. A recent survey (OTB, 2003) showed that of young households (aged 18 to
30) with an above-average income, more than 90% wanted to buy (although many may not
actually do so because of high prices). Parents are increasingly helping their children gain a
foothold in the housing market.
Expenditure figures in Table 2 do not include utility payments, and are net of housing allowance.
Table 2: Actual expenditures on housing, Euros / month
Young Entrant Mid-Life
1993 1998 1993 1998
Owner-occupier 318 424 294 358
Social tenant 256 279 275 339
Private tenant 296 283 366 374Source: 1993: Housing Need Survey 1993/94; 1998: Housing Need Survey 1998; Ministry of Housing and Central Statistics Bureau Note: Figures exclude utilities and do not include housing allowance.

CML Research
114 November 2004
Table 3: Relative expenditures on housing (owner-occupation = 100%)
Young Entrant Mid-Life
1993 1998 1993 1998
Social tenant 81 66 94 95
Private tenant 93 67 125 104Source: Authors' calculations
For Mid-Life households in 1993, the cost of private renting was nearly 25% higher than that of
owner-occupation. By 1998 the difference had narrowed to only four per cent.
Table 4: Housing costs for owner-occupiers in 1998
Young Entrant Mid-Life
Average house price �110,000 �149,000
Average mortgage interest rate 6.3% 6.7%Average mortgage payment (per month) �577 (interest 442; principal 135) �523 (interest 371; principal 152)
Average disposable income (monthly) �1,574 �2,156
Source: Experts' estimates
Mortgage system
Of owner-occupiers, 85% have a mortgage. This rises to about 99% for Young Entrant
households and 95% for Mid-Life owner-occupiers.
Table 5: Type of mortgage in Netherlands, 1998, %
Proportion of mortgages
Linear repayment 8
Annuity 18
Spaar (saving) 35
Life insurance (equity) 15
Interest only 18
Other 6Source: Housing Demand Survey 1998
The typical mortgage term is 30 years. In the past interest rates were generally fixed for five
years but recently, because interest rates are low, buyers prefer a ten-year fixed rate. Purchasers
may choose a fixed rate that lasts up to the full 30 years, however very few choose to do so.
Variable rates are rarely used. In the Netherlands, as in Britain, lenders offer a variety of
International trends in housing tenure and mortgage finance
November 2004 115
mortgage types � the product range is one of the broadest in Europe, reflecting the strong
competition in the mortgage market, see Table 5.
In the 1990s a variety of loan types were developed to take maximum advantage of the fact that
mortgage-interest payments are fully tax deductible in the Netherlands, and most new issuances
are savings or equity mortgages. The savings mortgage, a type introduced about ten years ago,
accounted for about a third of new mortgages in 1998. With such a mortgage, part of the buyer's
monthly payment covers the interest on the loan, and part goes into a fixed-interest savings
account. The interest rate paid on this account is the same as the rate charged on the loan; no tax
is charged on this interest. After 30 years there is enough in the savings account to repay the
mortgage.
A similar mortgage type is the equity-based mortgage, where the second part of the monthly
payment is invested in a stock-market-linked investment vehicle designed to pay off the
mortgage principal after 30 years. It may or may not be associated with life insurance. In 1998
this accounted for 14.5% of mortgages.
Interest-only mortgages are also significant. The borrower pays interest on the mortgage until
the house is sold, when the principal is repaid. Again, this allows borrowers to take maximum
advantage of the tax deductibility of mortgage-interest payments. Mortgage types can be
mixed�for instance, 50% savings mortgage and 50% interest-only.
The average loan-to-value ratio for households with mortgage guarantees (see below) was about
87% over the period 1995-2001, but in the first quarter of 2001 the average LTV for new home-
owners was 104% (Ball, 2003). There are no official or unofficial limits on LTV; mortgages of
over 100% LTV may cover costs such as stamp duty (six per cent), estate agents' fees (three per
cent), and one or two per cent for the notary. Income multiples have risen from about 3.5% in
1995 to about 4.2% in 2002; some banks will lend up to six times gross income. Since the 1990s
lenders have taken into account both incomes of dual-income households.
Taxes and subsidies
Home-owners
In the Netherlands, housing is nominally treated as an investment good, with taxation of imputed
rental income. Such taxation is, however, minimal � the home-owner must add a small
percentage of the value of his home to his taxable income each year (0.3% for houses worth less
than �25,000, rising in steps to 0.8% for houses worth more than �75,000). However, capital
gains from housing, unlike those from other investment goods, are not taxed for owner-occupiers.

CML Research
116 November 2004
This means that housing is favoured relative to other investment goods where capital gains are
taxed.
Mortgage interest is fully deductible at the taxpayer's marginal rate � on average, owner-
occupiers can deduct 35% (maximum 52%). There has recently been some discussion about
modifying this very generous tax treatment of mortgage interest, but making changes to this
system is would be politically unpopular. Tax relief for second homes was abolished in 2001,
and deductibility is limited to a 30-year period.
In addition, there is no tax on capital gains on endowment insurance contracts linked to mortgage
loans. The proceeds from such contracts must be used to repay the mortgage. The exemption is
limited to �121,000 per person.
Recent changes in the tax and subsidy regime include the Wet bevordering eigen Woningbezit
(Law for the Promotion of Home-ownership), passed in 2001. This programme, known as BEW,
is an income-related housing allowance for owner-occupiers which lasts for the full period of the
loan (up to 30 years). Households with income and assets below a certain level (between
�12,225 and �16,275 in income and �19,875 and �36,292 in assets, depending on household size)
can apply. The dwelling price may not exceed �115,000, and the mortgage must be below
�103,000; the mortgage itself must be an annuity or savings mortgage (that is, not equity linked)
with a fixed interest rate for 15 years. Although policymakers were hoping that about 20,000
households would qualify for the subsidy annually, in fact fewer than 1,000 have been granted.
This is in part due to the shortage of suitable properties. In addition, though, there may be a lack
of enthusiasm on the part of the banks--the Dutch Association of Home-owners recently
conducted a survey in which they sent people who would qualify for the subsidy to several
banks. Most banks said they did not know about the subsidy, or offered other types of loans. It
now appears likely that this programme will be abolished, because of these factors and because
other loan types with lower monthly costs, such as interest-only mortgages or investment
vehicles, are more attractive to both banks and customers.
Rental property
Until the early 1990s, central government gave large subsidies for the construction of rental
dwellings (mainly for social rental), as well as annual operating subsidies to reduce rents. In
1992 the government gave a lump-sum compensation to recipients in exchange for the cessation
of such subsidies, paying an estimated �13.5 billion to Dutch housing associations. As part of
this reform package, the housing allowance scheme has been improved.

International trends in housing tenure and mortgage finance
November 2004 117
Problems accessing housing
First-time buyers face a general problem accessing owner-occupation because of the level of
house prices. The problems are larger, of course, for those on single incomes than dual incomes.
More affluent parents may step in to help, either with outright gifts or by providing surety for
loans. Banks have recently begun to promote these options.
Risk reduction
In the Netherlands, according to Mercer Oliver Wyman, prepayment risk can result in
considerable additional cost for lenders. This is because only a proportion of yield maintenance
fees are recovered in practice due to waiving of fees by banks and pressure from consumer
groups accompanied by some consumer-friendly rulings. In addition 15% of the loan may be
repaid without charge each year (by law) and prepayment due to moving home is also exempt
from charge (Mercer Oliver Wyman, 2003, pp. A43-44).
Normally lenders require that the life of the purchasers be insured. Insurance is also available
against loss of income because of accident or sickness, and in the last five years it has been
possible to ensure against loss of employment, but these policies cover only one or two years, not
the full term of the mortgage. Such insurance, particularly against loss of employment, is not
common.
Both lenders and buyers could until 1995 make use of the so-called local authority mortgage
guarantee scheme. This was targeted at dwellings below a certain price limit (approximately the
median house price). Under this scheme, loans held no risk for the financial institution. Their
interest rates could thus be about 20 basis points below the market rate. Any losses from the
scheme were shared equally between local and central government.
National insurance scheme
In 1995, this scheme was replaced by a national insurance scheme known as the National
Mortgage Guarantee (NHG). The NHG is administered by a private non-profit organisation
called the De Stichting Waarborgfonds Eigen-woningbezit (Home-ownership Insurance Fund).
This organisation receives no state subsidy, but central and local governments will provide an
interest-free loan if it gets into financial problems. Representatives of central and local
government meet each year to set conditions for what mortgages they will cover.
The borrower pays 0.3% of the mortgage amount for the NHG guarantee. This money goes into
a fund to meet potential losses. Under its terms, the NHG will pay if the borrower should be
unable to meet interest and repayment obligations. (If the borrower is at fault for defaulting, he
CML Research
118 November 2004
or she then owes this sum to NHG.) Moreover, the borrower receives a discount of 20 to 50
basis points on the market interest rate, because the credit risk for banks of NHG loans is
practically nil. The mortgage supplier provides a top-up mortgage, which covers transaction
costs (about 10% of the sale price). From 2000, only mortgages up to a maximum of f 420,000
(�190,500) were eligible; the purchase price was limited to f 375,000 (�170,200) for existing
buildings or f 388,800 (�176,500) for new dwellings. The mortgage therefore can exceed the
value of the house, because it may cover transactions costs as well.
In addition to indemnifying the lender against default by the borrower, since 1998 the NHG also
insures purchasers against a fall in house prices: if the borrower is forced to sell the house by
long-term illness, unemployment, divorce, etc., the NHG will make up the difference of the debt.
As of 31 December 2003, NHG had a fund of �275m; the value of all loans covered was �50bn.
Figures for all forced sales are not available, but the number of forced sales with a loss was 59 in
2001, 80 in 2002, and 178 in 2003. So far the fund has been able to meet its obligations without
any problem, but its resilience has not been fully tested yet because house prices have been rising
(so few forced sales have resulted in losses) and a strong economy has meant few people have
lost their jobs.
If owner-occupiers get into arrears with their mortgage payments they can get a means-tested
temporary subsidy from the municipality to cover their housing costs. Recipients are obliged to
move within a certain time (generally a year) to cheaper accommodation (normally rented).
References
Information provided by K. Dol
Ball, M. (2003) RICS European Housing Review 2003 RICS, London
Boelhouwer, P. and Neuteboom, P. (2003) 'Netherlands', in Globalisation and Home-ownership
(Doling, J. and Ford, J., eds); Delft University Press, Delft.
EMF (2003) Country fact sheets 2002 European Mortgage Federation, Brussels
EMF(2003)Hypostat 1992-2002 European Mortgage Federation, Brussels
Freeman A, Holmans A, and Whitehead CME (1996) Is the UK Different? International
Comparisons of Tenure Patterns Council of Mortgage Lenders, London
Mercer Oliver Wyman (2003) Study on the Financial Integration of European Mortgage
Markets, European Mortgage Federation, Brussels.
OTB (2003) Homebuyers in Profile 1995 � 2002, OTB Research Institute for Housing, Urban
and Mobility Studies
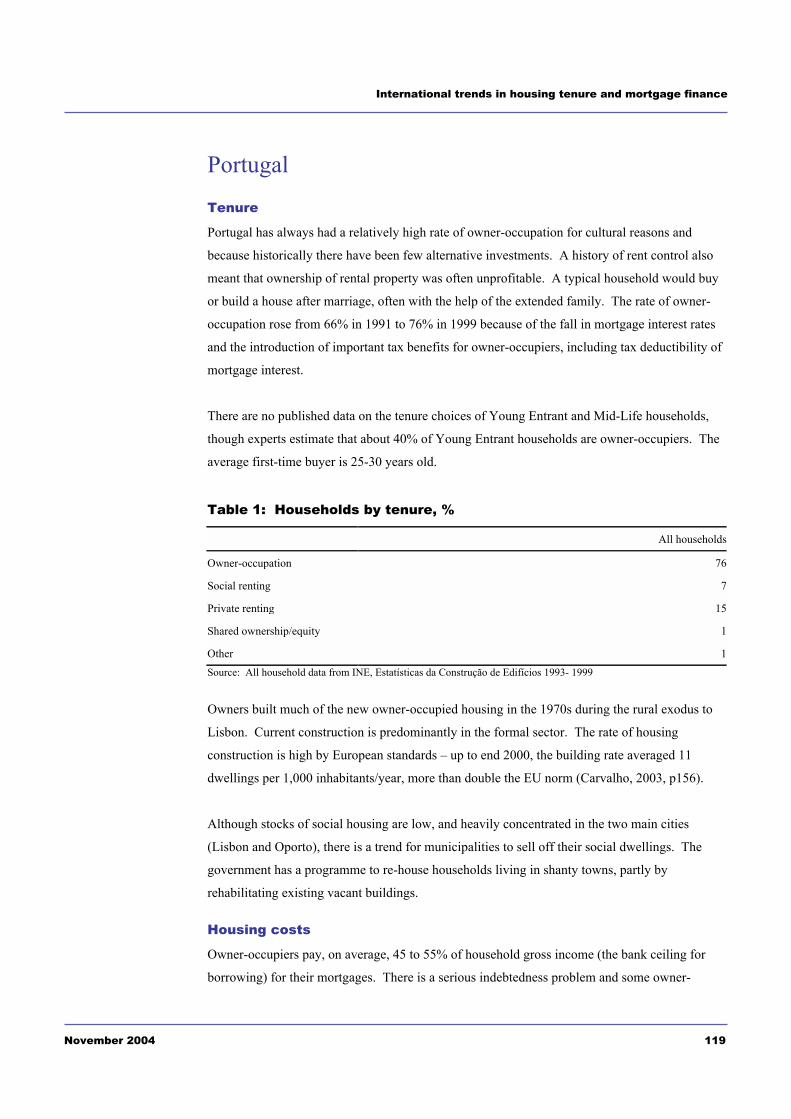
International trends in housing tenure and mortgage finance
November 2004 119
Portugal
Tenure
Portugal has always had a relatively high rate of owner-occupation for cultural reasons and
because historically there have been few alternative investments. A history of rent control also
meant that ownership of rental property was often unprofitable. A typical household would buy
or build a house after marriage, often with the help of the extended family. The rate of owner-
occupation rose from 66% in 1991 to 76% in 1999 because of the fall in mortgage interest rates
and the introduction of important tax benefits for owner-occupiers, including tax deductibility of
mortgage interest.
There are no published data on the tenure choices of Young Entrant and Mid-Life households,
though experts estimate that about 40% of Young Entrant households are owner-occupiers. The
average first-time buyer is 25-30 years old.
Table 1: Households by tenure, %
All households
Owner-occupation 76
Social renting 7
Private renting 15
Shared ownership/equity 1
Other 1Source: All household data from INE, Estatísticas da Construção de Edifícios 1993- 1999
Owners built much of the new owner-occupied housing in the 1970s during the rural exodus to
Lisbon. Current construction is predominantly in the formal sector. The rate of housing
construction is high by European standards � up to end 2000, the building rate averaged 11
dwellings per 1,000 inhabitants/year, more than double the EU norm (Carvalho, 2003, p156).
Although stocks of social housing are low, and heavily concentrated in the two main cities
(Lisbon and Oporto), there is a trend for municipalities to sell off their social dwellings. The
government has a programme to re-house households living in shanty towns, partly by
rehabilitating existing vacant buildings.
Housing costs
Owner-occupiers pay, on average, 45 to 55% of household gross income (the bank ceiling for
borrowing) for their mortgages. There is a serious indebtedness problem and some owner-
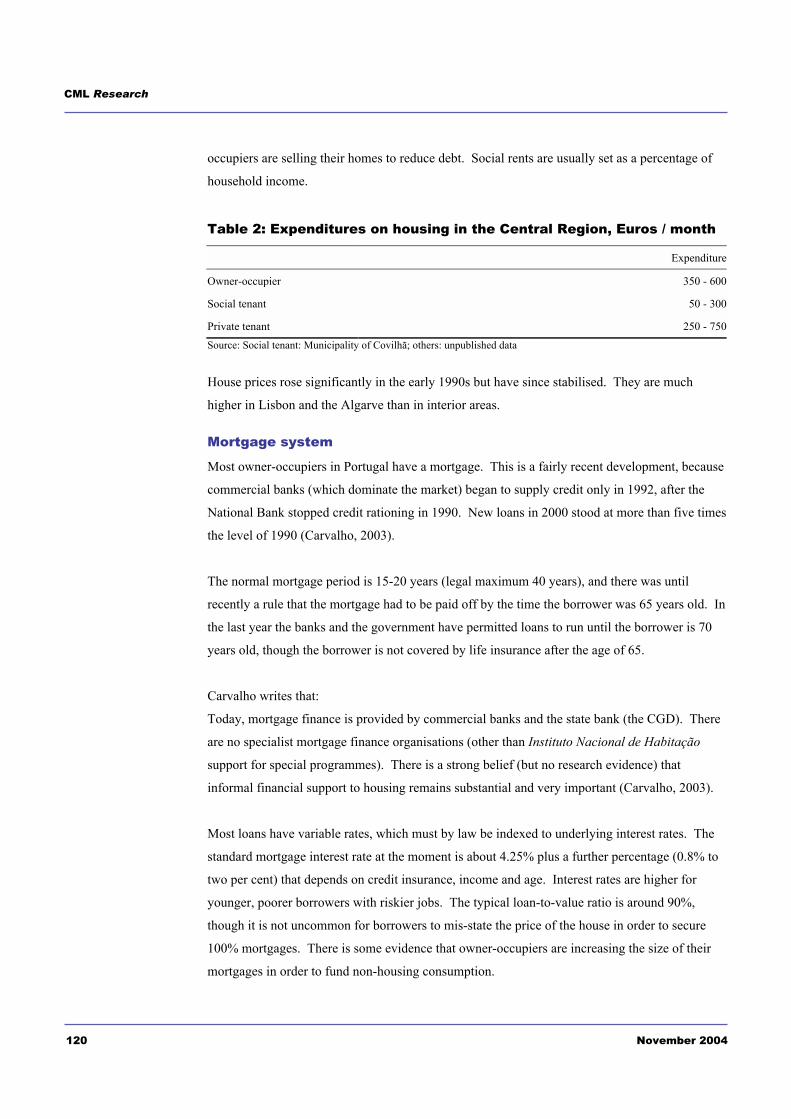
CML Research
120 November 2004
occupiers are selling their homes to reduce debt. Social rents are usually set as a percentage of
household income.
Table 2: Expenditures on housing in the Central Region, Euros / month
Expenditure
Owner-occupier 350 - 600
Social tenant 50 - 300
Private tenant 250 - 750Source: Social tenant: Municipality of Covilhã; others: unpublished data
House prices rose significantly in the early 1990s but have since stabilised. They are much
higher in Lisbon and the Algarve than in interior areas.
Mortgage system
Most owner-occupiers in Portugal have a mortgage. This is a fairly recent development, because
commercial banks (which dominate the market) began to supply credit only in 1992, after the
National Bank stopped credit rationing in 1990. New loans in 2000 stood at more than five times
the level of 1990 (Carvalho, 2003).
The normal mortgage period is 15-20 years (legal maximum 40 years), and there was until
recently a rule that the mortgage had to be paid off by the time the borrower was 65 years old. In
the last year the banks and the government have permitted loans to run until the borrower is 70
years old, though the borrower is not covered by life insurance after the age of 65.
Carvalho writes that:
Today, mortgage finance is provided by commercial banks and the state bank (the CGD). There
are no specialist mortgage finance organisations (other than Instituto Nacional de Habitação
support for special programmes). There is a strong belief (but no research evidence) that
informal financial support to housing remains substantial and very important (Carvalho, 2003).
Most loans have variable rates, which must by law be indexed to underlying interest rates. The
standard mortgage interest rate at the moment is about 4.25% plus a further percentage (0.8% to
two per cent) that depends on credit insurance, income and age. Interest rates are higher for
younger, poorer borrowers with riskier jobs. The typical loan-to-value ratio is around 90%,
though it is not uncommon for borrowers to mis-state the price of the house in order to secure
100% mortgages. There is some evidence that owner-occupiers are increasing the size of their
mortgages in order to fund non-housing consumption.
International trends in housing tenure and mortgage finance
November 2004 121
In the past, the government subsidised mortgage rates for young people, immigrants and the
disabled, but as of September 2002 most of these special provisions were abolished.
Taxes and subsidies
Mortgage payments are eligible for tax relief in Portugal, and there is no tax on imputed rent.
Sales of owner-occupied housing do not attract capital gains tax if the proceeds are reinvested in
another residence within two years.
New mortgage loans previously attracted government subsidies, but these were reduced and then
eliminated in the 1990s.
References
Information provided by P.G. Carvalho
Carvalho, P.G. (2003) 'Portugal', in Globalisation and Home-ownership (Doling, J. and Ford, J.,
eds); Delft University Press, Delft.
European Central Bank (2003) Structural factors in the EU housing markets
EMF (2003) Country factsheets 2002 European Mortgage Federation, Brussels
EMF (2003) Hypostat 1992-2002 European Mortgage Federation, Brussels
Mercer Oliver Wyman (2003), Study on the Financial Integration of European Mortgage
Markets, European Mortgage Federation, Brussels.

CML Research
122 November 2004
Slovenia
Tenure
The very high rate of home-ownership in Slovenia is due to the privatisation of housing (ie, the
sale of public rented housing from 1991-1994) and the restitution of dwellings to their original
owners (or their eligible heirs), which took place from 1991 onwards. The sale of public rented
housing (ie, housing owned by employers, local authorities, state institutions, pension and
disability funds, etc.,) to sitting tenants at below-market price resulted in one of the highest rates
of home-ownership in Europe.
Table 1: Households by tenure, 2002, %
All households Young Entrant1 Mid-Life
1991 2002 1994 1994
Owner-occupation 68 82 46 78
Social renting 31 7
Private renting 1 310 10
Living with parents/relatives 8 41 10
Other/unknown 1Source: Statistical Office of the Republic of Slovenia; unpublished first report of Census 2002; Level of Living Survey, published in Mandic, S: Housing, Quality of Living and Changes in the Last Decade, Dru�boslovne razprave, 15 (1999) Notes: 1 - 25- to 34-year-olds
The average first-time buyer in Slovenia is 30-40 years old, in a two-adult household. Compared
to most European countries, a very high percentage of Young Entrant households still live with
parents or other relatives. It is common for parents to add a floor to their house to accommodate
their children (or even grandchildren). Formation of independent households is delayed by the
high price of housing. In 2001 the typical (dual) net income for a Young Entrant household was
SIT 300,000 (�1,300) per month. For household Mid-Life the figure was SIT 350,000 (�1,350).
Housing costs
Because utility payments make up such a high proportion of housing expenditure in Slovenia we
have included them in our cost calculations. Social renting is the least expensive tenure for both
Young Entrant and Mid-Life households. Owner-occupation is the most expensive tenure for
Young Entrants, while for Mid-Life households private renting is more expensive than owner-
occupation.

International trends in housing tenure and mortgage finance
November 2004 123
Table 2: Actual expenditures on housing, 2002, Euros/month
Young Entrant Mid-Life
Owner-occupier Mortgage 400 Utils 152
Mortgage 200 Utils 217
Social tenant Rent 867 Utils 130
Rent 152 Utils 174
Private tenant Rent 261 Utils 130
Rent 348 Utils 174
Source: Experts' estimates
Table 3: Relative expenditures on housing (owner-occupation = 100%)
Young Entrant Mid-Life
Social tenant 39 78
Private tenant 71 125Source: Authors' calculations
The cost of housing in the owner-occupied sector rose by a real annual rate of three per cent (new
dwellings) to five per cent (existing dwellings) over the period 1996-2001. Nevertheless, many
of those households with mortgages have experienced falling housing costs, as the real interest
rate on housing loans has dropped dramatically, from about 11% in 1996 to about 3.75% in 2003.
Since the collapse in the system of social-housing finance, all additions to the existing housing
stock have been owner-occupied. Construction permits are expensive in Slovenia. For example,
it costs �15-25,000 to secure the necessary permits for an average house in Ljubljana.
Table 4: Housing costs for owner-occupiers, 2002, Euros
Young Entrant Mid-Life
Average house price 45,000 for existing housing 45,000 � 67,500 for new housing
67,500 for existing housing 60,000 � 150,000 for new housing
Average down payment on a mortgage 25,000 70,000
Average mortgage payment 400 200Source: Experts' estimates
Mortgage system
Rough estimates are that about 15% of owner-occupiers are buying (or building) a dwelling with
a mortgage or other type of dedicated housing loan. About 55% of owner-occupiers are outright
owners. Other buyers use loans not secured on the house.
Mortgage lending, in the sense of house-purchase loans secured on the dwellings themselves,
was introduced in Slovenia only in 1997. Prior to that, housing loans were secured by guarantors
CML Research
124 November 2004
or on loan insurance, and the loan period was therefore limited to ten years because insurers
would only issue insurance for this period. The mortgage system is still in its infancy, and only
about 20% of housing loans are secured on the dwelling; the banks still prefer insurance as
collateral, because possession in the case of borrower default is a lengthy, difficult procedure (it
takes a minimum of two years and, until recently, if the bank foreclosed the borrower had the
legal right to stay in the house as a tenant). This system results in high up-front costs � loan
closing costs are up to five per cent of the loan amount.
The typical mortgage in Slovenia is a ten-year repayment mortgage. Most have variable interest
rates � the longest fixed-rate available is three years. The typical LTV ratio is a very low 50%,
because of the income criteria applied by lenders: affordability is calculated on the basis that the
mortgage payment should account for no more than a third of the borrower's disposable income.
Because of the country's high housing prices and the affordability ratio, borrowers are rarely in a
position to borrow even as much as 50% of the purchase price.
Several foreign-owned banks have either purchased Slovenian banks or entered the Slovenian
market, and these foreign-owned banks usually offer Euro-denominated mortgages, while
domestic banks offer tolar-denominated mortgages. Mortgages in Euros have a lower interest
rate at the moment; the real interest rate on tolar-denominated mortgages has been 4-5%, though
it fell in 2003 to around 3.75%; this is in addition to approximately 7.5% inflation. According to
the Bank of Slovenia, the average gross interest rate on housing loans (including mortgages) in
May 2002 was about 12.9%. This reflects Slovenia's high rate of inflation (currently 7.5%)
compared to EU countries. Even at this level, the rate is much lower than it was six years ago�
in 1996 housing loan real interest rates were about 11%.
Taxes and subsidies
Home-ownership
Housing is treated as a consumption good in Slovenia. There is tax relief on mortgage interest
payments, with a credit of up to three per cent of income tax payable. Owner-occupiers are
exempt from capital gains tax on the sale of dwellings as long as they have owned them for at
least three years.
The National Housing Scheme, modelled on the German Bausparen system, started in 1999.
Under this scheme, savers contract to save a set amount monthly for five or ten years; they are
paid below-market interest rates (currently 1.65% for the five-year scheme and three per cent for
the ten-year scheme). Participants sign up for coupons, each of which entitles them to save
10,000 tolars/month. The participant's deposits are topped up annually by a state-funded

International trends in housing tenure and mortgage finance
November 2004 125
premium of 1-1.25 times the monthly amount saved. At the end of the savings period, the saver
is entitled to a housing loan with a below-market real interest rate (currently 2.45% on a ten-year
mortgage after saving for five years, or 3.8% on a 20-year mortgage after saving for ten).
The first annual scheme, worth �0.5bn, sold out in a few days � the interest rate paid to savers
including the subsidy was competitive, but the loan rate was half the market rate. Now, though,
bank loan interest rates have fallen and are approaching the rate that will be offered under the
scheme. No loans have yet been disbursed. In 2004 the first round of the five-year scheme will
be completed, and approximately 22,800 savers will be entitled to apply for loans. Loans must
be spent on housing, but savings can be used for anything. New savings schemes have been
started every year since 1999, and the total number of savers at the end of 2002 was 69,102.
Rental property
For landlords, the low property tax and low effective income-tax rate on rental income favour
housing against other investments.
Reform of the property tax system is due to take place in 2005. Mass appraisal-based taxation
will replace the current administrative system of tax-base estimation, and two subtypes of
property taxes will be combined into a single tax.
Mortgage interest payments are tax deductible. First-time homebuyers are exempt from local
property taxes during the first 10 years.
Problems accessing housing
The high cost of housing and the demanding lending criteria adopted by banks mean that many
Slovenian households must live with relatives because they cannot access owner-occupied
housing. The National Housing Fund, established in 1992, supports first-time buyers in the
following categories: "young families" (below 35 years of age), families with many children, the
disabled, or families living in poor housing conditions. They are provided with loans at below-
market interest rates (1.75% for ten-year loans, or 3.5% for 20 years). In the past ten years the
NHF has provided more than 30,000 loans.
The city of Ljubjana plans to introduce a shared ownership scheme to coincide with the first
tranche of people receiving money from the savings scheme. Many will not be able to afford to
buy anything with the proceeds, so the programme will allow them to buy a half-interest in a
dwelling, with the municipality owning the other half.

CML Research
126 November 2004
Reverse mortgages for the over-65 are also to be introduced in Ljubjana, in a sale/leaseback
scheme where the homeowner becomes a non-profit renter until he dies. The municipality will
buy the dwelling, paying for it with a monthly annuity out of which the owner pays a non-profit
rent.
Risk reduction
Although there is a growing concern with mortgage default, there is virtually no state support for
home-owners who experience problems.
References
Information provided by N. Pichler-Milanovic and A. Cirman
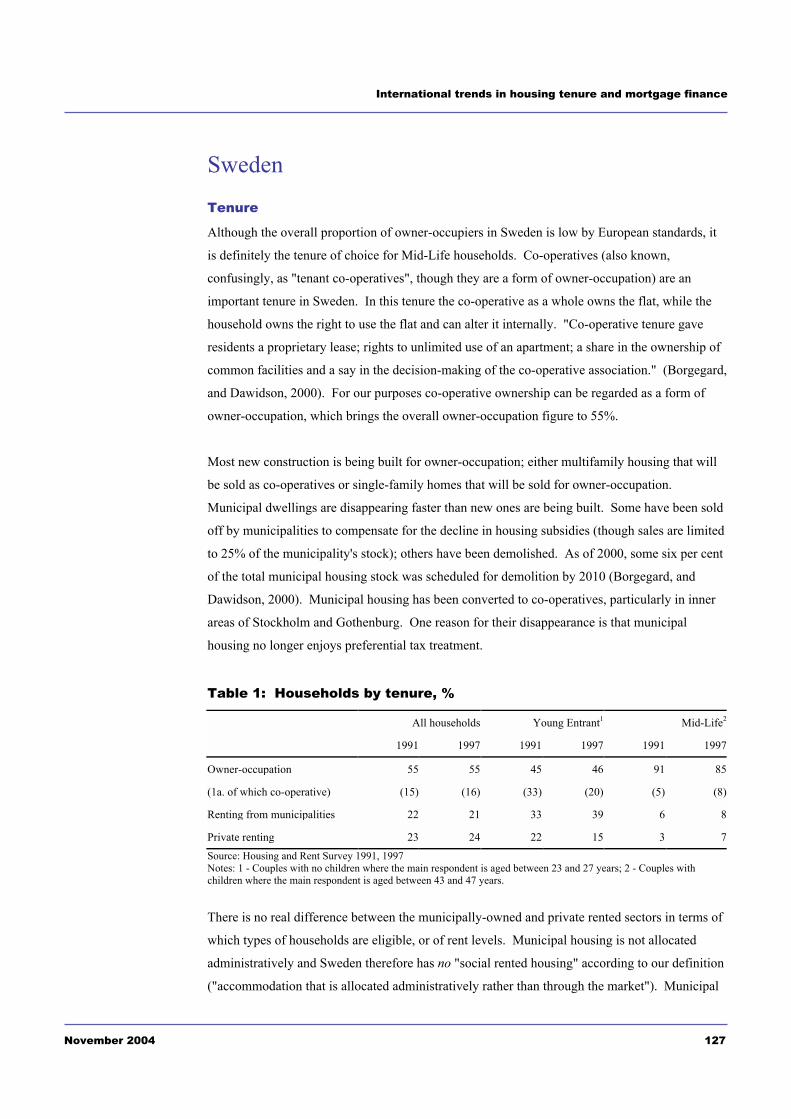
International trends in housing tenure and mortgage finance
November 2004 127
Sweden
Tenure
Although the overall proportion of owner-occupiers in Sweden is low by European standards, it
is definitely the tenure of choice for Mid-Life households. Co-operatives (also known,
confusingly, as "tenant co-operatives", though they are a form of owner-occupation) are an
important tenure in Sweden. In this tenure the co-operative as a whole owns the flat, while the
household owns the right to use the flat and can alter it internally. "Co-operative tenure gave
residents a proprietary lease; rights to unlimited use of an apartment; a share in the ownership of
common facilities and a say in the decision-making of the co-operative association." (Borgegard,
and Dawidson, 2000). For our purposes co-operative ownership can be regarded as a form of
owner-occupation, which brings the overall owner-occupation figure to 55%.
Most new construction is being built for owner-occupation; either multifamily housing that will
be sold as co-operatives or single-family homes that will be sold for owner-occupation.
Municipal dwellings are disappearing faster than new ones are being built. Some have been sold
off by municipalities to compensate for the decline in housing subsidies (though sales are limited
to 25% of the municipality's stock); others have been demolished. As of 2000, some six per cent
of the total municipal housing stock was scheduled for demolition by 2010 (Borgegard, and
Dawidson, 2000). Municipal housing has been converted to co-operatives, particularly in inner
areas of Stockholm and Gothenburg. One reason for their disappearance is that municipal
housing no longer enjoys preferential tax treatment.
Table 1: Households by tenure, %
All households Young Entrant1 Mid-Life2
1991 1997 1991 1997 1991 1997
Owner-occupation 55 55 45 46 91 85
(1a. of which co-operative) (15) (16) (33) (20) (5) (8)
Renting from municipalities 22 21 33 39 6 8
Private renting 23 24 22 15 3 7Source: Housing and Rent Survey 1991, 1997 Notes: 1 - Couples with no children where the main respondent is aged between 23 and 27 years; 2 - Couples with children where the main respondent is aged between 43 and 47 years.
There is no real difference between the municipally-owned and private rented sectors in terms of
which types of households are eligible, or of rent levels. Municipal housing is not allocated
administratively and Sweden therefore has no "social rented housing" according to our definition
("accommodation that is allocated administratively rather than through the market"). Municipal

CML Research
128 November 2004
housing is built and owned by municipal companies, and is let on a non-profit basis to anyone.
This cost-based rent system means that rents can be well below market levels, particularly in
attractive areas. This has led to significant windfall gains for those lucky enough to rent these
dwellings.
Of all owner-occupiers, 80% have a mortgage, while 93% of households that bought their house
during the last five years have a mortgage.
Housing costs
Swedish housing has traditionally been the recipient of generous subsidies. The aim was to
provide decent but cheap housing, and rents were set at 20-25% of average disposable income.
In the 1990s housing subsidies were cut, and households' housing expenditure increased.
Nevertheless, figures for 1997 show that Young Entrant and Mid-Life owner-occupiers spent
25% of their income on housing, and renters spent from 18-23% - still within the range targeted.
Table 2: Actual expenditures on housing, SEK / month
Young Entrant Mid-Life
1991 1997 1991 1997
Owner-occupier 6,850 5,500 6,450 6,500
Municipality tenant 3,050 4,100 4,100 5,150
Private tenant 3,250 4,000 4,000 5,850Source: Housing and Rent Survey 1991, 1997 Notes: Figures include mortgage and rent payments, water and electricity; not adjusted for housing allowances. The average (dual) income for a Young Entrant household was 21,900 SEK/month in 1997. The average (dual) income for Mid-Life households was 25,600 SEK/month; this was also a dual income.
Table 3: Relative expenditures on housing (owner-occupation = 100%)
Young Entrant Mid-Life
1991 1997 1991 1997
Municipality tenant 45 75 64 79
Private tenant 47 73 62 90Source: Authors' calculations
In 1997 the cost of owner-occupation was higher than the cost of renting for both Young Entrant
and Mid-Life households, as it was in 1991. However, Young Entrant households in 1997 were
on average paying more for owner-occupation than older, Mid-Life households; this was a
reversal of the 1991 situation.
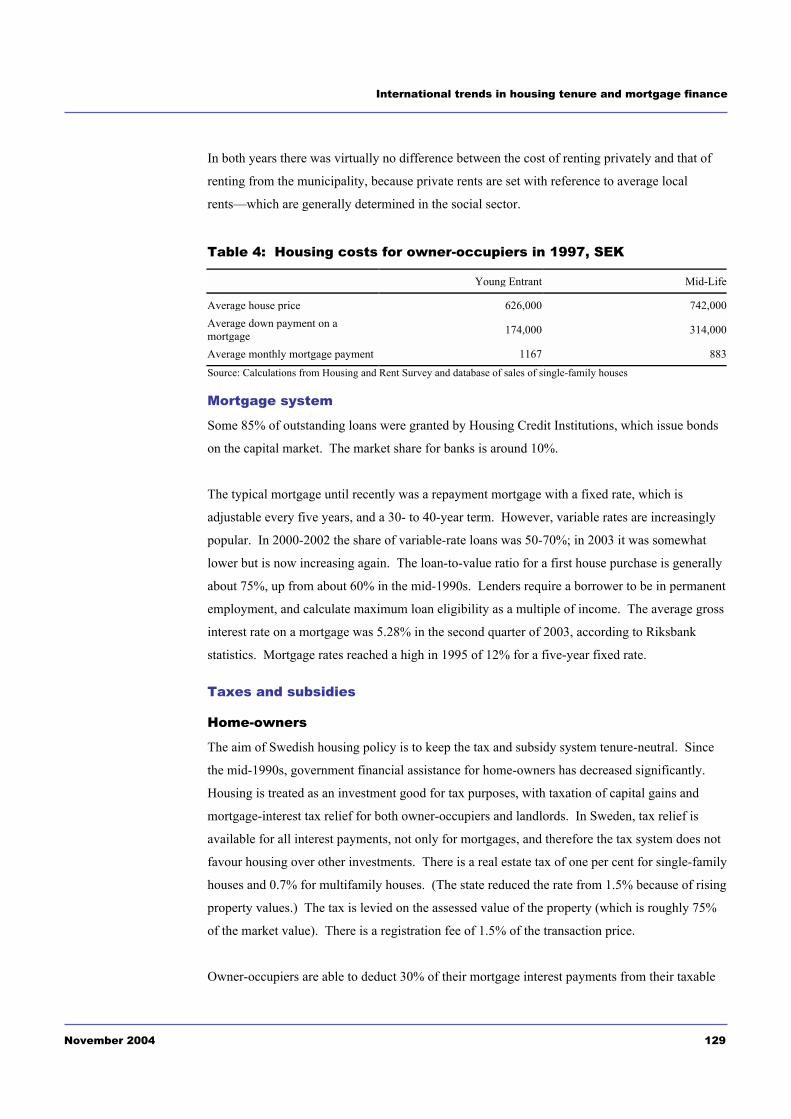
International trends in housing tenure and mortgage finance
November 2004 129
In both years there was virtually no difference between the cost of renting privately and that of
renting from the municipality, because private rents are set with reference to average local
rents�which are generally determined in the social sector.
Table 4: Housing costs for owner-occupiers in 1997, SEK
Young Entrant Mid-Life
Average house price 626,000 742,000Average down payment on a mortgage 174,000 314,000
Average monthly mortgage payment 1167 883Source: Calculations from Housing and Rent Survey and database of sales of single-family houses
Mortgage system
Some 85% of outstanding loans were granted by Housing Credit Institutions, which issue bonds
on the capital market. The market share for banks is around 10%.
The typical mortgage until recently was a repayment mortgage with a fixed rate, which is
adjustable every five years, and a 30- to 40-year term. However, variable rates are increasingly
popular. In 2000-2002 the share of variable-rate loans was 50-70%; in 2003 it was somewhat
lower but is now increasing again. The loan-to-value ratio for a first house purchase is generally
about 75%, up from about 60% in the mid-1990s. Lenders require a borrower to be in permanent
employment, and calculate maximum loan eligibility as a multiple of income. The average gross
interest rate on a mortgage was 5.28% in the second quarter of 2003, according to Riksbank
statistics. Mortgage rates reached a high in 1995 of 12% for a five-year fixed rate.
Taxes and subsidies
Home-owners
The aim of Swedish housing policy is to keep the tax and subsidy system tenure-neutral. Since
the mid-1990s, government financial assistance for home-owners has decreased significantly.
Housing is treated as an investment good for tax purposes, with taxation of capital gains and
mortgage-interest tax relief for both owner-occupiers and landlords. In Sweden, tax relief is
available for all interest payments, not only for mortgages, and therefore the tax system does not
favour housing over other investments. There is a real estate tax of one per cent for single-family
houses and 0.7% for multifamily houses. (The state reduced the rate from 1.5% because of rising
property values.) The tax is levied on the assessed value of the property (which is roughly 75%
of the market value). There is a registration fee of 1.5% of the transaction price.
Owner-occupiers are able to deduct 30% of their mortgage interest payments from their taxable

CML Research
130 November 2004
income. All realised nominal capital gains are taxed by 30%, but the tax can be rolled over
provided the new house is more expensive. There is a stamp duty of 1.5% of the purchase value,
and a 'mortgage registration fee' of two per cent of the value of the new mortgage.
If the house was built after 1980 but before 2000, the owners received an interest allowance that
went towards payment of the mortgage costs, which provided a considerable benefit to owners of
these homes. The Swedish system for financing such construction was deregulated in the early
1990s. Before deregulation, interest allowances for new construction were given to borrowers
who had taken out a special type of loan, available only from the state institution. After
deregulation, borrowers with such loans from any mortgage lender (or no loan at all) were
eligible for the allowance. The state lender then had to compete in the market for this type of
loan, and could also compete with other lenders for basic mortgage loans.
The loan that gave interest allowances followed the house, so if the house was sold, the new
owners also took over the loan. If they had to borrow more, they could. Older houses that no
longer received interest allowances from this system were financed on a free mortgage market.
Since 2000, newly constructed owner-occupied houses are no longer eligible for interest
allowances.
Low-income owner-occupiers with children receive a housing allowance to help them pay
housing costs. The amount of subsidy depends on a formula that takes into account the net value
of the owner-occupier's housing equity.
Rental property
Private and social landlords are treated alike for tax purposes, and the structure of the tax
framework that applies to them is similar to that for owner-occupiers. They can deduct all their
costs from their taxable income. They pay capital gains tax at the slightly lower rate of 28%
(30% for owner-occupiers). Landlords receive somewhat more generous interest allowances in
that they are paid to all households who live in flats, and owners of houses built after 1975
(instead of 1980 as for owner-occupiers). New loans are no longer eligible for interest
allowances. The allowances were highest when the house was new and then decreased over
time, so there most dwellings no longer carry them. In the past landlords paid a real estate tax of
2.5%, higher than owner-occupiers did, but the rate has now been decreased to 0.7%. Tenants
are eligible for the housing allowance in the same way as owner-occupiers.
Risk reduction
The Swedish social insurance system pays individuals who are unable to work up to 80% of their

International trends in housing tenure and mortgage finance
November 2004 131
normal income, which could normally be expected to cover mortgage obligations. There is some
guaranteeing of mortgage loans through a state institution, the National Housing Credit
Guarantee Board (BKN), which since 1997 has been self-financing. BKN originally provided
guarantees only for state-subsidised loans, but since 1999 has also been able to guarantee
unsubsidised loans for owner-occupied housing. BKN's guarantee compensates the lender for
losses on a guaranteed loan due to the borrower's inability to service the loan. The annual fee is
currently 0.5% of the guaranteed amount.
Changes in Swedish housing policy over the last ten years have shifted risk from the state to the
builder, owner, and end user, as subsidies and government assistance have been reduced.
References
Information provided by T. Berger
Ball, M. (2003) RICS European Housing Review 2003 RICS, London
Borgegard, L.E and Dawidson, K (2000), The Development of and Prospects for Swedish
Housing Policy, research paper, Institute for Housing Research, Uppsala University
European Mortgage Federation Country factsheets 2002
Freeman, A, Holmans, A, and Whitehead, CME (1996) Is the UK Different? International
Comparisons of Tenure Patterns Council of Mortgage Lenders, London
National Housing Credit Guarantee Board website: www.bkn.se

CML Research
132 November 2004
United Kingdom Separate government departments are responsible for housing policy in the countries of the
United Kingdom (England, Wales, Scotland and Northern Ireland). Each conducts its own
housing surveys. Survey data are fullest for England, so English data are used except where
stated otherwise.
Tenure
In the last ten years the percentage of owner-occupiers in England has increased, as it has every
decade since 1950, when it was 29%. The percentage has climbed steadily to its current level at
70% despite fluctuations in property prices.
Overall levels of owner occupation have continued to rise, and Mid-Life owner occupation is
holding steady at above 85%. However, there has been a notable fall in owner-occupation levels
among Young Entrant households. In 1994/95, nearly at the bottom of a property-price cycle, the
percentage of Young Entrant owner-occupiers was higher than the overall percentage. By
2001/02, the owner occupation rate for such households was 11% lower than for the overall
population, while the percentage of young households in private rental had increased from 20%
to 35%. Steadily rising house prices have brought increasing affordability problems for first-time
buyers; recent figures show that the average age of a first-time buyer in England is now 34
(ODPM website). A rise in the age of first-time buyers is not necessarily a bad thing; it may be
that some young households are now more satisfied with their options in the rental market than
was the case ten years ago, and are less motivated to try to move into owner occupation as early
as possible.
Table 1: Households by tenure, %
All households Young Entrant1 Mid-Life2
1994/5 2001/2 1994/5 2001/2 1994/5 2001/2
Owner-occupation 67 70 74 59 86 87
Social renting 23 20 6 7 10 9
(Council) (19) (14) (5) (6)
(Registered Social Landlord) (4) (6) (2) (3)
Private renting 10 10 20 35 4 5Source: 1994/95 Survey of English Housing Table A1.2, Department of Environment; 2001/02 Survey of English Housing online, Table S101, Office of the Deputy Prime Minister; calculations from survey dataset. Notes: Private rental sector includes all miscellaneous tenures. 1 - 1994/95: Couples with no children where the main respondent is aged between 20-29 years. 2001/02: Couples with no children where the main respondent is aged between 25 and 29 years. 2 - 1994/95: Couples with one or more dependent children where the main respondent is aged between 40 and 49 years. 2001/02: Couples with children where the main respondent is aged between 45 and 64 years.
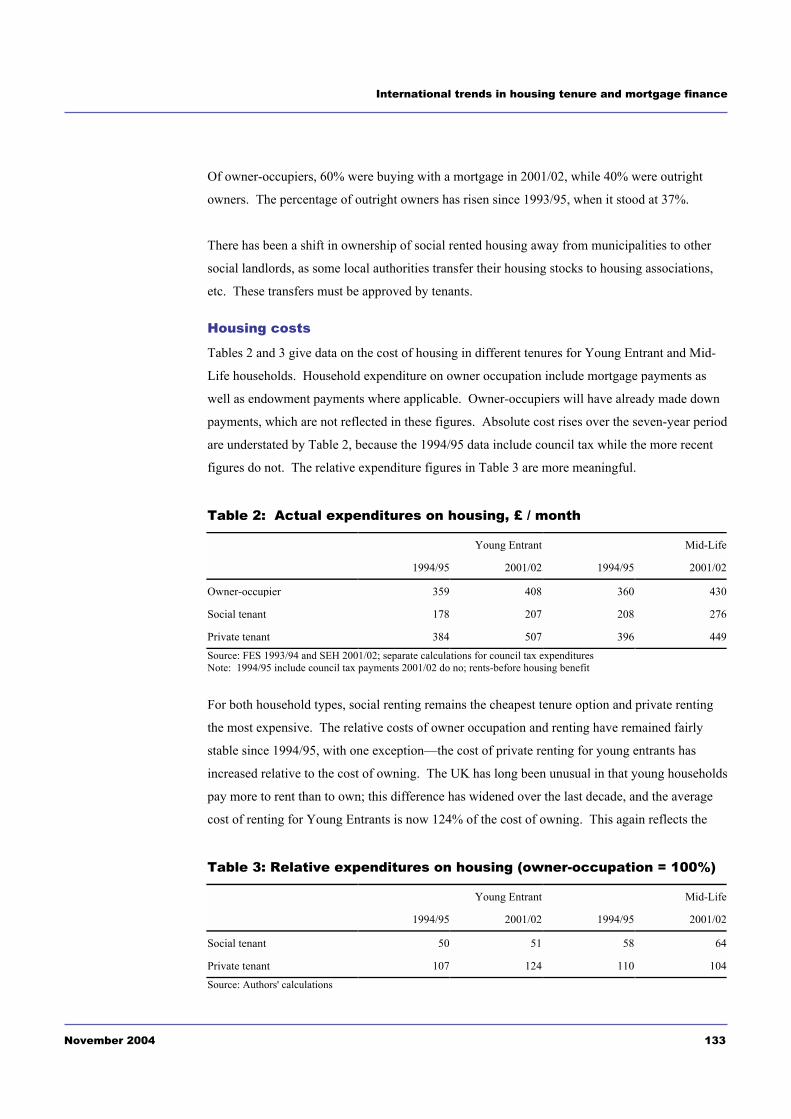
International trends in housing tenure and mortgage finance
November 2004 133
Of owner-occupiers, 60% were buying with a mortgage in 2001/02, while 40% were outright
owners. The percentage of outright owners has risen since 1993/95, when it stood at 37%.
There has been a shift in ownership of social rented housing away from municipalities to other
social landlords, as some local authorities transfer their housing stocks to housing associations,
etc. These transfers must be approved by tenants.
Housing costs
Tables 2 and 3 give data on the cost of housing in different tenures for Young Entrant and Mid-
Life households. Household expenditure on owner occupation include mortgage payments as
well as endowment payments where applicable. Owner-occupiers will have already made down
payments, which are not reflected in these figures. Absolute cost rises over the seven-year period
are understated by Table 2, because the 1994/95 data include council tax while the more recent
figures do not. The relative expenditure figures in Table 3 are more meaningful.
Table 2: Actual expenditures on housing, £ / month
Young Entrant Mid-Life
1994/95 2001/02 1994/95 2001/02
Owner-occupier 359 408 360 430
Social tenant 178 207 208 276
Private tenant 384 507 396 449Source: FES 1993/94 and SEH 2001/02; separate calculations for council tax expenditures Note: 1994/95 include council tax payments 2001/02 do no; rents-before housing benefit
For both household types, social renting remains the cheapest tenure option and private renting
the most expensive. The relative costs of owner occupation and renting have remained fairly
stable since 1994/95, with one exception�the cost of private renting for young entrants has
increased relative to the cost of owning. The UK has long been unusual in that young households
pay more to rent than to own; this difference has widened over the last decade, and the average
cost of renting for Young Entrants is now 124% of the cost of owning. This again reflects the
Table 3: Relative expenditures on housing (owner-occupation = 100%)
Young Entrant Mid-Life
1994/95 2001/02 1994/95 2001/02
Social tenant 50 51 58 64
Private tenant 107 124 110 104Source: Authors' calculations

CML Research
134 November 2004
affordability problems facing many young households�unable to buy because they have not yet
accumulated the necessary deposit, they also pay relatively high rents in the private sector.
Table 4: Housing costs for owner-occupiers, 2003, £
Young Entrant1 Mid-Life2
Average house price 119,312 189,029Average down payment on a mortgage 20,420 88,464
Average mortgage payment 346 (interest only) 344 (interest only)Source: Council of Mortgage Lenders Note: 1 - 25-29 yr old FTBs; 2 - 45-54 yr old movers
Table 4 shows average costs for owner-occupiers in 2003. These figures are for all of England.
Regional data show a very wide range of house prices, with (in general) lower prices in the north
and higher prices in the south-east. According to government figures, the average house price in
the county of Cleveland in 2002 was £69,335, while in the London suburban county of Surrey it
was £255,565, and in Inner London £288,433 (ODPM website).
Mortgage system
The mortgage market is dominated by former building societies that have become banks. The
largest five lenders accounted for 63% of new loans in 2002; the largest ten, for 83% (CML
website). Of new mortgages in 2002, 37% were remortgages taken out either to benefit from
lower interest rates or to withdraw equity (CML website).
Mortgages in the UK normally have a 25-year term. Table 5 shows the split between fixed and
variable interest rates. In contrast to usage in most countries, rates set for one year or more are
classified as 'fixed'. The government has recently commissioned a study into whether the
introduction of long-term fixed rates, as are typical in America, would reduce the volatility of the
UK housing market. The final report suggested that long-term fixed rates were probably not
feasible on a wide scale in the UK (Miles, 2004).
The UK market has a high level of product innovation. Readily available mortgage types include
flexible mortgages, capped rates, discounted variable rates, offset mortgages, and trackers.

International trends in housing tenure and mortgage finance
November 2004 135
Table 5: Fixed and variable rate lending, 3Q2003
Interest type % of all loans Average rate
Capped 3 4.53
Fixed 45 4.03
Variable 52 4.34Source: Council of Mortgage Lenders website, "Fixed and variable rate lending", table PR3
In terms of loan structure, the stock of mortgages outstanding are roughly evenly split between
repayment (annuity) and interest-only. However, more recently new take up has become
dominated by capital repayment loans as the repayment vehicles backing interest-only have
performed badly. Interest-only mortgages usually have repayment vehicles designed to pay off
the principal at the end of the mortgage term. There are several types of repayment vehicle,
including saving through PEPs or ISAs (tax-advantaged investment funds), pensions, and
endowments (insurance funds). The type chosen depends on the borrower's tax position and
attitude to risk.
An endowment mortgage, for example, operates as follows. The borrower makes two monthly
payments: one to the lender to cover interest and one to an insurance company. Part of the
payment to the insurance company goes to life insurance, which will repay the loan if the
borrower dies, and part into an investment account (usually stock-market linked) which will, in
theory, pay off the mortgage at the end of its term. Given the performance of the stock market in
recent years, however, many endowment policies have not grown enough to pay off the mortgage
principal, and borrowers have had to increase their payments into the policies or extend the terms
of loans.
The median loan-to-value ratios in 2003 were 89% for first-time buyers and 70% for movers, but
it is possible to get loans of 100% of the property's value, or even more. Properties are valued on
behalf of the banks by surveyors, who base their assessments on recent prices achieved on similar
properties in the area.
Loan-to-income ratios have been rising steadily because of the increase in house prices and the
fall in interest rates; ten years ago lenders might have offered 2.5 times the main income plus one
times the second income, but now many lenders will lend three times joint income or more. The
median income multiple for first-time buyers rose from 2.36 in 1996 to 2.91 in 3Q2003 (CML
website). Lenders are increasingly supplementing income multiples with a scorecard approach,
using affordability models and looking at applicants' credit and debt history, savings, etc.

CML Research
136 November 2004
Taxes and subsidies
Owner-occupation
Housing is treated as consumption good for tax purposes, with no taxation of capital gains from
principal residences, and exclusion of the imputed rental income from taxable income.
Historically mortgage interest payments were tax deductible to a limited extent, but this tax break
was progressively decreased in value over the 1990s and finally eliminated in 2000. There is a
banded transfer tax, or 'stamp duty' (one per cent for properties worth between £60,000 and
£250,000, rising in steps to four per cent on properties worth over £500,000). Stamp duty is not
payable on purchases of property in certain designated deprived areas.
Owner-occupation has been favoured in a number of ways. The Right to Buy programme allows
council tenants to purchase their homes at a discount. The Cash Incentive Scheme gives council
tenants grants to leave their home and purchase on the open market. The Voluntary Purchase
scheme and the Tenant Incentive scheme are the equivalent grants for tenants of housing
associations. Do-It-Yourself Shared Ownership is a scheme run by local authorities, through
which a household can purchase a share in a house with a housing association purchasing the
remaining share and charging a rent for it. Its aim is to help lower-income households overcome
the entry costs of owner-occupation. The Starter Homes Initiative provides grants to "key
workers" (defined as public-sector workers in certain posts, including police, teachers, nurses,
and transport) to help them access owner-occupation in expensive areas.
Rental sector
The private rental sector is at a disadvantage compared to other investments because there are no
special depreciation allowances, and losses from private renting cannot be set against income
from other sources for tax purposes. The disadvantage is especially marked when house prices
are rising, because private landlords have to pay capital gains and income tax.
Low-income households in both rental sectors are eligible for rent rebates or rent allowances
(Housing Benefit).
Problems accessing housing
The steady increase in the cost of housing, since its nadir in 1996, has made it increasingly
difficult for some people to access owner-occupation. The problems are particularly acute in
London and south-east England, and for first-time buyers and 'key workers' (public-sector
employees whose pay is the same everywhere in the country). The government sponsors some
limited schemes to help key workers into owner-occupation, but has rejected the idea of local
wage flexibility. Other forms of low cost home-ownership are being considered by government
International trends in housing tenure and mortgage finance
November 2004 137
and a recent review of housing supply in the UK (Barker 2004), has resulted in a commitment to
increase the supply of affordable homes in the UK.
Risk reduction
UK lenders use a range of risk mitigation strategies to manage high credit risk. These include
mortgage indemnity insurance, captives, excess of loss insurance, self-insurance and
securitisation. Many high LTV loans (traditionally over 75%, but increasingly now only over
90/95%) will be covered through one of these methods. Mortgage indemnity insurance (MII),
which protect the lender against losses arising from foreclosure but are paid for by the borrower,
are used less than they have been in the past following problems in paying claims in the recession
in the early 1990s. Premiums for these policies vary with the loan-to-value ratio and are usually
prepaid. Where lenders do not use MII, loans still need to be covered in some way, which is paid
for indirectly via higher mortgage rates and/or cross-subsidies from existing borrowers.
The government provides some support to borrowers who become unemployed, through the
Income Support for Mortgage Interest programme. For borrowers with loans taken out before
October 1995, there is a waiting period of eight weeks before ISMI is payable. Up to 50% of
eligible interest is paid for the following 18 weeks, then full eligible interest is covered by ISMI.
For people with mortgages taken out after October 1995, there is a waiting period of 39 weeks.
Full eligible interest is payable after this point. ISMI is only paid to those who put in claims for
unemployment benefit. The eligible interest payable is paid at a standard rate (which may be less
than the actual interest rate payable), and is limited to interest on loans of up to £100,000.
Studies have shown that for the majority of recipients the benefit does not cover their full
mortgage payment, due to this interest-rate limit (Croucher et al, 2003). According to Ford and
Doling, "The failure to meet full payments once the benefit is paid results in half of all those
receiving state help experiencing mortgage defaults." (Ford and Doling, 2003). Other income
protection insurance available to borrowers that cover mortgage repayments in the case of loss of
income includes critical illness, permanent health and unemployment insurance.
Private mortgage protection plans (Mortgage Payment Protection Insurance � MPPIs) are also
available, which will cover mortgage payments if the borrower becomes sick or unemployed. As
of the second half of 2003, 23.7% of all mortgages outstanding were covered by MPPI policies
(CML website), which are paid for by the borrower. Some experts consider these to be poor
value, with an average premium of £4.95 per £100 monthly mortgage payment (as at end 2003)
compared to an "actuarial premium" of about a third as much.
CML Research
138 November 2004
References
Ball M. (2003) RICS European Housing Review 2003 RICS, London
Bennett J. (2002) Low cost home-ownership schemes in England and Wales Housing Finance
Winter 2002, Council of Mortgage Lenders
Council of Mortgage Lenders website (www.cml.org.uk)
Croucher K., Quilgers D., Wallace A., Baldwin S., and Mather L. (2003) Paying the Mortgage?
A Systematic Literature Review of Safety Nets for Home-owners, Department of Social Policy
and Social Work, University of York. http://www.york.ac.uk/inst/chp/mppireview.pdf
EMF (2003) Hypostat 1992-2002 European Mortgage Federation, Brussels
Ford J. and Doling J. (2003) 'United Kingdom', in Globalisation and Home-ownership (Doling, J.
and Ford, J., eds); Delft University Press, Delft.
Freeman A, Holmans A, and Whitehead CME (1996) Is the UK Different? International
Comparisons of Tenure Patterns Council of Mortgage Lenders, London
Mercer Oliver Wyman (2003) Study on the Financial Integration of European Mortgage
Markets, European Mortgage Federation, Brussels.
Miles D. (2003) The UK Mortgage Market: Taking a Longer-Term View � Interim Report
Information, Incentives and Pricing HMSO London
ODPM website � various data www.odpm.gov.uk

International trends in housing tenure and mortgage finance
November 2004 139
USA
Tenure
The overall rate of owner-occupation in America, which had been stable at 64-65% nationally
from 1960 to 1990, has now risen slightly to 68%. Interestingly, this is the opposite of what was
predicted in our 1996 report, which noted that in 1994 the rate of owner-occupation where the
householder was younger than 55 had been dropping, and that the only age group for which
owner-occupation had been increasing was the over-65s. The higher proportion of owner-
occupiers comes predominantly from older age cohorts of the population. The rise in home-
ownership has come about because interest rates are at historically low levels, purchasers expect
that house prices will continue to appreciate, real incomes are rising, and new forms of mortgage
finance have been developed.
The apparent rise in owner-occupation for Young Entrant households in Table 1 is due largely to
the fact that the 1991 figure covered childless couples 20-29 years old, while the 2001 figure
covered couples under 35 � thus encompassing the age at which most households purchase their
first home. To compare like with like, the home-ownership rate for married couples under 35
was 56% in 1994, growing to 62% in 2001. There has therefore been a substantial increase in the
rate of home-ownership amongst younger households over the last decade, but not a doubling.
The apparent drop in owner-occupation among Mid-Life households again reflects slightly
different definitions � the 1991 figure was for couples with children aged 40-49, while the 1999
figure was for couples with or without children aged 35-44. If we assume that older couples, and
couples with children, are more likely to be owner-occupiers then the difference probably
disappears.
Table 1: Occupied homes by tenure, %
All households Young Entrant1 Mid-Life2
1990 1999/2002 1991 2001 1991 1999
Owner-occupation 64 68 28 62 86 81
Social renting 2 3 2 1
Private renting 34 30 7138
1419
Source: 1990 all household figures from 1990 Census of Population and Housing, Summary Tape File 3C; 1991 household Young Entrant Mid-Life figures from 1991 American Housing Survey for the United States. 2002 all household figure from CHP, 2003 Table A-5; 1999 social renting figure derived from American Survey of Housing 1999. 2001 Young Entrant figures from Retsinas and Belsky, 2002; 1999 Mid-Life figures from Simmons 2000 Table 3.31 Notes: 1 - 1991: Couples with no children of average income with the main respondent aged between 20-29 years. 2001: Married couples with or without children, where the main respondent is under 35. 2 - 1991: Couples with children of average income where the main respondent is aged between 40-49 years. 1999: Married couple households with or without children, where main respondent is aged 35-44.
CML Research
140 November 2004
The vast majority of married couple households (with or without children) aged 35-54 are in
owner-occupation. Those older married couple households who rent have incomes about
$30,000 lower than those who own their homes.
It is striking how low the percentage of dwellings in social renting is compared to most European
countries. It is not easy to determine which parts of the US housing system are social housing.
Figures from the American Survey of Housing 1999 showed that publicly-owned housing, to
which residents are allocated by bureaucratic mechanisms, accounted for 1% of all homes; a
further 2% was housing that was privately owned but received public funds (including supported
housing and housing for the elderly and disabled), and to which access was bureaucratically
controlled. We have included both of these types in the "social housing" category of Table 1. A
further 1% of homes are occupied by tenants who receive public support via Section 8
certificates and vouchers � a form of housing benefit. The dwellings themselves, however, are
privately owned and managed, and we have not counted such homes as social housing. Because
only the poorest people tend to live in social housing in the USA, we would expect the social
sector to house very few Young Entrant or Mid-Life households (who are by definition not the
poorest). The earlier (1991) data showed that just 2% of Young Entrant households and 1 % of
Mid-Life households lived in social housing, but later data were unavailable.
The Centre for Housing Policy predicts that the overall tenure mix will be roughly stable for the
next 20 years, and while home-ownership rates may rise slightly, rental demand will be sustained
by growing groups in the population: immigrants, minorities (who make up 42% of all renters)
and older and younger people (especially the children of the 'baby boomers') (CHP, 2003).
Housing costs
In our 1996 report, the US housing-cost data used were not full enough to permit relative-cost
calculations for social renting. One striking point that emerges from the latest data is the low
average cost of social housing compared to owner-occupation. The data are still imperfect; the
housing-expenditure figure for Young Entrant Mid-Life social tenants in Table 2 is the average
monthly cost of social housing for all groups (rather than Young Entrants and Mid-Life
households specifically). The true Mid-Life figure in particular would certainly be somewhat
higher than this (the average difference between Young Entrant Mid-Life costs for other types of
housing is 16%, which would imply a Mid-Life social-renting cost of $241). Despite the
limitations of the data, it is clear that social housing is very cheap compared to owner-
occupation.

International trends in housing tenure and mortgage finance
November 2004 141
Table 2: Actual expenditures on housing, $ US / month
Young Entrant Mid-Life1
1991 20012 1991 2001
Owner-occupier 638 915 781 1058
Social tenant N/A 2083 N/A 208
Private tenant 522 641 580 776Source: US Census Bureau American Housing Survey for the United States: 1991 and 2001; Simmons 2000 Table 5.10; Bonette 2003 Notes: 1- Married couple households with or without children, householder aged 35-44. 2 - Married couple households with or without children; householder aged 25-29. 3 - Average monthly housing cost in 1998 ($193) for all age groups, inflated by US CPI to 2001.
Table 3: Relative expenditures on housing (owner-occupation = 100%)
Young Entrant Mid-Life
1991 2001 1991 2001
Social tenant N/A 23 N/A 20
Private tenant 82 70 74 73Source: Authors' calculations
The cost of private rental relative to the cost of owner-occupation has fallen for young
households in the last ten years. In 1991, the average amount paid for rent was 81% of the
average expenditure on owner-occupation; by 2001 this had fallen to 70%. For middle-aged
households the proportion remained roughly constant at about 75%.
Table 4: Housing costs for owner-occupiers in 2000, $ US
Young Entrant Mid-Life
Average house price 114,000 129,000
Average down payment on a mortgage 27,000 30,000
Median gross interest rate on first mortgage 7.5%
Median monthly cost for first mortgage 669 Source: Bennefield 2003, Federal Housing Board monthly interest rate survey, 2001 American Housing Survey, calculations based on the above.
In 2001, 62% of all owner-occupiers were purchasing with a mortgage and 38% owned outright.
According to the Federal Housing Board, the average LTV ratio was 76% in 2001 for
conventional mortgages on single-family homes. The down payment figures shown in Table 4
were derived by applying this ratio to the respective average house prices. In fact, however, it is
probably reasonable to assume that down payments for Young Entrant are generally lower than
the figure shown, and Mid-Life down payments are higher.

CML Research
142 November 2004
Mortgage system
Of all first mortgages in existence in 2001, 82% were fixed rate (over the full term) and self-
amortising. Small percentages of mortgages took other forms, including variable rate, variable
term, graduated payment and "balloon" (a mortgage with a shorter term than that over which the
principal and interest are amortised, with options to refinance or repay at the end of that term). In
2001, 63% of first mortgages in existence were for 30 years and about 16% for 15 years, with a
range of other terms and a small number of variable terms. There has been a gradual post-war
trend for mortgage terms to increase.
The Federal Housing Board's monthly interest rate survey showed that for conventional single-
family mortgages in 2001, the average loan-to-value (LTV) ratio was 76%, which represented a
slight fall since the early 1990s. 21% of loans had an LTV ratio over 90%, which again was a
slight fall. One in six borrowers put down five per cent or less. Typical specialised "affordable"
loans, such as those provided by Fannie Mae, may require only three per cent down. Lenders
usually require additional credit checks if loaning more than 80% of home value, and usually
require private mortgage insurance for LTV ratios over 80%. LTVs of over 100% can be found,
but usually at higher-than-average rates of interest.
Taxes and subsidies
There have been few changes in the treatment of housing by the US federal government since our
last report. However, states and municipal authorities have their own tax and subsidy systems,
which vary enormously.
Housing is treated as a consumption good and receives favourable tax treatment. The imputed
rent of owner-occupied housing is not taxed, nor, after a two-year holding period, are capital
gains (up to $250,000 for a single person, or $500,000 for couples). Owner-occupiers can deduct
mortgage interest (on loans of up to $1,000,000) and real estate taxes from their income for tax
purposes, at their marginal tax rate. Rental housing may benefit from accelerated depreciation
for tax purposes. However, housing is heavily taxed by local government and is one of the most
heavily regulated sectors of the economy.
These tax benefits undoubtedly favour owner-occupation relative to the private rental sector.
This is particularly true for higher income households who pay a higher marginal tax rate, and
therefore face a lower after-tax cost than do households facing a lower marginal tax rate or
households who do not itemise (claim tax deductions individually, rather than applying a
standard figure).

International trends in housing tenure and mortgage finance
November 2004 143
Over the 1990s, Fannie Mae and Freddie Mac introduced several new schemes to help first-time
buyers and people on incomes up to 80% of area median to buy their own homes. People in
"underserved areas" (census tracts with average income below 90% of area median, or average
income below 120% of area median and over 30% minority population), veterans, and people in
some rural areas are eligible for special assistance.
The recently announced "American Dream Down Payment Programme" will give federal grants
to low-income households for down payments on owner occupied homes.
Problems accessing housing
After a big drop in affordability in the 1980s, home-ownership became more affordable for first-
time-buyer, low-income and minority households in the 1990s, and this partly accounts for its
growth. However, price inflation in the late 1990s reduced the number of homes affordable to
those on low incomes. The recent bipartisan Millennium Housing Commission argued that
"affordability is the single greatest housing challenge facing the nation" (MHC 2002:14).
The total number of households receiving federal assistance with housing rose steadily from the
1950s to the mid-1990s, but then stabilised, although the total number of US households
continued to grow. Only about one-third of those eligible for federal assistance receive it. The
total number of rental homes affordable to those on moderate incomes (defined as 60-120% of
area median) has fallen sharply due to market movements and the expiry of temporary contracts
associated with past federal subsidies.
Differences in home-ownership rates between ethnic groups have been a longstanding concern in
the US. In 2001, the overall home-ownership rate was 68% of households, but for non-Hispanic
whites it was 74%, for blacks 48% and for Hispanics 47%. Minority home-ownership rates have,
however, increased faster than overall home-ownership rates over the last 30 years.
Risk reduction
There is a well-developed market for mortgage insurance in the US. Lenders usually require
borrowers to take out private mortgage insurance for LTV ratios over 80%. For mortgages taken
out since 1999, PMI is automatically cancelled when the LTV falls to 78%. Unemployed
borrowers are not eligible for state benefits to cover mortgage payments.
References
Information provided by R. Tunstall Archer, W., Ling, D. and McGill, G. (2002) Prepayment risk and lower-income mortgage

CML Research
144 November 2004
providers pp279-321 in eds. Retsinas, NP and Belsky, ES Low income home-ownership:
Examining the unexamined goal Washington DC: Brookings Institution
Bennefield, R. (2003) Home values: 2000 Census 2000 Brief Washington, DC: Government
Printing Office
Bonnette, R. (2003) Housing costs of renters: 2000 Census 2000 Brief Washington, DC:
Government Printing Office
Collins, M; Crowe, D and Carliner, M (2002) Supply side constraints on home-ownership;
pp175-199 in eds. Retsinas, NP and Belsky, ES Low income home-ownership: Examining the
unexamined goal Washington DC: Brookings Institution
DeNavas-Walt, C. and Cleveland, R. (2002) Money income in the United States: 2001
Washington, DC: Government Printing Office
Freeman, A, Holmans, A, and Whitehead, CME (1996) Is the UK Different? International
Comparisons of Tenure Patterns Council of Mortgage Lenders, London
Joint Center for Housing of Harvard University (2003) The state of the nation's housing Harvard,
Conn: Joint Center for Housing of Harvard University
Millennial Housing Commission (2002) Meeting our nation's housing challenges: Report of the
bipartisan millennial housing commission appointed by the Congress of the United States
Washington, DC: Government Printing Office
National Low-Income Housing Coalition (2003) 2003 Advocates' guide to housing and
community development policy Washington, DC: NLIHC
Quercia, R., Stegman, M., Davis,W. and Stein,E. (2002) Performance of community
reinvestment loans: Implications for secondary purchasers pp348-380 in eds. Retsinas, NP and
Belsky, ES Low income home-ownership: Examining the unexamined goal Washington DC:
Brookings Institution
Retsinas, N. and Belsky, E. (2002) Low income home-ownership: Examining the unexamined
goal Washington DC: Brookings Institution
Simmons, P. ed. (2000) Housing statistics of the United States 3rd edn. Washington DC: Bernan
Press
US Census Bureau (2002a) American Housing Survey for the United States: 2001 Washington,
DC: Government Printing Office
US Census Bureau (2002b) US 2000: Summary population and housing characteristics Part 1
Washington, DC: Government Printing Office
US Census Bureau (2002c) US 2000: Summary social, economic and housing characteristics
Part 1 Washington, DC: Government Printing Office
www.fanniemae.com
International trends in housing tenure and mortgage finance
November 2004 145
Other CML Publications Visit the CML website at www.cml.org.uk for a full listing of CML publications and access to a wide range of freely
available research and information.
Housing Finance � published quarterly this authoritative journal provides in-depth articles on a wide range of mortgage
related issues. Recent articles include: Policy Update �regulation round up, Mortgage equity withdrawal and remortgaging
activity, Exploring attitudes to housing wealth and retirement, Affordability: testing times ahead, Home ownership solutions
for low demand areas, Has devolution made a difference? The pace of change in Scottish housing policy. Members can
access Housing Finance free of charge on the members-only part of the CML website (www.cml.org.uk).
Annual subscription: Members £60.00 (paper copy) Academics £60.00 Non-Members £115.00
CML Market Briefing � an online publication providing an in depth monthly market commentary and up-to-the-minute
statistics on the housing and mortgage markets. Members can access Market Briefing free of charge on the members-only
part of the CML website (www.cml.org.uk). Non-members need to subscribe to a monthly email service to receive this
information and will also receive ad hoc emails containing latest CML market forecasts and other pieces of analysis.
Annual subscription: Non-Members £235.00 (including VAT)
CML News and Views � a fortnightly six-page newsletter providing a lively digest of information, opinions and
perspectives on the UK mortgage and housing markets. Bulk subscriptions are available.
Subscription: Members £40.00 Academics £40.00 Non-members £65.00
CML Research Reports � research is commissioned and published on a range of strategic issues by experts in the field.
Research reports are now available to access free of charge on the CML website (www.cml.org.uk).
Recent reports include:
The CML Mortgage Market Manifesto: Taking the past into the future (February 2004) Sue Anderson
The mortgage backed securities market in the UK: overview and prospects (September 2003) Alan Holmans et al
Who's counting? Demand for homes in Wales 1998 - 2016 (July 2003) Alan Holmans
Giving Credit where it's due: Home-owners and Tax Credits (April 2003) Steve Wilcox
Residential Stamp Duty: Time for a Change (April 2003) Mark Andrew et al
To request a free trial of Housing Finance or News and Views please call Liz Porter on 020 7440 2229 or email

International trends inhousing tenure and mortgage finance
CML IResearchCouncil of Mortgage Lenders
3 Savile Row, London W1S 3PB