cmg first state global umbrella fund p · first state global umbrella fund plc directors’ report...
TRANSCRIPT
First StateGlobal Umbrella Fund plc
2017 Annual Report

First State Global Umbrella Fund PLC
Table of Contents
Directors’ Report 1
Investment Managers’ report and schedules of investment:
First State Asian Growth Fund 5
First State China Growth Fund 16
Stewart Investors Worldwide Leaders Fund 24
First State Hong Kong Growth Fund 30
First State Indian Subcontinent Fund 39
First State Global Bond Fund 48
First State High Quality Bond Fund 60
First State Long Term Bond Fund 73
First State Greater China Growth Fund 79
First State Singapore and Malaysia Growth Fund 88
First State Asia Opportunities Fund 94
First State Asian Equity Plus Fund 102
First State Asian Bond Fund 114
First State Asian Quality Bond Fund 125
Stewart Investors Global Emerging Markets Leaders Fund 137
First State Global Resources Fund 145
First State Global Property Securities Fund 156
First State Asian Property Securities Fund 163
First State China Focus Fund 171
First State Global Listed Infrastructure Fund 178
First State Asia Pacific Select Fund 187
Stewart Investors Worldwide Equity Fund 196
First State Emerging Markets Bond Fund 204
First State Global Credit Income Fund 213
First State Asia Pacific All Cap Fund 233
First State Japan Equity Fund 243
First State Sustainable Listed Infrastructure Fund 251
Statement of Financial Position 256
Statement of Comprehensive Income 276
Statement of Changes in Net Assets Attributable to Redeemable Participating
Shareholders 286
Statement of Cashflows 291
Distribution Statement (Unaudited) 303
Notes forming part of the financial statements 321

First State Global Umbrella Fund PLC
Table of Contents (continued)
Supplementary Information 422
Appendix 426
Depositary’s Report to the Shareholders 427
Independent Auditors’ Report 428
Directory 431
This annual report does not constitute an offer to sell or a solicitation of an offer to buy shares in
any of the sub-funds (“Funds”) of First State Global Umbrella Fund Plc (the “Company”).
Subscriptions are to be made only on the basis of the information contained in the Company’s
prospectus, and the relevant key investor information document, as supplemented by the latest
semi-annual and annual reports.
The following sub-funds of First State Global Umbrella Fund PLC are not authorized in Hong
Kong and are not available to Hong Kong Residents as of 31 December 2017:
First State Asia Pacific All Cap Fund
First State Global Credit Income Fund
First State Sustainable Listed Infrastructure Fund

First State Global Umbrella Fund PLC
Directors’ Report
1
The Directors submit their Annual Report for the financial year ended 31 December 2017.
Activities, Business Review and Future Prospects
The Directors have directed the affairs of the Company in accordance with the Companies Act, 2014. A
detailed business review and future prospects are outlined in the Investment Managers’ Reports.
Risk Management Objectives and Policies
Investment in the Company involves a number of risks. Details of the general and specific risks are
contained in the Prospectus. Details of the risks associated with financial instruments are included in Note
8.
Principal risks and uncertainties
The Company is an umbrella fund with segregated liability between sub funds. The principal risks facing
the Company relate primarily to the holding of financial instruments and markets in which it invests. The
most significant types of financial risk to which the Company is exposed to are market risk, credit risk
and liquidity risk. Market risk includes other price risk, currency risk and interest rate risk. Details of the
risks associated with financial instruments are included in Note 8.
Results and Dividends
The results for the financial year are shown in the Statement of Comprehensive Income on pages 276-
285. Details of the dividends declared during the financial year in respect of certain Funds by the
Directors are shown in the Distribution Statement on pages 303-320. The Directors did not declare or pay
dividends on any of the Funds not mentioned in the Distribution Statement.
Directors
Mr Peter Blessing is a Director and the Chairman of the Company. Ms Bronwyn Wright, Mr Kevin
Molony, Mr Chris Turpin, Ms Kate Dowling and Mr Adrian Hilderly are also the Directors of the
Company. The Directors of the Company are detailed on page 431.
Directors' Responsibility Statement
Company law requires the directors to prepare Company financial statements for each financial year.
Under that law the directors have elected to prepare the financial statements in accordance with Irish Law
and International Financial Reporting Standards (IFRS's) as adopted by the European Union (“EU”) and
applicable law.
Irish company law requires the Directors to prepare financial statements for each financial year that give
a true and fair view of the assets, liabilities and financial position of the Company and of the Statement
of Comprehensive Income of the Company for that financial year. In preparing the financial statements,
the Directors are required to:
select suitable accounting policies and then apply them consistently;
make judgements and estimates that are reasonable and prudent;
state whether the financial statements have been prepared in accordance with IFRS as adopted by the
EU and ensure that they contain additional information required by the Companies Act, 2014; and
prepare the financial statements on the going concern basis unless it is inappropriate to presume that
the Company will continue.
The Directors confirm that they have complied with the above requirements in preparing the financial
statements.

First State Global Umbrella Fund PLC
Directors’ Report (continued)
2
Directors' Responsibility Statement (continued)
The Directors are responsible for keeping adequate accounting records which disclose with reasonable
accuracy at any time the financial position of the Company and to enable them to ensure that the financial
statements comply with the Irish Companies Act, 2014 (the “Companies Act”) and the Central Bank
(Supervision and Enforcement) Act 2013 (section 48(1)) (Undertakings for Collective Investment in
Transferable Securities) Regulations 2015 (the “Central Bank UCITS Regulations”). They are also
responsible for safeguarding the assets of the Company and hence for taking reasonable steps for the
prevention and detection of fraud and other irregularities.
Under the Central Bank UCITS Regulations, the Directors are required to entrust the assets of the
Company to the Depositary for safe-keeping. In carrying out this duty, the Directors have delegated
custody of the Company’s assets to HSBC Institutional Trust Services (Ireland) DAC.
The Directors are responsible for the maintenance and integrity of the financial statements which are
included on the Company’s website (www.firststate.co.uk). Legislation in the Republic of Ireland
governing the preparation and dissemination of financial statements may differ from legislation in other
jurisdictions.
The financial statements of the Company may be included on the website of First State Investments
(www.firststate.co.uk). The work carried out by the auditors does not involve consideration of the
maintenance and integrity of the Company's financial information which has been included on the
aforementioned website. Accordingly, the auditors accept no responsibility for any changes that may
have occurred to the financial statements since they were initially presented on the aforementioned
website.
Adequate Accounting Records
The Directors are responsible for keeping adequate accounting records that disclose with reasonable
accuracy at any time the financial position of the Company and enable them to ensure that the financial
statements are prepared in accordance with International Financial Reporting Standards (IFRS's) as
adopted by the EU and comply with the Irish Companies Act, 2014 and the Central Bank UCITS
Regulations.
The measures taken by the Directors to secure compliance with the Company’s obligation to keep
adequate accounting records are the use of appropriate systems and procedures and employment of
competent persons. To this end the Directors have engaged HSBC Securities Services (Ireland) DAC as
Administrator and Bradwell Limited as Secretary. The accounting records are kept at 1 Grand Canal
Square, Grand Canal Harbour, Dublin 2.
Corporate Governance Code
The Board of Directors has assessed the measures included in the voluntary Corporate Governance Code
for Collective Investment Schemes and Management Companies as published by Irish Funds in
December 2011 (the “IF Code”). The Board adopted the IF Code with effect from 20 November 2012
and it follows the corporate governance practices and procedures in the IF Code.

First State Global Umbrella Fund PLC
Directors’ Report (continued)
3
Directors and Secretary’s Interests in the Share Capital of the Company
The Secretary did not hold any interest, beneficial or otherwise, in the share capital of the Company
during or at the end of the financial year.
Details of Directors Interests in the Share Capital of the Company are disclosed in Note 14 to these
financial statements.
Connected persons
In accordance with the requirements of the Central Bank UCITS Regulations, all transactions carried out
with the Company by the management company or depositary of a UCITS, and the delegate or sub-
delegates of such a management company or depositary (excluding any non-group company sub-
depositarys appointed by a depositary), and any associated or group companies of such a management
company, depositary, delegate or sub-delegate (“connected persons”) must be carried out as if negotiated
at arm's length and be in the best interests of shareholders. The Directors are satisfied that there are
arrangements in place to ensure that the obligations set out in the Central Bank UCITS Regulations are
applied to all transactions with connected persons and transactions with connected persons entered into
during the period complied with the obligations set out in the Central Bank UCITS Regulations.
Significant events during the financial year
Details of significant events during the financial year are disclosed in Note 16 to these financial
statements.
Subsequent Events
Details of subsequent events are disclosed in Note 17 to these financial statements.
Audit Committee
In accordance with section 167(1) to 167(3) of the Companies Act, 2014 there is a requirement for certain
companies to establish an audit committee and the decision to do so, or not to do so, must be documented
and explained in the Directors’ report. As the Company satisfies all the criteria to be called a “large
company”, the Company has established an audit committee. The members of audit committee are
Bronwyn Wright, Kevin Molony and Kate Dowling.
Independent Auditors
The independent auditors, PricewaterhouseCoopers, will be re-appointed in accordance with section
383(2) of the Companies Act, 2014.

First State Global Umbrella Fund PLC
Directors’ Report (continued)
4
Directors Compliance Statement
The Directors confirm, in accordance with Section 225 of the Companies Act, 2014 that the following
has been completed:
- a compliance policy document has been drawn up that sets out policies that, in our opinion, are
appropriate to the Company, respecting compliance by the Company with its relevant obligations;
- appropriate arrangements or structures are in place that are, in our opinion, designed to secure
material compliance with the Company's relevant obligations; and
- during the year ended 31 December 2017, the arrangements or structures referred to above have been
reviewed.
Audit Information Statement
As per Section 330 of the Companies Act, 2014
- so far as the Directors are aware, there is no relevant audit information of which the Company’s
statutory auditors are unaware; and
- the Directors have taken all the steps that they ought to have taken as directors in order to make them
aware of any relevant audit information and to establish that the Company’s statutory auditors are
aware of that information.
20 April 2018

First State Asian Growth Fund
Investment Manager’s Report (Unaudited)
5
Performance
01/01/14 01/01/15 01/01/16 01/01/17
To To To To
31/12/14 31/12/15 31/12/16 31/12/17
First State Asian Growth Fund “the Fund”
- Class I 13.14% -2.40% -1.10% 24.33%
- Class II 12.37% -3.12% -1.32% 24.31%
- Class III 14.55% -1.21% -0.13% 25.16%
- Class I (Dist)^ 13.15% -2.43% -1.06% 24.30%
- Class IV 12.61% -2.97% -1.57% 23.71%
- Class VI^* 3.40% -1.84% -0.39% 25.12%
- Class VI (Dist)^** n/a n/a 4.77% 25.11%
MSCI A/C Asia Ex Japan Free Index (total return)# 5.10% -8.90% 5.76% 41.72%
MSCI A/C Asia Ex Japan Free Index (total return) # -1.03% -8.90% 5.76% 41.72%
(Performance calculation is based on official dealing net asset value (NAV) per share)
^ Dividend adjustment return
*Inception date – 10 June 2014
**Inception date – 8 January 2016
#Benchmarks are being included for illustrative purposes and there is no guarantee that a fund will outperform a benchmark.
Past performance is no indication of current or future performance and the performance data does not take account of
commissions and costs incurred in the issue and redemption of units.
The MSCI AC Asia ex Japan index increased by 41.7% in US dollar terms in the 12 months to the end of
December 2017. China and South Korea outperformed, while Pakistan and Indonesia lagged. On a sector level,
Information Technology and Real Estate gained the most, while Utilities and Telecom Services were the weakest.
On portfolio holdings, Taiwan Semiconductor (TSMC) continued to benefit from the ramp up in sales of
the Apple iPhone. TSMC has maintained its leading competitive edge in technology and precision manufacturing,
with revenue growth expected to accelerate as its 7nm chips gain market share. HDFC Bank strengthened on the
back of increased net profits, driven by strong asset growth and higher net interest income despite the temporary
disruption from demonetisation and the public sector banks’ recapitalisation. Oversea-Chinese Banking Corp rallied
on the back of improved profitability metrics and higher loan growth. Asset quality seems to have stabilised,
although oil and gas – which makes up around half of OCBC’s total non-performing loans – has yet to stage a
recovery.
Detracting from performance, Global Brands Group struggled to meet earnings expectations amid the
ongoing disruption in the US retail sector. Retail bankruptcies led to the loss of several brand licences which
impacted the group’s revenue. Dr Reddy’s Laboratories underperformed, as a series of inspections from the US
Food and Drug Administration (FDA) led to concerns around quality control issues, while delays to a number of its
product launches caused lacklustre sales growth and compressed margins. Lupin continued to face challenges in the
US generics market as the rate of price erosion has been exacerbated by consolidation in the distributor space.
Significant purchases over the year included Midea Group, China’s largest home appliances company. A
strong emphasis on R&D, streamlined products and greater control over distributors has resulted in market share
gains for almost all of its products. We also purchased ComfortDelgro, a well-managed and returns-focused bus,
rail and taxi operator. The company has faced competitive headwinds from UBER, GRAB and other car-sharing
apps, but we believe its high free cash flow yield and rising dividend makes it reasonably defensive.
We sold Infosys Technologies on concerns around the political in-fighting between the founders and the
management which eventually led to the resignation of the CEO Vishal Sikka and divested Dr Reddy’s Laboratories
after the company reported weak earnings due to regulatory challenges and price erosion in the US market.

First State Asian Growth Fund
Investment Manager’s Report (Unaudited) (continued)
6
Our generally cautious stance, as well as overall portfolio positioning has not changed very much in the
last 12 months. Stock markets in Asia and globally have shot through previous highs, as investors remain sanguine
on the prospect of the global economic recovery continuing into 2018. Weak inflationary pressures have called into
question the need for tightening measures, which has added to the market’s bullish sentiment. However, history and
our experience suggest that such benign conditions do not endure; although we do not know what the catalyst will
be or when it will appear, we are mindful of a potential reversal in fortunes and – at current heady valuations – the
growing risks to capital preservation. On the other hand, our longer-term time horizon means that we are able to
look past the short-term noise. While there is plenty to worry about on a macro level, there are still plenty of
opportunities for the bottom-up investor. We have added to quality companies in our portfolio and continue to prefer
exporters and US dollar earners as being amongst Asia’s more competitive companies.
First State Investments (Hong Kong) Limited
February 2018

First State Asian Growth Fund
Performance Table
as of 31 December 2017 (Unaudited)
7
Financial period Total net asset
value
Net asset
value per
share
Class I
Dec 2015 US$ 284,238,854 US$ 38.15
Dec 2016 US$ 256,302,239 US$ 37.73
Dec 2017 US$ 244,622,790 US$ 46.91
Class II
Dec 2015 US$ 1,286,456 US$ 89.43
Dec 2016 US$ 1,268,021 US$ 88.25
Dec 2017 US$ 1,388,295 US$ 109.70
Class III
Dec 2015 US$ 77,463,204 US$ 46.52
Dec 2016 US$ 70,524,994 US$ 46.46
Dec 2017 US$ 39,663,763 US$ 58.15
Class I Distributing
Dec 2015 US$ 59,177,001 US$ 35.87
Dec 2016 US$ 12,360,475 US$ 35.34
Dec 2017 US$ 13,952,293 US$ 43.69
Class IV
Dec 2015 US$ 10,411,005 US$ 11.44
Dec 2016 US$ 11,332,894 US$ 11.26
Dec 2017 US$ 14,134,038 US$ 13.93
Class VI
Dec 2015 US$ 124,059,275 US$ 10.15
Dec 2016 US$ 119,010,236 US$ 10.11
Dec 2017 US$ 143,967,172 US$ 12.65
Class VI Distributing
Dec 2016 US$ 54,264,539 US$ 10.41
Dec 2017 US$ 96,262,542 US$ 12.89

First State Asian Growth Fund
Performance Table (continued)
as of 31 December 2017 (Unaudited)
8
Financial period The highest issue
price
The lowest
redemption
price
Class I
Dec 2008 US$ 28.27 US$ 13.69
Dec 2009 US$ 24.87 US$ 14.43
Dec 2010 US$ 31.90 US$ 22.38
Dec 2011 US$ 34.03 US$ 26.87
Dec 2012 US$ 35.93 US$ 28.78
Dec 2013 US$ 37.42 US$ 32.04
Dec 2014 US$ 40.69 US$ 32.31
Dec 2015 US$ 43.71 US$ 36.32
Dec 2016 US$ 41.36 US$ 34.01
Dec 2017 US$ 46.91 US$ 37.76
Class II
Dec 2008 NA* US$ 33.63
Dec 2009 NA* US$ 35.40
Dec 2010 NA* US$ 54.61
Dec 2011 NA* US$ 64.89
Dec 2012 NA* US$ 69.20
Dec 2013 NA* US$ 76.46
Dec 2014 NA* US$ 76.77
Dec 2015 NA* US$ 85.33
Dec 2016 NA* US$ 79.69
Dec 2017 NA* US$ 88.32
*No further class II shares have been offered since 30 July 1999

First State Asian Growth Fund
Performance Table (continued)
as of 31 December 2017 (Unaudited)
9
Financial period The highest issue
price
The lowest
redemption
price
Class III
Dec 2008 US$ 31.20 US$ 15.28
Dec 2009 US$ 28.15 US$ 16.16
Dec 2010 US$ 36.57 US$ 25.36
Dec 2011 US$ 39.29 US$ 31.09
Dec 2012 US$ 42.20 US$ 33.59
Dec 2013 US$ 44.17 US$ 37.88
Dec 2014 US$ 48.82 US$ 38.49
Dec 2015 US$ 52.86 US$ 44.12
Dec 2016 US$ 50.82 US$ 41.50
Dec 2017 US$ 58.15 US$ 46.50
Class I Distributing
Dec 2008 US$ 27.93 US$ 13.45
Dec 2009 US$ 24.22 US$ 14.10
Dec 2010 US$ 30.99 US$ 21.79
Dec 2011 US$ 32.95 US$ 25.93
Dec 2012 US$ 34.41 US$ 27.71
Dec 2013 US$ 35.75 US$ 30.61
Dec 2014 US$ 38.39 US$ 30.82
Dec 2015 US$ 41.21 US$ 34.15
Dec 2016 US$38.74 US$ 31.98
Dec 2017 US$ 43.69 US$ 35.36

First State Asian Growth Fund
Performance Table (continued)
as of 31 December 2017 (Unaudited)
10
Financial period The highest issue
price
The lowest
redemption
price
Class IV
Dec 2011 US$ 10.49 US$ 8.24
Dec 2012 US$ 10.95 US$ 8.79
Dec 2013 US$ 11.38 US$ 9.74
Dec 2014 US$ 12.29 US$ 9.79
Dec 2015 US$ 13.16 US$ 10.91
Dec 2016 US$ 12.37 US$ 10.20
Dec 2017 US$ 13.93 US$ 11.27
Class VI
Dec 2014 US$ 10.74 US$ 9.83
Dec 2015 US$ 11.59 US$ 9.65
Dec 2016 US$ 11.06 US$ 9.06
Dec 2017 US$ 12.65 US$ 10.12
Class VI Distributing
Dec 2016 US$ 11.39 US$ 9.39
Dec 2017 US$ 12.89 US$ 10.42

First State Asian Growth Fund
Schedule of Investments
as of 31 December 2017
11
The schedule that follows includes financial assets designated at fair value through profit or loss
Number of
shares
Fair value
US$
% of net
assets
Australia (2016: 28,660,959, 5.46%) 27,398,125 4.95
Newcrest Mining 1,535,809 27,398,125 4.95
Bermuda (2016: 13,750,889, 2.62%) 7,522,861 1.36
Global Brands Group Holding 91,868,825 7,522,861 1.36
China (2016: 14,459,178, 2.75%) 37,111,576 6.70
China Mengniu Dairy 2,729,000 8,118,231 1.47
Midea Group 2,041,739 17,389,919 3.14
Sun Art Retail Group 10,979,215 11,603,426 2.09
Hong Kong (2016: 108,097,675, 20.59%) 92,726,069 16.74
AIA Group 700,800 5,976,255 1.08
Cathay Pacific Airways 4,169,000 6,465,013 1.17
CK Hutchison Holdings 1,615,032 20,271,461 3.66
Dairy Farm International Holdings 2,681,200 21,074,232 3.80
Hong Kong & China Gas 8,288,521 16,246,908 2.93
Jardine Matheson Holdings 247,059 15,008,834 2.71
Swire Pacific "A" 830,000 7,683,366 1.39
India (2016: 144,465,653, 27.51%) 122,491,344 22.11
Axis Bank 606,598 5,359,617 0.97
HDFC Bank 767,531 22,515,766 4.06
Housing Development Finance 822,194 22,032,519 3.98
Idea Cellular 7,962,035 13,490,957 2.44
Kotak Mahindra Bank 689,575 10,913,927 1.97
Lupin 520,237 7,214,160 1.30
Tata Consultancy Services 555,241 23,497,975 4.24
Tech Mahindra 2,211,761 17,466,423 3.15
Indonesia (2016: Nil) 15,204,012 2.74
Bank Central Asia 5,161,700 8,331,765 1.50
Indocement Tunggal Prakarsa 4,247,800 6,872,247 1.24

First State Asian Growth Fund
Schedule of Investments (continued)
as of 31 December 2017
12
Number of
shares
Fair value
US$
% of net
assets
Japan (2016: 8,317,685, 1.58%) 11,767,506 2.12
Nippon Paint 68,900 2,182,782 0.39
Ryohin Keikaku 12,200 3,805,385 0.69
Unicharm 222,000 5,779,339 1.04
Philippines (2016: Nil) 529,959 0.10
Universal Robina 174,890 529,959 0.10
Singapore (2016: 52,634,007, 10.03%) 70,262,826 12.68
ComfortDelGro 7,220,100 10,702,050 1.93
Great Eastern Holdings 563,500 11,672,440 2.11
Jardine Cycle & Carriage 333,700 10,159,888 1.83
Oversea Chinese Banking 2,946,818 27,332,741 4.93
Singapore Telecommunications 3,889,800 10,395,707 1.88
South Korea (2016: 32,623,143, 6.21%) 40,913,722 7.38
Amore Pacific Group 39,968 5,285,830 0.95
Hanon Systems 549,370 7,162,447 1.29
Hanssem 36,322 6,132,308 1.11
LG Chemical 14,128 5,366,825 0.97
LG Household & Health Care 4,796 5,348,632 0.96
Naver 14,237 11,617,680 2.10
Taiwan (2016: 105,243,731, 20.05%) 97,632,264 17.62
Asustek Computer 606,000 5,712,932 1.03
Delta Electronics Industrial 1,827,000 8,842,907 1.60
Giant Manufacturing 1,798,000 9,915,441 1.79
MediaTek 1,668,000 16,540,475 2.98
President Chain Store 1,080,760 10,352,666 1.87
Taiwan Semiconductor Manufacturing 3,861,465 29,890,927 5.39
Uni-President Enterprises 7,356,709 16,376,916 2.96
Thailand (2016: 13,590,165, 2.59%) 17,264,047 3.12
Delta Electronics 2,964,000 6,661,951 1.20
Kasikorn Bank 1,445,700 10,602,096 1.92

First State Asian Growth Fund
Schedule of Investments (continued)
as of 31 December 2017
13
Number of
shares
Fair value
US$
% of net
assets
Total financial assets designated at fair value through
profit or loss*
540,824,311 97.62
Cash and other net assets 13,166,582 2.38
Total net assets attributable to redeemable participating
shareholders
553,990,893 100.00
Total cost of financial assets designated at fair value
through profit or loss (2016: 509,384,580) 430,362,825
Analysis of net investments
% of total
assets
*Transferable securities admitted to an official stock
exchange listing or traded on a regulated market
540,824,311 96.16

First State Asian Growth Fund
Portfolio Changes (Unaudited)
14
The schedule of portfolio changes is based on financial assets designated at fair value through
profit or loss
Number of
shares purchased
Number of
shares sold
AIA Group 289,600 68,600
Amore Pacific Group 57,118 72,609
Asustek Computer - 359,000
Axis Bank 606,598 -
Bank Central Asia 5,161,700 -
Cathay Pacific Airways - 696,000
China Mengniu Dairy 3,184,000 455,000
CK Hutchison Holdings 290,000 1,580,000
ComfortDelGro 8,136,500 916,400
Dairy Farm International Holdings 306,400 412,300
Delta Electronics - 3,004,000
Delta Electronics Industrial - 519,000
Dr Reddys Laboratories - 469,246
Giant Manufacturing - 300,000
Global Brands Group Holding 3,700,000 15,350,000
Godrej Consumer Products 110,524 294,018
Great Eastern Holdings - 94,100
Hanon Systems 603,886 54,516
Hanssem 36,322 -
HDFC Bank - 231,236
Hong Kong & China Gas 1,030,956 3,052,000
Housing Development Finance 319,648 266,073
Idea Cellular 1,212,465 3,231,509
Indocement Tunggal Prakarsa 4,957,500 709,700
Infosys Technologies - 1,668,752
Jardine Cycle & Carriage 16,700 55,700
Jardine Matheson Holdings 58,405 41,000
Kasikorn Bank 1,687,300 241,600
Kotak Mahindra Bank 191,998 83,142
LG - 160,800
LG Chemical - 29,808
LG Household & Health Care 7,887 11,807
Li & Fung - 34,252,000
Lupin 293,293 37,921
Mahindra & Mahindra 162,243 464,399
MediaTek - 769,000
Midea Group 2,217,939 176,200
Naver 11,261 1,220
Newcrest Mining 163,725 585,802

First State Asian Growth Fund
Portfolio Changes (Unaudited) (continued)
15
Number of
shares purchased
Number of
shares sold
Nippon Paint 68,900 -
Oversea Chinese Banking 572,800 396,600
President Chain Store - 181,000
Ryohin Keikaku - 2,100
Shimano 15,400 34,100
Singapore Telecommunications - 2,292,300
Sun Art Retail Group 816,500 6,325,000
Swire Pacific "A" 830,000 -
Taiwan Semiconductor Manufacturing 324,000 2,277,000
Tata Consultancy Services 178,518 262,947
Tech Mahindra 795,987 236,568
Unicharm 121,000 16,700
Uni-President Enterprises 302,000 2,578,000
United Overseas Bank - 1
Universal Robina 174,890 -
The Schedule of Portfolio Changes in Investments reflects the aggregate purchases of a security
exceeding one percent of the total value of purchases for the year and aggregate sales of a security
exceeding one percent of the total sales for the year.

First State China Growth Fund
Investment Manager’s Report (Unaudited)
16
Performance
01/01/14 01/01/15 01/01/16 01/01/17
To To To To
31/12/14 31/12/15 31/12/16 31/12/17
First State China Growth Fund “the Fund”
- Class I -2.79% -4.01% -3.16% 55.74%
- Class II -2.96% -4.18% -2.90% 56.51%
- Class I (Dist)^ 2.79% -4.02% -3.17% 55.73%
MSCI China Free Index (total return)# 8.26% -7.62% 1.11% 54.07%
(Performance calculation is based on official dealing NAV per share)
^ Dividend adjustment return
#Benchmarks are being included for illustrative purposes and there is no guarantee that a fund will outperform a benchmark.
Past performance is no indication of current or future performance and the performance data does not take account of
commissions and costs incurred in the issue and redemption of units.
The MSCI China increased by 54.1% in 2017. Policy measures from the People’s Bank of China (PBoC)
helped to reduce capital outflows and provided support to the renminbi, which, against market expectations,
continued to appreciate against the US dollar. Meanwhile, reforms in the state-owned enterprise (SOE) sector
continued apace with the reorganization of several central SOEs and the introduction of mixed ownership plans.
The China Securities Regulatory Commission (CSRC) said that it encouraged listed SOEs to improve the dividend
pay-out and return excess capital to investors where there is an ability to do so. Midway through the year, MSCI
said that it would include China A-shares in the MSCI Emerging Markets Index from June 2018 onwards, which
provided further impetus for the market rally.
On portfolio holdings, Tencent rose to record highs as the firm announced strong net profits growth driven
by a surge in mobile payments and cloud services, while Minth was boosted by strong orders and new business
wins as it expanded its product range and grew its customer base. AAC Technologies, one of Apple’s main suppliers
of acoustic components (speaker boxes, receivers) and haptics (provides tactile feedback such as vibrations), also
added to performance as it reported a jump in profits and strong sales growth.
Detracting from performance, Tong Ren Tang Technology weakened over the year as it announced a
slowdown in profits. The company has a long history and a strong brand, but has struggled to achieve much growth.
Vipshop de-rated significantly as high customer acquisition costs and margin pressure led to lower revenue growth,
while Ctrip.com declined on concerns around greater competition in the online travel agency market.
Significant purchases over the year included Midea Group and Qingdao Haier, two leading home
appliances groups in China. For Midea, a strong emphasis on R&D, streamlined products and greater control over
distributors had resulted in market share gains for almost all of its products, while at Haier, the company had
strengthened its leadership in certain segments with better than expected execution.
We divested Li & Fung after it announced a set of weak results due to the ongoing tough retail environment.
Its traditional clients – US retailers such as Kohl’s and Macy’s – have closed thousands of stores, compressing Li
& Fung’s turnover as destocking takes place. We sold China Oilfield Services (COSL) as we believe the current rig
cycle is unlikely to recover anytime soon.

First State China Growth Fund
Investment Manager’s Report (Unaudited) (continued)
17
The 19th National Congress of the Communist Party took place in mid-October where, as expected, Xi
Jinping was strengthened as China’s leader and a number of the top leadership team were changed. We do not
expect major changes in policy, simply a continuation of reforms to reduce over-supply, rebalance the economy and
avoid a “hard landing”.
There have been positive signs that supply-side reforms are taking hold. In the past two years, capacity
closures in the coal and steel sectors have amounted to around 70-80% of the government’s target, providing a
catalyst for price increases and strong margin improvement for the remaining players. We expect further capacity
closures to carry forward in 2018, which we believe should eventually pass through to general price levels.
Contrary to investor expectations, the renminbi had appreciated by around 6% against the US dollar by the
end of 2017, reversing three years of depreciation. Despite the strength of China’s currency and its stable balance
of payments, we expect strict capital controls to remain in place in 2018. We expect the government to continue its
efforts to stem the outflow of capital from the mainland and encourage more investment domestically.
The China equity market has risen significantly over the past year and there are clear signs of market
exuberance. We believe investors are paying little attention to potential downside risks and as a result, valuations –
particularly for quality companies – are not cheap. As such, we maintain our cautious outlook and continue to look
for companies with a superior management team, a conservative balance sheet and good risk awareness.
First State Investments (Hong Kong) Limited
February 2018

First State China Growth Fund
Performance Table
as of 31 December 2017 (Unaudited)
18
Financial period Total net asset
value
Net asset
value per
share
Class I
Dec 2015 US$ 4,238,553,904 US$ 118.21
Dec 2016 US$ 3,517,075,286 US$ 114.47
Dec 2017 US$ 4,474,257,204 US$ 178.28
Class II
Dec 2015 US$ 2,935,699 US$ 180.70
Dec 2016 US$ 2,866,089 US$ 175.46
Dec 2017 US$ 3,509,472 US$ 274.62
Class I Distributing
Dec 2015 US$ 39,926,855 US$ 110.97
Dec 2016 US$ 24,345,791 US$ 107.15
Dec 2017 US$ 26,642,456 US$ 166.58
Financial period The highest issue
price
The lowest
redemption
price
Class I
Dec 2008 US$ 99.98 US$ 36.32
Dec 2009 US$ 90.70 US$ 43.43
Dec 2010 US$ 110.20 US$ 81.32
Dec 2011 US$ 106.40 US$ 46.81
Dec 2012 US$ 104.32 US$ 87.53
Dec 2013 US$ 127.59 US$ 100.20
Dec 2014 US$ 134.35 US$ 113.35
Dec 2015 US$ 149.42 US$ 105.57
Dec 2016 US$ 122.81 US$ 94.96
Dec 2017 US$ 181.75 US$ 114.61

First State China Growth Fund
Performance Table (continued)
as of 31 December 2017 (Unaudited)
19
Financial period The highest issue
price
The lowest
redemption
price
Class II
Dec 2008 NA* US$ 56.07
Dec 2009 NA* US$ 67.04
Dec 2010 NA* US$ 125.39
Dec 2011 NA* US$ 118.41
Dec 2012 NA* US$ 134.74
Dec 2013 NA* US$ 153.85
Dec 2014 NA* US$ 173.81
Dec 2015 NA* US$ 161.48
Dec 2016 NA* US$ 145.12
Dec 2017 NA* US$ 175.68
Class I Distributing
Dec 2008 US$ 97.13 US$ 34.99
Dec 2009 US$ 86.70 US$ 41.83
Dec 2010 US$ 105.32 US$ 77.72
Dec 2011 US$ 101.68 US$ 73.15
Dec 2012 US$ 98.93 US$ 83.26
Dec 2013 US$ 120.57 US$ 95.03
Dec 2014 US$ 126.84 US$ 107.12
Dec 2015 US$ 141.06 US$ 99.11
Dec 2016 US$ 114.95 US$ 89.14
Dec 2017 US$ 169.83 US$ 107.27
*No further Class II shares have been offered since 30 July 1999

First State China Growth Fund
Schedule of Investments
as of 31 December 2017
20
The schedule that follows includes financial assets designated at fair value through profit or loss
Number of
shares Fair value US$
% of net
assets
Bermuda (2016: 32,092,030, 0.91%) 55,560,907 1.23
Luye Pharma Group 70,380,000 55,560,907 1.23
China (2016: 2,310,743,073, 65.19%) 3,252,504,665 72.21
AAC Technologies Holdings 11,090,000 197,801,334 4.39
Baidu 352,308 82,700,780 1.84
China Blue Chemical 169,232,000 53,482,825 1.19
China Conch Venture Holdings 17,943,000 41,553,588 0.92
China Mengniu Dairy 38,321,000 113,997,332 2.53
China Merchants Bank 54,388,015 216,420,549 4.81
China National Accord Medicine 9,867,349 48,354,195 1.07
China Resources Phoenix Healthcare Holdings 53,742,666 67,800,207 1.51
China Resources Beer Holdings 18,872,000 67,730,720 1.50
China Resources Land 34,487,295 101,489,676 2.25
China Taiping Insurance Holdings 48,316,856 181,134,503 4.02
China Vanke 25,727,657 102,704,561 2.28
Ctrip Com International ADR 1,499,200 67,089,200 1.49
ENN Energy Holdings 27,832,000 198,529,105 4.41
Foshan Haitian Flavouring and Food 7,784,625 64,353,538 1.43
Fuyao Glass Industry 18,412,700 77,626,105 1.72
Gree Electric Appliances 21,006,211 141,052,769 3.13
Hangzhou Hikvision Digital Technology 15,230,879 91,272,938 2.03
Hangzhou Robam Appliances 6,043,360 44,665,891 0.99
Hongfa Technology 6,080,576 38,652,955 0.86
Jiangsu Hengrui Medicine 5,865,582 62,170,843 1.38
Midea Group 27,319,149 232,682,918 5.17
Qingdao Haier 29,350,912 84,967,914 1.89
Shanghai International Airport 12,446,714 86,082,759 1.91
Shanghai Liangxin Electrical 16,536,534 31,888,983 0.71
Shenzhen Inovance Technology 9,806,570 43,728,743 0.97
Shenzhou International Group Holdings 14,970,000 142,504,846 3.16
Sun Art Retail Group 41,093,316 43,429,630 0.96
Tencent Holdings 6,471,700 336,185,755 7.46
Tong Ren Tang Technologies 54,880,000 79,346,440 1.76
Yunnan Baiyao Group 3,544,479 55,438,309 1.23
Zhejiang Chint Electrics 6,374,423 25,613,270 0.57
Zhengzhou Yutong Bus 8,125,262 30,051,484 0.67
Hong Kong (2016: 825,020,789, 23.28%) 946,146,622 21.00
ASM Pacific Technology 8,601,600 119,851,099 2.66
China Resources Gas 6,212,000 22,533,020 0.50
First State China Growth Fund
Schedule of Investments (continued)
as of 31 December 2017
21
Number of
shares Fair value US$
% of net
assets
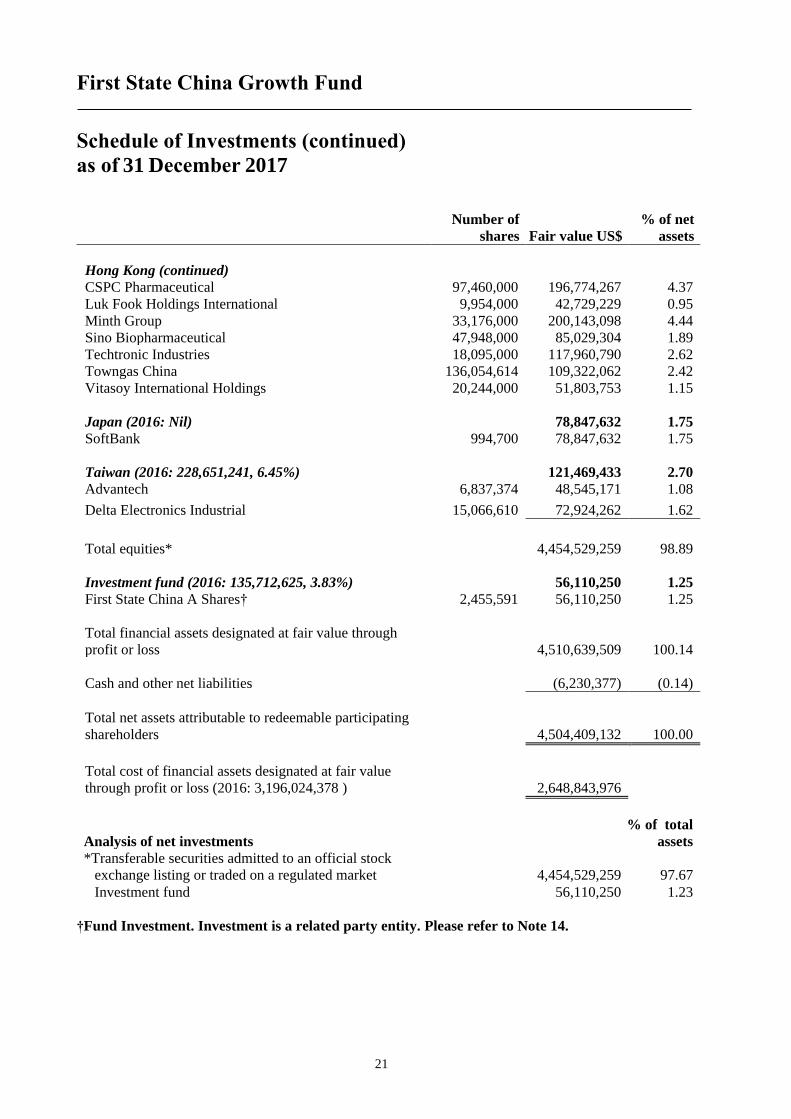
Hong Kong (continued)
CSPC Pharmaceutical 97,460,000 196,774,267 4.37
Luk Fook Holdings International 9,954,000 42,729,229 0.95
Minth Group 33,176,000 200,143,098 4.44
Sino Biopharmaceutical 47,948,000 85,029,304 1.89
Techtronic Industries 18,095,000 117,960,790 2.62
Towngas China 136,054,614 109,322,062 2.42
Vitasoy International Holdings 20,244,000 51,803,753 1.15
Japan (2016: Nil) 78,847,632 1.75
SoftBank 994,700 78,847,632 1.75
Taiwan (2016: 228,651,241, 6.45%) 121,469,433 2.70
Advantech 6,837,374 48,545,171 1.08
Delta Electronics Industrial 15,066,610 72,924,262 1.62
Total equities* 4,454,529,259 98.89
Investment fund (2016: 135,712,625, 3.83%) 56,110,250 1.25
First State China A Shares† 2,455,591 56,110,250 1.25
Total financial assets designated at fair value through
profit or loss 4,510,639,509 100.14
Cash and other net liabilities (6,230,377) (0.14)
Total net assets attributable to redeemable participating
shareholders 4,504,409,132 100.00
Total cost of financial assets designated at fair value
through profit or loss (2016: 3,196,024,378 ) 2,648,843,976
Analysis of net investments
% of total
assets
*Transferable securities admitted to an official stock
exchange listing or traded on a regulated market 4,454,529,259 97.67
Investment fund 56,110,250 1.23
†Fund Investment. Investment is a related party entity. Please refer to Note 14.

First State China Growth Fund
Portfolio Changes (Unaudited)
22
The schedule of portfolio changes is based on financial assets designated at fair value through
profit or loss
Number of
shares purchased
Number of
shares sold
AAC Technologies Holdings 1,536,500 4,796,000
Advantech 621,374 -
ASM Pacific Technology 655,300 3,568,400
Asustek Computer - 236,000
Baidu 18,876 441,884
Beijing Tong Ren Tang Chinese Medicine - 3,612,000
Changan Minsheng APLL Logistic - 5,673,000
China Blue Chemical - 31,908,000
China Conch Venture Holdings 17,943,000 -
China Literature 344,315 344,315
China Mengniu Dairy 1,197,000 37,218,000
China Merchants Bank - 3,176,500
China National Accord Medicine 1,612,293 -
China Oilfield Services - 89,736,000
China Rescs Phoenix Healthcare Holdings 53,742,666 -
China Resources Enterprise 18,872,000 -
China Resources Gas 3,402,000 10,228,000
China Resources Land 10,202,162 1,212,000
China Resources Power Holdings - 27,311,538
China South Publishing & Media Group 1,891,059 23,951,725
China Taiping Insurance Holdings - 30,466,600
China Vanke 15,068,900 5,304,300
CSPC Pharmaceutical - 49,582,000
Ctrip Com International 1,499,200 -
Delta Electronics Industrial - 14,912,000
ENN Energy Holdings 1,565,000 3,631,000
First State China A Shares † 12,277 6,211,829
Foshan Haitian Flavouring and Food 2,677,572 3,056,400
Fuyao Glass Industry 940,700 8,381,600
Giant Manufacturing - 5,281,000
Gree Electric Appliances - 2,270,600
Hang Lung Group - 8,159,000
Hangzhou Hikvision Digital Technology 8,157,344 5,494,400
Hangzhou Robam Appliances 2,788,501 568,600
Hongfa Technology 6,080,576 -
Jiangsu Hengrui Medicine 1,385,963 2,984,000
Lenovo Group - 49,838,000
†Fund Investment. Investment is a related party entity. Please refer to Note 14.

First State China Growth Fund
Portfolio Changes (Unaudited) (continued)
23
Number of
shares purchased
Number of
shares sold
Li & Fung 7,940,000 138,308,330
Luk Fook Holdings International 9,954,000 -
Luxshare Precision Industry 1,841,090 10,684,338
Luye Pharma Group 16,284,000 -
Midea Group 22,215,457 4,170,400
Minth Group - 21,356,000
Pacific Textiles Holdings - 28,197,000
Qingdao Haier 29,350,912 -
Shanghai International Airport 4,388,882 1,422,700
Shanghai Liangxin Electrical 16,536,534 -
Shenzhen Inovance Technology 9,806,570 5,653,438
Shenzhou International Group Holdings - 9,366,000
Sino Biopharmaceutical - 33,240,000
SoftBank 1,074,500 79,800
Sun Art Retail Group - 29,928,000
Techtronic Industries 6,533,500 714,500
Tencent Holdings - 1,587,600
Tencent Holdings Rights 5,731 5,731
Tong Ren Tang Technologies 7,309,000 5,417,000
Towngas China 3,294,300 -
Vipshop Holdings 3,471,400 3,471,400
Vitasoy International Holdings 2,956,000 -
Xinjiang Goldwind Science & Technology - 8,562,800
Yue Yuen Industrial Holdings - 11,876,500
Yunnan Baiyao Group 678,920 483,900
Zhejiang Chint Electrics 7,353,623 979,200
Zhengzhou Yutong Bus - 11,134,700
The Schedule of Portfolio Changes in Investments reflects the aggregate purchases of a security
exceeding one percent of the total value of purchases for the year and aggregate sales of a security
exceeding one percent of the total sales for the year.

Stewart Investors Worldwide Leaders Fund
Investment Manager’s Report (Unaudited)
24
Performance
01/01/14 01/01/15 01/01/16 01/01/17
To To To To
31/12/14 31/12/15 31/12/16 31/12/17
Stewart Investors Worldwide Leaders Fund “the Fund”
- Class I 2.07% -0.11% 5.76% 23.81%
- Class III (G)* 3.32% 1.11% 6.98% 25.34%
MSCI AC World Index (total return)# 5.18% -1.84% 8.48% 24.62%
(Performance calculation is based on official dealing Net asset value (NAV) per share)
*Class III was renamed to Class III (G) on 24 February 2014.
#Benchmarks are being included for illustrative purposes and there is no guarantee that a fund will outperform a benchmark.
Past performance is no indication of current or future performance and the performance data does not take account of
commissions and costs incurred in the issue and redemption of units.
Global markets rose in 2017 with the MSCI AC World Index gaining 24.6% in US dollar terms. At a sector
level, Information Technology and Materials were particularly strong, while Energy and Telecom Service lagged.
Unilever rose as it announced a restructuring after the failed Kraft-Heinz bid, which included selling its
more commoditised spreads business. Henkel gained on positive earnings growth and OCBC climbed because it
delivered solid results.
On the negative side, Dr. Reddy’s Laboratories continued to be impacted by regulatory pressure and US
FDA quality concerns, as well as rising competition. GlaxoSmithKline lagged on concerns about increased
competition in its core HIV drugs and respiratory businesses.
Major purchases during the period included Mahindra & Mahindra, taking the opportunity to back a well-
run family conglomerate at a reasonable valuation. We also bought Kikkoman, a conservatively governed company
with a long track record and a strong brand, and Infosys, a software services company based in Bangalore which
has an impressive culture and business franchise.
We sold Bank Pekao as we have lower conviction in the company because of increased state influence
following the sale of UniCredit’s controlling stake.
We also sold GlaxoSmithKline on concerns about the quality of the franchise and deteriorating financials,
and Banco Bradesco on valuation worries after a period of strong performance.
We remain cautiously positioned on the basis that compelling investment opportunities are hard to come
by. The focus remains on well-run cash-generative companies that meet our sustainability criteria and are reasonably
valued.
First State Investment (Hong Kong) Limited
February 2018

Stewart Investors Worldwide Leaders Fund
Performance Table
as of 31 December 2017 (Unaudited)
25
Financial period Total net asset
value
Net asset
value per
share
Class I
Dec 2015 US$ 26,127,433 US$ 9.33
Dec 2016 US$ 27,527,918 US$ 9.91
Dec 2017 US$ 32,718,891 US$ 12.27
Class III (G)
Dec 2015 US$ 12,742,380 US$ 16.25
Dec 2016 US$ 13,197,089 US$ 17.48
Dec 2017 US$ 14,787,678 US$ 21.91
Financial period The highest issue
price
The lowest
redemption
price
Class I
Dec 2008 US$ 8.43 US$ 4.17
Dec 2009 US$ 6.40 US$ 3.82
Dec 2010 US$ 6.71 US$ 5.40
Dec 2011 US$ 7.32 US$ 5.61
Dec 2012 US$ 7.28 US$ 6.25
Dec 2013 US$ 9.20 US$ 7.29
Dec 2014 US$ 9.77 US$ 8.67
Dec 2015 US$ 9.99 US$ 8.79
Dec 2016 US$ 10.63 US$ 8.65
Dec 2017 US$ 12.27 US$ 9.85

Stewart Investors Worldwide Leaders Fund
Performance Table (continued)
as of 31 December 2017 (Unaudited)
26
Financial period The highest
issue price
The lowest
redemption
price
Class III (G)
Dec 2008 US$ 13.29 US$ 6.66
Dec 2009 US$ 10.33 US$ 6.11
Dec 2010 US$ 11.00 US$ 8.80
Dec 2011 US$ 12.06 US$ 9.28
Dec 2012 US$ 12.23 US$ 10.44
Dec 2013 US$ 15.65 US$ 12.26
Dec 2014 US$ 16.72 US$ 14.84
Dec 2015 US$ 17.33 US$ 15.28
Dec 2016 US$ 18.68 US$ 15.08
Dec 2017 US$ 21.91 US$ 17.38

Stewart Investors Worldwide Leaders Fund
Schedule of Investments
as of 31 December 2017
27
The schedule that follows includes financial assets designated at fair value through profit or loss
Number of
shares
Fair value
US$
% of net
assets
Brazil (2016: 912,242, 2.24%) - - -
Denmark (2016: 1,215,293, 2.98%) 1,486,028 3.13
Novo Nordisk 15,761 853,433 1.80
Novozymes 11,052 632,595 1.33
Germany (2016: 6,621,643, 16.26%) 8,380,465 17.64
Beiersdorf 19,905 2,335,040 4.92
Henkel 35,440 4,243,238 8.93
Merck KGaA 16,680 1,802,187 3.79
India (2016: 2,526,944, 6.20%) 5,140,030 10.82
Dr Reddys Laboratories 21,655 819,075 1.72
Housing Development Finance 40,816 1,093,756 2.30
Infosys Technologies 37,600 613,859 1.29
Mahindra & Mahindra 82,530 971,185 2.05
Tata Consultancy Services 38,803 1,642,155 3.46
Japan (2016: 3,155,595, 7.75%) 3,912,044 8.23
Hoya 7,400 370,099 0.78
Kansai Paint 36,000 936,710 1.97
Kikkoman 18,100 733,458 1.54
Unicharm 71,900 1,871,777 3.94
Poland (2016: 653,181, 1.60%) - - -
Singapore (2016: 1,444,923, 3.55%) 1,647,310 3.47
Oversea Chinese Banking 177,601 1,647,310 3.47
South Africa (2016: 1,166,351, 2.86%) 726,494 1.53
Standard Bank 45,689 726,494 1.53
Spain (2016: 364,677, 0.90%) 810,279 1.71
Distribuidora Internacional de Alimentacion 158,592 810,279 1.71
Switzerland (2016: 2,584,751, 6.35%) 2,360,943 4.97
Kuehne + Nagel International 2,563 454,482 0.96
Nestle 13,371 1,147,104 2.41

Stewart Investors Worldwide Leaders Fund
Schedule of Investments (continued)
as of 31 December 2017
28
Number of
shares
Fair value
US$
% of net
assets
Switzerland (continued)
SGS 293 759,357 1.60
United Kingdom (2016: 5,141,636, 12.63%) 5,004,750 10.53
Lloyds Banking Group 803,186 730,548 1.54
Sage Group 54,044 576,981 1.21
Tesco 299,108 841,526 1.77
Unilever 51,230 2,855,695 6.01
United States (2016: 8,787,958, 21.58%) 10,667,969 22.46
ANSYS 6,494 958,839 2.02
Berkshire Hathaway 8 2,393,680 5.04
Colgate-Palmolive 19,006 1,428,111 3.01
Edwards Lifesciences 3,380 387,179 0.82
Expeditor International 19,773 1,292,363 2.72
Intel 11,585 535,459 1.13
Markel 438 493,626 1.04
Varex Imaging 2,448 101,151 0.21
Varian Medical Systems 10,281 1,154,454 2.43
Wabtec Corporation 9,404 766,520 1.61
Waters 5,937 1,156,587 2.43
Total financial assets designated at fair value through
profit or loss* 40,136,312 84.49
Cash and other net assets 7,370,257 15.51
Total net assets attributable to redeemable participating
shareholders 47,506,569 100.00
Total cost of financial assets designated at fair value
through profit or loss (2016: 34,790,031) 32,834,396
Analysis of net investments
% of total
assets
*Transferable securities admitted to an official stock
exchange listing or traded on a regulated market 40,136,312 84.29

Stewart Investors Worldwide Leaders Fund
Portfolio Changes (Unaudited)
29
The schedule of portfolio changes is based on financial assets designated at fair value through
profit or loss
Number of
shares purchased
Number of
shares sold
Banco Bradesco 4,329 106,219
Bank Pekao - 21,546
Beiersdorf 6,354 -
Berkshire Hathaway - 3
Colgate-Palmolive 1,780 -
Distribuidora Internacional de Alimentacion 84,445 -
Edwards Lifesciences 3,380 -
Expeditor International 7,519 -
GlaxoSmithKline 365 29,189
Henkel 1,764 3,875
Housing Development Finance 5,166 -
Infosys Technologies 37,600 -
Intel 11,585 -
Kansai Paint - 17,000
Kikkoman 18,100 -
Kuehne + Nagel International - 1,902
Lloyds Banking Group 391,102 -
Mahindra & Mahindra 82,530 -
Markel - 243
Merck KGaA 1,975 -
Novo Nordisk 6,939 14,290
Oversea Chinese Banking - 56,300
Sage Group 54,044 -
SGS - 218
Standard Bank 11,455 70,947
Tata Consultancy Services 13,341 -
Tesco 148,031 -
Unicharm 14,800 28,200
Unilever - 45,165
Varex Imaging 2,448 -
Varian Medical Systems 4,161 -
Wabtec Corporation 3,129 -
Waters - 7,040
Xylem - 5,506
The Schedule of Portfolio Changes in Investments reflects the aggregate purchases of a security
exceeding one percent of the total value of purchases for the year and aggregate sales of a security
exceeding one percent of the total sales for the year.

First State Hong Kong Growth Fund
Investment Manager’s Report (Unaudited)
30
Performance
01/01/14 01/01/15 01/01/16 01/01/17
To To To To
31/12/14 31/12/15 31/12/16 31/12/17
First State Hong Kong Growth Fund “the Fund”
- Class I -4.15% -2.23% 3.49% 42.97%
- Class III -2.93% -1.01% 4.39% 43.75%
MSCI Hong Kong Index (total return)# 5.07% -0.54% 2.27% 36.17%
(Performance calculation is based on official dealing Net asset value (NAV) per share)
#Benchmarks are being included for illustrative purposes and there is no guarantee that a fund will outperform a benchmark.
Past performance is no indication of current or future performance and the performance data does not take account of
commissions and costs incurred in the issue and redemption of units.
The MSCI Hong Kong increased by 36.2% in 2017, helped by strong performance in the China market
and robust trading between Hong Kong and the Mainland. Total Northbound turnover in 2017 almost doubled from
the previous year to RMB2,266 billion, while Southbound turnover reached HKD2,259 billion, an increase of 170%
from 2016. Meanwhile, residential property prices continued to climb, despite rising interest rates and the
government’s attempts at cooling the market.
On portfolio holdings, Tencent rose to record highs as the firm announced strong net profits growth driven
by a surge in mobile payments and cloud services, while CSPC Pharmaceutical rallied on better than expected
earnings which was boosted by the inclusion of its flagship NBP product on China's National Reimbursement Drug
List (NRDL). AAC Technologies, one of Apple’s main suppliers of acoustic components (speaker boxes, receivers)
and haptics (provides tactile feedback such as vibrations), also added to performance as it reported a jump in profits
and strong sales growth.
Detracting from performance, Tong Ren Tang Technology weakened over the year as it announced a
slowdown in profits. The company has a long history and a strong brand, but has struggled to achieve much growth.
Pou Sheng declined on weaker than expected earnings, amid lacklustre retail spending and increased competition
from online sales. Global Brands Group also struggled to meet earnings expectations amid ongoing disruption in
the US retail sector. Retail bankruptcies led to the loss of several brand licences which impacted the group’s revenue.
Significant purchases over the year included Fairwood Holdings, a fast food chain with around 130 stores
in Hong Kong and a handful of outlets in China. The Group had started to ramp up its expansion plans to take
advantage of falling rents; we believed the valuation was reasonable for high single digit growth and a 4% dividend
yield. We also bought Luk Fook Holdings, a jewellery retailer with a long-term track record. Earnings had fallen
by about half but we believed the outlook was stabilising – their same store sales decline had decelerated and falling
Hong Kong rents had eased rental cost pressures. Longer-term, we believe the expansion into China and conversion
from franchised to self-operated stores should result in reasonable growth.
We divested Li & Fung after it announced a set of weak results due to the ongoing tough retail environment.
Its clients – US retailers such as Kohl’s and Macy’s – have closed thousands of stores, compressing Li & Fung’s
turnover as destocking takes place. We sold Smartone Telecommunications due to weak results and to raise cash
for other purchases.

First State Hong Kong Growth Fund
Investment Manager’s Report (Unaudited) (continued)
31
Hong Kong equities performed strongly in 2017, rising to a 10-year high as concerns around renminbi
depreciation and US trade protectionism failed to materialise. However, market performance was driven by just a
few key stocks and themes, in particular the Chinese tech giants which reported significant growth in revenue and
profitability. Equity valuations are now considerably elevated, driven by abundant liquidity and a generally high
risk appetite as investors chase higher yielding assets. We have found it difficult to find good quality companies at
reasonable valuations and remain cautious on the outlook.
First State Investment (Hong Kong) Limited
February 2018

First State Hong Kong Growth Fund
Performance Table
as of 31 December 2017 (Unaudited)
32
Financial period Total net asset
value
Net asset
value per
share
Class I
Dec 2015 US$ 94,850,684 US$ 49.90
Dec 2016 US$ 86,206,236 US$ 51.64
Dec 2017 US$ 107,929,238 US$ 73.83
Class III
Dec 2015 US$ 76,275,231 US$ 88.33
Dec 2016 US$ 65,815,651 US$ 92.21
Dec 2017 US$ 73,449,381 US$ 132.55
Financial period The highest issue
price
The lowest
redemption
price
Class I
Dec 2008 US$ 38.01 US$ 16.06
Dec 2009 US$ 34.11 US$ 17.84
Dec 2010 US$ 44.66 US$ 31.89
Dec 2011 US$ 44.37 US$ 32.92
Dec 2012 US$ 47.53 US$ 38.16
Dec 2013 US$ 53.25 US$ 44.99
Dec 2014 US$ 55.78 US$ 48.65
Dec 2015 US$ 61.20 US$ 45.54
Dec 2016 US$ 56.33 US$ 42.23
Dec 2017 US$ 75.86 US$ 51.95

First State Hong Kong Growth Fund
Performance Table (continued)
as of 31 December 2017 (Unaudited)
33
Financial period The highest issue
price
The lowest
redemption
price
Class III
Dec 2008 US$ 60.77 US$ 25.96
Dec 2009 US$ 55.93 US$ 28.97
Dec 2010 US$ 74.09 US$ 52.40
Dec 2011 US$ 74.29 US$ 12.95
Dec 2012 US$ 81.02 US$ 64.26
Dec 2013 US$ 91.92 US$ 77.16
Dec 2014 US$ 97.12 US$ 84.08
Dec 2015 US$ 107.41 US$ 80.26
Dec 2016 US$ 100.48 US$ 74.84
Dec 2017 US$ 136.13 US$ 92.78
First State Hong Kong Growth Fund
Schedule of Investments
as of 31 December 2017
34
The schedule that follows includes financial assets designated at fair value through profit or loss
Number of
shares
Fair value
US$
% of net
assets
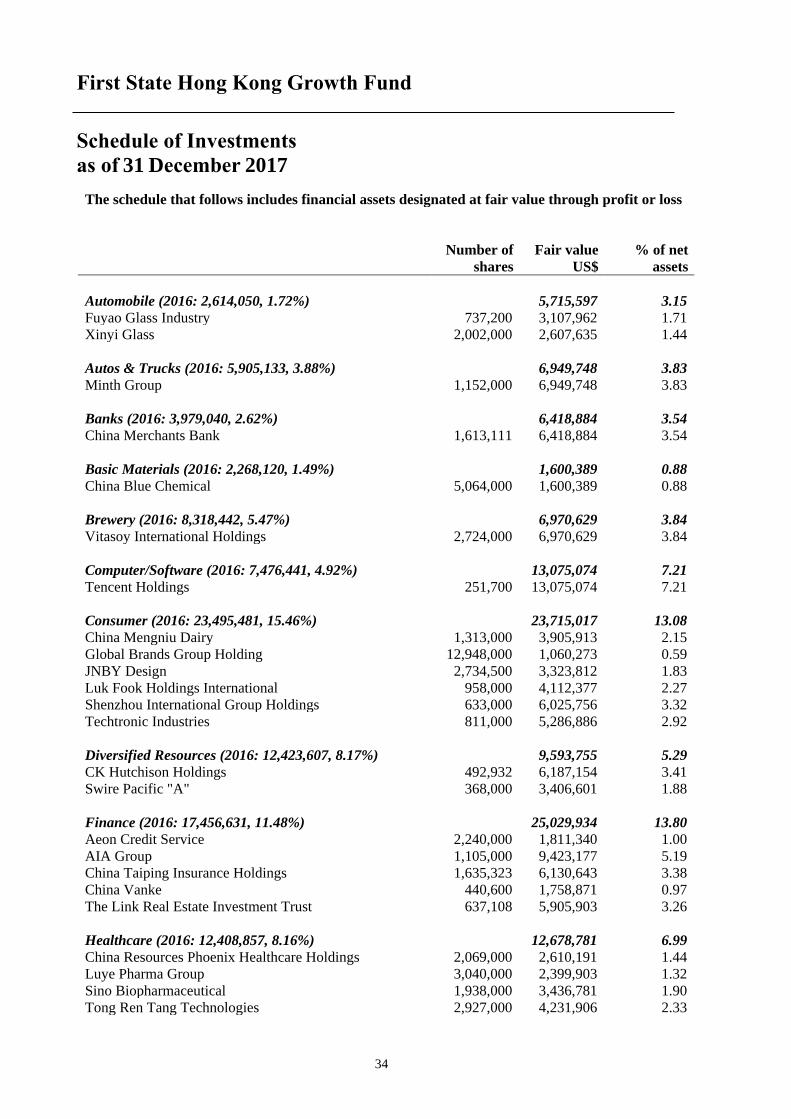
Automobile (2016: 2,614,050, 1.72%) 5,715,597 3.15
Fuyao Glass Industry 737,200 3,107,962 1.71
Xinyi Glass 2,002,000 2,607,635 1.44
Autos & Trucks (2016: 5,905,133, 3.88%) 6,949,748 3.83
Minth Group 1,152,000 6,949,748 3.83
Banks (2016: 3,979,040, 2.62%) 6,418,884 3.54
China Merchants Bank 1,613,111 6,418,884 3.54
Basic Materials (2016: 2,268,120, 1.49%) 1,600,389 0.88
China Blue Chemical 5,064,000 1,600,389 0.88
Brewery (2016: 8,318,442, 5.47%) 6,970,629 3.84
Vitasoy International Holdings 2,724,000 6,970,629 3.84
Computer/Software (2016: 7,476,441, 4.92%) 13,075,074 7.21
Tencent Holdings 251,700 13,075,074 7.21
Consumer (2016: 23,495,481, 15.46%) 23,715,017 13.08
China Mengniu Dairy 1,313,000 3,905,913 2.15
Global Brands Group Holding 12,948,000 1,060,273 0.59
JNBY Design 2,734,500 3,323,812 1.83
Luk Fook Holdings International 958,000 4,112,377 2.27
Shenzhou International Group Holdings 633,000 6,025,756 3.32
Techtronic Industries 811,000 5,286,886 2.92
Diversified Resources (2016: 12,423,607, 8.17%) 9,593,755 5.29
CK Hutchison Holdings 492,932 6,187,154 3.41
Swire Pacific "A" 368,000 3,406,601 1.88
Finance (2016: 17,456,631, 11.48%) 25,029,934 13.80
Aeon Credit Service 2,240,000 1,811,340 1.00
AIA Group 1,105,000 9,423,177 5.19
China Taiping Insurance Holdings 1,635,323 6,130,643 3.38
China Vanke 440,600 1,758,871 0.97
The Link Real Estate Investment Trust 637,108 5,905,903 3.26
Healthcare (2016: 12,408,857, 8.16%) 12,678,781 6.99
China Resources Phoenix Healthcare Holdings 2,069,000 2,610,191 1.44
Luye Pharma Group 3,040,000 2,399,903 1.32
Sino Biopharmaceutical 1,938,000 3,436,781 1.90
Tong Ren Tang Technologies 2,927,000 4,231,906 2.33

First State Hong Kong Growth Fund
Schedule of Investments (continued)
as of 31 December 2017
35
Number of
shares
Fair value
US$
% of net
assets
Industrial Material (2016: 17,040,688, 11.21%) 21,216,297 11.70
AAC Technologies Holdings 475,000 8,472,104 4.67
Jardine Matheson Holdings 127,320 7,734,690 4.27
Sunny Optical Tech Group 246,000 3,144,384 1.73
Wasion Meters Group 3,816,000 1,865,119 1.03
Infrastructure (2016: 3,078,511, 2.03%) 5,578,934 3.08
Fairwood Holdings 792,000 3,242,725 1.79
MTR 398,668 2,336,209 1.29
Medical (2016: 5,343,451, 3.52%) 7,563,271 4.17
CSPC Pharmaceutical 3,746,000 7,563,271 4.17
Oil & Gas (2016: 1,706,680, 1.12%) 2,601,876 1.43
China Conch Venture Holdings 1,123,500 2,601,876 1.43
Property (2016: 1,642,255, 1.08%) 3,461,228 1.91
China Resources Land 1,176,163 3,461,228 1.91
Real Estate (2016: 1,213,154, 0.80%) 751,889 0.41
Hang Lung Group 204,400 751,889 0.41
Retail (2016: 4,852,905, 3.19%) 7,057,117 3.89
Dairy Farm International Holdings 897,852 7,057,117 3.89
Technology (2016: 4,086,311, 2.69%) 5,134,525 2.83
ASM Pacific Technology 368,500 5,134,525 2.83
Telecom Services (2016: 1,951,230, 1.28%) - - -
Utilities (2016: 14,414,909, 9.48%) 16,274,388 8.97
ENN Energy Holdings 930,000 6,633,805 3.66
Towngas China 11,997,997 9,640,583 5.31
Total financial assets designated at fair value through
profit or loss*
181,387,333 100.00
Cash and other net liabilities (8,714) -
Total net assets attributable to redeemable participating
shareholders
181,378,619 100.00
Total cost of financial assets designated at fair value
through profit or loss (2016: 122,761,910) 104,597,780

First State Hong Kong Growth Fund
Schedule of Investments (continued)
as of 31 December 2017
36
Analysis of net investments
% of
total
assets
*Transferable securities admitted to an official stock
exchange listing or traded on a regulated market
181,387,333 99.72

First State Hong Kong Growth Fund
Portfolio Changes (Unaudited)
37
The schedule of portfolio changes is based on financial assets designated at fair value through
profit or loss
Number of
shares purchased
Number of
shares sold
AAC Technologies Holdings 59,500 154,000
AIA Group - 29,000
ASM Pacific Technology 13,600 30,800
China Blue Chemical - 3,116,000
China Conch Venture Holdings 1,123,500 -
China Literature 14,291 14,291
China Mengniu Dairy 106,000 847,000
China Merchants Bank - 84,000
China Oilfield Services - 1,838,000
China Rescs Phoenix Healthcare Holdings 2,069,000 -
China Resources Gas - 556,000
China Resources Land 504,000 58,000
China Taiping Insurance Holdings - 320,600
China Vanke 440,600 -
CK Hutchison Holdings - 394,500
CSPC Pharmaceutical - 1,258,000
Dairy Farm International Holdings 222,900 -
ENN Energy Holdings 152,000 32,000
Fairwood Holdings 792,000 -
Fuyao Glass Industry - 105,600
Global Brands Group Holding 4,570,000 5,694,000
Hang Lung Group - 144,000
I.T Limited 1,238,000 4,018,000
Jardine Matheson Holdings 24,278 -
JNBY Design 2,734,500 -
Li & Fung 334,000 5,919,050
Luk Fook Holdings International 958,000 -
Luye Pharma Group 832,500 -
Minth Group - 744,000
MTR 2,991 237,500
Pacific Basin Shipping - 6,367,000
Pacific Textiles Holding - 1,572,000
Pou Sheng International 2,495,000 9,652,000
Power Assets Holdings - 176,500
Q Technology Group 1,895,000 1,895,000
Shenzhou International Group Holdings - 353,000
Sino Biopharmaceutical - 664,000
Smartone Telecom - 1,452,000
Sunny Optical Tech Group - 370,000

First State Hong Kong Growth Fund
Portfolio Changes (Unaudited) (continued)
38
Number of
shares purchased
Number of
shares sold
Swire Pacific "A" 120,500 -
TCC International Holdings 948,000 5,642,000
Techtronic Industries 205,000 -
Tencent Holdings - 53,900
Tencent Holdings Rights 218 218
The Link Real Estate Investment Trust - 197,500
Tong Ren Tang Technologies - 2,070,000
Towngas China 351,283 3,488,000
Truly International Holdings 4,488,000 4,488,000
Vitasoy International Holdings - 1,416,000
Wasion Meters Group 2,510,000 1,212,000
Xinyi Glass 2,002,000 -
Yue Yuen Industrial Holdings - 530,500
The Schedule of Portfolio Changes in Investments reflects the aggregate purchases of a security
exceeding one percent of the total value of purchases for the year and aggregate sales of a security
exceeding one percent of the total sales for the year.

First State Indian Subcontinent Fund
Investment Manager’s Report (Unaudited)
39
Performance
01/01/14 01/01/15 01/01/16 01/01/17
To To To To
31/12/14 31/12/15 31/12/16 31/12/17
First State Indian Subcontinent Fund “the Fund”
- Class I 45.60% 5.06% 1.58% 40.04%
- Class II 43.67% 3.66% 1.25% 40.45%
- Class I (Dist)^ 45.60% 5.04% 1.54% 40.06%
- Class III 46.37% 5.58% 2.24% 41.20%
MSCI India Index (total return)# 23.87% -6.12% -1.43% 38.76%
(Performance calculation is based on official dealing Net asset value (NAV) per share)
^ Dividend adjustment return
#Benchmarks are being included for illustrative purposes and there is no guarantee that a fund will outperform a benchmark. Past performance is no indication of current or future performance and the performance data does not take account of
commissions and costs incurred in the issue and redemption of units.
The MSCI India made solid gains over the year, rising by 38.8% in 2017. In general, Indian firms shrugged
off the turmoil caused by demonetization last November with a better than expected earnings season at the start of
the year. The Union Budget, announced on February 1st and, unusually, approved by parliament in just two months,
included a host of tax proposals and reform measures designed to curb tax evasion and ease the difficulties of doing
business. Meanwhile, India’s Goods and Services Tax (GST) was the biggest tax reform in India since independence
and replaced more than 40 other taxes and levies with a single, unifying system. In October, the Indian government
announced a US$32 billion plan to recapitalise the state-owned banking sector, which had been beleaguered by
problem loans. The capital injection should allow banks to start lending again and provide a much needed boost to
economic development, growth and consumption.
On portfolio holdings, Nestle India benefitted from new management and a revitalised strategy. Following
the Maggi crisis in 2015, Suresh Narayanan, who was then running Nestle’s operations in Philippines, was appointed
the first Indian CEO of Nestle India in 17 years. Since then, Narayanan has been focused on volume growth and
market share – 43 new products were launched over the last 18 months and advertising spend almost doubled from
4%-4.5% of sales historically to around 8% of sales now. HDFC Bank also added to performance, as it continued
to grow customer deposits and loans at over 20% in 2017 with low credit costs. This was achieved despite a
challenging environment where system credit growth fell to its lowest level in 60 years. Meanwhile, significant
investments into fin-tech and digital technology should position it well for future growth as it continues to take
market share from state banks.
On the negative side, Lupin continued to face challenges in the US generics market. Although generic drug
prices are expected to fall – with a typical 80% decline in the first couple of years – the rate of price erosion had
been exacerbated by consolidation in the distributor space. Dr Reddy’s Laboratories underperformed, as a series of
inspections from the US Food and Drug Administration (FDA) led to concerns around quality control issues, while
delays to a number of its product launches caused lacklustre sales growth and compressed margins. We divested
the position earlier in the year.
Significant purchases over the year included Bharti Airtel, India’s largest telecoms company, as we
believed the disruption from new entrant Reliance Jio had started to wane. We believe Bharti’s wide mobile network
and strong balance sheet should bode the company well in the long-term, amid consolidation in the market. We also
bought Ambuja Cement, one of the largest cement companies in India. Improving demand and higher utilisation
should be a positive catalyst for the company.

First State Indian Subcontinent Fund
Investment Manager’s Report (Unaudited) (continued)
40
Infosys disappointed on lower than expected revenues. The IT services company has been subject to a
challenging environment for its major customer groups, as well as political squabbling between the founders and
management. We sold our position in Infosys on concerns around the lack of growth and the changing industry
model. We also divested Wipro, one of the better performing IT stocks, on valuation concerns.
Household savings in India has always been a big number (~US$500 billion) and only a small part of it
was in financial instruments, let alone equities. The demonetization exercise in November 2016 has encouraged
the shift of household savings into financial assets. Historically, real estate and fixed income have been large asset
classes for domestic investors. After stellar performance over the past decade, real estate prices have stagnated or
fallen in most major Indian cities in recent years. Benchmark bond yields have also fallen from 9% to 6.4% over
three years.
Therefore, with few alternatives, corporates and individuals have ploughed savings into equities. Average
domestic equity mutual fund inflows in 2017 have been US$1.9 billion per month, 4 times the average monthly
inflow of the previous five years. Driven by liquidity, there seems to be a palpable sense of euphoria in Indian
equity markets. An India bull will justify this by saying that as a percentage of household financial savings, only
10% is invested in equities. While true, this number was less than 5% just two years ago. We have seen this
enthusiasm before and unfortunately it almost always doesn’t end well.
Whilst euphoria reigns supreme, Corporates have used this opportunity to fund growth and deleverage
their balance sheets. In 2017 so far, institutional placements and rights issues totalled almost Rs.1 trillion, close to
the 2010 all-time high of Rs.1.16 trillion. And with three months of the year left to go, there is still a big line-up of
new capital issues on the horizon. In the three years after 2010, the return from Nifty in US dollar terms was -22%.
Prior to 2010, the peak of equity issuance was in 2007 when companies raised Rs.89 billion by selling shares in the
market – the Nifty’s return was -8% in the three year period after CY2007.
As such, the portfolio is positioned cautiously in this environment and we have maintained a high cash
level throughout the year. This is entirely a bottom-up outcome and not a result of trying to time the market (which,
in our opinion, is a futile exercise). Our conviction in the portfolio is as high as ever, with regards to the long term
growth potential that it presents. We would happily own a lot more of our companies if prices were to fall – the
ultimate test of our confidence in them.
First State Investment (Hong Kong) Limited
February 2018

First State Indian Subcontinent Fund
Performance Table
as of 31 December 2017 (Unaudited)
41
Financial period Total net asset
value
Net asset
value per
share
Class I
Dec 2015 US$ 199,092,309 US$ 77.46
Dec 2016 US$ 193,771,363 US$ 78.68
Dec 2017 US$ 291,594,464 US$ 110.18
Class II
Dec 2015 US$ 720,945 US$ 47.03
Dec 2016 US$ 720,471 US$ 47.62
Dec 2017 US$ 958,271 US$ 66.88
Class I Distributing
Dec 2015 US$ 3,835,477 US$ 76.70
Dec 2016 US$ 1,491,425 US$ 77.88
Dec 2017 US$ 2,050,929 US$ 109.08
Class III
Dec 2015 US$ 64,459,823 US$ 18.73
Dec 2016 US$ 152,368,151 US$ 19.15
Dec 2017 US$ 304,734,076 US$ 27.04
Financial period The highest issue
price
The lowest
redemption
price
Class I
Dec 2008 US$ 42.65 US$ 15.94
Dec 2009 US$ 35.76 US$ 16.17
Dec 2010 US$ 48.16 US$ 34.16
Dec 2011 US$ 48.93 US$ 35.75
Dec 2012 US$ 47.49 US$ 36.61
Dec 2013 US$ 50.65 US$ 38.83
Dec 2014 US$ 76.71 US$ 47.40
Dec 2015 US$ 83.79 US$ 72.32
Dec 2016 US$ 85.73 US$ 66.46
Dec 2017 US$ 110.18 US$ 78.29

First State Indian Subcontinent Fund
Performance Table (continued)
as of 31 December 2017 (Unaudited)
42
Financial period The highest issue
price
The lowest
redemption
price
Class II
Dec 2008 NA* US$ 10.57
Dec 2009 NA* US$ 10.68
Dec 2010 NA* US$ 22.31
Dec 2011 NA* US$ 22.85
Dec 2012 NA* US$ 23.29
Dec 2013 NA* US$ 24.32
Dec 2014 NA* US$ 29.52
Dec 2015 NA* US$ 44.09
Dec 2016 NA* US$ 40.27
Dec 2017 NA* US$ 47.39
Class I Distributing
Dec 2008 US$ 42.09 US$ 15.81
Dec 2009 US$ 35.45 US$ 16.04
Dec 2010 US$ 47.72 US$ 33.86
Dec 2011 US$ 48.46 US$ 35.40
Dec 2012 US$ 47.02 US$ 36.25
Dec 2013 US$ 50.16 US$ 38.45
Dec 2014 US$ 75.97 US$ 46.94
Dec 2015 US$ 82.98 US$ 71.61
Dec 2016 US$ 84.86 US$ 65.82
Dec 2017 US$ 109.08 US$ 77.50
Class III
Dec 2013 US$ 12.12 US$ 9.28
Dec 2014 US$ 18.45 US$ 11.35
Dec 2015 US$ 20.19 US$ 17.45
Dec 2016 US$ 20.83 US$16.09
Dec 2017 US$ 27.04 US$ 19.06
*No further Class II shares have been offered since 30 July 1999

First State Indian Subcontinent Fund
Schedule of Investments
as of 31 December 2017
43
The schedule that follows includes financial assets designated at fair value through profit or loss
Number of
shares
Fair value
US$
% of net
assets
Banks (2016: 34,160,489, 9.81%) 87,285,494 14.56
Axis Bank 1,372,739 12,128,881 2.02
Commercial Bank of Ceylon 2,697,126 2,386,899 0.40
Hatton National Bank 1,596,300 2,590,281 0.43
HDFC Bank 1,097,642 32,199,677 5.37
Kotak Mahindra Bank 1,713,255 27,115,745 4.53
State Bank of India 2,237,569 10,864,011 1.81
Basic Materials (2016: 15,276,247, 4.38%) 17,732,835 2.96
BASF India 292,815 9,811,499 1.64
Linde India 943,018 7,921,336 1.32
Computer/Software (2016: 57,271,638, 16.44%) 30,864,984 5.15
Mphasis BFL 749,989 8,526,568 1.42
Tech Mahindra 2,828,698 22,338,416 3.73
Consumer (2016: 66,437,958, 19.07%) 125,208,838 20.89
Asahi India Glass 1,085,109 6,265,590 1.05
Bajaj Auto 174,302 9,103,492 1.52
Colgate-Palmolive 500,613 8,627,540 1.44
Godrej Agrovet 342,727 3,110,867 0.52
Godrej Consumer Products 1,517,175 23,756,853 3.96
Godrej Industries 914,578 8,689,763 1.45
Hemas Holdings 2,059,745 1,691,286 0.28
Hindustan Unilever 602,698 12,916,070 2.15
Indus Motor 450,060 6,846,401 1.14
Jubilant Foodworks 210,118 5,797,482 0.97
Jyothy Laboratories 2,237,307 13,397,027 2.23
Lumax Auto Technologies 118,916 1,542,727 0.26
Mahindra Forgings 2,223,374 8,992,425 1.50
PAK Suzuki Motor 525,750 2,374,234 0.40
Shoppers Stop 292,241 2,565,622 0.43
Suprajit Engineering 813,980 4,255,613 0.71
United Breweries 312,089 5,275,846 0.88

First State Indian Subcontinent Fund
Schedule of Investments (continued)
as of 31 December 2017
44
Number of
shares
Fair value
US$
% of net
assets
Finance (2016: 13,414,462, 3.85%) 32,226,369 5.38
Delta Brac Housing Finance 2,473,153 4,061,938 0.68
HDFC Bank 54,416 5,497,648 0.92
Housing Development Finance 845,863 22,666,783 3.78
Financial Services (2016: Nil) 1,693,054 0.28
TI Financial Holdings 400,903 1,693,054 0.28
Food & Beverages (2016: 20,917,731, 6.00%) 41,207,619 6.88
Nestle India 334,165 41,207,619 6.88
Healthcare (2016: 28,690,059, 8.24%) 19,677,748 3.28
Dr Lal Pathlabs 157,151 2,169,867 0.36
HealthCare Global Enterprises 3,080,890 13,505,668 2.25
Indoco Remedies 910,862 4,002,213 0.67
Industrials (2016: 30,457,888, 8.74%) 96,425,713 16.09
Ambuja Cements 3,818,488 16,275,425 2.72
Blue Dart Express 221,784 15,819,972 2.64
Blue Star 1,441,299 18,469,131 3.08
HeidelbergCement India 6,157,405 14,769,476 2.46
John Keells Holdings 5,651,466 5,469,161 0.91
SKF India 783,567 23,703,124 3.96
Thermax 100,112 1,919,424 0.32
Infrastructure (2016: 5,918,124, 1.70%) 9,181,303 1.53
Container Corporation of India 424,852 9,181,303 1.53
Life Insurance (2016: Nil) 11,292,935 1.89
HDFC Standard Life Insurance 1,867,357 11,292,935 1.89
Medical (2016: 6,885,055, 1.98%) 16,024,903 2.67
Lupin 1,155,609 16,024,903 2.67
Metals (2016: 9,314,427, 2.67%) - - -

First State Indian Subcontinent Fund
Schedule of Investments (continued)
as of 31 December 2017
45
Number of
shares
Fair value
US$
% of net
assets
Real Estate (2016: 12,734,032, 3.66%) 16,224,749 2.71
Mahindra Lifespace Developers 1,138,353 8,190,648 1.37
Oberoi Realty 1,065,662 8,034,101 1.34
Technology (2016: 5,846,789, 1.68%) - - -
Telecommunications (2016: Nil) 23,245,949 3.88
Bharti Airtel 2,801,342 23,245,949 3.88
Utilities (2016: 4,147,657, 1.19%) 10,808,687 1.80
Gujarat Gas 820,762 10,808,687 1.80
Total financial assets designated at fair value through
profit or loss*
539,101,180 89.95
Cash and other net assets 60,236,560 10.05
Total net assets attributable to redeemable participating
shareholders
599,337,740 100.00
Total cost of financial assets designated at fair value
through profit or loss (2016: 274,071,150) 399,643,075
Analysis of net investments
% of total
assets
*Transferable securities admitted to an official stock
exchange listing or traded on a regulated market 539,101,180 88.82

First State Indian Subcontinent Fund
Portfolio Changes (Unaudited)
46
The schedule of portfolio changes is based on financial assets designated at fair value through
profit or loss
Number of
shares purchased
Number of
shares sold
Akzo Nobel India 112,127 112,127
Ambuja Cements 3,818,488 -
Asahi India Glass 64,180 185,538
Avenue Supermarts 576,776 576,776
Axis Bank 1,372,739 -
Bajaj Auto 174,302 -
Bank Of Baroda 2,086,387 3,509,355
BASF India 40,905 85,684
Bata Shoe Company Bangladesh - 118,700
Bharti Airtel 2,801,342 -
Blue Dart Express 221,784 -
Blue Star 45,258 244,012
Cipla 149,852 1,939,295
Colgate-Palmolive 531,049 758,101
Commercial Bank of Ceylon 275,693 -
Commercial Bank of Ceylon Rights 245,193 245,193
Container Corporation of India 126,432 63,449
Dabur India - 1,657,058
Delta Brac Housing Finance 754,709 -
Dr Lal Pathlabs 157,151 -
Dr Reddys Laboratories 14,662 167,362
Godrej Agrovet 342,727 -
Godrej Consumer Products 1,321,188 185,008
Godrej Industries - 952,043
Godrej Properties - 1,144,585
Gujarat Gas 401,458 118,928
Hatton National Bank 1,596,300 -
HDFC Bank 283,472 43,326
HDFC Standard Life Insurance 1,867,357 -
HealthCare Global Enterprises 3,080,890 -
HeidelbergCement India 655,572 -
Hexaware Technologies - 1,916,228
Hindustan Unilever 29,485 366,964
Housing Development Finance 422,107 -
Indoco Remedies 52,301 939,566
Indus Motor 450,060 -

First State Indian Subcontinent Fund
Portfolio Changes (Unaudited) (continued)
47
Number of
shares purchased
Number of
shares sold
Infosys Technologies 647,798 1,773,008
John Keells Holdings 3,924,026 -
Jubilant Foodworks 680,779 527,532
Jyothy Laboratories 885,016 -
Kansai Nerolac Paints - 867,324
Kotak Mahindra Bank 610,328 157,006
Linde India 87,417 192,319
Lumax Auto Technologies 118,916 -
Lupin 1,155,609 -
Mahindra Forgings 2,223,374 -
Mahindra Lifespace Developers 1,190,468 85,998
Mahindra Lifespace Developers Rights 673,215 673,215
Marico - 1,380,068
Mphasis BFL 158,436 681,923
Nestle India 143,258 44,612
Oberoi Realty - 646,903
PAK Suzuki Motor 525,750 -
Shoppers Stop 324,706 32,465
SKF India 333,125 -
State Bank of India 2,237,569 -
Suprajit Engineering - 293,959
Tech Mahindra 1,342,408 575,589
Thermax 100,112 -
TI Financial Holdings 801,806 400,903
Tube Investments of India - 1,081,082
United Breweries 222,192 161,501
Wipro 1,613,998 3,768,683
The Schedule of Portfolio Changes in Investments reflects the aggregate purchases of a security
exceeding one percent of the total value of purchases for the year and aggregate sales of a security
exceeding one percent of the total sales for the year.

First State Global Bond Fund
Investment Manager’s Report (Unaudited)
48
Performance
01/01/14 01/01/15 01/01/16 01/01/17
To To To To
31/12/14 31/12/15 31/12/16 31/12/17
First State Global Bond Fund “the Fund”
- Class I -3.08% -5.54% -1.25% 6.48%
- Class III -2.41% -4.82% -0.65% 7.29%
Citigroup World Govt Bond – All Maturities# -0.48% -3.57% 1.60% 7.49%
(Performance calculation is based on official dealing NAV per share)
#Benchmarks are being included for illustrative purposes and there is no guarantee that a fund will outperform a benchmark. Past performance is no indication of current or future performance and the performance data does not take account of
commissions and costs incurred in the issue and redemption of units.
The December quarter was dominated by monetary policy changes, US regulatory changes including the
highly anticipated tax reforms, changes to the Trump administration, global political unrest and heightened
geopolitical conflict. This environment led to a risk on market sentiment for most of the period with some equity
indices at all-time highs and credit spreads testing their post Global Financial Crisis (GFC) lows. In contrast,
government bond yields remained range bound (at historically narrow levels) amidst continued central bank buying
and despite the expected US Federal Reserve’s third rate hike this year which moved the federal funds rate to 1.25%-
1.50%. Economic growth globally remains on a positive path and labour markets continued to improve. However
an absence of wage pressures and inflation continue to be barriers to higher yields.
Looking at monetary policy, other than the rate hike in the US there were no other major changes as central
banks continue to support the economy with asset purchases (albeit at a reduced pace). Other news from central
banks included the nomination as incoming Chairman of the US Federal Reserve (Fed) of Jerome Powell. The much
debated and delayed US tax reforms were also passed in December much to the relief of growth markets.
On the political front, in the US the Trump administration was thrown into heightened risks of
impeachment following the indictment of a number of associates related to the involvement with Russia during the
election campaign. In Japan, President Abe was re-elected in a landslide victory in the parliamentary elections. In
China, President Xi Jinping became the “chairman of everything” and broke precedent by not appointing an obvious
successor leading to speculation he may seek to remain in power longer than his current 5-year term. New Zealand
saw a new Prime Minister elected following an inconclusive public vote which ended with a coalition government
being formed between Labour and the Greens and nationalist New Zealand First parties. In Australia, the dual
citizenship scandal rocked parliament with a number of MPs relinquished from their duties for holding undeclared
dual citizen status.
In Europe, political turmoil in Spain was also rife with the battle over Catalonia’s bid for independence
leading to fiery clashes in the region. German elections, which were assumed to be a clear win for Chancellor
Angela Merkel, were plunged into doubt as hope of a planned coalition with the Greens and Free Party collapsed
however the Social Democrats provided a surprise coalition solution. In the UK and Europe, Brexit news continued
to dominate markets. Negotiations progressed then faltered but ended the quarter with confirmation from EU leaders
that they had agreed to move onto the second stage of negotiations with the UK.
Other newsworthy events included the rising oil price which broke over US$60 a barrel in December, the
highest level since June 2015. This was boosted by OPEC’s extension of production cuts. Also helping the rise was
the arrest of a number of ministers, royals and military officials as part of an anti-corruption campaign in Saudi
Arabia. Geopolitical risk was further increased when North Korea launched another missile after a notable hiatus
around the time of the Chinese Congress. Whilst the missile was significantly bigger than prior ones the market was
somewhat unresponsive to the event and again demonstrated a resilience to ongoing geopolitical risks, for now.

First State Global Bond Fund
Investment Manager’s Report (Unaudited) (continued)
49
The net impact of events in the quarter saw 10-year government bond yields down everywhere but the US
where yields rose 7 bps. The UK and Australia saw the biggest falls in yields, 18 bps and 21 bps respectively, driven
by Brexit in the UK and soft inflation data in Australia. German yields were more resilient falling 4 bps and Japanese
government bond yields were down 2 bps in the quarter.
Ongoing geopolitical unrest globally remains a key risk factor for markets, particularly the potential for
North Korean related issues to escalate. Middle East tensions have now been added to the list of potential near-term
risks. Despite the tax reform finally passing, political uncertainty remains around how much of President Trump’s
pre-election promises can be moved through Congress, along with the ongoing threat of impeachment. European
event risk remains a lesser potential risk to markets. Talks of normalisation are becoming more widespread with the
US Federal Reserve continuing on its gradual pace of higher interest rates, and with the timing of a gradual tapering
of bond purchases programs in both the US and Europe coming nearer. The risk of wage or inflation pressure
emerging also represents a risk to the outlook.
In the absence of these risks materialising, the current low inflation environment will likely continue to
support historically low yields, low volatility and ultimately lower real rates of return. These factors would continue
to drive an increasingly difficult global hunt for yield. In this environment, we believe that a more balanced approach
to risk will protect investors from down-side risks whilst our flexible investment model will allow us to take
advantage of any opportunities to increase returns in our portfolios.
First State Investment (Hong Kong) Limited
February 2018

First State Global Bond Fund
Performance Table
as of 31 December 2017 (Unaudited)
50
Financial period Total net asset
value
Net asset
value per
share
Class I
Dec 2015 US$ 5,241,401 US$ 15.17
Dec 2016 US$ 5,129,867 US$ 14.98
Dec 2017 US$ 5,450,351 US$ 15.95
Class III
Dec 2015 US$ 10,021,965 US$ 16.98
Dec 2016 US$ 10,056,706 US$ 16.87
Dec 2017 US$ 10,961,895 US$ 18.10
Financial period The highest issue
price
The lowest
redemption
price
Class I
Dec 2008 US$ 16.90 US$ 14.84
Dec 2009 US$ 17.53 US$ 15.00
Dec 2010 US$ 17.68 US$ 15.75
Dec 2011 US$ 18.23 US$ 16.90
Dec 2012 US$ 17.85 US$ 17.17
Dec 2013 US$ 17.40 US$ 16.17
Dec 2014 US$ 17.05 US$ 15.90
Dec 2015 US$ 16.04 US$ 14.99
Dec 2016 US$ 16.68 US$ 14.81
Dec 2017 US$ 16.27 US$ 14.84

First State Global Bond Fund
Performance Table (continued)
as of 31 December 2017 (Unaudited)
51
Financial period The highest issue
price
The lowest
redemption
price
Class III
Dec 2008 US$ 17.89 US$ 15.75
Dec 2009 US$ 18.76 US$ 15.95
Dec 2010 US$ 19.06 US$ 16.93
Dec 2011 US$ 19.78 US$ 18.26
Dec 2012 US$ 19.53 US$ 18.71
Dec 2013 US$ 19.06 US$ 17.78
Dec 2014 US$ 18.86 US$ 17.66
Dec 2015 US$ 17.83 US$ 16.75
Dec 2016 US$ 18.75 US$ 16.68
Dec 2017 US$ 18.42 US$ 16.72

First State Global Bond Fund
Schedule of Investments
as of 31 December 2017
52
The schedule that follows includes financial assets designated at fair value through profit or loss
Number of
shares
Fair value
US$
% of net
assets
Australian Dollar (2016: 239,623, 1.58%) 281,387 1.71
Australia Government Bond 2.75% 21/04/2024 35,000 27,823 0.17
Australia Government Bond 3.75% 21/04/2037 45,000 38,527 0.23
Australia Government Bond 4.25% 21/04/2026 83,000 72,967 0.44
Australia Government Bond 5.75% 15/05/2021 95,000 82,833 0.51
Queensland Treasury 4.25% 21/07/2023 70,000 59,237 0.36
Canadian Dollar (2016: 301,801, 1.99%) 377,484 2.30
Canadian (Govt of) 1.5% 01/06/2023 110,000 86,037 0.52
Canadian (Govt of) 1.75% 01/09/2019 80,000 63,917 0.39
Canadian (Govt of) 2% 01/06/2028 5,000 3,967 0.02
Canadian (Govt of) 4.25% 01/06/2018 170,000 137,302 0.84
Canadian (Govt of) 5% 01/06/2037 75,000 86,261 0.53
Danish Krone (2016: 78,190, 0.51%) 82,851 0.50
Denmark Government Bond 0.5% 15/11/2027 220,000 35,550 0.21
Denmark Government Bond 1.5% 15/11/2023 270,000 47,301 0.29
Euro (2016: 4,046,996, 26.65%) 5,374,484 32.75
Austria (Govt of) 0.5% 20/04/2027 168,000 200,072 1.22
Belgium (Govt of) 2.6% 22/06/2024 80,000 111,155 0.68
Belgium (Govt of) 4.25% 28/09/2022 15,000 21,735 0.13
Belgium (Govt of) 5% 28/03/2035 57,000 109,825 0.67
Belgium (Govt of) 5.5% 28/03/2028 63,000 112,480 0.68
Bonos Y Oblig Del Estado 0.75% 30/07/2021 70,000 85,968 0.52
Bonos Y Oblig Del Estado 5.15% 31/10/2044 30,000 52,576 0.32
BTPS Italy 3.75% 01/08/2021 35,000 47,059 0.29
Bundesrepublik Deutschland 2.5% 15/08/2046 43,000 67,852 0.41
Bundesrepublic Deutschland 5.5% 04/01/2031 153,500 295,080 1.80
Buoni Poliennali Del Tes 2% 01/12/2025 275,000 339,248 2.07
Buoni Poliennali Del Tes 3.5% 01/03/2030 200,000 270,594 1.65
Buoni Poliennali Des Tes 4.25% 01/03/2020 215,000 281,846 1.72
Finnish (Govt of) 0.75% 15/04/2031 27,000 31,882 0.19
Finnish (Govt of) 1.5% 15/4/2023 20,000 25,913 0.16
France (Govt of) 0.5% 25/05/2026 234,000 282,068 1.72
France (Govt of) 1.75% 25/11/2024 294,000 389,887 2.38
France (Govt of) 2.75% 25/10/2027 16,000 23,014 0.14
France (Govt of) 4% 25/10/2038 60,000 106,449 0.65
Germany (Rep of) 0.25% 15/02/2027 295,000 350,481 2.14
Germany (Rep of) 0.5% 15/08/2027 299,000 361,057 2.20
Irish Treasury 2.4% 15/05/2030 13,000 17,940 0.11
Irish Treasury 3.4% 18/03/2024 15,000 21,477 0.13
Irish Treasury 3.9% 20/03/2023 56,000 80,468 0.49
Italy Buoni Poliennali Del Tesoro 2.05% 01/08/2027 190,000 230,124 1.40
Italy Buoni Poliennali Del Tesoro 5.5% 01/11/2022 284,000 417,500 2.54
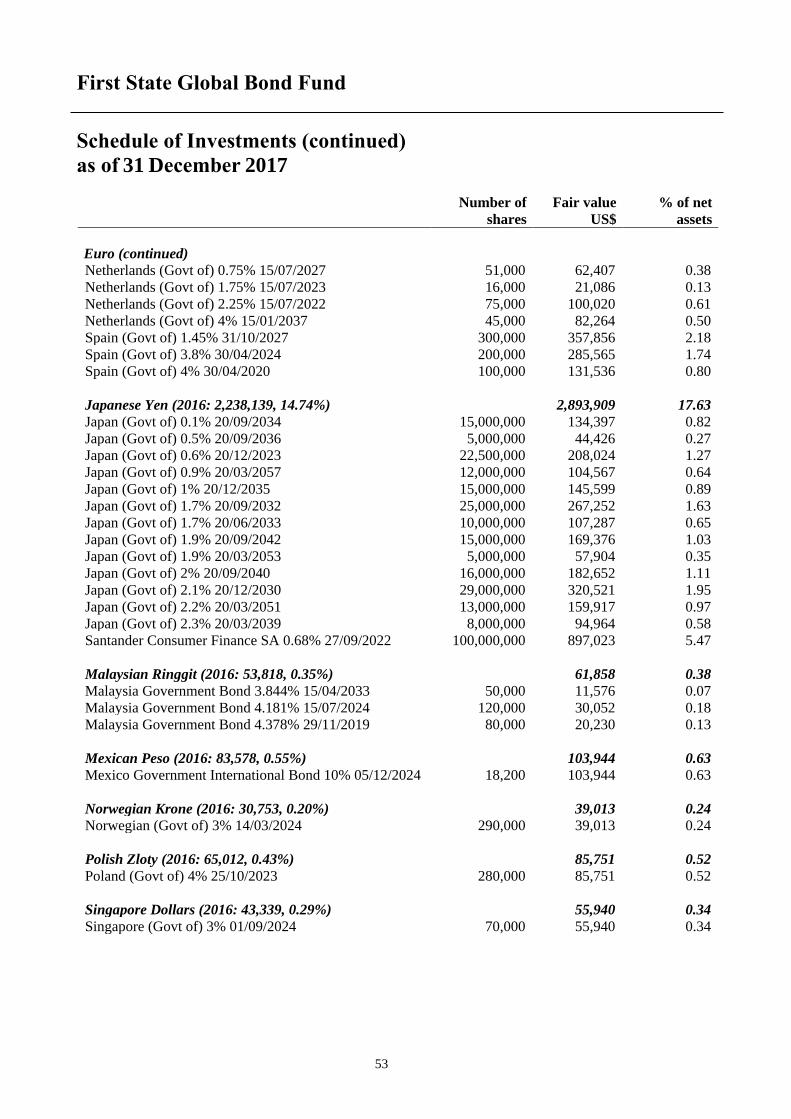
First State Global Bond Fund
Schedule of Investments (continued)
as of 31 December 2017
53
Number of
shares
Fair value
US$
% of net
assets
Euro (continued)
Netherlands (Govt of) 0.75% 15/07/2027 51,000 62,407 0.38
Netherlands (Govt of) 1.75% 15/07/2023 16,000 21,086 0.13
Netherlands (Govt of) 2.25% 15/07/2022 75,000 100,020 0.61
Netherlands (Govt of) 4% 15/01/2037 45,000 82,264 0.50
Spain (Govt of) 1.45% 31/10/2027 300,000 357,856 2.18
Spain (Govt of) 3.8% 30/04/2024 200,000 285,565 1.74
Spain (Govt of) 4% 30/04/2020 100,000 131,536 0.80
Japanese Yen (2016: 2,238,139, 14.74%) 2,893,909 17.63
Japan (Govt of) 0.1% 20/09/2034 15,000,000 134,397 0.82
Japan (Govt of) 0.5% 20/09/2036 5,000,000 44,426 0.27
Japan (Govt of) 0.6% 20/12/2023 22,500,000 208,024 1.27
Japan (Govt of) 0.9% 20/03/2057 12,000,000 104,567 0.64
Japan (Govt of) 1% 20/12/2035 15,000,000 145,599 0.89
Japan (Govt of) 1.7% 20/09/2032 25,000,000 267,252 1.63
Japan (Govt of) 1.7% 20/06/2033 10,000,000 107,287 0.65
Japan (Govt of) 1.9% 20/09/2042 15,000,000 169,376 1.03
Japan (Govt of) 1.9% 20/03/2053 5,000,000 57,904 0.35
Japan (Govt of) 2% 20/09/2040 16,000,000 182,652 1.11
Japan (Govt of) 2.1% 20/12/2030 29,000,000 320,521 1.95
Japan (Govt of) 2.2% 20/03/2051 13,000,000 159,917 0.97
Japan (Govt of) 2.3% 20/03/2039 8,000,000 94,964 0.58
Santander Consumer Finance SA 0.68% 27/09/2022 100,000,000 897,023 5.47
Malaysian Ringgit (2016: 53,818, 0.35%) 61,858 0.38
Malaysia Government Bond 3.844% 15/04/2033 50,000 11,576 0.07
Malaysia Government Bond 4.181% 15/07/2024 120,000 30,052 0.18
Malaysia Government Bond 4.378% 29/11/2019 80,000 20,230 0.13
Mexican Peso (2016: 83,578, 0.55%) 103,944 0.63
Mexico Government International Bond 10% 05/12/2024 18,200 103,944 0.63
Norwegian Krone (2016: 30,753, 0.20%) 39,013 0.24
Norwegian (Govt of) 3% 14/03/2024 290,000 39,013 0.24
Polish Zloty (2016: 65,012, 0.43%) 85,751 0.52
Poland (Govt of) 4% 25/10/2023 280,000 85,751 0.52
Singapore Dollars (2016: 43,339, 0.29%) 55,940 0.34
Singapore (Govt of) 3% 01/09/2024 70,000 55,940 0.34

First State Global Bond Fund
Schedule of Investments (continued)
as of 31 December 2017
54
Number of
shares
Fair value
US$
% of net
assets
South African Rand (2016: 63,831, 0.42%) 79,741 0.49
South Africa Government International Bond 7% 28/02/2031 80,000 5,437 0.04
South Africa Government International Bond 9% 31/01/2040 980,000 74,304 0.45
Sterling Pound (2016: 684,090, 4.50%) 788,707 4.81
UK Treasury 4.25% 07/03/2036 133,000 252,255 1.54
UK Treasury 4.5% 07/12/2042 121,000 252,939 1.54
United Kingdom Gilt 1.25% 22/07/2027 78,000 105,526 0.64
United Kingdom Gilt 1.5% 22/01/2021 120,000 166,724 1.02
United Kingdom Gilt 3.5% 22/07/2068 5,000 11,263 0.07
Swedish Krono (2016: 33,978, 0.22%) 63,321 0.39
Sweden (Govt of) 1.5% 13/11/2023 290,000 38,158 0.23
Sweden (Govt of) 3.5% 30/03/2039 150,000 25,163 0.16
Swiss Franc (2016: 25,127, 0.17%) 21,508 0.13
Switzerland (Govt of) 4% 11/02/2023 17,000 21,508 0.13
United States Dollar (2016: 7,039,499, 46.35%) 5,859,174 35.70
Bao-trans Enterprises 3.75% 12/12/2018 400,000 402,970 2.46
Bestgain Real Estate 2.625% 13/03/2018 400,000 399,895 2.44
China Development Bank 2.75% 16/11/2022 200,000 198,129 1.21
Citic Pacific 6.875% 21/01/2018 400,000 400,926 2.44
Citigroup 2.5% 26/09/2018 100,000 100,303 0.61
Export Import Bank of China 2.75% 28/11/2022 200,000 197,474 1.20
Harvest Operations 2.125% 14/05/2018 200,000 199,769 1.22
International Finance 2.125% 07/04/2026 200,000 193,782 1.18
Three Gorges Finance I 3.15% 02/06/2026 200,000 195,808 1.19
US Treasury 3.125% 15/05/2021 750,000 776,045 4.73
US Treasury 4.5% 15/02/2036 100,000 128,633 0.78
US Treasury Bond 2.5% 15/05/2046 160,000 151,806 0.92
US Treasury Bond 3.125% 15/02/2043 560,000 600,294 3.66
US Treasury Bond 3.875% 15/08/2040 25,000 30,078 0.18
US Treasury Note 0.875% 15/05/2019 100,000 98,701 0.60
US Treasury Note 1.375% 31/05/2020 300,000 296,074 1.80
US Treasury Note 1.625% 15/08/2022 690,000 673,451 4.10
US Treasury Note 2% 15/11/2026 300,000 290,086 1.77
US Treasury Note 2.25% 15/11/2024 300,000 298,207 1.82
US Treasury Note 3% 15/05/2047 26,000 27,261 0.17
Want Want China Finance 1.875% 14/05/2018 200,000 199,482 1.22
Total bonds* 16,169,072 98.52

First State Global Bond Fund
Schedule of Investments (continued)
as of 31 December 2017
55
Number of
shares
Fair value
US$ % of net assets
Forward contracts ** (2016: 3,323, 0.02%) 13,872 0.08
Buy EUR 351,000 / Sell USD 414,679 1 7,807 0.05
Buy JPY 86,600,000 / Sell USD 767,445 1 5,000 0.03
Buy GBP 54,000 / Sell USD 72,210 1 845 0.00
Buy GBP 24,000 / Sell USD 32,350 1 119 0.00
Buy AUD 4,000 / Sell USD 3,026 2 101 0.00
Total financial assets designated at fair value through
profit or loss 16,182,944 98.60
Forward contracts ** (2016: (45,894), (0.30%)) (7,622) (0.05)
Buy USD 88,756 / Sell CAD 114,000 1 (2,289) (0.02)
Buy USD 163,927 / Sell EUR 138,000 2 (2,178) (0.01)
Buy USD 270,720 / Sell JPY 30,000,000 3 (1,900) (0.01)
Buy USD 102,358 / Sell EUR 86,000 1 (1,157) (0.01)
Buy USD 5,921 / Sell SGD 8,000 1 (74) (0.00)
Buy USD 2,682 / Sell GBP 2,000 1 (24) (0.00)
Future contracts 4 *** (2016: (1,641), (0.01%)) (469) (0.00)
CBOT 2 Year U.S. Notes Mar 18 4 (469) (0.00)
Total financial liabilities designated at fair value through
profit or loss (8,091) (0.05)
Total financial assets and liabilities designated at fair value
through profit or loss 16,174,853 98.55
Cash and other net assets 237,393 1.45
Total net assets attributable to redeemable participating
shareholders 16,412,246 100.00
Total cost of financial assets designated at fair value through
profit or loss (2016: 14,658,498) 15,825,141
1The counterparty for the forward contracts is HSBC Bank plc. 2 The counterparty for the forward contracts is Australia and New Zealand Banking Group. 3The counterparty for the forward contracts is UBS AG Singapore Branch. 4The counterparty for the future contract is JP Morgan Securities LLC.

First State Global Bond Fund
Schedule of Investments (continued)
as of 31 December 2017
56
Analysis of net investments
% of total
assets
*Transferable securities admitted to an official stock
exchange listing or traded on a regulated market 16,169,072 98.38
**Financial derivative instruments traded over-the-counter 6,250 0.04
***Financial derivative instruments dealt on a regulated
market (469) 0.00

First State Global Bond Fund
Portfolio Changes (Unaudited)
57
The schedule of portfolio changes is based on financial assets designated at fair value through
profit or loss
Number of
shares purchased
Number of
shares sold
Australia Government Bond 3.75% 21/04/2037 25,000 -
Australia Government Bond 4.25% 21/04/2026 3,000 -
Austria (Govt of) 0.5% 20/04/2027 168,000 -
Austria (Govt of) 1.2% 20/10/2025 30,000 47,000
Austria (Govt of) 3.4% 22/11/2022 - 40,000
Austria (Govt of) 4.15% 15/03/2037 - 30,000
Bao-trans Enterprises 3.75% 12/12/2018 200,000 -
Belgium (Govt of) 2.6% 22/06/2024 40,000 -
Belgium (Govt of) 3.75% 22/06/2045 - 10,000
Belgium (Govt of) 5% 28/03/2035 15,000 -
Belgium (Govt of) 5.5% 28/03/2028 3,000 -
Bestgain Real Estate 2.625% 13/03/2018 200,000 -
Bonos Y Oblig Del Estado 0.75% 30/07/2021 70,000 -
Bonos Y Oblig Del Estado 1.3% 31/10/2026 220,000 220,000
Bonos Y Oblig Del Estado 5.15% 31/10/2044 15,000 -
BTPS Italy 3.75% 01/08/2021 5,000 -
Bundesrepublik Deutschland 0% 15/08/2026 320,000 720,000
Bundesrepublik Deutschland 1% 15/08/2025 240,000 240,000
Bundesrepublik Deutschland 2.5% 04/07/2044 60,000 100,000
Bundesrepublik Deutschland 2.5% 15/08/2046 43,000 -
Bundesrepublik Deutschland 4% 04/01/2037 40,000 80,000
Bundesrepublic Deutschland 5.5% 04/01/2031 153,500 -
Buoni Poliennali Del Tes 0.25% 15/05/2018 - 45,000
Buoni Poliennali Del Tes 2% 01/12/2025 311,000 116,000
Buoni Poliennali Del Tes 2.5% 01/12/2024 - 70,000
Buoni Poliennali Del Tes 3.5% 01/03/2030 277,000 77,000
Buoni Poliennali Des Tes 4.25% 01/03/2020 20,000 -
Buoni Poliennali Des Tes 4.5% 01/03/2024 - 36,000
Canadian (Govt of) 1.5% 01/06/2023 50,000 -
Canadian (Govt of) 2% 01/06/2028 5,000 -
Canadian (Govt of) 5% 01/06/2037 15,000 -
China Development Bank 2.75% 16/11/2022 200,000 -
Citic Pacific 6.875% 21/01/2018 200,000 -
Citigroup 2.5% 26/09/2018 100,000 -
Denmark Government Bond 0.5% 15/11/2027 220,000 -
Denmark Government Bond 1.5% 15/11/2023 - 230,000
Export Import Bank of China 2.75% 28/11/2022 200,000 -
Finnish (Govt of) 0.75% 15/04/2031 15,000 -
France (Govt of) 0.25% 25/11/2026 220,000 220,000

First State Global Bond Fund
Portfolio Changes (Unaudited) (continued)
58
Number of
shares purchased
Number of
shares sold
France (Govt of) 0.5% 25/11/2019 - 270,000
France (Govt of) 0.5% 25/05/2026 234,000 -
France (Govt of) 1% 25/11/2025 - 150,000
France (Govt of) 1% 25/05/2027 428,000 428,000
France (Govt of) 1.75% 25/11/2024 - 36,000
France (Govt of) 2.5% 25/05/2030 - 85,000
France (Govt of) 2.75% 25/10/2027 16,000 -
France (Govt of) 4% 25/10/2038 - 7,442
France (Govt of) 4% 25/04/2055 - 35,000
Germany (Rep of) 0.25% 15/02/2027 899,000 604,000
Germany (Rep of) 0.5% 15/08/2027 565,000 266,000
Harvest Operations 2.125% 14/05/2018 200,000 -
Irish Treasury 2.4% 15/05/2030 3,000 -
Irish Treasury 3.9% 20/03/2023 45,000 14,000
Italy Buoni Poliennali Del Tesoro 1.25% 01/12/2026 - 360,000
Italy Buoni Poliennali Del Tesoro 2.05% 01/08/2027 190,000 -
Italy Buoni Poliennali Del Tesoro 2.2% 01/06/2027 105,000 105,000
Italy Buoni Poliennali Del Tesoro 4.75% 01/09/2044 - 40,000
Italy Buoni Poliennali Del Tesoro 5.5% 01/11/2022 59,000 5,000
Japan (Govt of) 0.1% 20/09/2034 4,000,000 -
Japan (Govt of) 0.4% 20/06/2025 - 32,500,000
Japan (Govt of) 0.5% 20/09/2036 2,000,000 -
Japan (Govt of) 0.6% 20/12/2023 5,000,000 2,500,000
Japan (Govt of) 0.6% 20/03/2024 - 32,200,000
Japan (Govt of) 0.9% 20/03/2057 12,500,000 500,000
Japan (Govt of) 2% 20/09/2040 1,900,000 -
Japan (Govt of) 2.1% 20/12/2030 8,000,000 -
Japan (Govt of) 2.2% 20/03/2051 - 100,000
JPMorgan Chase 1.35% 15/02/2017 - 200,000
Malaysia Government Bond 3.844% 15/04/2033 50,000 -
Malaysia Government Bond 4.378% 29/11/2019 - 40,000
Mexico Government International Bond 10% 05/12/2024 3,200 -
Netherlands (Govt of) 0.5% 15/07/2026 30,000 30,000
Netherlands (Govt of) 0.75% 15/07/2027 51,000 -
Netherlands (Govt of) 1.75% 15/07/2023 - 34,000
Norwegian (Govt of) 3% 14/03/2024 50,000 -
Poland (Govt of) 4% 25/10/2023 40,000 20,000
Santander Consumer Finance 0.68% 27/09/2022 100,000,000 -
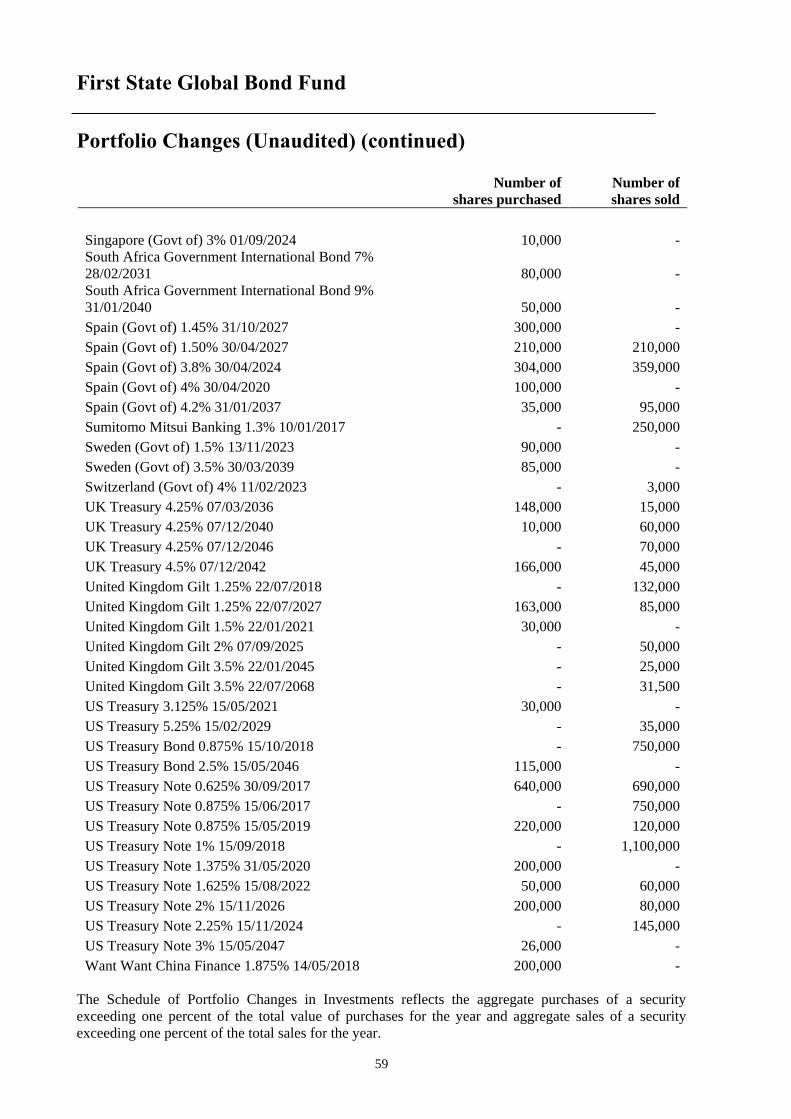
First State Global Bond Fund
Portfolio Changes (Unaudited) (continued)
59
Number of
shares purchased
Number of
shares sold
Singapore (Govt of) 3% 01/09/2024 10,000 -
South Africa Government International Bond 7%
28/02/2031 80,000 -
South Africa Government International Bond 9%
31/01/2040 50,000 -
Spain (Govt of) 1.45% 31/10/2027 300,000 -
Spain (Govt of) 1.50% 30/04/2027 210,000 210,000
Spain (Govt of) 3.8% 30/04/2024 304,000 359,000
Spain (Govt of) 4% 30/04/2020 100,000 -
Spain (Govt of) 4.2% 31/01/2037 35,000 95,000
Sumitomo Mitsui Banking 1.3% 10/01/2017 - 250,000
Sweden (Govt of) 1.5% 13/11/2023 90,000 -
Sweden (Govt of) 3.5% 30/03/2039 85,000 -
Switzerland (Govt of) 4% 11/02/2023 - 3,000
UK Treasury 4.25% 07/03/2036 148,000 15,000
UK Treasury 4.25% 07/12/2040 10,000 60,000
UK Treasury 4.25% 07/12/2046 - 70,000
UK Treasury 4.5% 07/12/2042 166,000 45,000
United Kingdom Gilt 1.25% 22/07/2018 - 132,000
United Kingdom Gilt 1.25% 22/07/2027 163,000 85,000
United Kingdom Gilt 1.5% 22/01/2021 30,000 -
United Kingdom Gilt 2% 07/09/2025 - 50,000
United Kingdom Gilt 3.5% 22/01/2045 - 25,000
United Kingdom Gilt 3.5% 22/07/2068 - 31,500
US Treasury 3.125% 15/05/2021 30,000 -
US Treasury 5.25% 15/02/2029 - 35,000
US Treasury Bond 0.875% 15/10/2018 - 750,000
US Treasury Bond 2.5% 15/05/2046 115,000 -
US Treasury Note 0.625% 30/09/2017 640,000 690,000
US Treasury Note 0.875% 15/06/2017 - 750,000
US Treasury Note 0.875% 15/05/2019 220,000 120,000
US Treasury Note 1% 15/09/2018 - 1,100,000
US Treasury Note 1.375% 31/05/2020 200,000 -
US Treasury Note 1.625% 15/08/2022 50,000 60,000
US Treasury Note 2% 15/11/2026 200,000 80,000
US Treasury Note 2.25% 15/11/2024 - 145,000
US Treasury Note 3% 15/05/2047 26,000 -
Want Want China Finance 1.875% 14/05/2018 200,000 -
The Schedule of Portfolio Changes in Investments reflects the aggregate purchases of a security
exceeding one percent of the total value of purchases for the year and aggregate sales of a security
exceeding one percent of the total sales for the year.

First State High Quality Bond Fund
Investment Manager’s Report (Unaudited)
60
Performance
01/01/14 01/01/15 01/01/16 01/01/17
To To To To
31/12/14 31/12/15 31/12/16 31/12/17
First State High Quality Bond Fund “the Fund”
- Class I (Dist)^ 5.07% -1.19% 0.68% 3.56%
- Class III 5.83% -0.41% 1.43% 4.27%
Barclays US Gov't/Credit# 6.01% 0.15% 3.05% 4.00%
(Performance calculation is based on official dealing NAV per share)
^ Dividend adjustment return
#Benchmarks are being included for illustrative purposes and there is no guarantee that a fund will outperform a benchmark. Past performance is no indication of current or future performance and the performance data does not take account of
commissions and costs incurred in the issue and redemption of units.
The final quarter for 2017 was dominated by monetary policy changes, US regulatory changes specifically
the highly anticipated tax reforms, changes to the Trump administration, global political unrest and heightened
geopolitical conflict. A risk on market sentiment dominated for most of the period with some equity indices at all-
time highs and credit spreads testing their post Global Financial Crisis (GFC) lows. In contrast, government bond
yields remained range bound (at historically narrow levels) amidst continued central bank buying. This despite the
expected US Federal Reserve’s third rate hike this year pushing the federal funds rate to 1.25%-1.50%. The Federal
Reserve continues to provide clear guidance for monetary policy endeavouring to not surprise the market. Economic
growth globally remains on a positive path and labour markets continued to improve. Despite this an absence of
wage pressures and inflation continue to be barriers to higher yields.
Looking at monetary policy, other than the rate hike in the US there were no other major changes as central
banks continue to support the economy with asset purchases (albeit at a reduced pace). The key change from central
banks was the nomination as incoming Chairman of the US Federal Reserve (Fed) of Jerome Powell. It is widely
anticipated that Mr. Powell represents continuity at the Federal Reserve. However additional focus will be on the
new appointments to the Federal Reserve board and how that will impact voting on monetary policy going forward.
On the political front, in the US the Trump administration was thrown into heightened risks of
impeachment following the indictment of a number of associates related to the involvement with Russia during the
election campaign. In Japan, President Abe was re-elected in a landslide victory in the parliamentary elections. In
China, President Xi Jinping became the “chairman of everything” and broke precedent by not appointing an obvious
successor leading to speculation he may seek to remain in power longer than his current 5-year term. New Zealand
saw a new Prime Minister elected following an inconclusive public vote which ended with a coalition government
being formed between Labour and the Greens and nationalist New Zealand First parties. In Australia, the dual
citizenship scandal rocked parliament with a number of MPs relinquished from their duties for holding undeclared
dual citizen status.
In Europe, political turmoil in Spain was also rife with the battle over Catalonia’s bid for independence
leading to fiery clashes in the region. German elections, which were assumed to be a clear win for Chancellor
Angela Merkel, were plunged into doubt as hope of a planned coalition with the Greens and Free Party collapsed
however the Social Democrats provided a surprise coalition solution. In the UK and Europe, Brexit news continued
to dominate markets. Negotiations progressed then faltered but ended the quarter with confirmation from EU leaders
that they had agreed to move onto the second stage of negotiations with the UK.
Other newsworthy events included the rising oil price which broke over US$60 a barrel in December, the
highest level since June 2015. This was boosted by OPEC’s extension of production cuts. Also helping the rise was
the arrest of a number of ministers, royals and military officials as part of an anti-corruption campaign in Saudi
Arabia. Geopolitical risk was further increased when North Korea launched another missile after a notable hiatus
around the time of the Chinese Congress. Whilst the missile was significantly bigger than prior ones the market was
somewhat unresponsive to the event and again demonstrated a resilience to ongoing geopolitical risks, for now.

First State High Quality Bond Fund
Investment Manager’s Report (Unaudited) (continued)
61
The net impact of events in the quarter saw 10-year government bond yields down everywhere but the US
where yields rose 7 bps. The UK and Australia saw the biggest falls in yields, 18 bps and 21 bps respectively,
driven by Brexit in the UK and soft inflation data in Australia. German yields were more resilient falling 4 bps and
Japanese government bond yields were down 2 bps in the quarter.
Global investment grade credit spreads continued to grind tighter in the quarter in response to the largely
‘risk-on’ market environment. The quarter continued the trend of heightened demand for investment grade credit
topping off an insatiable year of appetite for higher yielding securities. The demand was met by annual global
issuance of US$2.2 trillion from corporates taking advantage of low global interest rates.
Looking at the specific indices, US credit also moved 7 bps narrower and Asia Investment Grade finished
26bps tighter. The Bloomberg Barclays US Aggregate Corporate Index average spread closing at 0.89bps and the
JPMorgan Asian Credit (Investment Grade) at 156bps. In Europe, the spread on the Bloomberg Barclays European
Aggregate Corporate Index was 10 bps narrower at 0.86%.
2018 will be dominated by bond markets, the US economy and the US dollar. Despite the tax reform
finally passing, political uncertainty remains around how much of President Trump’s pre-election promises can be
moved through Congress, along with the ongoing threat of impeachment. European event risk remains a lesser
potential risk to markets. Talks of normalisation are becoming more widespread with the US Federal Reserve
continuing on its gradual pace of higher interest rates, and with the timing of a gradual tapering of bond purchases
programs in both the US and Europe coming nearer. The risk of wage or inflation pressure emerging also represents
a risk to the outlook.
Global synchronised growth will be an ongoing theme in the year ahead. Whilst we expect volatility to
increase, they should remain contained given solid growth outlook and good corporate fundamentals (leverage
improving, earnings growth). Against this backdrop and in the current low inflation environment support for credit
markets should remain healthy. However the starting point for valuations in 2018 is lower (spreads) and higher
(equities) than in previous years. What this points to is lower expected returns in 2018 and the need to be defensive
minded in portfolios.
First State Investment (Hong Kong) Limited
February 2018

First State High Quality Bond Fund
Performance Table
as of 31 December 2017 (Unaudited)
62
Financial period Total net asset
value
Net asset
value per
share
Class I Distributing
Dec 2015 US$ 3,003,118 US$ 13.74
Dec 2016 US$ 3,887,302 US$ 13.62
Dec 2017 US$ 3,034,350 US$ 13.86
Class III
Dec 2015 US$ 79,226,209 US$ 21.68
Dec 2016 US$ 77,789,743 US$ 21.99
Dec 2017 US$ 80,955,858 US$ 22.93
Financial period The highest issue
price
The lowest
redemption
price
Class I Distributing
Dec 2008 US$ 13.32 US$ 12.25
Dec 2009 US$ 13.42 US$ 12.54
Dec 2010 US$ 13.89 US$ 13.15
Dec 2011 US$ 13.94 US$ 13.26
Dec 2012 US$ 14.28 US$ 13.72
Dec 2013 US$ 14.24 US$ 13.39
Dec 2014 US$ 14.13 US$ 13.60
Dec 2015 US$ 14.40 US$ 13.73
Dec 2016 US$ 14.45 US$ 13.52
Dec 2017 US$ 13.95 US$ 13.47

First State High Quality Bond Fund
Performance Table (continued)
as of 31 December 2017 (Unaudited)
63
Financial period The highest issue
price
The lowest
redemption
price
Class III
Dec 2008 US$ 17.14 US$ 15.75
Dec 2009 US$ 18.00 US$ 16.39
Dec 2010 US$ 19.31 US$ 17.88
Dec 2011 US$ 19.98 US$ 18.70
Dec 2012 US$ 21.04 US$ 19.89
Dec 2013 US$ 21.21 US$ 20.17
Dec 2014 US$ 21.78 US$ 20.55
Dec 2015 US$ 22.22 US$ 21.51
Dec 2016 US$ 23.07 US$ 21.70
Dec 2017 US$ 23.04 US$ 21.98

First State High Quality Bond Fund
Schedule of Investments
as of 31 December 2017
64
The schedule that follows includes financial assets designated at fair value through profit or loss
Number of
shares
Fair value
US$
% of net
assets
United States Dollar (2016: 80,612,928, 98.70%) 83,249,471 99.12
Abbvie 3.6% 14/05/2025 300,000 308,592 0.37
Abbvie 4.5% 14/05/2035 500,000 549,825 0.65
Abu Dhabi National Energy 2.5% 12/01/2018 250,000 250,286 0.30
Abu Dhabi National Energy 3.625% 12/01/2023 250,000 253,663 0.30
Alibaba Group Holding 4% 06/12/2037 500,000 517,093 0.62
Altria 9.95% 10/11/2038 300,000 514,081 0.61
American Electric Power 3.20% 13/11/2027 500,000 496,573 0.59
American International Group 4.5% 16/07/2044 250,000 269,693 0.32
Amgen 6.375% 01/06/2037 150,000 196,947 0.23
Anheuser-Busch Inbev Worldwide 6.625% 15/08/2033 350,000 467,347 0.56
AP Moeller Maersk 3.875% 28/09/2025 500,000 502,336 0.60
Apple 3.25% 23/02/2026 250,000 255,155 0.30
APT Pipelines 3.875% 11/10/2022 450,000 462,589 0.55
AstraZeneca 6.45% 15/09/2037 250,000 340,137 0.41
AT&T 4.9% 14/08/2037 500,000 506,893 0.60
AT&T 5.25% 01/03/2037 500,000 529,869 0.63
AT&T 6.3% 15/01/2038 200,000 235,895 0.28
Bank of America 3.248% 21/10/2027 500,000 495,429 0.59
Bank of America 3.824% VRN 20/01/2028 900,000 930,846 1.11
Bao-trans Enterprises 3.75% 12/12/2018 800,000 805,940 0.96
Becton Dickinson 3.7% 06/06/2027 500,000 503,622 0.60
Bharti Airtel International 5.35% 20/05/2024 1,000,000 1,078,226 1.28
Boardwalk Pipelines 4.45% 15/07/2027 400,000 407,211 0.49
Brambles USA 5.35% 01/04/2020 200,000 210,510 0.25
Centrica 4% 16/10/2023 400,000 412,385 0.49
China Development Bank 2.75% 16/11/2022 900,000 891,580 1.06
China State Construction Finance 3.375% 29/11/2022 800,000 793,658 0.95
CNAC HK Finbridge 4.125% 19/07/2027 1,000,000 1,002,183 1.19
Enbridge 3.7% 15/07/2027 250,000 250,796 0.30
ENI SPA 5.7% 01/10/2040 550,000 599,130 0.71
ENN Energy Holdings 3.25% 24/07/2022 800,000 795,326 0.95
Export-Import Bank of Korea 3% 01/11/2022 800,000 797,774 0.95
Firstenergy 3.9% 15/07/2027 500,000 512,447 0.61
GlaxoSmithKline Capital 6.375% 15/05/2038 250,000 352,712 0.42
Goldman Sachs 3.5% 16/11/2026 500,000 502,553 0.60
Goldman Sachs 6.75% 01/10/2037 500,000 669,313 0.80
Heathrow Funding 4.875% 15/07/2021 200,000 213,761 0.25
Home Depot 5.875% 16/12/2036 500,000 680,039 0.81
HSBC Bank 4.75% 19/01/2021 250,000 266,017 0.32
Huntington Ingalls Industries 3.483% 01/12/2027 1,000,000 998,550 1.19

First State High Quality Bond Fund
Schedule of Investments (continued)
as of 31 December 2017
65
Number of
shares
Fair value
US$
% of net
assets
United States Dollar (continued)
Incitec Pivot Finance 6% 10/12/2019 250,000 264,884 0.32
Intel 4% 15/12/2032 200,000 220,049 0.26
International Bank for Reconstruction & Development 0.5%
05/12/2022 1,500,000 1,323,660 1.58
International Bank for Reconstruction & Development 2.5%
29/07/2025 500,000 499,382 0.59
IPIC GMTN 5.5% 01/03/2022 250,000 275,275 0.33
JIC Zhixin 3.0% 24/11/2022 1,000,000 989,557 1.18
Johnson & Johnson 2.9% 15/01/2028 500,000 503,112 0.60
JPMorgan Chase 2.95% 01/10/2026 500,000 490,858 0.58
JPMorgan Chase 3.782% VRN 01/02/2028 500,000 518,047 0.62
Kinder Morgan 4.3% 01/06/2025 500,000 521,096 0.62
Kroger 2.65% 15/10/2026 500,000 465,571 0.55
Kroger 3.7% 01/08/2027 250,000 253,208 0.30
Lear 5.25% 15/01/2025 500,000 533,882 0.64
Li & Fung 5.25% Perp 200,000 185,108 0.22
Microsoft 3.3% 06/02/2027 500,000 515,701 0.61
Microsoft 4.1% 06/02/2037 500,000 558,906 0.67
Motorola Solutions 3.75% 15/05/2022 250,000 256,965 0.31
Nan Fung Treasury 3.875% 03/10/2027 500,000 482,706 0.57
National Bank of Abu Dhabi 3% 13/08/2019 500,000 505,218 0.60
Nexen 6.4% 15/05/2037 600,000 785,561 0.94
Nexen Energy 5.875% 10/03/2035 250,000 307,474 0.37
ORANGE SA 8.5% 01/03/2031 200,000 300,302 0.36
Origin Energy Finance 5.45% 14/10/2021 400,000 431,687 0.51
Potash Corporation of Saskatchewan 5.875% 01/12/2036 500,000 616,220 0.73
SES 3.6% 04/04/2023 100,000 100,480 0.12
Siemens Financieringsmaatschappij 6.125% 17/08/2026 500,000 605,276 0.72
Sinopec Group Overseas Development 2.5% 13/09/2022 800,000 779,547 0.93
Smiths Group 3.625% 12/10/2022 500,000 503,166 0.60
SPI Australia Assets 3.3% 09/04/2023 500,000 504,786 0.60
Statoil ASA 7.25% 23/09/2027 250,000 330,011 0.39
Sydney Airport Finance 3.625% 28/04/2026 500,000 505,322 0.60
Teva Pharmaceutical Finance 2.8% 21/07/2023 750,000 652,417 0.78
Teva Pharmaceutical Finance 3.65% 10/11/2021 250,000 237,970 0.28
Toronto-Dominion Bank 1.8% 13/07/2021 500,000 489,756 0.58
Transurban Finance 4.125% 02/02/2026 240,000 249,865 0.30
UBM 5.75% 03/11/2020 250,000 259,661 0.31
Unilever Capital 5.9% 15/11/2032 250,000 325,503 0.39

First State High Quality Bond Fund
Schedule of Investments (continued)
as of 31 December 2017
66
Number of
shares
Fair value
US$
% of net
assets
United States Dollar (continued)
United Overseas Bank 3.75% VRN 19/09/2024 800,000 812,554 0.97
US Bancorp 5.125% VRN Perp 400,000 416,500 0.50
US Treasury Bill 1.875% 31/01/2022 1,000,000 988,809 1.18
US Treasury Bill 2.25% 15/11/2027 750,000 738,091 0.88
US Treasury Bond 2.5% 15/05/2046 500,000 474,395 0.57
US Treasury Bond 4.25% 15/05/2039 1,000,000 1,262,500 1.50
US Treasury Note 1.125% 31/01/2019 2,600,000 2,579,689 3.07
US Treasury Note 1.25% 31/03/2021 2,500,000 2,438,183 2.90
US Treasury Note 1.375% 31/07/2019 2,000,000 1,984,296 2.36
US Treasury Note 1.375% 15/09/2020 2,500,000 2,463,085 2.93
US Treasury Note 1.375% 31/10/2020 2,000,000 1,966,602 2.34
US Treasury Note 1.5% 28/02/2019 2,000,000 1,992,032 2.37
US Treasury Note 1.5% 31/05/2019 3,300,000 3,283,695 3.91
US Treasury Note 1.5% 31/10/2019 750,000 744,785 0.89
US Treasury Note 1.5% 15/08/2020 2,000,000 1,976,954 2.35
US Treasury Note 1.75% 30/11/2021 3,000,000 2,957,343 3.52
US Treasury Note 1.875% 31/07/2022 1,800,000 1,773,844 2.11
US Treasury Note 3% 15/05/2047 1,050,000 1,100,921 1.31
US Treasury Note 3.625% 15/02/2044 2,000,000 2,332,500 2.78
US Treasury Note 3.75% 15/11/2018 1,500,000 1,525,430 1.82
US Treasury Note 3.75% 15/11/2043 3,300,000 3,924,809 4.67
Vanke Real Estate Hong Kong 3.975% 09/11/2027 1,000,000 997,150 1.19
Verizon Communications 4.5% 10/08/2033 500,000 522,868 0.62
Vodafone Group 6.15% 27/02/2037 400,000 502,369 0.60
Wells Fargo 3.069% 24/01/2023 500,000 503,741 0.60
Wells Fargo 4.1% 03/06/2026 500,000 524,264 0.62
Westpac Banking Corporation 3.625% VAR 28/02/2023 1,500,000 1,510,335 1.80
WI Treasury Securities 1.625% 31/07/2020 400,000 396,711 0.47
WI Treasury Securities 2% 31/07/2022 2,400,000 2,379,845 2.83
Total financial assets designated at fair value through profit
or loss* 83,249,471 99.12
Future contract (2016: (16,301), (0.02%)) - -
Total financial assets and liabilities designated at fair value
through profit or loss 83,249,471 99.12
Cash and other net assets 740,737 0.88
Total net assets attributable to redeemable participating
shareholders 83,990,208 100.00

First State High Quality Bond Fund
Schedule of Investments (continued)
as of 31 December 2017
67
Number of
shares
Fair value
US$
% of net
assets
Total cost of financial assets designated at fair value
through profit or loss ( 2016: 80,587,844) 81,944,590
Analysis of net investments
% of
total
assets
*Transferable securities admitted to an official stock
exchange listing or traded on a regulated market 83,249,471 98.99

First State High Quality Bond Fund
Portfolio Changes (Unaudited)
68
The schedule of portfolio changes is based on financial assets designated at fair value through
profit or loss
Number of
shares purchased
Number of
shares sold
Abbvie 3.6% 14/05/2025 300,000 -
Abbvie 4.5% 14/05/2035 500,000 -
ABN AMRO Bank 4.25% 02/02/2017 - 250,000
AerCap Ireland Capital 3.95% 01/02/2022 500,000 500,000
AIA Group 3.2% 11/03/2025 - 500,000
Alibaba Group Holding 4% 06/12/2037 500,000 -
Altera 4.1% 15/11/2023 - 400,000
America Movil 3.125% 16/07/2022 - 500,000
American Electric Power 3.20% 13/11/2027 500,000 -
Anheuser-Busch InBev Worldwide 7.75% 15/01/2019 - 400,000
Apple 3.2% 11/05/2027 500,000 500,000
Apple 3.25% 23/02/2026 500,000 250,000
APT Pipelines 4.25% 15/07/2027 70,000 70,000
AT&T 4.9% 14/08/2037 500,000 -
AT&T 5.20% 15/03/2020 - 100,000
AT&T 5.25% 01/03/2037 500,000 -
Australia & New Zealand Banking 3.45% 08/08/2022 - 500,000
Banco De Credito E Inversiones 4% 11/02/2023 - 500,000
Banco Del Estado 4.125% 07/10/2020 - 250,000
Bank of America 3.248% 21/10/2027 500,000 -
Bank of America 3.824% VRN 20/01/2028 900,000 -
Bank of China Luxemborg 2.25% 12/07/2021 - 1,000,000
Bao-trans Enterprises 3.75% 12/12/2018 800,000 500,000
Becton Dickinson 3.7% 06/06/2027 500,000 -
Bestgain Real Estate 2.625% 13/03/2018 - 300,000
Bestgain Real Estate 3.95% 23/12/2019 - 200,000
Bharti Airtel International 5.35% 20/05/2024 1,000,000 -
BNP Paribas 5% 15/01/2021 - 500,000
Boardwalk Pipelines 4.45% 15/07/2027 400,000 -
CA 5.375% 01/12/2019 - 400,000
Chevron 3.191% 24/06/2023 - 500,000
China Development Bank 2.75% 16/11/2022 900,000 -
China State Construction Finance 3.375% 29/11/2022 800,000 -
CLP Power Hong Kong Financing 2.875% 26/04/2023 - 250,000
CNAC HK Finbridge 4.125% 19/07/2027 1,000,000 -
Coca-Cola Femsa 4.625% 15/02/2020 - 100,000
Comcast 6.5% 15/11/2035 - 200,000
Cooperatieve Rabobank 4% VRN 10/04/2029 400,000 400,000
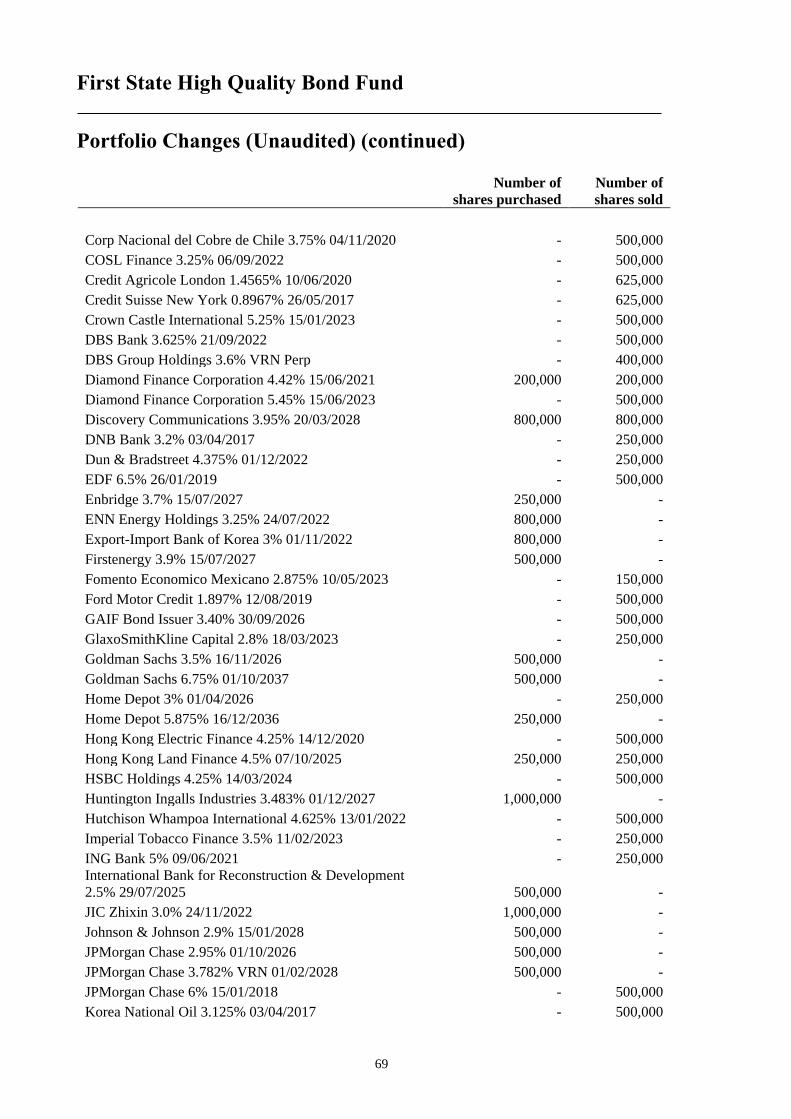
First State High Quality Bond Fund
Portfolio Changes (Unaudited) (continued)
69
Number of
shares purchased
Number of
shares sold
Corp Nacional del Cobre de Chile 3.75% 04/11/2020 - 500,000
COSL Finance 3.25% 06/09/2022 - 500,000
Credit Agricole London 1.4565% 10/06/2020 - 625,000
Credit Suisse New York 0.8967% 26/05/2017 - 625,000
Crown Castle International 5.25% 15/01/2023 - 500,000
DBS Bank 3.625% 21/09/2022 - 500,000
DBS Group Holdings 3.6% VRN Perp - 400,000
Diamond Finance Corporation 4.42% 15/06/2021 200,000 200,000
Diamond Finance Corporation 5.45% 15/06/2023 - 500,000
Discovery Communications 3.95% 20/03/2028 800,000 800,000
DNB Bank 3.2% 03/04/2017 - 250,000
Dun & Bradstreet 4.375% 01/12/2022 - 250,000
EDF 6.5% 26/01/2019 - 500,000
Enbridge 3.7% 15/07/2027 250,000 -
ENN Energy Holdings 3.25% 24/07/2022 800,000 -
Export-Import Bank of Korea 3% 01/11/2022 800,000 -
Firstenergy 3.9% 15/07/2027 500,000 -
Fomento Economico Mexicano 2.875% 10/05/2023 - 150,000
Ford Motor Credit 1.897% 12/08/2019 - 500,000
GAIF Bond Issuer 3.40% 30/09/2026 - 500,000
GlaxoSmithKline Capital 2.8% 18/03/2023 - 250,000
Goldman Sachs 3.5% 16/11/2026 500,000 -
Goldman Sachs 6.75% 01/10/2037 500,000 -
Home Depot 3% 01/04/2026 - 250,000
Home Depot 5.875% 16/12/2036 250,000 -
Hong Kong Electric Finance 4.25% 14/12/2020 - 500,000
Hong Kong Land Finance 4.5% 07/10/2025 250,000 250,000
HSBC Holdings 4.25% 14/03/2024 - 500,000
Huntington Ingalls Industries 3.483% 01/12/2027 1,000,000 -
Hutchison Whampoa International 4.625% 13/01/2022 - 500,000
Imperial Tobacco Finance 3.5% 11/02/2023 - 250,000
ING Bank 5% 09/06/2021 - 250,000
International Bank for Reconstruction & Development
2.5% 29/07/2025 500,000 -
JIC Zhixin 3.0% 24/11/2022 1,000,000 -
Johnson & Johnson 2.9% 15/01/2028 500,000 -
JPMorgan Chase 2.95% 01/10/2026 500,000 -
JPMorgan Chase 3.782% VRN 01/02/2028 500,000 -
JPMorgan Chase 6% 15/01/2018 - 500,000
Korea National Oil 3.125% 03/04/2017 - 500,000

First State High Quality Bond Fund
Portfolio Changes (Unaudited) (continued)
70
Number of
shares purchased
Number of
shares sold
Kowloon Canton Railway 5.125% 20/05/2019 - 500,000
Kroger 2.65% 15/10/2026 500,000 -
Kroger 3.7% 01/08/2027 250,000 -
Lear 5.25% 15/01/2025 500,000 -
Li & Fung 5.25% Perp 200,000 -
Lloyds Bank 2.7% 17/08/2020 - 500,000
Lockheed Martin 3.55% 15/01/2026 500,000 500,000
Malayan Banking 3% 10/02/2017 - 500,000
Medtronic 3.5% 15/03/2025 - 500,000
Microsoft 3.3% 06/02/2027 500,000 -
Microsoft 4.1% 06/02/2037 500,000 -
Morgan Stanley 2.5% 21/04/2021 - 500,000
MTR 2% 12/04/2017 - 500,000
Nan Fung Treasury 3.875% 3/10/2027 500,000 -
National Australia Bank 1.875% 23/07/2018 - 315,000
Nationwide Building Society 6.25% 25/02/2020 - 500,000
Nordea Bank 3.125% 20/03/2017 - 500,000
NXP Funding 4.125% 01/06/2021 800,000 800,000
Ooredoo International Finance 7.875% 10/06/2019 - 250,000
Optus Finance Pty 4.625% 15/10/2019 - 750,000
Oracle 2.5% 15/10/2022 - 500,000
Oracle 3.25% 15/11/2027 500,000 500,000
Oversea-Chinese Banking 3.75% 15/11/2022 - 500,000
Procter & Gamble 3.1% 15/08/2023 - 100,000
PSA International 3.875% 11/02/2021 - 200,000
QNB Finance 2.75% 31/10/2018 - 250,000
Rabobank Netherlands 3.875% 08/02/2022 - 500,000
Ras Laffan 5.298% 30/09/2020 - 625,000
Reynolds American 4.45% 12/06/2025 400,000 400,000
Shire Acquisitions Investment Ireland 2.875% 23/09/2023 - 500,000
Sinopec Group Overseas Development 2.5% 13/09/2022 800,000 -
Sinopec Group Overseas Development 3.9% 17/05/2022 - 250,000
Societe Generale 5.2% 15/04/2021 - 250,000
SPI Australia Assets 3.3% 09/04/2023 - 500,000
Standard Chartered 4.3% 19/02/2027 - 200,000
Svenska Handelsbanken AB 2.875% 04/04/2017 - 250,000
Swire Pacific MTN Financing 5.5% 19/08/2019 - 400,000
Sydney Airport Finance 3.625% 28/04/2026 500,000 300,000
Sydney Airport Finance 3.9% 22/03/2023 - 200,000

First State High Quality Bond Fund
Portfolio Changes (Unaudited) (continued)
71
Number of
shares purchased
Number of
shares sold
Telefonaktiebolaget LM Ericsson 4.125% 15/05/2022 - 200,000
Temasek Financial 4.3% 25/10/2019 - 250,000
Teva Pharmaceutical Finance 2.8% 21/07/2023 750,000 -
Three Gorges Finance I 3.15% 02/06/2026 - 1,500,000
Toronto-Dominion Bank 1.8% 13/07/2021 500,000 -
Toronto-Dominion Bank 3.625% VRN 15/09/2031 - 1,000,000
United Overseas Bank 2.875% VRN 17/10/2022 - 200,000
United Overseas Bank 3.75% VRN 19/09/2024 800,000 -
US Bancorp 2.35% 29/01/2021 - 500,000
US Bancorp 5.125% VRN Perp - 600,000
US Treasury 1.125% 31/01/2019 2,600,000 -
US Treasury 1.5% 31/10/2019 750,000 -
US Treasury Bill 1.875% 31/01/2022 1,000,000 -
US Treasury Bill 2.25% 15/11/2027 1,350,000 600,000
US Treasury Bond 1.5% 15/07/2020 90,000 90,000
US Treasury Bond 2.25% 15/08/2027 700,000 700,000
US Treasury Bond 2.5% 15/02/2045 - 165,000
US Treasury Bond 2.875% 15/11/2046 - 900,000
US Treasury Bond 3% 15/11/2045 - 300,000
US Treasury Note 0.625% 30/09/2017 3,400,000 3,900,000
US Treasury Note 0.625% 30/04/2018 - 1,500,000
US Treasury Note 0.75% 28/02/2018 1,800,000 3,050,000
US Treasury Note 1% 31/05/2018 - 1,500,000
US Treasury Note 1% 15/09/2018 1,000,000 2,500,000
US Treasury Note 1.25% 31/03/2021 500,000 -
US Treasury Note 1.375% 31/07/2018 - 1,500,000
US Treasury Note 1.375% 31/07/2019 2,000,000 -
US Treasury Note 1.375% 15/09/2020 2,500,000 -
US Treasury Note 1.375% 31/10/2020 2,000,000 -
US Treasury Note 1.5% 28/02/2019 500,000 -
US Treasury Note 1.5% 31/05/2019 1,050,000 -
US Treasury Note 1.5% 15/08/2020 2,000,000 -
US Treasury Note 1.625% 15/11/2022 2,500,000 2,500,000
US Treasury Note 1.625% 15/05/2026 - 2,400,000
US Treasury Note 1.75% 30/11/2021 1,700,000 -
US Treasury Note 1.875% 31/07/2022 2,480,000 680,000
US Treasury Note 1.875% 30/09/2022 600,000 600,000
US Treasury Note 2% 15/11/2026 400,000 1,250,000
US Treasury Note 2.125% 30/11/2023 100,000 500,000
US Treasury Note 2.5% 15/02/2046 120,000 200,000

First State High Quality Bond Fund
Portfolio Changes (Unaudited) (continued)
72
Number of
shares purchased
Number of
shares sold
US Treasury Note 3% 15/11/2044 - 100,000
US Treasury Note 3% 15/05/2047 1,050,000 -
US Treasury Note 3.625% 15/02/2044 - 175,000
US Treasury Note 3.75% 15/11/2043 - 105,000
US Treasury Note 4.25% 15/05/2039 - 275,000
Vanke Real Estate Hong Kong 3.975% 09/11/2027 1,000,000 -
Verizon Communications 4.5% 10/08/2033 500,000 -
Visa 3.15% 14/12/2025 - 500,000
Wal-Mart Stores 5.625% 01/04/2040 - 250,000
Want Want China Finance 1.875% 14/05/2018 - 965,000
Wells Fargo 3.069% 24/01/2023 500,000 -
Westpac Banking Corporation 3.625% 28/02/2023 1,250,000 -
Wharf Finance 4.625% 08/02/2017 - 500,000
WI Treasury Securities 1.625% 31/07/2020 400,000 -
WI Treasury Securities 2% 31/07/2022 2,400,000 -
Woolworths 4% 22/09/2020 - 500,000
The Schedule of Portfolio Changes in Investments reflects the aggregate purchases of a security
exceeding one percent of the total value of purchases for the year and aggregate sales of a security
exceeding one percent of the total sales for the year.

First State Long Term Bond Fund
Investment Manager’s Report (Unaudited)
73
Performance
01/01/14 01/01/15 01/01/16 01/01/17
To To To To
31/12/14 31/12/15 31/12/16 31/12/17
First State Long Term Bond Fund “the Fund”
- Class III 10.66% -0.77% -1.39% 4.69%
Citigroup US TSY Bond Index Local – 5+ Year# 12.34% 0.72% 1.15% 4.60%
(Performance calculation is based on official dealing NAV per share)
#Benchmarks are being included for illustrative purposes and there is no guarantee that a fund will outperform a benchmark. Past performance is no indication of current or future performance and the performance data does not take account of
commissions and costs incurred in the issue and redemption of units.
The final quarter for 2017 was dominated by monetary policy changes, US regulatory changes specifically
the highly anticipated tax reforms, changes to the Trump administration, global political unrest and heightened
geopolitical conflict. A risk on market sentiment dominated for most of the period with some equity indices at all-
time highs and credit spreads testing their post Global Financial Crisis (GFC) lows. In contrast, government bond
yields remained range bound (at historically narrow levels) amidst continued central bank buying. This despite the
expected US Federal Reserve’s third rate hike this year pushing the federal funds rate to 1.25%-1.50%. The Federal
Reserve continues to provide clear guidance for monetary policy endeavouring to not surprise the market. Economic
growth globally remains on a positive path and labour markets continued to improve. Despite this an absence of
wage pressures and inflation continue to be barriers to higher yields.
Looking at monetary policy, other than the rate hike in the US there were no other major changes as central
banks continue to support the economy with asset purchases (albeit at a reduced pace). The key change from central
banks was the nomination as incoming Chairman of the US Federal Reserve (Fed) of Jerome Powell. It is widely
anticipated that Mr. Powell represents continuity at the Federal Reserve. However additional focus will be on the
new appointments to the Federal Reserve board and how that will impact voting on monetary policy going forward.
On the political front, in the US the Trump administration was thrown into heightened risks of
impeachment following the indictment of a number of associates related to the involvement with Russia during the
election campaign. In Japan, President Abe was re-elected in a landslide victory in the parliamentary elections. In
China, President Xi Jinping became the “chairman of everything” and broke precedent by not appointing an obvious
successor leading to speculation he may seek to remain in power longer than his current 5-year term.
Other newsworthy events included the rising oil price which broke over US$60 a barrel in December, the
highest level since June 2015. This was boosted by OPEC’s extension of production cuts. Also helping the rise was
the arrest of a number of ministers, royals and military officials as part of an anti-corruption campaign in Saudi
Arabia. Geopolitical risk was further increased when North Korea launched another missile after a notable hiatus
around the time of the Chinese Congress. Whilst the missile was significantly bigger than prior ones the market was
somewhat unresponsive to the event and again demonstrated a resilience to ongoing geopolitical risks, for now.
The net impact of events in the quarter saw 10-year government bond yields down everywhere but the US
where yields rose 7 bps and the 2/10s curve flattened by almost 70bp and is at levels not seen since pre-crisis. There
are many who predict an imminent bond bear market yet this must be considered in context. As at the end of 2017
long term yields have risen by approximately 25bps since the start of the rate hiking cycle in December 2015.
During this time the Federal Reserve has raised rates by 125bps. The last rate hiking cycle of 2004-2006 saw yields
largely range bound and it will be interesting later in 2018 (assuming rates continue to rise) whether this trend holds
true in this cycle.

First State Long Term Bond Fund
Investment Manager’s Report (Unaudited) (continued)
74
2018 will be dominated by bond markets, the US economy and the US dollar. Despite the tax reform
finally passing, political uncertainty remains around how much of President Trump’s pre-election promises can be
moved through Congress, along with the ongoing threat of impeachment. European event risk remains a lesser
potential risk to markets. Talks of normalisation are becoming more widespread with the US Federal Reserve
continuing on its gradual pace of higher interest rates, and with the timing of a gradual tapering of bond purchases
programs in both the US and Europe coming nearer. The risk of wage or inflation pressure emerging also represents
a risk to the outlook.
Global synchronised growth will be an ongoing theme in the year ahead. Whilst we expect volatility to
increase, they should remain contained given solid growth outlook and good corporate fundamentals (leverage
improving, earnings growth). Against this backdrop and in the current low inflation environment support for credit
markets should remain healthy. However the starting point for valuations in 2018 is lower (spreads) and higher
(equities) than in previous years. What this points to is lower expected returns in 2018 and the need to be defensive
minded in portfolios.
For treasuries the competing factors of Fed raising rates, expectations for government budgets that
ultimately end in further treasury issuance and fear of the end of quantitative easing will see some periods of
volatility during the year. However with global FX reserves increasing sharply over the last 20 years, these reserves
tend to be recycled into assets that are liquid such as US treasuries. This should for now put a cap on significantly
higher yields in 2018.
First State Investment (Hong Kong) Limited
February 2018

First State Long Term Bond Fund
Performance Table
as of 31 December 2017 (Unaudited)
75
Financial period Total net asset
value
Net asset
value per
share
Class III
Dec 2015 US$ 77,726,323 US$ 24.41
Dec 2016 US$ 66,982,947 US$ 24.07
Dec 2017 US$ 70,276,055 US$ 25.20
Financial period The highest issue
price
The lowest
redemption
price
Class III
Dec 2008 US$ 20.17 US$ 16.68
Dec 2009 US$ 19.88 US$ 17.84
Dec 2010 US$ 21.06 US$ 18.62
Dec 2011 US$ 23.08 US$ 19.55
Dec 2012 US$ 24.36 US$ 22.18
Dec 2013 US$ 24.22 US$ 21.93
Dec 2014 US$ 24.62 US$ 22.17
Dec 2015 US$ 25.65 US$ 23.79
Dec 2016 US$ 26.82 US$ 23.74
Dec 2017 US$ 25.71 US$ 23.88

First State Long Term Bond Fund
Schedule of Investments
as of 31 December 2017
76
The schedule that follows includes financial assets designated at fair value through profit or loss
Number of
shares
Fair value
US$
% of net
assets
United States Dollar (2016: 66,175,534, 98.79%) 69,368,729 98.71
Apple 2.4% 03/05/2023 700,000 692,048 0.98
China Development Bank 2.75% 16/11/2022 700,000 693,451 0.99
Export Import Bank of China 3.25% 28/11/2027 700,000 687,038 0.98
International Finance 2.125% 07/04/2026 900,000 872,021 1.24
JIC Zhixin 3.5% 24/11/2027 500,000 489,338 0.70
SingTel Group Treasury 2.375% 03/10/2026 500,000 472,940 0.67
Sinopec Group Overseas Development 2.5% 13/09/2022 700,000 682,104 0.97
Three Gorges Finance I 3.15% 02/06/2026 500,000 489,520 0.70
US Treasury 2% 15/02/2025 1,250,000 1,220,801 1.74
US Treasury 3% 15/05/2042 750,000 787,969 1.12
US Treasury 4.5% 15/02/2036 700,000 900,430 1.28
US Treasury 5.25% 15/02/2029 1,420,000 1,807,061 2.57
US Treasury Bill 2.25% 15/11/2027 1,350,000 1,328,563 1.89
US Treasury Bond 2.5% 15/02/2045 5,370,000 5,108,631 7.27
US Treasury Bond 2.5% 15/05/2046 1,400,000 1,328,306 1.89
US Treasury Bond 2.875% 15/11/2046 1,300,000 1,330,417 1.89
US Treasury Bond 3% 15/11/2045 1,200,000 1,257,376 1.79
US Treasury Bond 3.125% 15/08/2044 650,000 696,871 0.99
US Treasury Bond 3.375% 15/05/2044 920,000 1,029,861 1.47
US Treasury Bond 3.5% 15/02/2039 1,900,000 2,166,743 3.08
US Treasury Bond 3.875% 15/08/2040 500,000 601,562 0.86
US Treasury Note 1.625% 15/11/2022 1,000,000 973,906 1.39
US Treasury Note 1.625% 15/02/2026 2,000,000 1,886,406 2.68
US Treasury Note 1.625% 15/05/2026 2,200,000 2,070,407 2.95
US Treasury Note 1.75% 15/05/2023 2,000,000 1,950,000 2.77
US Treasury Note 1.875% 31/10/2022 1,000,000 985,156 1.40
US Treasury Note 2% 30/11/2022 2,000,000 1,981,406 2.82
US Treasury Note 2% 15/02/2023 2,000,000 1,978,594 2.81
US Treasury Note 2% 15/08/2025 2,300,000 2,239,715 3.19
US Treasury Note 2% 15/11/2026 4,600,000 4,447,984 6.33
US Treasury Note 2.25% 15/11/2024 2,550,000 2,534,759 3.61
US Treasury Note 2.375% 15/08/2024 2,460,000 2,466,054 3.51
US Treasury Note 2.375% 15/05/2027 2,600,000 2,588,321 3.68
US Treasury Note 2.5% 15/08/2023 2,000,000 2,026,250 2.88
US Treasury Note 2.5% 15/05/2024 1,750,000 1,768,116 2.52
US Treasury Note 2.75% 15/11/2023 1,500,000 1,539,961 2.19
US Treasury Note 2.75% 15/02/2024 1,000,000 1,025,547 1.46
US Treasury Note 2.75% 15/11/2042 250,000 251,055 0.36
US Treasury Note 2.875% 15/05/2043 500,000 513,144 0.73

First State Long Term Bond Fund
Schedule of Investments (continued)
as of 31 December 2017
77
Number of
shares
Fair value
US$
% of net
assets
United States Dollar (continued)
US Treasury Note 3% 15/05/2047 900,000 943,646 1.34
US Treasury Note 3.125% 15/02/2043 2,850,000 3,055,066 4.35
US Treasury Note 3.625% 15/02/2044 2,410,000 2,810,663 4.00
US Treasury Note 3.75% 15/08/2041 3,375,000 3,993,310 5.68
Wells Fargo 2.625% 22/07/2022 700,000 696,212 0.99
Total bonds* 69,368,729 98.71
Future Contracts (2016: 2,453, 0.00%) - -
Total financial assets designated at fair value through
profit or loss 69,368,729 98.71
Cash and other net assets 907,326 1.29
Total net assets attributable to redeemable participating
shareholders 70,276,055 100.00
Total cost of financial assets designated at fair value
through profit or loss (2016: 67,739,725) 68,975,867
Analysis of net investments
% of
total
assets
*Transferable securities admitted to an official stock
exchange listing or traded on a regulated market 69,368,729 98.59

First State Long Term Bond Fund
Portfolio Changes (Unaudited)
78
The schedule of portfolio changes is based on financial assets designated at fair value through
profit or loss
Number of
shares purchased
Number of
shares sold
Apple 2.4% 03/05/2023 700,000 -
China Development Bank 2.75% 16/11/2022 700,000 -
Export Import Bank of China 3.25% 28/11/2027 700,000 -
JIC Zhixin 3.5% 24/11/2027 500,000 -
National Australia Bank 1.25% 17/03/2017 - 800,000
Oracle 2.4% 15/09/2023 - 300,000
Rabobank Nederland 3.375% 19/01/2017 - 800,000
Ras Laffan 5.298% 30/09/2020 - 625,000
Sinopec Group Overseas Development 2.5% 13/09/2022 700,000 -
Three Gorges Finance I 3.15% 02/06/2026 - 800,000
US Treasury 1.75% 15/05/2022 - 1,000,000
US Treasury 4.5% 15/02/2036 100,000 -
US Treasury 5.25% 15/02/2029 320,000 380,000
US Treasury Bill 1.875% 31/01/2022 750,000 750,000
US Treasury Bill 2.25% 15/11/2027 1,350,000 -
US Treasury Bond 2.5% 15/05/2046 480,000 -
US Treasury Bond 2.875% 15/11/2046 700,000 -
US Treasury Note 0.625% 30/09/2017 3,700,000 3,700,000
US Treasury Note 1.625% 15/08/2022 - 1,000,000
US Treasury Note 1.625% 15/11/2022 100,000 100,000
US Treasury Note 1.75% 30/11/2021 250,000 500,000
US Treasury Note 1.75% 15/05/2023 - 350,000
US Treasury Note 1.875% 31/08/2022 - 3,000,000
US Treasury Note 2% 15/02/2022 - 500,000
US Treasury Note 2% 15/02/2023 - 250,000
US Treasury Note 2% 15/08/2025 950,000 -
US Treasury Note 2% 15/11/2026 2,530,000 -
US Treasury Note 2.125% 15/05/2025 - 800,000
US Treasury Note 2.375% 15/05/2027 2,600,000 -
US Treasury Note 2.5% 15/02/2046 30,000 150,000
US Treasury Note 2.75% 15/11/2023 - 250,000
US Treasury Note 3% 15/05/2047 900,000 -
Wells Fargo 2.625% 22/07/2022 700,000 -
WI Treasury Securities 1.875% 31/05/2022 - 1,500,000
The Schedule of Portfolio Changes in Investments reflects the aggregate purchases of a security
exceeding one percent of the total value of purchases for the year and aggregate sales of a security
exceeding one percent of the total sales for the year.

First State Greater China Growth Fund
Investment Manager’s Report (Unaudited)
79
Performance
01/01/14 01/01/15 01/01/16 01/01/17
To To To To
31/12/14 31/12/15 31/12/16 31/12/17
First State Greater China Growth Fund “the Fund”
- Class I 4.09% -3.24% 1.88% 49.88%
- Class I (Dist)^ 4.09% -3.23% 1.78% 49.89%
- Class IV 3.53% -3.66% 1.38% 49.10%
- Class III (Dist)^ 4.47% -2.80% 2.36% 50.58%
- Class III* 6.90% -2.71% 2.50% 50.56%
MSCI Golden Dragon (total return)# 8.03% -7.12% 5.75% 43.79%
MSCI Golden Dragon (total return)*# 11.96% -7.12% 5.75% 43.79%
(Performance calculation is based on official dealing NAV per share)
^ Dividend adjustment return
*Inception date -1 April 2014.
#Benchmarks are being included for illustrative purposes and there is no guarantee that a fund will outperform a benchmark.
Past performance is no indication of current or future performance and the performance data does not take account of
commissions and costs incurred in the issue and redemption of units.
The Greater China equity markets increased over the 12 months to 31 December 2017. The MSCI Golden
Dragon Index rose by 43.8% in US dollar terms over the period, with China gaining the most, up 54.3% over the
year. The MSCI Hong Kong increased by 36.2%, while Taiwan was up 28.5%.
On portfolio holdings, Tencent rose to record highs as the firm announced strong net profits growth driven
by a surge in mobile payments and cloud services, while Taiwan Semiconductor (TSMC) continued to benefit from
the ramp up in sales of the Apple iPhone. TSMC has maintained its leading competitive edge in technology and
precision manufacturing, with revenue growth expected to accelerate as its 7nm chips gain market share. AAC
Technologies, one of Apple’s main suppliers of acoustic components (speaker boxes, receivers) and haptics
(provides tactile feedback such as vibrations), also added to performance as it reported a jump in profits and strong
sales growth.
Detracting from performance, Ctrip.com declined on concerns around greater competition in the online
travel agency market. Li & Fung continued to face headwinds due to the ongoing tough retail environment. Its
traditional clients – US retailers such as Kohl’s and Macy’s – have closed thousands of stores, compressing Li &
Fung’s turnover as destocking takes place. China Oilfield Services (COSL) declined due to larger than expected
losses and declining rig utilisation. A generally weaker oil price contributed to reduced capex spending from
CNOOC, which added to COSL’s underperformance.
Significant purchases over the year included Midea Group, China’s largest home appliances company. A
strong emphasis on R&D, streamlined products and greater control over distributors has resulted in market share
gains for almost all of its products. We also initiated a position in China Resources Phoenix Health Care, a mixed
ownership venture between Phoenix Healthcare Group, the largest private hospital in China, and China Resources,
one of the largest state-owned conglomerates in China. At the hospital level, revenue per bed at Phoenix’s hospitals
are twice as high as at China Resources’ hospitals; we expect the profitability of China Resources’ hospitals to catch
up over time.
First State Greater China Growth Fund
Investment Manager’s Report (Unaudited) (continued)
80
We divested China Oilfield Services (COSL), as we believe the current rig cycle is unlikely to recover
anytime soon, and sold Yue Yuen Industrial Holdings on portfolio consolidation. We reassessed our position in Yue
Yuen and, in light of previous concerns (shoe manufacturing has scale but lacks pricing power), we thought there
were better opportunities elsewhere.
The 19th National Congress of the Communist Party took place in mid-October where, as expected, Xi
Jinping was strengthened as China’s leader and a number of the top leadership team were changed. We do not
expect major changes in policy, simply a continuation of reforms to reduce over-supply, rebalance the economy and
avoid a “hard landing”.
There have been positive signs that supply-side reforms are taking hold. In the past two years, capacity
closures in the coal and steel sectors have amounted to around 70-80% of the government’s target, providing a
catalyst for price increases and strong margin improvement for the remaining players. We expect further capacity
closures to carry forward in 2018, which we believe should eventually pass through to general price levels.
Contrary to investor expectations, the renminbi had appreciated by around 6% against the US dollar by the
end of 2017, reversing three years of depreciation. Despite the strength of China’s currency and its stable balance
of payments, we expect strict capital controls to remain in place in 2018. We expect the government to continue its
efforts to stem the outflow of capital from the mainland and encourage more investment domestically.
The China equity market has risen significantly over the past year and there are clear signs of market
exuberance. We believe investors are paying little attention to potential downside risks and as a result, valuations –
particularly for quality companies – are not cheap. As such, we maintain our cautious outlook and continue to look
for companies with a superior management team, a conservative balance sheet and good risk awareness.
First State Investment (Hong Kong) Limited
February 2018

First State Greater China Growth Fund
Performance Table
as of 31 December 2017 (Unaudited)
81
Financial period Total net asset
value
Net asset
value per
share
Class I
Dec 2015 US$ 552,625,194 US$ 71.18
Dec 2016 US$ 465,969,472 US$ 72.52
Dec 2017 US$ 610,202,130 US$ 108.69
Class I Distributing
Dec 2015 US$ 5,179,684 US$ 64.59
Dec 2016 US$1,643,409 US$ 65.74
Dec 2017 US$1,351,351 US$ 98.10
Class IV
Dec 2015 US$ 11,803,287 US$ 11.57
Dec 2016 US$ 11,551,928 US$ 11.73
Dec 2017 US$ 10,043,782 US$17.49
Class III Distributing
Dec 2015 US$ 6,406,162 US$ 10.77
Dec 2016 US$ 6,442,959 US$ 10.94
Dec 2017 US$ 9,705,590 US$ 16.29
Class III
Dec 2015 US$ 25,123,535 US$ 10.40
Dec 2016 US$ $3,912,340 US$ 10.66
Dec 2017 US$ 17,011,456 US$ 16.05
Financial period The highest issue
price
The lowest
redemption
price
Class I
Dec 2008 US$ 52.70 US$ 24.26
Dec 2009 US$ 49.35 US$ 26.77
Dec 2010 US$ 60.63 US$ 44.87
Dec 2011 US$ 60.63 US$ 44.87
Dec 2012 US$ 63.11 US$ 52.11

First State Greater China Growth Fund
Performance Table (continued)
as of 31 December 2017 (Unaudited)
82
Financial period The highest issue
price
The lowest
redemption
price
Class I (continued)
Dec 2013 US$ 71.18 US$ 59.38
Dec 2014 US$ 78.88 US$ 64.33
Dec 2015 US$ 85.99 US$ 63.54
Dec 2016 US$78.68 US$ 60.00
Dec 2017 US$ 111.13 US$ 72.83
Class I Distributing
Dec 2008 US$ 51.51 US$ 23.59
Dec 2009 US$ 46.91 US$ 25.61
Dec 2010 US$ 57.27 US$ 42.55
Dec 2011 US$ 58.10 US$ 43.93
Dec 2012 US$ 58.62 US$ 48.71
Dec 2013 US$ 65.60 US$ 55.00
Dec 2014 US$ 72.36 US$ 59.28
Dec 2015 US$ 78.59 US$ 57.65
Dec 2016 US$ 71.32 US$ 54.44
Dec 2017 US$ 100.30 US$ 66.02
Class IV
Dec 2011 US$ 10.26 US$ 7.78
Dec 2012 US$ 10.41 US$ 8.62
Dec 2013 US$ 11.69 US$ 9.77
Dec 2014 US$ 12.91 US$ 10.56
Dec 2015 US$ 14.02 US$ 10.34
Dec 2016 US$ 12.74 US$ 9.75
Dec 2017 US$ 17.90 US$ 11.78
Class III Distributing
Dec 2013 US$ 10.91 US$ 9.69
Dec 2014 US$ 12.01 US$ 9.87
Dec 2015 US$ 13.09 US$ 9.60
Dec 2016 US$ 11.85 US$ 9.08
Dec 2017 US$ 16.65 US$ 10.98

First State Greater China Growth Fund
Performance Table (continued)
as of 31 December 2017 (Unaudited)
83
Financial period The highest issue
price
The lowest
redemption
price
Class III
Dec 2014 US$ 11.45 US$ 9.80
Dec 2015 US$ 12.52 US$ 9.27
Dec 2016 US$ 11.55 US$ 8.77
Dec 2017 US$ 16.40 US$ 10.71

First State Greater China Growth Fund
Schedule of Investments
as of 31 December 2017
84
The schedule that follows includes financial assets designated at fair value through profit or loss
Number of
shares
Fair value
US$
% of net
assets
Bermuda (2016: 4,265,115, 0.87%) 5,675,691 0.88
Luye Pharma Group 7,189,500 5,675,691 0.88
China (2016: 207,278,923, 42.34%) 334,981,019 51.67
AAC Technologies Holdings 1,370,000 24,435,332 3.77
Baidu 42,697 10,022,694 1.55
China Blue Chemical 12,258,000 3,873,927 0.60
China Mengniu Dairy 5,047,000 15,013,819 2.32
China Merchants Bank 6,267,236 24,938,558 3.85
China Resources Phoenix Healthcare Holdings 6,488,500 8,185,706 1.26
China Resources Land 3,732,332 10,983,557 1.69
China Taiping Insurance Holdings 6,649,639 24,928,755 3.85
China Vanke 3,094,393 12,352,787 1.90
Ctrip Com International ADR 159,900 7,155,525 1.10
ENN Energy Holdings 2,888,000 20,600,462 3.18
Foshan Haitian Flavouring and Food 554,976 4,587,847 0.71
Fuyao Glass Industry 2,642,400 11,140,095 1.72
Gree Electric Appliances 3,102,065 20,829,785 3.21
Hangzhou Hikvision Digital Technology 1,572,445 9,423,072 1.45
Hangzhou Robam Appliances 852,567 6,301,241 0.97
Hongfa Technology 758,889 4,824,099 0.74
Jiangsu Hengrui Medicine 685,243 7,263,070 1.12
Midea Group 2,713,053 23,107,641 3.56
Qingdao Haier 2,327,979 6,739,263 1.04
Shanghai International Airport 1,460,483 10,100,851 1.56
Shenzhou International Group Holdings 1,897,000 18,058,229 2.79
Tencent Holdings 819,300 42,560,222 6.56
Yunnan Baiyao Group 483,000 7,554,482 1.17
Hong Kong (2016: 140,858,966, 28.77%)
170,723,001 26.33
AIA Group 3,024,600 25,793,068 3.98
ASM Pacific Technology 933,900 13,012,572 2.01
CK Hutchison Holdings 1,574,000 19,756,437 3.05
CSPC Pharmaceutical 11,916,000 24,058,713 3.71
Dairy Farm International Holdings 2,078,075 16,333,669 2.52
Jardine Matheson Holdings 255,352 15,512,634 2.39
Minth Group 3,668,000 22,128,192 3.41

First State Greater China Growth Fund
Schedule of Investments (continued)
as of 31 December 2017
85
Number of
shares
Fair value
US$
% of net
assets
Hong Kong (continued)
Sino Biopharmaceutical 6,422,000 11,388,550 1.75
Techtronic Industries 1,877,500 12,239,369 1.89
The Link Real Estate Investment Trust 1,132,681 10,499,797 1.62
Taiwan (2016: 123,139,147, 25.16%) 121,996,334 18.82
Advantech 2,561,420 18,186,013 2.81
Delta Electronics Industrial 2,947,949 14,268,439 2.20
E.Sun Financial Holdings 11,137,504 7,099,933 1.09
Giant Manufacturing 875,000 4,825,368 0.74
Nien Made Enterprise 904,000 9,696,168 1.50
President Chain Store 1,482,128 14,197,395 2.19
Taiwan Semiconductor Manufacturing 5,801,033 44,904,785 6.93
Uni-President Enterprises 3,961,257 8,818,233 1.36
Total equities* 633,376,045 97.70
Investment fund (2016: 10,315,430, 2.11%) 9,671,981 1.49
First State China A Shares† 423,281 9,671,981 1.49
Total financial assets designated at fair value through
profit or loss 643,048,026 99.19
Cash and other net assets 5,266,283 0.81
Total net assets attributable to redeemable participating
shareholders 648,314,309 100.00
Total cost of financial assets designated at fair value
through profit or loss (2016: 390,927,465) 347,314,800
Analysis of net investments
% of
total
assets
*Transferable securities admitted to an official stock
exchange listing or dealt in on regulated market 633,376,045 97.39
Investment fund 9,671,981 1.49
†Fund Investment. Investment is a related party entity. Please refer to Note 14.

First State Greater China Growth Fund
Portfolio Changes (Unaudited)
86
The schedule of portfolio changes is based on financial assets designated at fair value through
profit or loss
Number of
shares purchased
Number of
shares sold
AAC Technologies Holdings 101,000 251,000
Advantech 384,866 873,000
AIA Group - 175,000
ASM Pacific Technology - 162,100
Asustek Computer - 570,000
Baidu 2,688 33,290
China Blue Chemical - 9,394,000
China Literature 47,720 47,720
China Mengniu Dairy - 3,338,000
China Merchants Bank - 191,000
China Oilfield Services - 9,834,000
China Rescs Phoenix Healthcare Holdings 6,488,500 -
China Resources Land 1,476,000 -
China South Publishing & Media Group - 1,626,300
China Taiping Insurance Holdings - 865,800
China Vanke 1,575,700 215,700
CK Hutchison Holdings - 589,000
CSPC Pharmaceutical - 4,322,000
Ctrip Com International 159,900 -
Dairy Farm International Holdings 236,600 -
Delta Electronics Industrial - 1,507,000
E.Sun Financial Holdings 4,663,561 3,672,000
E.Sun Financial Holdings Rights 791,084 791,084
ENN Energy Holdings - 618,000
First State China A Shares † - 234,590
Foshan Haitian Flavouring and Food 554,976 -
Fuyao Glass Industry - 253,600
Giant Manufacturing - 464,000
Gree Electric Appliances - 272,700
Hangzhou Hikvision Digital Technology 886,915 226,700
Hangzhou Robam Appliances 382,346 -
Hongfa Technology 758,889 -
Jardine Matheson Holdings 4,332 -
Jiangsu Hengrui Medicine 147,990 269,300
Li & Fung - 11,424,040
MediaTek - 697,000
†Fund Investment. Investment is a related party entity. Please refer to Note 14.

First State Greater China Growth Fund
Portfolio Changes (Unaudited) (continued)
87
Number of
shares purchased
Number of
shares sold
Midea Group 1,531,403 -
Minth Group - 544,000
Nien Made Enterprise 904,000 -
President Chain Store - 529,000
Qingdao Haier 2,327,979 -
Shanghai International Airport 243,997 -
Shenzhou International Group Holdings - 774,000
Sino Biopharmaceutical - 2,316,000
Sun Art Retail Group - 5,698,500
Taiwan Semiconductor Manufacturing 259,000 448,000
Techtronic Industries 1,052,500 -
Tencent Holdings - 133,600
Tencent Holdings Rights 704 704
The Link Real Estate Investment Trust - 370,500
Uni-President Enterprises 1,692,000 1,656,000
Yue Yuen Industrial Holdings - 1,433,000
Yunnan Baiyao Group 91,900 107,400
The Schedule of Portfolio Changes in Investments reflects the aggregate purchases of a security
exceeding one percent of the total value of purchases for the year and aggregate sales of a security
exceeding one percent of the total sales for the year.

First State Singapore and Malaysia Growth Fund
Investment Manager’s Report (Unaudited)
88
Performance
01/01/14 01/01/15 01/01/16 01/01/17
To To To To
31/12/14 31/12/15 31/12/16 31/12/17
First State Singapore and Malaysia Growth Fund “the
Fund”
- Class I 3.17% -17.21% 2.58% 20.87%
Cap-weighted MSCI Malaysia & MSCI Singapore
Free (USD)# -3.10% -18.69% -7.70% 31.50%
(Performance calculation is based on official dealing NAV per share)
#Benchmarks are being included for illustrative purposes and there is no guarantee that a fund will outperform a benchmark.
Past performance is no indication of current or future performance and the performance data does not take account of
commissions and costs incurred in the issue and redemption of units.
The MSCI Singapore and Malaysia Index rose by 31.5% in 2017. Real Estate and Financials were the best
performing sectors, while Energy and Consumer Staples lagged.
On portfolio holdings, Oversea-Chinese Banking Corp (OCBC) increased on the back of improved
profitability metrics and higher loan growth. Asset quality seems to have stabilised, although oil and gas – which
makes up around half of OCBC’s total non-performing loans – has yet to stage a recovery. OCBC subsidiary Great
Eastern Holdings was driven higher by strong bancassurance and agency sales, while Haw Par Corp rallied on the
back of better than expected results due to higher sales in its healthcare segment.
On the negative side, Delfi Ltd weakened on declining sales growth in Indonesia. After reporting losses in
FY2015 – the first time in its 50-year history – the company began its product rationalisation process to focus on
core brands and improve margins. While this could continue to impact near-term earnings, we believe that it should
better position the business in the long run. ComfortDelgro faced competitive headwinds from UBER, GRAB and
other car-sharing apps; however, we believe its high free cash flow yield and rising dividend makes it reasonably
defensive. Acset Indonusa declined on concerns around rising debt levels combined with lower revenues. Although
recent new infrastructure business wins were significant, their construction and foundation businesses had declined
on the back of an industry slowdown.
Significant purchases over the period included APM Automotive, an auto component manufacturer in
Malaysia. The company had endured a difficult few years mainly due to a soft domestic economy and currency
weakness; however, a recovery appeared to be underway, with rising domestic orders, a stable ringgit and rapid
growth overseas. We also bought Keppel Corp, a diversified conglomerate with businesses in property, investments,
infrastructure, and offshore and marine. We believed the company was attractively valued and the management had
executed well through a tough period.
We divested Tenaga Nasional on concerns around weak domestic electricity demand in Malaysia and the
resulting push into overseas projects. Our fears that the government would delay the implementation of fuel cost
past-through measures were later realised. Meanwhile, we took advantage of a takeover offer to divest Trinity at a
price materially above recent price levels, particularly as we still had concerns around the challenging environment
for luxury brands and retailers.

First State Singapore and Malaysia Growth Fund
Investment Manager’s Report (Unaudited) (continued)
89
We maintain our cautious approach due to structural weakness and inflationary pressures. On the whole,
we remain focused on finding high-quality management teams and businesses that have, over time, delivered
predictable and sustainable returns comfortably in excess of the cost of capital, despite the prevailing headwinds.
First State Investment (Hong Kong) Limited
February 2018

First State Singapore and Malaysia Growth Fund
Performance Table
as of 31 December 2017 (Unaudited)
90
Financial period Total net asset
value
Net asset
value per
share
Class I
Dec 2015 US$ 52,583,727 US$ 46.84
Dec 2016 US$ 50,409,957 US$ 48.05
Dec 2017 US$ 52,047,415 US$ 58.08
Financial period The highest issue
price
The lowest
redemption
price
Class I
Dec 2008 US$ 32.80 US$ 15.17
Dec 2009 US$ 28.51 US$ 14.53
Dec 2010 US$ 38.21 US$ 27.18
Dec 2011 US$ 43.26 US$ 33.96
Dec 2012 US$ 51.91 US$ 37.60
Dec 2013 US$ 59.02 US$ 51.57
Dec 2014 US$ 61.34 US$ 51.75
Dec 2015 US$ 58.98 US$ 45.62
Dec 2016 US$ 53.10 US$ 43.39
Dec 2017 US$ 58.15 US$ 47.95

First State Singapore and Malaysia Growth Fund
Schedule of Investments
as of 31 December 2017
91
The schedule that follows includes financial assets designated at fair value through profit or loss
Number of
shares
Fair value
US$
% of net
assets
Hong Kong (2016: 6,270,916, 12.44%) 6,439,227 12.37
Dairy Farm International Holdings 297,000 2,334,420 4.49
Hong Kong Aircraft Engineering 78,400 502,059 0.96
Jardine Matheson Holdings 34,055 2,068,841 3.97
Tan Chong International 4,683,000 1,533,907 2.95
Indonesia (2016: 478,495, 0.95%) 475,047 0.91
Acset Indonusa 2,620,000 475,047 0.91
Japan (2016: 901,964, 1.79%) 592,402 1.14
Coca-Cola West Japan 16,200 592,402 1.14
Malaysia (2016: 9,955,542, 19.75%) 11,505,165 22.11
APM Automotive Holdings 633,800 562,229 1.08
Batu Kawan 260,400 1,261,142 2.42
Carlsberg Brewery Malaysia 299,200 1,131,149 2.17
CIMB Group Holdings 350,673 566,692 1.09
Heineken Malaysia 239,200 1,117,094 2.14
IJM 761,600 573,976 1.10
IJM Plantations 704,800 477,181 0.92
Kuala Lumpur Kepong 174,400 1,077,341 2.07
LPI Capital 70,400 315,904 0.61
Nestle Malaysia 82,600 2,106,331 4.05
Public Bank 135,530 695,901 1.34
Top Glove 257,300 507,988 0.98
United Plantations 160,300 1,112,237 2.14
Singapore (2016: 27,209,558, 53.97%) 27,728,961 53.28
Capitaland 190,200 502,625 0.97
City Developments 167,800 1,568,964 3.01
ComfortDelGro 1,177,600 1,745,507 3.35
DBS Group Holdings 76,675 1,426,391 2.74
Great Eastern Holdings 161,000 3,334,983 6.41
Haw Par 398,000 3,381,719 6.50
Hong Leong Finance 272,400 556,709 1.07
Jardine Cycle & Carriage 57,700 1,756,744 3.37
Keppel Corporation 95,100 523,271 1.00

First State Singapore and Malaysia Growth Fund
Schedule of Investments (continued)
as of 31 December 2017
92
Number of
shares
Fair value
US$
% of net
assets
Singapore (continued)
Delfi 1,012,200 1,076,002 2.07
M1 523,000 696,916 1.34
Oversea Chinese Banking 361,900 3,356,746 6.45
SATS 229,600 893,786 1.72
Sembcorp Industries 242,200 549,383 1.05
Sheng Siong Group 786,100 544,350 1.05
Singapore Airlines 68,100 543,964 1.05
Singapore Telecommunications 936,400 2,502,581 4.81
United Overseas Bank 139,808 2,768,320 5.32
Thailand (2016: 3,013,280, 5.98%) 2,859,970 5.49
Delta Electronics 582,400 1,309,015 2.51
Glow Energy 622,100 1,550,955 2.98
Total equities* 49,600,772 95.30
Investment fund (2016: 603,705, 1.20%) 992,270 1.91
Capita Commercial Trust 686,774 992,270 1.91
Total financial assets designated at fair value through
profit or loss 50,593,042 97.21
Cash and other net assets 1,454,373 2.79
Total net assets attributable to redeemable participating
shareholders 52,047,415 100.00
Total cost of financial assets designated at fair value
through profit or loss (2016: 45,250,935) 38,186,967
Analysis of net investments
% of total
assets
*Transferable securities admitted to an official stock exchange
listing or traded on a regulated market 49,600,772 94.90
Investment fund 992,270 1.90

First State Singapore and Malaysia Growth Fund
Portfolio Changes (Unaudited)
93
The schedule of portfolio changes is based on financial assets designated at fair value through
profit or loss
Number of
shares purchased
Number of
shares sold
Acset Indonusa 1,505,700 1,171,700
Aeon - 793,700
APM Automotive Holdings 633,800 -
Bukit Sembawang Estates - 185,000
Capita Commercial Trust 97,774 -
Capitaland 190,200 -
Capitaland Commercial Trust Rights 97,774 97,774
CIMB Group Holdings - 614,000
City Developments 63,000 -
Coca-Cola Central Japan - 40,900
Coca-Cola West Japan 30,675 14,475
ComfortDelGro 361,500 -
DBS Group Holdings 1,112 -
Fraser & Neave Holdings - 46,400
Glow Energy - 142,200
Haw Par - 24,100
Heineken Malaysia 95,800 -
Hong Kong Aircraft Engineering 40,000 -
Hong Leong Finance - 161,600
iFast Corporation - 839,700
Jardine Matheson Holdings 787 -
Keppel Corporation 95,100 -
Kuala Lumpur Kepong 60,300 -
Nestle Malaysia 27,100 -
SATS 35,800 -
Sembcorp Industries - 677,600
Sheng Siong Group - 3,597,600
Singapore Airlines - 45,700
Singapore Telecommunications - 226,600
Tenaga Nasional - 319,850
Trinity - 8,472,000
United Overseas Bank 2,817 19,900
Yeo Hiap Seng - 295,000
The Schedule of Portfolio Changes in Investments reflects the aggregate purchases of a security
exceeding one percent of the total value of purchases for the year and aggregate sales of a security
exceeding one percent of the total sales for the year.

First State Asia Opportunities Fund
Investment Manager’s Report (Unaudited)
94
Performance
01/01/14 01/01/15 01/01/16 01/01/17
To To To To
31/12/14 31/12/15 31/12/16 31/12/17
First State Asia Opportunities Fund “the Fund”
- Class I 14.72% -2.38% 1.14% 23.72% - Class III* n/a n/a n/a n/a - Class VI (EUR)** n/a n/a n/a n/a
MSCI A/C Asia Ex Japan Free Index (total return)# 5.10% -8.90% 5.76% 41.72%
(Performance calculation is based on official dealing Net asset value (NAV) per share)
*Inception date – 24 April 2017
**Inception date – 15 June 2017 and closing date – 22 November 2017
#Benchmarks are being included for illustrative purposes and there is no guarantee that a fund will outperform a benchmark..
Past performance is no indication of current or future performance and the performance data does not take account of
commissions and costs incurred in the issue and redemption of units.
The MSCI AC Asia ex Japan index increased by 41.7% in US dollar terms in the 12 months to the end of
December 2017. China and South Korea outperformed, while Pakistan and Indonesia lagged. On a sector level,
Information Technology and Real Estate gained the most, while Utilities and Telecom Services were the weakest.
On portfolio holdings, Taiwan Semiconductor (TSMC) continued to benefit from the ramp up in sales of
the Apple iPhone. TSMC has maintained its leading competitive edge in technology and precision manufacturing,
with revenue growth expected to accelerate as its 7nm chips gain market share. Haw Par Corp continued to rally on
the back of better than expected results due to higher sales in its healthcare segment. CSL Limited strengthened
over the year, as global demand for plasma-related products continued to exceed supply, leading to profit upgrades
for the group. Meanwhile, its Seqirus acquisition is expected to achieve profitability in FY18, which should add
significantly to the bottom line.
Detracting from performance, Global Brands Group struggled to meet earnings expectations amid the
ongoing disruption in the US retail sector. Retail bankruptcies led to the loss of several brand licences which
impacted the group’s revenue. Dr Reddy’s Laboratories underperformed, as a series of inspections from the US
Food and Drug Administration (FDA) led to concerns around quality control issues, while delays to a number of its
product launches caused lacklustre sales growth and compressed margins. Lupin continued to face challenges in the
US generics market as the rate of price erosion has been exacerbated by consolidation in the distributor space.
Significant purchases over the year included Midea Group, China’s largest home appliances company. A
strong emphasis on R&D, streamlined products and greater control over distributors has resulted in market share
gains for almost all of its products. We also subscribed to the HDFC Standard Life Insurance initial public offering,
as we believe there is significant opportunity for insurance to take off in India – current penetration of insurance
protection is extremely low at just 2.7% of the population.
We sold Infosys Technologies on concerns around the political in-fighting between the founders and the
management which eventually led to the resignation of the CEO Vishal Sikka and divested Dr Reddy’s Laboratories
after the company reported weak earnings due to regulatory challenges and price erosion in the US market.

First State Asia Opportunities Fund
Investment Manager’s Report (Unaudited) (continued)
95
Our generally cautious stance, as well as overall portfolio positioning has not changed very much
in the last 12 months. Stock markets in Asia and globally have shot through previous highs, as investors remain
sanguine on the prospect of the global economic recovery continuing into 2018. Weak inflationary pressures have
called into question the need for tightening measures, which has added to the market’s bullish sentiment. However,
history and our experience suggest that such benign conditions do not endure; although we do not know what the
catalyst will be or when it will appear, we are mindful of a potential reversal in fortunes and – at current heady
valuations – the growing risks to capital preservation. On the other hand, our longer-term time horizon means that
we are able to look past the short-term noise. While there is plenty to worry about on a macro level, there are still
plenty of opportunities for the bottom-up investor. We have added to quality companies in our portfolio and continue
to prefer exporters and US dollar earners as being amongst Asia’s more competitive companies.
First State Investment (Hong Kong) Limited
February 2018

First State Asia Opportunities Fund
Performance Table
as of 31 December 2017 (Unaudited)
96
Financial period Total net asset
value
Net asset
value per
share
Class I
Dec 2015 US$ 33,899,851 US$ 36.98
Dec 2016 US$ 34,591,096 US$ 37.40
Dec 2017 US$ 40,459,177 US$ 46.27
Class III
Dec 2017 US$ 1,317,205 US$ 11.11
Financial period The highest issue
price
The lowest
redemption
price
Class I
Dec 2008 US$ 26.82 US$ 11.45
Dec 2009 US$ 23.79 US$ 11.98
Dec 2010 US$ 28.65 US$ 21.24
Dec 2011 US$ 31.38 US$ 24.52
Dec 2012 US$ 32.00 US$ 26.55
Dec 2013 US$ 33.31 US$ 29.29
Dec 2014 US$ 38.82 US$ 30.68
Dec 2015 US$ 42.10 US$ 34.29
Dec 2016 US$ 40.56 US$ 33.31
Dec 2017 US$ 46.32 US$ 37.47
Class III
Dec 2017 US$ 11.12 US$ 9.89
Class VI (EUR)
Dec 2017 EUR 10.43 EUR 9.41

First State Asia Opportunities Fund
Schedule of Investments
as of 31 December 2017
97
The schedule that follows includes financial assets designated at fair value through profit or loss
Number of
shares
Fair value
US$
% of net
assets
Australia (2016: 2,709,113, 7.83%) 3,785,423 9.06
CSL 11,586 1,279,805 3.06
Newcrest Mining 103,657 1,849,193 4.43
Ramsay Health Care 11,975 656,425 1.57
Bermuda (2016: 1,156,565, 3.34%) 529,242 1.27
Global Brands Group Holding 6,463,081 529,242 1.27
China (2016: 835,501, 2.42%) 2,577,241 6.17
Greatview Aseptic Packaging 678,000 494,470 1.19
Midea Group 146,297 1,246,042 2.98
Sun Art Retail Group 791,717 836,729 2.00
Hong Kong (2016: 7,626,952, 22.05%) 7,460,572 17.86
CK Hutchison Holdings 94,448 1,185,487 2.84
Dairy Farm International Holdings 173,800 1,366,068 3.27
Hong Kong & China Gas 436,116 854,861 2.05
Hong Kong Aircraft Engineering 58,400 373,983 0.90
Jardine Matheson Holdings 18,151 1,102,673 2.64
Swire Pacific "A" 39,000 361,026 0.86
Swire Pacific "B" 237,500 369,515 0.88
Towngas China 1,784,966 1,434,249 3.43
VTech Holdings 31,500 412,710 0.99
India (2016: 7,188,292, 20.78%) 8,358,419 20.01
HDFC Bank 37,745 1,107,262 2.65
HDFC Standard Life Insurance 172,450 1,042,900 2.50
Housing Development Finance 31,810 852,420 2.04
Idea Cellular 560,228 949,256 2.27
Kotak Mahindra Bank 34,977 553,582 1.33
Lupin 39,609 549,261 1.31
Mahindra Forgings 112,328 454,310 1.09
Tata Consultancy Services 40,461 1,712,322 4.10
Tech Mahindra 143,991 1,137,106 2.72

First State Asia Opportunities Fund
Schedule of Investments (continued)
as of 31 December 2017
98
Number of
shares
Fair value
US$
% of net
assets
Indonesia (2016: 534,657, 1.55%) 1,404,660 3.36
Bank Central Asia 266,800 430,656 1.03
Hero Supermarket 7,110,400 484,770 1.16
Indocement Tunggal Prakarsa 302,400 489,234 1.17
Philippines (2016: 356,747, 1.03%) 979,488 2.34
Cemex Holdings 5,687,100 556,943 1.33
Integrated Micro Electronics 1,118,800 422,545 1.01
Singapore (2016: 4,058,799, 11.73%) 4,286,896 10.26
ComfortDelGro 523,600 776,110 1.86
Great Eastern Holdings 33,000 683,568 1.63
Haw Par 208,500 1,771,579 4.24
Jardine Cycle & Carriage 21,400 651,548 1.56
Singapore Telecommunications 151,200 404,091 0.97
South Korea (2016: 2,374,093, 6.86%) 2,616,942 6.26
Amore Pacific Group 3,054 403,896 0.96
Hanon Systems 35,484 462,625 1.11
Hanssem 2,764 466,651 1.12
LG Chemical 1,211 460,025 1.10
LG Household & Health Care 364 405,943 0.97
Naver 512 417,802 1.00
Sri Lanka (2016: 181,735, 0.53%) 809,789 1.94
Hatton National Bank 251,900 408,753 0.98
John Keells Holdings 414,404 401,036 0.96
Taiwan (2016: 5,442,123, 15.73%) 6,394,245 15.31
Asustek Computer 46,000 433,655 1.04
Giant Manufacturing 62,000 341,912 0.82
MediaTek 122,000 1,209,795 2.90
President Chain Store 79,576 762,263 1.82
Sinbon Electronics 151,000 439,534 1.05
Taiwan Semiconductor Manufacturing 262,125 2,029,064 4.86
Uni-President Enterprises 529,182 1,178,022 2.82

First State Asia Opportunities Fund
Schedule of Investments (continued)
as of 31 December 2017
99
Number of
shares
Fair value
US$
% of net
assets
Thailand (2016: 938,830, 2.71%) 1,494,113 3.58
Delta Electronics 332,600 747,559 1.79
Kasikorn Bank 101,800 746,554 1.79
Vietnam (2016: 178,833, 0.52%) 413,812 0.99
FPT Corporation 106,432 267,615 0.64
Refrigeration Electrical Engineering 80,000 146,197 0.35
Total financial assets designated at fair value through profit
or loss* 41,110,842 98.41
Cash and other net assets 665,540 1.59
Total net assets attributable to redeemable participating
shareholders 41,776,382 100.00
Total cost of financial assets designated at fair value
through profit or loss (2016: 33,537,043) 33,492,827
Analysis of net investments
% of
total
assets
*Transferable securities admitted to an official stock
exchange listing or traded on a regulated market 41,110,842 98.21

First State Asia Opportunities Fund
Portfolio Changes (Unaudited)
100
The schedule of portfolio changes is based on financial assets designated at fair value through
profit or loss
Number of
shares purchased
Number of
shares sold
Amore Pacific Group 2,407 2,854
Amore Pacific Group Preference - 3,720
Asustek Computer - 11,000
Avenue Supermarts 1,040 1,040
Bank Central Asia 266,800 -
Brambles 296 19,061
Cathay Pacific Airways - 176,000
Cemex Holdings Philippines 5,687,100 -
Chroma - 75,000
CK Hutchison Holdings 40,000 128,000
ComfortDelGro 523,600 -
CSL - 1,452
Dairy Farm International Holdings 14,900 -
Dr Reddys Laboratories - 26,252
FPT 13,882 -
Giant Manufacturing 9,000 -
Global Brands Group Holding 758,000 -
Glow Energy - 82,200
Greatview Aseptic Packaging 678,000 -
Hanon Systems 39,527 4,043
Hanssem 2,764 -
Hatton National Bank 251,900 -
Haw Par - 55,800
HDFC Standard Life Insurance 172,450 -
Hemas Holdings - 277,470
Hero Supermarket 1,393,600 -
Hong Kong & China Gas 70,010 334,000
Hong Kong Aircraft Engineering 34,800 -
Housing Development Finance 31,810 -
Idea Cellular 152,084 218,671
Indocement Tunggal Prakarsa 302,400 -
Infosys Technologies - 89,960
Integrated Micro Electronics - 1,792,500
Jardine Matheson Holdings 6,514 -
Jardine Strategic 60 12,070
John Keells Holdings 414,404 -
Kasikorn Bank 101,800 -
LG - 9,202

First State Asia Opportunities Fund
Portfolio Changes (Unaudited) (continued)
101
Number of
shares purchased
Number of
shares sold
LG Chemical - 1,233
LG Household & Health Care - 556
Li & Fung - 2,260,000
Lupin 6,442 -
Mahindra Forgings 112,328 -
Marico - 44,789
MediaTek - 16,000
Midea Group 146,297 -
Naver 248 -
Newcrest Mining 20,445 25,713
Ramsay Health Care 11,975 -
Refrigeration Electrical Engineering 80,000 -
Sinbon Electronics 151,000 -
Singapore Telecommunications - 370,900
Sun Art Retail Group - 161,000
Swire Pacific “A” 39,000 -
Swire Pacific “B” 237,500 -
Taiwan Semiconductor Manufacturing - 92,000
Tata Consultancy Services 12,399 9,848
Tech Mahindra 44,155 -
Towngas China 1,128,295 -
Trinity - 5,118,000
Uni-President Enterprises - 88,000
The Schedule of Portfolio Changes in Investments reflects the aggregate purchases of a security
exceeding one percent of the total value of purchases for the year and aggregate sales of a security
exceeding one percent of the total sales for the year.

First State Asian Equity Plus Fund
Investment Manager’s Report (Unaudited)
102
Performance
01/01/14 01/01/15 01/01/16 01/01/17
To To To To
31/12/14 31/12/15 31/12/16 31/12/17
First State Asian Equity Plus Fund “the Fund”
- Class I (Dist)^ 13.72% -2.78% 2.00% 36.82%
- Class I 13.74% -2.76% 1.97% 36.85%
- Class I (GBP)*** n/a -1.30% n/a n/a
- Class III (Dist)^ 14.20% -2.27% 2.49% 37.61%
- Class III (GBP Dist)*^ 13.46% 2.71% 23.39% 25.36%
- Class III** 0.50% -1.89% 1.62% 37.43%
MSCI AC Asia Pacific ex Japan Free (total return)# 3.08% -9.12% 7.06% 36.99%
MSCI AC Asia Pacific ex Japan Free (GBP)*# 4.96% -3.85% 27.70% 25.14%
MSCI AC Asia Pacific ex Japan Free (total return)**# -2.53% -9.12% 7.06% 36.99% MSCI AC Asia Pacific ex Japan Free (total return)***# n/a -7.34% n/a n/a
(Performance calculation is based on official dealing NAV per share)
^ Dividend adjustment return
#Benchmarks are being included for illustrative purposes and there is no guarantee that a fund will outperform a benchmark.
*Inception date – 5 June 2014
**Inception date – 30 October 2014
***Inception date – 22 June 2015 and closing date – 13 May 2016
Past performance is no indication of current or future performance and the performance data does not take account of
commissions and costs incurred in the issue and redemption of units.
The MSCI AC Asia Pacific ex Japan index increased by 37% in US dollar terms in 2017. China and South
Korea outperformed, while Pakistan and New Zealand lagged. On a sector level, Information Technology and
Consumer Discretionary gained the most, while Utilities and Telecom Services were the weakest.
On portfolio holdings, Taiwan Semiconductor (TSMC) continued to benefit from the ramp up in sales of
the Apple iPhone. TSMC has maintained its leading competitive edge in technology and precision manufacturing,
with revenue growth expected to accelerate as its 7nm chips gain market share. HDFC Bank strengthened on the
back of increased net profits, driven by strong asset growth and higher net interest income despite the temporary
disruption from demonetisation and public sector banks’ recapitalisation. CSL Limited strengthened over the year,
as global demand for plasma-related products continued to exceed supply, leading to profit upgrades for the group.
Meanwhile, its Seqirus acquisition is expected to achieve profitability in FY18, which should add significantly to
the bottom line.
Detracting from performance, Brambles has been weak since its profit downgrade at the beginning of the
year. The new CEO and CFO are determined to make changes but have guided for lower returns, growth and capex.
While we do not believe its business model is broken, the lack of free cash flow generation and earnings growth
has been worrying. Dr Reddy’s Laboratories underperformed, as a series of inspections from the US Food and Drug
Administration (FDA) led to concerns around quality control issues, while delays to a number of its product
launches caused lacklustre sales growth and compressed margins. Lupin continued to face challenges in the US
generics market as the rate of price erosion has been exacerbated by consolidation in the distributor space.

First State Asian Equity Plus Fund
Investment Manager’s Report (Unaudited) (continued)
103
Significant purchases over the year included Midea Group, China’s largest home appliances company. A
strong emphasis on R&D, streamlined products and greater control over distributors has resulted in market share
gains for almost all of its products. We also bought Bank Central Asia (BCA), a high quality Indonesian bank that
was trading on reasonable valuations. Given its strong deposit and retail franchise, we believe BCA should benefit
greatly as banking penetration in Indonesia – which is still extremely low – starts to increase.
We sold Infosys Technologies on concerns around the political in-fighting between the founders and
management which eventually led to the resignation of the CEO Vishal Sikka, and divested Dr Reddy’s Laboratories
after the company reported weak earnings due to regulatory challenges and price erosion in the US market.
Our generally cautious stance, as well as overall portfolio positioning has not changed very much in the
last 12 months. Stock markets in Asia and globally have shot through previous highs, as investors remain sanguine
on the prospect of the global economic recovery continuing into 2018. Weak inflationary pressures have called into
question the need for tightening measures, which has added to the market’s bullish sentiment. However, history and
our experience suggest that such benign conditions do not endure; although we do not know what the catalyst will
be or when it will appear, we are mindful of a potential reversal in fortunes and – at current heady valuations – the
growing risks to capital preservation. On the other hand, our longer-term time horizon means that we are able to
look past the short-term noise. While there is plenty to worry about on a macro level, there are still plenty of
opportunities for the bottom-up investor. We have added to quality companies in our portfolio and continue to prefer
exporters and US dollar earners as being amongst Asia’s more competitive companies.
First State Investment (Hong Kong) Limited
February 2018

First State Asian Equity Plus Fund
Performance Table
as of 31 December 2017 (Unaudited)
104
Financial period Total net asset value Net asset value per
share
Class I Distributing
Dec 2015 US$ 2,405,176,189 US$ 39.55
Dec 2016 US$ 2,189,791,068 US$ 39.51
Dec 2017 US$ 2,666,302,690 US$ 52.96
Class I
Dec 2015 US$ 309,149,148 US$ 52.80
Dec 2016 US$ 287,243,881 US$ 53.84
Dec 2017 US$ 346,976,663 US$ 73.68
Class I GBP
Dec 2015 £ 24,685 £ 9.87
Class III Distributing
Dec 2015 US$ 49,199,388 US$ 11.54
Dec 2016 US$ 68,578,011 US$ 11.61
Dec 2017 US$ 181,484,613 US$ 15.65
Class III GBP Distributing
Dec 2015 £ 7,820,429 £ 11.38
Dec 2016 £ 6,746,407 £ 13.76
Dec 2017 £ 5,919,033 £ 16.90
Class III
Dec 2015 US$ 219,993 US$ 9.86
Dec 2016 US$ 8,654,484 US$ 10.02
Dec 2017 US$ 97,338,537 US$ 13.77
Financial period The highest issue
price
The lowest
redemption price
Class I Distributing
Dec 2008 US$ 32.06 US$ 16.39
Dec 2009 US$ 29.21 US$ 16.63
Dec 2010 US$ 34.81 US$ 26.23
Dec 2011 US$ 36.15 US$ 28.19
Dec 2012 US$ 36.70 US$ 30.05

First State Asian Equity Plus Fund
Performance Table (continued)
as of 31 December 2017 (Unaudited)
105
Financial period The highest issue
price
The lowest
redemption price
Class I Distributing
(continued)
Dec 2013 US$ 39.30 US$ 33.98
Dec 2014 US$ 43.41 US$ 34.86
Dec 2015 US$ 45.77 US$ 36.92
Dec 2016 US$ 43.09 US$ 35.02
Dec 2017 US$ 52.96 US$ 39.41
Class I
Dec 2008 US$ 34.54 US$ 17.98
Dec 2009 US$ 33.54 US$ 18.87
Dec 2010
US$ 41.01
US$ 30.54
Dec 2011 US$ 43.22 US$ 34.15
Dec 2012 US$ 45.84 US$ 37.01
Dec 2013 US$ 49.66 US$ 42.94
Dec 2014 US$ 56.76 US$ 44.60
Dec 2015 US$ 60.42 US$ 49.29
Dec 2016 US$ 58.73 US$ 46.75
Dec 2017 US$ 73.68 US$ 53.72
Class I GBP
Dec 2015 £ 100.00 £ 8.69
Dec 2016 £ 10.56 £ 9.06
Class III Distributing
Dec 2014 US$ 12.57 US$ 9.92
Dec 2015 US$ 13.31 US$ 10.75
Dec 2016 US$ 12.65 US$ 10.22
Dec 2017 US$ 15.65 US$ 11.59
Class III GBP Distributing
Dec 2014 £ 11.47 £ 9.81
Dec 2015 £ 13.33 £ 10.01
Dec 2016 £ 14.82 £ 10.46
Dec 2017 £ 17.09 £ 13.76

First State Asian Equity Plus Fund
Performance Table (continued)
as of 31 December 2017 (Unaudited)
106
Financial period The highest issue
price
The lowest
redemption price
Class III
Dec 2014 US$ 10.27 US$ 9.65
Dec 2015 US$ 11.20 US$ 9.16
Dec 2016 US$ 10.92 US$ 8.72
Dec 2017 US$ 13.77 US$ 10.00

First State Asian Equity Plus Fund
Schedule of Investments
as of 31 December 2017
107
The schedule that follows includes financial assets designated at fair value through profit or loss
Number of
shares
Fair value
US$
% of net
assets
Australia (2016: 204,914,147, 8.00%) 200,495,982 6.07
Brambles 3,718,362 29,271,780 0.89
CSL 1,035,578 114,391,295 3.46
Ramsay Health Care 1,036,788 56,832,907 1.72
China (2016: 203,143,495, 7.93%) 485,381,399 14.71
AAC Technologies Holdings 2,903,500 51,786,851 1.57
Baidu 91,698 21,525,188 0.65
China Mengniu Dairy 18,028,000 53,629,704 1.63
China Resources Land 9,338,999 27,482,932 0.83
Ctrip Com International ADR 648,200 29,006,950 0.88
ENN Energy Holdings 8,696,000 62,029,646 1.88
Fuyao Glass Industry 8,478,896 35,746,179 1.08
Gree Electric Appliances 7,446,033 49,998,716 1.52
Midea Group 14,032,900 119,521,150 3.62
Shanghai International Airport 5,010,637 34,654,083 1.05
Hong Kong (2016: 369,415,483, 14.41%) 458,244,960 13.89
AIA Group 7,397,400 63,083,264 1.91
CK Hutchison Holdings 5,219,500 65,513,803 1.99
CSPC Pharmaceutical 14,428,000 29,130,506 0.88
Dairy Farm International Holdings 7,858,118 61,764,808 1.87
Jardine Matheson Holdings 865,455 52,576,391 1.60
Minth Group 9,426,000 56,864,867 1.72
Techtronic Industries 5,365,000 34,974,282 1.06
The Link Real Estate Investment Trust 4,527,057 41,965,195 1.27
Vitasoy International Holdings 20,466,000 52,371,844 1.59
India (2016: 491,350,526, 19.17%) 576,988,158 17.48
Axis Bank 3,676,865 32,487,063 0.98
Dabur India 8,197,318 44,911,709 1.36
Godrej Consumer Products 2,630,590 41,191,386 1.25
HDFC Bank 4,896,386 153,794,097 4.66
HDFC Standard Life Insurance 912,030 5,515,547 0.17
Housing Development Finance 2,851,187 76,403,905 2.31
Kotak Mahindra Bank 2,420,510 38,309,494 1.16

First State Asian Equity Plus Fund
Schedule of Investments (continued)
as of 31 December 2017
108
Number of
shares
Fair value
US$
% of net
assets
India (continued)
Lupin 1,203,757 16,692,575 0.51
Marico 3,711,550 18,753,278 0.57
Nestle India 377,625 46,566,897 1.41
Tata Consultancy Services 1,226,698 51,914,247 1.57
Tech Mahindra 6,388,190 50,447,960 1.53
Indonesia (2016: Nil) 74,066,050 2.24
Bank Central Asia 31,073,600 50,157,497 1.52
Indocement Tunggal Prakarsa 14,778,100 23,908,553 0.72
Japan (2016: 149,980,700, 5.85%) 264,724,837 8.02
Fast Retailing 82,900 33,084,857 1.00
Keyence 81,500 45,714,743 1.38
Misumi 1,915,800 55,841,322 1.69
Pigeon 897,500 34,215,542 1.04
Ryohin Keikaku 100,500 31,347,641 0.95
SMC 79,100 32,601,600 0.99
Unicharm 1,226,100 31,919,132 0.97
Malaysia (2016: 20,970,193, 0.82%) 30,872,703 0.94
Public Bank 6,012,600 30,872,703 0.94
Philippines (2016: 168,299,811, 6.57%) 207,966,753 6.30
BDO Unibank 15,431,169 50,785,891 1.54
DMCI Holdings 112,507,000 32,511,906 0.98
Manila Water 64,545,700 36,332,943 1.10
SM Investments 2,007,461 39,882,531 1.21
Universal Robina 15,989,970 48,453,482 1.47
Singapore (2016: 154,652,926, 6.03%) 146,792,897 4.45
DBS Group Holdings 2,637,158 49,059,273 1.49
Oversea Chinese Banking 10,536,931 97,733,624 2.96
South Korea (2016: 254,996,058, 9.95%) 291,084,316 8.82
Amore Pacific Group 157,365 20,811,767 0.63
Hanon Systems 2,147,194 27,994,181 0.85
Hanssem 145,767 24,610,102 0.75
LG Chemical 84,963 32,275,022 0.98

First State Asian Equity Plus Fund
Schedule of Investments (continued)
as of 31 December 2017
109
Number of
shares
Fair value
US$
% of net
assets
South Korea (continued)
LG Household & Health Care 42,633 47,545,502 1.44
Naver 45,761 37,341,903 1.13
Samsung Electronics 51,270 100,505,839 3.04
Taiwan (2016: 370,475,452, 14.46%) 366,605,739 11.11
Advantech 8,148,208 57,852,057 1.75
Delta Electronics Industrial 10,143,564 49,096,109 1.49
President Chain Store 4,230,000 40,519,428 1.23
Taiwan Semiconductor Manufacturing 23,978,751 185,615,332 5.62
Uni-President Enterprises 15,058,854 33,522,813 1.02
Thailand (2016: 86,381,095, 3.37%) 83,520,868 2.53
Delta Electronics 11,077,500 24,898,033 0.75
Kasikorn Bank 7,993,800 58,622,835 1.78
United States (2016: 30,639,577, 1.20%) 42,440,734 1.29
ResMed 4,939,889 42,440,734 1.29
Total equities* 3,229,185,396 97.85
Investment funds (2016: 45,064,654, 1.76%) 62,225,782 1.89
CPN Retail Growth Leasehold Property Fund 33,261,756 22,963,777 0.70
First State China A Shares† 1,718,250 39,262,005 1.19
Total financial assets designated at fair value through
profit or loss
3,291,411,178 99.74
Cash and other net assets 8,680,245 0.26
Total net assets attributable to redeemable participating
shareholders
3,300,091,423 100.00
Total cost of financial assets designated at fair value
through profit or loss (2016: 2,105,444,548) 2,096,187,556
†Fund Investment. Investment is a related party entity. Please refer Note 14.

First State Asian Equity Plus Fund
Schedule of Investments (continued)
as of 31 December 2017
110
Analysis of net investments
Fair Value
US$
% of total
assets
*Transferable securities admitted to an official stock
exchange listing or traded on a regulated market
3,229,185,396 97.36
Investment funds 62,225,782 1.88

First State Asian Equity Plus Fund
Portfolio Changes (Unaudited)
111
The schedule of portfolio changes is based on financial assets designated at fair value through
profit or loss
Number of
shares purchased
Number of
shares sold
AAC Technologies Holdings 1,100,000 1,204,500
Advantech 1,151,424 986,000
AIA Group - 845,800
Amore Pacific Group 39,452 187,154
Asustek Computer - 140,000
Axis Bank 3,676,865 -
Baidu 13,189 53,136
Bank Central Asia 31,073,600 -
BDO Unibank 2,802,585 3,549,390
BDO Unibank Right 2,802,585 2,802,585
Brambles 558,252 4,704,487
China Mengniu Dairy 2,779,000 2,916,000
China Oilfield Services - 12,794,000
China Resources Land 9,338,999 -
China South Publishing & Media Group 5,922,020 10,768,110
CK Hutchison Holdings - 4,029,500
CSL - 478,911
Ctrip Com International 648,200 -
Dabur India - 2,655,987
Dairy Farm International Holdings 556,300 -
DBS Group Holdings 44,066 541,600
Delta Electronics - 13,284,100
Delta Electronics Industrial - 2,791,000
DMCI Holdings - 11,278,300
Dr Reddys Laboratories - 1,288,071
ENN Energy Holdings 904,000 792,000
Fast Retailing 91,300 8,400
Fuyao Glass Industry 2,206,096 2,369,200
Giant Manufacturing - 3,992,000
Godrej Consumer Products 1,470,383 976,254
Gree Electric Appliances 1,239,190 -
Hanon Systems 2,420,648 273,454
Hanssem 145,767 -
HDFC Bank 318,998 -
HDFC Standard Life Insurance 912,030 -
Housing Development Finance 474,573 -
IDFC - 26,855,461

First State Asian Equity Plus Fund
Portfolio Changes (Unaudited) (continued)
112
Number of
shares purchased
Number of
shares sold
IDFC Bank - 10,480,803
Indocement Tunggal Prakarsa 14,778,100 -
Infosys Technologies 555,375 2,707,572
Jardine Matheson Holdings 14,681 -
Kasikorn Bank 1,762,200 -
Keyence 81,500 -
LG - 704,643
LG Chemical - 103,550
LG Household & Health Care - 36,735
Lung Kee (Bermuda) Holdings - 5,531,000
M1 - 18,594,900
Manila Water 16,591,700 -
MediaTek - 2,237,000
Midea Group 14,032,900 -
Minth Group 2,956,000 806,000
Misumi - 207,400
Naver 31,366 5,276
Nestle India 377,625 -
Oversea Chinese Banking 1,263,900 957,600
Pigeon - 213,200
President Chain Store - 513,000
Public Bank 1,242,200 -
Ramsay Health Care 540,882 -
Ryohin Keikaku - 75,000
Samsung Electronics 8,556 -
Samsung Fire & Marine Insurance - 164,709
Shanghai International Airport 5,010,637 -
Shimano - 183,300
Singapore Telecommunications - 11,302,000
SM Investments - 1,311,000
SMC - 18,800
Sun Art Retail Group - 12,844,000
Taiwan Semiconductor Manufacturing 895,000 2,943,000
Tata Consultancy Services - 89,938
Tech Mahindra 3,828,202 2,280,521
Techtronic Industries 5,365,000 -
The Link Real Estate Investment Trust - 1,243,500

First State Asian Equity Plus Fund
Portfolio Changes (Unaudited) (continued)
113
Number of
shares purchased
Number of
shares sold
Unicharm 1,226,100 -
Uni-President Enterprises 2,914,000 3,056,000
Universal Robina 7,847,280 -
The Schedule of Portfolio Changes in Investments reflects the aggregate purchases of a security
exceeding one percent of the total value of purchases for the year and aggregate sales of a security
exceeding one percent of the total sales for the year.

First State Asian Bond Fund
Investment Manager’s Report (Unaudited)
114
Performance
01/01/14 01/01/15 01/01/16 01/01/17
To To To To
31/12/14 31/12/15 31/12/16 31/12/17
First State Asian Bond Fund “the Fund”
– Class I (Dist)^ 6.01% 1.31% 3.73% 5.37%
– Class III* 6.88% n/a% n/a n/a
JP Morgan Asia Credit Index# 8.32% 2.80% 5.81% 5.78%
(Performance calculation is based on official dealing NAV per share)
^ Dividend adjustment return
*The class III was closed at 23 Jan 2015, therefore no performance figures provided.
#Benchmarks are being included for illustrative purposes and there is no guarantee that a fund will outperform a benchmark.
Past performance is no indication of current or future performance and the performance data does not take account of
commissions and costs incurred in the issue and redemption of units.
Despite US Fed’s rate hikes, Trump’s protectionist rhetoric and heightened geo-political tension between
US and North Korea, Asian credit markets defied all odds and delivered yet another year of stellar return. The JP
Morgan Asia Credit Index (JACI) gained 5.78%. The positive return was largely attributed to spreads tightening
which saw the average spread of the JACI tightened by 15 bps to 222 bps. Return was further boosted by a rally in
the longer dated US treasuries, despite the front end rates normalizing significantly as the Fed continued to hike
policy rate.
2017 will be best remembered as a year we finally see synchronized global growth. Especially encouraging
was the growth in developed economies, allowing the Fed to continue normalizing policy rates while the European
Central Bank reduced their asset purchases. China continued with its effort to de-leverage and rebalanced its
economy and at the same time issued its first USD sovereign bonds for the first time since 2004, effectively
establishing a benchmark for pricing foreign currency bonds from China which will help to further develop the
market.
The Asian credit market continue to expand at an exponential pace. On a full year basis, new issues
increased by 56% over 2016, coming in at USD 271bn. Chinese issuers accounted for 64% of the total, up from the
60% last year. At a distant second is Hong Kong at 9% while South Korea came third at 6%. Corporate investment
grade issuers accounted for 33% of total supply, followed by high yield corporates 27%, banks senior 23%, bank
capital 9% and sovereigns 8%.
Market and economic conditions look a lot more favorable as we start 2018 versus a year ago when it was
clouded with uncertainties. We now have a synchronized global growth that looks set to continue at least in the first
quarter along with Fed rate hikes that has been well communicated and thus bringing no surprises. There is also
optimism around US tax reforms and China’s ability to rebalance its economy without derailing its growth. Amid
this positive backdrop, the more plausible risks that we see derailing the risky assets rally would be limited to a
more hawkish than expected ECB as it winds down its QE and a sudden spike up in inflation in the developed
economy forcing the Fed and ECB to move quicker. Supply and demand technical in the Asian credit market
remains extremely favorable as we believe the current situation of too much cash chasing after a limited pool of
assets is likely to persist. The onshore Chinese investors’ bid is becoming a structural development that bodes well
for the market. In short, we are bullish in Asian fixed income as we begin 2018 barring significant changes to the
above mentioned factors.
First State Investment (Hong Kong) Limited
February 2018

First State Asian Bond Fund
Performance Table
as of 31 December 2017 (Unaudited)
115
Financial period Total net asset
value
Net asset
value per
share
Class I Distributing
Dec 2015 US$ 15,400,195 US$ 8.31
Dec 2016 US$ 18,810,887 US$ 8.38
Dec 2017 US$ 33,850,880 US$ 8.62
Financial period The highest issue
price
The lowest
redemption
price
Class I Distributing
Dec 2008 US$ 10.33 US$ 6.15
Dec 2009 US$ 7.99 US$ 6.03
Dec 2010 US$ 8.59 US$ 7.96
Dec 2011 US$ 15.08 US$ 7.78
Dec 2012 US$ 8.75 US$ 8.13
Dec 2013 US$ 8.77 US$ 8.03
Dec 2014 US$ 8.59 US$ 8.22
Dec 2015 US$ 8.66 US$ 8.27
Dec 2016 US$ 8.82 US$ 8.29
Dec 2017 US$ 8.69 US$ 8.39

First State Asian Bond Fund
Performance Table (continued)
as of 31 December 2017 (Unaudited)
116
Financial period The highest issue
price
The lowest
redemption
price
Class III
Dec 2008 US$ 13.41 US$ 9.21
Dec 2009 US$ 12.34 US$ 8.93
Dec 2010 US$ 13.86 US$ 12.33
Dec 2011 US$ 14.13 US$ 13.12
Dec 2012 US$ 15.53 US$ 13.88
Dec 2013 US$ 15.76 US$ 14.69
Dec 2014 US$ 16.50 US$ 15.22
Dec 2015 US$ 16.40 US$ 16.25

First State Asian Bond Fund
Schedule of Investments
as of 31 December 2017
117
The schedule that follows includes financial assets designated at fair value through profit or loss
Number of
shares
Fair value
US$
% of net
assets
Australian Dollar (2016: Nil) 181,832 0.54
Fonterra Co operative Group 4% 02/11/2027 100,000 78,962 0.23
SGSP Australia Assets 3.75% 27/09/2024 130,000 102,870 0.31
Chinese Renminbi (2016: 430,798, 2.29%) 1,104,828 3.26
Bank of China 4.5% 22/11/2020 1,000,000 153,061 0.45
Bank of China 6.75% VRN Perp 4,000,000 644,345 1.90
Hong Kong Mortgage 4.05% 06/11/2020 1,000,000 152,838 0.45
Longfor Properties 6.75% 28/05/2018 1,000,000 154,584 0.46
Indian Rupee (2016: 211,221, 1.12%) - - -
Indonesian Rupiah (2016: 362,502, 1.93%) 152,202 0.45
Indonesia Government International Bond 7.875% 15/04/2019 2,000,000,000 152,202 0.45
Malaysian Ringgit (2016: 111,595, 0.60%) 124,745 0.37
Malaysia Government Bond 3.654% 31/10/2019 500,000 124,745 0.37
Thailand Baht (2016: 28, 0.00%) - - -
United States Dollar (2016: 17,163,498, 91.24%) 29,681,131 87.68
Axiata 5.375% 28/04/2020 200,000 211,387 0.62
Azure Nova International Finance 3.5% 21/03/2022 900,000 902,241 2.67
Bangkok Bank 4.8% 18/10/2020 250,000 263,469 0.78
Bank of China 5% 13/11/2024 400,000 427,241 1.26
Bank of East Asia 4.25% VRN 20/11/2024 200,000 202,463 0.60
Bank of East Asia 6.125% 16/07/2020 200,000 214,170 0.63
Bharti Airtel International 5.35% 20/05/2024 300,000 323,468 0.96
BPRL International Singapore 4.375% 18/01/2027 200,000 207,085 0.61
CCCI Treasure 3.5% VRN Perp 200,000 199,781 0.59
Central China Real Estate 6.0% 16/07/2018 200,000 201,768 0.60
Central China Real Estate 6.5% 04/06/2018 200,000 201,250 0.59
Central China Real Estate 8.75% 23/01/2021 200,000 214,380 0.63
Champion MTN 3.75% 17/01/2023 200,000 200,624 0.59
Charming Light Investments 4.25% VRN Perp 400,000 401,063 1.18
Charming Light Investments 4.375% 21/12/2027 200,000 201,405 0.60
China Cinda Finance 4.1% 09/03/2024 400,000 408,886 1.21
China Clean Energy Development 4% 05/11/2025 200,000 206,368 0.61
China Construction Bank 3.875% VRN 13/05/2025 200,000 201,956 0.60
China Construction Bank 4.25% VRN 20/08/2024 200,000 203,299 0.60
China Oversea Finance 6.375% 29/10/2043 400,000 524,402 1.55
China Railway Xunjie 3.25% 28/07/2026 200,000 196,539 0.58
China Reinsurance Finance 3.375% 09/03/2022 400,000 394,415 1.17
Chinalco Capital Holding 4.25% 21/04/2022 200,000 200,868 0.59
Citic 2.8% 14/12/2021 200,000 196,463 0.58
Citic 6.625% 15/04/2021 941,000 1,040,068 3.07

First State Asian Bond Fund
Schedule of Investments (continued)
as of 31 December 2017
118
Number of
shares
Fair value
US$
% of net
assets
United States Dollar (continued)
CNAC HK Finbridge 4.125% 19/07/2027 300,000 300,655 0.89
Commonwealth Bank of Australia 4.2% 26/10/2020 1,000,000 152,713 0.45
Cosco Pacific Finance 4.375% 31/01/2023 200,000 202,769 0.60
Country Garden Holdings 4.75% 28/09/2023 400,000 398,309 1.18
Dah Sing Bank 5.25% VRN 29/01/2024 200,000 203,877 0.60
DBS Group Holdings 3.6% VRN Perp 200,000 199,662 0.59
Development Bank of Philippines 5.5% 25/03/2021 200,000 218,277 0.64
Eastern Creation II Investment 3.25% 20/01/2020 200,000 201,872 0.60
ENN Energy Holdings 3.25% 24/07/2022 400,000 397,663 1.17
Franshion Brilliant 3.60% 03/03/2022 900,000 896,081 2.65
Goodman Finance 4.375% 19/06/2024 200,000 209,353 0.62
Greenland Global Investment 4.85% 17/08/2020 400,000 400,529 1.18
Hana Bank 4.375% 30/09/2024 200,000 208,124 0.61
Huarong Finance 3.75% 27/04/2022 200,000 201,749 0.60
Huarong Finance 4.95% 07/11/2047 300,000 296,124 0.87
Huarong Finance 5% 19/11/2025 400,000 420,644 1.24
Huarong Finance 5.5% 27/04/2047 300,000 322,910 0.95
Hyundai Capital America 2.75% 27/09/2026 300,000 276,313 0.82
Hyundai Capital Services 3.0% 29/08/2022 400,000 393,716 1.16
Hyundai Capital Services 3.625% 29/08/2027 500,000 488,680 1.44
Indonesia Government International Bond 4.15% 29/03/2027 200,000 206,090 0.61
Industrial & Commercial Bank of China 5.125% 30/11/2020 200,000 211,328 0.62
Keppel Land Financial Services Pte 3.259% 11/12/2019 200,000 200,415 0.59
Korea Hydro And Nuclear Power 3.125% 25/07/2027 250,000 244,486 0.72
Korea National Oil 2.625% 14/04/2026 200,000 189,934 0.56
KWG Property Holding 5.875% 10/11/2024 400,000 391,064 1.16
KWG Property Holdings 8.975% 14/01/2019 200,000 205,250 0.61
Lenovo Group 3.875% 16/03/2022 500,000 499,375 1.48
Li And Fung 5.25% Perp 400,000 370,217 1.09
Longfor Properties 6.75% 29/01/2023 300,000 310,303 0.92
Majapahit Holding 7.875% 29/06/2037 100,000 135,380 0.40
Malayan Banking 3.905% VRN 29/10/2026 200,000 204,752 0.61
Nan Fung Treasury 3.875% 03/10/2027 600,000 579,247 1.71
Nan Fung Treasury 5.5% Perp 500,000 506,064 1.50
New World China Land 4.75% 23/01/2027 300,000 311,620 0.92
Nexen 6.4% 15/05/2037 400,000 523,708 1.55
Nexen Energy 5.875% 10/03/2035 200,000 245,979 0.73
Nonghyup Bank 2.875% 22/07/2020 200,000 199,613 0.59
NTPC 4.25% 26/02/2026 200,000 206,238 0.61
Oil India International 4% 21/04/2027 200,000 200,480 0.59
Oman Government International Bond 6.5% 08/03/2047 200,000 200,777 0.59
ONGC Videsh 4.625% 15/07/2024 200,000 213,332 0.63
Oversea Chinese Banking 4.25% 19/06/2024 400,000 416,334 1.23
Pertamina Persero 6.45% 30/05/2044 200,000 240,007 0.71
Press Metal Labuan 4.8% 30/10/2022 870,000 878,806 2.60

First State Asian Bond Fund
Schedule of Investments (continued)
as of 31 December 2017
119
Number of
shares
Fair value
US$
% of net
assets
United States Dollar (continued)
Reliance Industries 3.667% 30/11/2027 250,000 247,838 0.73
Reliance Industries 5.875% Perp 200,000 200,300 0.59
RHB Bank 2.503% 06/10/2021 200,000 197,076 0.58
Rural Electrification 3.875% 07/07/2027 200,000 198,785 0.59
Shimao Property Holdings 4.75% 03/07/2022 200,000 199,657 0.59
Siam Commercial Bank 2.75% 16/05/2023 350,000 342,655 1.01
Singtel Group Treasury 3.25% 30/06/2025 500,000 508,245 1.50
SingTel Group Treasury 4.5% 08/09/2021 200,000 212,746 0.63
Sinochem Overseas Capital 6.3% 12/11/2040 200,000 261,733 0.77
Sinopec Group Overseas Development 2.5% 13/09/2022 1,000,000 974,434 2.88
Sinopec Group Overseas Development 3.625%
12/04/2027 500,000 503,655 1.49
Sinopec Group Overseas Development 4.25%
12/04/2047 300,000 310,657 0.92
Standard Chartered Bank 5.875% 24/06/2020 200,000 213,784 0.63
State Grid Overseas Investment 3.50% 04/05/2027 200,000 200,849 0.59
Tenaga Nasional 7.5% 01/11/2025 250,000 317,458 0.94
Theta Capital 7% 11/04/2022 200,000 207,031 0.61
Three Gorges Finance I 2.3% 02/06/2021 200,000 196,806 0.58
United Overseas Bank 3.75% VRN 19/09/2024 400,000 406,277 1.20
United Overseas Bank 3.875% VRN Perp 200,000 199,795 0.59
Vanke Real Estate Hong Kong 3.975% 09/11/2027 200,000 199,430 0.59
Wanda Properties International 7.25% 29/01/2024 600,000 604,200 1.79
Wanda Properties Oversea 4.875% 21/11/2018 400,000 399,385 1.18
Westpac Banking Corporation 5% VRN Perp 150,000 149,677 0.44
Yuzhou Properties 6% 25/01/2022 200,000 202,780 0.60
Total bonds* 31,244,738 92.30
Future Contracts 1** (2016: 664, 0.00%) 22,610 0.07
CBOT 10 Year U.S. Notes Mar 18 (24) 21,891 0.07
CBOT US Long Bond Mar 18 (2) 719 0.00
Total financial assets designated at fair value through
profit or loss 31,267,348 92.37
Future Contracts 1** (2016: (1,805), (0.01%)) (5,070) (0.02)
CBOT 2 Year U.S. Notes Mar 18 11 (5,070) (0.02)
Total Financial Liabilities designated at fair value (5,070) (0.02)
Total financial assets and liabilities designated at fair
value through profit or loss 31,262,278 92.35
Cash and other net assets 2,588,602 7.65

First State Asian Bond Fund
Schedule of Investments (continued)
as of 31 December 2017
120
Fair value
US$
% of net
assets
Number of
shares
Total net assets attributable to redeemable participating
shareholders
33,850,880
100.00
Total cost of financial assets designated at fair value
through profit or loss (2016: 18,326,256) 31,046,629
1The counterparty for future contracts is JP Morgan Securities LLC.
Analysis of net investments
% of total
assets
*Transferable securities admitted to an official stock
exchange listing or traded on a regulated market 31,244,738 92.06
**Financial derivative instruments dealt in on a regulated
market 17,540 0.05

First State Asian Bond Fund
Portfolio Changes (Unaudited)
121
The schedule of portfolio changes is based on financial assets designated at fair value through
profit or loss
Number of shares
purchased
Number of
shares sold
Alibaba Group Holding 4.5% 28/11/2034 - 400,000
Amber Circle Funding 3.25% 04/12/2022 - 200,000
APT Pipelines 4.25% 15/07/2027 40,000 40,000
Australia & New Zealand Banking 6.75% VRN Perp - 200,000
Australia & New Zealand Banking VRN 30/01/2025 1,560,000 1,560,000
Azure Nova International Finance 3.0% 21/03/2020 200,000 200,000
Azure Nova International Finance 3.5% 21/03/2022 900,000 -
Bank of China 4.5% 22/11/2020 1,000,000 -
Bank of China 6.75% VRN Perp 4,000,000 -
Bank of China Johannesburg 4.88% 20/04/2020 1,000,000 1,000,000
Bank of East Asia 4.25% VRN 20/11/2024 200,000 -
Bharti Airtel International 5.35% 20/05/2024 300,000 -
BPRL International Singapore 4.375% 18/01/2027 200,000 -
Central China Real Estate 6.0% 16/07/2018 200,000 -
Charming Light Investments 4.25% Perp 400,000 -
Charming Light Investments 4.375% 21/12/2027 200,000 -
China Cinda Finance 4.1% 09/03/2024 400,000 -
China Cinda Finance 4.4% 09/03/2027 200,000 200,000
China Clean Energy Development 4% 05/11/2025 - 200,000
China Construction Bank 4.25% VRN 20/08/2024 200,000 -
China Construction Bank 5.55% 11/02/2020 - 200,000
China Merchants Bank 4.1% 10/04/2017 - 1,000,000
China Oversea Finance 6.375% 29/10/2043 400,000 -
China Reinsurance Finance 3.375% 09/03/2022 400,000 -
Chinalco Capital Holding 4.25% 21/04/2022 200,000 -
CITIC 2.8% 14/12/2021 200,000 -
CITIC 6.625% 15/04/2021 941,000 -
CNAC HK Finbridge 4.125% 19/07/2027 300,000 -
CNOOC Finance 3.5% 05/05/2025 - 200,000
Commonwealth Bank of Australia 4.2% 26/10/2020 1,000,000 -
Country Garden Holdings 4.75% 28/09/2023 200,000 -
Country Garden Holding 7.25% 04/04/2021 - 200,000
Dah Sing Bank 5.25% VRN 29/01/2024 200,000 -
DBS Group Holdings 3.6% VRN Perp - 200,000
ENN Energy Holdings 3.25% 24/07/2022 400,000 -
Export Import Bank of China 3.375% 14/03/2027 200,000 200,000
Export Import Bank of India 3.375% 05/08/2026 - 200,000
Export-Import Bank of Korea 5.125% 29/06/2020 - 200,000

First State Asian Bond Fund
Portfolio Changes (Unaudited) (continued)
122
Number of shares
purchased
Number of
shares sold
Fonterra Co operative Group 4% 02/11/2027 100,000 -
Franshion Brilliant 3.60% 03/03/2022 900,000 -
Franshion Investment 4.7% 26/10/2017 - 200,000
Greenland Global Investment 4.85% 17/08/2020 200,000 -
Greenland Global Investment 4.85% 17/08/2022 200,000 -
Hana Bank 4.375% 30/09/2024 200,000 -
Hong Kong Electric Finance 2.875% 03/05/2026 - 600,000
Hong Kong Land Finance 4.5% 07/10/2025 - 100,000
Hong Kong Mortgage 4.05% 06/11/2020 1,000,000 -
Huarong Finance 3.375% 24/01/2020 200,000 200,000
Huarong Finance 3.75% 27/04/2022 200,000 -
Huarong Finance 4.75% 27/04/2027 300,000 300,000
Huarong Finance 4.95% 07/11/2047 300,000 -
Huarong Finance 5% 19/11/2025 400,000 -
Huarong Finance 5.5% 27/04/2047 300,000 -
Hyundai Capital America 1.75% 27/09/2019 - 200,000
Hyundai Capital America 2.75% 27/09/2026 300,000 150,000
Hyundai Capital America 3% 18/03/2021 - 200,000
Hyundai Capital Services 3.0% 29/08/2022 400,000 -
Hyundai Capital Services 3.625% 29/08/2027 700,000 200,000
ICBCIL Finance 3.2% 10/11/2020 200,000 700,000
ICICI Bank Dubai 4% 18/03/2026 - 200,000
India (Govt of) 8.08% 02/08/2022 - 10,000,000
India (Govt of) 8.27% 09/06/2020 - 3,500,000
Indonesia Government International Bond 3.4%
29/03/2022 200,000 200,000
Indonesia Government International Bond 4.15%
29/03/2027 200,000 -
Indonesia Government International Bond 5.95%
08/01/2046 - 400,000
Indonesia Government International Bond 7.5%
15/08/2032 2,000,000,000 2,000,000,000
Indonesia Government International Bond 7.875%
15/04/2019 5,000,000,000 6,700,000,000
Indonesia Government International Bond 8.75%
15/05/2031 - 1,100,000,000
Industrial & Commercial Bank of China 4.875%
21/09/2025 - 200,000
Korea Hydro & Nuclear Power 3.125% 25/07/2027 250,000 -
Korea National Oil 2.125% 14/04/2021 - 200,000
KWG Property Holding 5.875% 10/11/2024 400,000 -
Lenovo Group 3.875% 16/03/2022 500,000 -

First State Asian Bond Fund
Portfolio Changes (Unaudited) (continued)
123
Number of shares
purchased
Number of
shares sold
Lenovo Group 4.95% 10/06/2020 - 1,000,000
Li & Fung 5.25% Perp 400,000 -
Longfor Properties 6.75% 29/01/2023 300,000 -
Nan Fung Treasury 3.875% 03/10/2027 600,000 -
Nan Fung Treasury 5.5% Perp 500,000 -
New World China Land 4.75% 23/01/2027 500,000 200,000
Nexen 6.4% 15/05/2037 400,000 -
Oil India International 4% 21/04/2027 200,000 -
Oman Government International Bond 6.5% 08/03/2047 200,000 -
ONGC Videsh 4.625% 15/07/2024 200,000 -
ONGC Videsh Vankorneft 2.875% 27/01/2022 - 200,000
Oversea Chinese Banking 4.25% 19/06/2024 - 200,000
Pertamina Persero 4.875% 03/05/2022 - 200,000
Press Metal Labuan 4.8% 30/10/2022 870,000 -
PTT 3.375% 25/10/2022 - 200,000
Reliance Industries 3.667% 30/11/2027 250,000 -
Reliance Industries 4.875% 10/02/2045 - 250,000
Reliance Industries 5.875% Perp 200,000 -
Rural Electrification Corporation 3.875% 07/07/2027 200,000 -
SGSP Australia Assets 3.75% 27/09/2024 130,000 -
Shimao Property Holdings 4.75% 03/07/2022 200,000 -
Shinhan Bank 2.875% 28/03/2022 200,000 200,000
Shinsegae 2.625% VRN 08/05/2045 - 200,000
Siam Commercial Bank 2.75% 16/05/2023 350,000 -
Singapore (Govt of) 2.125% 01/06/2026 100,000 100,000
Singtel Group Treasury 3.25% 30/06/2025 500,000 -
Sinochem Overseas Capital 4.5% 12/11/2020 - 200,000
Sinopec Group Overseas Development 1.75% 29/09/2019 - 200,000
Sinopec Group Overseas Development 2% 29/09/2021 - 200,000
Sinopec Group Overseas Development 2.5% 13/09/2022 1,000,000 -
Sinopec Group Overseas Development 3.625% 12/04/2027 500,000 -
Sinopec Group Overseas Development 4.25% 12/04/2047 300,000 -
State Grid Overseas Investment 2016 2.125% 18/05/2021 - 200,000
State Grid Overseas Investment 2016 3.50% 04/05/2027 500,000 300,000
Sun Hung Kai Properties 3.625% 16/01/2023 - 200,000
Thailand Government Bond 2.8% 10/10/2017 - 1,000
United Overseas Bank 2.875% VRN 17/10/2022 - 200,000
United Overseas Bank 3.5% VRN 16/09/2026 - 200,000
United Overseas Bank 3.75% VRN 19/09/2024 400,000 -
United Overseas Bank 3.875% VRN Perp 200,000 -

First State Asian Bond Fund
Portfolio Changes (Unaudited) (continued)
124
Number of shares
purchased
Number of
shares sold
US Treasury 0.625% 31/05/2017 400,000 620,000
US Treasury Note 0.625% 30/09/2017 400,000 400,000
US Treasury Note 0.875% 28/02/2017 1,000,000 1,250,000
US Treasury Note 3% 15/02/2047 40,000 40,000
Vanke Real Estate Hong Kong 3.975% 09/11/27 200,000 -
Vedanta Resources 8.25% 07/06/2021 - 200,000
Wanda Properties International 7.25% 29/01/2024 200,000 -
Wanda Properties Oversea 4.875% 21/11/2018 200,000 -
Want Want China Finance 2.875% 27/04/2022 200,000 200,000
Westpac Banking Corporation 5% VRN Perp 150,000 -
Wharf Finance 4.625% 08/02/2017 - 200,000
Woori Bank 4.75% 30/04/2024 - 200,000
Yuzhou Properties 6% 25/01/2022 200,000 -
The Schedule of Portfolio Changes in Investments reflects the aggregate purchases of a security
exceeding one percent of the total value of purchases for the year and aggregate sales of a security
exceeding one percent of the total sales for the year.

First State Asian Quality Bond Fund
Investment Manager’s Report (Unaudited)
125
Performance
01/01/14 01/01/15 01/01/16 01/01/17
To To To To
31/12/14 31/12/15 31/12/16 31/12/17
First State Asian Quality Bond Fund “the Fund”
– Class I 6.82% 0.93% 3.36% 5.61%
– Class I (Monthly Dist)^ 7.26% 0.71% 3.26% 5.75%
– Class I (HKD Monthly Dist)^ 6.81% 0.86% 3.41% 6.52%
– Class III* n/a n/a -0.20% n/a
– Class VI (Distributing)** n/a n/a -4.00% 6.50%
JP Morgan Asia Credit Investment Grade Index# 9.00% 2.16% 4.49% 5.46%
JP Morgan Asia Credit Investment Grade Index (HKD)# 9.02% 2.10% 4.53% 6.33%
(Performance calculation is based on official dealing NAV per share)
*Inception date – 7 December 2016 and closing date – 28 April 2017
**Inception date – 22 August 2016
^ Dividend adjustment return
#Benchmarks are being included for illustrative purposes and there is no guarantee that a fund will outperform a benchmark
Past performance is no indication of current or future performance and the performance data does not take account of
commissions and costs incurred in the issue and redemption of units.
Despite US Fed’s rate hikes, Trump’s protectionist rhetoric and heightened geo-political tension between
US and North Korea, Asian credit market defied all odds and delivered yet another year of stellar return. The JP
Morgan Asia Credit Investment Grade Index (JACI IG) gained 5.46%. The positive return was largely attributed to
spreads tightening which saw the average spread of the JACI IG index tightened by 20 bps to 158 bps. Return was
further boosted by a rally in the longer dated US treasuries, despite the front end rates normalizing significantly as
the Fed continued to hike policy rate.
2017 will be best remembered as a year we finally see synchronized global growth. Especially
encouraging was the growth in developed economies, allowing the Fed to continue normalizing policy rates while
the European Central Bank reduced their asset purchases. China continued with its effort to de-leverage and
rebalanced its economy and at the same time issued its first USD sovereign bonds for the first time since 2004,
effectively establishing a benchmark for pricing foreign currency bonds from China which will help to further
develop the market. The Asian credit market continue to expand at an exponential pace. On a full year basis, new issues
increased by 56% over 2016, coming in at USD 271bn. Chinese issuers accounted for 64% of the total, up from the
60% last year. At a distant second is Hong Kong at 9% while South Korea came third at 6%. Corporate investment
grade issuers accounted for 33% of total supply, followed by high yield corporates 27%, banks senior 23%, bank
capital 9% and sovereigns 8%.
Market and economic conditions look a lot more favorable as we start 2018 versus a year ago when it
was clouded with uncertainties. We now have a synchronized global growth that looks set to continue at least in the
first quarter along with Fed rate hikes that has been well communicated and thus bringing no surprises. There is
also optimism around US tax reforms and China’s ability to rebalance its economy without derailing its growth.
Amid this positive backdrop, the more plausible risks that we see derailing the risky assets rally would be limited
to a more hawkish than expected ECB as it winds down its QE and a sudden spike up in inflation in the developed
economy forcing the Fed and ECB to move quicker. Supply and demand technical in the Asian credit market
remains extremely favorable as we believe the current situation of too much cash chasing after a limited pool of
assets is likely to persist. The onshore Chinese investors’ bid is becoming a structural development that bodes well
for the market. In short, we are bullish in Asian fixed income as we begin 2018 barring significant changes to the
above mentioned factors.
First State Investment (Hong Kong) Limited
February 2018

First State Asian Quality Bond Fund
Performance Table
as of 31 December 2017 (Unaudited)
126
Financial period Total net asset
value
Net asset
value per
share
Class I
Dec 2015 US$ 470,959,387 US$ 15.17
Dec 2016 US$ 462,919,429 US$ 15.68
Dec 2017 US$ 561,387,196 US$ 16.56
Class I Monthly Distributing
Dec 2015 US$ 12,230,219 US$ 10.11
Dec 2016 US$ 107,054,564 US$ 10.03
Dec 2017 US$ 52,366,510 US$ 10.19
Class I HKD Monthly Distributing
Dec 2015 HKD 85,232,414 HKD 100.83
Dec 2016 HKD 450,600,993 HKD 100.17
Dec 2017 HKD 233,480,988 HKD 102.51
Class III
Dec 2016 US$ 11,653,583 US$ 9.98
Class VI Distributing
Dec 2016 US$ 1,441 US$ 9.60
Dec 2017 US$ 1,534 US$ 9.96
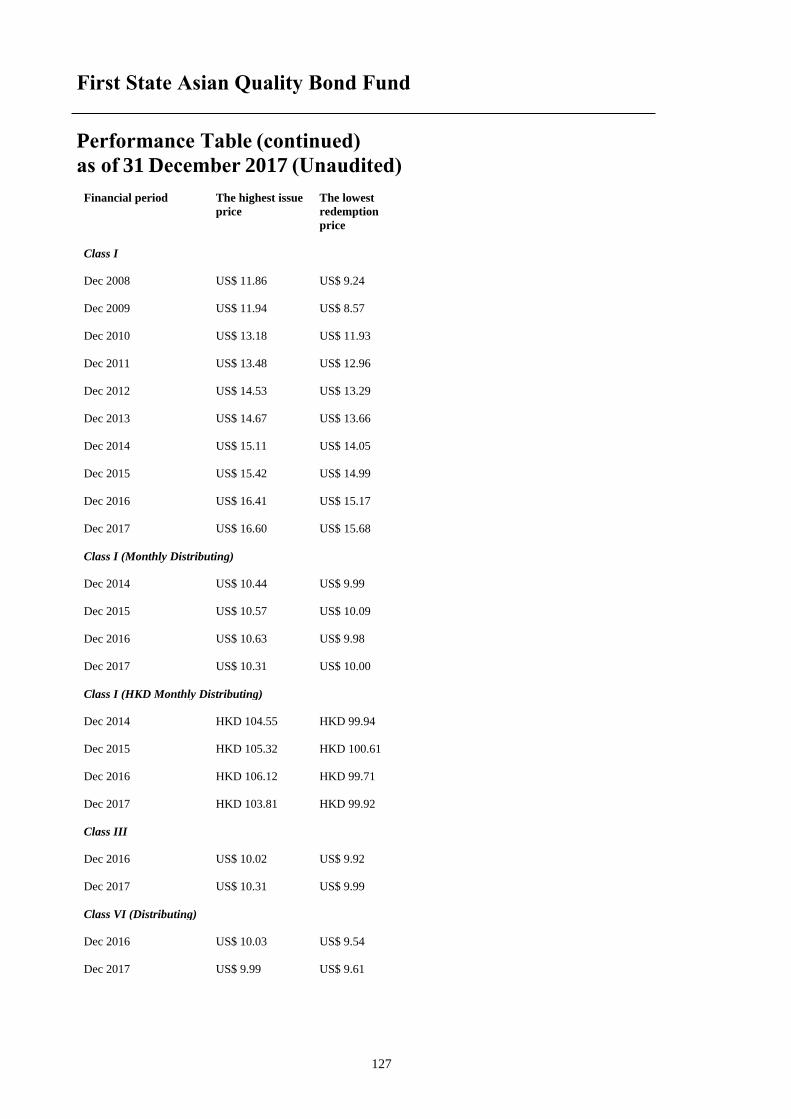
First State Asian Quality Bond Fund
Performance Table (continued)
as of 31 December 2017 (Unaudited)
127
Financial period The highest issue
price
The lowest
redemption
price
Class I
Dec 2008 US$ 11.86 US$ 9.24
Dec 2009 US$ 11.94 US$ 8.57
Dec 2010 US$ 13.18 US$ 11.93
Dec 2011 US$ 13.48 US$ 12.96
Dec 2012 US$ 14.53 US$ 13.29
Dec 2013 US$ 14.67 US$ 13.66
Dec 2014 US$ 15.11 US$ 14.05
Dec 2015 US$ 15.42 US$ 14.99
Dec 2016 US$ 16.41 US$ 15.17
Dec 2017 US$ 16.60 US$ 15.68
Class I (Monthly Distributing)
Dec 2014 US$ 10.44 US$ 9.99
Dec 2015 US$ 10.57 US$ 10.09
Dec 2016 US$ 10.63 US$ 9.98
Dec 2017 US$ 10.31 US$ 10.00
Class I (HKD Monthly Distributing)
Dec 2014 HKD 104.55 HKD 99.94
Dec 2015 HKD 105.32 HKD 100.61
Dec 2016 HKD 106.12 HKD 99.71
Dec 2017 HKD 103.81 HKD 99.92
Class III
Dec 2016 US$ 10.02 US$ 9.92
Dec 2017 US$ 10.31 US$ 9.99
Class VI (Distributing)
Dec 2016 US$ 10.03 US$ 9.54
Dec 2017 US$ 9.99 US$ 9.61

First State Asian Quality Bond Fund
Schedule of Investments
as of 31 December 2017
128
The schedule that follows includes financial assets designated at fair value through profit or loss
Number of
shares
Fair value
US$
% of net
assets
Australian Dollar (2016: Nil) 4,720,565 0.73
Fonterra Co operative Group 4% 02/11/2027 2,100,000 1,658,201 0.26
SGSP Australia Assets 3.75% 27/09/2024 3,870,000 3,062,364 0.47
Chinese Renminbi (2016: 12,433,956, 1.94%) 9,575,534 1.49
Australia & New Zealand Banking VRN 30/01/2025 15,750,000 2,420,365 0.38
Bank of China 4.5% 22/11/2020 8,000,000 1,224,484 0.19
Bestgain Real Estate 4.5% 04/12/2018 26,890,000 4,141,151 0.64
Industrial & Commercial Bank of China 3.9% 24/04/2019 3,000,000 458,086 0.07
Ocean Wealth 5.5% 08/06/2019 5,560,000 867,082 0.14
Westpac Banking Corporation 4.85% VRN 09/02/2025 3,000,000 464,366 0.07
Indian Rupee (2016: 7,016,975, 1.10%) - - -
Indonesian Rupiah (2016: 12,661,372, 1.98%) 3,196,241 0.50
Indonesia Government International Bond 7.875% 15/04/2019 42,000,000,000 3,196,241 0.50
Malaysian Ringgit (2016: 3,347,856, 0.52%) 3,742,335 0.58
Malaysia Government Bond 3.654% 31/10/2019 15,000,000 3,742,335 0.58
United States Dollar (2016: 592,557,252, 92.63%) 598,695,661 93.02
AIA Group 3.125% 13/03/2023 3,000,000 3,031,017 0.47
AIA Group 4.5% 16/03/2046 4,750,000 5,283,297 0.82
Amber Circle Funding 3.25% 04/12/2022 4,300,000 4,335,217 0.67
Australia & New Zealand Banking 4.5% 19/03/2024 6,000,000 6,297,750 0.98
Axiata 5.375% 28/04/2020 3,680,000 3,889,521 0.60
Azure Nova International Finance 3.5% 21/03/2022 15,500,000 15,538,595 2.41
Bangkok Bank 4.8% 18/10/2020 1,550,000 1,633,509 0.25
Bangkok Bank 9.025% 15/03/2029 4,750,000 6,738,217 1.05
Bao-trans Enterprises 3.75% 12/12/2018 500,000 503,713 0.08
Bharti Airtel International 5.35% 20/05/2024 500,000 539,113 0.08
BOC Aviation 3.5% 18/09/2027 500,000 486,525 0.08
BPRL International Singapore 4.375% 18/01/2027 2,500,000 2,588,565 0.40
Charming Light Investments 3.75% 03/09/2019 2,000,000 2,021,118 0.31
Charming Light Investments 4.375% 21/12/2027 5,950,000 5,991,787 0.93
China Cinda Finance 4.1% 09/03/2024 1,600,000 1,635,542 0.25
China Construction Bank 4.25% VRN 20/08/2024 8,400,000 8,538,575 1.33
China Mengniu Dairy 3.5% 27/11/2018 2,400,000 2,417,141 0.38
China Merchants Finance 4.75% 03/08/2025 3,430,000 3,682,547 0.57
China Overseas Finance 3.95% 15/11/2022 2,200,000 2,267,806 0.35
China Overseas Finance 5.35% 15/11/2042 4,961,000 5,743,360 0.89

First State Asian Quality Bond Fund
Schedule of Investments (continued)
as of 31 December 2017
129
Number of
shares
Fair value
US$
% of net
assets
United States Dollar (continued)
China Overseas Finance 5.5% 10/11/2020 5,000,000 5,340,365 0.83
China Overseas Finance 5.95% 08/05/2024 4,365,000 4,965,882 0.77
China Overseas Finance 6.45% 11/06/2034 4,500,000 5,663,925 0.88
China Resources Gas 4.5% 05/04/2022 2,000,000 2,106,508 0.33
China Resources Land 4.375% 27/02/2019 14,000,000 14,232,232 2.21
China State Construction Finance 3.125% 02/04/2018 2,300,000 2,301,851 0.36
China State Construction Finance 3.375% 29/11/2022 6,200,000 6,150,846 0.96
China (Govt of) 2.125% 02/11/2022 2,000,000 1,980,014 0.31
Chinalco Capital Holding 4.25% 21/04/2022 6,000,000 6,026,046 0.94
Citic 2.8% 14/12/2021 10,650,000 10,461,676 1.63
Citic 6.625% 15/04/2021 9,200,000 10,168,576 1.58
CLP Power Hong Kong Financing 4.75% 19/03/2020 2,600,000 2,712,694 0.42
CMHI Finance 7.125% 18/06/2018 700,000 713,125 0.11
CMT MTN Pte 3.731% 21/03/2018 1,900,000 1,912,645 0.30
CNOOC Finance 5.5% 21/05/2033 7,000,000 8,242,766 1.28
CNPC General Capital 2.7% 25/11/2019 1,250,000 1,251,229 0.19
CNPC HK Overseas Capital 5.95% 28/04/2041 1,600,000 2,067,280 0.32
Commonwealth Bank of Australia 4.2% 26/10/2020 22,000,000 3,359,682 0.52
DBS Group Holdings 3.6% VRN Perp 10,200,000 10,182,772 1.58
Eastern Creation II Investment 3.25% 20/01/2020 8,000,000 8,074,880 1.25
Eastern Creation Investments 3.625% 20/03/2019 1,100,000 1,110,141 0.17
ENN Energy Holdings 3.25% 24/07/2022 9,400,000 9,345,085 1.45
Franshion Brilliant 3.60% 03/03/2022 14,800,000 14,735,561 2.29
Gohl Capital 4.25% 24/01/2027 1,550,000 1,592,109 0.25
Hana Bank 4.375% 30/09/2024 5,846,000 6,083,453 0.95
HKCG Finance 6.25% 07/08/2018 4,000,000 4,088,048 0.64
Hong Kong Electric Finance 2.875% 03/05/2026 4,500,000 4,350,780 0.68
Hong Kong Electric Finance 4.25% 14/12/2020 4,000,000 4,161,472 0.65
Hong Kong Land Finance 4.5% 07/10/2025 2,000,000 2,175,144 0.34
Huarong Finance 3.375% 24/01/2020 5,500,000 5,502,805 0.86
Huarong Finance 3.75% 27/04/2022 6,800,000 6,859,466 1.07
Huarong Finance 4.95% 07/11/2047 5,300,000 5,231,524 0.81
Huarong Finance 5.5% 27/04/2047 10,100,000 10,871,286 1.69
Hutchison Whampoa International 7.45% 24/11/2033 5,544,000 8,005,081 1.24
Hyundai Capital Services 3% 29/08/2022 19,800,000 19,488,922 3.03
Hyundai Capital Services 3.625% 29/08/2027 10,600,000 10,360,016 1.61
ICBCIL Finance 3.2% 10/11/2020 8,800,000 8,805,500 1.37
Indonesia Government International Bond 8.5%
12/10/2035 3,700,000 5,542,063 0.86
JIC Zhixin 3% 24/11/2022 5,000,000 4,947,785 0.77
Korea Gas 3.5% 21/07/2025 2,500,000 2,536,010 0.39

First State Asian Quality Bond Fund
Schedule of Investments (continued)
as of 31 December 2017
130
Number of
shares
Fair value
US$
% of net
assets
United States Dollar (continued)
Korea Gas 6.25% 20/01/2042 1,000,000 1,427,458 0.22
Korea Hydro And Nuclear Power 3.125% 25/07/2027 4,350,000 4,254,061 0.66
Korea National Oil 2.125% 14/04/2021 4,800,000 4,678,339 0.73
Korea National Oil 2.625% 14/04/2026 4,800,000 4,558,421 0.71
Kowloon Canton Railway 5.125% 20/05/2019 2,000,000 2,068,850 0.32
Lembaga Pembiayaan Ekspor 3.875% 06/04/2024 1,000,000 1,021,174 0.16
Link Finance 3.6% 03/09/2024 3,300,000 3,377,494 0.52
Malayan Banking 3.905% VRN 29/10/2026 9,800,000 10,032,848 1.56
Mega Advance Investments 5% 12/05/2021 6,400,000 6,771,590 1.05
Nan Fung Treasury 3.875% 03/10/2027 9,450,000 9,123,143 1.42
Nan Fung Treasury 4.5% 20/09/2022 2,000,000 2,085,400 0.32
Nan Fung Treasury 4.875% 29/05/2024 3,000,000 3,187,602 0.50
Nexen 6.4% 15/05/2037 14,132,000 18,502,590 2.88
Nexen 7.5% 30/07/2039 237,000 351,875 0.05
Nexen Energy 5.875% 10/03/2035 4,800,000 5,903,496 0.92
Nonghyup Bank 1.875% 12/09/2021 5,000,000 4,825,720 0.75
Nonghyup Bank 2.875% 22/07/2020 3,450,000 3,443,317 0.53
NTPC 4.25% 26/02/2026 2,100,000 2,165,499 0.34
Oil India International 4% 21/04/2027 4,550,000 4,560,929 0.71
ONGC Videsh 4.625% 15/07/2024 935,000 997,328 0.16
Oversea Chinese Banking 4.25% 19/06/2024 14,400,000 14,988,024 2.33
Pertamina Persero 5.625% 20/05/2043 2,000,000 2,179,460 0.34
Pertamina Persero 6% 03/05/2042 13,000,000 14,797,861 2.30
Pertamina Persero 6.45% 30/05/2044 4,800,000 5,760,173 0.90
POSCO 5.25% 14/04/2021 1,000,000 1,067,963 0.17
PSA International 4.625% 11/09/2019 2,000,000 2,073,360 0.32
PSA Treasury Pte 2.5% 12/04/2026 5,000,000 4,824,600 0.75
PTTEP Canada International 6.35% 12/06/2042 3,600,000 4,737,445 0.74
Reliance Holdings 4.5% 19/10/2020 3,750,000 3,922,136 0.61
Reliance Holdings USA 6.25% 19/10/2040 1,250,000 1,622,526 0.25
Reliance Industries 3.667% 30/11/2027 5,400,000 5,353,301 0.83
Reliance Industries 4.125% 28/01/2025 1,700,000 1,764,811 0.27
Reliance Industries 5.875% Perp 5,000,000 5,007,500 0.78
RHB Bank 2.503% 06/10/2021 4,050,000 3,990,793 0.62
Rural Electrification 3.875% 07/07/2027 4,750,000 4,721,144 0.73
Shinhan Bank 2.25% 15/04/2020 1,500,000 1,478,423 0.23
Singtel Group Treasury 4.5% 08/09/2021 4,100,000 4,361,285 0.68
Sinochem Overseas Capital 4.5% 12/11/2020 5,000,000 5,222,955 0.81
Sinochem Overseas Capital 6.3% 12/11/2040 6,198,000 8,111,106 1.26
Sinopec Group Overseas Development 1.75% 29/09/2019 4,800,000 4,726,042 0.73

First State Asian Quality Bond Fund
Schedule of Investments (continued)
as of 31 December 2017
131
Number of
shares
Fair value
US$
% of net
assets
United States Dollar (continued)
Sinopec Group Overseas Development 2% 29/09/2021 4,800,000 4,656,518 0.72
Sinopec Group Overseas Development 2.5% 13/09/2022 10,000,000 9,744,340 1.51
Sinopec Group Overseas Development 3.9% 17/05/2022 4,000,000 4,141,008 0.64
Sinopec Group Overseas Development 4.25% 12/04/2047 5,000,000 5,177,620 0.80
SK Broadband 2.875% 29/10/2018 3,800,000 3,808,094 0.59
SP PowerAssets 3.25% 24/11/2025 2,450,000 2,504,860 0.39
Standard Chartered Bank 5.875% 24/06/2020 3,000,000 3,206,766 0.50
State Grid Overseas Investment 2016 2.125% 18/05/2021 3,100,000 3,033,539 0.47
Swire Properties MTN Financing 3.625% 13/01/2026 1,100,000 1,119,720 0.17
Swire Properties MTN Financing 4.375% 18/06/2022 2,200,000 2,326,003 0.36
Temasek Financial 4.3% 25/10/2019 2,950,000 3,055,283 0.48
Tenaga Nasional 7.5% 01/11/2025 3,500,000 4,444,405 0.69
Three Gorges Finance I 2.3% 02/06/2021 3,000,000 2,952,090 0.46
United Overseas Bank 2.88% VRN 08/03/2027 1,520,000 1,491,965 0.23
United Overseas Bank 3.5% VRN 16/09/2026 2,800,000 2,823,254 0.44
United Overseas Bank 3.75% VRN 19/09/2024 2,600,000 2,640,802 0.41
United Overseas Bank 3.875% VRN Perp 10,000,000 9,989,730 1.55
Vanke Real Estate Hong Kong 3.975% 09/11/2027 3,800,000 3,789,170 0.59
Want Want China Finance 2.875% 27/04/2022 2,600,000 2,581,550 0.40
Westpac Banking Corporation 5% VRN Perp 4,300,000 4,290,742 0.67
Total bonds* 619,930,336 96.32
Future contracts 1** (2016: 179,195, 0.03%) 125,984 0.02
CBOT US Long Bond Mar 18 (307) 110,328 0.02
CBOT US 5 Year Note Mar 18 (24) 15,656 0.00
Total financial assets designated at fair value through
profit or loss 620,056,320 96.34
Future contracts 1** (2016: (76,827), (0.01%)) (82,420) (0.01)
CBOT US 2 Year Note Mar 18 139 (42,694) (0.01)
CBOT US 10 Year Mar 18 45 (39,726) (0.00)
Total financial liabilities designated at fair value through
profit or loss (82,420) (0.01)
Total financial assets and liabilities designated at fair value
through profit or loss 619,973,900 96.33

First State Asian Quality Bond Fund
Schedule of Investments (continued)
as of 31 December 2017
132
Number of
shares
Fair value
US$
% of net
assets
Cash and other net assets 23,654,766 3.67
Total net assets attributable to redeemable participating
shareholders 643,628,666 100.00
Total cost of financial assets designated at fair value through
profit or loss (2016: 629,831,275) 606,293,731
1 The counterparty for the future contracts is JP Morgan Securities LLC.
Analysis of net investments
% of
total
assets
*Transferable securities admitted to an official stock exchange
listing or traded on a regulated market 619,930,336 96.20
**Financial derivative instruments dealt on a regulated market 43,564 0.01

First State Asian Quality Bond Fund
Portfolio Changes (Unaudited)
133
The schedule of portfolio changes is based on financial assets designated at fair value through
profit or loss
Number of
shares purchased
Number of
shares sold
AIA Group 3.125% 13/03/2023 - 3,000,000
Alibaba Group Holding 3.6% 28/11/2024 - 3,000,000
Alibaba Group Holding 4.5% 28/11/2034 - 14,600,000
Ambank M 3.125% 03/07/2019 - 600,000
APT Pipelines 4.25%15/07/2027 1,090,000 1,090,000
Australia & New Zealand Banking 4.5% 19/03/2024 - 800,000
Australia & New Zealand Banking VRN 30/01/2025 14,250,000 -
Azure Nova International Finance 3.0% 21/03/2020 3,600,000 3,600,000
Azure Nova International Finance 3.5% 21/03/2022 15,500,000 -
Bank of China 4.5% 22/11/2020 8,000,000 -
Bank of China Abu Dhabi 3.6% 30/06/2017 - 1,000,000
Bank Of China Johannesburg 4.88% 20/04/2020 23,000,000 23,000,000
Bank of China Singapore 4% 04/03/2019 - 10,000,000
Bestgain Real Estate 3.95% 23/12/2019 - 850,000
Bestgain Real Estate 4.5% 04/12/2018 - 30,000,000
Bharti Airtel International 5.125% 11/03/2023 - 6,500,000
Bharti Airtel International 5.35% 20/05/2024 6,500,000 6,000,000
BOC Aviation 3.5% 18/09/2027 500,000 -
BPRL International Singapore 4.375% 18/01/2027 2,500,000 -
Busan Bank 4.125% 09/02/2017 - 1,000,000
Charming Light Investments 4.375% 21/12/2027 5,950,000 -
China Cinda Finance 3% 09/03/2020 500,000 500,000
China Cinda Finance 4.1% 09/03/2024 3,600,000 2,000,000
China Cinda Finance 4.25% 23/04/2025 - 1,000,000
China Cinda Finance 4.4% 09/03/2027 3,250,000 3,250,000
China Clean Energy Development 4% 05/11/2025 - 11,600,000
China Construction Bank 3.25% 02/07/2019 - 900,000
China Construction Bank 4.25% VRN 20/08/2024 4,800,000 -
China Construction Bank 4.9% VRN 12/11/2024 1,600,000 1,600,000
China Railway Xunjie 3.25% 28/07/2026 - 3,540,000
China Resources Cement Holdings 2.125% 05/10/2017 - 300,000
China Resources Land 4.375% 27/02/2019 5,000,000 -
China Resources Land 6% 27/02/2024 - 2,000,000
China State Construction Finance 3.375% 29/11/2022 6,200,000 -
China (Govt of) 2.125% 02/11/2022 2,000,000 -
Chinalco Capital Holding 4.25% 21/04/2022 6,000,000 -
CIMB Bank 2.375% 26/07/2017 - 1,800,000
CITIC 2.8% 14/12/2021 10,650,000 -

First State Asian Quality Bond Fund
Portfolio Changes (Unaudited) (continued)
134
Number of
shares purchased
Number of
shares sold
CITIC 3.875% 28/02/2027 950,000 950,000
CITIC 6.625% 15/04/2021 7,000,000 -
CITIC Pacific 6.8% 17/01/2023 - 7,000,000
CNOOC Finance 3.5% 05/05/2025 - 2,800,000
CNOOC Finance 3.875% 02/05/2022 - 3,000,000
CNOOC Finance 4.25% 26/01/2021 - 4,000,000
CNOOC Finance 4.25% 30/04/2024 - 200,000
CNOOC Finance 5.5% 21/05/2033 5,000,000 -
Commonwealth Bank of Australia 4.2% 26/10/2020 22,000,000 -
COSL Finance 3.25% 06/09/2022 - 1,150,000
DBS Bank 3.625% 21/09/2022 - 1,800,000
DBS Group Holdings 3.6% VRN Perp - 9,800,000
Eastern Creation II Investment 2.625% 20/11/2017 7,750,000 7,750,000
Eastern Creation II Investment 3.75% 27/06/2017 - 7,000,000
ENN Energy Holdings 3.25% 24/07/2022 9,400,000 -
Export Import Bank of China 3.375% 14/03/2027 3,500,000 3,500,000
Export Import Bank of India 3.375% 05/08/2026 - 5,900,000
Export-Import Bank of Korea 2.875% 17/09/2018 - 600,000
Export-Import Bank of Korea 3.25% 10/11/2025 - 580,000
Fonterra Co operative Group 4% 02/11/2027 2,100,000 -
Franshion Brilliant 3.60% 03/03/2022 14,800,000 -
Gohl Capital 4.25% 24/01/2027 1,550,000 -
Hana Bank 3.5% 25/10/2017 - 1,000,000
Hana Bank 4.375% 30/09/2024 1,846,000 -
Hong Kong Electric Finance 2.875% 03/05/2026 - 4,800,000
Huarong Finance 3.375% 24/01/2020 10,500,000 5,000,000
Huarong Finance 3.75% 27/04/2022 6,800,000 -
Huarong Finance 4.625% 03/06/2026 5,000,000 5,750,000
Huarong Finance 4.75% 27/04/2027 13,700,000 13,700,000
Huarong Finance 4.95% 07/11/2047 5,300,000 -
Huarong Finance 5.5% 27/04/2047 10,100,000 -
Hutchison Whampoa International 7.45% 24/11/2033 2,044,000 -
Hyundai Capital America 1.75% 27/09/2019 - 4,800,000
Hyundai Capital America 2.75% 27/09/2026 - 5,150,000
Hyundai Capital America 3% 18/03/2021 - 4,800,000
Hyundai Capital Services 2.625% 29/09/2020 - 4,000,000
Hyundai Capital Services 3.0% 09/08/2022 19,800,000 -
Hyundai Capital Services 3.5% 13/09/2017 - 2,000,000
Hyundai Capital Services 3.625% 29/08/2027 10,600,000 -
ICBCIL Finance 3.2% 10/11/2020 4,800,000 5,000,000

First State Asian Quality Bond Fund
Portfolio Changes (Unaudited) (continued)
135
Number of
shares purchased
Number of
shares sold
ICICI Bank Dubai 4% 18/03/2026 - 5,000,000
India (Govt of) 8.08% 02/08/2022 - 330,000,000
India (Govt of) 8.27% 09/06/2020 - 118,500,000
Indonesia Government International Bond 3.4%
29/03/2022 1,600,000 1,600,000
Indonesia Government International Bond 4.15%
29/03/2027 2,100,000 2,100,000
Indonesia Government International Bond 4.75%
08/01/2026 - 900,000
Indonesia Government International Bond 5.95%
08/01/2046 - 7,600,000
Indonesia Government International Bond 7.5%
15/08/2032 42,000,000,000 42,000,000,000
Indonesia Government International Bond 7.875%
15/04/2019 42,000,000,000 124,800,000,000
Indonesia Government International Bond 8.75%
15/05/2031 - 42,700,000,000
JIC Zhixin 3.0% 24/11/2022 5,000,000 -
Kookmin Bank 3.625% 14/01/2017 - 4,100,000
Korea Development Bank 2.5% 11/03/2020 - 350,000
Korea Exchange Bank 3.125% 26/06/2017 - 1,500,000
Korea Hydro & Nuclear Power 3% 19/09/2022 - 800,000
Korea Hydro & Nuclear Power 3.125% 25/07/2027 4,350,000 -
Korea Midland Power 2.5% 21/07/2021 - 1,000,000
Korea National Oil 2.75% 23/01/2019 - 500,000
Korea South-East Power 3.625% 29/01/2017 - 2,000,000
Kowloon Canton Railway 5.125% 20/05/2019 - 640,000
Lembaga Pembiayaan Ekspor 3.875% 06/04/2024 1,000,000 -
Malayan Banking 3% 10/02/2017 - 2,000,000
Malayan Banking 3.25% VRN 20/09/2022 - 3,000,000
MTR 2% 12/04/2017 - 2,200,000
Nan Fung Treasury 3.875% 3/10/2027 9,450,000 -
Nexen 6.4% 15/05/2037 7,600,000 -
Ocean Wealth 5.5% 08/06/2019 5,560,000 -
Oil India International 4% 21/04/2027 4,550,000 -
ONGC Videsh 4.625% 15/07/2024 4,800,000 12,000,000
ONGC Videsh Vankorneft 2.875% 27/01/2022 - 7,580,000
ONGC Videsh Vankorneft 3.75% 27/07/2026 - 2,600,000
Oversea-Chinese Banking 3.15% 11/03/2023 - 3,000,000
Oversea-Chinese Banking 4% 15/10/2024 - 1,600,000
Oversea-Chinese Banking 4.25% 19/06/2024 - 5,000,000
Pelabuhan Indonesia II 4.25% 05/05/2025 - 4,800,000
Pertamina Persero 4.875% 03/05/2022 - 4,000,000
PSA International 3.875% 11/02/2021 - 600,000

First State Asian Quality Bond Fund
Portfolio Changes (Unaudited) (continued)
136
Number of
shares purchased
Number of
shares sold
PTT 3.375% 25/10/2022 - 700,000
PTT 4.5% 25/10/2042 - 2,250,000
Reliance Industries 3.667% 30/11/2027 5,400,000 -
Reliance Industries 4.875% 10/02/2045 - 5,750,000
Reliance Industries 5.875% Perp 5,000,000 -
Rural Electrification Corporation 3.875% 07/07/2027 4,750,000 -
SGSP Australia Assets 3.25% 29/07/2026 - 1,370,000
SGSP Australia Assets 3.75% 27/09/2024 3,870,000 -
Shinhan Bank 2.875% 28/03/2022 4,800,000 4,800,000
Shinsegae 2.625% VRN 08/05/2045 - 2,950,000
Siam Commercial Bank 3.375% 19/09/2017 - 2,050,000
Sinochem Overseas Capital 4.5% 12/11/2020 - 6,500,000
Sinopec Group Overseas Development 2.5% 13/09/2022 10,000,000 -
Sinopec Group Overseas Development 2.75% 29/09/2026 - 4,800,000
Sinopec Group Overseas Development 4.25% 12/04/2047 5,000,000 -
Sinopec Group Overseas Development 4.875% 17/05/2042 - 1,500,000
Starway Assets Enterprises 4.1% 22/01/2017 - 8,000,000
State Grid Overseas Investment 3.50% 04/05/2027 9,700,000 9,700,000
Tencent Holdings 2.875% 11/02/2020 - 1,500,000
Tencent Holdings 3.8% 11/02/2025 - 2,900,000
Thailand Government Bond 2.8% 10/10/2017 - 1,000
United Overseas Bank 2.875% VRN 17/10/2022 - 4,800,000
United Overseas Bank 3.5% VRN 27/02/2029 250,000 250,000
United Overseas Bank 3.875% VRN Perp 10,000,000 -
US Treasury 0.625% 31/05/2017 12,000,000 34,000,000
US Treasury Note 0.625% 30/09/2017 20,000,000 20,000,000
US Treasury Note 0.75% 31/12/2017 35,000,000 35,000,000
US Treasury Note 0.875% 28/02/2017 15,500,000 23,500,000
Vanke Real Estate Hong Kong 3.975% 09/11/27 3,800,000 -
Want Want China Finance 2.875% 27/04/2022 2,600,000 -
Westpac Banking Corporation 4.85% VRN 09/02/2025 3,000,000 -
Westpac Banking Corporation 5% VRN Perp 4,300,000 -
Wharf Finance 4.625% 08/02/2017 - 4,000,000
Wing Hang Bank 6% Perp - 1,870,000
The Schedule of Portfolio Changes in Investments reflects the aggregate purchases of a security
exceeding one percent of the total value of purchases for the year and aggregate sales of a security
exceeding one percent of the total sales for the year.

Stewart Investors Global Emerging Markets Leaders Fund
Investment Manager’s Report (Unaudited)
137
Performance
01/01/14 01/01/15 01/01/16 01/01/17
To To To To
31/12/14 31/12/15 31/12/16 31/12/17
Stewart Investors Global Emerging Markets Leaders
Fund “the Fund”
– Class I 1.63% -10.16% 6.47% 27.22%
– Class III 2.34% -9.50% 7.20% 28.07%
– Class IV 1.39% -10.38% 6.22% 26.94%
MSCI Emerging Markets Index# -1.82% -14.60% 11.60% 37.75%
(Performance calculation is based on official dealing Net asset value (NAV) per share)
#Benchmarks are being included for illustrative purposes and there is no guarantee that a fund will outperform a benchmark
Past performance is no indication of current or future performance and the performance data does not take account of
commissions and costs incurred in the issue and redemption of units.
Emerging Markets rose over the twelve months to 31 December 2017 in US dollar terms. The MSCI
Emerging Markets Index was up by 37.8% over the period. Emerging Asia outperformed, driven by strength in
China and South Korea, while Latin America lagged as Mexico was subdued over the period.
Dr. Reddy’s Laboratories was impacted by continued regulatory and US FDA quality concerns, as well as
reduced profitability, while Nigerian Breweries was weak as International Breweries continued to win market share
in Nigeria. Klabin declined because of disappointing results linked to depressed product prices.
On the positive side, Uni-President Enterprises rose as its business in mainland China continued to
improve. HDFC gained on increased demand due to improved housing affordability which the government is
looking to extend via incentive schemes. Unilever climbed on the back of the acquisition of Carver Korea, a skincare
business in North Asia, and disposal of its spreads business in South Africa.
Over the period, significant purchases included Amorepacific, a family-run company with a strong
franchise and brands. We bought Kuala Lumpur Kepong, a family-owned, palm oil business with a net cash balance
sheet which has displayed financial stewardship in the past. We also bought China Resources Pharmaceutical at
reasonable valuations as the company should be a major beneficiary of consolidation and formalisation of China’s
pharmaceutical market over the long-term.
We sold Antofagasta, Banco Bradesco and China Mengniu Dairy on valuation concerns.
Companies in emerging markets continue to look expensive and we find it difficult to find quality ones
trading at reasonable valuations. As the future is inherently unpredictable, most of our time is spent analysing
history. We focus on the history of key people at companies we invest in, assessing their approach to business risk,
capital allocation and indebtedness. We believe that the best way to reduce risk is to back management who are
conservative, honest and have built resilient businesses.
First State Investment (Hong Kong) Limited
February 2018
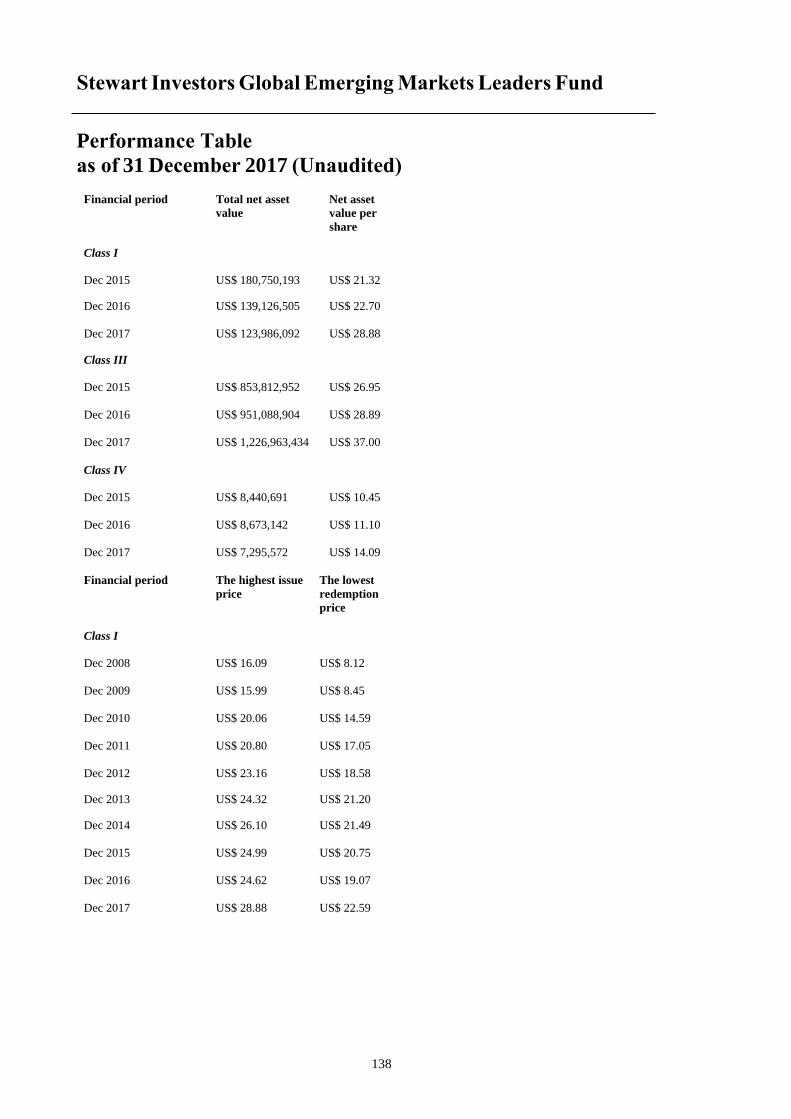
Stewart Investors Global Emerging Markets Leaders Fund
Performance Table
as of 31 December 2017 (Unaudited)
138
Financial period Total net asset
value
Net asset
value per
share
Class I
Dec 2015 US$ 180,750,193 US$ 21.32
Dec 2016 US$ 139,126,505 US$ 22.70
Dec 2017 US$ 123,986,092 US$ 28.88
Class III
Dec 2015 US$ 853,812,952 US$ 26.95
Dec 2016 US$ 951,088,904 US$ 28.89
Dec 2017 US$ 1,226,963,434 US$ 37.00
Class IV
Dec 2015 US$ 8,440,691 US$ 10.45
Dec 2016 US$ 8,673,142 US$ 11.10
Dec 2017 US$ 7,295,572 US$ 14.09
Financial period The highest issue
price
The lowest
redemption
price
Class I
Dec 2008 US$ 16.09 US$ 8.12
Dec 2009 US$ 15.99 US$ 8.45
Dec 2010 US$ 20.06 US$ 14.59
Dec 2011 US$ 20.80 US$ 17.05
Dec 2012 US$ 23.16 US$ 18.58
Dec 2013 US$ 24.32 US$ 21.20
Dec 2014 US$ 26.10 US$ 21.49
Dec 2015 US$ 24.99 US$ 20.75
Dec 2016 US$ 24.62 US$ 19.07
Dec 2017 US$ 28.88 US$ 22.59

Stewart Investors Global Emerging Markets Leaders Fund
Performance Table (continued)
as of 31 December 2017 (Unaudited)
139
Financial period The highest issue
price
The lowest
redemption
price
Class III
Dec 2008 US$ 19.23 US$ 9.74
Dec 2009 US$ 19.34 US$ 10.16
Dec 2010 US$ 24.46 US$ 17.71
Dec 2011 US$ 24.46 US$ 17.71
Dec 2012 US$ 28.66 US$ 22.84
Dec 2013 US$ 30.28 US$ 26.32
Dec 2014 US$ 32.68 US$ 26.80
Dec 2015 US$ 31.44 US$ 26.21
Dec 2016 US$ 31.25 US$ 24.11
Dec 2017 US$ 37.00 US$ 28.75
Class IV
Dec 2011 US$ 10.35 US$ 8.46
Dec 2012 US$ 11.44 US$ 9.20
Dec 2013 US$ 11.99 US$ 10.46
Dec 2014 US$ 12.83 US$ 10.58
Dec 2015 US$ 12.27 US$ 10.17
Dec 2016 US$ 12.05 US$ 9.34
Dec 2017 US$ 14.09 US$ 11.04

Stewart Investors Global Emerging Markets Leaders Fund
Schedule of Investments
as of 31 December 2017
140
The schedule that follows includes financial assets designated at fair value through profit or loss
Number of
shares
Fair value
US$
% of net
assets
Australia (2016: 9,392,354, 0.85%) 30,021,430 2.21
Newcrest Mining 1,682,859 30,021,430 2.21
Brazil (2016: 87,376,677, 7.95%) 60,556,654 4.46
Klabin 5,740,700 30,501,991 2.25
Natura Cosmeticos 3,011,330 30,054,663 2.21
China (2016: 28,105,466, 2.56%) - - -
Chile (2016: 56,687,908, 5.16%) 52,339,604 3.85
Aguas Andinas 26,460,800 17,469,366 1.28
Cia Cervecerias Unidas 2,317,476 34,870,238 2.57
Hong Kong (2016: 78,389,673, 7.13%) 98,275,216 7.23
China Resources Pharmaceutical Group 16,350,333 21,171,031 1.56
Dairy Farm International Holdings 3,153,700 24,788,082 1.82
Hong Kong & China Gas 14,065,442 27,570,653 2.03
Li & Fung 45,082,000 24,745,450 1.82
India (2016: 254,552,929, 23.16%) 351,191,957 25.86
Cipla 3,600,624 34,326,579 2.53
Colgate-Palmolive 938,953 16,181,870 1.19
Dr Reddys Laboratories 633,860 23,975,008 1.77
Federal Bank 3,287,242 5,587,964 0.41
Housing Development Finance 508,826 13,635,126 1.00
Idea Cellular 18,320,010 31,041,621 2.29
Infosys Technologies 2,169,854 35,425,112 2.61
Mahindra & Mahindra 2,619,648 30,827,114 2.27
Tata Consultancy Services 1,598,355 67,642,889 4.98
Tata Global Beverages 718,741 3,562,879 0.26
Tata Power 35,560,687 52,092,346 3.84
Tech Mahindra 1,760,885 13,905,826 1.02
United Breweries 1,359,817 22,987,623 1.69
Japan (2016: 15,672,104, 1.43%) - - -

Stewart Investors Global Emerging Markets Leaders Fund
Schedule of Investments (continued)
as of 31 December 2017
141
Number of
shares
Fair value
US$
% of net
assets
Malaysia (2016: 12,151,594, 1.11%) 41,976,401 3.09
Axiata Group 10,045,263 13,627,006 1.00
Kuala Lumpur Kepong 4,589,200 28,349,395 2.09
Mexico (2016: 20,482,330, 1.86%) 24,973,984 1.84
Grupo Financiero Santander ADR 2,018,963 14,294,258 1.05
Kimberly-Clark de Mexico 6,205,866 10,679,726 0.79
Netherlands (2016: 16,668,616, 1.52%) 23,574,550 1.73
Heineken Holding 238,830 23,574,550 1.73
Nigeria (2016: 11,340,041, 1.03%) 22,867,532 1.68
Guaranty Trust Bank 89,883,246 10,164,640 0.75
Nigerian Breweries 33,789,693 12,702,892 0.93
Papua New Guinea (2016: Nil) 14,925,976 1.10
Oil Search 2,450,966 14,925,976 1.10
Philippines (2016: Nil) 7,441,154 0.55
Universal Robina 2,455,630 7,441,154 0.55
Poland (2016: 29,752,252, 2.71%) 26,175,992 1.93
Bank Pekao 701,857 26,175,992 1.93
Russia (2016: Nil) 11,279,700 0.83
Magnit GDR 415,000 11,279,700 0.83
South Africa (2016: 76,332,678, 6.95%) 90,404,630 6.65
Spar Group 944,228 15,602,591 1.15
Standard Bank 1,970,873 31,338,562 2.30
Tiger Brands 1,162,648 43,463,477 3.20
South Korea (2016: 52,321,397, 4.76%) 116,408,515 8.57
Amore Pacific Group 187,817 24,839,091 1.83
KT Corporation 3,940 111,790 0.01
KT Corporation ADR 1,884,372 29,301,985 2.16
Remgro 3,240,785 62,155,649 4.57
Switzerland (2016: 28,776,402, 2.62%) 24,683,410 1.82
Coca-Cola 759,471 24,683,410 1.82

Stewart Investors Global Emerging Markets Leaders Fund
Schedule of Investments (continued)
as of 31 December 2016
142
Number of
shares
Fair value
US$
% of net
assets
Taiwan (2016: 97,763,969, 8.90%) 155,740,832 11.47
Asustek Computer 3,302,000 31,128,879 2.30
MediaTek 3,645,000 36,145,102 2.66
President Chain Store 1,803,000 17,271,047 1.27
Uni-President Enterprises 31,982,018 71,195,804 5.24
Turkey (2016: 34,451,868, 3.13%) 25,235,041 1.86
Anadolou Efes Biracilik 3,907,291 25,235,041 1.86
United Kingdom (2016: 83,494,088, 7.60%) 69,404,205 5.11
Tullow Oil 7,534,266 20,917,641 1.54
Unilever 869,829 48,486,564 3.57
Total financial assets designated at fair value through
profit or loss*
1,247,476,783 91.84
Cash and other net assets 110,768,315 8.16
Total net assets attributable to redeemable participating
shareholders
1,358,245,098 100.00
Total cost of financial assets designated at fair value
through profit or loss (2016: 1,090,666,305) 1,122,414,540
Analysis of net investments
% of total
assets
*Transferable securities admitted to an official stock
exchange listing or traded on a regulated market 1,247,476,783 91.27

Stewart Investors Global Emerging Markets Leaders Fund
Portfolio Changes (Unaudited)
143
The schedule of portfolio changes is based on financial assets designated at fair value through
profit or loss
Number of
shares purchased
Number of
shares sold
Aguas Andinas 4,013,191 -
Akbank - 6,571,828
Amore Pacific Group 187,817 -
AngloGold Ashanti - 190,586
Antofagasta - 2,358,369
Asustek Computer 425,000 -
Axiata Group 5,352,300 6,856,200
Banco Bradesco 224,646 3,954,509
Bank Pekao - 279,558
China Mengniu Dairy - 14,587,000
China Resources Pharmaceutical Group 16,350,333 -
Cia Cervecerias Unidas - 216,404
Cia Cervecerias Unidas ADR - 377,883
Cipla 1,290,470 -
Coca-Cola - 576,160
Colgate-Palmolive 938,953 -
Dairy Farm International Holdings 112,700 212,500
Empresa Nacional De Telecom - 1,011,898
Engie Brasil - 816,200
Federal Bank 3,287,242 -
Giant Manufacturing - 1,465,000
Grupo Financiero Santander ADR 421,716 1,275,450
Guaranty Trust Bank 452,528 -
Hong Kong & China Gas 1,278,676 -
Housing Development Finance - 2,331,936
Idea Cellular 5,530,962 -
IDFC - 2,781,130
Impala Platinum Holdings - 1,226,767
Infosys Technologies 1,430,498 1,023,225
Kimberly-Clark de Mexico 6,205,866 -
Klabin 1,235,900 -
KT Corporation ADR 1,281,409 -
Kuala Lumpur Kepong 4,589,200 -
Li & Fung 2,986,000 -
Magnit 415,000 -
Mahindra & Mahindra 2,010,481 -
MediaTek 577,000 419,000
Natura Cosmeticos 521,398 433,813

Stewart Investors Global Emerging Markets Leaders Fund
Portfolio Changes (Unaudited) (continued)
144
Number of
shares purchased
Number of
shares sold
Nestle India - 51,896
Newcrest Mining 1,041,249 -
Nigerian Breweries 24,956,443 -
Oil Search 2,450,966 -
President Chain Store 1,803,000 -
Remgro 1,428,070 -
Shinhan Financial Group - 376,443
Spar Group 944,228 -
Standard Bank - 1,376,816
Tata Consultancy Services 801,160 26,908
Tata Global Beverages 718,741 -
Tata Power 2,747,871 -
Tech Mahindra - 813,659
Tiger Brands 211,181 192,414
Tullow Oil 4,857,930 -
Tullow Oil Rights 4,946,930 4,946,930
Unicharm - 715,800
Unilever - 457,600
Uni-President Enterprises 6,226,000 -
United Breweries 301,612 -
Universal Robina 2,455,630 -
Yue Yuen Industrial Holdings 1,562,000 5,370,500
The Schedule of Portfolio Changes in Investments reflects the aggregate purchases of a security
exceeding one percent of the total value of purchases for the year and aggregate sales of a security
exceeding one percent of the total sales for the year.

First State Global Resources Fund
Investment Manager’s Report (Unaudited)
145
Performance
01/01/14 01/01/15 01/01/16 01/01/17
To To To To
31/12/14 31/12/15 31/12/16 31/12/17
First State Global Resources Fund “the Fund”
– Class I -13.05% -34.94% 40.49% 18.80%
– Class III -12.45% -34.64% 41.32% 19.75%
– Class IV -13.20% -35.16% 40.11% 18.55%
Customised Benchmark#* -16.67% -35.88% 54.23% 25.64%
(Performance calculation is based on official dealing Net asset value (NAV) per share)
#Benchmarks are being included for illustrative purposes and there is no guarantee that a fund will outperform a benchmark
*75% Euromoney Global Mining Index & 25% MSCI AC World Energy Index
Past performance is no indication of current or future performance and the performance data does not take account of
commissions and costs incurred in the issue and redemption of units.
Global commodity markets were mostly stronger over the 12 months period to 31 December 2017,
supported by firmer expectations of global synchronised growth, as well as firm demand as markets struggled with
supply disruptions.
During a volatile 12 months, Iron Ore finished -9.3% lower at US$72.78/t. Base metals mostly performed
well, led by Aluminium (+30.8%), Copper (+30.1%), Zinc (+29.1%) and Lead (+25.7%). Gold added 13.6%, while
Silver and Platinum lagged, adding 3.9% and 3.6% respectively. WTI Crude performed well in the second half of
the year to finish 12.5% higher at US$60.46/bbl – its highest level since July 2015. Thermal coal added +15.1%,
while Coking Coal added 10.0%. Natural gas was one of the few commodities to finish the period lower, falling -
20.7%, as mild weather conditions diminished electricity demand for cooling or heating.
The quality bias of the portfolio has held back relative performance as the mining sector recovery which
began in 2016 continued to unfold in 2017. This can be seen in negative attribution generated by the underweight
position in leveraged Anglo American for example.
Gold was a laggard in the mining sector, significantly underperforming base metals. Particularly impacted
were smaller precious metal developers like MAG Silver, Detour, Beadell Resources and TMAC. In some cases the
companies have compounded the negative trend by under-delivering against expectations. We used the share price
weakness as an opportunity to add to MAG, TMAC and Detour.
In the energy sector, negative performance has been generated by VII Generation and ARC Resources.
Both companies are slowing their growth profiles and the market has de-rated the shares. This negative performance
was partly offset by strong contributions from Canadian Natural Resources which is ramping up the third phase of
its Horizon project, and from Rice Energy which was acquired by EQT for its highly attractive Marcellus gas
exposure.
The main positive contributions to performance came from the portfolio’s holdings in base metal
companies such as copper producers Lundin Mining and First Quantum, and zinc producer Trevali. This was further
complemented by strong performance by certain small caps such as Integra Gold which was acquired by Eldorado.
We have gradually reduced the portfolio’s exposure to the larger cap (‘oak trees’) in favour of higher
growth ‘acorns’ (small cap) and ‘saplings’ (mid-cap) with high-quality assets, low-cost development projects and
solid balance sheets. In the initial phases of a recovery, they are laggards but, as the industry improves, we anticipate
that companies such as TMAC Resources, Pretium Resources, MAG Silver, First Quantum or Petra Diamonds, who
have been investing through the downturn, will be well rewarded by the market.

First State Global Resources Fund
Investment Manager’s Report (Unaudited) (continued)
146
Smaller companies are inherently higher risk, but catalysts such as exploration success, permitting and
development, or operational turnarounds are drivers of the ‘acorns’ and ‘saplings’ in the portfolio. These types of
catalyst-rich names could also increasingly be of interest from an M&A perspective, as larger companies look to
replenish their capital-starved project pipelines. We observe that for the first time in several years exploration
spending is up, which bodes well for the small and mid-cap companies in the portfolio.
We are broadly constructive on the outlook for the mining sector. Positive global economic indicators
suggest that the synchronous recovery in both developed and developing economies will continue in 2018. This
should be supportive for both commodity prices and resources equities. The primary risks to be cognisant of are a
slowdown in the Chinese economy, global protectionism and rising interest rates. Thematics to watch in 2018 are
likely to include ongoing supply constraint from miners and Chinese processing companies, a pick-up in merger
and acquisition activity, inflation, and cash returns to shareholders.
First State Investment (Hong Kong) Limited
February 2018
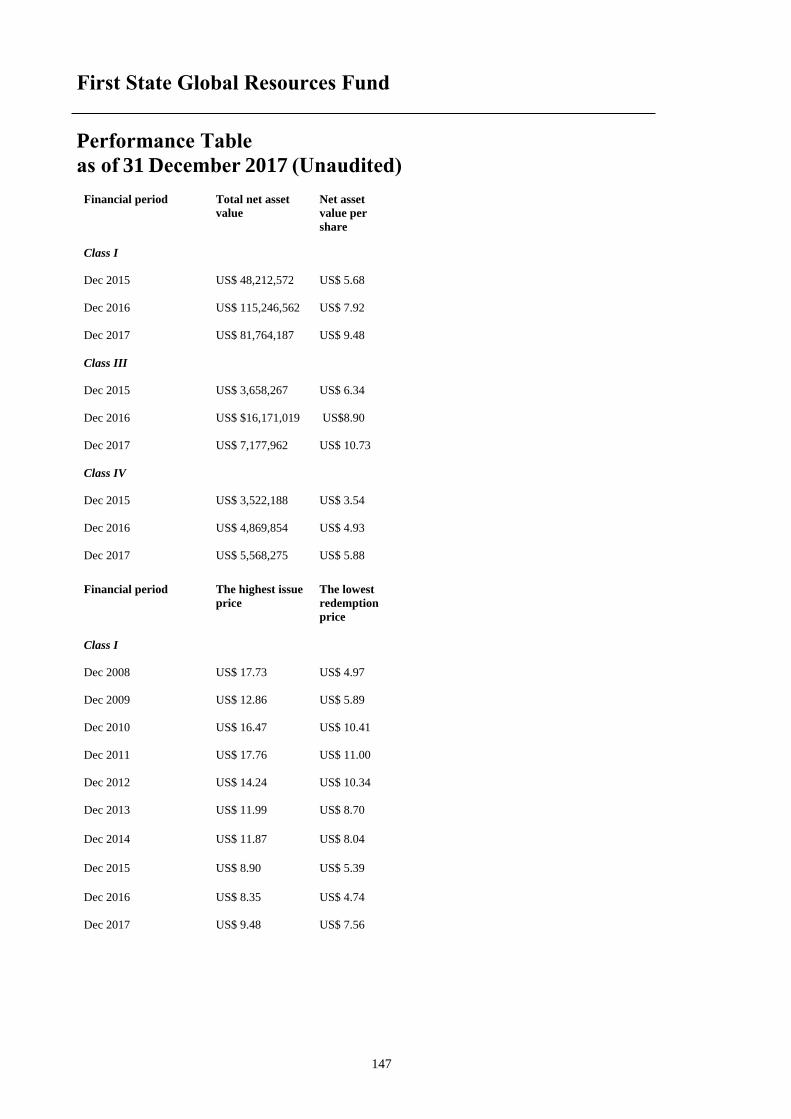
First State Global Resources Fund
Performance Table
as of 31 December 2017 (Unaudited)
147
Financial period Total net asset
value
Net asset
value per
share
Class I
Dec 2015 US$ 48,212,572 US$ 5.68
Dec 2016 US$ 115,246,562 US$ 7.92
Dec 2017 US$ 81,764,187 US$ 9.48
Class III
Dec 2015 US$ 3,658,267 US$ 6.34
Dec 2016 US$ $16,171,019 US$8.90
Dec 2017 US$ 7,177,962 US$ 10.73
Class IV
Dec 2015 US$ 3,522,188 US$ 3.54
Dec 2016 US$ 4,869,854 US$ 4.93
Dec 2017 US$ 5,568,275 US$ 5.88
Financial period The highest issue
price
The lowest
redemption
price
Class I
Dec 2008 US$ 17.73 US$ 4.97
Dec 2009 US$ 12.86 US$ 5.89
Dec 2010 US$ 16.47 US$ 10.41
Dec 2011 US$ 17.76 US$ 11.00
Dec 2012 US$ 14.24 US$ 10.34
Dec 2013 US$ 11.99 US$ 8.70
Dec 2014 US$ 11.87 US$ 8.04
Dec 2015 US$ 8.90 US$ 5.39
Dec 2016 US$ 8.35 US$ 4.74
Dec 2017 US$ 9.48 US$ 7.56

First State Global Resources Fund
Performance Table (continued)
as of 31 December 2017 (Unaudited)
148
Financial period The highest issue
price
The lowest
redemption
price
Class III
Dec 2008 US$ 18.85 US$ 5.30
Dec 2009 US$ 13.82 US$ 6.30
Dec 2010 US$ 17.82 US$ 11.22
Dec 2011 US$ 19.26 US$ 11.97
Dec 2012 US$ 15.53 US$ 11.31
Dec 2013 US$ 13.16 US$ 9.57
Dec 2014 US$ 13.15 US$ 8.93
Dec 2015 US$ 9.91 US$ 6.02
Dec 2016 US$ 9.38 US$ 5.29
Dec 2017 US$ 10.73 US$ 8.52
Class IV
Dec 2011 US$ 10.65 US$ 6.94
Dec 2012 US$ 8.97 US$ 6.50
Dec 2013 US$ 7.53 US$ 5.46
Dec 2014 US$ 7.43 US$ 5.02
Dec 2015 US$ 5.56 US$ 3.36
Dec 2016 US$ 5.19 US$ 2.95
Dec 2017 US$ 5.88 US$ 4.69

First State Global Resources Fund
Schedule of Investments
as of 31 December 2017
149
The schedule that follows includes financial assets designated at fair value through profit or loss
Number of
shares
Fair value
US$
% of net
assets
Australia (2016: 29,598,574, 21.72%) 24,157,480 25.56
Beadell Resources 3,347,755 471,080 0.50
BHP Billiton NPV 284,996 6,588,068 6.97
BHP Billiton Ordinary 132,689 2,710,534 2.87
Evolution Mining 186,592 386,551 0.41
Independence Group 249,254 927,507 0.98
Metro Mining 4,200,401 853,753 0.90
Mineral Deposits 668,403 543,425 0.57
Paringa Resources 969,480 310,735 0.33
Rio Tinto 130,910 7,758,313 8.21
Sundance Energy 1,735,406 100,392 0.11
West African Resources 4,353,139 1,395,258 1.48
Western Areas 517,003 1,309,502 1.38
Whitehaven Coal 230,127 802,362 0.85
Brazil (2016: 4,248,822, 3.12%) 4,555,710 4.82
Vale SA 374,032 4,555,710 4.82
Canada (2016: 52,910,900, 38.82%) 40,806,486 43.18
Agnico Eagle Mines 34,189 1,587,585 1.68
Alamos Gold 196,600 1,283,112 1.36
Almonty Industries 146,615 64,338 0.07
Arc Resources 34,537 412,234 0.44
Cameco 149,525 1,404,164 1.49
Canadian Natural Resources 66,178 2,380,792 2.52
Detour Gold 118,838 1,370,096 1.45
Enbridge 55,193 2,171,874 2.30
Endeavour Mining 50,300 1,043,042 1.10
Erdene Resource Development 897,900 401,184 0.42
Ero Copper 145,170 864,059 0.91
First Quantum Minerals 185,994 2,659,283 2.81
Franco-Nevada 30,371 2,425,609 2.57
Gibson Energy 27,216 391,297 0.41

First State Global Resources Fund
Schedule of Investments (continued)
as of 31 December 2017
150
Number of
shares
Fair value
US$
% of net
assets
Canada (Continued)
Gold 177,504 2,263,146 2.39
Highland Copper 2,477,994 286,679 0.30
Hudbay Minerals 114,476 1,036,664 1.10
Ivanhoe Mines 145,126 508,320 0.54
Kennady Diamonds 13,168 32,044 0.03
Lucara Diamond 151,968 338,286 0.36
Lundin Mining 112,464 761,814 0.81
Mag Silver 190,400 2,347,054 2.48
Mountain Province Diamonds 244,226 672,262 0.71
OceanaGold 178,186 470,575 0.50
Prairiesky Royalty 35,111 903,723 0.96
Pretium Resources 130,900 1,494,538 1.58
Seven Generations Energy 63,974 922,336 0.98
Silver Wheaton 73,427 1,630,409 1.73
Suncor Energy 60,075 2,211,562 2.34
Teck Resources 123,609 3,298,936 3.49
TMAC Resourcs 182,434 1,388,615 1.47
Torex Gold Resources 38,934 353,818 0.37
Trevali Mining 1,233,500 1,427,036 1.51
China (2016: 1,229,668, 0.90%) - - -
Denmark (2016: 208,875, 0.15%) 541,222 0.57
Vestas Windsystems 7,925 541,222 0.57
France (2016:Nil) 1,048,229 1.11
Total SA 18,878 1,048,229 1.11
Luxembourg (2016: 759,996, 0.56%) 546,149 0.58
Tenaris 34,470 546,149 0.58
Mexico (2016: 2,388,133, 1.76%) 508,607 0.54
Fresnillo 26,878 508,607 0.54
Netherlands (2016: 568,029, 0.42%) - - -
South Africa (2016: 404,983, 0.30%) 219,205 0.23
Royal Bafokeng Platinum 96,333 219,205 0.23

First State Global Resources Fund
Schedule of Investments (continued)
as of 31 December 2017
151
Number of
shares
Fair value
US$
% of net
assets
South Korea (2016: 2,540,511, 1.86%) 505,609 0.53
LG Chemical 1,331 505,609 0.53
Spain (2016: 787,671, 0.58%) 630,538 0.67
Acerinox 44,044 630,538 0.67
Sweden (2016: 2,096,388, 1.54%) 371,629 0.39
Boliden 10,836 371,629 0.39
Switzerland (2016: 6,346,691, 4.65%) 3,621,471 3.83
Glencore Xstrata 693,683 3,621,471 3.83
United Kingdom (2016: 5,758,819, 4.22%) 2,776,116 2.94
Anglo American 32,981 685,523 0.73
Antofagasta 85,447 1,146,936 1.21
Petra Diamonds 890,650 943,657 1.00
United States (2016: 21,510,859, 15.78%) 13,709,343 14.51
Chevron 28,473 3,575,639 3.78
Concho Resources 14,024 2,122,252 2.25
EQT 8,155 466,955 0.49
Exxon Mobil 19,914 1,673,174 1.77
Halliburton 24,696 1,199,485 1.27
Patterson UTI Energy 43,522 986,209 1.04
Schlumberger 14,069 949,095 1.01
Southern Copper 57,454 2,736,534 2.90
Total financial assets designated at fair value through
profit or loss* 93,997,794 99.46
Cash and other net assets 512,630 0.54
Total net assets attributable to redeemable participating
shareholders 94,510,424 100.00
Total cost of financial assets designated at fair value
through profit or loss (2016: 133,266,139) 83,655,835

First State Global Resources Fund
Schedule of Investments (continued)
as of 31 December 2017
152
Analysis of net investments
% of total
assets
*Transferable securities admitted to an official stock
exchange listing or traded on a regulated market 93,997,794 98.39

First State Global Resources Fund
Portfolio Changes (Unaudited)
153
The schedule of portfolio changes is based on financial assets designated at fair value through
profit or loss
Number of
shares purchased
Number of
shares sold
Acacia Mining 42,118 165,370
Acerinox 42,357 43,417
Agnico Eagle Mines 29,414 28,249
Alamos Gold 191,200 228,200
Almonty Industries 1,500 500
Alumina 8,619 349,442
Anglo American 62,533 125,370
Anglo American Platinum 15,298 15,298
Antofagasta 58,946 193,675
Arc Resources 21,558 65,458
Beadell Resources 3,779,849 2,208,963
BHP Billiton 240,821 337,433
BHP Billiton Ordinary 95,005 193,521
Boliden 17,574 86,792
Cameco 122,911 275,051
Canadian Natural Resources 70,119 59,785
Capstone Mining 101,307 563,682
Chevron 20,410 31,291
China Shenhua Energy 595,500 1,248,500
Concho Resources 8,462 16,529
Copper Mountain Mining 111,754 604,305
Core Laboratories 803 5,535
Denison Mines 74,277 595,766
Detour Gold 109,709 108,979
EDP Renovaveis 1,389 30,920
Eldorado Gold 65,126 65,126
Enbridge 68,238 76,183
Endeavour Mining 35,600 68,100
EQT 10,305 2,150
Erdene Resource Development 988,000 90,100
Ero Copper 145,170 -
Evolution Mining 136,459 433,775
Exxon Mobil 18,639 72,023
First Quantum Minerals 193,257 280,992
Fortescue Metals Group 133,767 420,383
Franco-Nevada 16,843 52,114
Fresnillo 14,125 39,236
Gibson Energy 33,050 101,484

First State Global Resources Fund
Portfolio Changes (Unaudited) (continued)
154
Number of
shares purchased
Number of
shares sold
Glencore Xstrata 707,569 1,865,813
Gold 97,427 167,586
Grupo Mexico 68,400 391,500
Halliburton 30,185 26,500
Highland Copper 2,273,494 140,000
Hudbay Minerals 192,234 77,758
Iluka Resources 143,183 309,700
Independence Group 497,471 529,497
Industrias Penoles 9,780 48,135
Integra Gold 33,000 1,565,412
Ivanhoe Mines 302,626 157,500
Kaz Minerals 98,483 98,483
Kennady Diamonds 701 8,352
Korea Zinc 460 5,250
LG Chemical 848 2,556
Lucara Diamond 96,131 297,370
Lundin Mining 132,643 463,301
Mag Silver 207,300 95,000
Metro Mining 4,528,885 328,484
Mineral Deposits 1,442,441 1,089,990
Mountain Province Diamonds 250,013 141,979
Nexa Resources 18,988 18,988
Nucor 2,053 11,489
OceanaGold 146,500 304,300
Paringa Resources 1,024,340 54,860
Patterson UTI Energy 54,264 39,904
Petra Diamonds 1,005,697 756,674
Peyto Exploration and Develpoment 5,267 45,742
Prairiesky Royalty 26,799 44,615
Pretium Resources 99,400 169,100
Rice Energy 80,711 80,711
Rio Tinto 90,689 148,916
Royal Bafokeng Platinum 13,560 72,749
Royal Dutch Shell 'B' 245 25,595
Schlumberger 7,796 17,738
Senex Energy 19,255 539,433
Seven Generations Energy 89,477 62,585
Silver Wheaton 46,320 83,500
South32 302,285 1,903,643
Southern Copper 43,942 61,030

First State Global Resources Fund
Portfolio Changes (Unaudited) (continued)
155
Number of
shares purchased
Number of
shares sold
Suncor Energy 38,908 98,021
Sundance Energy 1,280,876 2,081,701
Tahoe Resources 11,366 59,495
Teck Resources 115,020 146,464
Tenaris 33,428 41,418
TMAC Resourcs 56,850 56,900
Torex Gold Resources 35,200 58,900
Total SA 23,889 5,011
Trevali Mining 1,814,500 2,054,500
Trican Well Service 298,734 298,734
Vale 535,528 743,568
Vestas Windsystems 12,804 8,087
West African Resources 47,587 388,604
Western Areas 652,920 611,364
Whitecap Resources 33,548 170,069
Whitehaven Coal 316,964 408,423
The Schedule of Portfolio Changes in Investments reflects the aggregate purchases of a security
exceeding one percent of the total value of purchases for the year and aggregate sales of a security
exceeding one percent of the total sales for the year.

First State Global Property Securities Fund
Investment Manager’s Report (Unaudited)
156
Performance
01/01/14 01/01/15 01/01/16 01/01/17
To To To To
31/12/14 31/12/15 31/12/16 31/12/17
First State Global Property Securities Fund “the Fund”
– Class I* 16.70% 0.17% -2.14% 10.75%
– Class VI (Dist)**^ n/a -2.55% -1.26% 11.60%
FTSE EPRA/NAREIT Developed Index*# 14.72% 0.05% 4.99% 10.36%
FTSE EPRA/NAREIT Developed Index**# n/a -0.97% 4.99% 10.36%
(Performance calculation is based on official dealing NAV per share)
^Dividend adjustment return
*Inception date – 17 January 2014
**Inception date – 5 March 2015.
#Benchmarks are being included for illustrative purposes and there is no guarantee that a fund will outperform a benchmark
Past performance is no indication of current or future performance and the performance data does not take account of
commissions and costs incurred in the issue and redemption of units.
After a volatile 2016, global REITs rallied through to June 2017 as longer-term US rates unexpectedly
trended lower. After then trading in a tight range, global REITs jumped in November/December on takeover activity
before falling away in late December as longer-term yields rose with the US tax cuts sparking inflationary fears.
The Fund rose 10.8% over the 2017 calendar year, compared with a return of 10.4% by its benchmark
index.
UNITE Group, was the strongest contributor last year. Stronger rental growth guidance and 99%
occupancy helped confirm our investment thesis.
Other strong contributors were the Fund’s holdings of data centres Equinix, CyrusOne, and European
leader Interxion. Growing demand for data centre services in the US and Europe continues to buoy this specialist
sub-sector.
With the USD depreciating against all major currencies over 2017, the detractors were dominated by Fund
holdings of US Retail/Office REITs. Tanger Factory Outlet Centers, Simon Property Group and GGP were affected
by investor concerns over e-commerce threats and a challenging outlook for US retailers. We believe REITs with
high quality real estate will weather these challenges - confirmed by M&A activity and broker upgrades towards
year end.
Mack-Cali Realty and Vornado Realty Trust suffered price weakness on concerns over exposure to New
Jersey and New York office markets respectively. Vornado underperformed despite a dividend hike and its spinoff
to become more Big Apple focussed.
The Fund established new positions in:-
• Invitation Homes. We see attractive synergies from its announced merger with competitor, Starwood
Waypoint.
• Host Hotels and Resorts. Earnings growth catalysts, in our view, include revenue per room acceleration,
improving corporate profits and tax cuts, and margin improvement from the Starwood/Marriott integration and more
focused asset management efforts.
• Kimco Realty. Investors undervalue retail REITs, such as Kimco, with its quality portfolio of mostly
grocery-anchored shopping centres.
Exits from the Fund included Essex Property Trust, CyrusOne and CapitaLand Mall Trust – all had
performed well and approached our fair valuation levels.

First State Global Property Securities Fund
Investment Manager’s Report (Unaudited) (continued)
157
The strategy retains exposure to very high quality assets in high barrier to entry urban locations in the
world’s most bustling cities.
With tax cuts adding to broader corporate earnings growth, we expect 2018 to be another year of relative
underperformance for US real estate stocks versus the broader equity market. More significant US sector exposures
include high quality data centres and lodging/hotel property stocks.
In the UK/Europe, our strategy is to look for individual investment strategies with inherent growth, such as
student accommodation, shopping centres, and Paris and Madrid office buildings.
Within Asia, the strategy is to have a balanced portfolio with exposure to both quality defensive names and
stocks with strong growth potential in the region.
First State Investment (Hong Kong) Limited
February 2018
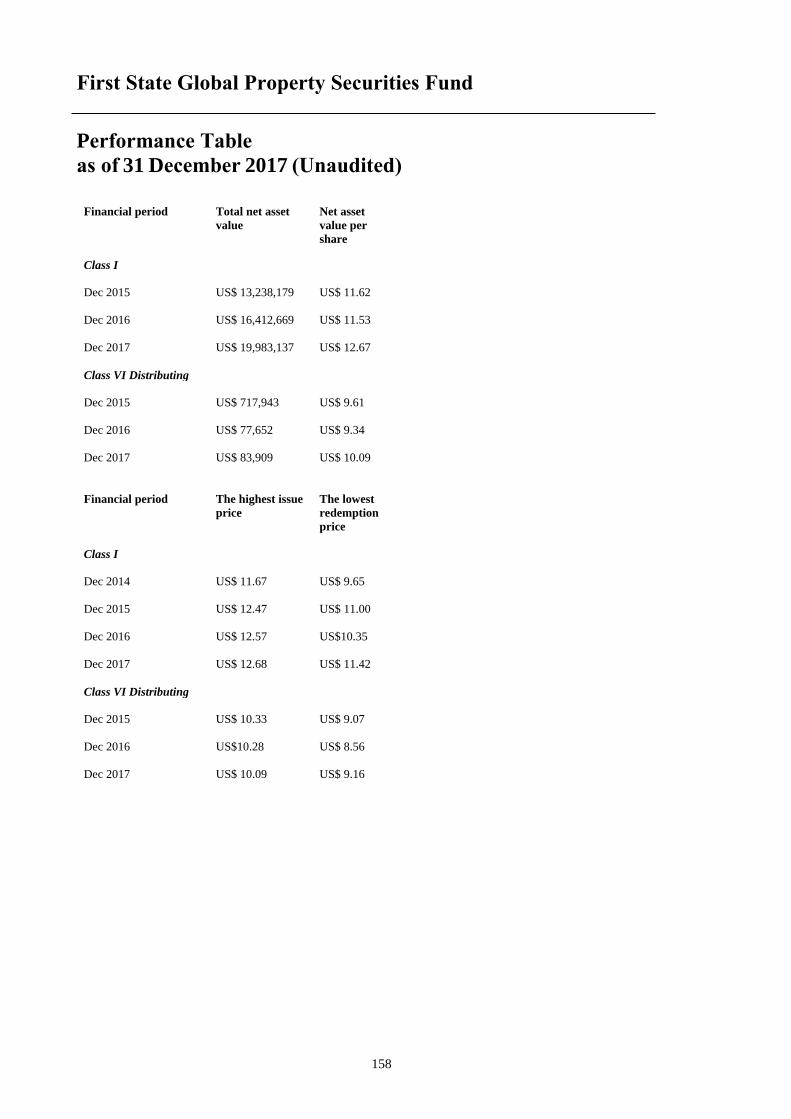
First State Global Property Securities Fund
Performance Table
as of 31 December 2017 (Unaudited)
158
Financial period Total net asset
value
Net asset
value per
share
Class I
Dec 2015 US$ 13,238,179 US$ 11.62
Dec 2016 US$ 16,412,669 US$ 11.53
Dec 2017 US$ 19,983,137 US$ 12.67
Class VI Distributing
Dec 2015 US$ 717,943 US$ 9.61
Dec 2016 US$ 77,652 US$ 9.34
Dec 2017 US$ 83,909 US$ 10.09
Financial period The highest issue
price
The lowest
redemption
price
Class I
Dec 2014 US$ 11.67 US$ 9.65
Dec 2015 US$ 12.47 US$ 11.00
Dec 2016 US$ 12.57 US$10.35
Dec 2017 US$ 12.68 US$ 11.42
Class VI Distributing
Dec 2015 US$ 10.33 US$ 9.07
Dec 2016 US$10.28 US$ 8.56
Dec 2017 US$ 10.09 US$ 9.16
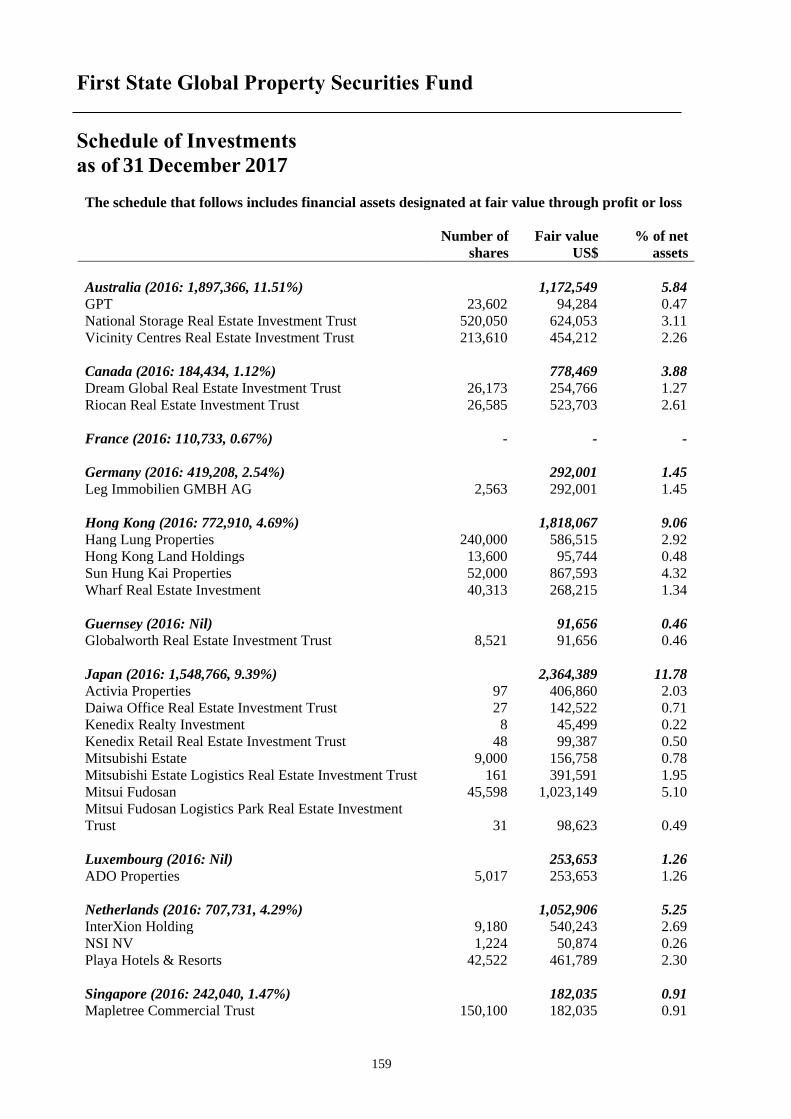
First State Global Property Securities Fund
Schedule of Investments
as of 31 December 2017
159
The schedule that follows includes financial assets designated at fair value through profit or loss
Number of
shares
Fair value
US$
% of net
assets
Australia (2016: 1,897,366, 11.51%) 1,172,549 5.84
GPT 23,602 94,284 0.47
National Storage Real Estate Investment Trust 520,050 624,053 3.11
Vicinity Centres Real Estate Investment Trust 213,610 454,212 2.26
Canada (2016: 184,434, 1.12%) 778,469 3.88
Dream Global Real Estate Investment Trust 26,173 254,766 1.27
Riocan Real Estate Investment Trust 26,585 523,703 2.61
France (2016: 110,733, 0.67%) - - -
Germany (2016: 419,208, 2.54%) 292,001 1.45
Leg Immobilien GMBH AG 2,563 292,001 1.45
Hong Kong (2016: 772,910, 4.69%) 1,818,067 9.06
Hang Lung Properties 240,000 586,515 2.92
Hong Kong Land Holdings 13,600 95,744 0.48
Sun Hung Kai Properties 52,000 867,593 4.32
Wharf Real Estate Investment 40,313 268,215 1.34
Guernsey (2016: Nil) 91,656 0.46
Globalworth Real Estate Investment Trust 8,521 91,656 0.46
Japan (2016: 1,548,766, 9.39%) 2,364,389 11.78
Activia Properties 97 406,860 2.03
Daiwa Office Real Estate Investment Trust 27 142,522 0.71
Kenedix Realty Investment 8 45,499 0.22
Kenedix Retail Real Estate Investment Trust 48 99,387 0.50
Mitsubishi Estate 9,000 156,758 0.78
Mitsubishi Estate Logistics Real Estate Investment Trust 161 391,591 1.95
Mitsui Fudosan 45,598 1,023,149 5.10
Mitsui Fudosan Logistics Park Real Estate Investment
Trust 31 98,623 0.49
Luxembourg (2016: Nil) 253,653 1.26
ADO Properties 5,017 253,653 1.26
Netherlands (2016: 707,731, 4.29%) 1,052,906 5.25
InterXion Holding 9,180 540,243 2.69
NSI NV 1,224 50,874 0.26
Playa Hotels & Resorts 42,522 461,789 2.30
Singapore (2016: 242,040, 1.47%) 182,035 0.91
Mapletree Commercial Trust 150,100 182,035 0.91

First State Global Property Securities Fund
Schedule of Investments (continued)
as of 31 December 2017
160
Number of
shares Fair value US$
% of net
assets
Spain (2016: Nil) 424,872 2.12
Inmobiliaria Colonial 43,085 424,872 2.12
United Kingdom (2016: 1,657,896, 10.06%) 1,405,476 7.00
Hammerson Real Estate Investment Trust 81,822 604,081 3.01
Unite Group 74,127 801,395 3.99
United States (2016: 7,879,881, 47.78%) 9,655,805 48.12
American Homes 4 Rent 18,170 397,741 1.98
Diamondrock Hospitality 17,283 197,718 0.99
Equinix 2,856 1,299,794 6.48
Hilton Worldwide Holdings 3,652 293,803 1.46
Host Marriott 40,443 813,713 4.05
Hudson Pacific Properties 22,556 771,641 3.85
Invitation Homes Real Estate Investment Trust 42,667 1,006,941 5.02
Kilroy Realty 8,516 633,165 3.16
Kimco Realty 38,771 712,223 3.55
Regency Centers 8,622 598,539 2.98
Simon Property Group 8,399 1,437,489 7.16
UDR 19,876 767,611 3.83
Vornado Realty Trust 9,292 725,427 3.61
Total equities* 19,491,878 97.13
Investment fund (2016: 649,514, 3.94%) - - -
Total financial assets designated at fair value through
profit or loss 19,491,878 97.13
Cash and other net assets 575,168 2.87
Total net assets attributable to redeemable participating
shareholders 20,067,046 100.00
Total cost of financial assets designated at fair value
through profit or loss (2016: 16,125,765) 18,055,688
Analysis of net investments
% of
total
assets *Transferable securities admitted to an official stock
exchange listing or dealt in on regulated market 19,491,878 96.91
Investment fund

First State Global Property Securities Fund
Portfolio Changes (Unaudited)
161
The schedule of portfolio changes is based on financial assets designated at fair value through
profit or loss
Number of
shares purchased
Number of
shares sold
Activia Properties 97 -
ADO Properties 5,017 -
American Assets Real Estate Investment Trust - 2,966
American Homes 4 Rent 18,170 -
Apartment Investment and Management 2,776 15,930
Ascendas Real Estate Investment Trust - 61,800
Brixmor Property Group - 18,061
CapitaMall Trust - 497,800
Charter Hall Group - 53,223
Cheung Kong Property Holdings - 9,500
CubeSmart - 23,760
Cyrusone 516 13,619
Daiwa Office Real Estate Investment Trust 55 28
Diamondrock Hospitality 17,283 -
Equinix 215 -
Equity One Real Estate Investment Trust - 9,148
Equity Residential - 2,129
Essex Property Real Estate Investment Trust - 2,731
Eurocommerical Properties - 8,339
General Growth Properties 47,448 47,448
Globalworth Real Estate Investment Trust 8,521 -
GPT - 209,431
Hammerson Real Estate Investment Trust 62,020 73,318
Hang Lung Properties 240,000 -
Henderson Land Development 12,100 23,100
Hilton Worldwide Holdings 6,227 2,575
Hong Kong Land Holdings - 60,100
Host Marriott 40,443 -
Hudson Pacific Properties 1,702 -
Inmobiliaria Colonial 43,085 -
InterXion Holding 2,738 4,563
Invitation Homes Real Estate Investment Trust 42,667 -
Japan Rental Housing Investment - 235
JBG Smith Properties Real Estate Investment Trust 4,464 4,464
Kenedix Realty Investment 45 61
Kenedix Retail Real Estate Investment Trust 46 26
Kilroy Realty 5,034 -
Kimco Realty 38,771 -

First State Global Property Securities Fund
Portfolio Changes (Unaudited) (continued)
162
Number of
shares purchased
Number of
shares sold
Land Securities Real Estate Investment Trust - 33,671
Leg Immobilien GMBH AG - 1,723
Mack Cali Realty 13,044 19,603
Mitsubishi Estate 7,000 12,000
Mitsubishi Estate Logistics 161 -
Mitsui Fudosan 22,598 -
Mitsui Fudosan Logistics Park Real Estate Investment
Trust 62 88
Monogram Residential Real Estate Investment Trust 3,114 9,912
NSI NV 1,224 -
Playa Hotels And Resorts 42,522 -
Regency Centers 8,622 -
Riocan Real Estate Investment Trust 26,585 -
Simon Property Group 7,360 2,142
Sumitomo Realty & Development - 8,000
Sun Hung Kai Properties 37,000 -
Tanger Factory Outlet Centre 2,567 14,143
TLG Immobilien AG - 4,533
UDR 11,085 1,471
Unibail-Rodamco Real Estate Investment Trust - 463
Vicinity Centres Real Estate Investment Trust 73,676 -
Vornado Realty Trust 702 -
Wharf Real Estate Investment 40,313 -
The Schedule of Portfolio Changes in Investments reflects the aggregate purchases of a security
exceeding one percent of the total value of purchases for the year and aggregate sales of a security
exceeding one percent of the total sales for the year.

First State Asian Property Securities Fund
Investment Manager’s Report (Unaudited)
163
Performance
01/01/14 01/01/15 01/01/16 01/01/17
To To To To
31/12/14 31/12/15 31/12/16 31/12/17
First State Asian Property Securities Fund “the Fund”
– Class I 0.24% -3.74% 1.88% 16.75%
– Class I (Dist) ^ 0.25% -3.70% 1.95% 16.81%
FTSE EPRA NAREIT Developed Asia Index#** n/a -7.12% 6.11% 15.56%
UBS Asia Real Estate Index# 0.62% n/a n/a n/a
(Performance calculation is based on official dealing NAV per share)
^Dividend adjustment return
#Benchmarks are being included for illustrative purposes and there is no guarantee that a fund will outperform a benchmark.
**Benchmarks was changed from UBS Asia Real Estate to FTSE EPRA NAREIT Developed Asia Index from 1 April 2015
Past performance is no indication of current or future performance and the performance data does not take account of
commissions and costs incurred in the issue and redemption of units.
After a positive March quarter, Asian REITs were dragged lower by weaker Japanese Office REITs in
June on fears of office oversupply in central Tokyo. Coupled with uncertainty over government policy affecting
broader Japanese REITs, this ongoing uncertainty offset Singapore and Hong Kong strength and kept Asian REITs
relatively subdued over the rest of 2017. Only USD depreciation pushed Asian REIT returns into double figures in
USD terms.
The Fund returned 16.7% during the 2017 calendar year, compared with a return of 15.6% by its
benchmark index.
City Developments was the largest contributor, rising on strong condominium sales, prime office
refurbishments and ongoing international diversification. Sun Hung Kai Properties gained on exposure to robust
Hong Kong office markets and successful re-zoning of its farmland holdings. Mapletree Commercial reported
strong operating trends with improving shopper traffic, tenant sales and positive leasing spread.
Cheung Kong Property gained post the sale of some iconic office assets to focus on building an
infrastructure business. We sold out on strength, but its share price continued to appreciate and that underweight
detracted value.
Hang Lung Properties suffered from declining earnings with part of its China portfolio is currently under
renovation and tenancy remix program. Conversely, strong retail sales growth was reported for its malls under
operation, signalling the sustainable recovery of luxury retail segment in China.
Our underweight to Link detracted from performance as the stock rose on successful disposal of its non-
core portfolio and share buy-back initiative.
The Fund initiated positions in:-
• Vicinity Centres, Australia’s largest owner of sub-regional retail and outlet centres. It appears well placed
to take advantage of stable retail fundamentals in Australia, while its development pipeline is expected to underpin
future earnings growth.
• Activia Properties, which holds Tokyo office/retail, especially in Shibuya, an emerging technology area.
We believe rents are defensive as many technology companies are relocating to Shibuya.
• Wharf REIC when it split from Wharf Holdings (also held). Wharf REIC holds premium quality
properties including Hong Kong’s two biggest shopping district malls.
The Fund switched from Kenedix Retail to Japan Retail Fund on its superior relative valuations, liquidity
and earnings growth outlook. It also sold out of strong outperformers that approached target valuations including
City Developments, Japan Rental Housing Investments and GPT Group – benefiting from investor demand for
exposure to its quality Sydney and Melbourne-focussed property portfolio.

First State Asian Property Securities Fund
Investment Manager’s Report (Unaudited) (continued)
164
The overall strategy is to have a balanced portfolio with exposure to both quality defensive names and
stocks with strong growth potential. Our holdings in Asia and Japan are expected to benefit from continued rental
growth and the opening of new properties across the region. Despite the challenging outlook for the Australian retail
sector, the Fund holds select names that will continue to deliver stable earnings growth through positive rental
reversion and attractive development pipelines.
First State Investment (Hong Kong) Limited
February 2018

First State Asian Property Securities Fund
Performance Table
as of 31 December 2017 (Unaudited)
165
Financial
period
Total net asset
value
Net asset value
per share
Class I
Dec 2015 US$ 853,311 US$ 7.97
Dec 2016 US$ 868,885 US$ 8.12
Dec 2017 US$ 491,117 US$ 9.48
Class I
Distributing
Dec 2015 US$ 12,316,726 US$ 5.89
Dec 2016 US$ 11,104,588 US$ 5.84
Dec 2017 US$ 9,767,427 US$ 6.62
Financial
period
The highest issue
price
The lowest
redemption
price
Class I
Dec 2008 US$ 9.70 US$ 3.60
Dec 2009 US$ 6.46 US$ 3.23
Dec 2010 US$ 7.20 US$ 5.39
Dec 2011 US$ 7.18 US$ 5.26
Dec 2012 US$ 8.14 US$ 5.73
Dec 2013 US$ 9.23 US$ 7.44
Dec 2014 US$ 8.77 US$ 7.40
Dec 2015 US$ 9.23 US$ 7.47
Dec 2016 US$ 8.95 US$ 7.00
Dec 2017 US$ 9.48 US$ 8.14

First State Asian Property Securities Fund
Performance Table (continued)
as of 31 December 2017 (Unaudited)
166
Financial period The highest issue
price
The lowest
redemption
price
Class III
Dec 2008 US$ 12.21 US$ 4.55
Dec 2009 US$ 8.19 US$ 4.08
Dec 2010 US$ 9.19 US$ 6.87
Dec 2011 US$ 9.17 US$ 6.74
Dec 2012 US$ 10.19 US$ 7.31
Dec 2013 US$ 11.51 US$ 9.26
Dec 2014 US$ 9.78 US$ 8.44
Class I Distributing
Dec 2008 US$ 9.39 US$ 3.35
Dec 2009 US$ 5.70 US$ 2.90
Dec 2010 US$ 6.15 US$ 4.68
Dec 2011 US$ 6.14 US$ 4.35
Dec 2012 US$ 6.52 US$ 4.74
Dec 2013 US$ 7.28 US$ 5.87
Dec 2014 US$ 6.70 US$ 5.69
Dec 2015 US$ 6.92 US$ 5.52
Dec 2016 US$ 6.48 US$ 5.17
Dec 2017 US$ 6.62 US$ 5.86

First State Asian Property Securities Fund
Schedule of Investments
as of 31 December 2017
167
The schedule that follows includes financial assets designated at fair value through profit or loss
Number of
shares
Fair value
US$
% of net
assets
Australia (2016: 2,678,819, 22.38%) 2,387,506 23.27
Charter Hall Group 17,631 82,974 0.81
Mirvac Group 197,057 362,016 3.53
National Storage Real Estate Investment Trust 329,193 395,027 3.85
Scentre Group 156,623 513,024 5.00
Vicinity Centres Real Estate Investment Trust 212,144 451,094 4.40
Westfield Group 78,634 583,371 5.68
China (2016: 188,298, 1.57%) - - -
Hong Kong (2016: 2,934,373, 24.51%) 3,157,062 30.77
CK Asset Holdings 37,000 323,338 3.15
Hang Lung Properties 130,000 317,696 3.10
Henderson Land Development 29,700 195,704 1.91
Hong Kong Land Holdings 35,000 246,400 2.40
Sun Hung Kai Properties 56,000 934,330 9.11
Swire Properties 84,800 273,421 2.66
The Link Real Estate Investment Trust 36,261 336,134 3.28
Wharf Holdings 33,400 115,384 1.12
Wharf Real Estate Investment Trust 62,323 414,655 4.04
Japan (2016: 5,012,328, 41.86%) 4,117,822 40.14
Activia Properties 98 411,055 4.01
GLP J-Real Estate Investment Trust 184 199,321 1.94
Hulic Real Estate Investment Trust 214 311,881 3.04
Ichigo Hotel Real Estate Investment Trust 57 61,898 0.60
Japan Retail Fund 177 324,964 3.17
Kenedix Realty Investment 33 187,683 1.83
Kenedix Residential Real Estate Investment Trust 88 255,719 2.49
Mitsubishi Estate 26,000 452,857 4.41
Mitsubishi Estate Logistics 123 299,166 2.92
Mitsui Fudosan 41,000 919,977 8.97
Mitsui Fudosan Logistics Park Real Estate Investment
Trust 49 155,887 1.52
NTT Urban Development Corporation 12,300 142,533 1.39
Sumitomo Realty & Development 12,000 394,881 3.85

First State Asian Property Securities Fund
Schedule of Investments (continued)
as of 31 December 2017
168
Number of
shares
Fair value
US$
% of net
assets
Singapore (2016: 652,821, 5.45%) 433,451 4.23
Frasers Logistics and Industrial Real Estate Investment
Trust 135,200 117,407 1.15
Mapletree Commercial Trust 260,600 316,044 3.08
Total equities* 10,095,841 98.41
Investment funds (2016: 262,264, 2.19%) - - -
Total financial assets designated at fair value through
profit or loss 10,095,841 98.41
Cash and other net assets 162,703 1.59
Total net assets attributable to redeemable participating
shareholders 10,258,544 100.00
Total cost of financial assets designated at fair value
through profit or loss (2016: 12,147,867) 9,422,132
Analysis of net investments
% of
total
assets
*Transferable securities admitted to an official stock
exchange listing or traded on a regulated market 10,095,841 97.92
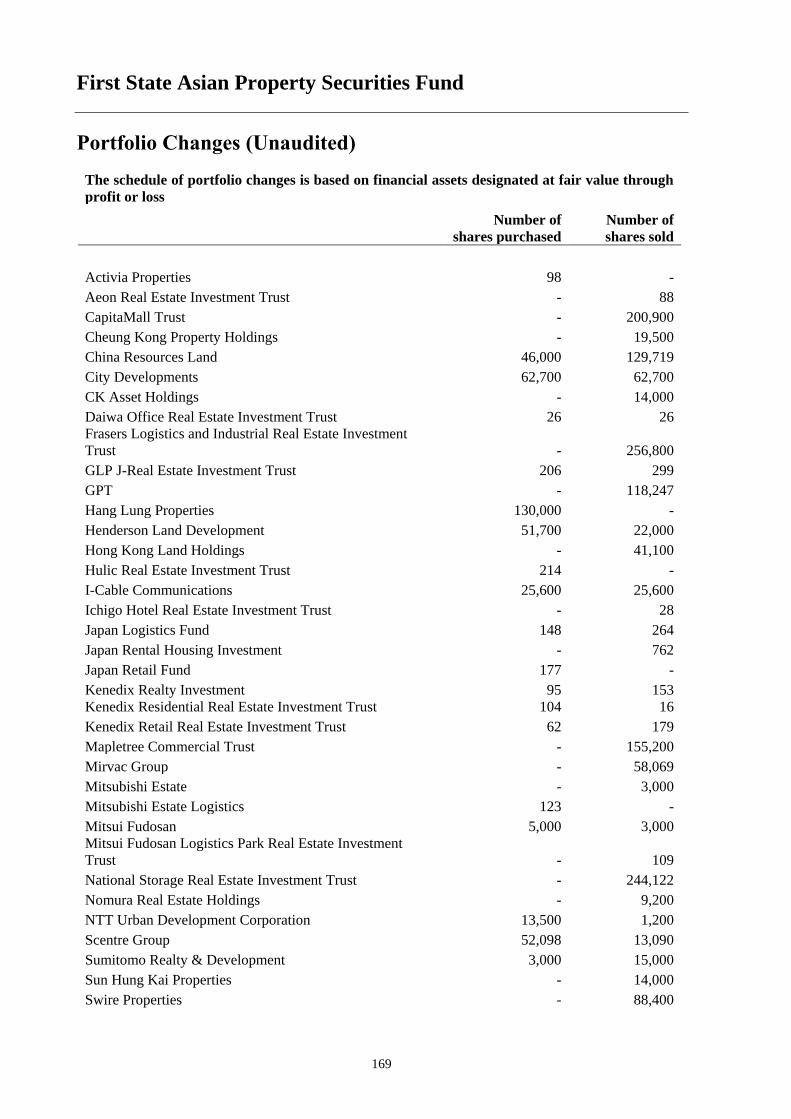
First State Asian Property Securities Fund
Portfolio Changes (Unaudited)
169
The schedule of portfolio changes is based on financial assets designated at fair value through
profit or loss
Number of
shares purchased
Number of
shares sold
Activia Properties 98 -
Aeon Real Estate Investment Trust - 88
CapitaMall Trust - 200,900
Cheung Kong Property Holdings - 19,500
China Resources Land 46,000 129,719
City Developments 62,700 62,700
CK Asset Holdings - 14,000
Daiwa Office Real Estate Investment Trust 26 26
Frasers Logistics and Industrial Real Estate Investment
Trust - 256,800
GLP J-Real Estate Investment Trust 206 299
GPT - 118,247
Hang Lung Properties 130,000 -
Henderson Land Development 51,700 22,000
Hong Kong Land Holdings - 41,100
Hulic Real Estate Investment Trust 214 -
I-Cable Communications 25,600 25,600
Ichigo Hotel Real Estate Investment Trust - 28
Japan Logistics Fund 148 264
Japan Rental Housing Investment - 762
Japan Retail Fund 177 -
Kenedix Realty Investment 95 153
Kenedix Residential Real Estate Investment Trust 104 16
Kenedix Retail Real Estate Investment Trust 62 179
Mapletree Commercial Trust - 155,200
Mirvac Group - 58,069
Mitsubishi Estate - 3,000
Mitsubishi Estate Logistics 123 -
Mitsui Fudosan 5,000 3,000
Mitsui Fudosan Logistics Park Real Estate Investment
Trust - 109
National Storage Real Estate Investment Trust - 244,122
Nomura Real Estate Holdings - 9,200
NTT Urban Development Corporation 13,500 1,200
Scentre Group 52,098 13,090
Sumitomo Realty & Development 3,000 15,000
Sun Hung Kai Properties - 14,000
Swire Properties - 88,400

First State Asian Property Securities Fund
Portfolio Changes (Unaudited) (continued)
170
Number of
shares purchased
Number of
shares sold
The Link Real Estate Investment Trust 8,000 27,500
Tokyu Fudosan Holdings - 39,000
Vicinity Centres Real Estate Investment Trust 212,144 -
Westfield Group - 36,616
Wharf Holdings 21,000 32,000
Wharf Real Estate Investment 62,323 -
The Schedule of Portfolio Changes in Investments reflects the aggregate purchases of a security
exceeding one percent of the total value of purchases for the year and aggregate sales of a security
exceeding one percent of the total sales for the year.

First State China Focus Fund
Investment Manager’s Report (Unaudited)
171
Performance
01/01/14 01/01/15 01/01/16 01/01/17
To To To To
31/12/14 31/12/15 31/12/16 31/12/17
First State China Focus Fund “the Fund”
- Class I -4.67% -15.86% -3.64% 26.53%
- Class III -3.85% -15.25% -3.90% 26.06%
- Class IV -4.94% 16.14% -3.85% 26.25%
MSCI China Free Index (total return)# 8.26% -7.62% 1.11% 54.07%
(Performance calculation is based on official dealing Net asset value (NAV) per share)
#Benchmarks are being included for illustrative purposes and there is no guarantee that a fund will outperform a benchmark Past performance is no indication of current or future performance and the performance data does not take account of
commissions and costs incurred in the issue and redemption of units.
The MSCI China increased by 54% in 2017. Policy measures from the People’s Bank of China (PBoC)
helped to reduce capital outflows and provided support to the renminbi, which, against market expectations,
continued to appreciate against the US dollar. Meanwhile, reforms in the state-owned enterprise (SOE) sector
continued apace with the reorganization of several central SOEs and the introduction of mixed ownership plans.
The China Securities Regulatory Commission (CSRC) said that it encouraged listed SOEs to improve the dividend
pay-out and return excess capital to investors where there is an ability to do so. Midway through the year, MSCI
said that it would include China A-shares in the MSCI Emerging Markets Index from June 2018 onwards, which
provided further impetus for the market rally.
On portfolio holdings, Wanhua Chemical continued to benefit from the methylene diphenyl diisocyanate
(MDI) upcycle and supply-side production constraints. China Mengniu Dairy benefitted from improvements to its
product mix. Margins have shown a healthy expansion, while operating cash flow has soared due to better inventory
management.
On the negative side, China Longyuan Power Group suffered from a profit decline, mainly due to higher
coal prices, which was only partly offset by better than expected profit growth from the wind power segment.
Lenovo Group continued to face a challenging environment and its share price suffered on account of poor
performance in its mobile and server businesses. However, its balance sheet returned to a net-cash position earlier
in the year with solid operating cash flow and PC execution has remained solid.
Over the course of the year, we initiated a position in Yunnan Baiyao, a pharmaceutical company that
produces haemostatic medicine and health care products such as toothpaste and shampoo. Although the valuation
was not cheap, we believe that the implementation of SOE reforms should bear fruit. The parent company recently
introduced a second private-sector shareholder, taking the combined private-sector ownership to 55%. We believe
this is a positive sign as improved governance and management incentives should boost Baiyao’s financial
performance. We also purchased Qingdao Haier, a leading home appliances group with a diversified product range
and regional coverage. Recent execution has been better than expected and the company has been strengthening
its leadership in the sector.
First State China Focus Fund
Investment Manager’s Report (Unaudited) (continued)
172
We divested China South Publishing on account of tighter regulations on textbook sales in Hunan Province.
Although the company has a commercial culture and a respectable track record, we believe ongoing regulatory
changes are likely to constrain returns. We also sold Global Logistic Properties on share price strength arising from
the acquisition by the China Vanke Consortium.
The 19th National Congress of the Communist Party took place in mid-October where, as expected, Xi
Jinping was strengthened as China’s leader and a number of the top leadership team were changed. We do not
expect major changes in policy, simply a continuation of reforms to reduce over-supply, rebalance the economy and
avoid a “hard landing”.
There have been positive signs that supply-side reforms are taking hold. In the past two years, capacity
closures in the coal and steel sectors have amounted to around 70-80% of the government’s target, providing a
catalyst for price increases and strong margin improvement for the remaining players. We expect further capacity
closures to carry forward in 2018, which we believe should eventually pass through to general price levels.
Contrary to investor expectations, the renminbi had appreciated by around 6% against the US dollar by the
end of 2017, reversing three years of depreciation. Despite the strength of China’s currency and its stable balance
of payments, we expect strict capital controls to remain in place in 2018. We expect the government to continue its
efforts to stem the outflow of capital from the mainland and encourage more investment domestically.
The China equity market has risen significantly over the past year and there are clear signs of market
exuberance. We believe investors are paying little attention to potential downside risks and as a result, valuations –
particularly for quality companies – are not cheap. As such, we maintain our cautious outlook and continue to look
for companies with a superior management team, a conservative balance sheet and good risk awareness.
First State Investment (Hong Kong) Limited
February 2018

First State China Focus Fund
Performance Table
as of 31 December 2017 (Unaudited)
173
Financial period Total net asset
value
Net asset
value per
share
Class I
Dec 2015 US$ 214,670,250 US$ 12.36
Dec 2016 US$ 183,568,633 US$11.91
Dec 2017 US$ 177,487,230 US$ 15.07
Class III
Dec 2015 US$ 37,478,984 US$ 10.78
Dec 2016 US$ 316,708 US$ 10.36
Dec 2017 US$ 500,123 US$ 13.06
Class IV
Dec 2015 US$ 29,005,249 US$ 9.35
Dec 2016 US$ 32,877,012 US$ 8.99
Dec 2017 US$ 31,887,552 US$ 11.35
Financial period The highest issue
price
The lowest
redemption
price
Class I
Dec 2009 US$ 10.92 US$ 5.37
Dec 2010 US$ 12.96 US$ 9.75
Dec 2011 US$ 13.65 US$ 9.60
Dec 2012 US$ 13.14 US$ 10.90
Dec 2013 US$ 15.71 US$ 12.41
Dec 2014 US$ 16.62 US$ 13.60
Dec 2015 US$ 17.89 US$ 11.42
Dec 2016 US$ 12.44 US$ 9.76
Dec 2017 US$ 15.14 US$ 12.01

First State China Focus Fund
Performance Table (continued)
as of 31 December 2017 (Unaudited)
174
Financial period The highest issue
price
The lowest
redemption
price
Class III
Dec 2012 US$ 11.20 US$ 9.84
Dec 2013 US$ 13.48 US$ 10.62
Dec 2014 US$ 14.35 US$ 11.70
Dec 2015 US$ 15.53 US$ 9.94
Dec 2016 US$ 10.84 US$ 8.55
Dec 2017 US$ 13.13 US$ 10.45
Class IV
Dec 2011 US$ 10.19 US$ 7.38
Dec 2012 US$ 10.03 US$ 8.35
Dec 2013 US$ 11.96 US$ 9.46
Dec 2014 US$ 12.62 US$ 10.34
Dec 2015 US$ 13.57 US$ 8.65
Dec 2016 US$ 9.40 US$ 7.39
Dec 2017 US$ 11.41 US$ 9.07

First State China Focus Fund
Schedule of Investments
as of 31 December 2017
175
The schedule that follows includes financial assets designated at fair value through profit or loss
Number of
shares
Fair value
US$
% of net
assets
China (2016: 163,515,321, 75.44%) 171,733,466 81.83
Bank of Ningbo 381,600 1,044,299 0.50
China Blue Chemical 16,332,000 5,161,444 2.46
China Longyuan Power Group 12,971,000 9,227,481 4.40
China Mengniu Dairy 6,708,000 19,954,962 9.51
China Merchants Holdings International 7,271,633 19,026,555 9.06
China Oilfield Services 9,314,000 9,068,924 4.32
China Telecom 39,860,000 18,972,088 9.04
Fuyao Glass Industry 546,000 2,301,881 1.10
Great Wall Motor 8,062,000 9,232,105 4.40
Lenovo Group 33,706,000 19,018,695 9.06
Li Ning 11,287,229 9,141,678 4.36
Longfor Properties 434,000 1,087,270 0.52
Qingdao Haier 1,062,610 3,076,148 1.47
Shanghai International Airport 479,093 3,313,457 1.58
Sun Art Retail Group 9,222,744 9,747,093 4.64
Tsingtao Brewery 1,876,000 9,673,258 4.61
Wanhua Chemical Group 1,605,945 9,389,399 4.47
Xinjiang Goldwind Science & Technology 5,651,280 9,602,400 4.57
Yunnan Baiyao Group 236,199 3,694,329 1.76
Hong Kong (2016: 20,513,633, 9.46%) 17,896,546 8.53
ASM Pacific Technology 599,200 8,349,002 3.98
Li & Fung 17,394,000 9,547,544 4.55
Singapore (2016: 4,823,408, 2.23%) - - -
Taiwan (2016: 15,128,792, 6.98%) 9,621,005 4.58
Delta Electronics Industrial 1,987,760 9,621,005 4.58
Total equities* 199,251,017 94.94
Investment fund (2016: 10,323,688 4.76%) 7,733,773 3.68
First State China A Shares† 338,458 7,733,773 3.68

First State China Focus Fund
Schedule of Investments (continued)
as of 31 December 2017
176
Number of
shares
Fair value
US$
% of net
assets
Total financial assets designated at fair value through
profit or loss
206,984,790 98.62
Cash and other net assets 2,890,115 1.38
Total net assets attributable to redeemable participating
shareholders
209,874,905 100.00
Total cost of financial assets designated at fair value
through profit or loss (2016: 258,039,034) 213,956,474
†Fund Investment. Investment is a related party entity. Please refer to Note 14.
Analysis of net investments
% of total
assets
*Transferable securities admitted to an official stock
exchange listing or traded on a regulated market 199,251,017 94.40
Investment fund 7,733,773 3.66

First State China Focus Fund
Portfolio Changes (Unaudited)
177
The schedule of portfolio changes is based on financial assets designated at fair value through
profit or loss
Number of
shares purchased
Number of
shares sold
ASM Pacific Technology 301,200 730,200
Bank of Ningbo 381,600 -
Changyuan Group - 532,593
China Blue Chemical 6,056,000 500,000
China Longyuan Power Group 1,015,000 1,113,000
China Mengniu Dairy 1,481,000 1,976,000
China Merchants Holdings International 1,678,000 656,000
China Oilfield Services - 1,466,000
China South Publishing & Media Group - 1,243,785
China Telecom 5,196,000 6,280,000
Delta Electronics Industrial 338,000 1,200,000
First State China A Shares † - 319,939
Foshan Haitian Flavouring and Food 52,741 453,657
Fuyao Glass Industry - 2,400,000
Global Logistic Properties - 3,165,800
Great Wall Motor 1,895,500 4,427,500
Gree Electric Appliances 147,900 147,900
Hang Lung Group - 150,000
Hongfa Technology - 118,045
Lenovo Group 7,968,000 2,410,000
Li & Fung 3,644,000 6,938,000
Li Ning 1,385,500 4,112,500
Longfor Properties - 248,000
Luthai Textile 303,498 303,498
Qingdao Haier 1,807,310 744,700
Shandong Himile Mechanical Science and Technology 398,406 398,406
Shanghai International Airport 344,629 146,400
Sun Art Retail Group 4,983,500 7,410,000
Tsingtao Brewery 406,000 1,172,000
Wanhua Chemical Group 1,007,997 2,369,100
Xinjiang Goldwind Science & Technology 3,719,880 4,321,800
Yunnan Baiyao Group 236,199 -
The Schedule of Portfolio Changes in Investments reflects the aggregate purchases of a security
exceeding one percent of the total value of purchases for the year and aggregate sales of a security
exceeding one percent of the total sales for the year.

First State Global Listed Infrastructure Fund
Investment Manager’s Report (Unaudited)
178
Performance
01/01/14 01/01/15 01/01/16 01/01/17
To To To To
31/12/14 31/12/15 31/12/16 31/12/17
First Global Listed Infrastructure Fund “the Fund”
- Class I (Dist) ^ 12.33% -5.70% 11.67% 17.18%
- Class III 13.38% -5.05% 12.51% 18.00%
- Class VI* 0.40% -4.98% 12.47% 18.08%
- Class VI (Dist) ^** n/a -4.90% 12.35% 18.05%
- Class I*** n/a n/a 13.27% 17.11%
- Class VI (GBP Dist) ^** n/a n/a 29.14% 7.66%
- Class I (EUR) *** n/a n/a 17.21% 3.07%
- Class VI (EUR) *** n/a n/a 17.81% 3.82%
FTSE Global Core Infrastructure 50-50 Index# n/a -5.99% 11.76% 18.40%
FTSE Global Core Infrastructure 50-50 Index**# n/a -4.89% 11.76% 18.40%
FTSE Global Core Infrastructure 50-50 Index***# n/a n/a 9.65% 18.40%
FTSE Global Core Infrastructure 50-50 (GBP) Index***## n/a n/a 23.99% 8.11%
FTSE Global Core Infrastructure 50-50 (EUR) Index***## n/a n/a 14.64% 4.00%
UBS Global Infrastructure & Utilities 50-50 Index# 13.58% n/a n/a n/a
UBS Global Infrastructure & Utilities 50-50 Index*# 0.71% n/a n/a n/a
(Performance calculation is based on official dealing NAV per share)
^ Dividend adjustment return
* Inception date – 26 June 2014
**Inception date – 13 March 2015
***Inception date ̶22 February 2016
#Benchmarks were changed from UBS Global Infrastructure & Utilities to FTSE Global Core Infrastructure 50-50 Index from
1 April 2015. Benchmarks are being included for illustrative purposes and there is no guarantee that a fund will outperform a
benchmark. Past performance is no indication of current or future performance and the performance data does not take account of
commissions and costs incurred in the issue and redemption of units.
Global listed infrastructure rallied along with broader financial markets in 2017, supported by positive
sentiment and buoyant economic conditions. The best performing infrastructure sectors included airports and
tollroads, which benefit the most from increasing economic activity levels.
The First State Global Listed Infrastructure Fund gained 19.1% (before fees) during the calendar year,
0.7% ahead of its benchmark index.
The largest contributor to positive performance was Transurban, which benefitted from healthy traffic
levels and contracted pricing increases. NextEra Energy rose on investor enthusiasm for its large, stable utility
business Florida Power and Light Co., and its continued investment into the development and build-out of renewable
energy. Abertis outperformed as competing takeover bids from Italian peer Atlantia and German construction firm
Hochtief drove substantial share price gains.
PG&E detracted from performance, owing to concerns about potential liabilities associated with the
outbreak of wildfires in its Northern California service territory. The Pipelines sector remained out of favour in
2017 despite improving fundamentals and a back-to-basics approach, causing holdings in Kinder Morgan and Plains
All American Pipeline to underperform.

First State Global Listed Infrastructure Fund
Investment Manager’s Report (Unaudited) (continued)
179
Southern Co was added to the Fund after uncertainty associated with construction of a new Georgia power
plant overshadowed this substantial company’s stable fundamentals, creating an attractive entry point. The Fund
bought shares in Great Plains Energy on a positive view of its proposed merger with peer Westar Energy. A position
was also initiated in Osaka Gas after investor concerns about gas market regulation changes weighed on the stock,
creating an appealing buying opportunity.
Holdings in Eversource Energy, Xcel Energy and SBA Communications were sold after strong share price
gains moved them to lower positions within the investment team’s value/quality stock ranking process.
Financial markets enter 2018 highly optimistic with global economic growth looking robust and US tax
cuts boosting corporate earnings. We would caution that political developments may lead to volatility with general
elections scheduled in Italy (March), Mexico (July) and Brazil (October); along with ongoing instability in the UK
and Germany; and an unpredictable Trump-led US.
With the gradual reduction in central bank stimulus and potential for higher inflation (tighter labour
markets and higher energy prices), we would expect to see interest rates rise through the year, which may act as a
headwind for investment returns across all asset classes.
Within the global listed infrastructure asset class earnings growth remains solid, balance sheets look robust,
and dividends should grow faster than earnings. Global listed infrastructure remains well positioned to protect and
grow capital through economic cycles, owing to its defensive earnings growth and inflation pass-through
characteristics.
First State Investment (Hong Kong) Limited
February 2018

First State Global Listed Infrastructure Fund
Performance Table
as of 31 December 2017 (Unaudited)
180
Financial period Total net asset
value
Net asset
value per
share
Class I (Dist)
Dec 2015 US$ 41,811,074 US$ 10.41
Dec 2016 US$ 78,176,938 US$ 11.33
Dec 2017 US$ 96,281,225 US$ 12.82
Class III
Dec 2015 US$ 66,263,231 US$ 12.79
Dec 2016 US$ 55,828,009 US$14.39
Dec 2017 US$ 58,348,209 US$ 16.98
Class VI
Dec 2015 US$ 16,430,550 US$ 9.54
Dec 2016 US$118,228,668 US$ 10.73
Dec 2017 US$ 151,514,349 US$ 12.67
Class VI (Dist)
Dec 2015 US$ 93,805 US$ 9.51
Dec 2016 US$ 15,569,951 US$ 10.41
Dec 2017 US$ 89,431,064 US$ 11.88
Class I
Dec 2016 US$ 8,280,675 US$ 11.16
Dec 2017 US$ 42,876,075 US$ 13.07
Class VI (GBP Dist)
Dec 2016 £ 8,637,414 £ 12.95
Dec 2017 £ 8,965,915 £ 13.49
Class I (EUR)
Dec 2016 EUR 370,109 EUR 11.71
Dec 2017 EUR 496,601 EUR 12.07
Class V I (EUR)
Dec 2016 EUR 14,837,595 EUR 11.78
Dec 2017 EUR 70,859,593 EUR 12.23

First State Global Listed Infrastructure Fund
Performance Table (continued)
as of 31 December 2017 (Unaudited)
181
Financial period The highest issue
price
The lowest
redemption
price
Class I (Dist)
Dec 2009 US$ 8.32 US$ 5.15
Dec 2010 US$ 8.87 US$ 7.20
Dec 2011 US$ 9.54 US$ 7.88
Dec 2012 US$ 9.38 US$ 8.22
Dec 2013 US$ 10.53 US$ 9.25
Dec 2014 US$ 11.72 US$ 10.25
Dec 2015 US$ 11.80 US$ 10.05
Dec 2016 US$ 12.03 US$ 9.53
Dec 2017 US$ 13.12 US$ 11.28
Class III
Dec 2012 US$ 10.27 US$ 10.00
Dec 2013 US$ 12.00 US$ 10.21
Dec 2014 US$ 13.61 US$ 11.69
Dec 2015 US$ 14.22 US$ 12.34
Dec 2016 US$15.20 US$ 11.71
Dec 2017 US$ 17.33 US$ 14.33
Class VI
Dec 2014 US$ 10.12 US$ 9.30
Dec 2015 US$ 10.60 US$ 9.20
Dec 2016 US$ 11.33 US$ 8.73
Dec 2017 US$ 12.92 US$ 10.69
Class VI (Dist)
Dec 2015 US$ 10.66 US$ 9.18
Dec 2016 US$ 11.02 US$ 8.71
Dec 2017 US$ 12.12 US$ 10.37
Class I
Dec 2016 US$ 11.81 US$ 9.98
Dec 2017 US$ 13.36 US$ 11.11

First State Global Listed Infrastructure Fund
Performance Table (continued)
as of 31 December 2017 (Unaudited)
182
Financial period The highest issue
price
The lowest
redemption
price
Class VI (GBP Dist)
Dec 2016 £ 13.25 £ 10.00
Dec 2017 £ 14.33 £ 12.73
Class I (EUR)
Dec 2016 EUR 11.81 EUR 10.00
Dec 2017 EUR 12.77 EUR 11.53
Class VI (EUR)
Dec 2016 EUR 11.88 EUR 10.00
Dec 2017 EUR 12.88 EUR 11.61

First State Global Listed Infrastructure Fund
Schedule of Investments
as of 31 December 2017
183
The schedule that follows includes financial assets designated at fair value through profit or loss
Number of
shares
Fair value
US$
% of net
assets
Australia (2016: 19,232,370, 6.35%) 31,787,204 5.93
Transurban Group 3,271,246 31,787,204 5.93
Bermuda (2016: 4,995,084, 1.65%) 7,803,735 1.46
Cosco Pacific 7,502,000 7,803,735 1.46
Brazil (2016: 7,448,687, 2.46%) 16,345,105 3.05
CCR 3,352,467 16,345,105 3.05
Canada (2016: 10,247,978, 3.38%) 36,898,315 6.88
Canadian Pacific Railway 30,140 5,526,849 1.03
Enbridge 418,859 16,482,328 3.08
Enbridge Inc 142,606 5,591,582 1.04
Hydro One 519,300 9,297,556 1.73
China (2016: 12,620,820, 4.17%) 15,925,572 2.97
China Merchants Holdings International 506,000 1,323,972 0.25
Jiangsu Expressway 9,590,000 14,601,600 2.72
France (2016: 14,005,247, 4.63%) 15,323,212 2.86
Groupe Eurotunnel 689,246 8,859,511 1.65
Vinci 63,100 6,463,701 1.21
Germany (2016: 1,675,326, 0.55%) - - -
Hong Kong (2016: 3,014,663, 1.00%) 12,977,948 2.42
Power Assets Holdings 1,538,000 12,977,948 2.42
Italy (2016: 9,061,763, 3.00%) 21,190,291 3.95
Atlantia 665,187 21,190,291 3.95
Japan (2016: 22,261,627, 7.35%) 46,105,791 8.60
Central Japan Railway 35,500 6,366,213 1.19
East Japan Railway 226,600 22,140,469 4.13
Japan Airport Terminal 72,700 2,700,489 0.50
Kamigumi 73,900 1,637,187 0.31
Osaka Gas 687,700 13,261,433 2.47
Mexico (2016: 2,998,955, 0.99%) 2,146,368 0.40
Grupo Aeroportuario 211,342 2,146,368 0.40
Netherlands (2016: Nil) 5,658,733 1.06
Vopak 128,634 5,658,733 1.06

First State Global Listed Infrastructure Fund
Schedule of Investments (continued)
as of 31 December 2017
184
Number of
shares
Fair value
US$
% of net
assets
Spain (2016: 19,566,179, 6.46%) 12,845,271 2.40
Abertis Infraestructuras 368,812 8,157,504 1.52
Aena 23,008 4,687,767 0.88
United Kingdom (2016: 23,727,042, 7.84%) 52,717,534 9.83
National Grid 3,695,315 43,526,517 8.12
Scottish & Southern Energy 520,617 9,191,017 1.71
United States (2016: 142,725,453, 47.14%) 248,093,092 46.28
Alliant Energy 132,949 5,671,604 1.06
American Electric Power 121,374 8,939,195 1.67
American Tower 180,275 25,763,100 4.81
Crown Castle Real Estate Investment Trust 64,485 7,081,743 1.32
CSX 134,683 7,407,565 1.38
Dominion Resources 323,771 26,248,115 4.90
Enterprise Products Partners 413,066 10,937,988 2.04
Great Plains Energy 431,387 13,912,231 2.59
Kinder Morgan 1,810,501 33,150,273 6.18
NextEra Energy 159,361 24,916,092 4.65
Nisource 227,903 5,825,201 1.09
Norfolk Southern 71,964 10,457,089 1.95
PG&E 365,823 16,392,529 3.06
Plains All American Pipeline 528,652 10,985,388 2.05
Southern 418,037 20,182,826 3.76
UGI Corporation 227,724 10,712,137 2.00
Union Pacific 70,382 9,510,016 1.77
Total financial assets designated at fair value through
profit or loss* 525,818,171 98.09
Cash and other net assets 10,254,446 1.91
Total net assets attributable to redeemable participating
shareholders 536,072,617 100.00
Total cost of financial assets designated at fair value
through profit or loss (2016: 296,441,836) 508,101,812
Analysis of net investments
% of
total
assets
*Transferable securities admitted to an official stock
exchange listing or traded on a regulated market 525,818,171 97.50

First State Global Listed Infrastructure Fund
Portfolio Changes (Unaudited)
185
The schedule of portfolio changes is based on financial assets designated at fair value through
profit or loss
Number of
shares purchased
Number of
shares sold
Abertis Infraestructuras 172,347 685,747
ADP Promesses 4,769 35,125
Aena 45,938 48,957
Alliant Energy 80,235 26,248
American Electric Power 266,298 249,615
American Tower 221,558 66,389
Atlantia 685,916 288,397
Canadian Pacific Railway 34,924 4,784
CCR 2,606,267 772,800
Central Japan Railway 86,400 50,900
China Merchants Holdings International 500,000 3,100,000
Cosco Pacific 4,432,000 1,902,000
Crown Castle Real Estate Investment Trust 94,551 189,241
CSX 204,191 69,508
Dominion Resources 258,399 72,945
East Japan Railway 158,000 116,100
EL Paso Electric 9,480 65,716
Enbridge 586,040 409,210
Enbridge Inc 142,606 -
Enterprise Products Partners 600,915 384,244
Eversource Energy 156,323 404,627
Fraport - 28,450
Great Plains Energy 493,156 61,769
Groupe Eurotunnel 667,569 786,758
Grupo Aeroportuario 179,300 334,300
Hydro One 519,300 -
Iberdrola 119,281 676,054
Iberdrola Rights 544,670 35
Infrastrutture Wireless Italiane SPA 221,880 806,738
Japan Airport Terminal 84,300 11,600
Jiangsu Expressway 6,236,000 534,000
Kamigumi 239,700 358,800
Kansas City Southern Industries 95,129 159,710
Kinder Morgan 2,029,547 746,531
National Grid 3,503,242 841,946
NextEra Energy 123,098 70,997
Nisource 218,295 31,976
Norfolk Southern 94,541 22,577
Osaka Gas 3,356,600 2,668,900

First State Global Listed Infrastructure Fund
Portfolio Changes (Unaudited) (continued)
186
Number of
shares purchased
Number of
shares sold
PG&E 207,823 148,830
Plains All American Pipeline 644,262 115,610
Power Assets Holdings 2,800,500 1,604,500
Rubis 3,915 40,711
SBA Communications 137,793 238,050
Scottish & Southern Energy 471,823 320,781
Southern 460,774 42,737
Spectra Energy 6,218 144,925
Tokyo Gas 1,374,000 2,357,000
Transurban Group 2,045,632 1,352,338
UGI Corporation 209,017 45,358
Union Pacific 84,286 71,028
United Utilities Group 124,929 542,648
Vinci 98,791 35,691
Vopak 147,724 19,090
Xcel Energy 217,033 465,439
The Schedule of Portfolio Changes in Investments reflects the aggregate purchases of a security
exceeding one percent of the total value of purchases for the year and aggregate sales of a security
exceeding one percent of the total sales for the year.

First State Asia Pacific Select Fund
Investment Manager’s Report (Unaudited)
187
Performance
01/01/14 01/01/15 01/01/16 01/01/17
To To To To
31/12/14 31/12/15 31/12/16 31/12/17
First State Asia Pacific Select Fund “the Fund”
- Class I 8.85% -5.00% 2.26% 37.53%
- Class III 9.57% -4.44% 2.07% 38.56%
MSCI AC Asia Pacific Japan Index (total return)# 3.09% -9.12% 7.06% 36.99%
(Performance calculation is based on official dealing NAVper share)
#Benchmarks are being included for illustrative purposes and there is no guarantee that a fund will outperform a benchmark Past performance is no indication of current or future performance and the performance data does not take account of
commissions and costs incurred in the issue and redemption of units.
The MSCI AC Asia Pacific ex Japan index increased by 37% in US dollar terms in 2017. China and South
Korea outperformed, while Pakistan and New Zealand lagged. On a sector level, Information Technology and
Consumer Discretionary gained the most, while Utilities and Telecom Services were the weakest.
On portfolio holdings, Taiwan Semiconductor (TSMC) continued to benefit from the ramp up in sales of
the Apple iPhone. TSMC has maintained its leading competitive edge in technology and precision manufacturing,
with revenue growth expected to accelerate as its 7nm chips gain market share. HDFC Bank strengthened on the
back of increased net profits, driven by strong asset growth and higher net interest income despite the temporary
disruption from demonetisation and public sector banks’ recapitalisation. CSL Limited strengthened over the year,
as global demand for plasma-related products continued to exceed supply, leading to profit upgrades for the group.
Meanwhile, its Seqirus acquisition is expected to achieve profitability in FY18, which should add significantly to
the bottom line.
Detracting from performance, Brambles has been weak since its profit downgrade at the beginning of the
year. The new CEO and CFO are determined to make changes but have guided for lower returns, growth and capex.
While we do not believe its business model is broken, the lack of free cash flow generation and earnings growth
has been worrying. Dr Reddy’s Laboratories underperformed, as a series of inspections from the US Food and Drug
Administration (FDA) led to concerns around quality control issues, while delays to a number of its product
launches caused lacklustre sales growth and compressed margins. Lupin continued to face challenges in the US
generics market as the rate of price erosion had been exacerbated by consolidation in the distributor space.
Significant purchases over the year included Midea Group, China’s largest home appliances company. A
strong emphasis on R&D, streamlined products and greater control over distributors has resulted in market share
gains for almost all of its products. We also added Keyence Corp, one of the leading names in automation. We
believe it is one of the best companies to own in this segment due to its strong culture, high levels of profitability
and superior return on invested capital.
We sold Infosys Technologies on concerns around the political in-fighting between the founders and
management which eventually led to the resignation of the CEO Vishal Sikka and divested Dr Reddy’s Laboratories
after the company reported weak earnings due to regulatory challenges and price erosion in the US market.

First State Asia Pacific Select Fund
Investment Manager’s Report (Unaudited) (continued)
188
Our generally cautious stance, as well as overall portfolio positioning has not changed very much in the
last 12 months. Stock markets in Asia and globally have shot through previous highs, as investors remain sanguine
on the prospect of the global economic recovery continuing into 2018. Weak inflationary pressures have called into
question the need for tightening measures, which has added to the market’s bullish sentiment. However, history and
our experience suggest that such benign conditions do not endure; although we do not know what the catalyst will
be or when it will appear, we are mindful of a potential reversal in fortunes and – at current heady valuations – the
growing risks to capital preservation. On the other hand, our longer-term time horizon means that we are able to
look past the short-term noise. While there is plenty to worry about on a macro level, there are still plenty of
opportunities for the bottom-up investor. We have added to quality companies in our portfolio and continue to prefer
exporters and US dollar earners as being amongst Asia’s more competitive companies.
First State Investment (Hong Kong) Limited
February 2018

First State Asia Pacific Select Fund
Performance Table
as of 31 December 2017 (Unaudited)
189
Financial period Total net asset
value
Net asset
value per
share
Class I
Dec 2015 US$ 299,230 US$ 10.63
Dec 2016 US$ 6,523 US$ 10.87
Dec 2017 US$ 93,967 US$ 14.95
Class III
Dec 2015 US$ 94,311,289 US$ 14.00
Dec 2016 US$90,573,000 US$ 14.29
Dec 2017 US$ 125,990,250 US$ 19.80
Financial period The highest issue
price
The lowest
redemption
price
Class I
Dec 2013 US$ 10.79 US$ 10.00
Dec 2014 US$ 11.69 US$ 9.63
Dec 2015 US$ 12.23 US$ 9.88
Dec 2016 US$ 11.83 US$ 9.41
Dec 2017 US$ 14.95 US$ 10.85
Class III
Dec 2010 US$ 12.06 US$ 8.99
Dec 2011 US$ 12.78 US$ 9.86
Dec 2012 US$ 13.54 US$ 10.75
Dec 2013 US$ 14.41 US$ 12.42
Dec 2014 US$ 15.27 US$ 12.53
Dec 2015 US$ 16.04 US$ 12.98
Dec 2016 US$ 15.53 US$ 12.40
Dec 2017 US$ 19.80 US$ 14.27

First State Asia Pacific Select Fund
Schedule of Investments
as of 31 December 2017
190
The schedule that follows includes financial assets designated at fair value through profit or loss
Number of
shares
Fair value
US$
% of net
assets
Australia (2016: 8,195,331, 9.05%) 7,646,204 6.06
Brambles 136,220 1,072,354 0.85
CSL 39,759 4,391,831 3.48
Ramsay Health Care 39,806 2,182,019 1.73
China (2016: 7,268,960, 8.02%) 17,833,176 14.14
AAC Technologies Holdings 111,500 1,988,715 1.58
Baidu 3,431 805,393 0.64
China Mengniu Dairy 715,000 2,126,982 1.69
China Resources Land 351,956 1,035,741 0.82
Ctrip Com International ADR 21,600 966,600 0.76
ENN Energy Holdings 325,000 2,318,265 1.84
Fuyao Glass Industry 294,931 1,243,400 0.98
Gree Electric Appliances 287,600 1,931,180 1.53
Midea Group 522,475 4,450,029 3.53
Shanghai International Airport 139,800 966,871 0.77
Hong Kong (2016: 12,695,838, 14.02%) 15,232,437 12.08
AIA Group 254,000 2,166,051 1.72
CK Hutchison Holdings 219,301 2,752,609 2.18
CSPC Pharmaceutical 492,000 993,361 0.79
Dairy Farm International Holdings 282,000 2,216,520 1.76
Jardine Matheson Holdings 32,527 1,976,015 1.57
Minth Group 342,000 2,063,207 1.63
Techtronic Industries 228,500 1,489,585 1.18
The Link Real Estate Investment Trust 169,915 1,575,089 1.25
India (2016: 16,509,293, 18.23%) 21,065,652 16.71
Axis Bank 139,779 1,235,022 0.98
Dabur India 222,415 1,218,574 0.97
Godrej Consumer Products 97,620 1,528,594 1.21
HDFC Bank 188,838 5,539,623 4.39
HDFC Standard Life Insurance 40,368 244,128 0.19
Housing Development Finance 120,146 3,219,580 2.55
Kotak Mahindra Bank 81,633 1,292,008 1.03
Lupin 41,457 574,887 0.46
Marico 123,697 625,001 0.50
Nestle India 12,280 1,514,310 1.20

First State Asia Pacific Select Fund
Schedule of Investments (continued)
as of 31 December 2017
191
Number of
shares
Fair value
US$
% of net
assets
India (continued)
Tata Consultancy Services 47,701 2,018,721 1.60
Tech Mahindra 260,249 2,055,204 1.63
Indonesia (2016: Nil) 3,231,561 2.56
Bank Central Asia 1,159,700 1,871,931 1.48
Indocement Tunggal Prakarsa 840,400 1,359,630 1.08
Japan (2016: 5,533,775, 6.11%) 14,352,736 11.38
Asahi Intecc 36,400 1,255,061 1.00
Fast Retailing 3,100 1,237,190 0.98
Keyence 3,800 2,131,485 1.69
Koito Manufacturing 14,600 1,027,566 0.82
Misumi 76,300 2,223,976 1.76
Pigeon 31,500 1,200,880 0.95
Ryohin Keikaku 3,900 1,216,476 0.96
SMC 2,900 1,195,254 0.95
Tsuruha Holdings 12,400 1,688,154 1.34
Unicharm 45,200 1,176,694 0.93
Malaysia (2016: 889,730, 0.98%) 1,189,703 0.94
Public Bank 231,700 1,189,703 0.94
Philippines (2016: 5,863,749, 6.47%) 7,882,079 6.25
BDO Unibank 631,375 2,077,933 1.65
DMCI Holdings 3,988,700 1,152,642 0.91
Manila Water 2,253,500 1,268,501 1.01
SM Investments 77,070 1,531,161 1.21
Universal Robina 611,120 1,851,842 1.47
Singapore (2016: 4,562,776, 5.04%) 5,479,066 4.35
DBS Group Holdings 97,552 1,814,768 1.44
Oversea Chinese Banking 395,058 3,664,298 2.91
South Korea (2016: 9,081,131, 10.02%) 11,655,895 9.25
Amore Pacific Group 7,783 1,029,314 0.82
Hanon Systems 100,101 1,305,073 1.03
Hanssem 6,114 1,032,237 0.82

First State Asia Pacific Select Fund
Schedule of Investments (continued)
as of 31 December 2017
192
Number of
shares
Fair value
US$
% of net
assets
South Korea (continued)
LG Chemical 3,144 1,194,316 0.95
LG Household & Health Care 1,624 1,811,130 1.44
Naver 1,757 1,433,748 1.14
Samsung Electronics 1,964 3,850,077 3.05
Taiwan (2016: 12,698,432, 14.02%) 13,841,425 10.98
Advantech 259,390 1,841,662 1.46
Delta Electronics Industrial 366,721 1,774,975 1.41
President Chain Store 187,000 1,791,284 1.42
Taiwan Semiconductor Manufacturing 927,000 7,175,746 5.69
Uni-President Enterprises 565,000 1,257,758 1.00
Thailand (2016: 3,084,854, 3.41%) 3,082,518 2.45
Delta Electronics 413,500 929,391 0.74
Kasikorn Bank 293,600 2,153,127 1.71
United States (2016: 2,486,209, 2.74%) 3,210,911 2.55
3M 6,218 1,465,707 1.16
ResMed 203,133 1,745,204 1.39
Total financial assets designated at fair value through profit
or loss* 125,703,363 99.70
Cash and other net assets 380,854 0.30
Total net assets attributable to redeemable participating
shareholders 126,084,217 100.00
Total cost of financial assets designated at fair value
through profit or loss (2016: 94,646,038) 98,605,049
Analysis of net investments
% of
total
assets
*Transferable securities admitted to an official stock
exchange listing or traded on a regulated market 125,703,363 99.32

First State Asia Pacific Select Fund
Portfolio Changes (Unaudited)
193
The schedule of portfolio changes is based on financial assets designated at fair value through
profit or loss
Number of
shares purchased
Number of
shares sold
3M 705 1,012
AAC Technologies Holdings 57,000 53,000
Advantech 27,390 55,000
AIA Group 28,800 54,200
Amore Pacific Group 3,092 5,998
Asahi Intecc 45,200 8,800
Asustek Computer - 4,000
Axis Bank 155,206 15,427
Baidu 530 2,045
Bank Central Asia 1,348,300 188,600
BDO Unibank 252,865 194,020
BDO Unibank Rights 98,975 98,975
Brambles 14,302 242,969
China Mengniu Dairy 260,000 207,000
China Oilfield Services - 446,000
China Resources Land 407,956 56,000
China South Publishing & Media Group 280,196 460,896
CK Hutchison Holdings 32,500 179,500
CSL 5,089 17,759
CSPC Pharmaceutical 56,000 80,000
Ctrip Com International 25,100 3,500
Dabur India 25,209 36,182
Dairy Farm International Holdings 47,700 45,900
DBS Group Holdings 13,630 34,300
Delta Electronics - 456,600
Delta Electronics Industrial - 94,000
DMCI Holdings 481,300 947,800
Dr Reddys Laboratories 3,499 50,019
ENN Energy Holdings 102,000 97,000
Fast Retailing 4,000 900
Fuyao Glass Industry 165,331 173,200
Giant Manufacturing - 153,000
Godrej Consumer Products 67,904 26,124
Gree Electric Appliances 350,600 63,000
Hanon Systems 134,474 34,373
Hanssem 6,114 -
HDFC Bank 43,645 30,720
HDFC Standard Life Insurance 40,368 -

First State Asia Pacific Select Fund
Portfolio Changes (Unaudited) (continued)
194
Number of
shares purchased
Number of
shares sold
Hong Kong & China Gas - 251,652
Housing Development Finance 54,864 19,545
IDFC - 940,510
IDFC Bank - 367,724
Indocement Tunggal Prakarsa 977,100 136,700
Infosys Technologies 36,957 113,738
Jardine Matheson Holdings 4,181 5,300
Kasikorn Bank 118,800 47,700
Keyence 4,400 600
Koito Manufacturing 16,900 2,300
Kotak Mahindra Bank 9,253 13,280
LG 1,805 26,537
LG Chemical 431 4,325
LG Household & Health Care 300 1,458
Lupin 4,699 6,744
Manila Water 1,096,500 366,600
Marico 14,021 20,123
MediaTek - 78,000
Midea Group 607,475 85,000
Minth Group 218,000 134,000
Misumi 19,100 26,700
Naver 1,533 465
Nestle India 14,278 1,998
Oversea Chinese Banking 116,900 64,300
Pigeon 3,600 11,000
President Chain Store 24,000 59,000
Public Bank 67,000 37,700
Ramsay Health Care 23,620 6,475
ResMed 23,024 33,045
Ryohin Keikaku - 2,400
Samsung Electronics 686 337
Samsung Fire & Marine Insurance - 3,503
Shanghai International Airport 139,800 -
Shimano - 6,300
Singapore Telecommunications 40,100 446,600
SM Investments 12,640 52,640
SMC 400 1,400
Sun Art Retail Group - 450,000
Taiwan Semiconductor Manufacturing 177,000 169,000
Tata Consultancy Services 11,231 14,189

First State Asia Pacific Select Fund
Portfolio Changes (Unaudited) (continued)
195
Number of
shares purchased
Number of
shares sold
Tech Mahindra 208,742 111,043
Techtronic Industries 265,500 37,000
The Link Real Estate Investment Trust 21,500 50,500
Tsingtao Brewery - 184,000
Tsuruha Holdings 14,400 2,000
Unicharm 45,200 -
Uni-President Enterprises 923,000 358,000
Universal Robina 424,180 99,420
The Schedule of Portfolio Changes in Investments reflects the aggregate purchases of a security
exceeding one percent of the total value of purchases for the year and aggregate sales of a security
exceeding one percent of the total sales for the year.

Stewart Investors Worldwide Equity Fund
Investment Manager’s Report (Unaudited)
196
Performance
01/01/14 01/01/15 01/01/16 01/01/17
To To To To
31/12/14 31/12/15 31/12/16 31/12/17
Stewart Investors Worldwide Equity Fund “the Fund”
- Class I -1.94% -0.16% 8.32% 23.19%
- Class III -1.18% 0.51% 9.28% 24.24%
- Class I (Dist)^* -1.88% n/a n/a n/a
MSCI AC World Index# 4.71% -1.84% 8.48% 24.62%
(Performance calculation is based on official dealing NAV per share)
^Dividend distribution return
*The class I (Dist) closed at 19 Oct 2015
#Benchmarks are being included for illustrative purposes and there is no guarantee that a fund will outperform a benchmark Past performance is no indication of current or future performance and the performance data does not take account of
commissions and costs incurred in the issue and redemption of units.
Global Markets rose in 2017 with the MSCI AC World Index gaining 24.6% in US dollar terms. At a sector
level, Information Technology and Materials were particularly strong, while Energy and Telecom Services lagged.
Unilever rose as it announced a restructuring after the failed Kraft-Heinz bid, which included selling its
more commoditised spreads business. German consumer franchises Henkel and Beiersdorf both climbed on positive
earnings growth.
On the negative side, Delfi Limited declined on weak demand in Indonesia where confectionary remains
an aspirational good and Brambles fell because of competitive pressures in the US. Dr. Reddy’s Laboratories
continued to be impacted by regulatory pressure and US FDA quality concerns, as well as rising competition.
Major purchases during the period included ASICS, a branded sporting goods company with improving
long-term growth prospects, which was available at a reasonable valuation. We bought L Brands, a ‘specialty retailer’
operating under the Victoria’s Secret and Bath & Body Works brands. We also bought Remgro, a well-managed
South African conglomerate.
We sold Novo Nordisk on valuation, especially as insulin-free ways to treat diabetes seem to be increasing,
and Nestlé as we believed there were better opportunities in other consumer companies. We sold Vapores on
valuation concerns.
We do not fear missing out on rising stock prices. Having our own money invested in the funds we run,
we spend our time worrying about capital preservation and paying careful attention to the warning signs. This
mindset of capital preservation is why we do not lose too much sleep over not owning the popular internet companies
known as FANGs (Facebook, Amazon, Netflix and Google, the latter now known as Alphabet). We remain
convinced that companies with strong balance sheets and conservative business owners should provide positive
long-term returns for investors.
First State Investment (Hong Kong) Limited
February 2018

Stewart Investors Worldwide Equity Fund
Performance Table
as of 31 December 2017 (Unaudited)
197
Financial period Total net asset
value
Net asset
value per
share
Class I
Dec 2015 US$ 2,065,534 US$ 12.14
Dec 2016 US$ 2,864,406 US$ 13.15
Dec 2017 US$ 3,122,525 US$ 16.20
Class III
Dec 2015 US$ 21,528,620 US$ 11.74
Dec 2016 US$ 22,224,931 US$ 12.83
Dec 2017 US$ 27,047,232 US$ 15.94
Financial period The highest issue
price
The lowest
redemption
price
Class I
Dec 2011 US$ 10.20 US$ 8.00
Dec 2012 US$ 10.71 US$ 9.09
Dec 2013 US$ 12.42 US$ 10.64
Dec 2014 US$ 12.86 US$ 11.40
Dec 2015 US$ 12.92 US$ 11.48
Dec 2016 US$ 13.80 US$ 11.23
Dec 2017 US$ 16.20 US$ 13.10
Class III
Dec 2011 US$ 10.13 US$ 9.52
Dec 2013 US$ 11.83 US$ 10.08
Dec 2014 US$ 12.30 US$ 10.93
Dec 2015 US$ 12.44 US$ 11.09
Dec 2016 US$ 13.44 US$ 10.88
Dec 2017 US$ 15.94 US$ 12.79

Stewart Investors Worldwide Equity Fund
Performance Table (continued)
as of 31 December 2017 (Unaudited)
198
Financial period The highest issue
price
The lowest
redemption
price
Class I Distributing
Dec 2011 US$ 10.20 US$ 8.72
Dec 2012 US$ 10.66 US$ 9.08
Dec 2013 US$ 12.34 US$ 10.59
Dec 2014 US$ 12.78 US$ 11.31
Dec 2015 US$ 12.82 US$ 11.38

Stewart Investors Worldwide Equity Fund
Schedule of Investments
as of 31 December 2017
199
The schedule that follows includes financial assets designated at fair value through profit or loss
Number of
shares
Fair value
US$
% of net
assets
Australia (2016: 295,278, 1.18%) 627,363 2.08
Newcrest Mining 35,167 627,363 2.08
Brazil (2016: 530,445, 2.12%) 444,992 1.47
Natura Cosmeticos 44,586 444,992 1.47
Chile (2016: 1,064,779, 4.24%) 797,673 2.64
Cia Cervecerias Unidas 21,275 320,117 1.06
Sociedad Matriz SAAM 4,448,182 477,556 1.58
Denmark (2016: 384,003, 1.53%) - - -
Germany (2016: 4,436,013, 17.68%) 5,287,844 17.53
Beiersdorf 16,042 1,881,875 6.24
Draegerwerk AG & Co 2,989 216,014 0.72
Henkel 22,074 2,642,924 8.76
Merck KGaA 5,063 547,031 1.81
Hong Kong (2016: 526,433, 2.10%) 500,304 1.66
Texwinca Holdings 314,000 172,756 0.57
Vitasoy International Holdings 128,000 327,548 1.09
India (2016: 1,586,271, 6.32%) 2,087,086 6.92
Tata Consultancy Services 26,467 1,120,092 3.71
United Breweries 22,044 372,653 1.24
Wipro 120,717 594,341 1.97
Japan (2016: 1,190,236, 4.74%) 1,677,269 5.56
Asics 42,300 675,116 2.24
Kansai Paint 9,000 234,178 0.78
Unicharm 29,500 767,975 2.54
Malaysia (2016: 226,389, 0.90%) - - -
Nigeria (2016: 115,322, 0.46%) 172,052 0.57
Unilever Nigeria 1,523,657 172,052 0.57

Stewart Investors Worldwide Equity Fund
Schedule of Investments (continued)
as of 31 December 2017
200
Number of
shares
Fair value
US$
% of net
assets
Norway (2016: 155,788, 0.62%) - -
Singapore (2016: 624,675, 2.49%) 1,238,416 4.10
Delfi 297,500 316,252 1.05
Oversea Chinese Banking 99,421 922,164 3.05
South Africa (2016: 541,464, 2.16%) 614,497 2.04
Impala Platinum Holdings 55,366 145,963 0.49
Standard Bank 29,466 468,534 1.55
South Korea (2016: Nil) 584,428 1.94
Remgro 30,472 584,428 1.94
Switzerland (2016: 1,246,168, 4.97%) 676,720 2.24
Energiedienst Holding 11,329 300,929 1.00
SGS 145 375,791 1.24
Taiwan (2016: Nil) 494,199 1.64
Uni-President Enterprises 222,000 494,199 1.64
United Kingdom (2016: 4,456,842, 17.76%) 4,065,780 13.48
Antofagasta 20,270 272,080 0.90
GlaxoSmithKline 25,419 451,665 1.50
Lloyds Banking Group 658,090 598,574 1.98
PZ Cussons 166,930 731,567 2.42
Tesco 180,838 508,779 1.69
Tullow Oil 93,126 258,549 0.86
Unilever 22,327 1,244,566 4.13
United States (2016: 3,413,988, 13.61%) 5,281,627 17.50
Bed Bath & Beyond 10,569 239,705 0.79
Berkshire Hathaway 4 1,196,840 3.97
Expeditor International 9,999 653,535 2.17
Fastenal 9,917 546,823 1.81
First of Long Island 9,390 271,841 0.90
Kirby 6,529 438,422 1.45
Limited Brands 11,840 722,477 2.39
Loews 24,172 1,211,984 4.02
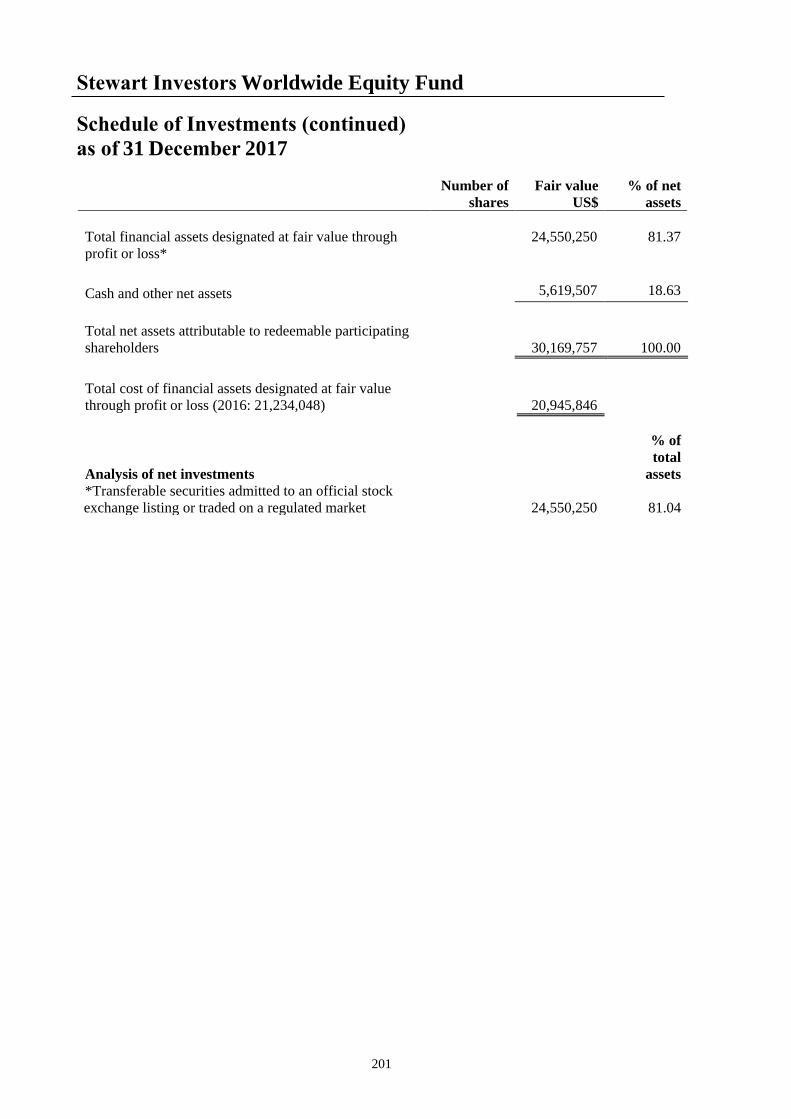
Stewart Investors Worldwide Equity Fund
Schedule of Investments (continued)
as of 31 December 2017
201
Number of
shares
Fair value
US$
% of net
assets
Total financial assets designated at fair value through
profit or loss*
24,550,250 81.37
Cash and other net assets 5,619,507 18.63
Total net assets attributable to redeemable participating
shareholders 30,169,757 100.00
Total cost of financial assets designated at fair value
through profit or loss (2016: 21,234,048) 20,945,846
Analysis of net investments
% of
total
assets
*Transferable securities admitted to an official stock
exchange listing or traded on a regulated market
24,550,250 81.04

Stewart Investors Worldwide Equity Fund
Portfolio Changes (Unaudited)
202
The schedule of portfolio changes is based on financial assets designated at fair value through
profit or loss
Number of
shares purchased
Number of
shares sold
Antofagasta - 21,114
Asics 42,300 -
Bed Bath & Beyond 10,569 -
Beiersdorf 3,442 -
Berkshire Hathaway - 3
Brambles 68,124 68,124
Cia Cervecerias Unidas - 16,136
Cia Sud Americana de Vapores 578,596 13,295,398
Compania Sud Americana de Vapores Rights 578,596 578,596
Delfi 297,500 -
Dr Reddys Laboratories - 5,569
Draegerwerk AG & Co - 2,322
Duratex - 61,265
Expeditor International 9,999 10,017
Fastenal 9,917 -
First of Long Island - 2,949
GlaxoSmithKline 7,541 -
Grainger W W 3,444 3,444
Henkel 1,878 1,263
Impala Platinum Holdings 55,366 -
Kansai Paint - 14,000
Kirby 2,387 -
Kuehne + Nagel International 1,887 3,765
Limited Brands 14,471 2,631
Lloyds Banking Group 55,518 -
Loews 17,828 -
Markel - 270
Merck KGaA 683 2,752
Natura Cosmeticos - 12,314
Nestle - 4,355
Newcrest Mining 14,996 -
Novo Nordisk 1,928 12,576
Oversea Chinese Banking 11,400 13,100
Public Bank - 51,500
PZ Cussons 17,040 -
Remgro 30,472 -
SGS - 61
Standard Bank 5,400 24,763
Tata Consultancy Services 3,505 -

Stewart Investors Worldwide Equity Fund
Portfolio Changes (Unaudited) (continued)
203
Number of
shares purchased
Number of
shares sold
Tesco 73,094 -
Texwinca Holdings 314,000 -
Tomra Systems - 14,947
Tullow Oil 54,017 -
Tullow Oil Rights 58,800 58,800
Unicharm - 5,500
Unilever - 34,015
Unilever Nigeria 520,273 -
Unilever Nigeria Rights 520,273 520,273
Uni-President Enterprises 222,000 -
United Breweries 14,590 -
Vitasoy International Holdings 68,000 202,000
Wipro 64,277 7,837
The Schedule of Portfolio Changes in Investments reflects the aggregate purchases of a security
exceeding one percent of the total value of purchases for the year and aggregate sales of a security
exceeding one percent of the total sales for the year.

First State Emerging Markets Bond Fund
Investment Manager’s Report (Unaudited)
204
Performance
01/01/14 01/01/15 01/01/16 01/01/17
To To To To
31/12/14 31/12/15 31/12/16 31/12/17
First State Emerging Markets Bond Fund “the Fund”**
- Class I 7.09% 0.17% 8.78% n/a
- Class I (Dist)^ 7.18% 0.12% 8.65% n/a - Class I (Monthly Dist)^ 7.09% 0.22% 8.59% n/a - Class I (HKD Monthly Dist)^ 7.13% 0.20% 8.74% n/a - Class III* n/a% n/a% 1.30% n/a
JP Morgan Emerging Market Bond - Global Diversified
Index# 7.43% 1.18% 10.15% n/a
JP Morgan Emerging Market Bond - Global Diversified
Index (HKD)# 7.44% 1.12% 10.19% n/a
(Performance calculation is based on official dealing NAV per share)
^ Dividend adjustment return
*Inception date – 5 December 2016 and closing date –23 November 2017
** The First State Emerging Market Bond Fund terminated on 23 November 2017
#Benchmarks are being included for illustrative purposes and there is no guarantee that a fund will outperform a benchmark.
Past performance is no indication of current or future performance and the performance data does not take account of
commissions and costs incurred in the issue and redemption of units.

First State Emerging Markets Bond Fund
Performance Table
as of 31 December 2017 (Unaudited)
205
Financial period Total net asset
value
Net asset
value per
share
Class I
Dec 2015 US$ 14,375,984 US$ 11.96
Dec 2016 US$ 35,036 US$ 13.01
Class I Distributing
Dec 2015 US$ 11,788,326 US$ 10.08
Dec 2016 US$ 246,578 US$ 10.40
Class I Monthly Distributing
Dec 2015 US$ 12,434 US$ 9.91
Dec 2016 US$ 13,503 US$ 10.24
Class I HKD Monthly Distributing
Dec 2015 HKD 27,432 HKD 99.14
Dec 2016 HKD 29,830 HKD 102.51
Class III
Dec 2016 US$ 27,713,361 US$ 10.13
* The First State Emerging Market Bond Fund terminated on 23 November 2017
Financial period The highest issue
price
The lowest
redemption
price
Class I
Dec 2011 US$ 10.02 US$ 9.69
Dec 2012 US$ 11.67 US$ 9.87
Dec 2013 US$ 11.84 US$ 10.71
Dec 2014 US$ 12.20 US$ 11.08
Dec 2015 US$ 12.45 US$ 11.80
Dec 2016 US$ 15.01 US$ 11.75
Dec 2017 US$ 14.42 US$ 12.90

First State Emerging Markets Bond Fund
Performance Table (continued)
as of 31 December 2017 (Unaudited)
206
Financial period The highest issue
price
The lowest
redemption
price
Class I Distributing
Dec 2011 US$ 10.02 US$ 9.69
Dec 2012 US$ 11.34 US$ 9.87
Dec 2013 US$ 11.41 US$ 9.94
Dec 2014 US$ 11.03 US$ 10.02
Dec 2015 US$ 10.75 US$ 9.99
Dec 2016 US$11.06 US$ 9.78
Dec 2017 US$ 10.75 US$ 10.25
Class I Monthly Distributing
Dec 2015 US$ 10.63 US$ 9.86
Dec 2016 US$ 10.88 US$ 9.69
Dec 2017 US$ 10.79 US$ 10.21
Class I HKD Monthly Distributing
Dec 2013 HKD 103.33 HKD 97.65
Dec 2014 HKD 107.73 HKD 99.35
Dec 2015 HKD 106.30 HKD 98.69
Dec 2016 HKD 108.94 HKD 97.51
Dec 2017 HKD 105.20 HKD 102.28
Class III
Dec 2016 US$10.13 US$ 10.00
Dec 2017 US$ 11.14 US$ 10.15

First State Emerging Markets Bond Fund
Portfolio Changes (Unaudited)
207
The schedule of portfolio changes is based on financial assets designated at fair value through
profit or loss
Number of
shares purchased
Number of
shares sold
African Export Import Bank 4.125% 20/06/2024 200,000 200,000
Argentine Republic Government International Bond 0%
31/12/2033 - 100,000
Argentine Republic Government International Bond 0%
15/12/2035 - 1,060,000
Argentine Republic Government International Bond 2.5%
31/12/2038 350,000 650,000
Argentine Republic Government International Bond
5.625% 26/01/2022 200,000 200,000
Argentine Republic Government International Bond
6.875% 22/04/2021 - 270,000
Argentine Republic Government International Bond
6.875% 26/01/2027 350,000 350,000
Argentine Republic Government International Bond
7.125% 28/06/2017 100,000 100,000
Argentine Republic Government International Bond
7.125% 06/07/2036 - 150,000
Argentine Republic Government International Bond
7.625% 18/04/2037 100,000 100,000
Argentine Republic Government International Bond 8.75%
07/05/2024 170,000 170,000
Armenia Government International Bond 6% 30/09/2020 - 200,000
Banco Nacional De Desenvol Econo 4.75% 09/05/2024 200,000 200,000
Banque Centrale de Tunisie 5.75% 30/01/2025 - 200,000
Bermuda Government International Bond 4.138%
03/01/2023 - 200,000
Biz Finance (Ukreximbank) 9.625% 27/04/2022 - 150,000
Brazil Government International Bond 10% 01/01/2027 650 650
Brazil Minas 5.333% 15/02/2028 - 200,000
Brazilian Government International Bond 4.25%
07/01/2025 - 275,000
Brazilian Government International Bond 5% 27/01/2045 - 400,000
Brazilian Government International Bond 5.625%
07/01/2041 175,000 175,000
Caixa Economica Federal 2.375% 06/11/2017 - 300,000
CNOOC Finance 2.625% 05/05/2020 - 650,000
CNOOC Finance 3% 09/05/2023 - 500,000
Colombia Government International Bond 2.625%
15/03/2023 - 300,000
Colombia Government International Bond 4% 26/02/2024 - 200,000
Colombia Government International Bond 5% 15/06/2045 200,000 200,000

First State Emerging Markets Bond Fund
Portfolio Changes (Unaudited) (continued)
208
Number of
shares purchased
Number of
shares sold
Colombia Government International Bond 6.125%
18/01/2041 100,000 200,000
Corp Nacional del Cobre de Chile 4.5% 01/08/2047 200,000 200,000
Costa Rica Government International Bond 7.158%
12/03/2045 - 200,000
Croatia Government International Bond 5.5% 04/04/2023 200,000 200,000
Croatia Government International Bond 6.375%
24/03/2021 - 450,000
Croatia Government International Bond 6.625%
14/07/2020 - 250,000
Dominican Republic International Bond 5.5% 27/01/2025 - 200,000
Dominican Republic International Bond 6.6% 28/01/2024 - 100,000
Dominican Republic International Bond 6.85% 27/01/2045 100,000 300,000
Dominican Republic International Bond 6.875%
29/01/2026 - 300,000
Ecuador Government International Bond 10.5%
24/03/2020 - 400,000
Ecuador Government International Bond 10.75%
28/03/2022 200,000 200,000
Egypt Government International Bond 5.75% 29/04/2020 - 100,000
Egypt Government International Bond 6.125% 31/01/2022 200,000 200,000
Egypt Government International Bond 6.875% 30/04/2040 - 100,000
Egypt Government International Bond 7.5% 31/01/2027 400,000 400,000
Egypt Government International Bond 8.50% 31/01/2047 200,000 200,000
El Salvador Government International Bond 5.875%
30/01/2025 30,000 30,000
El Salvador Government International Bond 6.375%
18/01/2027 25,000 25,000
El Salvador Government International Bond 7.65%
15/06/2035 120,000 120,000
El Salvador Government International Bond 7.75%
24/01/2023 80,000 80,000
El Salvador Government International Bond 8.625%
28/02/2029 85,000 85,000
Eskom Holdings 5.75% 26/01/2021 - 400,000
Eskom Holdings 7.125% 11/02/2025 200,000 200,000
Export Credit Bank of Turkey 5.375% 08/02/2021 - 310,000
Gazprom 7.288% 16/08/2037 100,000 100,000
Georgia Government International Bond 6.875%
12/04/2021 - 200,000
Ghana Government International Bond 9.25% 15/09/2022 - 200,000
Ghana Government International Bond 10.75% 14/10/2030 - 200,000
Guatemala (Govt of) 4.5% 03/05/2026 - 200,000
Hungary Government International Bond 4.125%
19/02/2018 - 200,000

First State Emerging Markets Bond Fund
Portfolio Changes (Unaudited) (continued)
209
Number of
shares purchased
Number of
shares sold
Hungary Government International Bond 5.375%
21/02/2023 - 200,000
Hungary Government International Bond 5.375%
25/03/2024 - 250,000
Hungary Government International Bond 7.625%
29/03/2041 - 150,000
Indonesia Government International Bond 4.15%
29/03/2027 450,000 450,000
Indonesia Government International Bond 5.25%
08/01/2047 200,000 200,000
Indonesia Government International Bond 5.875%
15/01/2024 - 300,000
Instituto Costarricense de Electricidad 6.95% 10/11/2021 - 400,000
Israel Electric 5% 12/11/2024 - 400,000
Ivory Coast Government International Bond 5.375%
23/07/2024 - 200,000
Ivory Coast Government International Bond 6.125%
15/06/2033 200,000 200,000
Jamaica Government International Bond 6.75% 28/04/2028 - 200,000
Jamaica Government International Bond 7.625%
09/07/2025 - 200,000
Kazakhstan Government International Bond 3.875%
14/10/2024 - 200,000
Kazakhstan Government International Bond 4.875%
14/10/2044 - 200,000
Kazakhstan Government International Bond 6.5%
21/07/2045 - 200,000
KazMunayGaz 4.75% 19/04/2027 200,000 200,000
KazMunayGaz 5.75% 19/04/2047 400,000 400,000
KazMunayGaz 7% 05/05/2020 - 300,000
KazMunayGaz 9.125% 02/07/2018 - 100,000
Kingdom Of Bahrain 5.624% 12/02/2024 - 200,000
Lebanon Government International Bond 5.45%
28/11/2019 - 350,000
Lebanon Government International Bond 6% 27/01/2023 - 200,000
Lebanon Government International Bond 7.25%
23/03/2037 200,000 200,000
Mexico City Airport Trust 4.25% 31/10/2026 - 200,000
Mexico Government International Bond 3.6% 30/01/2025 - 250,000
Morocco Government International Bond 5.5% 11/12/2042 200,000 200,000
Nacional Financiera 3.375% 05/11/2020 - 200,000
Namibia International Bond 5.25% 29/10/2025 - 200,000
Nigeria Government International Bond 6.75% 28/01/2021 200,000 200,000
Nigeria Government International Bond 7.875%
16/02/2032 200,000 200,000
Northern Lights III 7% 16/08/2019 - 250,000

First State Emerging Markets Bond Fund
Portfolio Changes (Unaudited) (continued)
210
Number of
shares purchased
Number of
shares sold
Oman Government International Bond 5.375% 08/03/2027 200,000 200,000
Oman Government International Bond 6.5% 08/03/2047 400,000 400,000
Pakistan Government International Bond 6.75%
03/12/2019 - 200,000
Panama Government International Bond 4% 22/09/2024 - 200,000
Panama Government International Bond 4.3% 29/04/2053 - 200,000
Paraguay Government International Bond 4.7% 27/03/2027 200,000 200,000
Pertamina Persero 5.25% 23/05/2021 - 300,000
Pertamina Persero 5.625% 20/05/2043 - 200,000
Pertamina Persero 6% 03/05/2042 - 200,000
Peru Government International Bond 5.625% 18/11/2050 - 290,000
Petrobras Global Finance 4.375% 20/05/2023 - 110,000
Petrobras Global Finance 5.875% 01/03/2018 - 150,000
Petrobras Global Finance 6.125% 17/01/2022 100,000 100,000
Petrobras Global Finance 6.25% 17/03/2024 150,000 150,000
Petrobras Global Finance 7.375% 17/01/2027 200,000 200,000
Petrobras Global Finance 8.375% 23/05/2021 - 200,000
Petrobras International Finance 5.375% 27/01/2021 - 150,000
Petroleos De Venezuela 5.375% 12/04/2027 - 500,000
Petroleos De Venezuela 6% 16/05/2024 150,000 450,000
Petroleos De Venezuela 8.5% 27/10/2020 - 150,000
Petroleos Mexicanos 3.5% 30/01/2023 - 120,000
Petroleos Mexicanos 4.25% 15/01/2025 100,000 100,000
Petroleos Mexicanos 4.875% 24/01/2022 - 110,000
Petroleos Mexicanos 5.375% 13/03/2022 - 40,000
Petroleos Mexicanos 5.5% 21/01/2021 - 360,000
Petroleos Mexicanos 5.5% 27/06/2044 - 48,000
Petroleos Mexicanos 5.625% 23/01/2046 - 50,000
Petroleos Mexicanos 6.5% 13/03/2027 270,000 410,000
Petroleos Mexicanos 6.5% 02/06/2041 375,000 375,000
Petroleos Mexicanos 6.75% 21/09/2047 100,000 100,000
Philippine (Govt of) 3.7% 01/03/2041 - 200,000
Philippine (Govt of) 3.95% 20/01/2040 - 200,000
Philippine (Govt of) 7.75% 14/01/2031 150,000 150,000
Provincia De Buenos Aires 6.5% 15/02/2023 100,000 100,000
Qatar Government International Bond 2.375% 02/06/2021 - 200,000
Republic of Azerbaijan 4.75% 18/03/2024 - 200,000
Republic of Costa Rica 4.25% 26/01/2023 - 200,000
Republic of Gabon 6.375% 12/12/2024 - 200,000
Republic of Kenya 5.875% 24/06/2019 - 200,000

First State Emerging Markets Bond Fund
Portfolio Changes (Unaudited) (continued)
211
Number of
shares purchased
Number of
shares sold
Republic of Kenya 6.875% 24/06/2024 200,000 200,000
Republic of Serbia 4.875% 25/02/2020 - 250,000
Republic of Serbia 5.25% 21/11/2017 - 200,000
Republic of Serbia 6.75% 1/11/2024 - 750,000
Republic of Slovenia 5.25% 18/02/2024 - 200,000
Republic of Slovenia 5.5% 26/10/2022 200,000 200,000
Republic of Turkey 6% 14/01/2041 200,000 400,000
Romanian Government International Bond 4.875%
22/01/2024 - 200,000
Romanian Government International Bond 6.125%
22/01/2044 - 50,000
Romanian Government International Bond 6.75%
07/02/2022 - 200,000
Russia Federation 3.25% 04/04/2017 - 800,000
Russia Government International Bond 6.7% 15/05/2019 2,000,000 2,000,000
Russian Foreign Bond - Eurobond 3.5% 16/01/2019 - 200,000
Russian Foreign Bond - Eurobond 4.875% 16/09/2023 200,000 400,000
Russian Foreign Bond - Eurobond 5% 29/04/2020 - 100,000
Russian Foreign Bond - Eurobond 5.875% 16/09/2043 200,000 400,000
Saudi Arabia Government International Bond 2.375%
26/10/2021 - 200,000
Senegal Government International Bond 6.25% 23/05/2033 200,000 200,000
Sinopec Group Overseas Development 2.5% 17/10/2018 - 200,000
Sinopec Group Overseas Development 2.5% 28/04/2020 - 200,000
South Africa Government International Bond 4.665%
17/01/2024 100,000 100,000
South Africa Government International Bond 5.875%
16/09/2025 - 200,000
Southern Gas Corridor 6.875% 24/03/2026 - 200,000
Sri Lanka Government International Bond 5.75%
18/01/2022 200,000 400,000
Sri Lanka Government International Bond 5.875%
25/07/2022 - 250,000
Sri Lanka Government International Bond 6.825%
18/07/2026 200,000 200,000
State Oil Company of Azerbaijan Republic 4.75%
13/03/2023 200,000 200,000
TC Ziraat Bankasi 5.125% 03/05/2022 200,000 200,000
Trinidad and Tobago Government International Bond
4.50% 04/08/2026 - 200,000
Turkey Government International Bond 4.25% 14/04/2026 - 200,000
Turkey Government International Bond 4.875%
09/10/2026 - 200,000
Turkey Government International Bond 5.75% 22/03/2024 200,000 200,000
Turkey Government International Bond 5.75% 11/05/2047 200,000 200,000

First State Emerging Markets Bond Fund
Portfolio Changes (Unaudited) (continued)
212
Number of
shares purchased
Number of
shares sold
Turkey Government International Bond 6% 25/03/2027 300,000 300,000
Ukraine Government International Bond 7.75% 01/09/2019 250,000 500,000
Ukraine Government International Bond 7.75% 01/09/2021 100,000 350,000
Ukraine Government International Bond 7.75% 01/09/2025 - 100,000
Ukraine Government International Bond 7.75% 01/09/2027 - 100,000
United Mexican States 4.6% 23/01/2046 - 200,000
United Mexican States 5.75% 12/10/2110 - 50,000
Uruguay Government International Bond 4.375%
27/10/2027 - 230,000
Uruguay Government International Bond 5.1% 18/06/2050 - 270,000
Uruguay Government International Bond 7.875%
15/01/2033 - 31,000
Uruguay Government international Bond 9.875%
20/06/2022 800,000 800,000
Vale Overseas 4.375% 11/01/2022 - 120,000
Vale Overseas 6.25% 10/08/2026 130,000 130,000
Venezuela Governement International Bond 7.75%
13/10/2019 100,000 100,000
Venezuela Governement International Bond 9%
07/05/2023 - 200,000
Venezuela Governement International Bond 9.25%
15/09/2027 - 210,000
Vietnam Government International Bond 4.8% 19/11/2024 - 400,000
Vnesheconombank Via VEB Finance 5.45% 22/11/2017 - 150,000
Vnesheconombank Via VEB Finance 6.8% 22/11/2025 - 130,000
The Schedule of Portfolio Changes in Investments reflects the aggregate purchases of a security
exceeding one percent of the total value of purchases for the year and aggregate sales of a security
exceeding one percent of the total sales for the year.

First State Global Credit Income Fund
Investment Manager’s Report (Unaudited)
213
Performance
01/01/14 01/01/15 01/01/16 01/01/17
To To To To
31/12/14 31/12/15 31/12/16 31/12/17
First State Global Credit Income Fund “the Fund”
- GBP Class III Hedged Distributing^ 1.21% -1.90% 3.36% 2.35%
- Class V 1.81% -1.13% 5.00% 4.38%
BBA Libor GBP 1 Month Index# 0.49% 0.51% 0.41% 0.28%
BBA Libor USD 1 Month Index# 0.16% 0.20% 0.50% 1.13%
(Performance calculation is based on official dealing NAV per share)
^ Dividend adjustment return
#Benchmarks are being included for illustrative purposes and there is no guarantee that a fund will outperform a benchmark
Past performance is no indication of current or future performance and the performance data does not take account of
commissions and costs incurred in the issue and redemption of units.
The Fund outperformed the benchmark (gross of fees) over the 12 months, benefiting from a tightening in
credit spreads and stock selection. The portfolio continues to benefit from positive carry.
Credit spreads largely maintained a tightening trend throughout the year as spreads moved to historically tight levels
in some markets. Heightened political and geopolitical tensions continued to drive bond markets for most of the
year but credit was relatively resilient.
We started the year amidst heightened political risks that have to materially dissipate during the first quarter.
Along with changes to monetary policy, specifically a rate hike in the US, political risks dominated market sentiment
with most noise created by the Trump administration followed by European elections. President Trump was
inaugurated on 20 January and by quarter end the new administration had released little detail on policy changes
that had been expected to be pro-growth in nature. This led to a stalling of the growth momentum witnessed in
markets immediately following the election result.
The rest of the period was continued to see bond markets impacted by political and geopolitical events
including European elections (specifically a centre-left win in France by Emanuel Macron), talks of possible
impeachment of the US President and Brexit’s somewhat shaky negotiations at times. Headlines were also
dominated by rising tensions between the US and North Korea over missile testing, the US retaliation on Syria’s
chemical weapons and terror attacks in the UK.
Speculation around the Trump administration’s abilities to pass significant reforms promised in the pre-
election campaign also drove markets. It took almost the whole year for tax reforms to be agreed, with them passing
in December and leading to a “risk-on” market environment to finish the year.
After a sluggish end to 2016, investment-grade issuance picked up significantly in 2017 with the first week alone
posting record levels of weekly issuance. This set the tone for the year with heightened demand for investment
grade credit continuing through to December, topping off an insatiable year of appetite for higher yielding securities.
The demand was met by annual global issuance of US$2.2 trillion from corporates taking advantage of low global
interest rates.
Volatility continued in the US high yield credit market with weakness from the Energy and Materials sector.
As expected we started to see a number of investment grade bonds in this sector downgraded to high yield by the
major ratings agencies. US High Yield credit spreads moved notably tighter in the year with the Bank of America
Merrill Lynch Global High Yield index (BB-B) spread 37 bps narrower, closing at 2.86%. Spread tightening was
driven by the general risk-on sentiment in markets.
First State Investment (Hong Kong) Limited
February 2018

First State Global Credit Income Fund
Performance Table
as of 31 December 2017 (Unaudited)
214
Financial period Total net asset
value
Net asset
value per
share
GBP Class III Hedged Distributing
Dec 2015 £ 3,215 £ 9.62
Dec 2016 £ 3,321 £ 9.69
Dec 2017 £ 3,400 £ 9.65
Class V
Dec 2015 US$ 137,049,243 US$ 9.81
Dec 2016 US$ 115,258,803 US$ 10.04
Dec 2017 US$ 71,953,099 US$ 10.19
Financial period The highest issue
price
The lowest
redemption
price
GBP Class III Hedged Distributing
Dec 2012 £ 10.04 £ 9.99
Dec 2013 £ 10.23 £ 10.03
Dec 2014 £ 10.25 £ 9.95
Dec 2015 £ 10.01 £ 9.59
Dec 2016 £ 9.72 £ 9.38
Dec 2017 £ 9.82 £ 9.61
Class V
Dec 2012 US$ 10.04 US$ 9.99
Dec 2013 US$ 10.26 US$ 10.03
Dec 2014 US$ 10.35 US$ 10.06
Dec 2015 US$ 10.15 US$ 9.76
Dec 2016 US$10.05 US$ 9.58
Dec 2017 US$ 10.22 US$ 10.03

First State Global Credit Income Fund
Schedule of Investments
as of 31 December 2017
215
The schedule that follows includes financial assets designated at fair value through profit or loss
Number of
shares
Fair value
US$
% of net
assets
Australian Dollar (2016: 4,370,767, 3.79%) 1,621,004 2.25
Corp Andina De Fomento 6.25% 08/11/2023 500,000 447,886 0.62
Liberty Series FRN 25/08/2048 500,000 357,844 0.50
Perth Airport 6% 23/07/2020 500,000 418,338 0.58
Swedbank AB FRN 17/02/2022 500,000 396,936 0.55
Canadian Dollar (2016: 381,230, 0.33%) 405,258 0.56
Bell Canada 3.55% 02/03/2026 500,000 405,258 0.56
Euro (2016: 7,538,385, 6.54%) 11,846,947 16.46
ABN AMRO Bank 2.875% 18/01/2028 400,000 522,772 0.73
Accor 2.625% 05/02/2021 300,000 385,086 0.54
Aon 2.875% 14/05/2026 250,000 334,044 0.46
Aroundtown Property Holdings 1.5% 15/07/2024 500,000 607,045 0.84
AstraZeneca 0.875% 24/11/2021 500,000 613,843 0.85
Atlantia 1.875% 13/07/2027 400,000 489,913 0.68
Carlsberg Breweries 2.5% 28/05/2024 400,000 527,488 0.73
Carrefour 1.25% 03/06/2025 500,000 613,052 0.85
Danone SA 1.25% 30/05/2024 300,000 372,851 0.52
Dream Global Funding 1.375% 21/12/2021 500,000 600,124 0.83
DS Smith 1.375% 26/07/2024 200,000 240,970 0.33
EasyJet 1.125% 18/10/2023 500,000 607,202 0.84
FedEx 1% 11/01/2023 250,000 305,370 0.42
Fresenius Fin Ireland 0.875% 31/01/2022 500,000 609,989 0.85
Inmobiliaria Colonial Socimi 1.625% 28/11/2025 500,000 594,954 0.83
ISS Global 1.5% 31/08/2027 300,000 358,789 0.50
Johnson Controls 1% 15/09/2023 300,000 363,792 0.51
LYB International Finance 1.875% 02/03/2022 400,000 503,531 0.70
National Australia Bank VRN 6.75% 26/06/2023 400,000 495,204 0.69
Priceline Group 1.8% 03/03/2027 500,000 611,004 0.85
Telecom Italia 3% 30/09/2025 300,000 386,013 0.54
Telefonica Emisiones 0.75% 13/04/2022 500,000 607,986 0.85
Thermo Fisher Scientific 1.45% 16/03/2027 100,000 119,497 0.17
VF Corporation 0.625% 20/09/2023 200,000 240,311 0.33
Volkswagen International Finance 1.125% 02/10/2023 300,000 367,650 0.51
Zimmer Biomet Holdings 1.414% 13/12/2022 300,000 368,467 0.51
Sterling Pound (2016: 3,441,987, 2.99%) 2,380,964 3.31
Barclays Bank 10% 21/05/2021 300,000 508,742 0.71
Chorus 6.75% 06/04/2020 250,000 376,659 0.52
Credit Suisse London 6.75% VRN 16/01/2023 400,000 540,938 0.75
Lloyds Bank 7.625% 22/04/2025 200,000 362,678 0.51
SPD Finance 5.875% 17/07/2026 250,000 434,203 0.60
TDC 5.625% 23/02/2023 100,000 157,744 0.22

First State Global Credit Income Fund
Schedule of Investments (continued)
as of 31 December 2017
216
Number of
shares
Fair value
US$
% of net
assets
United States Dollar (2016: 93,750,859, 81.34%) 51,492,287 71.56
A Schulman 6.875% 01/06/2023 33,000 34,526 0.05
AbbVie 3.2% 14/05/2026 500,000 498,633 0.69
Abu Dhabi National Energy 7.25% 01/08/2018 200,000 205,893 0.29
Actavis Funding 3.45% 15/03/2022 500,000 508,443 0.71
AIA Group 3.2% 11/03/2025 500,000 497,752 0.69
AMC Networks 5% 01/04/2024 50,000 50,750 0.07
American International Group 4.125% 15/02/2024 500,000 528,552 0.73
Amgen 2.60% 19/08/2026 200,000 191,820 0.27
Amgen 3.875% 15/11/2021 270,000 281,900 0.39
Anheuser-Busch InBev Worldwide 7.75% 15/01/2019 500,000 528,079 0.73
Antero Midstream Partners 5.375% 15/09/2024 90,000 93,150 0.13
AP Moeller Maersk 3.875% 28/09/2025 300,000 301,402 0.42
APT Pipelines 4.2% 23/03/2025 500,000 519,533 0.72
AT&T 4.1% 15/02/2028 535,000 536,986 0.75
Axiata 3.466% 19/11/2020 250,000 253,342 0.35
BAE Systems Holdings 4.75% 11/10/2021 100,000 106,686 0.15
Banco Santander 3.5% 11/04/2022 400,000 408,014 0.57
Bank of America 3.004% VRN 20/12/2023 271,000 271,848 0.38
Becton Dickinson 3.363% 06/06/2024 500,000 501,743 0.70
Bharti Airtel International 5.35% 20/05/2024 200,000 215,645 0.30
Block Communications 6.875% 15/02/2025 63,000 66,465 0.09
BlueScope Steel Finance 6.5% 15/05/2021 54,000 56,430 0.08
BNP Paribas 5% 15/01/2021 500,000 537,559 0.75
Boardwalk Pipelines 4.95% 15/12/2024 400,000 428,494 0.60
Boston Properties 3.125% 01/09/2023 500,000 504,370 0.70
Boyd Gaming 6.375% 01/04/2026 73,000 79,205 0.11
BPCE 4% 15/04/2024 450,000 476,174 0.66
Brambles USA 5.35% 01/04/2020 500,000 526,274 0.73
Building Materials 6% 15/10/2025 71,000 76,147 0.11
Carnival 3.95% 15/10/2020 500,000 522,058 0.73
Cascades 5.5% 15/07/2022 19,000 19,570 0.03
CCO Holdings 5.5% 01/05/2026 55,000 56,512 0.08
Centrica 4% 16/10/2023 500,000 513,773 0.71
CenturyLink 5.8% 15/03/2022 77,000 75,749 0.10
Charter Communications Operating 4.908% 23/07/2025 400,000 425,362 0.59
Chevron 3.191% 24/06/2023 250,000 256,997 0.36
China Overseas Finance 5.5% 10/11/2020 500,000 534,037 0.74
China Railway Xunjie 3.25% 28/07/2026 200,000 196,539 0.27
China Reinsurance Finance Corporation 3.375%
09/03/2022 500,000 493,018 0.68
China State Construction Finance 3.375% 29/11/2022 500,000 496,036 0.69
Cincinnati Bell 7% 15/07/2024 96,000 95,520 0.13
Citigroup 2.6% 26/10/2020 200,000 200,745 0.28
CLP Power Hong Kong Financing 4.75% 19/03/2020 500,000 521,672 0.72
CMHI Finance 7.125% 18/06/2018 500,000 509,375 0.71
CMT MTN Pte 3.731% 21/03/2018 200,000 201,331 0.28
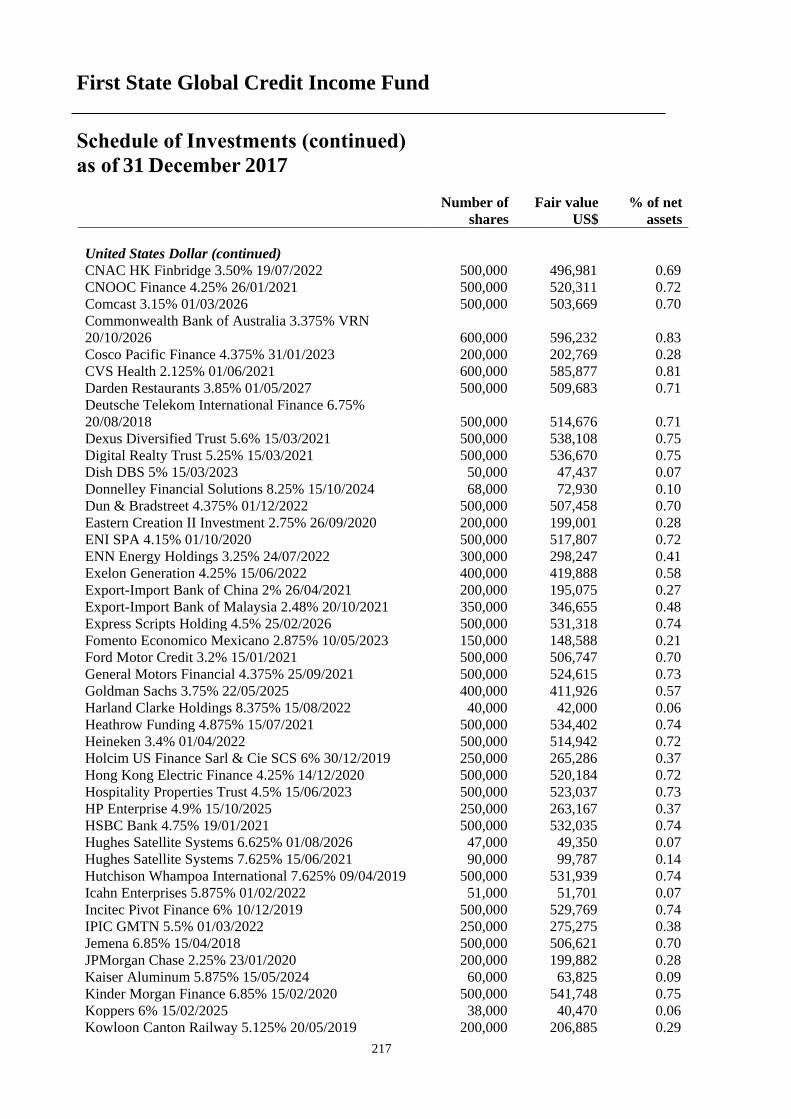
First State Global Credit Income Fund
Schedule of Investments (continued)
as of 31 December 2017
217
Number of
shares
Fair value
US$
% of net
assets
United States Dollar (continued)
CNAC HK Finbridge 3.50% 19/07/2022 500,000 496,981 0.69
CNOOC Finance 4.25% 26/01/2021 500,000 520,311 0.72
Comcast 3.15% 01/03/2026 500,000 503,669 0.70
Commonwealth Bank of Australia 3.375% VRN
20/10/2026 600,000 596,232 0.83
Cosco Pacific Finance 4.375% 31/01/2023 200,000 202,769 0.28
CVS Health 2.125% 01/06/2021 600,000 585,877 0.81
Darden Restaurants 3.85% 01/05/2027 500,000 509,683 0.71
Deutsche Telekom International Finance 6.75%
20/08/2018 500,000 514,676 0.71
Dexus Diversified Trust 5.6% 15/03/2021 500,000 538,108 0.75
Digital Realty Trust 5.25% 15/03/2021 500,000 536,670 0.75
Dish DBS 5% 15/03/2023 50,000 47,437 0.07
Donnelley Financial Solutions 8.25% 15/10/2024 68,000 72,930 0.10
Dun & Bradstreet 4.375% 01/12/2022 500,000 507,458 0.70
Eastern Creation II Investment 2.75% 26/09/2020 200,000 199,001 0.28
ENI SPA 4.15% 01/10/2020 500,000 517,807 0.72
ENN Energy Holdings 3.25% 24/07/2022 300,000 298,247 0.41
Exelon Generation 4.25% 15/06/2022 400,000 419,888 0.58
Export-Import Bank of China 2% 26/04/2021 200,000 195,075 0.27
Export-Import Bank of Malaysia 2.48% 20/10/2021 350,000 346,655 0.48
Express Scripts Holding 4.5% 25/02/2026 500,000 531,318 0.74
Fomento Economico Mexicano 2.875% 10/05/2023 150,000 148,588 0.21
Ford Motor Credit 3.2% 15/01/2021 500,000 506,747 0.70
General Motors Financial 4.375% 25/09/2021 500,000 524,615 0.73
Goldman Sachs 3.75% 22/05/2025 400,000 411,926 0.57
Harland Clarke Holdings 8.375% 15/08/2022 40,000 42,000 0.06
Heathrow Funding 4.875% 15/07/2021 500,000 534,402 0.74
Heineken 3.4% 01/04/2022 500,000 514,942 0.72
Holcim US Finance Sarl & Cie SCS 6% 30/12/2019 250,000 265,286 0.37
Hong Kong Electric Finance 4.25% 14/12/2020 500,000 520,184 0.72
Hospitality Properties Trust 4.5% 15/06/2023 500,000 523,037 0.73
HP Enterprise 4.9% 15/10/2025 250,000 263,167 0.37
HSBC Bank 4.75% 19/01/2021 500,000 532,035 0.74
Hughes Satellite Systems 6.625% 01/08/2026 47,000 49,350 0.07
Hughes Satellite Systems 7.625% 15/06/2021 90,000 99,787 0.14
Hutchison Whampoa International 7.625% 09/04/2019 500,000 531,939 0.74
Icahn Enterprises 5.875% 01/02/2022 51,000 51,701 0.07
Incitec Pivot Finance 6% 10/12/2019 500,000 529,769 0.74
IPIC GMTN 5.5% 01/03/2022 250,000 275,275 0.38
Jemena 6.85% 15/04/2018 500,000 506,621 0.70
JPMorgan Chase 2.25% 23/01/2020 200,000 199,882 0.28
Kaiser Aluminum 5.875% 15/05/2024 60,000 63,825 0.09
Kinder Morgan Finance 6.85% 15/02/2020 500,000 541,748 0.75
Koppers 6% 15/02/2025 38,000 40,470 0.06
Kowloon Canton Railway 5.125% 20/05/2019 200,000 206,885 0.29

First State Global Credit Income Fund
Schedule of Investments (continued)
as of 31 December 2017
218
Number of
shares
Fair value
US$
% of net
assets
United States Dollar (continued)
Kroger 2.95% 01/11/2021 400,000 404,121 0.56
Li & Fung 5.25% 13/05/2020 500,000 522,781 0.73
Louisiana Pacific 4.875% 15/09/2024 30,000 31,088 0.04
MasTec 4.875% 15/03/2023 90,000 91,800 0.13
Medtronic 3.15% 15/03/2022 200,000 204,908 0.28
Mercer International 6.5% 01/02/2024 42,000 44,782 0.06
Meritor 6.25% 15/02/2024 75,000 79,313 0.11
Merrill Lynch 6.875% 25/04/2018 250,000 253,830 0.35
Morgan Stanley 3.875% 29/04/2024 200,000 208,738 0.29
MPLX 4.125% 01/03/2027 500,000 512,239 0.71
Nationwide Building Society 6.25% 25/02/2020 500,000 538,975 0.75
Newcrest Finance 4.2% 01/10/2022 500,000 520,974 0.72
Newell Brands 4.0% 01/12/2024 300,000 311,595 0.43
Norbord 6.25% 15/04/2023 100,000 108,585 0.15
Nordea Bank 4.875% 27/01/2020 500,000 525,293 0.73
NRG Energy 7.25% 15/05/2026 75,000 81,938 0.11
Optus Finance 4.625% 15/10/2019 500,000 517,889 0.72
Oracle 2.5% 15/05/2022 500,000 500,843 0.70
Orange 5.375% 08/07/2019 500,000 522,746 0.73
Origin Energy Finance 5.45% 14/10/2021 400,000 431,687 0.60
Party City Holdings 6.125% 15/08/2023 82,000 84,767 0.12
PCCW-HKT Capital 3.75% 08/03/2023 250,000 255,594 0.36
Penske Automotive Group 5.75% 01/10/2022 99,000 102,156 0.14
Perry Ellis International 7.875% 01/04/2019 95,000 95,237 0.13
Petronas Capital 5.25% 12/08/2019 500,000 522,036 0.72
Pinnacle Entertainment 5.625% 01/05/2024 59,000 63,631 0.09
Post Holdings 5% 15/08/2026 17,000 16,830 0.02
Potash Corporation of Saskatchewan 6.5% 15/05/2019 500,000 525,859 0.73
PQ Corporation 6.75% 15/11/2022 49,000 52,614 0.07
Proven Honour Capital 4.125% 19/05/2025 500,000 515,554 0.72
Rite Aid 6.125% 01/04/2023 62,000 56,298 0.08
Royal Bank of Scotland 3.875% 12/09/2023 500,000 509,012 0.71
Sabine Pass Liquefaction 5.625% 01/03/2025 200,000 220,648 0.31
Scentre Group Trust 3.5% 12/02/2025 500,000 502,659 0.70
Schneider Electric 2.95% 27/09/2022 500,000 503,596 0.70
SES 3.6% 04/04/2023 500,000 502,400 0.70
Sky 3.75% 16/09/2024 250,000 260,874 0.36
Smiths Group 3.625% 12/10/2022 500,000 503,166 0.70
Stryker 3.5% 15/03/2026 500,000 516,239 0.72
Swire Pacific MTN Financing 5.5% 19/08/2019 500,000 523,211 0.73
Sydney Airport Finance 3.625% 28/04/2026 500,000 505,322 0.70
T Mobile USA 6.5% 15/01/2026 34,000 37,196 0.05
Taylor Morrison Communities 5.25% 15/04/2021 70,000 71,575 0.10
Telesat Canada 8.875% 15/11/2024 61,000 68,549 0.10

First State Global Credit Income Fund
Schedule of Investments (continued)
as of 31 December 2017
219
Number of
shares
Fair value
US$
% of net
assets
United States Dollar (continued)
Tempur Sealy International 5.5% 15/06/2026 21,000 21,525 0.03
Tempur Sealy International 5.625% 15/10/2023 57,000 59,565 0.08
Teva Pharmaceutical Finance 2.8% 21/07/2023 100,000 86,989 0.12
Teva Pharmaceutical Finance 3.65% 10/11/2021 500,000 475,941 0.66
Three Gorges Finance I 2.3% 02/06/2021 500,000 492,015 0.68
Transurban Finance 4.125% 02/02/2026 500,000 520,553 0.72
Tri Pointe Holdings 5.875% 15/06/2024 47,000 50,335 0.07
UBM 5.75% 03/11/2020 500,000 519,323 0.72
United Overseas Bank 2.88% VRN 08/03/2027 200,000 196,311 0.27
United Rentals North America 5.5% 15/05/2027 80,000 84,200 0.12
United States Steel 8.375% 01/07/2021 52,000 56,420 0.08
Unitedhealth Group 2.875% 15/03/2022 500,000 506,146 0.70
Vale Overseas 4.375% 11/01/2022 400,000 415,000 0.58
Ventas Realty 4.125% 15/01/2026 500,000 522,147 0.73
Verizon Communications 5.15% 15/09/2023 500,000 556,804 0.77
Vodafone Group 2.5% 26/09/2022 200,000 198,579 0.28
Walgreens Boots Alliance 3.45% 01/06/2026 500,000 494,536 0.69
Wells Fargo FRN 31/10/2023 500,000 513,451 0.71
Welltower 4% 01/06/2025 300,000 310,276 0.43
Westpac Banking Corporation 3.625% VAR 28/02/2023 500,000 503,445 0.70
William Lyon Homes 5.875% 31/01/2025 74,000 75,850 0.11
Woodside Finance 3.65% 05/03/2025 350,000 352,310 0.49
Woodside Finance 8.75% 01/03/2019 100,000 106,803 0.15
Woolworths 4% 22/09/2020 500,000 515,533 0.72
Total bonds* 67,746,460 94.14
Forward contracts** (2016: 260,375, 0.22%) - -
Future contracts7*** (2016: 12,286, 0.01%) 76,062 0.11
EUX Euro Bond Mar 18 (18) 24,485 0.04
CBOT 5 Year U.S. Notes Mar 18 (30) 16,313 0.02
CBOT 10 Year U.S. Notes Mar 18 (24) 13,984 0.02
EUX Euro BOBL Mar 18 (16) 13,136 0.02
MSE Canada 10 Year Bond Mar 18 (3) 4,261 0.01
SFE 10 Year Bond Mar 18 (2) 2,235 0.00
EUX Euro Schatz Mar 18 (10) 1,648 0.00
Interest rate swaps** (2016: 1,212,562, 1.05%) 1,008,764 1.40
IRS USD 1.3211% 17/12/2020 3 10,500,000 229,221 0.32
IRS CMGCI 1.3486% 07/10/2026 4 2,600,000 173,161 0.24
IRS CMGCI 1.3674% 25/04/2026 5 2,900,000 139,382 0.19
IRS NAB 1.335% 01/04/2026 5 2,500,000 126,167 0.18
IRS CBA 1.3231% 22/06/2021 4 3,500,000 122,585 0.17
IRS CMGCI 1.3674% 25/04/2021 5 3,600,000 103,074 0.14
IRS WBC 1.4357% 19/08/2022 1 4,900,000 48,142 0.07

First State Global Credit Income Fund
Schedule of Investments (continued)
as of 31 December 2017
220
Number of
shares
Fair value
US$
% of net
assets
Interest rate swaps (continued)
IRS CMGCI 1.3486% 07/10/2021 4 1,000,000 34,854 0.05
IRS WBC 1.3339% 03/04/2019 1 10,500,000 16,967 0.02
IRS CMGCI 0% 25/04/2024 1 1,300,000 9,600 0.01
IRS USD 1.3573% 19/07/2018 5 5,200,000 5,611 0.01
Total financial assets designated at fair value through
profit or loss* 68,831,286 95.65
Forward contracts** (2016: (5,831), (0.01%)) (105,293) (0.15)
Buy USD 1,292,549 / Sell AUD 1,700,000 1 (36,347) (0.05)
Buy USD 11,615,478 / Sell EUR 9,700,000 1 (31,453) (0.05)
Buy USD 2,469,633 / Sell GBP 1,850,000 1 (29,776) (0.04)
Buy USD 425,133 / Sell CAD 540,000 1 (5,906) (0.01)
Buy USD 178,314 / Sell EUR 150,000 2 (1,794) (0.00)
Buy GBP 3,271 / Sell USD 4,444 3 (16) (0.00)
Buy GBP 143 / Sell USD 194 3 (1) (0.00)
Future contracts 7*** (2016: (51,550), (0.04%)) (17,218) (0.02)
SFE 3 Year Bond Mar18 22 (11,152) (0.02)
CBOT 2 Year U.S. Notes Mar18 11 (3,070) (0.00)
Icf Ice Long Gilt Mar18 (4) (2,996) (0.00)
Interest rate swaps** (2016: 638,250), (0.55%)) (203,046) (0.28)
IRS USD 1.325% 20/09/2023 6 4,400,000 (162,715) (0.23)
IRS ANZ 1.83% 18/08/2020 3 3,750,000 (22,290) (0.03)
IRS GBP 0.5798% 14/12/2018 3 2,500,000 (15,862) (0.02)
IRS NAB 0% 01/04/2021 5 2,500,000 (2,179) (0.00)
Total financial liabilities designated at fair value through
profit or loss (325,557) (0.45)
Total financial assets and liabilities designated at fair
value through profit or loss 68,505,729 95.20
Cash and other net assets 3,451,958 4.80
Total net assets attributable to redeemable participating
shareholders 71,957,687 100.00
Total cost of financial assets designated at fair value
through profit or loss (2016: 108,980,387) 67,109,136

First State Global Credit Income Fund
Schedule of Investments (continued)
as of 31 December 2017
221
1The counterparty for the forward contracts and interest rate swap contracts is Westpac Banking
Corporation Sydney.
2The counterparty for the forward contracts is JP Morgan Chase Bank N.A New York.
3The counterparty for the forward contracts and interest rate swap contracts is ANZ Banking
Group Limited.
4The counterparty for the interest rate swap contracts is Commonwealth Bank of Australia.
5The counterparty for the interest rate swap contracts is National Australia Bank.
6The counterparty for the interest rate swap contracts is Morgan Stanley.
7The counterparty for the future contracts is JP Morgan Securities LLC.
Analysis of net investments
Fair
value
US$
% of total
assets
*Transferable securities admitted to an official stock
exchange listing or dealt in on another regulated market 67,746,460 93.40
**Financial derivative instruments traded over-the-counter 700,425 0.97
***Financial derivative instruments dealt on a regulated
market 58,844 0.08

First State Global Credit Income Fund
Portfolio Changes (Unaudited)
222
The schedule of portfolio changes is based on financial assets designated at fair value through
profit or loss
Number of
shares purchased
Number of
shares sold
AbbVie 3.2% 14/05/2026 500,000 -
ABN AMRO Bank 2.875% 18/01/2028 500,000 100,000
ABN AMRO Bank 4.25% 02/02/2017 - 250,000
Abu Dhabi National Energy 7.25% 01/08/2018 - 450,000
Acadia Healthcare 6.125% 15/03/2021 - 89,000
ACCO Brands 5.25% 15/12/2024 - 38,000
ADT 6.25% 15/10/2021 - 106,000
Aecom 5.125% 15/03/2027 20,000 20,000
AEP Industries 8.25% 15/04/2019 - 48,000
Aetna 3.2% 15/06/2026 - 500,000
Air Canada 7.75% 15/04/2021 - 70,000
Aircastle 5% 01/04/2023 - 75,000
Aleris International 9.5% 01/04/2021 5,000 77,000
Allianz 3.875% Perp - 400,000
Ally Financial 4.25% 15/04/2021 - 10,000
Ally Financial 4.625% 19/05/2022 - 58,000
Ally Financial 4.625% 30/03/2025 - 70,000
Ally Financial 5.75% 20/11/2025 - 54,000
Ally Financial 8% 01/11/2031 - 45,000
Altera 4.1% 15/11/2023 - 500,000
Ambank M 3.125% 03/07/2019 - 200,000
AMC Entertainment 5.875% 15/02/2022 - 120,000
AMC Entertainment 5.875% 15/11/2026 - 3,000
Amcor 2.75% 22/03/2023 - 500,000
American Airlines Group 4.625% 01/03/2020 - 100,000
American Axle & Manufacturing 6.625% 15/10/2022 32,000 82,000
Amkor Technology 6.375% 01/10/2022 - 100,000
Amsurg 5.625% 15/07/2022 - 130,000
Anglo American Capital 3.625% 14/05/2020 - 200,000
Anixter 5.5% 01/03/2023 - 97,000
Antero Resources 5% 01/03/2025 - 125,000
APT Pipelines 4.2% 23/03/2025 - 100,000
Argos Merger Sub 7.125% 15/03/2023 - 100,000
Aroundtown Property Holdings 1.5% 15/07/2024 500,000 -
Asbury Automotive Group 6% 15/12/2024 - 100,000
AT&T 4.1% 15/02/2028 - 445
AT&T 4.6% 15/02/2021 - 200,000

First State Global Credit Income Fund
Portfolio Changes (Unaudited) (continued)
223
Number of
shares purchased
Number of
shares sold
Atlantia 1.875% 13/07/2027 400,000 -
Aurizon Network 5.75% 28/10/2020 - 800,000
Australia & New Zealand Banking 3.45% VRN 08/08/2022 - 250,000
Avis Budget Car Rental 5.25% 15/03/2025 - 85,000
Banco Bilbao Vizcaya Argentaria 3% 20/10/2020 - 500,000
Banco De Credito E Inversiones 4% 11/02/2023 - 400,000
Banco Del Estado 4.125% 07/10/2020 - 750,000
Banco Santander 3.5% 11/04/2022 400,000 -
Banco Santander 4.5% 13/03/2017 - 1,000,000
Bank of America 3.004% VRN 20/12/2023 - 315
Barclays Bank 1.875% 23/03/2021 - 300,000
Barclays Bank 6.625% 30/03/2022 - 200,000
Barclays Bank 10% 21/05/2021 300,000 -
Bayer US Finance 3% 08/10/2021 - 500,000
Beazer Homes USA 8.75% 15/03/2022 - 47,000
Becton Dickinson 3.363% 06/06/2024 500,000 -
Belden 5.5% 01/09/2022 - 150,000
Berry Plastics 5.125% 15/07/2023 - 75,000
Bharti Airtel International 5.35% 20/05/2024 500,000 300,000
Block Communications 6.875% 15/02/2025 63,000 -
Block Communications 7.25% 01/02/2020 - 115,000
Blue Cube Spinco 9.75% 15/10/2023 - 53,000
BMW Finance 0.875% 17/11/2020 - 500,000
Boardwalk Pipelines 4.95% 15/12/2024 400,000 -
Bombardier 8.75% 01/12/2021 - 57,000
Boral Finance 3.0% 01/11/2022 100,000 100,000
BPCE 4% 15/04/2024 450,000 -
Brambles USA 5.35% 01/04/2020 - 250,000
Brookfield Residential Properties 6.125% 01/07/2022 - 97,000
Brunswick 4.625% 15/05/2021 - 106,000
Builders FirstSource 5.625% 01/09/2024 - 96,000
CA 5.375% 01/12/2019 - 750,000
Calatlantic Group 6.625% 01/05/2020 - 43,000
Calpine 5.375% 15/01/2023 - 120,000
Calpine 5.75% 15/01/2025 3,000 53,000
Cardtronics 5.125% 01/08/2022 - 38,000
Cargill 4.307% 14/05/2021 - 500,000
Carlsberg Breweries 2.5% 28/05/2024 - 100,000
Carnival 3.95% 15/10/2020 - 250,000
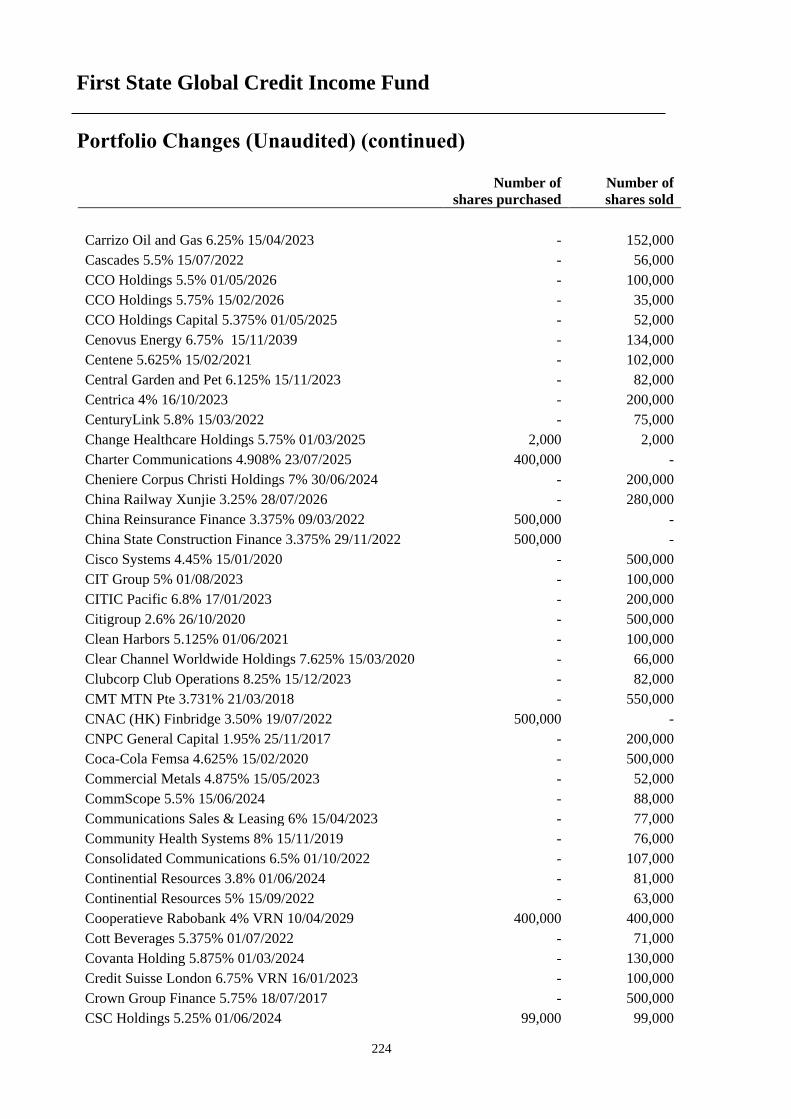
First State Global Credit Income Fund
Portfolio Changes (Unaudited) (continued)
224
Number of
shares purchased
Number of
shares sold
Carrizo Oil and Gas 6.25% 15/04/2023 - 152,000
Cascades 5.5% 15/07/2022 - 56,000
CCO Holdings 5.5% 01/05/2026 - 100,000
CCO Holdings 5.75% 15/02/2026 - 35,000
CCO Holdings Capital 5.375% 01/05/2025 - 52,000
Cenovus Energy 6.75% 15/11/2039 - 134,000
Centene 5.625% 15/02/2021 - 102,000
Central Garden and Pet 6.125% 15/11/2023 - 82,000
Centrica 4% 16/10/2023 - 200,000
CenturyLink 5.8% 15/03/2022 - 75,000
Change Healthcare Holdings 5.75% 01/03/2025 2,000 2,000
Charter Communications 4.908% 23/07/2025 400,000 -
Cheniere Corpus Christi Holdings 7% 30/06/2024 - 200,000
China Railway Xunjie 3.25% 28/07/2026 - 280,000
China Reinsurance Finance 3.375% 09/03/2022 500,000 -
China State Construction Finance 3.375% 29/11/2022 500,000 -
Cisco Systems 4.45% 15/01/2020 - 500,000
CIT Group 5% 01/08/2023 - 100,000
CITIC Pacific 6.8% 17/01/2023 - 200,000
Citigroup 2.6% 26/10/2020 - 500,000
Clean Harbors 5.125% 01/06/2021 - 100,000
Clear Channel Worldwide Holdings 7.625% 15/03/2020 - 66,000
Clubcorp Club Operations 8.25% 15/12/2023 - 82,000
CMT MTN Pte 3.731% 21/03/2018 - 550,000
CNAC (HK) Finbridge 3.50% 19/07/2022 500,000 -
CNPC General Capital 1.95% 25/11/2017 - 200,000
Coca-Cola Femsa 4.625% 15/02/2020 - 500,000
Commercial Metals 4.875% 15/05/2023 - 52,000
CommScope 5.5% 15/06/2024 - 88,000
Communications Sales & Leasing 6% 15/04/2023 - 77,000
Community Health Systems 8% 15/11/2019 - 76,000
Consolidated Communications 6.5% 01/10/2022 - 107,000
Continential Resources 3.8% 01/06/2024 - 81,000
Continential Resources 5% 15/09/2022 - 63,000
Cooperatieve Rabobank 4% VRN 10/04/2029 400,000 400,000
Cott Beverages 5.375% 01/07/2022 - 71,000
Covanta Holding 5.875% 01/03/2024 - 130,000
Credit Suisse London 6.75% VRN 16/01/2023 - 100,000
Crown Group Finance 5.75% 18/07/2017 - 500,000
CSC Holdings 5.25% 01/06/2024 99,000 99,000

First State Global Credit Income Fund
Portfolio Changes (Unaudited) (continued)
225
Number of
shares purchased
Number of
shares sold
CSC Holdings 6.75% 15/11/2021 - 145,000
CyrusOne 6.375% 15/11/2022 - 50,000
Dana Financing Luxembourg Sarl 6.5% 01/06/2026 - 22,000
Dana Holding 5.5% 15/12/2024 - 50,000
Dana Holding 6% 15/09/2023 - 30,000
Darden Restaurants 3.85% 01/05/2027 500,000 -
Darling Ingredients 5.375% 15/01/2022 - 71,000
Davita HealthCare Partners 5% 01/05/2025 - 89,000
Davita HealthCare Partners 5.125% 15/07/2024 - 30,000
DBS Bank 3.625% 21/09/2022 - 500,000
DBS Group Holdings 3.6% VRN Perp - 250,000
Dean Foods 6.5% 15/03/2023 - 175,000
Dell 6.5% 15/04/2038 29,000 29,000
Dexus Diversified Trust 5.6% 15/03/2021 - 250,000
Diamond Finance Corporation 2 7.125% 15/06/2024 - 30,000
Diamondback Energy 4.75% 01/11/2024 - 128,000
Diebold 8.5% 15/04/2024 - 96,000
Digital Globe 5.25% 01/02/2021 - 107,000
Digital Realty Trust 5.25% 15/03/2021 - 200,000
Dish DBS 6.75% 01/06/2021 - 100,000
Dream Global Funding 1.375% 21/12/2021 500,000 -
DS Smith 1.375% 26/07/2024 200,000 -
EarthLink 7.375% 01/06/2020 - 93,000
Eastern Creation II Investment 2.75% 26/09/2020 200,000 -
EasyJet 1.125% 18/10/2023 500,000 -
EDF 6.5% 26/01/2019 - 250,000
EMC 3.375% 01/06/2023 29,000 29,000
Emirates 5.75% 08/05/2019 - 500,000
Endo Finance 5.375% 15/01/2023 - 100,000
ENN Energy Holdings 3.25% 24/07/2022 300,000 -
Equinix 5.375% 01/04/2023 - 80,000
Equinix 5.875% 15/01/2026 - 13,000
Era Group 7.75% 15/12/2022 - 119,000
ESH Hospitality 5.25% 01/05/2025 - 96,000
Exelon Generation 4.25% 15/06/2022 400,000 -
Fairpoint Communications 8.75% 15/08/2019 - 100,000
FedEx 4% 15/01/2024 - 250,000
First Data Corporation 7% 01/12/2023 - 120,000
First Quantum Minerals 6.75% 15/02/2020 - 75,000

First State Global Credit Income Fund
Portfolio Changes (Unaudited) (continued)
226
Number of
shares purchased
Number of
shares sold
Fly Leasing 6.375% 15/10/2021 - 200,000
Freeport-McMoRan Copper & Gold 3.55% 01/03/2022 - 157,000
Fresenius Fin Ireland 0.875% 31/01/2022 500,000 -
Frontier Communications 6.875% 15/01/2025 - 75,000
Frontier Communications 7.125% 15/01/2023 - 125,000
Frontier Communications 10.5% 15/09/2022 - 56,000
Frontier Communications 11% 15/09/2025 - 40,000
GCI 6.75% 01/06/2021 - 150,000
General Motors Financial 4.375% 25/09/2021 - 200,000
Genesis Energy 5.75% 15/02/2021 - 82,000
Gibraltar Industries 6.25% 01/02/2021 - 100,000
Global Switch Property 6.25% 23/12/2020 - 1,000,000
Goldman Sachs 3.75% 22/05/2025 400,000 -
Goodman Funding 6% 22/03/2022 - 250,000
Goodman US Finance Two 6% 22/03/2022 - 500,000
Goodyear Tire & Rubber 5% 31/05/2026 - 99,000
Gray Television 5.125% 15/10/2024 - 34,000
Gray Television 5.875% 15/07/2026 - 67,000
Great Lakes Dredge & Dock 7.375% 01/02/2019 - 50,000
Gulfport Energy 6% 15/10/2024 - 10,000
Gulfport Energy 6.375% 15/05/2025 - 12,000
Gulfport Energy 6.625% 01/05/2023 - 150,000
Harland Clarke Holdings 8.375% 15/08/2022 40,000 -
Harvest Operations 2.125% 14/05/2018 - 750,000
HCA 7.5% 15/02/2022 - 125,000
HealthSouth 5.125% 15/03/2023 - 65,000
HealthSouth 5.75% 01/11/2024 - 30,000
Heathrow Funding 4.875% 15/07/2021 - 300,000
Herc Rentals 7.5% 01/06/2022 11,000 86,000
Hertz 5.5% 15/10/2024 - 22,000
Hertz 6.75% 15/04/2019 - 27,000
Hertz 8% 15/01/2021 35,000 35,000
Hill Rom Holdings 5.75% 01/09/2023 - 60,000
Hilton Grand Vacations Borrower 6.125% 01/12/2024 - 6,000
Holcim US Finance Sarl & Cie SCS 6% 30/12/2019 - 450,000
Home Depot 3% 01/04/2026 - 500,000
Hospitality Properties Trust 4.5% 15/06/2023 500,000 -
Hot Topic 9.25% 15/06/2021 11,000 77,000
HudBay Minerals 7.25% 15/01/2023 - 39,000

First State Global Credit Income Fund
Portfolio Changes (Unaudited) (continued)
227
Number of
shares purchased
Number of
shares sold
HudBay Minerals 7.625% 15/01/2025 - 6,000
Hughes Satellite Systems 6.625% 01/08/2026 15,000 -
Hughes Satellite Systems 7.625% 15/06/2021 - 50,000
Hyundai Capital Services 3.5% 13/09/2017 - 500,000
Icahn Enterprises 5.875% 01/02/2022 - 50,000
Imperial Tobacco Finance 7.75% 24/06/2019 - 400,000
Inception Merger 8.625% 15/11/2024 35,000 35,000
Inmarsat Finance 4.875% 15/05/2022 - 100,000
Inmobiliaria Colonial Socimi 1.625% 28/11/2025 500,000 -
Inversiones CMPC 6.125% 05/11/2019 - 500,000
Iron Mountain 5.75% 15/08/2024 - 100,000
ISS Global 1.5% 31/08/2027 300,000 -
iStar Financial 6.5% 01/07/2021 - 22,000
iStar Financial 7.125% 15/02/2018 - 57,000
JBS USA Finance 5.75% 15/06/2025 - 125,000
JC Penney 7.4% 01/04/2037 - 113,000
Johnson Controls International 1% 15/09/2023 300,000 -
JPMorgan Chase 2.25% 23/01/2020 - 550,000
KB Home 8% 15/03/2020 - 55,000
Kindred Healthcare 8.75% 15/01/2023 - 56,000
Kinross Gold 5.95% 15/03/2024 - 30,000
KLX 5.875% 01/12/2022 - 75,000
Koppers 6% 15/02/2025 38,000 -
Koppers 7.875% 01/12/2019 - 50,000
Kowloon Canton Railway 5.125% 20/05/2019 - 550,000
Kroger 2.95% 01/11/2021 - 238,000
L Brands 5.625% 15/10/2023 - 70,000
L Brands 6.875% 01/11/2035 28,000 42,000
Lennar 4.875% 15/12/2023 - 93,000
Level 3 Communications 5.75% 01/12/2022 - 75,000
LifePoint Health 5.375% 01/05/2024 34,000 -
LifePoint Health 5.5% 01/12/2021 31,000 31,000
LifePoint Hospitals 5.375% 01/05/2024 - 53,000
Live Nation Entertainment 4.875% 01/11/2024 - 50,000
Live Nation Entertainment 5.375% 15/06/2022 - 85,000
Lloyds Bank 7.625% 22/04/2025 200,000 -
Lloyds TSB Bank 4.625% 02/02/2017 - 500,000
LYB International Finance 1.875% 02/03/2022 - 100,000
Malayan Banking 3% 10/02/2017 - 586,000

First State Global Credit Income Fund
Portfolio Changes (Unaudited) (continued)
228
Number of
shares purchased
Number of
shares sold
Marriott International 6.375% 15/06/2017 - 750,000
McDonalds 3.7% 30/01/2026 - 600,000
Medtronic 3.15% 15/03/2022 - 400,000
Mercer International 6.50% 01/02/2024 42,000 -
Meritor 6.75% 15/06/2021 - 25,000
MGM Resorts International 7.75% 15/03/2022 - 100,000
Micron Technology 5.25% 01/08/2023 - 142,000
Morgan Stanley 3.875% 29/04/2024 200,000 -
Motorola Solutions 3.75% 15/05/2022 - 500,000
MPLX 4.125% 01/03/2027 500,000 -
MRT Mid Partners/MRT Mid Finance 7.25% 15/02/2021 - 106,000
MSCI 5.25% 15/11/2024 - 69,000
Murphy Oil 3.7% 01/12/2022 - 185,000
Mylan 3.15% 15/06/2021 - 400,000
Mylan 3.95% 15/06/2026 - 500,000
National Australia Bank VRN 6.75% 26/06/2023 - 100,000
National Bank of Abu Dhabi 3% 13/08/2019 - 500,000
Netflix 4.375% 15/11/2026 - 79,000
Netflix 5.375% 01/02/2021 - 59,000
Newcrest Finance 4.2% 01/10/2022 500,000 -
Newell Brands 4.0% 01/12/2024 300,000 -
Nexstar Broadcasting 6.125% 15/02/2022 - 71,000
Nexstar Broadcasting 6.875% 15/11/2020 - 92,000
Nielsen Finance 5% 15/04/2022 - 100,000
Nissan Motor Acceptance 1.55% 13/09/2019 - 300,000
Noble Holding International 7.75% 15/01/2024 - 51,000
Northern Tier Energy 7.125% 15/11/2020 - 155,000
Novelis 5.875% 30/09/2026 - 100,000
NRG Energy 6.25% 01/05/2024 - 75,000
NRG Energy 6.625% 15/03/2023 - 50,000
Numericable Group 6% 15/05/2022 - 200,000
Oasis Petroleum 6.875% 15/03/2022 100,000 100,000
Optus Finance Pty 4.625% 15/10/2019 - 250,000
Orange 5.375% 08/07/2019 - 100,000
Origin Energy Finance 5.45% 14/10/2021 - 350,000
Oversea-Chinese Banking 3.75% VRN 15/11/2022 - 750,000
Owens Brockway Packaging 5% 15/01/2022 - 130,000
Parsley Energy 5.25% 15/08/2025 5,000 5,000

First State Global Credit Income Fund
Portfolio Changes (Unaudited) (continued)
229
Number of
shares purchased
Number of
shares sold
Party City Holdings 6.125% 15/08/2023 82,000 -
Pattern Energy Group 5.875% 01/02/2024 13,000 13,000
PBF Holding 8.25% 15/02/2020 - 108,000
Peabody Securities Finance 6% 31/03/2022 43,000 43,000
Peabody Securities Finance 6.375% 31/03/2025 5,000 5,000
Pearson Dollar Finance 6.25% 06/05/2018 - 200,000
Penn National Gaming 5.625% 15/01/2027 23,000 23,000
Penn National Gaming 5.875% 01/11/2021 - 75,000
Pepsico 2.85% 24/02/2026 - 600,000
Pernod Ricard 5.75% 07/04/2021 - 500,000
PH Glatfelter 5.375% 15/10/2020 - 100,000
PolyOne 5.25% 15/03/2023 - 90,000
Post Holdings 6.75% 01/12/2021 - 14,000
Precision Drilling 6.5% 15/12/2021 - 89,000
Priceline Group 1.8% 03/03/2027 500,000 -
Prime Security Services Borrower 9.25% 15/05/2023 - 92,000
Procter & Gamble 2.7% 02/02/2026 - 600,000
Proven Honour Capital 4.125% 19/05/2025 500,000 -
PSA International 4.625% 11/09/2019 - 500,000
QBE Insurance Group 2.4% 01/05/2018 - 750,000
QEP Resources 5.25% 01/05/2023 - 200,000
QNB Finance 2.75% 31/10/2018 - 250,000
QTS LP Finance 5.875% 01/08/2022 - 60,000
Rabobank International 4% 19/09/2022 250,000 250,000
Rabobank Nederland 4.75% 15/01/2020 - 500,000
Range Resources 5% 15/08/2022 - 97,000
Ras Laffan 6.75% 30/09/2019 - 250,000
Regal Entertainment Group 5.75% 15/06/2023 - 50,000
Rent-A-Center 6.625% 15/11/2020 - 136,000
Revlon Consumer Products 5.75% 15/02/2021 - 43,000
Revlon Consumer Products 6.25% 01/08/2024 3,000 59,000
RHB Bank 3.088% 03/10/2019 - 500,000
RHP Hotel Properties 5% 15/04/2023 - 120,000
Rio Tinto Finance 3.5% 22/03/2022 - 64,000
Rite Aid 6.125% 01/04/2023 62,000 -
Rowan Cos 7.375% 15/06/2025 - 49,000
Royal Bank of Scotland 3.875% 12/09/2023 500,000 -
RR Donnelley and Sons 7% 15/02/2022 - 65,000
RR Donnelley and Sons 7.875% 15/03/2021 - 35,000

First State Global Credit Income Fund
Portfolio Changes (Unaudited) (continued)
230
Number of
shares purchased
Number of
shares sold
Ryder System 2.55% 01/06/2019 - 750,000
Sabine Pass Liquefaction 5.625% 01/03/2025 200,000 -
Sabine Pass Liquefaction 5.75% 15/05/2024 - 100,000
SBA Communications 4.875% 01/09/2024 40,000 40,000
Select Medical 6.375% 01/06/2021 - 114,000
Service International 5.375% 15/05/2024 - 50,000
Sesi 7.125% 15/12/2021 - 102,000
Sinclair Television Group 5.625% 01/08/2024 - 80,000
Sinopec Group Overseas Development 2.75% 17/05/2017 - 500,000
Sirius XM Radio 5.375% 15/07/2026 - 97,000
Smiths Group 3.625% 12/10/2022 - 250,000
Societe Generale 2.75% 12/10/2017 - 500,000
Sonic Automotive 5% 15/05/2023 - 25,000
Sonic Automotive 7% 15/07/2022 - 75,000
Sotheby's 5.25% 01/10/2022 - 52,000
Southwest Airlines 6.15% 01/08/2022 - 1,000,000
Speedway Motorsports 5.125% 01/02/2023 - 125,000
SPI Australia Assets 3.3% 09/04/2023 - 250,000
Sprint 7.125% 15/06/2024 50,000 50,000
Sprint 7.875% 15/09/2023 - 250,000
Statoil Hydro 5.25% 15/04/2019 - 500,000
Stockland Trust 1.5% 03/11/2021 - 500,000
Sumitomo Mitsui Financial 2.442% 19/10/2021 - 500,000
Sumitomo Mitsui Financial FRN 29/03/2022 750,000 750,000
Supervalu 7.75% 15/11/2022 42,000 42,000
Svenska Handelsbanken 4.5% 10/04/2019 - 500,000
Swedbank AB FRN 17/02/2022 500,000 -
Sydney Airport Finance 3.625% 28/04/2026 - 205,000
T Mobile USA 6.375% 01/03/2025 24,000 24,000
T Mobile USA 6.5% 15/01/2026 20,000 -
Taylor Morrison Communities 5.875% 15/04/2023 - 47,000
Teck Resources 6.25% 15/07/2041 41,000 41,000
Teck Resources 8% 01/06/2021 - 89,000
Teck Resources 8.5% 01/06/2024 - 11,000
Telecom Italia 3% 30/09/2025 500,000 200,000
Telecom Italia Capital 6% 30/09/2034 - 95,000
Teleflex 5.25% 15/06/2024 - 75,000
Telefonaktiebolaget LM Ericsson 4.125% 15/05/2022 - 250,000
Telesat Canada 8.875% 15/11/2024 10,000 -

First State Global Credit Income Fund
Portfolio Changes (Unaudited) (continued)
231
Number of
shares purchased
Number of
shares sold
Telstra 4.8% 12/10/2021 - 500,000
Tenet Healthcare 6.75% 15/06/2023 - 77,000
Tenet Healthcare 8.125% 01/04/2022 - 70,000
Tenneco 5% 15/07/2026 - 65,000
Tenneco 5.375% 15/12/2024 - 25,000
Terex 5.625% 01/02/2025 12,000 12,000
Tesco Property Finance 5.744% 13/04/2040 - 300,000
Teva Pharmaceutical Finance 2.8% 21/07/2023 - 150,000
Thermo Fisher Scientific 1.45% 16/03/2027 100,000 -
Three Gorges Finance I 2.3% 02/06/2021 500,000 -
T-Mobile 6.25% 01/04/2021 - 50,000
T-Mobile 6.633% 28/04/2021 - 106,000
Toll Brothers Finance 4.875% 15/11/2025 - 37,000
Transocean 9% 15/07/2023 - 90,000
Tribune Media 5.875% 15/07/2022 - 152,000
Triumph Group 5.25% 01/06/2022 - 100,000
Unilever Capital 2.2% 06/03/2019 - 800,000
United Continental Holdings 6% 01/12/2020 - 84,000
United Rentals North America 5.5% 15/05/2027 30,000 -
United Rentals North America 6.125% 15/06/2023 - 48,000
United States Steel 7.5% 15/03/2022 - 45,000
United States Steel 8.375% 01/07/2021 - 14,000
UPCB Finance 6.875% 15/01/2022 150,000 150,000
US Concrete 6.375% 01/06/2024 - 82,000
US Treasury Note 1.125% 30/06/2021 - 550,000
US Treasury Note 1.625% 15/02/2026 - 200,000
Vale Overseas 4.375% 11/01/2022 400,000 -
Vale Overseas 4.625% 15/09/2020 - 500,000
Vector Group 6.125% 01/02/2025 64,000 64,000
Vector Group 7.75% 15/02/2021 - 200,000
Viasat 6.875% 15/06/2020 - 47,000
Vicinity Centres 3.375% 07/04/2026 - 500,000
Vodafone Group 2.5% 26/09/2022 - 150,000
Vodafone Group 5.375% 05/12/2017 - 250,000
Volkswagen International Finance 1.125% 02/10/2023 300,000 -
Want Want China Finance 2.875% 27/04/2022 200,000 200,000
Weatherford 6.8% 15/06/2037 - 69,000
Weatherford International 7.75% 15/06/2021 - 24,000

First State Global Credit Income Fund
Portfolio Changes (Unaudited) (continued)
232
Number of
shares purchased
Number of
shares sold
Weatherford International 8.25% 15/06/2023 - 15,000
Welltower 4% 01/06/2025 300,000 -
WESCO Distribution 5.375% 15/12/2021 - 45,000
Wesfarmers 1.874% 20/03/2018 - 250,000
West Corporation 5.375% 15/07/2022 - 130,000
Western Digital 10.5% 01/04/2024 - 87,000
Westpac Banking Corporation 3.625% 28/02/2023 - 250,000
Westpac Banking Corporation 5% VRN Perp 150,000 150,000
William Lyon Homes 5.875% 31/01/2025 74,000 -
Windstream 7.5% 01/04/2023 100,000 100,000
Windstream 7.75% 15/10/2020 - 21,000
Windstream 7.75% 01/10/2021 - 150,000
Woolworths 4% 22/09/2020 - 250,000
WPX Energy 7.5% 01/08/2020 - 100,000
WPX Energy 8.25% 01/08/2023 - 41,000
XPO Logistics 6.5% 15/06/2022 - 94,000
Zayo 5.75% 15/01/2027 50,000 50,000
Zimmer Biomet Holdings 1.414% 13/12/2022 300,000 -
The Schedule of Portfolio Changes in Investments reflects the aggregate purchases of a security
exceeding one percent of the total value of purchases for the year and aggregate sales of a security
exceeding one percent of the total sales for the year.

First State Asia Pacific All Cap Fund
Investment Manager’s Report (Unaudited)
233
Performance
01/01/14 01/01/15 01/01/16 01/01/17
To To To To
31/12/14 31/12/15 31/12/16 31/12/17
First State Asia Pacific All Cap Fund “the Fund”
- Class III 12.89% -1.43% 2.73% 35.66%
MSCI AC Asia Pacific Japan Index (total return)# 3.09% -9.12% 7.06% 36.99%
(Performance calculation is based on official dealing NAV per share)
#Benchmarks are being included for illustrative purposes and there is no guarantee that a fund will outperform a benchmark. Past performance is no indication of current or future performance and the performance data does not take account of
commissions and costs incurred in the issue and redemption of units.
The MSCI AC Asia Pacific ex Japan index increased by 37% in US dollar terms in 2017. China and
South Korea outperformed, while Pakistan and New Zealand lagged. On a sector level, Information Technology
and Consumer Discretionary gained the most, while Utilities and Telecom Services were the weakest.
On portfolio holdings, Taiwan Semiconductor (TSMC) continued to benefit from the ramp up in sales
of the Apple iPhone. TSMC has maintained its leading competitive edge in technology and precision manufacturing,
with revenue growth expected to accelerate as its 7nm chips gain market share. HDFC Bank strengthened on the
back of increased net profits, driven by strong asset growth and higher net interest income despite the temporary
disruption from demonetisation and public sector banks’ recapitalisation. CSL Limited strengthened over the year,
as global demand for plasma-related products continued to exceed supply, leading to profit upgrades for the group.
Meanwhile, its Seqirus acquisition is expected to achieve profitability in FY18, which should add significantly to
the bottom line.
Detracting from performance, Brambles has been weak since its profit downgrade at the beginning of
the year. The new CEO and CFO are determined to make changes but have guided for lower returns, growth and
capex. While we do not believe its business model is broken, the lack of free cash flow generation and earnings
growth has been worrying. Dr Reddy’s Laboratories underperformed, as a series of inspections from the US Food
and Drug Administration (FDA) led to concerns around quality control issues, while delays to a number of its
product launches caused lacklustre sales growth and compressed margins. Lupin continued to face challenges in the
US generics market as the rate of price erosion had been exacerbated by consolidation in the distributor space.
Significant purchases over the year included Midea Group, China’s largest home appliances company.
A strong emphasis on R&D, streamlined products and greater control over distributors has resulted in market share
gains for almost all of its products. We also subscribed to the HDFC Standard Life Insurance initial public offering,
as we believe there is significant opportunity for insurance to take off in India – current penetration of insurance
protection is extremely low at just 2.7% of the population.
We divested Brambles on concerns that the pursuit of growth here has been at the expense of cash flow,
to the extent that we believe it has become unsustainable. We sold Dr Reddy’s Laboratories after the company
reported weak earnings due to regulatory challenges and price erosion in the US market.

First State Asia Pacific All Cap Fund
Investment Manager’s Report (Unaudited) (continued)
234
Our generally cautious stance, as well as overall portfolio positioning has not changed very much in
the last 12 months. Stock markets in Asia and globally have shot through previous highs, as investors remain
sanguine on the prospect of the global economic recovery continuing into 2018. Weak inflationary pressures have
called into question the need for tightening measures, which has added to the market’s bullish sentiment. However,
history and our experience suggest that such benign conditions do not endure; although we do not know what the
catalyst will be or when it will appear, we are mindful of a potential reversal in fortunes and – at current heady
valuations – the growing risks to capital preservation. On the other hand, our longer-term time horizon means that
we are able to look past the short-term noise. While there is plenty to worry about on a macro level, there are still
plenty of opportunities for the bottom-up investor. We have added to quality companies in our portfolio and continue
to prefer exporters and US dollar earners as being amongst Asia’s more competitive companies.
First State Investment (Hong Kong) Limited
February 2018

First State Asia Pacific All Cap Fund
Performance Table
as of 31 December 2017 (Unaudited)
235
Financial period Total net asset
value
Net asset
value per
share
Class III
Dec 2015 US$ 59,484,672 US$ 11.74
Dec 2016 US$ 63,312,438 US$ 12.06
Dec 2017 US$ 83,516,676 US$ 16.36
Financial period The highest issue
price
The lowest
redemption
price
Class III
Dec 2014 US$ 12.32 US$ 10.00
Dec 2015 US$ 13.52 US$ 10.85
Dec 2016 US$ 13.14 US$ 10.41
Dec 2017 US$ 16.36 US$ 12.01

First State Asia Pacific All Cap Fund
Schedule of Investments
as of 31 December 2017
236
The schedule that follows includes financial assets designated at fair value through profit or loss
Number of
shares
Fair value
US$
% of net
assets
Australia (2016: 4,584,844, 7.24%) 4,129,329 4.94
CSL 26,016 2,873,761 3.44
Ramsay Health Care 22,905 1,255,568 1.50
Bangladesh (2016: 474,155, 0.75%) 1,043,652 1.25
Marico Bangladesh 78,130 1,043,652 1.25
China (2016: 7,457,447, 11.78%) 11,009,503 13.18
AAC Technologies Holdings 72,000 1,284,193 1.54
Baidu 2,047 480,513 0.57
China Mengniu Dairy 420,000 1,249,416 1.50
China Rescs Phoenix Healthcare Holdings 622,500 785,328 0.94
China Resources Land 174,000 512,050 0.61
ENN Energy Holdings 166,000 1,184,099 1.42
Fuyao Glass Industry 192,562 811,822 0.97
Midea Group 321,586 2,739,015 3.28
Tong Ren Tang Technologies 718,000 1,038,097 1.24
Wuxi Little Swan 163,041 924,970 1.11
Hong Kong (2016: 6,829,481, 10.79%) 9,286,644 11.12
AIA Group 159,200 1,357,620 1.63
CK Hutchison Holdings 99,500 1,248,898 1.50
CSPC Pharmaceutical 406,000 819,725 0.98
Dairy Farm International Holdings 130,600 1,026,516 1.23
Minth Group 236,000 1,423,733 1.70
Towngas China 2,868,241 2,304,678 2.76
Vitasoy International Holdings 432,000 1,105,474 1.32
India (2016: 11,029,209, 17.42%) 13,734,575 16.45
Dabur India 121,140 663,705 0.79
Godrej Consumer Products 68,749 1,076,514 1.29
HDFC Bank ADR 31,556 3,188,103 3.82
HDFC Standard Life Insurance 204,174 1,234,752 1.48
HealthCare Global Enterprises Limited 109,959 482,026 0.58
Housing Development Finance 62,693 1,679,999 2.01
Jyothy Laboratories 77,255 462,604 0.55

First State Asia Pacific All Cap Fund
Schedule of Investments (continued)
as of 31 December 2017
237
Number of
shares
Fair value
US$
% of net
assets
India (continued)
Kotak Mahindra Bank 56,077 887,533 1.06
Lupin 24,596 341,074 0.41
Mahindra Forgings 146,266 591,572 0.71
Marico 144,593 730,582 0.88
Nestle India 6,848 844,462 1.01
Suprajit Engineering 140,001 731,947 0.88
Tata Consultancy Services 19,369 819,702 0.98
Indonesia (2016: 1,533,746, 2.42%) 3,337,419 4.00
BFI Finance Indonesia 28,755,700 1,441,229 1.73
Hero Supermarket 7,698,410 524,859 0.63
Indocement Tunggal Prakarsa 374,100 605,233 0.72
Selamat Sempurna 8,282,100 766,098 0.92
Japan (2016: 4,290,139, 6.78%) 5,605,670 6.71
Keyence 2,500 1,402,293 1.68
Koito Manufacturing 7,000 492,669 0.59
Misumi 41,300 1,203,803 1.44
Pigeon 22,600 861,584 1.03
Ryohin Keikaku 2,500 779,792 0.93
SMC 2,100 865,529 1.04
Philippines (2016: 5,310,832, 8.39%) 7,115,325 8.52
BDO Unibank 392,602 1,292,102 1.55
China Banking 1,216,621 813,018 0.97
DMCI Holdings 2,411,300 696,810 0.83
Integrated Micro Electronics 2,320,100 876,247 1.05
Manilla Water 2,970,100 1,671,877 2.00
SM Investments 42,210 838,593 1.01
Universal Robina 305,810 926,678 1.11
Singapore (2016: 1,968,969, 3.11%) 3,122,924 3.74
Haw Par 126,700 1,076,542 1.29
Oversea Chinese Banking 220,626 2,046,382 2.45

First State Asia Pacific All Cap Fund
Schedule of Investments (continued)
as of 31 December 2017
238
Number of
shares
Fair value
US$
% of net
assets
South Korea (2016: 6,938,441, 10.96%) 9,522,592 11.40
Hanon Systems 51,997 677,914 0.81
Hanssem 1,885 318,248 0.38
Koh Young Technology 14,824 1,147,099 1.38
Korea Kolmar Holdings 27,560 1,054,681 1.26
Leeno Industrial 17,046 919,331 1.10
LG Household and Health Care Preference 1,776 1,162,733 1.39
Naver 1,032 842,133 1.01
Samsung Electronics 1,261 2,471,969 2.96
Vieworks 24,203 928,484 1.11
Sri Lanka (2016: 998,965, 1.58%) 3,170,792 3.80
Hatton National Bank 690,400 1,120,297 1.34
Hemas Holdings 1,451,059 1,191,485 1.43
John Keells Holdings 887,644 859,010 1.03
Taiwan (2016: 8,113,215, 12.81%) 7,965,173 9.54
Advantech 168,559 1,196,764 1.43
Delta Electronics Industrial 212,379 1,027,941 1.23
Sinbon Electronics 443,000 1,289,493 1.55
Taiwan Semicon Manufacturing 575,000 4,450,975 5.33
Thailand (2016: 1,605,336, 2.53%) 939,426 1.12
KasikornBank 128,100 939,426 1.12
United States (2016: 760,393, 1.20%) 1,053,267 1.26
Resmed 122,595 1,053,267 1.26
Vietnam (2016: 577,866, 0.91%) 2,236,797 2.68
FPT 389,378 979,060 1.17
Refrigeration Electrical Engineering 688,240 1,257,737 1.51

First State Asia Pacific All Cap Fund
Schedule of Investments (continued)
as of 31 December 2017
239
Number of
shares
Fair value
US$
% of net
assets
Total financial assets designated at fair value through
profit or loss* 83,273,088 99.71
Cash and other net assets 243,588 0.29
Total net assets attributable to redeemable participating
shareholders 83,516,676 100.00
Total cost of financial assets designated at fair value
through profit or loss (2016: 61,079,377) 61,102,502
Analysis of net investments
Fair
value
US$
% of total
assets
*Transferable securities admitted to an official stock
exchange listing or traded on a regulated market 83,273,088 99.53

First State Asia Pacific All Cap Fund
Portfolio Changes (Unaudited)
240
The schedule of portfolio changes is based on financial assets designated at fair value through
profit or loss
Number of
shares purchased
Number of
shares sold
AAC Technologies Holdings 22,000 10,500
Advantech 15,318 -
Akzo Nobel India 19,346 19,346
Amore Pacific Group Preference 3,023 26,898
Avenue Supermarts 1,964 1,964
Axiomtek - 247,000
Baidu - 1,094
BDO Unibank 69,652 31,930
BDO Unibank Rights 69,652 69,652
BFI Finance Indonesia 28,191,600 2,568,300
Brambles 12,487 188,758
China Banking 1,216,621 -
China Blue Chemical - 3,384,000
China Mengniu Dairy 96,000 138,000
China Rescs Phoenix Healthcare Holdings 622,500 -
China Resources Land 174,000 -
China South Publishing & Media Group 82,199 185,799
CK Hutchison Holdings - 87,500
CSL - 7,230
CSPC Pharmaceutical 100,000 18,000
Dairy Farm International Holdings 130,600 -
Delta Electronics - 520,500
Delta Electronics Industrial - 79,000
Dr Reddys Laboratories - 31,792
ENN Energy Holdings - 12,000
EO Technics 4,618 4,618
FPT 167,608 -
Fuyao Glass Industry 37,762 54,400
Godex International - 258,050
Godrej Consumer Products 34,802 3,266
Hana Tour Service 2,440 7,530
Hanon Systems 58,928 6,931
Hanssem 1,885 -
Hatton National Bank 690,400 -
Haw Par 81,400 5,200
HDFC Bank 2,388 -
HDFC Standard Life Insurance 260,600 56,426
HealthCare Global Enterprises 109,959 -
Hemas Holdings - 74,147

First State Asia Pacific All Cap Fund
Portfolio Changes (Unaudited) (continued)
241
Number of
shares purchased
Number of
shares sold
Housing Development Finance 9,235 -
IDFC - 587,219
Indocement Tunggal Prakarsa 374,100 -
Indoco Remedies - 166,189
Infosys Technologies 9,962 62,690
Integrated Micro Electronics - 4,458,800
John Keells Holdings 887,644 -
Jyothy Laboratories 77,255 -
Kasikorn Bank 43,400 -
Keyence 1,300 100
Koh Young Technology - 1,606
Koito Manufacturing 7,000 -
Korea Kolmar Holdings 27,560 -
Leeno Industrial 17,046 -
LG Chemical - 3,059
LG Household & Health Care - 669
LG Household & Health Care Preference 278 244
LG Preference - 20,160
Luthai Textile - 656,592
Mahindra Forgings 146,266 -
Manila Water 130,600 -
Marico - 28,011
Marico Bangladesh 37,530 -
Midea Group 321,586 -
Minth Group - 20,000
Naver 554 -
Nestle India 7,508 660
Oversea Chinese Banking 36,200 -
Posiflex Technology - 207,301
Raffles Medical Group 6,152 522,913
Ramsay Health Care 10,924 -
Rayence - 21,742
Refrigeration Electrical Engineering 550,280 -
Robinsons Land - 820,200
Ryohin Keikaku - 700
Samsung Electronics 255 -
Selamat Sempurna 8,282,100 -
Shimano - 4,000
Sinbon Electronics 443,000 -
SM Investments - 29,340

First State Asia Pacific All Cap Fund
Portfolio Changes (Unaudited) (continued)
242
Number of
shares purchased
Number of
shares sold
SMC - 400
SMS - 12,900
Suprajit Engineering - 89,733
Taiwan Semiconductor Manufacturing 55,000 28,000
Tata Consultancy Services 2,149 -
Tech Mahindra - 81,948
Tong Ren Tang Technologies - 435,000
Towngas China 77,681 493,000
Universal Robina 305,810 -
Value Added Technologies 13,859 13,859
Vieworks 13,823 -
Vitasoy International Holdings - 36,000
Wistron Neweb 4,902 169,772
Wuxi Little Swan 163,041 -
The Schedule of Portfolio Changes in Investments reflects the aggregate purchases of a security
exceeding one percent of the total value of purchases for the year and aggregate sales of a security
exceeding one percent of the total sales for the year.

First State Japan Equity Fund
Investment Manager’s Report (Unaudited)
243
Performance
Inception 01/01/16 01/01/17
To To To
31/12/15 31/12/16 31/12/17
First State Japan Equity Fund “the Fund”
- Class I** n/a -2.70% 42.86%
- Class III JPY*** n/a 3.17% 38.79%
- Class III* 19.80% 3.17% 44.17%
- Class VI EUR**** n/a 1.03% 26.80%
MSCI Japan Total Return USD# 7.65% 2.73% 23.99%
MSCI Japan Total Return JPY*** n/a 11.30% 19.75%
MSCI Japan Total Return EUR**** n/a 5.69% 8.91%
(Performance calculation is based on official dealing NAV)
*Inception date – 2 February 2015
**Inception date – 6 September 2016
***Inception date – 24 October 2016
****Inception date – 6 July 2016
#Benchmarks are being included for illustrative purposes and there is no guarantee that a fund will outperform a benchmark. Past performance is no indication of current or future performance and the performance data does not take account of
commissions and costs incurred in the issue and redemption of units.
The MSCI Japan Index increased by 24% in US dollar terms in 2017. The economy continued to grow at
a moderate pace, with preliminary data revised upwards again in December to show a 2.5% annualised growth for
the July-September period, based on export growth, private capital expenditure and rising inventory investments.
However, despite tightness in the labour market, wage growth remains subdued and personal consumption – which
makes up as much as 60% of Japan’s economy – remains lacklustre.
On portfolio holdings, Start Today rose on the back of strong growth in transaction value, sales and profits.
The company has focused on building its ZOZOTOWN brand and is one of the few websites in Japan that generates
a high level of direct traffic (rather than via search engines). Keyence also added to performance, delivering strong
sales growth and high margins due to the uptick in capex across multiple regions and industries.
Detracting from performance, Enigmo declined as promotions to attract new users fell short of the mark,
leading to lower than expected sales growth and operating profit. Meanwhile, Zojirushi reported declining sales for
its domestic rice cooker business, as well as greater price competition in China. Due to Zojirushi’s deteriorating
fundamentals, we sold the position earlier in the year.
Significant purchases over the period included Recruit Holdings, a global human resources company which
provides recruitment, staffing and marketing media services. Recruit owns the largest global online career search
engine Indeed, which has over 200 million monthly unique visitors. We also bought Komatsu, a leading
manufacturer of construction and mining machinery. We believe a cyclical global recovery is underway, which
should improve profits.
We divested Daito Trust and Hoshizaki Electric on valuation concerns.

First State Japan Equity Fund
Investment Manager’s Report (Unaudited) (continued)
244
With a landslide victory for the Liberal Democratic Party in Japan’s recent election – retaining a two-thirds
majority in the lower house – Shinzo Abe is likely to win the mandate in September 2018 to remain party leader
and become Japan’s longest-serving Prime Minister. We expect fiscal and monetary policies to continue on the
current loosening trend and, although there is talk of a further consumption tax hike (which could potentially impair
economic growth), we believe that Abe will find reasons not to press ahead with it, given the lack of inflation
expectations. Meanwhile, Abe is widely expected to revise Japan’s pacifist constitution in response to geopolitical
threats in the region, which has divided domestic opinion (and could offend the Chinese government). However, in
sum, we believe Abe’s victory should be positive for Japan’s equity market.
First State Investment (Hong Kong) Limited
February 2018

First State Japan Equity Fund
Performance Table
as of 31 December 2017 (Unaudited)
245
Financial period Total net asset
value
Net asset
value per
share
Class I
Dec 2016 US$ 8,692 US$ 9.73
Dec 2017 US$ 8,698,179 US$ 13.90
Class III JPY
Dec 2016 JPY 1,255,547,396 JPY 1,032.11
Dec 2017 JPY 1,286,791,729 JPY 1432.45
Class III
Dec 2015 US$ 18,524,218 US$ 11.98
Dec 2016 US$ 20,519,524 US$12.36
Dec 2017 US$ 31,632,290 US$ 17.82
Class VI EUR
Dec 2016 EUR 23,037,282 EUR 9.44
Dec 2017 EUR 27,221,286 EUR 11.97
Financial period The highest issue
price
The lowest
redemption
price
Class I
Dec 2016 US$ 10.83 US$ 9.35
Dec 2017 US$ 14.03 US$ 9.61
Class III JPY
Dec 2016 JPY 1,032.11 JPY 952.00
Dec 2017 JPY 1446.60 JPY 1002.31
Class III
Dec 2015 US$ 12.12 US$ 9.79
Dec 2016 US$ 13.74 US$10.53
Dec 2017 US$ 17.98 US$ 12.21
Class VI EUR
Dec 2016 EUR 10.01 EUR 8.90
Dec 2017 EUR 12.26 EUR 9.26

First State Japan Equity Fund
Schedule of Investments
as of 31 December 2017
246
The schedule that follows includes financial assets designated at fair value through profit or loss
Number of
shares
Fair value
US$
% of net
assets
Japan (2016: 54,627,699, 98.29%) 82,472,221 97.73
Asahi Intecc 74,000 2,551,497 3.02
Benefit One 92,900 1,947,490 2.31
Daikin Industries 14,500 1,718,275 2.04
Disco Corporation 10,800 2,406,078 2.85
Enigmo 34,600 337,913 0.40
Fast Retailing 3,900 1,556,465 1.84
Freund Corporation 23,700 294,223 0.35
Harmonic Drive Systems 40,600 2,377,624 2.82
Investors Cloud 100,500 1,495,041 1.77
Isuzu Motors 101,100 1,695,332 2.01
Katitas 10,800 248,190 0.29
Keyence 9,400 5,272,621 6.25
Koito Manufacturing 26,300 1,851,026 2.19
Komatsu 72,200 2,616,472 3.10
Kose 8,300 1,297,405 1.54
Kusuri No Aoki 47,400 2,514,689 2.98
M and A Capital Partners 11,900 779,374 0.92
Mabuchi Motor 14,200 771,012 0.91
Meiji Holdings 10,900 928,917 1.10
Misumi 129,200 3,765,894 4.46
Monotaro 82,300 2,632,898 3.12
Morinaga 16,600 842,318 1.00
N Field 82,000 1,119,275 1.33
NGK Insulators 51,000 964,436 1.14
Nifco 15,100 1,031,894 1.22
Nippon Paint 14,300 453,030 0.54
Nitori Holdings 20,500 2,926,620 3.47
OSG 39,600 858,651 1.02
Pigeon 33,300 1,269,502 1.50
Rakus 36,600 922,725 1.09
Recruit Holdings 180,200 4,483,782 5.31
Relo Holdings 17,200 469,244 0.56
Ryohin Keikaku 9,700 3,025,593 3.59
Sagami Rubber Industries 42,000 653,159 0.77
Sekisui Chemical 55,000 1,105,572 1.31
Seven and I Holdings 9,800 407,833 0.48

First State Japan Equity Fund
Schedule of Investments (continued)
as of 31 December 2017
247
Number of
shares
Fair value
US$
% of net
assets
Japan (continued)
Shin-Etsu Chemical 20,800 2,116,413 2.51
SMS 25,800 813,916 0.97
SoftBank 21,300 1,688,403 2.00
So-Net M3 21,900 771,648 0.91
Start Today 167,000 5,082,867 6.02
TechnoPro Holdings 18,600 1,011,570 1.20
Terumo 33,200 1,575,473 1.87
Tokyo Base 20,000 881,543 1.05
Tosho 26,800 866,898 1.03
Tsubaki Nakashima 56,500 1,348,107 1.60
Tsuruha Holdings 25,800 3,512,450 4.16
Unicharm 47,200 1,228,760 1.46
Welcia Holdings 45,800 1,982,103 2.35
Total financial assets designated at fair value through
profit or loss* 82,472,221 97.73
Cash and other net assets 1,918,678 2.27
Total net assets attributable to redeemable participating
shareholders 84,390,899 100.00
Total cost of financial assets designated at fair value
through profit or loss (2016: 55,587,176) 63,222,152
Analysis of net investments
% of total
assets
*Transferable securities admitted to an official stock
exchange listing or traded on a regulated market 82,472,221 96.20

First State Japan Equity Fund
Portfolio Changes (Unaudited)
248
The schedule of portfolio changes is based on financial assets designated at fair value through
profit or loss
Number of
shares purchased
Number of
shares sold
Arcland Service 45,500 45,500
Asahi Intecc 46,600 17,700
Astellas Pharma 27,200 27,200
Benefit One 81,100 5,400
Casio Computer - 84,600
Cookpad - 45,500
Create 4,500 58,400
Daikin Industries 15,200 700
Daito Trust Construction 900 17,400
DIP Corporation 4,300 52,400
Disco Corporation 3,900 3,900
Enigmo 36,400 1,800
Ezaki Glico - 28,600
Fast Retailing 4,400 500
Freund Corporation 1,700 1,200
Harmonic Drive Systems 27,900 10,600
Hoshizaki Electric - 24,000
Investors Cloud 108,400 7,900
Isuzu Motors 115,200 14,100
Izumi - 12,600
Kakaku.com - 17,200
Kameda Seika - 10,600
Katitas 10,800 -
Keyence 8,400 1,700
Koito Manufacturing 8,900 15,000
Komatsu 72,200 -
Kose 5,900 7,900
Kubota - 39,000
Kusuri No Aoki 17,900 4,900
LINE 3,500 14,600
M and A Capital Partners 11,900 -
Mabuchi Motor 24,500 10,300
Meiji Holdings 3,900 8,300
Misumi 22,100 18,400
Monotaro 82,300 -
Morinaga 16,600 -
N Field 27,500 3,800
Nakanishi 3,100 23,000

First State Japan Equity Fund
Portfolio Changes (Unaudited) (continued)
249
Number of
shares purchased
Number of
shares sold
NGK Insulators 29,000 11,000
NGK Spark Plug - 29,900
Nifco 7,900 27,600
Nippon Paint 14,300 -
Nitori Holdings 8,300 5,300
Olympus Optical - 25,200
OSG 16,900 34,800
Pigeon 23,700 500
Rakus 36,600 -
Recruit Holdings 245,500 65,300
Relo Holdings 91,400 79,800
Ryohin Keikaku 1,700 7,400
Sagami Rubber Industries 52,000 10,000
SAN-A - 10,900
SCSK Corporation - 31,400
Sekisui Chemical 65,000 10,000
Seven and I Holdings 17,600 7,800
Shimano - 800
Shin-Etsu Chemical 12,200 2,500
SMC - 1,900
SMS 9,300 10,100
SoftBank 22,400 1,100
So-Net M3 23,000 1,100
Sosei - 4,300
Start Today 37,200 15,900
TechnoPro Holdings 1,300 44,300
Terumo 34,300 1,100
Tokyo Base 20,000 -
Tosho 18,800 37,800
Tsubaki Nakashima 58,900 2,400
Tsuruha Holdings 4,700 5,000
Unicharm 17,000 1,600
V Cube - 18,900
Welcia Holdings 41,700 5,200
W-Scope 10,400 61,600

First State Japan Equity Fund
Portfolio Changes (Unaudited) (continued)
250
The Schedule of Portfolio Changes in Investments reflects the aggregate purchases of a security
exceeding one percent of the total value of purchases for the year and aggregate sales of a security
exceeding one percent of the total sales for the year.
Number of
shares purchased
Number of
shares sold
Yaoko - 8,800
Zenkoku Hosho - 8,300
Zojirushi 10,000 50,000

First State Sustainable Listed Infrastructure Fund
Investment Manager’s Report (Unaudited)
251
Performance
Inception
To
31/12/17
First State Sustainable Listed Infrastructure Fund “the Fund”
- Class VI* 0.90%
- Class E* 0.90%
- Class VI (EUR)* -0.30%
- Class E (EUR)*
- Class VI (GBP Dist)* ^
- Class E (GBP Dist)* ^
-0.30%
0.20%
0.20%
FTSE Global Core Infrastructure 50-50 Index in EUR# -0.31%
FTSE Global Core Infrastructure 50-50 Index in GBP# -0.16%
FTSE Global Core Infrastructure 50-50 Index in USD# 0.74%
(Performance calculation is based on official dealing NAV)
^ Dividend adjustment return
*Inception date – 20 December 2017
#Benchmarks are being included for illustrative purposes and there is no guarantee that a fund will outperform a benchmark. Past performance is no indication of current or future performance and the performance data does not take account of
commissions and costs incurred in the issue and redemption of units.
The First State Sustainable Listed Infrastructure Fund was launched on 20 December 2017.
The Fund’s investment objective is to deliver capital growth and inflation-protected income by investing
in a globally diversified portfolio of sustainable infrastructure securities. Infrastructure companies include
companies from the transport, utilities, energy, and communications sectors.
The assets held by these companies tend to exhibit high barriers to entry, pricing power and structural
growth. The Fund takes a long term approach to investing and therefore aims to outperform its benchmark, the
FTSE Global Core Infrastructure 50/50 Index over rolling five year periods, after fees.
A focus on sustainability can help deliver positive risk adjusted returns. It can create opportunities for
positive performance; generating ideas as well as lowering the overall risk profile of a portfolio through a better
understanding of ESG related risks.
Our outlook for the Fund is positive. While rising interest rates present a headwind in the short-term, listed
infrastructure fundamentals remain healthy, with robust balance sheets, solid earnings growth, and the potential for
dividends to grow faster than earnings.
Global listed infrastructure remains well positioned to protect and grow capital through economic cycles,
owing to its defensive earnings profile and inflation pass-through characteristics.
First State Investment (Hong Kong) Limited
February 2018

First State Sustainable Listed Infrastructure Fund
Performance Table
as of 31 December 2017 (Unaudited)
252
Financial period Total net asset
value
Net asset
value per
share
Class VI
Dec 2017 US$ 673,119 US$ 10.05
Class E
Dec 2017 US$ 673,163 US$ 10.05
Class VI (EUR)
Dec 2017 EUR 565,964 EUR 9.93
Class E (EUR)
Dec 2017 EUR 566,001 EUR 9.93
Class VI (GBP Dist)
Dec 2017 £ 498,569 £ 9.97
Class E (GBP Dist)
Dec 2017 £ 498,601 £ 9.97
Financial period The highest issue
price
The lowest
redemption
price
Class VI
Dec 2017 US$ 10.05 US$ 9.94
Class E
Dec 2017 US$ 10.05 US$ 9.94
Class VI (EUR)
Dec 2017 EUR 10.00 EUR 9.93
Class E (EUR)
Dec 2017 EUR 10.00 EUR 9.93
Class VI (GBP Dist)
Dec 2017 £ 10.00 £ 9.95
Class E (GBP Dist)
Dec 2017 £ 10.00 £ 9.95

First State Sustainable Listed Infrastructure Fund
Schedule of Investments
as of 31 December 2017
253
The schedule that follows includes financial assets designated at fair value through profit or loss
Number of
shares
Fair value
US$
% of net
assets
Australia 245,864 6.07
Transurban Group 25,302 245,864 6.07
Bermuda 60,333 1.49
Cosco Pacific 58,000 60,333 1.49
Canada 206,134 5.09
Canadian Pacific Railway 675 123,776 3.06
Hydro One 4,600 82,358 2.03
China 132,746 3.28
China Merchants Holdings International 10,000 26,165 0.65
Jiangsu Expressway 70,000 106,581 2.63
France 140,519 3.47
Groupe Eurotunnel 4,716 60,619 1.50
Vinci 780 79,900 1.97
Hong Kong 122,354 3.02
Power Assets Holdings 14,500 122,354 3.02
Italy 162,307 4.01
Atlantia 5,095 162,307 4.01
Japan 393,948 9.73
East Japan Railway 2,200 214,956 5.31
Japan Airport Terminal 1,600 59,433 1.47
Osaka Gas 6,200 119,559 2.95
Mexico 23,359 0.58
Grupo Aeroportuario 2,300 23,359 0.58
Spain 188,983 4.67
Abertis Infraestructuras 2,751 60,847 1.50
Aena 198 40,342 1.00
Iberdrola 11,301 87,794 2.17

First State Sustainable Listed Infrastructure Fund
Schedule of Investments (continued)
as of 31 December 2017
254
Number of
shares
Fair value
US$
% of net
assets
United Kingdom 414,526 10.24
National Grid 28,313 333,494 8.24
Scottish & Southern Energy 4,590 81,032 2.00
United States 1,781,086 43.99
American Tower 1,562 223,225 5.51
Cons Edison 1,413 120,232 2.97
Crown Castle Real Estate Investment Trust 483 53,043 1.31
CSX 1,469 80,795 2.00
Dominion Resources 2,972 240,940 5.95
Enterprise Products Partners 3,839 101,657 2.51
NextEra Energy 1,307 204,349 5.05
Nisource 3,185 81,409 2.01
Norfolk Southern 841 122,206 3.02
PG&E 2,322 104,049 2.57
Portland General Electric 1,475 67,290 1.66
UGI Corporation 2,153 101,277 2.50
Williams 4,692 143,153 3.54
Xcel Energy 2,859 137,461 3.39
Total financial assets designated at fair value through
profit or loss* 3,872,159 95.64
Cash and other net liabilities 176,666 4.36
Total net assets attributable to redeemable participating
shareholders 4,048,825 100.00
Total cost of financial assets designated at fair value
through profit or loss 3,837,142
Analysis of net investments
% of total
assets
*Transferable securities admitted to an official stock
exchange listing or traded on a regulated market 3,872,159 95.43

First State Sustainable Listed Infrastructure Fund
Portfolio Changes (Unaudited)
255
The Schedule of Portfolio Changes in Investments reflects the aggregate purchases of a security
exceeding one percent of the total value of purchases for the year and aggregate sales of a security
exceeding one percent of the total sales for the year.
The schedule of portfolio changes is based on financial assets designated at fair value through
profit or loss
Number of
shares purchased
Number of
shares sold
Abertis Infraestructuras 2,751 -
Aena 198 -
American Tower 1,562 -
Atlantia 5,095 -
Canadian Pacific Railway 675 -
China Merchants Holdings International 10,000 -
Cons Edison 1,413 -
Cosco Pacific 58,000 -
Crown Castle Real Estate Investment Trust 483 -
CSX 1,469 -
Dominion Resources 2,972 -
East Japan Railway 2,200 -
Enterprise Products Partners 3,839 -
Groupe Eurotunnel 4,716 -
Grupo Aeroportuario 2,300 -
Hydro One 4,600 -
Iberdrola 11,301 -
Japan Airport Terminal 1,600 -
Jiangsu Expressway 70,000 -
National Grid 28,313 -
NextEra Energy 1,307 -
Nisource 3,185 -
Norfolk Southern 841 -
Osaka Gas 6,200 -
PG&E 2,322 -
Portland General Electric 1,475 -
Power Assets Holdings 14,500 -
Scottish & Southern Energy 4,590 -
Transurban Group 25,302 -
UGI Corporation 2,153 -
Vinci 780 -
Williams 4,692 -
Xcel Energy 2,859 -

First State Global Umbrella Fund PLC
Statement of Financial Position
as at 31 December 2017
See accompanying notes to the financial statements
256
31-Dec-2017
Total
US$
Asian
Growth
Fund
US$
China
Growth
Fund
US$
Worldwide
Leaders
Fund
US$
Hong Kong
Growth
Fund
US$
Assets
Cash and cash equivalents (Note 10) 262,837,651 17,164,728 15,070,768 7,381,774 43,854
Margin accounts (Note 10) 1,193,294 - - - -
Due from brokers 33,504,301 820 17,007,372 - 431,778
Due from shareholders 55,555,833 4,104,808 18,193,463 90,514 1,350
Financial assets at fair value through profit or loss (Notes 2
and 6) 13,150,944,169 540,824,311 4,510,639,509 40,136,312 181,387,333
Dividends and other receivables* 11,377,364 316,597 7 5,751 37,494
Total assets 13,515,412,612 562,411,264 4,560,911,119 47,614,351 181,901,809
Liabilities
Bank Overdrafts 21,956,914 1,813,759 15,984,859 - -
Financial liabilities at fair value through profit or loss (Notes
2 and 6) 421,138 - - - -
Due to brokers 13,838,775 4,348,689 320,759 - -
Due to shareholders 54,111,648 1,650,934 32,647,075 49,130 312,875
Due to investment manager (Note 3) 15,558,160 511,615 6,969,539 41,907 185,911
Accrued expenses 3,318,745 95,374 579,755 16,745 24,404
Total liabilities 109,205,380 8,420,371 56,501,987 107,782 523,190
Net Assets Attributable to Holders of Redeemable
Participating
Shares 13,406,207,232 553,990,893 4,504,409,132 47,506,569 181,378,619
Shares in issue
Class I 5,214,599 25,096,287 2,665,685 1,461,815
Class II 12,655 12,779 - -
Class III 681,977 - - 554,095
Class III (G) - - 674,793 -
Class I (Dist) 319,320 159,930 - -
Class IV 1,014,298 - - -
Class V - - - -
Class VI 11,376,665 - - -
Class VI (Dist) 7,464,085 - - -
GBP III Hedged (Dist) - - - -
Class III (Acc JPY) - - - -
Class III (Dist) - - - -
Class I (Monthly Dist) - - - -
Class I (HKD Monthly Dist) - - - -
Class I GBP - - - -
Class I (EUR Acc) - - - -
Class VI (GBP Dist) - - - -
Class VI (EUR Acc) - - - -
Class E EUR - - - -
Class E USD - - - -
Class E (GBP Dist) - - - -
*This includes unamortised preliminary expenses amounting to $2,543 and $20,929 in relation to the Asia Pacific All Cap Fund and Japan Equity
Fund respectively

First State Global Umbrella Fund PLC
Statement of Financial Position (continued)
as at 31 December 2017
See accompanying notes to the financial statements
257
Indian
Subcontinent
Fund
US$
Global Bond
Fund
US$
High Quality
Bond Fund
US$
Long Term
Bond Fund
US$
Greater China
Growth Fund
US$
Singapore and
Malaysia
Growth Fund
US$
Asia
Opportunities
Fund
US$
Asian Equity
Plus Fund
US$
62,697,877 139,196 181,633 475,902 3,404,604 1,535,262 711,656 3,147,495
- 912 - - - - - -
128,601 - - - - - - 12,961,543
4,922,809 1,210 66,804 64,198 3,869,862 60,831 22,760 8,914,187
539,101,180 16,182,944 83,249,471 69,368,729 643,048,026 50,593,042 41,110,842 3,291,411,178
79,961 111,356 602,478 455,349 - 77,512 13,555 190,963
606,930,428 16,435,618 84,100,386 70,364,178 650,322,492 52,266,647 41,858,813 3,316,625,366
- - - - - - - 3,581,803
- 8,091 - - - - - -
3,250,522 - - - 42,090 - - 4,847,672
3,619,348 5,982 80,912 64,178 1,142,818 147,141 19,956 3,916,551
626,088 6,899 21,683 16,719 741,071 61,889 56,269 3,714,895
96,730 2,400 7,583 7,226 82,204 10,202 6,206 473,022
7,592,688 23,372 110,178 88,123 2,008,183 219,232 82,431 16,533,943
599,337,740 16,412,246 83,990,208 70,276,055 648,314,309 52,047,415 41,776,382 3,300,091,423
2,646,353 341,579 - - 5,613,698 896,034 874,245 4,708,935
14,328 - - - - - - -
11,268,703 605,451 3,529,070 2,788,389 1,059,461 - 118,465 7,064,578
- - - - - - - -
18,802 - 218,818 - 13,775 - - 50,339,272
- - - - 573,974 - - -
- - - - - - - -
- - - - - - - -
- - - - - - - -
- - - - - - - 350,063
- - - - - - - -
- - - - 595,641 - - 11,591,950
- - - - - - - -
- - - - - - - -
- - - - - - - -
- - - - - - - -
- - - - - - - -
- - - - - - - -
- - - - - - - -
- - - - - - - -
- - - - - - - -

First State Global Umbrella Fund PLC
Statement of Financial Position (continued)
as at 31 December 2017
See accompanying notes to the financial statements
258
31-Dec-2017
Total
US$
Asian
Growth
Fund
US$
China
Growth
Fund
US$
Worldwide
Leaders
Fund
US$
Hong Kong
Growth
Fund
US$
NAV per share-class I $46.91 $178.28 $12.27 $73.83
NAV per share-class II $109.70 $274.62 - -
NAV per share-class III $58.15 - - $132.55
NAV per share-class III (G) - - $21.91 -
NAV per share-class I (Dist) $43.69 $166.58 - -
NAV per share-class IV $13.93 - - -
NAV per share-class V - - - -
NAV per share-class VI $12.65 - - -
NAV per share-class VI (Dist) $12.89 - - -
NAV per share-GBP III Hedged (Dist) - - - -
NAV per share-class III (Acc JPY) - - - -
NAV per share-class III (Dist) - - - -
NAV per share-class I (Monthly Dist) - - - -
NAV per share-class I (HKD Monthly Dist) - - - -
NAV per share-class I GBP - - - -
NAV per share-class I (EUR Acc) - - - -
NAV per share-class VI (GBP Dist) - - - -
NAV per share-class VI (EUR Acc) - - - -
NAV per share-class E EUR - - - -
NAV per share-class E USD - - - -
NAV per share-class E (GBP Dist) - - - -

First State Global Umbrella Fund PLC
Statement of Financial Position (continued)
as at 31 December 2017
See accompanying notes to the financial statements
259
Indian
Subcontinent
Fund
US$
Global Bond
Fund
US$
High Quality
Bond Fund
US$
Long Term
Bond Fund
US$
Greater China
Growth Fund
US$
Singapore and
Malaysia
Growth Fund
US$
Asia
Opportunities
Fund
US$
Asian Equity
Plus Fund
US$
$110.18 $15.95 - - $108.69 $58.08 $46.27 $73.68
$66.88 - - - - - - -
$27.04 $18.10 $22.93 $25.20 $16.05 - $11.11 $13.77
- - - - - - - -
$109.08 - $13.86 - $98.10 - - $52.96
- - - - $17.49 - - -
- - - - - - - -
- - - - - -
- - - - - - - -
- - - - - - - -
- - - - - - - £16.90
- - - - $16.29 - - $15.65
- - - - - - - -
- - - - - - - -
- - - - - - - -
- - - - - - - -
- - - - - - - -
- - - - - - - -
- - - - - - - -
- - - - - - - -
- - - - - - - -

First State Global Umbrella Fund PLC
Statement of Financial Position (continued)
as at 31 December 2017
See accompanying notes to the financial statements
260
Asian Bond
Fund
US$
Asian Quality
Bond Fund
US$
Global
Emerging
Markets
Leaders Fund
US$
Global
Resources Fund
US$
Global Property
Securities Fund
US$
Assets
Cash and cash equivalents (Note 10) 2,284,426 12,359,772 111,897,195 1,259,719 412,961
Margin accounts (Note 10) 12,485 792,680 - - -
Due from brokers - - 2,008,430 5,150 -
Due from shareholders 37,005 5,879,347 4,568,597 116,696 142,020
Financial assets at fair value through profit or loss
(Notes 2 and 6) 31,267,348 620,056,320 1,247,476,783 93,997,794 19,491,878
Dividends and other receivables 337,063 5,330,476 801,639 153,871 65,634
Total assets 33,938,327 644,418,595 1,366,752,644 95,533,230 20,112,493
Liabilities
Bank Overdrafts - - - - -
Financial liabilities at fair value through profit or loss
(Notes 2 and 6) 5,070 82,420 - - -
Due to brokers - - 1,588 82 -
Due to shareholders 53,730 128,148 6,429,901 881,240 -
Due to investment manager (Note 3) 25,398 506,050 960,534 105,399 23,376
Accrued expenses 3,249 73,311 1,115,523 36,085 22,071
Total liabilities 87,447 789,929 8,507,546 1,022,806 45,447
Net Assets Attributable to Holders of Redeemable
Participating
Shares 33,850,880 643,628,666 1,358,245,098 94,510,424 20,067,046
Shares in issue
Class I - 33,879,857 4,292,912 8,617,883 1,576,183
Class II - - - - -
Class III - - 33,153,334 668,492 -
Class III (G) - - - - -
Class I (Dist) 3,926,205 - - - -
Class IV - - 517,753 946,674 -
Class V - - - - -
Class VI - - - - -
Class VI (Dist) - 154 - - 8,311
GBP III Hedged (Dist) - - - - -
Class III (Acc JPY) - - - - -
Class III (Dist) - - - - -
Class I (Monthly Dist) - 5,136,858 - - -
Class I (HKD Monthly Dist) - 2,277,570 - - -
Class I GBP - - - - -
Class I (EUR Acc) - - - - -
Class VI (GBP Dist) - - - - -
Class VI (EUR Acc) - - - - -
Class E EUR - - - - -
Class E USD - - - - -
Class E (GBP Dist) - - - - -

First State Global Umbrella Fund PLC
Statement of Financial Position (continued)
as at 31 December 2017
See accompanying notes to the financial statements
261
Asian Property
Securities Fund
US$
China Focus
Fund
US$
Global Listed
Infrastructure
Fund
US$
Asia Pacific Select
Fund
US$
Global
Agribusiness
Fund**
US$ Worldwide
Equity Fund
US$
Emerging
Markets Bond
Fund*
US$
143,288 3,953,000 7,924,147 28,576 - 5,526,910 16,149
- - - - - - -
- - 3,736 640,573 - 181,653 -
23,571 116,021 3,709,997 167,660 - 4,332 -
10,095,841 206,984,790 525,818,171 125,703,363 - 24,550,250 -
47,241 15,074 1,859,270 17,563 - 29,479 -
10,309,941 211,068,885 539,315,321 126,557,735 - 30,292,624 16,149
- - - - - - -
- - - - - - -
- - 818,637 203,868 - - -
22,975 835,623 1,642,648 163,815 - 76,886 -
12,107 296,211 419,186 83,342 - 25,344 -
16,315 62,146 362,233 22,493 - 20,637 16,149
51,397 1,193,980 3,242,704 473,518 - 122,867 16,149
10,258,544 209,874,905 536,072,617 126,084,217 - 30,169,757 -
51,772 11,774,294 3,280,433 6,284 - 192,670 -
- - - - - - -
- 38,278 3,435,300 6,362,200 - 1,696,455 -
- - - - - - -
1,474,697 - 7,507,059 - - - -
- 2,807,925 - - - - -
- - - - - - -
- - 11,957,644 - - - -
- - 7,524,658 - - - -
- - - - - - -
- - - - - - -
- - - - - - -
- - - - - - -
- - - - - - -
- - 41,135 - - - -
- - 664,521 - - - -
- - 5,793,890 - - - -
- - - - - - -
- - - - - - -
- - - - - - -
- - - - - - -
* The First State Emerging Market Bond Fund terminated on 23 November 2017.
**The First State Global Agribusiness Fund terminated on 8 November 2016.

First State Global Umbrella Fund PLC
Statement of Financial Position (continued)
as at 31 December 2017
262
Asian Bond
Fund
US$
Asian Quality
Bond Fund
US$
Global
Emerging
Markets
Leaders Fund
US$
Global
Resources Fund
US$
Global
Property
Securities Fund
US$
NAV per share-class I - $16.56 $28.88 $9.48 $12.67
NAV per share-class II - - - - -
NAV per share-class III - - $37.00 $10.73 -
NAV per share-class III (G) - - - - -
NAV per share-class I (Dist) $8.62 - - - -
NAV per share-class IV - - $14.09 $5.88 -
NAV per share-class V - - - - -
NAV per share-class VI - - - -
NAV per share-class VI (Dist) - $9.96 - - -
NAV per share-GBP III Hedged (Dist) - - - - $10.09
NAV per share-class III (Acc JPY) - - - - -
NAV per share-class III (Dist) - - - - -
NAV per share-class I (Monthly Dist) - $10.19 - - -
NAV per share-class I (HKD Monthly Dist) - HKD 102.51 - - -
NAV per share-class I GBP - - - - -
NAV per share-class I (EUR Acc) - - - - -
NAV per share-class VI (GBP Dist) - - - - -
NAV per share-class VI (EUR Acc) - - - - -
NAV per share-class E EUR - - - - -
NAV per share-class E USD - - - - -
NAV per share-class E (GBP Dist) - - - - -

First State Global Umbrella Fund PLC
Statement of Financial Position (continued)
as at 31 December 2017
See accompanying notes to the financial statements
263
Asian Property
Securities Fund
US$
China Focus
Fund
US$
Global Listed
Infrastructure
Fund
US$
Asia Pacific
Select Fund
US$
Global
Agribusiness
Fund**
US
Worldwide
Equity Fund
US$
Emerging
Markets Bond
Fund*
US$
$9.48 $15.07 $13.07 $14.95 - $16.20 -
- - - - - - -
- $13.06 $16.98 $19.80 - $15.94 -
- - - - - - -
$6.62 - $12.82 - - - -
- $11.35 - - - - -
- - - - - - -
- - - - - - -
- - $12.67 - - - -
- - $11.88 - - - -
- - - - - - -
- - - - - - -
- - - - - - -
- - - - - - -
- - - - - - -
- - EUR 12.07 - - - -
- - £13.49 - - - -
- - EUR 12.23 - - - -
- - - - - - -
- - - - - - -
- - - - - - -
* The First State Emerging Market Bond Fund terminated on 23 November 2017.
**The First State Global Agribusiness Fund terminated on 8 November 2016.

First State Global Umbrella Fund PLC
Statement of Financial Position (continued)
as at 31 December 2017
See accompanying notes to the financial statements
264
Global Credit
Income Fund
US$
Asia Pacific All
Cap Fund
US$
Japan Equity
Fund
US$
Sustainable
Listed
Infrastructure
Fund
US$
Assets
Cash and cash equivalents (Note 10) 2,365,795 277,432 2,260,475 173,057
Margin accounts (Note 10) 387,217 - - -
Due from brokers 52,155 82,490 - -
Due from shareholders 203,110 14,660 259,746 275
Financial assets at fair value through profit or loss (Notes 2 and 6) 68,831,286 83,273,088 82,472,221 3,872,159
Dividends and other receivables* 694,322 20,895 101,613 12,201
Total assets 72,533,885 83,668,565 85,094,055 4,057,692
Liabilities
Bank Overdrafts - - 574,391 2,102
Financial liabilities at fair value through profit or loss (Notes 2 and
6) 325,557 - - -
Due to brokers - 4,868 - -
Due to shareholders 203,110 14,660 2,012 -
Due to investment manager (Note 3) 2 80,857 65,341 528
Accrued expenses 47,529 51,504 61,412 6,237
Total liabilities 576,198 151,889 703,156 8,867
Net Assets Attributable toHolders of Redeemable Participating
Shares 71,957,687 83,516,676 84,390,899 4,048,825
Shares in issue
Class I - - 625,731 -
Class II - - - -
Class III - 5,103,569 1,774,916 -
Class III (G) - - - -
Class I (Dist) - - - -
Class IV - - - -
Class V 7,059,999 - - -
Class VI - - - -
Class VI (Dist) - - - 67,000
GBP III Hedged (Dist) 352 - - -
Class III (Acc JPY) - - 898,310 -
Class III (Dist) - - - -
Class I (Monthly Dist) - - - -
Class I (HKD Monthly Dist) - - - -
Class I GBP - - - -
Class I (EUR Acc) - - - -
Class VI (GBP Dist) - - - 50,000
Class VI (EUR Acc) - - 2,272,600 57,000
Class E EUR - - - 57,000
Class E USD - - - 67,000
Class E (GBP Dist) - - - 50,000
*This includes unamortised preliminary expenses amounting to $2,543 and $20,929 in relation to the Asia Pacific All Cap Fund and Japan Equity
Fund respectively

First State Global Umbrella Fund PLC
Statement of Financial Position (continued)
as at 31 December 2017
See accompanying notes to the financial statements
265
Global Credit
Income Fund
US$
Asia Pacific All
Cap Fund
US$
Japan Equity
Fund US$
Fund
US$
Sustainable
Listed
Infrastructure
Fund
US$
NAV per share-class I - - $13.90 - NAV per share-class II - - - - NAV per share-class III - $16.36 $17.82 - NAV per share-class III (G) - - - - NAV per share-class I (Dist) - - - - NAV per share-class IV - - - - NAV per share-class V - - - - NAV per share-class VI - - - $10.05 NAV per share-class VI (Dist) $10.19 - - -
NAV per share-GBP III Hedged (Dist) £9.65 - - - NAV per share-class III (JPY) - - JPY1,432.45 - NAV per share-class III (Dist) - - - - NAV per share-class I (Monthly Dist) - - - - NAV per share-class I (HKD Monthly Dist) - - - - NAV per share-class I GBP - - - - NAV per share-class I (EUR) - - - - NAV per share-class VI (GBP Dist) - - - £9.97
NAV per share-class VI (EUR) - - €11.97 € 9.93
NAV per share-class E EUR - - - € 9.93
NAV per share-class E USD - - - $10.05
NAV per share-class E (GBP Dist) - - - £9.97

First State Global Umbrella Fund PLC
Statement of Financial Position
as at 31 December 2016
See accompanying notes to the financial statements
266
31-Dec-2016
Total
US$
Asian
Growth
Fund
US$
China
Growth
Fund
US$
Worldwide
Leaders
Fund
US$
Hong Kong
Growth
Fund
US$
Assets
Cash and cash equivalents (Note 10) 240,618,306 2,625,995 22,362,197 6,210,069 534,882
Margin accounts (Note 10) 2,199,130 - - - -
Due from brokers 21,020,574 89,619 8,306,657 - 889,352
Due from shareholders 70,231,351 9,288,240 18,673,815 82,313 308,427
Financial assets at fair value through profit or loss (Notes 2
and 6) 10,502,984,371 521,843,085 3,532,219,758 34,575,194 151,675,896
Dividends and other receivables* 15,647,787 412,362 1,090,934 39,037 60,820
Total assets 10,852,701,519 534,259,301 3,582,653,361 40,906,613 153,469,377
Liabilities
Bank Overdrafts 9,447,169 - 1,688,113 - -
Financial liabilities at fair value through profit or loss (Notes
2 and 6) 853,841 - - - -
Due to brokers 22,856,845 53 5,026,090 - 793,753
Due to shareholders 72,601,870 8,581,302 25,285,573 107,528 469,878
Due to investment manager (Note 3) 13,162,281 496,130 5,873,836 36,721 161,449
Accrued expenses 2,855,722 118,418 492,583 37,357 22,410
Total liabilities 121,777,728 9,195,903 38,366,195 181,606 1,447,490
Net Assets Attributable toHolders of Redeemable
Participating
Shares 10,730,923,791 525,063,398 3,544,287,166 40,725,007 152,021,887
Shares in issue
Class I 6,791,629 30,722,644 2,777,438 1,669,307
Class II 14,368 16,334 - -
Class III 1,517,818 - - 713,695
Class III (G) - - 754,872 -
Class I (Dist) 349,734 227,209 - -
Class IV 1,006,282 - - -
Class V - - - -
Class VI 11,765,460 - - -
Class VI (Dist) 5,209,287 - - -
GBP III Hedged (Dist) - - - -
Class III (Acc JPY) - - --
Class III (Dist) - - - -
Class I (Monthly Dist) - - - -
Class I (HKD Monthly Dist) - - - -
Class I GBP - - - -
Class I (EUR Acc) - - - -
Class VI (GBP Dist) - - - -
Class VI (EUR Acc) - - - -
* This includes unamortised preliminary expenses amounting to $9,503, $12,517 and $30,902 in relation to the Global Credit Income Fund,
Asia Pacific All Cap Fund and Japan Equity Fund respectively

First State Global Umbrella Fund PLC
Statement of Financial Position (continued)
as at 31 December 2016
See accompanying notes to the financial statements
267
Indian
Subcontinent
Fund
US$
Global Bond
Fund
US$
High Quality
Bond Fund
US$
Long Term
Bond Fund
US$
Greater China
Growth Fund
US$
Singapore and
Malaysia
Growth Fund
US$
Asia
Opportunities
Fund
US$
Asian Equity
Plus Fund
US$
36,824,197 227,104 1,004,814 590,567 5,886,704 1,984,393 1,066,691 15,052,966
- 2,164 64,872 34,162 - - - -
- 105 2,291,016 - 1,982,178 - - 5,322,444
5,106,226 7,614 70,893 64,193 1,472,685 137,575 42,875 17,400,937
311,472,556 15,031,097 80,612,928 66,177,987 485,857,581 48,433,460 33,582,240 2,550,284,117
142,593 86,420 627,301 469,568 - 76,057 24,587 653,860
353,545,572 15,354,504 84,671,824 67,336,477 495,199,148 50,631,485 34,716,393 2,588,714,324
- - - - - - - 1,537,337
- 47,535 16,301 15,742 - - - -
27,420 99,429 2,863,577 248,272 2,958,768 - 6,798 -
4,642,790 9,588 82,824 64,173 2,026,186 148,144 58,133 21,070,802
402,383 6,675 22,014 16,441 623,137 62,938 49,786 3,080,533
121,569 4,704 10,063 8,902 70,949 10,446 10,580 457,082
5,194,162 167,931 2,994,779 353,530 5,679,040 221,528 125,297 26,145,754
348,351,410 15,186,573 81,677,045 66,982,947 489,520,108 50,409,957 34,591,096 2,562,568,570
2,462,742 342,445 - - 6,424,647 1,049,067 924,839 5,334,154
15,127 - - - - - - -
7,953,088 595,808 3,537,020 2,782,043 366,751 - - 863,157
- - - - - - - -
19,148 - 285,268 - 24,995 - - 55,422,260
- - - - 984,586 - - -
- - - - - - - -
- - - - - - - -
- - - - - - - -
- - - - - - - 490,061
- - - - - - - -
- - - - 588,876 - - 5,901,920
- - - - - - - -
- - - - - - - -
- - - - - - - -
- - - - - - - -
- - - - - - - -
- - - - - - - -

First State Global Umbrella Fund PLC
Statement of Financial Position (continued)
as at 31 December 2016
See accompanying notes to the financial statements
268
31-Dec-2016
Total
US$
Asian
Growth
Fund
US$
China
Growth
Fund
US$
Worldwide
Leaders
Fund
US$
Hong Kong
Growth
Fund
US$
NAV per share-class I $37.73 $114.47 $9.91 $51.64
NAV per share-class II $88.25 $175.46 - -
NAV per share-class III $46.46 - - $92.21
NAV per share-class III (G) - - $17.48 -
NAV per share-class I (Dist) $35.34 $107.15 - -
NAV per share-class IV $11.26 - - -
NAV per share-class V - - - -
NAV per share-class VI $10.11 - - -
NAV per share-class VI (Dist) $10.41 - - -
NAV per share-GBP III Hedged (Dist) - - - -
NAV per share-class III (Acc JPY) - - - -
NAV per share-class III (Dist) - - - -
NAV per share-class I (Monthly Dist) - - - -
NAV per share-class I (HKD Monthly Dist) - - - -
NAV per share-class I GBP - - - -
NAV per share-class I (EUR Acc) - - - -
NAV per share-class VI (GBP Dist) - - - -
NAV per share-class VI (EUR Acc) - - - -

First State Global Umbrella Fund PLC
Statement of Financial Position (continued)
as at 31 December 2016
See accompanying notes to the financial statements
269
Indian
Subcontinent
Fund
US$
Global Bond
Fund
US$
High Quality
Bond Fund
US$
Long Term
Bond Fund
US$
Greater China
Growth Fund
US$
Singapore and
Malaysia
Growth Fund
US$
Asia
Opportunities
Fund
US$
Asian Equity
Plus Fund
US$
$78.68 $14.98 - - $72.52 $48.05 $37.40 $53.84
$47.62 - - - - - - -
$19.15 $16.87 $21.99 $24.07 $10.66 - - $10.02
- - - - - - - - $77.88 - $13.62 - $65.74 - - $39.51
- - - - $11.73 - - -
- - - - - - - -
- - - - - - - -
- - - - - - - -
- - - - - - - £13.76
- - - - - - - -
- - - - $10.94 - - $11.61
- - - - - - - -
- - - - - - - -
- - - - - - - -
- - - - - - - -
- - - - - - - - - - - - - - - -

First State Global Umbrella Fund PLC
Statement of Financial Position (continued)
as at 31 December 2016
See accompanying notes to the financial statements
270
Asian Bond
Fund
US$
Asian Quality
Bond Fund
US$
Global
Emerging
Markets
Leaders Fund
US$
Global
Resources Fund
US$
Global Property
Securities Fund
US$
Assets
Cash and cash equivalents (Note 10) 638,452 13,580,258 105,431,841 4,192,227 298,231
Margin accounts (Note 10) 13,487 671,924 - - -
Due from brokers - 21 400,121 205,685 -
Due from shareholders 131,336 3,235,471 2,180,590 956,912 146,552
Financial assets at fair value through profit or loss
(Notes 2 and 6) 18,280,306 628,196,634 993,712,346 131,358,919 16,070,479
Dividends and other receivables* 186,612 5,828,684 2,791,032 95,981 83,964
Total assets 19,250,193 651,512,992 1,104,515,930 136,809,724 16,599,226
Liabilities
Bank Overdrafts - 372,360 - - -
Financial liabilities at fair value through profit or loss
(Notes 2 and 6) 1,805 76,827 - - -
Due to brokers 250,918 7,005,027 1,994,162 - -
Due to shareholders 163,624 3,731,858 2,055,201 327,450 60,532
Due to investment manager (Note 3) 15,442 523,630 843,945 160,934 19,656
Accrued expenses 7,517 62,203 734,071 33,905 28,717
Total liabilities 439,306 11,771,905 5,627,379 522,289 108,905
Net Assets Attributable toHolders of Redeemable
Participating
Shares 18,810,887 639,741,087 1,098,888,551 136,287,435 16,490,321
Shares in issue
Class I - 29,522,032 6,127,628 14,542,232 1,423,450
Class II - - - - -
Class III - 1,166,669 32,917,110 1,816,613 -
Class III (G) - - - - -
Class I (Dist) 2,242,454 - - - -
Class IV - - 781,086 988,282 -
Class V - - - - -
Class VI - - - - -
Class VI (Dist) - 150 - - 8,311
GBP III Hedged (Dist) - - - - -
Class III (Acc JPY) - - - -
Class III (Dist) - - - - -
Class I (Monthly Dist) - 10,664,964 - - -
Class I (HKD Monthly Dist) - 4,498,233 - - -
Class I GBP - - - - -
Class I (EUR Acc) - - - - -
Class VI (GBP Dist) - - - - -
Class VI (EUR Acc) - - - - -

First State Global Umbrella Fund PLC
Statement of Financial Position (continued)
as at 31 December 2016
See accompanying notes to the financial statements
271
Asian
Property
Securities Fund
US$
China Focus
Fund
US$
Global Listed
Infrastructure
Fund
US$
Asia Pacific
Select Fund
US$
Global
Agribusiness
Fund*
US$
Worldwide
Equity Fund
US$
Emerging
Markets Bond
Fund
US$
257,621 3,434,006 6,533,603 1,553,437 10,962 4,062,914 1,381,321
- - - - - - -
- - 547,023 172,910 - - -
1,643 559,355 8,224,748 167,660 21,406 254,112 1,130,916
11,728,903 214,304,842 293,581,194 88,870,078 - 20,794,094 26,251,489
48,963 - 1,195,803 23,323 - 10,815 401,611
12,037,130 218,298,203 310,082,371 90,787,408 32,368 25,121,935 29,165,337
- - 5,849,359 - - - -
- - - - - - -
- - 592,997 18 - - -
27,061 1,157,026 299,271 132,270 24,430 3,776 1,130,780
14,802 317,474 223,397 63,343 - 22,069 16,255
21,794 61,350 364,873 12,254 7,938 6,753 5,974
63,657 1,535,850 7,329,897 207,885 32,368 32,598 1,153,009
11,973,473 216,762,353 302,752,474 90,579,523 - 25,089,337 28,012,328
106,941 15,410,484 741,830 600 - 217,796 2,691
- - - - - - -
- 30,554 3,877,158 6,334,389 - 1,731,098 2,733,110
- - - - - - -
1,898,883 - 6,894,570 - - - 23,705
- 3,654,559 - - - - -
- - - - - - -
- - 11,012,437 - - - -
- - 1,494,512 - - - -
- - - - - - -
- - - - - - -
- - - - - - -
- - - - - - 1,318
- - - - - - 291
- - - - - - -
- - 31,605 - - - -
- - 666,520 - - - -
- - 1,259,511 - - - -
* The First State Global Agribusiness Fund terminated on 8 November 2016.

First State Global Umbrella Fund PLC
Statement of Financial Position (continued)
as at 31 December 2016
See accompanying notes to the financial statements
272
Asian Bond
Fund
US$
Asian Quality
Bond Fund
US$
Global
Emerging
Markets
Leaders Fund
US$
Global
Resources Fund
US$
Global
Property
Securities Fund
US$
NAV per share-class I - $15.68 $22.70 $7.92 $11.53
NAV per share-class II - - - - -
NAV per share-class III - $9.98 $28.89 $8.90 -
NAV per share-class III (G) - - - - -
NAV per share-class I (Dist) $8.38 - - - -
NAV per share-class IV - - $11.10 $4.93 -
NAV per share-class V - - - - -
NAV per share-class VI - - - - -
NAV per share-class VI (Dist) - $9.60 - - $9.34
NAV per share-GBP III Hedged (Dist) - - - - -
NAV per share-class III (Acc JPY) - - - - -
NAV per share-class III (Dist) - - - - -
NAV per share-class I (Monthly Dist) - $10.03 - - -
NAV per share-class I (HKD Monthly Dist) - HKD 100.17 - - -
NAV per share-class I GBP - - - - -
NAV per share-class I (EUR Acc) - - - - -
NAV per share-class VI (GBP Dist) - - - - -
NAV per share-class VI (EUR Acc) - - - - -

First State Global Umbrella Fund PLC
Statement of Financial Position (continued)
as at 31 December 2016
See accompanying notes to the financial statements
273
Asian Property
Securities Fund
US$
China Focus
Fund
US$
Global Listed
Infrastructure
Fund
US$
Asia Pacific
Select Fund
US$
Global
Agribusiness
Fund*
US$
Worldwide
Equity Fund
US$
Emerging
Markets Bond
Fund
US$
$8.12 $11.91 $11.16 $10.87 - $13.15 $13.01
- - - - - - -
- $10.36 $14.39 $14.29 - $12.83 $10.13
- - - - - - -
$5.84 - $11.33 - - - $10.40
- $8.99 - - - - -
- - - - - - -
- - $10.73 - - - -
- - $10.41 - - - -
- - - - - - -
- - - - - - -
- - - - - - -
- - - - - - $10.24
- - - - - - HKD 102.51
- - - - - - -
- - €11.71 - - - -
- - £12.95 - - - -
- - €11.78 - - - -
* The First State Global Agribusiness Fund terminated on 8 November 2016.

First State Global Umbrella Fund PLC
Statement of Financial Position (continued)
as at 31 December 2016
See accompanying notes to the financial statements
274
Global Credit
Income Fund
US$
Asia Pacific All
Cap Fund
US$
Japan Equity
Fund
US$
Assets
Cash and cash equivalents (Note 10) 2,885,995 818,482 1,168,377
Margin accounts (Note 10) 1,412,521 - -
Due from brokers 879 83,346 729,218
Due from shareholders - 23,750 541,107
Financial assets at fair value through profit or loss (Notes 2 and
6) 110,968,451 62,473,038 54,627,699
Dividends and other receivables* 1,150,886 20,597 125,977
Total assets 116,418,732 63,419,213 57,192,378
Liabilities
Bank Overdrafts - - -
Financial liabilities at fair value through profit or loss (Notes 2
and 6) 695,631 - -
Due to brokers 416,443 30 573,090
Due to shareholders - 786 940,884
Due to investment manager (Note 3) - 64,843 44,448
Accrued expenses 43,769 41,116 58,425
Total liabilities 1,155,843 106,775 1,616,847
Net Assets Attributable toHolders of Redeemable
Participating
Shares 115,262,889 63,312,438 55,575,531
Shares in issue
Class I - - 893
Class II - - -
Class III - 5,246,016 1,659,217
Class III (G) - - -
Class I (Dist) - - -
Class IV - - -
Class V 11,474,280 - -
Class VI - - -
Class VI (Dist) - - -
GBP III Hedged (Dist) 343 - -
Class III (Acc JPY) - - 1,216,480
Class III (Dist) - - -
Class I (Monthly Dist) - - -
Class I (HKD Monthly Dist) - - -
Class I GBP - - -
Class I (EUR Acc) - - -
Class VI (GBP Dist) - - -
Class VI (EUR Acc) - - 2,438,800
*This includes unamortised preliminary expenses amounting to $9,503, $12,517 and $30,902 in relation to the Global Credit Income Fund, Asia
Pacific All Cap Fund and Japan Equity Fund respectively.

First State Global Umbrella Fund PLC
Statement of Financial Position (continued)
as at 31 December 2016
See accompanying notes to the financial statements
275
Global Credit
Income Fund
US$
Asia Pacific All
Cap Fund
US$
Japan Equity
Fund US$
Fund
US$
NAV per share-class I - - $9.73
NAV per share-class II - - -
NAV per share-class III - $12.06 $12.36
NAV per share-class III (G) - - -
NAV per share-class I (Dist) - - -
NAV per share-class IV - - -
NAV per share-class V $10.04 - -
NAV per share-class VI - - -
NAV per share-class VI (Dist) - - -
NAV per share-GBP III Hedged (Dist) £9.69 - -
NAV per share-class III (JPY) - - JPY1,032.11
NAV per share-class III (Dist) - - -
NAV per share-class I (Monthly Dist) - - -
NAV per share-class I (HKD Monthly Dist) - - -
NAV per share-class I GBP - - -
NAV per share-class I (EUR) - - -
NAV per share-class VI (GBP Dist) - - -
NAV per share-class VI (EUR) - - €9.44

First State Global Umbrella Fund PLC
Statement of Comprehensive Income
for the year ended 31 December 2017
See accompanying notes to the financial statements
276
31-Dec-2017
Total
US$
Asian
Growth
Fund
US$
China
Growth
Fund
US$
Worldwide
Leaders
Fund
US$
Hong Kong
Growth
Fund
US$
Income
Interest income 34,165,530 124,639 72,010 44,387 5,749
Dividend income 232,810,727 12,419,539 71,289,266 677,547 4,099,853
Sundry income 832,647 17,164 152,200 16,237 8,106
Realised gain/(loss) on financial assets and liabilities at fair value
through profit or loss
- Derivative instruments (Note 9) (3,450,262) - - - -
- Non-derivative instruments 653,526,634 23,235,552 261,815,302 2,163,217 11,856,136
Net (loss)/gain on foreign exchange (1,870,062) (97,788) (124,214) (9,036) (11,604)
Net change in unrealised appreciation/(depreciation) on financial
assets/ liabilities at fair value through profit or loss
- Derivative instruments (Note 9) 66,745 - - - -
- Non-derivative instruments 3,143,933,630 98,002,981 1,525,600,153 7,516,753 47,875,567
Total net income 4,060,015,589 133,702,087 1,858,804,717 10,409,105 63,833,807
Expenses
Investment management fees (Note 3) 180,506,269 6,781,067 79,991,440 503,936 2,203,409
Investment management fixed expenses fees (Note 3) - - - - -
Administration fees 4,939,278 243,446 1,940,150 19,908 52,706
Legal and other professional fees 252,341 14,854 52,256 6,211 2,011
Safe custody and bank charges 1,478,234 80,641 229,704 3,703 13,883
Audit fees 382,013 13,383 126,987 1,174 4,425
Directors fees 129,872 4,602 42,240 465 1,682
Preliminary expenses 29,483 - - - -
Other expenses 3,942,550 205,519 671,460 69,175 72,495
Total expenses 191,660,040 7,343,512 83,054,237 604,572 2,350,611
Operating profit 3,868,355,549 126,358,575 1,775,750,480 9,804,533 61,483,196
Finance costs
Distributions to redeemable participating shareholders (65,780,595) (807,451) (43,344) - -
Interest expense (609,256) (7,145) (231,480) (70) (3,694)
Profit for the financial year before tax 3,801,965,698 125,543,979 1,775,475,656 9,804,463 61,479,502
Capital gains tax (2,769,447) (225,051) - - -
Withholding tax on dividends (19,179,954) (1,003,526) (4,212,697) (100,863) (41,511)
Increase in net assets attributable to holders of redeemable
participating shareholders 3,780,016,297 124,315,402 1,771,262,959 9,703,600 61,437,991
Gains and losses arose solely from continuing operations with the exception of Global Emerging Markets Bond Fund. There were no gains or losses other
than those dealt with in the Statement of Comprehensive Income.(‘SCI”)

First State Global Umbrella Fund PLC
Statement of Comprehensive Income (continued)
for the year ended 31 December 2017
See accompanying notes to the financial statements
277
Indian
Subcontinent
Fund
US$
Global Bond
Fund
US$
High
Quality
Bond Fund
US$
Long Term
Bond Fund
US$
Greater China
Growth Fund
US$
Income
Interest income 306,927 267,964 2,295,649 1,576,349 10,594
Dividend income 4,220,397 - - - 11,680,118
Sundry income 282,799 907 3,433 5,676 24,196
Realised gain/(loss) on financial assets and liabilities at
fair value through profit or loss
- Derivative instruments (Note 9) 92,676 (38,172) 26,279 -
- Non-derivative instruments 55,292,264 86,003 241,192 (196,297) 21,582,969
Net (loss)/gain on foreign exchange (82,362) (63,021) 7 - (78,653)
Net change in unrealised appreciation/(depreciation) on
financial assets/ liabilities at fair value through profit or
loss
- Derivative instruments (Note 9) - 48,352 - - -
- Non-derivative instruments 102,056,699 791,540 1,279,797 1,957,053 200,803,110
Total net income 162,076,724 1,224,421 3,781,906 3,369,060 234,022,334
Expenses
Investment management fees (Note 3) 6,423,939 85,353 270,183 207,028 8,322,726
Investment management fixed expenses fees (Note 3) - - - - -
Administration fees 122,941 7,590 6,501 4,987 271,087
Legal and other professional fees 14,115 328 93 618 13,962
Safe custody and bank charges 154,411 915 4,044 3,274 28,949
Audit fees 13,636 402 2,087 1,717 36,715
Directors fees 7,096 123 663 339 5,699
Preliminary expenses - - - - -
Other expenses 263,060 20,377 36,394 15,841 177,204
Total expenses 6,999,198 115,088 319,965 233,804 8,856,342
Operating profit 155,077,526 1,109,333 3,461,941 3,135,256 225,165,992
Finance costs
Distributions to redeemable participating shareholders - - (60,038) - (95,555)
Interest expense (14) (27,911) (155) - (25,457)
Profit for the financial year before tax 155,077,512 1,081,422 3,401,748 3,135,256 225,044,980
Capital gains tax (2,669,775) - - - -
Withholding tax on dividends (76,596) (279) (10,763) - (1,029,108)
Increase in net assets attributable to holders of
redeemable participating shareholders 152,331,141 1,081,143 3,390,985 3,135,256 224,015,872

First State Global Umbrella Fund PLC
Statement of Comprehensive Income (continued)
for the year ended 31 December 2017
See accompanying notes to the financial statements
278
Singapore and
Malaysia
Growth Fund
US$
Asia
Opportunities
Fund
US$
Asian Equity
Plus Fund
US$
Asian Bond
Fund
US$
Asian Quality
Bond Fund
US$
Global
Emerging
Markets
Leaders
Fund
US$
Global
Resources
Fund US$
Global
Property
Securities
Fund
US$
11,340 6,605 1,163,309 851,542 22,450,652 712,483 13,974 1,385
1,645,165 794,666 58,590,044 - - 30,809,370 2,736,471 602,145
11,916 2,528 86,895 1,093 52,165 32,401 5,168 202
- - - (38,669) (2,092,416) - - -
23,190 479,236 140,659,075 107,254 3,470,131 64,014,907 4,095,803 44,188
(1,393) (6,455) (953,504) 17,043 5,052 (1,394,517) 112,798 17,587
- - - 17,540 43,564 - - -
9,223,549 7,572,818 750,384,053 271,936 16,884,358 222,016,202 12,249,179 1,491,476
10,913,767 8,849,398 949,929,872 1,227,739 40,813,506 316,190,846 19,213,393 2,156,983
792,064 664,934 42,525,991 210,270 6,144,442 11,401,618 1,666,745 270,962
- - - - - - - -
25,610 21,615 1,347,264 10,198 299,193 76,920 54,700 8,781
2,177 4,088 51,788 3,302 23,918 23,738 3,176 981
9,153 6,265 414,270 954 31,153 384,557 8,486 1,092
1,301 1,010 98,256 721 15,947 32,313 2,418 481
405 414 28,787 302 6,234 13,318 2,005 190
- - - - - - - -
81,910 57,065 459,118 38,350 170,069 737,058 150,037 20,747
912,620 755,391 44,925,474 264,097 6,690,956 12,669,522 1,887,567 303,234
10,001,147 8,094,007 905,004,398 963,642 34,122,550 303,521,324 17,325,826 1,853,749
- - (51,233,317) (496,443) (4,635,829) - - (1,992)
(15) (522) (162,576) (27,765) (465) (1,520) (129) (71)
10,001,132 8,093,485 853,608,505 439,434 29,486,256 303,519,804 17,325,697 1,851,686
- - - (1,856) (52,047) 195,426 - -
(15,634) (59,743) (5,864,642) (2,497) (85,872) (2,267,002) (336,159) (110,787)
9,985,498 8,033,742 847,743,863 435,081 29,348,337 301,448,228 16,989,538 1,740,899

First State Global Umbrella Fund PLC
Statement of Comprehensive Income (continued)
for the year ended 31 December 2017
See accompanying notes to the financial statements
279
Asian Property
Securities Fund
US$
China Focus
Fund
US$
Global Listed
Infrastructure
Fund
US$
Asia Pacific
Select Fund
US$
Income
Interest income 347 10,798 10,804 5,751
Dividend income 372,919 7,245,332 20,545,404 2,381,526
Sundry income 907 5,284 30,355 1,193
Realised gain/(loss) on financial assets and liabilities at fair
value through profit or loss
- Derivative instruments (Note 9) - - - -
- Non-derivative instruments 490,595 13,186,899 37,484,429 3,564,786
Net (loss)/gain on foreign exchange 2,443 (19,974) 868,961 (22,575)
Net change in unrealised appreciation/(depreciation) on
financial assets/liabilities at fair value through profit or loss
- Derivative instruments (Note 9) - - - -
- Non-derivative instruments 1,092,673 36,762,508 20,577,001 32,874,273
Total net income 1,959,884 57,190,847 79,516,954 38,804,954
Expenses
Investment management fees (Note 3) 165,784 4,067,335 4,799,176 993,274
Investment management fixed expenses fees (Note 3) - - - -
Administration fees 5,360 115,180 215,154 5,009
Legal and other professional fees 776 4,926 15,577 4,976
Safe custody and bank charges 875 14,303 37,781 16,984
Audit fees 251 5,114 13,683 3,033
Directors fees 62 1,779 9,121 1,271
Preliminary expenses - - - -
Other expenses 19,594 150,375 348,658 35,275
Total expenses 192,702 4,359,012 5,439,150 1,059,822
Operating profit 1,767,182 52,831,835 74,077,804 37,745,132
Finance costs
Distributions to redeemable participating shareholders (326,691) - (5,645,827) -
Interest expense (79) (5,024) (90,472) (4,065)
Profit for the financial year before tax 1,440,412 52,826,811 68,341,505 37,741,067
Capital gains tax - - - 5,717
Withholding tax on dividends (26,322) (323,444) (3,010,244) (252,165)
Increase in net assets attributable to holders of
redeemable participating shareholders 1,414,090 52,503,367 65,331,261 37,494,619

First State Global Umbrella Fund PLC
Statement of Comprehensive Income (continued)
for the year ended 31 December 2017
See accompanying notes to the financial statements
280
Global
Agribusiness
Fund**
US
Worldwide
Equity Fund
US$
Emerging
Markets
Bond Fund*
US$
Global Credit
Income Fund
US$
Asia Pacific
All Cap
Fund
US$
Japan
Equity Fund
US$
Sustainable
Listed
Infrastructure
US$
- 19,103 1,766,068 2,435,234 866 1,001 -
- 452,334 - 7,851 1,456,630 772,291 11,859
- 4,199 611 85,517 886 495 114
- - - (1,399,960) - - -
- 1,637,709 536,032 1,001,942 1,185,905 5,468,215 -
- 179,233 (1,888) (100,455) (16,150) (68,205) (21,392)
- - - (42,711) - - -
- 4,044,358 (182,302) 1,766,408 20,776,925 20,209,546 35,016
- 6,336,936 2,118,521 3,753,826 23,405,062 26,383,343 25,597
- 298,707 101,514 22 921,210 692,612 528
- - - - - - -
- 6,410 3,607 47,318 4,987 22,614 42
- 1,573 182 674 4,329 1,665 47
- 4,992 928 3,970 17,514 5,430 3
- 716 453 1,833 1,980 1,972 5
- 251 200 286 836 1,501 1
- - - 9,535 9,974 9,974 -
- 22,859 41,185 21,550 28,537 28,496 142
- 335,508 148,069 85,188 989,367 764,264 768
- 6,001,428 1,970,452 3,668,638 22,415,695 25,619,079 24,829
- - (7,709) (2,426,399) - - -
- (2) (75) (12,764) (4,696) (3,090) -
- 6,001,426 1,962,668 1,229,475 22,410,999 25,615,989 24,829
- - (1,343) - (20,518) - -
- (57,991) (232) - (168,561) (117,381) (5,935)
- 5,943,435 1,961,093 1,229,475 22,221,920 25,498,608 18,894
* The First State Emerging Market Bond Fund terminated on 23 November 2017.
** The First State Global Agribusiness Fund terminated on 8 November 2016.

First State Global Umbrella Fund PLC
Statement of Comprehensive Income
for the year ended 31 December 2016
See accompanying notes to the financial statements
281
31-Dec-2016
Total
US$
Asian
Growth
Fund
US$
China
Growth
Fund
US$
Worldwide
Leaders
Fund
US$
Hong Kong
Growth
Fund
US$
Income
I Interest income 33,816,366 26,076 39,043 6,488 1,769
Dividend income 237,936,762 14,163,929 87,645,616 704,717 4,087,654
Sundry income 2,677,370 117,271 407,080 24,403 29,587
Realised gain/(loss) on financial assets and liabilities at fair value
t through profit or loss
- Derivative instruments (Note 9) (2,075,031) - - - -
- Non-derivative instruments 131,847,395 (414,283) 49,511,982 447,024 (2,154,864)
Net (loss)/gain on foreign exchange (3,384,547) (157,386) (186,494) (14,629) 822
Net change in unrealised appreciation/(depreciation) on financial
aassets/liabilities at fair value through profit or loss
- Derivative instruments (Note 9) 1,232,556 - - - -
- Non-derivative instruments (188,453,251) (6,668,731) (215,185,787) 2,010,908 6,605,999
Total net income/(expense) 213,597,620 7,066,876 (77,768,560) 3,178,911 8,570,967
Expenses
I Investment management fees (Note 3) 162,709,945 6,756,633 73,378,742 443,011 1,798,147
I Investment management fixed expenses fees (Note 3) 10,133 2,942 5,888 - -
Depositary fees 73,362 2,753 2,753 2,753 2,753
Administration fees 4,504,611 243,232 1,779,768 18,028 47,812
Legal and other professional fees 316,240 21,137 27,576 3,131 2,800
Safe custody and bank charges 2,156,119 137,255 417,391 21,831 36,943
Audit fees 316,065 17,228 97,418 1,267 4,495
Directors fees 102,460 6,504 29,144 433 1,528
Preliminary expenses 30,003 - - - -
Other expenses 2,197,448 122,187 325,907 46,204 43,394
Total expenses 172,416,386 7,309,871 76,064,587 536,658 1,937,872
Operating profit/(loss) 41,181,234 (242,995) (153,833,147) 2,642,253 6,633,095
Finance costs
Distributions to redeemable participating shareholders (59,411,073) (396,942) (84,728) - -
I Interest expense (694,486) (122) (60,093) (17) (1,030)
( Loss)/profit for the financial year before tax (18,924,325) (640,059) (153,977,968) 2,642,236 6,632,065
Capital gains tax (1,638,513) (15,668) - - -
Withholding tax on dividends (18,119,832) (975,999) (4,920,704) (98,276) (61,740)
(Decrease)/increase in net assets attributable to
redeemable participating shareholders (38,682,670) (1,631,726) (158,898,672) 2,543,960 6,570,325
Gains and losses arose solely from continuing operations with the exception of Global Agribusiness Fund. There were no gains or losses other than those
dealt with in the Statement of Comprehensive Income.(‘SCI”)

First State Global Umbrella Fund PLC
Statement of Comprehensive Income (continued)
for the year ended 31 December 2016
See accompanying notes to the financial statements
282
Indian
Subcontinent
Fund
US$
Global Bond
Fund
US$
High
Quality
Bond Fund
US$
Long Term
Bond Fund
US$
Greater China
Growth Fund
US$
Income
Interest income 22,843 206,085 2,309,594 1,709,222 10,434
Dividend income 3,070,252 - - - 13,444,652
Sundry income 14,785 201 1,026 989 104,185
Realised gain/(loss) on financial assets and liabilities at fair
value through profit or loss
- Derivative instruments (Note 9) - (212,096) (941,496) (1,384,573) -
- Non-derivative instruments 21,689,769 400,008 1,086,340 2,132,007 23,698,722
Net (loss)/gain on foreign exchange (315,955) (41,547) (16,486) (7) (50,973)
Net change in unrealised appreciation/(depreciation) on
financial assets/liabilities at fair value through profit or loss
- Derivative instruments (Note 9) - (43,393) (16,301) (13,289) -
- Non-derivative instruments (17,153,038) (306,453) (945,101) (2,657,368) (20,115,787)
Total net income/(expense) 7,328,656 2,805 1,477,576 (213,019) 17,091,233
Expenses
Investment management fees (Note 3) 4,221,026 85,171 269,892 233,237 8,082,822
Investment management fixed expenses fees (Note 3) 1,303 - - - -
Depositary fees 2,753 2,753 2,753 2,753 2,753
Administration fees 101,008 7,586 6,495 4,986 263,435
Legal and other professional fees 41,023 2,259 2,762 3,334 15,724
Safe custody and bank charges 162,809 5,724 16,395 4,555 79,664
Audit fees 9,970 481 2,476 2,087 15,474
Directors fees 3,079 183 884 866 4,655
Preliminary expenses - - - - -
Other expenses 179,675 14,110 26,890 17,702 108,323
Total expenses 4,722,646 118,267 328,547 269,520 8,572,850
Operating profit/(loss) 2,606,010 (115,462) 1,149,029 (482,539) 8,518,383
Finance costs
Distributions to redeemable participating shareholders - - (49,481) - (69,749)
Interest expense (446) (20,305) (1,177) (30,542) (10,277)
(Loss)/profit for the financial year before tax 2,605,564 (135,767) 1,098,371 (513,081) 8,438,357
Capital gains tax (1,508,059) - - - -
Withholding tax on dividends (26,972) (286) 167 - (1,234,331)
(Decrease)/increase in net assets attributable to
redeemable participating shareholders 1,070,533 (136,053) 1,098,538 (513,081) 7,204,026

First State Global Umbrella Fund PLC
Statement of Comprehensive Income (continued)
for the year ended 31 December 2016
See accompanying notes to the financial statements
283
Singapore and
Malaysia
Growth Fund
US$
Global
Emerging
Markets
Leaders
Fund
US$
Global
Property
Securities
Fund
US$
Asia
Opportunities
Fund*
US$
Asian Equity
Plus Fund
US$
Asian Bond
Fund
US$
Asian Quality
Bond Fund
US$
Global
Resources Fund
US$
3,016 1,229 1,061,908 718,265 22,640,593 104,594 1,336 393
1,863,717 809,324 63,584,610 - - 28,350,955 1,626,261 586,426
105,341 19,192 1,214,246 214 9,140 451,497 6,268 195
- - - (37,224) (811,049) - - -
566,301 311,166 70,020,923 73,443 6,802,754 (8,420,260) (10,466,418) (56,055)
3,279 (8,504) (1,835,953) (5,480) (101,734) (327,577) 51,345 37,604
- - - (1,141) 102,368 - - -
(65,498) (170,789) (42,133,166) (71,086) (8,263,114) 59,510,578 33,971,690 (309,607)
2,476,156 961,618 91,912,568 676,991 20,378,958 79,669,787 25,190,482 258,956
811,616 587,281 39,573,708 176,557 5,913,537 10,254,135 1,198,139 230,712
- - - - - - - -
2,753 2,753 2,753 2,753 2,753 2,753 2,753 2,753
26,242 16,276 1,268,401 8,563 287,013 86,437 41,373 7,592
2,927 7,717 67,113 2,837 23,572 28,452 3,928 2,535
39,691 21,804 532,293 15,414 66,415 384,219 45,993 4,015
1,707 1,079 76,837 553 20,207 34,175 4,173 521
599 345 26,789 197 7,224 11,061 923 181
- - - - - - - -
55,953 35,108 271,822 29,005 107,562 176,956 83,833 10,591
941,488 672,363 41,819,716 235,879 6,428,283 10,978,188 1,381,115 258,900
1,534,668 289,255 50,092,852 441,112 13,950,675 68,691,599 23,809,367 56
- - (49,387,809) (503,646) (3,576,719) - - (16,918)
(2) (194) (16,649) (13) (458,142) (26) (9,084) (5)
1,534,666 289,061 688,394 (62,547) 9,915,814 68,691,573 23,800,283 (16,867)
- (65,364) - - - - - -
(15,881) (49,335) (5,576,589) (3,285) (106,650) (2,549,405) (260,719) (135,656)
1,518,785 174,362 (4,888,195) (65,832) 9,809,164 66,142,168 23,539,564 (152,523)
* Formerly known as First State Asia Innovation Fund.
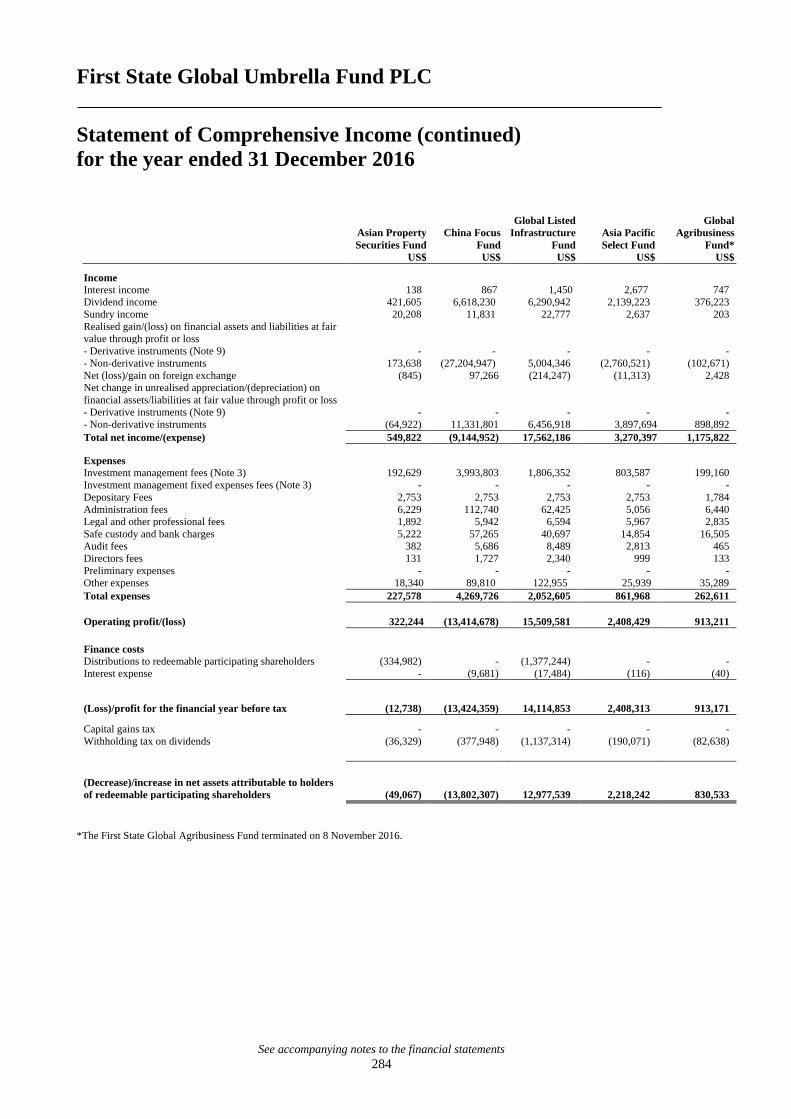
First State Global Umbrella Fund PLC
Statement of Comprehensive Income (continued)
for the year ended 31 December 2016
See accompanying notes to the financial statements
284
Asian Property
Securities Fund
US$
China Focus
Fund
US$
Global Listed
Infrastructure
Fund
US$
Asia Pacific
Select Fund
US$
Global
Agribusiness
Fund*
US$
Income
Interest income 138 867 1,450 2,677 747
Dividend income 421,605 6,618,230 6,290,942 2,139,223 376,223
Sundry income 20,208 11,831 22,777 2,637 203
Realised gain/(loss) on financial assets and liabilities at fair
value through profit or loss
- Derivative instruments (Note 9) - - - - -
- Non-derivative instruments 173,638 (27,204,947) 5,004,346 (2,760,521) (102,671)
Net (loss)/gain on foreign exchange (845) 97,266 (214,247) (11,313) 2,428
Net change in unrealised appreciation/(depreciation) on
financial assets/liabilities at fair value through profit or loss
- Derivative instruments (Note 9) - - - - -
- Non-derivative instruments (64,922) 11,331,801 6,456,918 3,897,694 898,892
Total net income/(expense) 549,822 (9,144,952) 17,562,186 3,270,397 1,175,822
Expenses
Investment management fees (Note 3) 192,629 3,993,803 1,806,352 803,587 199,160
Investment management fixed expenses fees (Note 3) - - - - -
Depositary Fees 2,753 2,753 2,753 2,753 1,784
Administration fees 6,229 112,740 62,425 5,056 6,440
Legal and other professional fees 1,892 5,942 6,594 5,967 2,835
Safe custody and bank charges 5,222 57,265 40,697 14,854 16,505
Audit fees 382 5,686 8,489 2,813 465
Directors fees 131 1,727 2,340 999 133
Preliminary expenses - - - - -
Other expenses 18,340 89,810 122,955 25,939 35,289
Total expenses 227,578 4,269,726 2,052,605 861,968 262,611
Operating profit/(loss) 322,244 (13,414,678) 15,509,581 2,408,429 913,211
Finance costs
Distributions to redeemable participating shareholders (334,982) - (1,377,244) - -
Interest expense - (9,681) (17,484) (116) (40)
(Loss)/profit for the financial year before tax (12,738) (13,424,359) 14,114,853 2,408,313 913,171
Capital gains tax - - - - -
Withholding tax on dividends (36,329) (377,948) (1,137,314) (190,071) (82,638)
(Decrease)/increase in net assets attributable to holders
of redeemable participating shareholders (49,067) (13,802,307) 12,977,539 2,218,242 830,533
*The First State Global Agribusiness Fund terminated on 8 November 2016.

First State Global Umbrella Fund PLC
Statement of Comprehensive Income (continued)
for the year ended 31 December 2016
See accompanying notes to the financial statements
285
Australian
Growth Fund*
US$
Worldwide
Equity Fund
US$
Emerging
Markets
Bond Fund
US$
Global Credit
Income Fund
US$
Asia Pacific
All Cap
Fund
US$
Japan
Equity Fund
US$
- 6,102 1,644,651 3,296,515 331 -
- 376,301 - - 1,382,710 393,415
- 1,793 9,947 99,038 3,059 257
- - - 1,311,407 - -
- 1,549,971 421,801 (33,707) (986,349) 557,275
3,240 (129,187) (11) (185,178) (2,922) 25,897
- - - 1,204,312 - -
- 813,793 547,262 64,131 2,194,674 (2,647,144)
3,240 2,618,773 2,623,650 5,756,518 2,591,503 (1,670,300)
- 268,464 333,562 22 767,268 330,732
- - - - - -
- 2,753 2,753 2,753 2,753 2,753
- 6,250 12,847 62,020 4,986 11,371
- 2,827 14,194 1,964 6,263 8,935
- 6,092 1,487 6,261 12,428 2,897
- 790 859 3,059 1,945 1,429
- 300 309 1,008 658 260
- - - 10,001 10,001 10,001
3,240 25,865 14,815 175,732 23,133 7,108
3,240 313,341 380,826 262,820 829,435 375,486
- 2,305,432 2,242,824 5,493,698 1,762,068 (2,045,786)
- - (650,334) (2,962,521) - -
- (41) (43) (54,507) (995) (3,455)
- 2,305,391 1,592,447 2,476,670 1,761,073 (2,049,241)
- (48,880) - - (542) -
- (59,435) - - (161,423) (59,013)
- 2,197,076 1,592,447 2,476,670 1,599,108 (2,108,254)
*The First State Australian Growth Fund terminated on 30 October 2015.

First State Global Umbrella Fund PLC
Statement of Changes in Net Assets Attributable to
Redeemable Participating Shareholders
for the year ended 31 December 2017
See accompanying notes to the financial statements
286
31-Dec-2017
Total
US$
Asian
Growth
Fund
US$
China
Growth
Fund
US$
Worldwide
Leaders
Fund
US$
Hong Kong
Growth
Fund
US$
Net assets attributable to redeemable participating
shareholders at beginning of financial year
10,730,923,791 525,063,398 3,544,287,166 40,725,007 152,021,887
Increase in net assets attributable to redeemable
participating shareholders
3,780,016,297 124,315,402 1,771,262,959 9,703,600 61,437,991
Proceeds on the issue of shares 26,480,650,115 170,209,877 511,657,629 7,785,142 15,771,640
Payments on the redemption of shares (27,585,382,971) (265,597,784) (1,322,798,622) (10,707,180) (47,852,899)
Net assets attributable to redeemable participating
shareholders at end of financial year
13,406,207,232 553,990,893 4,504,409,132 47,506,569 181,378,619
Statement of Changes in Net Assets Attributable to
Redeemable Participating Shareholders
for the year ended 31 December 2016
31-Dec-2016
Total
US$
Asian
Growth
Fund
US$
China
Growth
Fund
US$
Worldwide
Leaders
Fund
US$
Hong Kong
Growth
Fund
US$
Net assets attributable to redeemable participating
shareholders at beginning of financial year
11,372,276,890 556,635,795 4,281,416,458 38,869,813 171,125,915
(Decrease)/increase in net assets attributable to redeemable
participating shareholders
(38,682,670) (1,631,726) (158,898,672) 2,543,960 6,570,325
Proceeds on the issue of shares 4,585,235,927 156,642,605 439,459,308 5,270,652 9,543,529
Payments on the redemption of shares (5,187,906,356) (186,583,276) (1,017,689,928) (5,959,418) (35,217,882)
Net assets attributable to redeemable participating
shareholders at end of financial year
10,730,923,791 525,063,398 3,544,287,166 40,725,007 152,021,887

First State Global Umbrella Fund PLC
Statement of Changes in Net Assets Attributable to
Redeemable Participating Shareholders (continued)
for the year ended 31 December 2017
See accompanying notes to the financial statements
287
Indian
Subcontinent
Fund
US$
Global Bond
Fund
US$
High Quality
Bond Fund
US$
Long Term
Bond Fund
US$
Greater China
Growth Fund
US$
Net assets attributable to redeemable participating
shareholders at beginning of financial year
348,351,410 15,186,573 81,677,045 66,982,947 489,520,108
Increase in net assets attributable to redeemable
participating shareholders
152,331,141 1,081,143 3,390,985 3,135,256 224,015,872
Proceeds on the issue of shares 207,594,630 835,935 4,685,784 206,657 96,565,262
Payments on the redemption of shares (108,939,441) (691,405) (5,763,606) (48,805) (161,786,933)
Net assets attributable to redeemable participating
shareholders at end of financial year
599,337,740 16,412,246 83,990,208 70,276,055 648,314,309
Statement of Changes in Net Assets Attributable to
Redeemable Participating Shareholders (continued)
for the year ended 31 December 2016
Indian
Subcontinent
Fund
US$
Global Bond
Fund
US$
High Quality
Bond Fund
US$
Long Term
Bond Fund
US$
Greater China
Growth Fund
US$
Net assets attributable to redeemable participating
shareholders at beginning of financial year
268,108,554 15,263,366 82,229,327 77,726,323 601,137,862
Increase in net assets attributable to redeemable
participating shareholders
1,070,533 (136,053) 1,098,538 (513,081) 7,204,026
Proceeds on the issue of shares 140,310,469 964,896 4,165,198 236,193 106,686,217
Payments on the redemption of shares (61,138,146) (905,636) (5,816,018) (10,466,488) (225,507,997)
Net assets attributable to redeemable participating
shareholders at end of financial year
348,351,410 15,186,573 81,677,045 66,982,947 489,520,108

First State Global Umbrella Fund PLC
Statement of Changes in Net Assets Attributable to
Redeemable Participating Shareholders (continued)
for the year ended 31 December 2017
See accompanying notes to the financial statements
288
Singapore and
Malaysia
Growth Fund
US$
Asia
Opportunities
Fund
US$
Asian Equity
Plus Fund
US$
Asian Bond
Fund
US$
Asian Quality
Bond
Fund
US$
Global
Emerging
Markets
Leaders
Fund
US$
Global
Resources
Fund
US$
Global
Property
Securities
Fund
US$
Asian
Property
Securities
Fund
US$
50,409,957 34,591,096 2,562,568,570 18,810,887 639,741,087 1,098,888,551 136,287,435 16,490,321 11,973,473
9,985,498 8,033,742 847,743,863 435,081 29,348,337 301,448,228 16,989,538 1,740,899 1,414,090
4,286,536 8,520,161 23,974,347,220 21,044,367 688,052,890 77,040,689 81,233,647 42,399,939 731,554
(12,634,576) (9,368,617) (24,084,568,230) (6,439,455) (713,513,648) (119,132,370) (140,000,196) (40,564,113) (3,860,573)
52,047,415 41,776,382 3,300,091,423 33,850,880 643,628,666 1,358,245,098 94,510,424 20,067,046 10,258,544
Singapore and
Malaysia
Growth Fund
US$
Asia
Opportunities
Fund*
US$
Asian Equity
Plus Fund
US$
Asian Bond
Fund
US$
Asian Quality
Bond
Fund
US$
Global
Emerging
Markets
Leaders
Fund
US$
Global
Resources
Fund
US$
Global
Property
Securities
Fund
US$
Asian
Property
Securities
Fund
US$
52,583,727 33,899,851 2,775,366,863 15,400,195 494,186,036 1,043,003,836 55,393,027 13,956,122 13,170,037
1,518,785 174,362 (4,888,195) (65,832) 9,809,164 66,142,168 23,539,564 (152,523) (49,067)
4,647,524 8,458,037 398,084,444 10,891,836 2,541,738,169 93,351,377 86,286,840 68,503,222 616,449
(8,340,079) (7,941,154) (605,994,542) (7,415,312) (2,405,992,282) (103,608,830) (28,931,996) (65,816,500) (1,763,946)
50,409,957 34,591,096 2,562,568,570 18,810,887 639,741,087 1,098,888,551 136,287,435 16,490,321 11,973,473
* Formerly known as First State Asia Innovation Fund.

First State Global Umbrella Fund PLC
Statement of Changes in Net Assets Attributable to
Redeemable Participating Shareholders (continued)
for the year ended 31 December 2017
See accompanying notes to the financial statements
289
China Focus
Fund
Global Listed
Infrastructure
Fund
Asia Pacific
Select Fund
Global
Agribusiness
Fund*
Worldwide
Equity Fund
Emerging
Markets Bond
Fund**
US$ US$ US$ US$ US$ US$
Net assets attributable to redeemable participating
shareholders at beginning of financial year
216,762,353 302,752,474 90,579,523 - 25,089,337 28,012,328
Increase in net assets attributable to redeemable
participating shareholders
52,503,367 65,331,261 37,494,619 - 5,943,435 1,961,093
Proceeds on the issue of shares 45,430,139 440,513,853 20,399,669 - 682,049 24,565,475
Payments on the redemption of shares (104,820,954) (272,524,971) (22,389,594) - (1,545,064) (54,538,896)
Net assets attributable to redeemable participating
shareholders at end of financial year
209,874,905 536,072,617 126,084,217 - 30,169,757 -
* The First State Global Agribusiness Fund terminated on 8 November 2016.
**The First State Emerging Market Bond Fund terminated on 23 November 2017
Statement of Changes in Net Assets Attributable to
Redeemable Participating Shareholders (continued)
for the year ended 31 December 2016
China Focus
Fund
Global Listed
Infrastructure
Fund
Asia Pacific
Select Fund
Global
Agribusiness
Fund**
Australian
Growth
Fund*
US$ US$ US$ US$ US$
Net assets attributable to redeemable participating
shareholders at beginning of financial year
281,154,483 124,598,660 94,610,519 17,602,788 -
(Decrease)/increase in net assets attributable to redeemable
participating shareholders
(13,802,307) 12,977,539 2,218,242 830,533 -
Proceeds on the issue of shares 67,479,179 252,109,995 221,607 1,697,533 -
Payments on the redemption of shares (118,069,002) (86,933,720) (6,470,845) (20,130,854) -
Net assets attributable to redeemable participating
shareholders at end of financial year
216,762,353 302,752,474 90,579,523 - -
*The First State Australian Growth Fund terminated on 30 October 2015.
** The First State Global Agribusiness Fund terminated on 8 November 2016.

First State Global Umbrella Fund PLC
Statement of Changes in Net Assets Attributable to
Redeemable Participating Shareholders (continued)
for the year ended 31 December 2017
See accompanying notes to the financial statements
290
Global Credit
Income Fund
Asia Pacific All
Cap Fund
Japan Equity
Fund
Sustainable
Listed
Infrastructure
Fund
US$ US$ US$ US$
115,262,889 63,312,438 55,575,531 -
1,229,475 22,221,920 25,498,608 18,894
118 2,037,438 30,021,884 4,029,931
-
(44,534,795) (4,055,120) (26,705,124) -
71,957,687 83,516,676 84,390,899 4,048,825
Worldwide
Equity Fund
Emerging
Markets Bond
Fund
Global Credit
Income Fund
Asia Pacific All
Cap Fund
Japan Equity
Fund
US$ US$ US$ US$ US$
23,594,154 26,180,283 137,054,006 59,484,672 18,524,218
2,197,076 1,592,447 2,476,670 1,599,108 (2,108,254)
1,627,823 27,452,859 115,505,802 2,620,728 40,663,436
(2,329,716) (27,213,261) (139,773,589) (392,070) (1,503,869)
25,089,337 28,012,328 115,262,889 63,312,438 55,575,531
.

First State Global Umbrella Fund PLC
Statement of Cashflows
for the year ended 31 December 2017
See accompanying notes to the financial statements
291
31-Dec-2017 Total
Asian Growth
Fund
China Growth
Fund
Worldwide
Leaders
Fund
US$ US$ US$ US$
Cash flows from operating activities
Increase in net assets attributable to redeemable participating
shareholders 3,780,016,297 124,315,402 1,771,262,959 9,703,600
Adjustment for:
– Interest income (34,165,530) (124,639) (72,010) (44,387)
– Distributions to holders of redeemable shares 65,780,595 807,451 43,344 -
– Dividend income (232,810,727) (12,419,539) (71,289,266) (677,547)
– Interest expense 609,256 7,145 231,480 70
– Withholding tax on dividends 19,179,954 1,003,526 4,212,697 100,863
– Exchange gains/(losses) on cash and cash equivalents (1,539,273) (18,331) (378,936) (350)
Net (increase)/ decrease in due from/to brokers (21,501,797) 4,437,435 (13,406,046) -
Net increase/(decrease) in other receivables and accrued
expenses 11,572,951 (7,559) 1,182,868 (15,426)
Increase in margin accounts 1,005,836 - - -
(Increase)/decrease in financial assets at fair value through
profit or loss (2,647,959,798) (18,981,226) (978,419,751) (5,561,118)
(Decrease)/increase in financial liabilities at fair value through
profit or loss (432,703) - - -
Cash provided by/(used in) operations 939,755,061 99,019,665 713,367,339 3,505,705
Interest received 26,681,842 124,639 72,010 44,387
Dividend received 216,661,290 11,511,778 68,167,503 609,970
Net cash provided by/(used in) operating activities 1,183,098,193 110,656,082 781,606,852 4,160,062
Cash flows from financing activities
Distributions paid to holders of redeemable shares (65,780,595) (807,451) (43,344) -
Interest paid (599,711) (7,145) (231,480) (70)
Proceeds from redeemable shares issued
2,452,201,236
169,204,149 512,137,981 7,776,941
Redemption of redeemable shares (3,560,748,796) (266,338,992) (1,315,437,120) (10,765,578)
Net cash (used in)/provided by financing activities (1,174,927,866) (97,949,439) (803,573,963) (2,988,707)
Net increase/(decrease) in cash and cash equivalents 8,170,327 12,706,643 (21,967,111) 1,171,355
Cash and cash equivalents at beginning of the financial year 231,171,137 2,625,995 20,674,084 6,210,069
Exchange gains/(losses) on cash and cash equivalents 1,539,273 18,331 378,936 350
Cash and cash equivalents at end of the financial year 240,880,737 15,350,969 (914,091) 7,381,774

First State Global Umbrella Fund PLC
Statement of Cashflows (continued)
for the year ended 31 December 2017
See accompanying notes to the financial statements
292
Hong Kong
Growth Fund
Indian
Subcontinent
Fund
Global Bond
Fund
High Quality
Bond Fund
Long Term
Bond Fund
Greater China
Growth Fund
Singapore and
Malaysia
Growth Fund
Asia
Opportunities
Fund
US$ US$ US$ US$ US$ US$ US$ US$
61,437,991 152,331,141 1,081,143 3,390,985 3,135,256 224,015,872 9,985,498 8,033,742
(5,749) (306,927) (267,964) (2,295,649) (1,576,349) (10,594) (11,340) (6,605)
- - - 60,038 - 95,555 - -
(4,099,853) (4,220,397) - - - (11,680,118) (1,645,165) (794,666)
3,694 14 27,911 155 - 25,457 15 522
41,511 76,596 279 10,763 - 1,029,108 15,634 59,743
(1,106) (13,233) 17,318 - - - (79,369) (789)
(336,179) 3,094,501 (99,324) (572,561) (248,272) (934,500) - (6,798)
26,456 198,852 84,340 616,690 468,170 129,189 (1,293) 2,109
- - 1,252 64,872 34,162 - - -
(29,711,437) (227,628,624) (1,151,847) (2,636,543) (3,190,742) (157,190,445) (2,159,582) (7,528,602)
- - (39,444) (16,301) (15,742) - - -
27,355,328 (76,468,077) (346,336) (1,377,551) (1,393,517) 55,479,524 6,104,398 (241,344)
5,749 306,927 156,608 1,700,971 1,121,000 10,594 11,340 6,605
4,081,668 4,206,447 (279) (10,763) - 10,651,010 1,628,076 745,955
31,442,745 (71,954,703) (190,007) 312,657 (272,517) 66,141,128 7,743,814 511,216
- - - (60,038) - (95,555) - -
(3,694) (14) (27,911) (155) - (25,457) (15) (522)
16,078,717
203,879,672 842,339 4,689,873 206,652 94,168,085 4,363,280 8,540,276
(48,009,902) (106,064,508) (695,011) (5,765,518) (48,800) (162,670,301) (12,635,579) (9,406,794)
(31,934,879) 97,815,150 119,417 (1,135,838) 157,852 (68,623,228) (8,272,314) (867,040)
(492,134) 25,860,447 (70,590) (823,181) (114,665) (2,482,100) (528,500) (355,824)
534,882 36,824,197 227,104 1,004,814 590,567 5,886,704 1,984,393 1,066,691
1,106 13,233 (17,318) - - - 79,369 789
43,854 62,697,877 139,196 181,633 475,902 3,404,604 1,535,262 711,656

First State Global Umbrella Fund PLC
Statement of Cashflows (continued)
for the year ended 31 December 2017
See accompanying notes to the financial statements
293
Asian Equity Plus
Fund Asian Bond Fund
Asian Quality
Bond Fund
Global Emerging
Markets Leaders
Fund
US$ US$ US$ US$
Cash flows from operating activities
Increase/(Decrease) in net assets attributable to redeemable
participating shareholders 847,743,863 435,081 29,348,337 301,448,228
Adjustment for:
– Interest income (1,163,309) (851,542) (22,450,652) (712,483)
– Distributions to holders of redeemable shares 51,233,317 496,443 4,635,829 -
– Dividend income (58,590,044) - - (30,809,370)
– Interest expense 162,576 27,765 465 1,520
– Withholding tax on dividends 5,864,642 2,497 85,872 2,267,002
– Exchange (gains)/ losses on cash and cash equivalents (445,103) - 724 935
Net decrease/(increase) in due from/to brokers (2,791,427) (250,918) (7,005,006) (3,600,883)
Net (increase)/ decrease in other receivables and accrued expenses 650,302 187,175 5,822,212 498,041
Increase/(decrease) in margin accounts - 1,002 (120,756) -
(Increase)/ decrease in financial assets at fair value through profit or
loss (741,127,061) (12,987,042) 8,140,314 (253,764,437)
(Decrease)/increase in financial liabilities at fair value through profit
or loss - 3,265 5,593 -
Cash provided by/(used in) operations 101,537,756 (12,936,274) 18,462,932 15,328,553
Interest received 1,163,309 519,604 17,120,176 712,483
Dividend received 53,188,299 (2,497) (85,872) 30,531,761
Net cash provided by/(used in) operating activities 155,889,364 (12,419,167) 35,497,236 46,572,797
Cash flows from financing activities
Distributions paid to holders of redeemable shares (51,233,317) (496,443) (4,635,829) -
Interest paid (162,576) (27,765) (465) (1,520)
Proceeds from redeemable shares issued*
522,768,064 21,138,698 151,651,171 74,652,682
Redemption of redeemable shares* (641,656,575) (6,549,349) (183,359,515) (114,757,670)
Net cash (used in)/provided by financing activities (170,284,404) 14,065,141 (36,344,638) (40,106,508)
Net (decrease)/increase in cash and cash equivalents (14,395,040) 1,645,974 (847,402) 6,466,289
Cash and cash equivalents at beginning of the financial year 13,515,629 638,452 13,207,898 105,431,841
Exchange gains/(losses) on cash and cash equivalents 445,103 - (724) (935)
Cash and cash equivalents at end of the financial year (434,308) 2,284,426 12,359,772 111,897,195
* The Cash Flow Statement for Asian Equity Plus Fund excludes subscriptions of US$23,444,683,411 and redemptions of US$23,444,683,411 which occurred
during the year, but which do not settle in cash.
* The Cash Flow Statement for Asian Quality Bond Fund excludes subscriptions of US$533,757,843 and redemptions of US$533,757,843 which occurred
during the year, but which do not settle in cash.

First State Global Umbrella Fund PLC
Statement of Cashflows (continued)
for the year ended 31 December 2017
See accompanying notes to the financial statements
294
Global Resources
Fund
Global Property
Securities Fund
Asian Property
Securities
Fund
China Focus
Fund
Global Listed
Infrastructure
Fund
Asia Pacific Select
Fund
US$ US$ US$ US$ US$ US$
16,989,538 1,740,899 1,414,090 52,503,367 65,331,261 37,494,619
(13,974) (1,385) (347) (10,798) (10,804) (5,751)
- 1,992 326,691 - 5,645,827 -
(2,736,471) (602,145) (372,919) (7,245,332) (20,545,404) (2,381,526)
129 71 79 5,024 90,472 4,065
336,159 110,787 26,322 323,444 3,010,244 252,165
(6,574) 895 69 (1,675) (291,612) (2,245)
200,617 - - - 768,927 (263,813)
(53,355) (2,926) (8,174) (20,467) 193,094 30,238
- - - - - -
37,361,125 (3,421,399) 1,633,062 7,320,052 (232,236,977) (36,833,285)
- - - - - -
52,077,194 (2,173,211) 3,018,873 52,873,615 (178,044,972) (1,705,533)
13,974 1,385 347 10,798 10,804 5,751
2,342,422 509,688 348,319 6,906,814 16,871,748 2,135,121
54,433,590 (1,662,138) 3,367,539 59,791,227 (161,162,420) 435,339
- (1,992) (326,691) - (5,645,827) -
(129) (71) (79) (5,024) (90,472) (4,065)
82,073,863 3,191,358 709,626 45,873,473 445,028,604 20,399,669
(139,446,406) (1,411,532) (3,864,659) (105,142,357) (271,181,594) (22,358,049)
(57,372,672) 1,777,763 (3,481,803) (59,273,908) 168,110,711 (1,962,445)
(2,939,082) 115,625 (114,264) 517,319 6,948,291 (1,527,106)
4,192,227 298,231 257,621 3,434,006 684,244 1,553,437
6,574 (895) (69) 1,675 291,612 2,245
1,259,719 412,961 143,288 3,953,000 7,924,147 28,576
* The Cash Flow Statement for Global Property Securities Fund excludes subscriptions of US$39,213,113 and redemptions of
US$39,213,113 which occurred during the year, but which do not settle in cash.

First State Global Umbrella Fund PLC
Statement of Cashflows (continued)
for the year ended 31 December 2017
See accompanying notes to the financial statements
295
Global
Agribusiness
Fund**
Worldwide
Equity Fund
Emerging Markets
Bond Fund*
US$ US$ US$
Cash flows from operating activities
Increase in net assets attributable to redeemable participating
shareholders - 5,943,435 1,961,093
Adjustment for:
– Interest income - (19,103) (1,766,068)
– Distributions to holders of redeemable shares - - 7,709
– Dividend income - (452,334) -
– Interest expense - 2 75
– Withholding tax on dividends - 57,991 232
– Exchange gains/(losses) on cash and cash equivalents - (154,086) (545)
Net (increase)/ decrease in due from/to brokers - (181,653) -
Net (decrease)/increase in other receivables and accrued
expenses (7,938) 17,159 392,250
Increase in margin accounts - - -
(Increase)/decrease in financial assets at fair value through
profit or loss - (3,756,156) 26,251,489
(Decrease)/increase in financial liabilities at fair value through
profit or loss - - -
Cash (used in)/provided operations (7,938) 1,455,255 26,846,235
Interest received - 19,103 1,769,349
Dividend received - 375,679 (232)
Net cash (used in)/provided operating activities (7,938) 1,850,037 28,615,352
Cash flows from financing activities
Distributions paid to holders of redeemable shares - - (7,709)
Interest paid - (2) (75)
Proceeds from redeemable shares issued 21,406 931,829 25,696,391
Redemption of redeemable shares (24,430) (1,471,954) (55,669,676)
Net cash (used in)/provided by financing activities (3,024) (540,127) (29,981,069)
Net (decrease)/increase in cash and cash equivalents (10,962) 1,309,910 (1,365,717)
Cash and cash equivalents at beginning of the financial year 10,962 4,062,914 1,381,321
Exchange gains/(losses) on cash and cash equivalents - 154,086 545
Cash and cash equivalents at end of the financial year - 5,526,910 16,149
* The First State Emerging Market Bond Fund terminated on 23 November 2017.
** The First State Global Agribusiness Fund terminated on 8 November 2016.

First State Global Umbrella Fund PLC
Statement of Cashflows (continued)
for the year ended 31 December 2017
See accompanying notes to the financial statements
296
Global Credit
Income Fund
Asia Pacific All Cap
Fund Japan Equity Fund
Sustainable
Listed
Infrastructure Fund
US$ US$ US$ US$
1,229,475 22,221,920 25,498,608 18,894
(2,435,234) (866) (1,001) -
2,426,399 - - -
(7,851) (1,456,630) (772,291) (11,859)
12,764 4,696 3,090 -
- 168,561 117,381 5,935
(171,952) (294) 6,986 -
(467,719) 5,694 156,128 -
1,113,953 36,376 33,964 6,651
1,025,304 - - -
42,137,165 (20,800,050) (27,844,522) (3,872,159)
(370,074) - - -
44,492,230 179,407 (2,801,657) (3,852,538)
1,772,062 866 1,001 -
7,851 1,277,797 669,190 (6,163)
46,272,143 1,458,070 (2,131,466) (3,858,701)
(2,426,399) - - -
(3,219) (4,696) (3,090) -
(202,992) 2,046,528 30,303,245 4,029,656
(44,331,685) (4,041,246) (27,643,996) -
(46,964,295) (1,999,414) 2,656,159 4,029,656
(692,152) (541,344) 524,693 170,955
2,885,995 818,482 1,168,377 -
171,952 294 (6,986) -
2,365,795 277,432 1,686,084 170,955

First State Global Umbrella Fund PLC
Statement of Cashflows
for the year ended 31 December 2016
See accompanying notes to the financial statements
297
31-Dec-2016 Total
Asian Growth
Fund
China Growth
Fund
Worldwide
Leaders
Fund
US$ US$ US$ US$
Cash flows from operating activities
(Decrease)/increase in net assets attributable to redeemable
participating shareholders (38,682,670) (1,631,726) (158,898,672) 2,543,960
Adjustment for:
– Interest income (33,816,366) (26,076) (39,043) (6,488)
– Distributions to holders of redeemable shares 59,411,073 396,942 84,728 -
– Dividend income (237,936,762) (14,163,929) (87,645,616) (704,717)
– Interest expense 694,486 122 60,093 17
– Withholding tax on dividends 18,119,832 975,999 4,920,704 98,276
– Exchange losses/(gains) on cash and cash equivalents 1,186,012 3,791 147,158 410
Net decrease/(increase) in due from/to brokers 31,096,834 (89,566) 11,165,309 -
Net (decrease)/increase in other receivables and accrued
expenses (2,330,452) (57,025) (1,612,584) 30,114
Increase in margin accounts 234,422 - - -
Decrease/(increase) in financial assets at fair value through
profit or loss 592,021,303 9,070,634 752,588,918 (2,045,762)
(Decrease)/increase in financial liabilities at fair value through
profit or loss (751,688) - - -
Cash provided by/(used in) operations 389,246,024 (5,520,834) 520,770,995 (84,190)
Interest received 33,805,265 26,076 39,043 6,488
Dividend received 217,600,525 13,166,090 82,686,656 619,727
Net cash provided by/(used in) operating activities 640,651,814 7,671,332 603,496,694 542,025
Cash flows from financing activities
Distributions paid to holders of redeemable shares (59,411,073) (396,942) (84,728) -
Interest paid (709,126) (122) (60,093) (17)
Proceeds from redeemable shares issued 6,181,203,256 160,561,425 455,363,692 5,439,685
Redemption of redeemable shares (6,776,828,061) (190,384,349) (1,028,537,121) (5,874,080)
Net cash (used in)/provided by financing activities (655,745,004) (30,219,988) (573,318,250) (434,412)
Net (decrease)/increase in cash and cash equivalents (15,093,190) (22,548,656) 30,178,444 107,613
Cash and cash equivalents at beginning of the financial year 247,450,339 25,178,442 (9,357,202) 6,102,866
Exchange (losses)/gains on cash and cash equivalents (1,186,012) (3,791) (147,158) (410)
Cash and cash equivalents at end of the financial year 231,171,137 2,625,995 20,674,084 6,210,069

First State Global Umbrella Fund PLC
Statement of Cashflows (continued)
for the year ended 31 December 2016
See accompanying notes to the financial statements
298
Hong Kong
Growth Fund
Indian
Subcontinent
Fund
Global Bond
Fund
High Quality
Bond Fund
Long Term
Bond Fund
Greater China
Growth Fund
Singapore and
Malaysia
Growth Fund
Asia
Opportunities
Fund*
US$ US$ US$ US$ US$ US$ US$ US$
6,570,325 1,070,533 (136,053) 1,098,538 (513,081) 7,204,026 1,518,785 174,362
(1,769) (22,843) (206,085) (2,309,594) (1,709,222) (10,434) (3,016) (1,229)
- - - 49,481 - 69,749 - -
(4,087,654) (3,070,252) - - - (13,444,652) (1,863,717) (809,324)
1,030 446 20,305 1,177 30,542 10,277 2 194
61,740 26,972 286 (167) - 1,234,331 15,881 49,335
40 (13,320) (5,065) - - - (61,687) 287
(92,618) 26,125 99,343 572,561 248,272 3,545,147 - 6,798
22,574 155,894 13,791 107,628 16,347
(130,865) (2,273) 3,704
- - 37,193 83,497 149,826 - - -
18,033,911 (60,457,766) (64,808) (341,774) 10,290,347 111,177,552 1,605,148 (876,153)
- - 40,968 2,076 (2,283) - - -
20,507,579 (62,284,211) (200,125) (736,577) 8,510,748 109,655,131 1,209,123 (1,452,026)
1,769 22,843 206,085 2,318,269 1,709,222 10,434 3,016 1,229
4,052,748 2,921,607 (286) 167 - 12,210,321 1,887,863 754,796
24,562,096 (59,339,761) 5,674 1,581,859 10,219,970 121,875,886 3,100,002 (696,001)
- - - (49,481) - (69,749) - -
(1,030) (446) (20,305) (1,177) (30,542) (10,277) (2) (194)
9,341,668 139,638,116 989,182 4,146,378 234,528 108,030,960 4,612,490 8,476,506
(34,895,984) (61,334,294) (898,003) (5,794,335) (10,464,823) (226,232,889) (8,304,461) (8,001,721)
(25,555,346) 78,303,376 70,874 (1,698,615) (10,260,837) (118,281,955) (3,691,973) 474,591
(993,250) 18,963,615 76,548 (116,756) (40,867) 3,593,931 (591,971) (221,410)
1,528,172 17,847,262 145,491 1,121,570 631,434 2,292,773 2,514,677 1,288,388
(40) 13,320 5,065 - - - 61,687 (287)
534,882 36,824,197 227,104 1,004,814 590,567 5,886,704 1,984,393 1,066,691
* Formerly known as First State Asia Innovation Fund.

First State Global Umbrella Fund PLC
Statement of Cashflows (continued)
for the year ended 31 December 2016
See accompanying notes to the financial statements
299
Asian Equity
Plus Fund Asian Bond Fund
Asian Quality
Bond Fund
Hong Kong
Dollar Bond
Fund*
US$ US$ US$ US$
Cash flows from operating activities
(Decrease)/increase in net assets attributable to redeemable
participating shareholders (4,888,195) (65,832) 9,809,164 -
Adjustment for:
– Interest income (1,061,908) (718,265) (22,640,593) -
– Distributions to holders of redeemable shares 49,387,809 503,646 3,576,719 -
– Dividend income (63,584,610) - - -
– Interest expense 16,649 13 458,142 -
– Withholding tax on dividends 5,576,589 3,285 106,650 -
– Exchange losses/(gains) on cash and cash equivalents 805,817 (378) 9,169 -
Net decrease /(increase) in due from/to brokers 5,089,560 250,918 7,051,735 -
Net (decrease)/increase in other receivables and accrued expenses (296,488) (21,783) (1,407,542) -
Increase in margin accounts - (3,268) (194,699) -
(Decrease)/increase in financial assets at fair value through profit
or loss 175,585,465 (4,571,979) (181,834,264) -
(Decrease)/increase) in financial liabilities at fair value through
profit or loss - 1,805 76,100 -
Cash provided by/(used in) operations 166,630,688 (4,621,838) (184,989,419) -
Interest received 1,061,908 713,140 22,646,656 -
Dividend received 58,016,044 (3,285) (106,650) -
Net cash provided by/(used in) operating activities 225,708,640 (3,911,983) (162,449,413) -
Cash flows from financing activities
Distributions paid to holders of redeemable shares (49,387,809) (503,646) (3,576,719) -
Interest paid (16,649) (13) (458,142) -
Proceeds from redeemable shares issued 1,983,740,094 11,332,537 2,541,951,106 -
Redemption of redeemable shares (2,184,670,085) (7,303,541) (2,404,583,896) (21)
Net cash (used in)/provided by financing activities (250,334,449) 3,525,337 133,332,349 (21)
Net (decrease)/increase in cash and cash equivalents (24,625,809) (386,646) (29,117,064) (21)
Cash and cash equivalents at beginning of the financial year 38,947,255 1,024,720 42,334,131 21
Exchange (losses)gains on cash and cash equivalents (805,817) 378 (9,169) -
Cash and cash equivalents at end of the financial year 13,515,629 638,452 13,207,898 -
*The First State Hong Kong Dollar Bond Fund terminated on 16 March 2015.

First State Global Umbrella Fund PLC
Statement of Cashflows (continued)
for the year ended 31 December 2016
See accompanying notes to the financial statements
300
Global Emerging
Markets Leaders
Fund
Global Resources
Fund
Global
Property
Securities
Fund
Asian Property
Securities Fund China Focus Fund
Global Listed
Infrastructure
Fund
US$ US$ US$ US$ US$ US$
66,142,168 23,539,564 (152,523) (49,067) (13,802,307) 12,977,539
(104,594) (1,336) (393) (138) (867) (1,450)
- - 16,918 334,982 - 1,377,244
(28,350,955) (1,626,261) (586,426) (421,605) (6,618,230) (6,290,942)
26 9,084 5 - 9,681 17,484
2,549,405 260,719 135,656 36,329 377,948 1,137,314
(32,095) 12,082 8,344 1,763 665 136,536
1,594,041 (175,664) (262,707) - 1,331,325 (50,158)
387,352 109,573 18,423 3,877 (81,815) 363,874
- - - - - -
(47,611,247) (77,706,356) (2,831,857) 1,429,770 65,175,563 (171,091,895)
- - - - - -
(5,425,899) (55,578,595) (3,654,560) 1,335,911 46,391,963 (161,424,454)
104,594 1,336 393 138 867 1,450
24,531,965 1,329,229 408,585 376,172 6,240,282 4,417,152
19,210,660 (54,248,030) (3,245,582) 1,712,221 52,633,112 (157,005,852)
- - (16,918) (334,982) - (1,377,244)
(26) (9,084) (5) - (9,681) (17,484)
92,388,756 85,443,085 68,530,151 615,647 67,629,587 244,704,615
(103,086,620) (28,684,253) (65,763,428) (1,793,866) (117,360,601) (86,867,917)
(10,697,890) 56,749,748 2,749,800 (1,513,201) (49,740,695) 156,441,970
8,512,770 2,501,718 (495,782) 199,020 2,892,417 (563,882)
96,886,976 1,702,591 802,357 60,364 542,254 1,384,662
32,095 (12,082) (8,344) (1,763) (665) (136,536)
105,431,841 4,192,227 298,231 257,621 3,434,006 684,244

First State Global Umbrella Fund PLC
Statement of Cashflows (continued)
for the year ended 31 December 2016
See accompanying notes to the financial statements
301
Asia Pacific Select
Fund
Global
Agribusiness
Fund**
Australian
Growth Fund*
Worldwide
Equity Fund
US$ US$ US$ US$
Cash flows from operating activities
(Decrease)/increase in net assets attributable to redeemable
participating shareholders 2,218,242 830,533 - 2,197,076
Adjustment for:
– Interest income (2,677) (747) - (6,102)
– Distributions to holders of redeemable shares - - - -
– Dividend income (2,139,223) (376,223) - (376,301)
– Interest expense 116 40 - 41
– Withholding tax on dividends 190,071 82,638 - 59,435
– Exchange losses/(gains) on cash and cash equivalents (1,940) 573 (3,240) 87,734
Net decrease /(increase) in due from/to brokers 15,685 - - 231,817
Net (decrease)/increase in other receivables and accrued
expenses (1,323) (22,666) (20,880) 3,324
Increase in margin accounts - - - -
Decrease/(increase) in financial assets at fair value through
profit or loss 4,561,492 15,892,812 - (143,911)
(Decrease)/increase) in financial liabilities at fair value through
profit or loss - - - -
Cash provided by/(used in) operations 4,840,443 16,406,960 (24,120) 2,053,113
Interest received 2,677 747 - 6,102
Dividend received 1,956,191 320,487 - 328,468
Net cash provided by/(used in) operating activities 6,799,311 16,728,194 (24,120) 2,387,683
Cash flows from financing activities
Distributions paid to holders of redeemable shares - - - -
Interest paid (116) (40) - (41)
Proceeds from redeemable shares issued 222,128 1,692,793 3,646 1,377,554
Redemption of redeemable shares (6,506,696) (20,143,562) (11,523) (2,329,763)
Net cash (used in)/provided by financing activities (6,284,684) (18,450,809) (7,877) (952,250)
Net (decrease)/increase in cash and cash equivalents 514,627 (1,722,615) (31,997) 1,435,433
Cash and cash equivalents at beginning of the financial year 1,036,870 1,734,150 28,757 2,715,215
Exchange gains/(losses) on cash and cash equivalents 1,940 (573) 3,240 (87,734)
Cash and cash equivalents at end of the financial year 1,553,437 10,962 - 4,062,914
*The First State Australian Growth Fund terminated on 30 October 2015.
** The First State Global Agribusiness Fund terminated on 8 November 2016.

First State Global Umbrella Fund PLC
Statement of Cashflows (continued)
for the year ended 31 December 2016
See accompanying notes to the financial statements
302
Emerging Markets
Bond Fund
Global Credit
Income Fund
Asia Pacific All Cap
Fund Japan Equity Fund
US$ US$ US$ US$
1,592,447 2,476,670 1,599,108 (2,108,254)
(1,644,651) (3,296,515) (331) -
650,334 2,962,521 - -
- - (1,382,710) (393,415)
43 54,507 995 3,455
- - 161,423 59,013
11 99,748 1,944 (12,335)
- 510,570 24,624 3,717
(46,666) 80,034 14,569 40,380
- 161,873 - -
(2,059,849) 19,622,668 (3,924,859) (37,450,497)
- (870,354) - -
(1,508,331) 21,801,722 (3,505,237) (39,857,936)
1,648,558 3,271,894 331 -
- - 1,218,488 267,708
140,227 25,073,616 (2,286,418) (39,590,228)
(650,334) (2,962,521) - -
(43) (69,147) (995) (3,455)
26,322,872 115,692,712 2,599,014 40,122,329
(26,083,425) (139,960,499) (393,320) (562,985)
(410,930) (27,299,455) 2,204,699 39,555,889
(270,703) (2,225,839) (81,719) (34,339)
1,652,035 5,211,582 902,145 1,190,381
(11) (99,748) (1,944) 12,335
1,381,321 2,885,995 818,482 1,168,377

First State Global Umbrella Fund PLC
Distribution Statement (Unaudited)
for the year ended 31 December 2017
See accompanying notes to the financial statements
303
31-Dec-2017
Total US$
Asian Growth
Fund US$
China Growth
Fund US$
High Quality
Bond Fund
US$
Greater China
Growth Fund
US$
Undistributed (loss)/income brought forward (109,180,098) 38,704,519 12,822,021 36,600,398 48,607,473
Net investment income for the period before
investment and exchange gains/losses
33,407,975 3,982,108 (15,984,938) 1,968,199 1,804,001
January 2017
Distribution payable at HKD0.3339 per share (193,124) - - - -
Distribution payable at US$0.0335 per share (357,276) - - - -
Distribution payable at HKD0.4274 per share (16) - - - -
Distribution payable at US$0.0427 per share (56) - - - -
February 2017
Distribution payable at US$0.1231 per share (768,976) - - - -
Distribution payable at US$0.3673 per share (20,221,741) - - - -
Distribution payable at GBP£0.1278 per share (74,542) - - - -
Distribution payable at GBP£0.0644 per share (28) - - - -
Distribution payable at US$0.1385 per share (45,700) (45,700) - - -
Distribution payable at US$0.0628 per share (361,720) (361,720) - - -
Distribution payable at US$0.0633 per share (726,322) - - - -
Distribution payable at US$0.0145 per share (363) - - - (363)
Distribution payable at US$0.0437 per share (25,737) - - - (25,737)
Distribution payable at US$0.1318 per share (36,613) - - (36,613) -
Distribution payable at US$0.0881 per share (164,463) - - - -
Distribution payable at US$0.1354 per share (1,075,053) - - - -
Distribution payable at US$0.1501 per share (213,323) - - - -
Distribution payable at GBP£0.1720 per share (143,260) - - - -
Distribution payable at US$0.1077 per share (895) - - - -
Distribution payable at US$0.1139 per share (17) - - - -
Distribution payable at US$0.0568 per share (127,101) - - - -
Distribution payable at HKD0.3353 per share (175,565) - - - -
Distribution payable at US$0.0336 per share (325,748) - - - -
Distribution payable at HKD0.4313 per share (16) - - - -
Distribution payable at US$0.0431 per share (57) - - - -
Distribution payable at US$0.3019 per share (7,154) - - - -
March 2017
Distribution payable at HKD0.3388 per share (166,257) - - - -
Distribution payable at US$0.0339 per share (305,127) - - - -
Distribution payable at HKD0.4371 per share (16) - - - -
Distribution payable at US$0.0436 per share (58) - - - -
April 2017
Distribution payable at HKD0.3394 per share (150,682) - - - -
Distribution payable at US$0.0339 per share (269,944) - - - -
Distribution payable at HKD0.4379 per share (17) - - - -
Distribution payable at US$0.0436 per share (58) - - - -
May 2017
Distribution payable at HKD0.3400 per share (143,344) - - - -
Distribution payable at US$0.0340 per share (247,781) - - - -
Distribution payable at US$0.0561 per share (125,364) - - - -
Distribution payable at GBP£0.064 per share (28) - - - -
Distribution payable at US$0.0839 per share (713,150) - - - -
Distribution payable at US$0.0440 per share (45) - - - -
June 2017
Distribution payable at HKD0.3422 per share (140,954) - - - -
Distribution payable at US$0.0341 per share (233,360) - - - -
Distribution payable at US$0.0442 per share (43) - - - -

First State Global Umbrella Fund PLC
Distribution Statement (Unaudited) (continued)
for the year ended 31 December 2017
See accompanying notes to the financial statements
304
31-Dec-2017
Total US$
Asian Growth
Fund US$
China Growth
Fund US$
High Quality
Bond Fund
US$
Greater China
Growth Fund
US$
July 2017 Distribution payable at HKD0.3430 per share (131,378) - - - -
Distribution payable at US$0.0342 per share (221,865) - - - -
Distribution payable at US$0.0438 per share (42) - - - -
August 2017
Distribution payable at US$0.5666 per share (29,033,733) - - - -
Distribution payable at US$0.1515 per share (1,026,692) - - - -
Distribution payable at GBP£0.1848 per share (107,633) - - - -
Distribution payable at US$0.0734 per share (23,644) (23,644) - - -
Distribution payable at US$0.0569 per share (376,387) (376,387) - - -
Distribution payable at US$0.2367 per share (43,344) - (43,344) - -
Distribution payable at US$0.3575 per share (7,005) - - - (7,005)
Distribution payable at US$0.1063 per share (62,450) - - - (62,450)
Distribution payable at US$0.0605 per share (125,879) - - - -
Distribution payable at US$0.1088 per share (23,425) - - (23,425) -
Distribution payable at US$0.1623 per share (25) - - - -
Distribution payable at US$0.0999 per share (162,228) - - - -
Distribution payable at US$0.3010 per share (2,505,861) - - - -
Distribution payable at US$0.2353 per share (1,442,471) - - - -
Distribution payable at GBP£0.2779 per share (265,859) - - - -
Distribution payable at US$0.1320 per share (1,097) - - - -
Distribution payable at GBP£0.0544 per share (24) - - - -
Distribution payable at US$0.0443 per share (334,465) - - - -
Distribution payable at HKD0.3430 per share (125,042) - - - -
Distribution payable at US$0.0341 per share (211,297) - - - -
Distribution payable at US$0.0440 per share (43) - - - -
September 2017
Distribution payable at HKD0.3460 per share (119,646) - - - -
Distribution payable at US$0.0344 per share (196,852) - - - -
Distribution payable at US$0.0447 per share (44) - - - -
October 2017 Distribution payable at HKD0.3431 per share (123,882) - - - -
Distribution payable at US$0.0341 per share (196,301) - - - -
Distribution payable at US$0.0449 per share (44) - - - -
November 2017 Distribution payable at US$0.0327 per share (118,099) - - - -
Distribution payable at US$0.0924 per share (652,345) - - - -
Distribution payable at GBP£0.0825 per share (37) - - - -
Distribution payable at HKD0.3432 per share (119,247) - - - -
Distribution payable at US$0.0342 per share (194,287) - - - -
December 2017 Distribution payable at HKD0.3421 per share (101,570) - - - - Distribution payable at US$0.0340 per share (185,258) - - - -

First State Global Umbrella Fund PLC
Distribution Statement (Unaudited) (continued)
for the year ended 31 December 2017
See accompanying notes to the financial statements
305
31-Dec-2017
Total US$
Asian Growth
Fund US$
China Growth
Fund US$
High Quality
Bond Fund
US$
Greater China
Growth Fund
US$
Total distributions paid (65,780,595) (807,451) (43,344) (60,038) (95,555)
Add: Equalisation income received on issue
of shares 204,952,302 391,358 326,401 20,118 294,654
Deduct: Equalisation income paid on
redemption of shares (207,237,348) (1,339,492) (1,011,043) (26,683) (392,027)
Net distribution for the financial year (68,065,641) (1,755,585) (727,986) (66,603) (192,928)
Net investment (expense)/income for the
financial year after distribution
(34,657,666) 2,226,523 (16,712,924) 1,901,596 1,611,073
Undistributed (loss)/income carried forward (143,837,764) 40,931,042 (3,890,903) 38,501,994 50,218,546
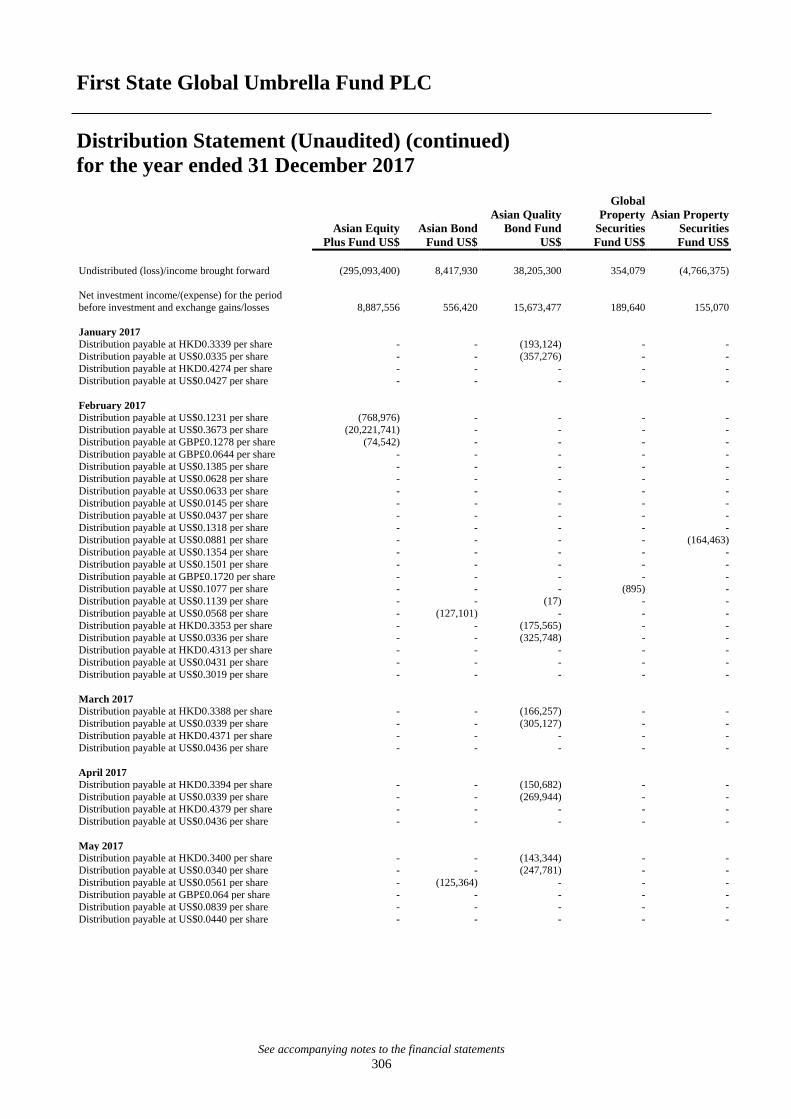
First State Global Umbrella Fund PLC
Distribution Statement (Unaudited) (continued)
for the year ended 31 December 2017
See accompanying notes to the financial statements
306
Asian Equity
Plus Fund US$
Asian Bond
Fund US$
Asian Quality
Bond Fund
US$
Global
Property
Securities
Fund US$
Asian Property
Securities
Fund US$
Undistributed (loss)/income brought forward (295,093,400) 8,417,930 38,205,300 354,079 (4,766,375)
Net investment income/(expense) for the period
before investment and exchange gains/losses
8,887,556 556,420 15,673,477 189,640 155,070
January 2017
Distribution payable at HKD0.3339 per share - - (193,124) - -
Distribution payable at US$0.0335 per share - - (357,276) - -
Distribution payable at HKD0.4274 per share - - - - -
Distribution payable at US$0.0427 per share - - - - -
February 2017
Distribution payable at US$0.1231 per share (768,976) - - - -
Distribution payable at US$0.3673 per share (20,221,741) - - - -
Distribution payable at GBP£0.1278 per share (74,542) - - - -
Distribution payable at GBP£0.0644 per share - - - - -
Distribution payable at US$0.1385 per share - - - - -
Distribution payable at US$0.0628 per share - - - - -
Distribution payable at US$0.0633 per share - - - - -
Distribution payable at US$0.0145 per share - - - - -
Distribution payable at US$0.0437 per share - - - - -
Distribution payable at US$0.1318 per share - - - - -
Distribution payable at US$0.0881 per share - - - - (164,463)
Distribution payable at US$0.1354 per share - - - - -
Distribution payable at US$0.1501 per share - - - - -
Distribution payable at GBP£0.1720 per share - - - - -
Distribution payable at US$0.1077 per share - - - (895) -
Distribution payable at US$0.1139 per share - - (17) - -
Distribution payable at US$0.0568 per share - (127,101) - - -
Distribution payable at HKD0.3353 per share - - (175,565) - -
Distribution payable at US$0.0336 per share - - (325,748) - -
Distribution payable at HKD0.4313 per share - - - - -
Distribution payable at US$0.0431 per share - - - - -
Distribution payable at US$0.3019 per share - - - - -
March 2017
Distribution payable at HKD0.3388 per share - - (166,257) - -
Distribution payable at US$0.0339 per share - - (305,127) - -
Distribution payable at HKD0.4371 per share - - - - -
Distribution payable at US$0.0436 per share - - - - -
April 2017
Distribution payable at HKD0.3394 per share - - (150,682) - -
Distribution payable at US$0.0339 per share - - (269,944) - -
Distribution payable at HKD0.4379 per share - - - - -
Distribution payable at US$0.0436 per share - - - - -
May 2017
Distribution payable at HKD0.3400 per share - - (143,344) - -
Distribution payable at US$0.0340 per share - - (247,781) - -
Distribution payable at US$0.0561 per share - (125,364) - - -
Distribution payable at GBP£0.064 per share - - - - -
Distribution payable at US$0.0839 per share - - - - -
Distribution payable at US$0.0440 per share - - - - -

First State Global Umbrella Fund PLC
Distribution Statement (Unaudited) (continued)
for the year ended 31 December 2017
See accompanying notes to the financial statements
307
Asian Equity
Plus Fund US$
Asian Bond
Fund US$
Asian Quality
Bond Fund US$
Global
Property
Securities
Fund US$
Asian Property
Securities
Fund US$
June 2017 Distribution payable at HKD0.3422 per share - - (140,954) - -
Distribution payable at US$0.0341 per share - - (233,360) - -
Distribution payable at US$0.0442 per share - - - - -
July 2017
Distribution payable at HKD0.3430 per share - - (131,378) - -
Distribution payable at US$0.0342 per share - - (221,865) - -
Distribution payable at US$0.0438 per share - - - - -
August 2017
Distribution payable at US$0.5666 per share (29,033,733) - - - -
Distribution payable at US$0.1515 per share (1,026,692) - - - -
Distribution payable at GBP£0.1848 per share (107,633) - - - -
Distribution payable at US$0.0734 per share - - - - -
Distribution payable at US$0.0569 per share - - - - -
Distribution payable at US$0.2367 per share - - - - -
Distribution payable at US$0.3575 per share - - - - -
Distribution payable at US$0.1063 per share - - - - -
Distribution payable at US$0.0605 per share - (125,879) - - -
Distribution payable at US$0.1088 per share - - - - -
Distribution payable at US$0.1623 per share - - (25) - -
Distribution payable at US$0.0999 per share - - - - (162,228)
Distribution payable at US$0.3010 per share - - - - -
Distribution payable at US$0.2353 per share - - - - -
Distribution payable at GBP£0.2779 per share - - - - -
Distribution payable at US$0.1320 per share - - - (1,097) -
Distribution payable at GBP£0.0544 per share - - - - -
Distribution payable at US$0.0443 per share - - - - -
Distribution payable at HKD0.3430 per share - - (125,042) - -
Distribution payable at US$0.0341 per share - - (211,297) - -
Distribution payable at US$0.0440 per share - - - - -
September 2017
Distribution payable at HKD0.3460 per share - - (119,646) - -
Distribution payable at US$0.0344 per share - - (196,852) - -
Distribution payable at US$0.0447 per share - - - - -
October 2017
Distribution payable at HKD0.3431 per share - - (123,882) - -
Distribution payable at US$0.0341 per share - - (196,301) - -
Distribution payable at US$0.0449 per share - - - - -
November 2017
Distribution payable at US$0.0327 per share - (118,099) - - -
Distribution payable at US$0.0924 per share - - - - -
Distribution payable at GBP£0.0825 per share - - - - -
Distribution payable at HKD0.3432 per share - - (119,247) - -
Distribution payable at US$0.0342 per share - - (194,287) - -
December 2017
Distribution payable at HKD0.3421 per share - - (101,570) - -
Distribution payable at US$0.0340 per share - - (185,258) - -

First State Global Umbrella Fund PLC
Distribution Statement (Unaudited) (continued)
for the year ended 31 December 2017
See accompanying notes to the financial statements
308
Asian Equity
Plus Fund US$
Asian Bond
Fund US$
Asian Quality
Bond Fund US$
Global
Property
Securities
Fund US$
Asian Property
Securities
Fund US$
Total distributions paid (51,233,317) (496,443) (4,635,829) (1,992) (326,691)
Add: Equalisation income received on issue
of shares 186,992,239 151,157 10,828,275 985,842 6,727
Deduct: Equalisation income paid on
redemption of shares (186,869,637) (37,734) (9,831,141) (962,637) (33,741)
Net distribution for the financial year (51,110,715) (383,020) (3,638,695) 21,213 (353,705)
Net investment (expense)/income for the
financial year after distribution
(42,223,159) 173,400 12,034,782 210,853 (198,635)
Undistributed (loss)/income carried forward (337,316,559) 8,591,330 50,240,082 564,932 (4,965,010)

First State Global Umbrella Fund PLC
Distribution Statement (Unaudited) (continued)
for the year ended 31 December 2017
See accompanying notes to the financial statements
309
Global Listed
Infrastructure
Fund US$
Australian
Growth Fund
US$
Worldwide
Equity Fund
US$
Emerging
Markets Bond
Fund* US$
Global Credit
Income Fund
US$
Undistributed income brought forward 4,762,473 69,163 355,215 1,030,119 750,987
Net investment income/(expense) for the period
before investment and exchange gains/losses
12,046,697 - 82,135 1,616,960 2,430,650
January 2017
Distribution payable at HKD0.3339 per share - - - - -
Distribution payable at US$0.0335 per share - - - -
Distribution payable at HKD0.4274 per share - - - (16) -
Distribution payable at US$0.0427 per share - - - (56) -
February 2017
Distribution payable at US$0.1231 per share - - - - -
Distribution payable at US$0.3673 per share - - - - -
Distribution payable at GBP£0.1278 per share - - - - -
Distribution payable at GBP£0.0644 per share - - - - (28)
Distribution payable at US$0.1385 per share - - - - -
Distribution payable at US$0.0628 per share - - - - -
Distribution payable at US$0.0633 per share - - - - (726,322)
Distribution payable at US$0.0145 per share - - - - -
Distribution payable at US$0.0437 per share - - - - -
Distribution payable at US$0.1318 per share - - - - -
Distribution payable at US$0.0881 per share - - - - -
Distribution payable at US$0.1354 per share (1,075,053) - - - -
Distribution payable at US$0.1501 per share (213,323) - - - -
Distribution payable at GBP£0.1720 per share (143,260) - - - -
Distribution payable at US$0.1077 per share - - - - -
Distribution payable at US$0.1139 per share - - - - -
Distribution payable at US$0.0568 per share - - - - -
Distribution payable at HKD0.3353 per share - - - - -
Distribution payable at US$0.0336 per share - - - - -
Distribution payable at HKD0.4313 per share - - - (16) -
Distribution payable at US$0.0431 per share - - - (57) -
Distribution payable at US$0.3019 per share - - - (7,154) -
March 2017
Distribution payable at HKD0.3388 per share - - - - -
Distribution payable at US$0.0339 per share - - - - -
Distribution payable at HKD0.4371 per share - - - (16) -
Distribution payable at US$0.0436 per share - - - (58) -
April 2017
Distribution payable at HKD0.3394 per share - - - - -
Distribution payable at US$0.0339 per share - - - - -
Distribution payable at HKD0.4379 per share - - - (17) -
Distribution payable at US$0.0436 per share - - - (58) -
May 2017
Distribution payable at US$0.0340 per share - - - - -
Distribution payable at US$0.0561 per share - - - - -
Distribution payable at GBP£0.064 per share - - - - (28)
Distribution payable at US$0.0839 per share - - - - (713,150)
Distribution payable at US$0.0440 per share - - - (45) -
June 2017 Distribution payable at HKD0.3422 per share - - - - -
Distribution payable at US$0.0341 per share - - - - -
Distribution payable at US$0.0442 per share - - - (43) -
* The First State Emerging Market Bond Fund terminated on 23 November 2017.

First State Global Umbrella Fund PLC
Distribution Statement (Unaudited) (continued)
for the year ended 31 December 2017
See accompanying notes to the financial statements
310
Global Listed
Infrastructure
Fund US$
Australian
Growth Fund
US$
Worldwide
Equity Fund
US$
Emerging
Markets Bond
Fund* US$
Global Credit
Income Fund
US$
July 2017 Distribution payable at HKD0.3430 per share - - - - -
Distribution payable at US$0.0342 per share - - - - -
Distribution payable at US$0.0438 per share - - - (42) -
August 2017 Distribution payable at US$0.5666 per share - - - - - Distribution payable at US$0.1515 per share - - - - -
Distribution payable at GBP£0.1848 per share - - - - -
Distribution payable at US$0.0734 per share - - - - -
Distribution payable at US$0.0569 per share - - - - -
Distribution payable at US$0.2367 per share - - - - - Distribution payable at US$0.3575 per share - - - - - Distribution payable at US$0.1063 per share - - - - -
Distribution payable at US$0.0605 per share - - - - -
Distribution payable at US$0.1088 per share - - - - -
Distribution payable at US$0.1623 per share - - - - -
Distribution payable at US$0.0999 per share - - - - -
Distribution payable at US$0.3010 per share (2,505,861) - - - -
Distribution payable at US$0.2353 per share (1,442,471) - - - -
Distribution payable at GBP£0.2779 per share (265,859) - - - -
Distribution payable at US$0.1320 per share - - - - -
Distribution payable at GBP£0.0544 per share - - - - (24)
Distribution payable at US$0.0443 per share - - - - (334,465)
Distribution payable at HKD0.3430 per share - - - - -
Distribution payable at US$0.0341 per share - - - - -
Distribution payable at US$0.0440 per share - - - (43) -
September 2017
Distribution payable at HKD0.3460 per share - - - - -
Distribution payable at US$0.0344 per share - - - - -
Distribution payable at US$0.0447 per share - - - (44) -
October 2017
Distribution payable at HKD0.3431 per share - - - - - Distribution payable at US$0.0341 per share - - - - - Distribution payable at US$0.0449 per share - - - (44) -
November 2017
Distribution payable at US$0.0327 per share - - - -
Distribution payable at US$0.0924 per share - - - - (652,345)
Distribution payable at GBP£0.0825 per share - - - - (37)
Distribution payable at HKD0.3432 per share - - - - -
Distribution payable at US$0.0342 per share - - - - -
December 2017
Distribution payable at HKD0.3421 per share - - - - -
Distribution payable at US$0.0340 per share - - - - -
* The First State Emerging Market Bond Fund terminated on 23 November 2017.
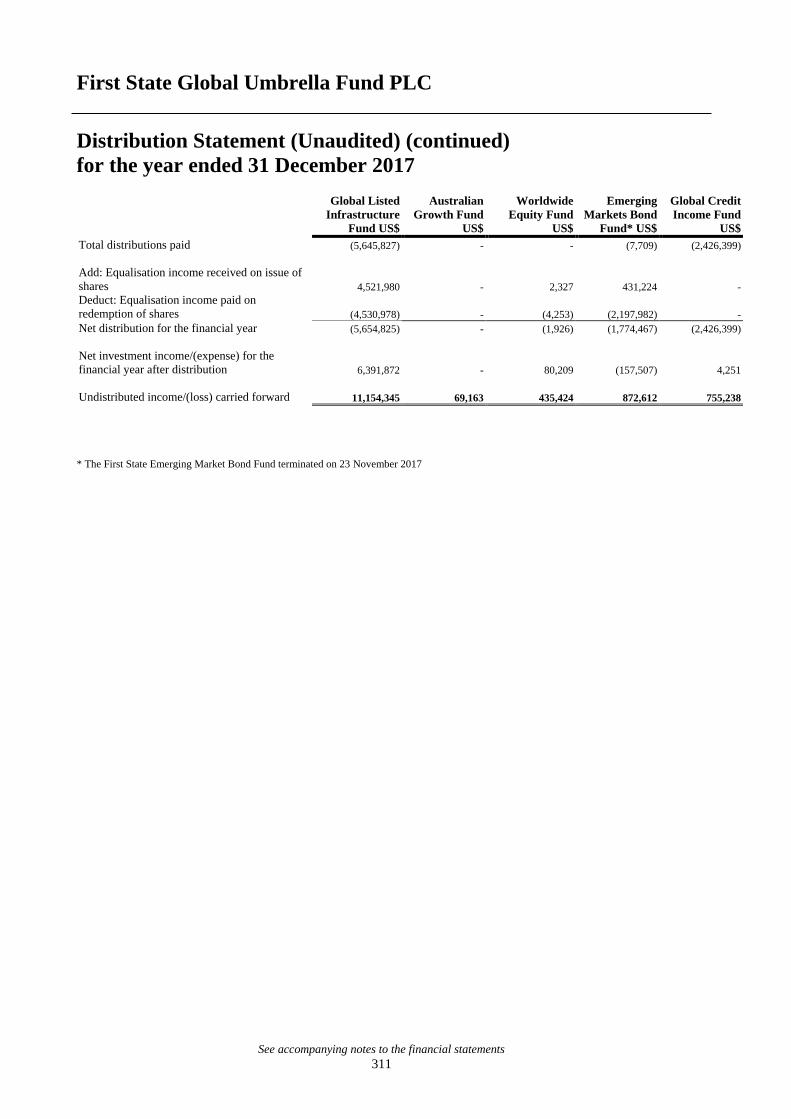
First State Global Umbrella Fund PLC
Distribution Statement (Unaudited) (continued)
for the year ended 31 December 2017
See accompanying notes to the financial statements
311
Global Listed
Infrastructure
Fund US$
Australian
Growth Fund
US$
Worldwide
Equity Fund
US$
Emerging
Markets Bond
Fund* US$
Global Credit
Income Fund
US$
Total distributions paid (5,645,827) - - (7,709) (2,426,399)
Add: Equalisation income received on issue of
shares 4,521,980 - 2,327 431,224 - Deduct: Equalisation income paid on
redemption of shares (4,530,978) - (4,253) (2,197,982) - Net distribution for the financial year (5,654,825) - (1,926) (1,774,467) (2,426,399)
Net investment income/(expense) for the
financial year after distribution
6,391,872 - 80,209 (157,507) 4,251
Undistributed income/(loss) carried forward 11,154,345 69,163 435,424 872,612 755,238
* The First State Emerging Market Bond Fund terminated on 23 November 2017

First State Global Umbrella Fund PLC
Distribution Statement (Unaudited)
for the year ended 31 December 2016
See accompanying notes to the financial statements
312
31-Dec-2016
Total US$
Asian Growth
Fund US$
China Growth
Fund US$
High Quality
Bond Fund
US$
Greater China
Growth Fund
US$
Undistributed (loss)/income brought forward (107,217,663) 33,741,297 7,495,831 34,670,652 45,509,790
Net investment income/(expense) for the period
before investment and exchange gains/losses
61,163,715 6,005,616 7,046,355 1,981,063 3,741,813
January 2016
Distribution payable at HKD0.3361 per share (36,575) - - - -
Distribution payable at US$0.0337 per share (40,730) - - - -
Distribution payable at HKD0.3718 per share (13) - - - -
Distribution payable at US$0.0372 per share (47) - - - -
February 2016
Distribution payable at US$0.3095 per share (18,633,836) - - - -
Distribution payable at US$0.0867 per share (356,176) - - - -
Distribution payable at GBP£0.0820 per share (78,052) - - - -
Distribution payable at US$0.0651 per share (49,160) (49,160) - - -
Distribution payable at US$0.0636 per share (114,595) - - - -
Distribution payable at US$0.1145 per share (25,043) - - (25,043) -
Distribution payable at US$0.0748 per share (153,697) - - - -
Distribution payable at US$0.01281 per share (522,274) - - - -
Distribution payable at US$0.1204 per share (1,188) - - - -
Distribution payable at US$0.1117 per share (8,344) - - - -
Distribution payable at US$0.2367 per share (279,925) - - - -
Distribution payable at GBP£0.0501 per share (24) - - - -
Distribution payable at US$0.0562 per share (661,391) - - - -
Distribution payable at HKD0.3392 per share (40,451) - - - -
Distribution payable at US$0.0339 per share (42,356) - - - -
Distribution payable at HKD0.4125 per share (15) - - - -
Distribution payable at US$0.0410 per share (52) - - - -
March 2016
Distribution payable at HKD0.3396 per share (35,159) - - - -
Distribution payable at US$0.0340 per share (57,466) - - - -
Distribution payable at HKD0.4149 per share (15) - - - -
Distribution payable at US$0.0414 per share (52) - - - -
April 2016
Distribution payable at HKD0.3434 per share (36,908) - - - -
Distribution payable at US$0.0344 per share (73,335) - - - -
Distribution payable at HKD0.4238 per share (15) - - - -
Distribution payable at US$0.0424 per share (54) - - - -
May 2016
Distribution payable at US$0.0630 per share (121,087) - - - -
Distribution payable at GBP£0.0625 per share (30) - - - -
Distribution payable at US$0.0643 per share (757,410) - - - -
Distribution payable at HKD0.3446 per share (49,558) - - - -
Distribution payable at US$0.0345 per share (105,120) - - - -
Distribution payable at HKD0.4287 per share (16) - - - -
Distribution payable at US$0.0428 per share (55) - - - -

First State Global Umbrella Fund PLC
Distribution Statement (Unaudited) (continued)
for the year ended 31 December 2016
See accompanying notes to the financial statements
313
31-Dec-2016
Total US$
Asian Growth
Fund US$
China Growth
Fund US$
High Quality
Bond Fund
US$
Greater China
Growth Fund
US$
June 2016 Distribution payable at HKD0.3444 per share (63,599) - - - -
Distribution payable at US$0.0345 per share (150,207) - - - -
Distribution payable at HKD0.4271 per share (16) - - - -
Distribution payable at US$0.0426 per share (55) - - - -
July 2016
Distribution payable at HKD0.3486 per share (87,829) - - - -
Distribution payable at US$0.0345 per share (180,412) - - - -
Distribution payable at HKD0.4271 per share (16) - - - -
Distribution payable at US$0.0426 per share (56) - - - -
August 2016
Distribution payable at HKD0.3518 per share (149,858) - - - -
Distribution payable at US$0.0352per share (233,756) - - - -
Distribution payable at HKD0.4455 per share (16) - - - -
Distribution payable at US$0.0445per share (57) - - - -
Distribution payable at US$0.5213 per share (29,341,305) - - - -
Distribution payable at US$0.1292 per share (840,767) - - - -
Distribution payable at GBP£0.1762 per share (137,673) - - - -
Distribution payable at US$0.0878 per share (68,606) (68,606) - - -
Distribution payable at US$0.0727 per share (279,176) (279,176) - - -
Distribution payable at US$0.3068 per share (84,728) - (84,728) - -
Distribution payable at US$0.0853 per share (69,749) - - - (69,749)
Distribution payable at US$0.0541 per share (120,081) - - -
Distribution payable at US$0.1043 per share (24,438) - - (24,438) -
Distribution payable at US$0.0930 per share (181,285) - - - -
Distribution payable at US$0.1559 per share (726,711) - - - -
Distribution payable at US$0.1425 per share (109,756) - - - -
Distribution payable at GBP£0.0514 per share (17,315) - - - -
Distribution payable at US$0.1689 per share (8,574) - - - -
Distribution payable at US$0.3100 per share (369,560) - - - -
Distribution payable at GBP£0.0653 per share (29) - - - - Distribution payable at US$0.0609 per share (717,201) - - - -
September 2016 Distribution payable at HKD0.3536 per share (181,658) - - - - Distribution payable at US$0.0354 per share (288,445) - - - - Distribution payable at HKD0.4531 per share (17) - - - - Distribution payable at US$0.0453 per share (59) - - - -
October 2016 Distribution payable at HKD0.3522 per share (190,420) - - - - Distribution payable at US$0.0353 per share (355,428) - - - - Distribution payable at HKD0.4516 per share (17) - - - - Distribution payable at US$0.0451 per share (59) - - - -

First State Global Umbrella Fund PLC
Distribution Statement (Unaudited) (continued)
for the year ended 31 December 2016
See accompanying notes to the financial statements
314
31-Dec-2016
Total US$
Asian Growth
Fund US$
China Growth
Fund US$
High Quality
Bond Fund
US$
Greater China
Growth Fund
US$
November 2016 Distribution payable at HKD0.3478 per share (212,394) - - - - Distribution payable at US$0.0349 per share (393,147) - - - - Distribution payable at HKD0.4450 per share (17) - - - - Distribution payable at US$0.0445 per share (58) - - - - Distribution payable at US$0.0607 per share (147,883) - - - - Distribution payable at GBP£0.0694 per share (31) - - - - Distribution payable at US$0.0702 per share (826,405) - - - -
December 2016 Distribution payable at HKD0.3364 per share (201,046) - - - - Distribution payable at US$0.0337 per share (370,862) - - - - Distribution payable at HKD0.4259 per share (16) - - - - Distribution payable at US$0.0426 per share (56) - - - -
Total distributions paid (59,411,073) (396,942) (84,728) (49,481) (69,749)
Add: Equalisation income received on issue
of shares 39,131,533 773,401 1,138,219 27,313 459,754
Deduct: Equalisation income paid on
redemption of shares (42,846,610) (1,418,853) (2,773,656) (29,149) (1,034,135)
Net distribution for the financial year (63,126,150) (1,042,394) (1,720,165) (51,317) (644,130)
Net investment (expense)/income for the
financial year after distribution
(1,962,435) 4,963,222 5,326,190 1,929,746 3,097,683
Undistributed (loss)/income carried forward (109,180,098) 38,704,519 12,822,021 36,600,398 48,607,473

First State Global Umbrella Fund PLC
Distribution Statement (Unaudited) (continued)
for the year ended 31 December 2016
See accompanying notes to the financial statements
315
Asian Equity
Plus Fund US$
Asian Bond
Fund US$
Asian Quality
Bond Fund
US$
Global
Property
Securities
Fund US$
Asian Property
Securities
Fund US$
Undistributed (loss)/income brought forward (262,778,287) 8,405,849 26,901,023 140,779 (4,596,886)
Net investment income/(expense) for the period
before investment and exchange gains/losses
18,447,810 479,302 15,656,659 192,453 178,044
January 2016
Distribution payable at HKD0.3361 per share - - (36,575) - -
Distribution payable at US$0.0337 per share - - (40,730) - -
Distribution payable at HKD0.3718 per share - - - - -
Distribution payable at US$0.0372 per share - - - - -
February 2016
Distribution payable at US$0.3095 per share (18,633,836) - - - -
Distribution payable at US$0.0867 per share (356,176) - - - -
Distribution payable at GBP£0.0820 per share (78,052) - - - -
Distribution payable at US$0.0651 per share - - - - -
Distribution payable at US$0.0636 per share - (114,595) - - -
Distribution payable at US$0.1145 per share - - - - -
Distribution payable at US$0.0748 per share - - - - (153,697)
Distribution payable at US$0.01281 per share - - - - -
Distribution payable at US$0.1204 per share - - - - -
Distribution payable at US$0.1117 per share - - - (8,344) -
Distribution payable at US$0.2367 per share - - - - -
Distribution payable at GBP£0.0501 per share - - - - -
Distribution payable at US$0.0562 per share - - - - -
Distribution payable at HKD0.3392 per share - - (40,451) - -
Distribution payable at US$0.0339 per share - - (42,356) - -
Distribution payable at HKD0.4125 per share - - - - -
Distribution payable at US$0.0410 per share - - - - -
March 2016
Distribution payable at HKD0.3396 per share - - (35,159) - -
Distribution payable at US$0.0340 per share - - (57,466) - -
Distribution payable at HKD0.4149 per share - - - - -
Distribution payable at US$0.0414 per share - - - - -
April 2016
Distribution payable at HKD0.3434 per share - - (36,908) - -
Distribution payable at US$0.0344 per share - - (73,335) - -
Distribution payable at HKD0.4238 per share - - - - -
Distribution payable at US$0.0424 per share - - - - -
May 2016
Distribution payable at US$0.0630 per share - (121,087) - - -
Distribution payable at GBP£0.0625 per share - - - - -
Distribution payable at US$0.0643 per share - - - - -
Distribution payable at HKD0.3446 per share - - (49,558) - -
Distribution payable at US$0.0345 per share - - (105,120) - -
Distribution payable at HKD0.4287 per share - - - - -
Distribution payable at US$0.0428 per share - - - - -

First State Global Umbrella Fund PLC
Distribution Statement (Unaudited) (continued)
for the year ended 31 December 2016
See accompanying notes to the financial statements
316
Asian Equity
Plus Fund US$
Asian Bond
Fund US$
Asian Quality
Bond Fund US$
Global
Property
Securities
Fund US$
Asian Property
Securities
Fund US$
June 2016
Distribution payable at HKD0.3444 per share - - (63,599) - -
Distribution payable at US$0.0345 per share - - (150,207) - -
Distribution payable at HKD0.4271 per share - - - - -
Distribution payable at US$0.0426 per share - - - - -
July 2016 Distribution payable at HKD0.3486 per share - - (87,829) - -
Distribution payable at US$0.0349 per share - - (180,412) - -
Distribution payable at HKD0.4396 per share - - - - -
Distribution payable at US$0.0439 per share - - - - -
August 2016
Distribution payable at HKD0.3518 per share - - (149,858) - -
Distribution payable at US$0.0352per share - - (233,756) - -
Distribution payable at HKD0.4455 per share - - - - -
Distribution payable at US$0.0445per share - - - - -
Distribution payable at US$0.5213 per share (29,341,305) - - - -
Distribution payable at US$0.1292 per share (840,767) - - - -
Distribution payable at GBP£0.1762 per share (137,673) - - - -
Distribution payable at US$0.0878 per share - - - - -
Distribution payable at US$0.0727 per share - - - - -
Distribution payable at US$0.3068 per share - - - - -
Distribution payable at US$0.0853 per share - - - - -
Distribution payable at US$0.0541 per share - (120,081) - - -
Distribution payable at US$0.1043 per share - - - -
Distribution payable at US$0.0930 per share - - - - (181,285)
Distribution payable at US$0.1559 per share - - - - -
Distribution payable at US$0.1425 per share - - - - -
Distribution payable at GBP£0.0514 per share - - - - -
Distribution payable at US$0.1689 per share - - - (8,574) -
Distribution payable at US$0.3100 per share - - - - -
Distribution payable at GBP£0.0653 per share - - - - -
Distribution payable at US$0.0609 per share - - - - -
September 2016
Distribution payable at HKD0.3536 per share - - (181,658) - -
Distribution payable at US$0.0354 per share - - (288,445) - -
Distribution payable at HKD0.4531 per share - - - - -
Distribution payable at US$0.0453 per share - - - - -
October 2016
Distribution payable at HKD0.3522 per share - - (190,420) - -
Distribution payable at US$0.0353 per share - - (355,428) - -
Distribution payable at HKD0.4516 per share - - - - -
Distribution payable at US$0.0451 per share - - - - -

First State Global Umbrella Fund PLC
Distribution Statement (Unaudited) (continued)
for the year ended 31 December 2016
See accompanying notes to the financial statements
317
Asian Equity
Plus Fund US$
Asian Bond
Fund US$
Asian Quality
Bond Fund US$
Global
Property
Securities
Fund US$
Asian Property
Securities
Fund US$
November 2016 Distribution payable at HKD0.3478 per share - - (212,394) - -
Distribution payable at US$0.0349 per share - - (393,147) - -
Distribution payable at HKD0.4450 per share - - - - -
Distribution payable at US$0.0445 per share - - - - -
Distribution payable at US$0.0607 per share - (147,883) - - -
Distribution payable at GBP£0.0694 per share - - - - -
Distribution payable at US$0.0702 per share - - - - -
December 2016 - - - - -
Distribution payable at HKD0.3364 per share - - (201,046) - -
Distribution payable at US$0.0337 per share - - (370,862) - -
Distribution payable at HKD0.4259 per share - - - - -
Distribution payable at US$0.0426 per share - - - - -
Total distributions paid (49,387,809) (503,646) (3,576,719) (16,918) (334,982)
Add: Equalisation income received on issue
of shares 3,594,729 78,459 27,838,796 1,090,047 3,328
Deduct: Equalisation income paid on
redemption of shares (4,969,843) (42,034) (28,614,459) (1,052,282) (15,879)
Net distribution for the financial year (50,762,923) (467,221) (4,352,382) 20,847 (347,533)
Net investment (expense)/income for the
financial year after distribution
(32,315,113) 12,081 11,304,277 213,300 (169,489)
Undistributed (loss)/income carried forward (295,093,400) 8,417,930 38,205,300 354,079 (4,766,375)

First State Global Umbrella Fund PLC
Distribution Statement (Unaudited) (continued)
for the year ended 31 December 2016
See accompanying notes to the financial statements
318
Global Listed
Infrastructure
Fund US$
Australian
Growth Fund
US$
Worldwide
Equity Fund
US$
Emerging
Markets Bond
Fund US$
Global Credit
Income Fund
US$
Undistributed income brought forward 615,687 72,403 395,329 1,519,468 689,402
Net investment income/(expense) for the period
before investment and exchange gains/losses
3,107,774 (3,240) (37,501) 1,289,341 3,078,226
January 2016
Distribution payable at HKD0.3361 per share - - - - -
Distribution payable at US$0.0337 per share - - - - -
Distribution payable at HKD0.3718 per share - - - (13) -
Distribution payable at US$0.0372 per share - - - (47) -
February 2016
Distribution payable at US$0.3095 per share - - - - -
Distribution payable at US$0.0867 per share - - - - -
Distribution payable at GBP£0.0820 per share - - - - -
Distribution payable at US$0.0651 per share - - - - -
Distribution payable at US$0.0636 per share - - - - -
Distribution payable at US$0.1145 per share - - - - -
Distribution payable at US$0.0748 per share - - - - -
Distribution payable at US$0.01281 per share (522,274) - - - -
Distribution payable at US$0.1204 per share (1,188) - - - -
Distribution payable at US$0.1117 per share - - - - -
Distribution payable at US$0.2367 per share - - - (279,925) -
Distribution payable at GBP£0.0501 per share - - - - (24)
Distribution payable at US$0.0562 per share - - - - (661,391)
Distribution payable at HKD0.3392 per share - - - - -
Distribution payable at US$0.0339 per share - - - - -
Distribution payable at HKD0.4125 per share - - - (15) -
Distribution payable at US$0.0410 per share - - - (52) -
March 2016
Distribution payable at HKD0.3396 per share - - - - -
Distribution payable at US$0.0340 per share - - - - -
Distribution payable at HKD0.4149 per share - - - (15) -
Distribution payable at US$0.0414 per share - - - (52) -
April 2016
Distribution payable at HKD0.3434 per share - - - - -
Distribution payable at US$0.0344 per share - - - - -
Distribution payable at HKD0.4238 per share - - - (15) -
Distribution payable at US$0.0424 per share - - - (54) -
May 2016
Distribution payable at US$0.0630 per share - - - - -
Distribution payable at GBP£0.0625 per share - - - - (30)
Distribution payable at US$0.0643 per share - - - - (757,410)
Distribution payable at HKD0.3446 per share - - - - -
Distribution payable at US$0.0345 per share - - - - -
Distribution payable at HKD0.4287 per share - - - (16) -
Distribution payable at US$0.0428 per share - - - (55) -

First State Global Umbrella Fund PLC
Distribution Statement (Unaudited) (continued)
for the year ended 31 December 2016
See accompanying notes to the financial statements
319
Global Listed
Infrastructure
Fund US$
Australian
Growth Fund
US$
Worldwide
Equity Fund
US$
Emerging
Markets Bond
Fund US$
Global Credit
Income Fund
US$
June 2016 Distribution payable at HKD0.3444 per share - - - - -
Distribution payable at US$0.0345 per share - - - - -
Distribution payable at HKD0.4271 per share - - - (16) -
Distribution payable at US$0.0426 per share - - - (55) -
July 2016 Distribution payable at HKD0.3486 per share - - - - -
Distribution payable at US$0.0349 per share - - - - -
Distribution payable at HKD0.4396 per share - - - (16) -
Distribution payable at US$0.0439 per share - - - (56) -
August 2016
Distribution payable at HKD0.3518 per share - - - - -
Distribution payable at US$0.0352per share - - - - -
Distribution payable at HKD0.4455 per share - - - (16) -
Distribution payable at US$0.0445per share - - - (57) -
Distribution payable at US$0.5213 per share - - - - -
Distribution payable at US$0.1292 per share - - - - -
Distribution payable at GBP£0.1762 per share - - - - -
Distribution payable at US$0.0878 per share - - - - -
Distribution payable at US$0.0727 per share - - - - -
Distribution payable at US$0.3068 per share - - - - -
Distribution payable at US$0.0853 per share - - - - -
Distribution payable at US$0.0541 per share - - - - -
Distribution payable at US$0.1043 per share - - - - -
Distribution payable at US$0.0930 per share - - - - -
Distribution payable at US$0.1559 per share (726,711) - -
Distribution payable at US$0.1425 per share (109,756) - - - -
Distribution payable at GBP£0.0514 per share (17,315) - - - -
Distribution payable at US$0.1689 per share - - - - -
Distribution payable at US$0.3100 per share - - - (369,560) -
Distribution payable at GBP£0.0653 per share - - - - (29)
Distribution payable at US$0.0609 per share - - - - (717,201)
September 2016 Distribution payable at HKD0.3536 per share - - - - -
Distribution payable at US$0.0354 per share - - - - -
Distribution payable at HKD0.4531 per share - - - (17) -
Distribution payable at US$0.0453 per share - - - (59) -
October 2016 Distribution payable at HKD0.3522 per share - - - - -
Distribution payable at US$0.0353 per share - - - - -
Distribution payable at HKD0.4516 per share - - - (17) -
Distribution payable at US$0.0451 per share - - - (59) -

First State Global Umbrella Fund PLC
Distribution Statement (Unaudited) (continued)
for the year ended 31 December 2016
See accompanying notes to the financial statements
320
Global Listed
Infrastructure
Fund US$
Australian
Growth Fund
US$
Worldwide
Equity Fund
US$
Emerging
Markets Bond
Fund US$
Global Credit
Income Fund
US$
November 2016 Distribution payable at HKD0.3478 per share - - - - -
Distribution payable at US$0.0349 per share - - - - -
Distribution payable at HKD0.4450 per share - - - (17)
Distribution payable at US$0.0445 per share - - - (58)
Distribution payable at US$0.0607 per share - - - -
Distribution payable at GBP£0.0694 per share - - - - (31)
Distribution payable at US$0.0702 per share - - - - (826,405)
December 2016
Distribution payable at HKD0.3364 per share - - - - -
Distribution payable at US$0.0337 per share - - - - -
Distribution payable at HKD0.4259 per share - - - (16) -
Distribution payable at US$0.0426 per share - - - (56) -
Total distributions paid (1,377,244) - - (650,334) (2,962,521)
Add: Equalisation income received on issue of
shares 3,416,429 - 2,506 2,095 706,457
Deduct: Equalisation income paid on
redemption of shares (1,000,173) - (5,119) (1,130,451) (760,577)
Net distribution for the financial year 1,039,012 - (2,613) (1,778,690) (3,016,641)
Net investment income/(expense) for the
financial year after distribution
4,146,786 (3,240) (40,114) (489,349) 61,585
Undistributed income/(loss) carried forward 4,762,473 69,163 355,215 1,030,119 750,987

First State Global Umbrella Fund PLC
Notes forming part of the financial statements for the year ended
31 December 2017
321
1. Organisation
First State Global Umbrella Fund plc (the “Company”) was incorporated on 18 June 1998 and registered
as an open-ended umbrella investment company with variable capital in Ireland under the Companies
Act, 2014. The authorised share capital of the Company is five hundred billion shares of no par value
initially designated as unclassified shares.
The sole object of the Company is the collective investment in transferable securities and/or in other
liquid financial assets referred to in the Central Bank UCITS Regulations of capital raised from the public
and which operates on the principle of risk spreading.
2. Principal accounting policies
(a) Basis of presentation
The financial statements have been prepared in accordance with International Financial Reporting
Standards (“IFRS”) issued by the International Accounting Standards Board (IASB), and interpretations
issued by the International Financial Reporting Interpretations Committee of the IASB.
The accounting policies used in the preparation of these financial statements are consistent with those
used in the Company’s most recent annual financial statements for the financial year ended 31 December
2016.
The preparation of financial statements in conformity with IFRS requires management to make
judgements, estimates and assumptions that affect the application of policies and the reported amounts
of assets and liabilities, income and expense. The estimates and associated assumptions are based on
historical experience and various other factors that are believed to be reasonable under the circumstances,
the results of which form the basis of making the judgements about carrying values of assets and liabilities
that are not readily apparent from other sources. If in the future such estimates and assumptions, which
are based on management's best judgement at the date of the financial statements deviate from the actual
outcome, the original estimates and assumptions will be modified as appropriate in the financial year
which the circumstances change.
The financial statements have also been prepared in accordance with the Central Bank (Supervision and
Enforcement Act 2013 (Section 48(1)) (Undertakings for Collective Investment in Transferable
Securities) Regulations 2015 (the “Central Bank UCITS Regulations”) and the Hong Kong Securities
and Futures Commission (“SFC”) Code on Unit Trust and Mutual Funds (the “Code”).
The financial statements are based on the valuations prepared at 11:00 a.m. (Irish time) on the final
business day of the financial year (29 December 2017). These valuations are based on prices and include
investment transactions up to 11:00 a.m. (Irish time) on the final business day of the financial year or as
at close of business on the latest day preceeding the final business day of the financial year where the
relevant markets are not yet open for trading. This method is in accordance with the valuation policies
outlined in the Company’s prospectus.

First State Global Umbrella Fund PLC
Notes forming part of the financial statements for the year ended
31 December 2017 (continued)
322
2. Principal accounting policies (continued)
(a) Basis of presentation (continued)
For financial statement purposes, where the difference between the fair value of investments as at the
valuation point and close of business on the final business day of the financial year (29 December 2017)
is deemed material, the financial statements have been updated. There were no material difference on 29
December 2017. In addition, all dealing in the Company’s shares on the final business day of the financial
year is incorporated in the financial statements for all funds. There is no impact on the NAV (Net Asset
Value) per share from these transactions.
All references to net assets in the financial statements refer to net assets attributable to redeemable
participating shareholders unless otherwise stated.
The format and certain wordings of the financial statements have been adapted from those contained in
IFRS as adopted by the European Union and the Companies Act 2014 so that, in the opinion of the
Directors, they more appropriately reflect the nature of the Company’s business as an investment fund.
Changes in accounting policy
Amendments to IAS 12 – Income Taxes
Recognition of deferred tax assets for unrealised losses: effective for annual periods beginning on or after
1 January 2017, clarify how to account for deferred tax assets related to debt instruments measured at fair
value. IAS 12 provides requirements on the recognition and measurement of current or deferred tax
liabilities or assets. The amendments clarify the requirements on recognition of deferred tax assets for
unrealised losses, to address diversity in practice. The measurement and classification requirements do
not have a significant impact on the Company’s financial statements.
Amendments to IAS 7 - Statements of cash flow
The Amendments effective for annual periods beginning on or after 1 January 2017, require the following
changes in liabilities arising from financing activities to be disclosed (to the extent necessary): (i) changes
from financing cash flows; (ii) changes arising from obtaining or losing control of subsidiaries or other
businesses; (iii) the effect of changes in foreign exchange rates; (iv) changes in fair values; and (v) other
changes. The amendments state that one way to fulfil the new disclosure requirement is to provide a
reconciliation between the opening and closing balances in the statement of financial position for
liabilities arising from financing activities. Finally, the amendments state that changes in liabilities arising
from financing activities must be disclosed separately from changes in other assets and liabilities. Earlier
application is permitted. The measurement and classification requirements do not have a significant
impact on the Company’s financial statements.

First State Global Umbrella Fund PLC
Notes forming part of the financial statements for the year ended
31 December 2017 (continued)
323
2. Principal accounting policies (continued)
(a) Basis of presentation (continued)
Changes in accounting policy (continued)
Accounting standards and amendments to existing accounting standards in issue but not yet
effective
IFRS 9 Financial Instruments
IFRS 9 ‘Financial Instruments’ (effective 1 January, 2018): IFRS 9 specifies how an entity should classify
and measure financial assets and liabilities, including some hybrid contracts. The standard improves and
simplifies the approach for classification and measurement of financial assets compared with the
requirements of IAS 39 Financial Instruments: Recognition and Measurement. Most of the requirements
of IAS 39 for classification and measurement of financial liabilities were carried forward unchanged. The
standard applies a constant approach to classifying financial assets and replaces the numerous categories
of financial assets in IAS 39, each of which had its own classification criteria. The standard is not
expected to have a significant impact on the Company’s financial position or performance, as it is
expected that the Company will continue to classify its financial assets and financial liabilities (both long
and short) as being at fair value through profit or loss.
IAS 28 Investments in Associates and Joint Ventures
IAS 28 has been amended to clarify that the election to measure at fair value through profit or loss an
investment in an associate or a joint venture that is held by an entity that is a venture capital organisation,
or other qualifying entity, is available for each investment in an associate or joint venture on an
investment-by-investment basis, upon initial recognition.
This annual interpretation is effective for annual periods beginning on or after 1 January 2018. Earlier
application is permitted. The Company does not expect the measurement and classification requirements
to have a significant impact on its financial statements.
IFRIC 22 Foreign Currency Transactions and Advance Consideration
On 8 December 2016, the IFRS Interpretations Committee of the International Accounting Standards
Board (IASB) issued IFRS Interpretation, IFRIC 22, Foreign Currency Transactions and Advance
Consideration which clarifies the date of the transaction for the purpose of determining the exchange rate
to use on initial recognition of the related asset, expense or income, when an entity has received or paid
advance consideration in a foreign currency.
As per IFRIC 22, the date of the transaction for the purpose of determining the exchange rate to use on
initial recognition of the related asset, expense or income (or part of it) is the date on which an entity
initially recognizes the non-monetary asset or non-monetary liability arising from the payment or receipt
of advance consideration. In case there are multiple payments or receipts in advance, the entity should
determine a date of the transaction for each payment or receipt of advance consideration.
This interpretation is applicable for annual periods beginning on or after 1 January 2018. Early application
is permitted. The Company is currently assessing the impact of IFRIC 22 and plans to adopt the new
interpretation on the required effective date.

First State Global Umbrella Fund PLC
Notes forming part of the financial statements for the year ended
31 December 2017 (continued)
324
2. Principal accounting policies (continued)
(b) Financial assets and liabilities designated at fair value through profit or loss
The Company has designated its investments as financial assets and liabilities designated at fair value
through profit or loss. There are two categories of investments:
Financial assets and liabilities held for trading – these are acquired or incurred principally for the
purpose of selling or repurchasing in the short term, and
Financial assets and financial liabilities designated by management at fair value through profit or
loss at inception – these are financial instruments that are not classified as held for trading, but
are managed and their performance are evaluated on a fair value basis in accordance with the
Company’s documented investment strategy.
All investments have been categorised as financial assets and liabilities designated at fair value through
profit or loss at inception.
Purchases and sales of investments are recognised on the trade date – the date on which the Company
commits to purchase or sell the asset. Investments are initially recognised at fair value and are
derecognised when the rights to receive cash flows from the investments have expired or the Company
has transferred substantially all risks and rewards of ownership. Subsequent to initial recognition, all
financial assets and financial liabilities designated at fair value through profit or loss are measured at fair
value. Gains and losses arising from changes in the fair value of the ‘financial assets or financial liabilities
designated at fair value through profit or loss’ category are included in the Statement of Comprehensive
Income (“SCI”) in the financial year in which they arise with the realised gains and losses calculated
using a First-in, First-out (“FIFO”) method.
Fair value is the price that would be received to sell an asset or paid to transfer a liability in an orderly
transaction between market participants at the measurement date. The fair value of financial assets and
liabilities of securities listed or dealt in on a regulated market shall be valued on the basis of the last
traded price available at the financial year end date. Where a security is listed or dealt in on more than
one regulated market, the Directors may at their absolute discretion, select any one of these regulated
markets for such purposes. The Company utilises the last traded market price for both financial assets
and liabilities where the last traded price is within the bid-ask spread. In circumstances where the last
traded price is not within the bid-ask spread, management will determine the point within the bid-ask
spread that is most representative of fair value.
The Board of Directors has appointed a Fair Value Pricing Committee (“FVPC”) to ascertain the value
of relevant securities in the event that market prices are unavailable, that they do not represent probable
realisation value or are not listed.

First State Global Umbrella Fund PLC
Notes forming part of the financial statements for the year ended
31 December 2017 (continued)
325
2. Principal accounting policies (continued)
(b) Financial assets and liabilities designated at fair value through profit or loss (continued)
Futures contracts are recorded on the trade date and are valued at the applicable 11.00 a.m. (Irish time)
mid prices on the last business day of the period. Forward foreign exchange contracts are recorded on the
trade date and are valued at the applicable foreign exchange rates on the last business day of the period.
Interest rate swaps and credit default swaps are valued at estimated fair values as determined by the swap
counterparties. Warrants are recorded as an asset or liability at their fair value and are valued at the quoted
market prices at the financial year end date. Certificates of deposit investments are based on the
underlying cash originally invested in the certificate which approximates fair value.
The difference between the original contract amount and the fair value of open positions is the unrealised
appreciation or depreciation and is reflected in financial assets and liabilities designated at fair value
through profit or loss on the Statement of Financial Position (“SFP”) and as a net change in unrealised
appreciation or depreciation in financial assets and liabilities designated at fair value through profit or
loss in the Statement of Comprehensive Income (“SCI”). Realised gains or losses are recognised on the
closing, maturity, expiry or trade date of the contract and are included in realised gain/(loss) on financial
assets and liabilities designated at fair value through profit or loss in the SCI.
Further details on derivative contracts are included in Note 9.
(c) Valuation of financial assets and liabilities
Holdings in other investment funds are valued at the last available net asset value per unit or share or
other similar participation or the last available traded price. These investments are recorded on their trade
date in financial assets and liabilities designated at fair value through profit or loss in the SFP. The change
in fair value is recorded as an unrealised gain/(loss) within net changes in unrealised
appreciation/(depreciation) on financial assets and liabilities designated at fair value through profit or
loss in the SCI. Upon derecognition of these holdings, the amount previously recognised in the SFP is
recognised as a realised gain or loss in realised gain/(loss) on financial assets and liabilities designated at
fair value through profit or loss in the SCI.
At the financial year-end date, the Company has also valued certain less liquid investments using a quote
from a single broker as an estimate of fair value.
Because of their inherent uncertainty, estimated fair values may differ significantly. These less liquid
investments have a greater amount of risk and exposure to market volatility than many other investments.
These investments trade in a limited market and may not be able to be immediately liquidated at these
estimated fair values if needed. Furthermore, the estimated net realisable value of a Fund’s investments
may be affected by economic and political developments in a specific country or region and those effects
could be material to the financial statements.

First State Global Umbrella Fund PLC
Notes forming part of the financial statements for the year ended
31 December 2017 (continued)
326
2. Principal accounting policies (continued)
(c) Valuation of financial assets and liabilities (continued)
The below table provides an analysis of all of the investments for the First State Global Credit Income
Fund and First State China Focus Fund which were valued at the financial year end date using a quote
from a single broker and with reference to an index a as an estimate of fair value.
2017 2017
% of NAV
2016 2016
% of NAV Funds Pricing source US$ US$
First State Global Credit
Income Fund Single broker quote 805,718 1.12% 574,312 0.50%
First State China Focus
Fund Index 9,389,399 4.47% - -
(d) Offsetting financial instruments
Financial assets and liabilities are offset and the net amount reported in the SFP when there is a legally
enforceable right to set-off recognised amounts and there is an intention to settle on a net basis or realise
the assets and settle the liability simultaneously.
(e) Foreign currency translation
(i) Functional and presentation currency
The Board of Directors considers the US Dollar the currency that most faithfully represents the economic
effect of the underlying transactions, events and conditions. The US Dollar is the currency in which the
Company measures its performance and reports its results, as well as the currency in which it principally
receives subscriptions and redemptions from its investors. The Company has also adopted the US Dollar
as its presentation currency.
(ii) Transactions and balances
Monetary assets and liabilities denominated in currencies other than the presentation currency are
translated into the presentation currency at the closing rates of exchange at financial year end.
Transactions during the financial year, including purchases and sales of securities, income and expenses,
are translated at the rate of exchange prevailing on the date of the transaction. Foreign exchange gains
and losses arising from translation are included in the SCI. Foreign exchange gains/losses relating to cash
and cash equivalents are presented in the SCI within “Net (Loss)/Gain on foreign exchange” and foreign
exchange gains/losses relating to financial assets and liabilities carried at fair value through profit or loss
are presented in the SCI within “Net Changes in Unrealised Appreciation/(Depreciation) on financial
assets and liabilities designated at fair value through profit or loss”.

First State Global Umbrella Fund PLC
Notes forming part of the financial statements for the year ended
31 December 2017 (continued)
327
2. Principal accounting policies (continued)
(f) Income
Interest income/expenses are recognised in the SCI for all debt instruments using the effective interest
method. The effective interest method is a method of calculating the amortised cost of a financial asset
or financial liability and of allocating the interest income or interest expense over the relevant period.
The effective interest rate is the rate that exactly discounts estimated future cash payments or receipts
throughout the expected life of the financial instrument, or a shorter period where appropriate, to the net
carrying amount of the financial asset or liability. When calculating the effective interest rate, the
Company estimates cash flows considering all contractual terms of the financial instrument but does not
consider future credit losses. The calculation includes all fees and points paid or received between parties
to the contract that are an integral part of the effective interest rate, transaction costs and all other
premiums or discounts.
Dividend income is credited to the SCI on the date on which the relevant securities are listed as “ex-
dividend”. Dividend income is shown gross of any non-recoverable withholding taxes, which are
disclosed separately in the SCI, and net of any tax credits.
(g) Expenses
Expenses are accounted for on an accruals basis and are charged to the SCI when incurred.
(h) Cash and cash equivalents
Cash and cash equivalents include cash in hand, deposits held at call with banks and bank overdrafts.
Cash and cash equivalents will be valued at their face value with the relevant interest accrued and charged
to the SCI when incurred.
(i) Due to and from brokers
Amounts due to/from brokers represent payables for investments purchased and receivables for securities
sold that have been contracted for but not yet delivered or settled by the end of the financial year.
These amounts are recognised initially at fair value and subsequently measured at amortised cost using
the effective interest method, less provision for impairment for amounts due from brokers. A provision
for impairment of amounts due from brokers is established when there is objective evidence that the
Company will not be able to collect all amounts due from the relevant broker. Significant financial
difficulties of the broker, probability that the broker will enter bankruptcy or financial reorganisation, and
defaults in payments are considered indicators that the amount due from brokers is impaired. Once a
financial asset or group of similar financial assets has been written down as a result of an impairment
loss, interest income is recognised using the rate of interest used to discount the future cash flows for the
purpose of measuring the impairment loss.

First State Global Umbrella Fund PLC
Notes forming part of the financial statements for the year ended
31 December 2017 (continued)
328
2. Principal accounting policies (continued)
(j) Distributions to holders of redeemable participating shares
Distributions to holders of redeemable participating shares are recognised in the SCI as finance costs
when they are appropriately authorised and no longer at the discretion of the Company.
Dividends may be paid out of net revenue (including interest and dividends) plus realised and unrealised
profits on the disposal/valuation of investments and other funds, less realised and unrealised losses
(including fees and expenses).
In the case of monthly distributing share classes, the monthly dividend rate per share is calculated by the
Investment Manager and any fees and expenses relating to these share classes are charged against capital.
In maintaining a regular monthly dividend payment, a Fund may at times pay dividends out of capital of
the Fund instead of income which may have different tax implications from the payment of dividends out
of income and may also result in an erosion of the capital invested.
(k) Redeemable participating shares
The Company issues redeemable participating shares, which are redeemable at the holder’s option and are
classified as financial liabilities. Redeemable participating shares can be put back to the Company at any
time for cash equal to a proportionate share of the Company’s net asset value. The redeemable share is
carried at the redemption amount that is payable at the SFP date if the holder exercises the right to put the
share back to the Company.
Redeemable participating shares are issued and redeemed at the holder’s option at prices based on the
Company’s net asset value per share at the time of issue or redemption. The Company’s NAV per share
is calculated by dividing the net assets attributable to the holders of redeemable participating shares with
the total number of outstanding redeemable participating shares. In accordance with the provisions of the
Company’s Articles of Association, investment positions are valued based on the last traded price for the
purpose of determining the net asset value per share for subscriptions and redemptions.
The Company has minimum initial investment, minimum subsequent investment amounts and minimum
holdings in relation to each share class as detailed in the prospectus. In the interests of shareholder
protection, the Directors may limit the number of participating shares of any Fund redeemed on any
dealing day to 10% of the total number of participating shares of that Fund in issue. The limitation will
apply pro rata to all shareholders wishing to redeem the participating shares on that dealing day. The
participating shares not redeemed but which would otherwise have been redeemed will be carried forward
for redemption on the next and successive dealing day until all of the shares to which the original request
related have been redeemed. The relevant movements are shown on the Statement of Changes in Net
Assets Attributable to Redeemable Participating Shareholders.

First State Global Umbrella Fund PLC
Notes forming part of the financial statements for the year ended
31 December 2017 (continued)
329
2. Principal accounting policies (continued)
(k) Redeemable participating shares (continued)
Each Fund will maintain an equalisation account with a view to ensuring that the level of dividends
payable on shares (or the reportable income arising in respect of any class approved as a reporting Fund)
is not affected by the issue and redemption of such shares during an accounting period. The subscription
price of such shares will therefore be deemed to include an equalisation payment calculated by reference
to the accrued income of the Fund and the equalisation payment will be refunded to the shareholders as
part of their first distribution, but for tax purposes will be treated as a return of capital. The redemption
price of each share will also include an equalisation payment in respect of the accrued income of the Fund
up to the date of redemption.
(l) Taxation
Under current law and practice the Company qualifies as an investment undertaking as defined in Section
739B of the Taxes Consolidation Act, 1997, as amended. On that basis, it is not chargeable to Irish tax
on its income or gains.
However, Irish tax may arise on the happening of a "chargeable event". A chargeable event includes any
distribution payments to shareholders, any encashment, redemption, cancellation or transfer of shares and
any deemed disposal of shares for Irish tax purposes arising as a result of the holding of shares for an
eight year period or more. No Irish tax will arise on the Company in respect of chargeable events in
respect of:
(a) a shareholder who is neither Irish resident nor ordinarily resident in Ireland for tax purposes, at the
time of the chargeable event, provided appropriate valid declarations in accordance with the provisions
of the Taxes Consolidation Act, 1997, as amended, are held by the Company or the Company has been
authorised by the Irish Revenue to make gross payments in the absence of appropriate declarations and
such authorisation has not been withdrawn; and
(b) certain exempted Irish tax resident shareholders who have provided the Company with the necessary
signed statutory declarations.
Dividends, interest and capital gains (if any) received on investments made by the Company may be
subject to withholding taxes imposed by the country from which the investment income/gains are
received and such taxes may not be recoverable by the Company or its shareholders.
(m) Transaction costs
Transaction costs are incremental costs, which are separately identifiable and directly attributable to the
acquisition, issue or disposal of a financial asset or financial liability. Transaction costs for all financial
assets carried at fair value through profit and loss are included in the SCI. These include fees and
commissions paid to brokers and counterparties and have been classified within gains and losses.
Transaction fees paid to the Depositary on trade settlement are expensed as incurred and included in the
SCI. Transaction costs are detailed in Note 6.

First State Global Umbrella Fund PLC
Notes forming part of the financial statements for the year ended
31 December 2017 (continued)
330
2. Principal accounting policies (continued)
(n) Collateral
Cash collateral provided by the Company is identified in the SFP as margin cash and is not included as a
component of cash and cash equivalents. For collateral other than cash, if the party to whom the collateral
is provided has the right by contract or custom to sell or re-pledge the collateral, the Fund classifies that
asset in its SFP separately from other assets and identifies the asset as pledged collateral. Where the party
to whom the collateral is provided does not have the right to sell or re-pledge, a disclosure of the collateral
provided is made in the notes to the financial statements.
As at 31 December 2017 and 31 December 2016, there was no collateral held by the Funds other than
cash.
(o) Preliminary expenses
Expenses incurred in the formation of the Asia Pacific All Cap Fund and Japan Equity Fund are
recognized as expenses of the Fund in the year in which they arise.
3. Fees and expenses
Investment management fees
First State Investments (Hong Kong) Limited (the “Investment Manager”) is entitled to a fee up to a rate
of 3% per annum of the net asset value of each Fund.
The below table shows the current rates per annum of investment management fees of each Fund of the
Company for Class I, II, III, IV shares as at 31 December 2017:
Funds Class I Class II Class III Class III (G) Class IV First State Asian Growth Fund 1.50% 1.50% 0.85% - 2.00% First State China Growth Fund 2.00% 1.50% - - - Stewart Investors Worldwide Leaders Fund 1.50% - 0.75% 0.30% - First State Hong Kong Growth Fund 1.50% - 1.00% - - First State Indian Subcontinent Fund 1.75% 1.50% 1.00% - - First State Global Bond Fund 1.00% - 0.30% - - First State High Quality Bond Fund - - 0.30% - - First State Long Term Bond Fund - - 0.30% - - First State Greater China Growth Fund 1.50% - 1.00% - 2.00% First State Singapore and Malaysia Growth Fund 1.50% - - - - First State Asia Opportunities Fund 1.75% - 1.00% - - First State Asian Equity Plus Fund 1.50% - 1.00% - - First State Asian Bond Fund - - 0.30% - - First State Asian Quality Bond Fund 1.00% - 0.30% - - Stewart Investors Global Emerging Markets
Leaders Fund
1.50%
-
0.85%
-
1.75%
First State Global Resources Fund 1.50% - 0.85% - 1.75% First State Global Property Securities Fund 1.50% - - - - First State Asian Property Securities Fund 1.50% - 0.85% - - First State China Focus Fund 1.75% - 1.00% - 2.00% First State Global Listed Infrastructure Fund 1.50% - 0.85% - -

First State Global Umbrella Fund PLC
Notes forming part of the financial statements for the year ended
31 December 2017 (continued)
331
3. Fees and expenses (continued)
Investment management fees (continued)
Funds Class I Class II Class III Class III (G) Class IV Stewart Investors Global Emerging Markets
Select Fund 1.50% - 0.85% - -
First State Asia Pacific Select Fund 1.50% - 0.85% - - Stewart Investors Worldwide Equity Fund 1.75% - 1.00% - - First State Emerging Markets Bond Fund 1.25% - - - - First State Global Credit Income Fund - - - - - First State Asia Pacific All Cap Fund - - 1.25% - - First State Japan Equity Fund 1.75% - 1.00% - -
The table below shows the current rates of investment management fees of each Fund, for the Class I
(Distributing), Class III (Distributing), Class V (Distributing), Class I (Monthly Distributing) and Class
I (HKD Monthly Distributing) shares, as at 31 December 2017:
Funds Class I
(Distributing) Class III
(Distributing)
Class V
(Distributing)
Class I
(Monthly
Distributing)
Class I
(HKD
Monthly
Distributing)
First State Asian Growth Fund 1.50% - - - - First State China Growth Fund 2.00% - - - - First State Indian Subcontinent
Fund
1.75% - - - -
First State High Quality Bond
Fund
1.00% - - - -
First State Greater China Growth
Fund
1.50% 1.00% - - -
First State Asian Equity Plus Fund 1.50% 1.00% - - -
First State Asian Bond Fund 1.00% - - - -
First State Asian Quality Bond
Fund
- - - 1.00% 1.00%
First State Asian Property
Securities Fund 1.50% 0.85% - - -
First State Global Credit Income
Fund - - 0.00% - -
First State Global Listed
Infrastructure Fund 1.50% - - - -
Stewart Investors Worldwide
Equity Fund 1.75% - - - -
First State Emerging Markets
Bond Fund 1.25% - - 1.25% 1.25%

First State Global Umbrella Fund PLC
Notes forming part of the financial statements for the year ended
31 December 2017 (continued)
332
3. Fees and expenses (continued)
Investment management fees (continued)
The table below shows the current rates of investment management fees of each Fund for the Class VI
Class III (GBP Hedged Distributing), Class III (GBP), Class I (GBP), Class I (HKD), Class I (GBP
Distributing) and Class VI (Distributing) shares as at 31 December 2017:
Funds
Class VI
Class III (GBP
Hedged
Distributing)
Class III
(GBP)
Class I
(GBP)
Class I
(HKD)
Class I
(GBP
Distributing)
Class VI
(Distributing)
First State Asian Growth
Fund
0.85% - - - - - 0.85% First State Asian Equity Plus
Fund - 1.00% 1.00% 1.5% 1.5% 1.5% -
First State Asian Quality
Bond Fund - - - - - - 0.30%
First State Global Listed
Infrastructure Fund 0.75% - - - - - 0.75%
First State Global Credit
Income Fund - 0.5% - - - - -
First State Asian Property
Securities Fund 0.75%
-
-
-
-
- 0.75%
First State Global Property
Securities Fund 0.75%
-
-
-
-
- 0.75%
First State Sustainable Listed
Infrastructure Fund 0.75%
-
-
-
-
-
-
The table below shows the current rates of investment management fees of each Fund for the Class VI
(Euro), Class VI (GBP Distributing), Class E, Class E (Euro) and Class E (GBP Distributing) shares as
at 31 December 2017:
The Investment Manager is also entitled to reimbursement of any expenses reasonably incurred to enable
it to perform its duties in relation to the Company. The investment management charge for the financial
year for each Fund is disclosed in the SCI on pages 276-285. The total amount due to the Investment
Manager at 31 December 2017 was US$15,558,160 (2016: US$13,162,281).
Funds Class I
(Euro)
Class III
(JPY)
Class VI
(Euro)
Class VI (GBP
Distributing) Class E
Class E
(Euro)
Class E (GBP
Distributing)
First State Japan Equity Fund - 1.00% 1.00% - - - -
First State Global Listed
Infrastructure Fund 1.50% - 0.75% 0.75% - - -
First State Asia Opportunities
Fund - - 1.00%
-
-
-
-
First State Sustainable Listed
Infrastructure Fund
Infrastructure Fund
Infrastructure Fund
- - 0.75% 0.75% 0.45% 0.45%
0.45%

First State Global Umbrella Fund PLC
Notes forming part of the financial statements for the year ended
31 December 2017 (continued)
333
3. Fees and expenses (continued)
The Investment Manager may delegate the investment management function to Sub-Investment
Managers. The Investment Manager will pay out of its investment management fee the fees and out of
pocket expenses of the Sub-Investment Managers.
During the year the Investment Mangement fees for Class I (Distributing) of First State Indian Sub-
Continent Fund were changed from 1.50% to 1.75% per annum.
Waivers and Reimbursement
The Investment Manager and the Company have agreed that the operating expenses of the Class II shares
of the following Funds should be set at the following rates as measured by the percentage of net assets:
Funds 2017 2016
Class II
First State Asian Growth Fund 2.30% 2.30%
First State China Growth Fund 2.25% 2.25%
First State Indian Subcontinent Fund 3.00% 3.00%
When the normal operating expenses of a Fund fall below the set expense rates, the Fund is not required
to pay the difference to the Investment Manager. When the normal operating expenses of a Fund exceed
these expense rates, the Investment Manager will waive all or some of its fees and absorb other expenses
of the Fund to maintain the set expense rate.
Subscription charges
The Investment Manager is entitled to a preliminary charge of up to 7% relating to subscriptions in the
Company. For the financial year ended 31 December 2017 the income accruing to the Investment
Manager relating to subscriptions in the Company amounted to US$Nil (2016: Nil).
Depositary and administration fees
HSBC Institutional Trust Services (Ireland) DAC (the “Depositary”) and HSBC Securities Services
(Ireland) DAC (the “Administrator”) are entitled to a composite fee out of the assets of each Fund at a
rate of 0.0485% per annum based on the net asset value of each Fund as of each dealing day for all classes
with the exception of Class III Shares for which the composite fee shall be US$5,000 per annum in respect
of trustee and administration services provided.
The Administrator is entitled to a transaction fee of US$15 for processing of subscriptions, redemptions,
transfers and other shareholder-related transactions. The Depositary is also entitled to a safe-keeping fee
from the Company for all Classes of shares, of up to 0.45% per annum on the asset value of securities
depending on the location of the assets held.
Directors’ fees
Directors are entitled to remuneration for their services as Directors.
The Directors are entitled to be reimbursed for any reasonable out of pocket expenses incurred in
execution of their duties. The total Directors fees for the financial year ended 31 December 2017 were
US$129,872 (2016: 102,460).

First State Global Umbrella Fund PLC
Notes forming part of the financial statements for the year ended
31 December 2017 (continued)
334
3. Fees and expenses (continued)
Auditors’ fees
Fees accrued to the statutory auditors, PricewaterhouseCoopers, in respect of the financial year ending
31 December 2017 and 31 December 2016 are as follows:
2017 2016
US$* US$*
Audit of financial statements 245,496 238,677
Other assurance services - -
Tax advisory services 16,566 5,764
Other non-audit services - -
Total 262,062 244,441
*Invoices are issued in Euro and amounts are shown exclusive of VAT.

First State Global Umbrella Fund PLC
Notes forming part of the financial statements for the year ended
31 December 2017 (continued)
335
4. Exchange rates
The following exchange rates were used to translate assets and liabilities into the presentation currency
United States Dollars or US$ at 31 December 2017.
2017 2016 Australian Dollar 1.27918 1.38332
Bangladeshi Taka 82.80500 79.05000
Brazilian Real 3.31245 3.25470
Canadian Dollar 1.25335 1.34760
Chilean Peso 614.75500 666.57000
Chinese Renminbi 6.50800 6.94400
Czech Koruna 21.33400 25.61350
Danish Krone 6.21440 7.04870
Egyptian Pound - 18.50000
Euro 0.83438 0.94809
Hong Kong Dollar 7.81565 7.75400
Hungarian Forint 259.03000 294.34000
Indian Rupee 63.82750 67.87500
Indonesian Rupiah 13,567.50000 13,472.50000
Israeli Shekel - 3.83950
Japanese Yen 112.53000 116.81000
Korean Won 1,066.15000 -
Malaysian Ringgit 4.04700 4.48600
Mexican Peso 19.69890 20.71775
New Taiwanese Dollar 29.64800 -
New Zealand Dollar 1.40459 1.43720
Nigerian Niara 360.43000 304.70000
Norwegian Krone 8.19270 8.61100
Oman Rial - 0.38500
Pakistani Rupee 110.70000 104.42500
Peruvian Sol - 3.35855
Philippine Peso 49.83100 49.61700
Polish Zloty 3.48435 4.19585
Quatari Rial - 3.64140
Russian Roubles - 61.55500
Singapore Dollar 1.33580 1.44395
South African Rand 12.30500 13.68475
South Korean Won - 1,201.99500
Sri Lankan Rupee 153.45000 149.62500
Sterling Pound 0.74091 0.81271
Swedish Krona 8.20800 9.07810
Swiss Franc 0.97505 1.01850
Taiwan Dollar - 32.33100
Thai Baht 32.59000 35.79000
Turkish Lira 3.77490 3.52550
Vietnamese Dong 22,709.00000 22,771.00000

First State Global Umbrella Fund PLC
Notes forming part of the financial statements for the year ended
31 December 2017 (continued)
336
5. Soft commission
The Company may make use of commission sharing arrangements for certain funds with brokerage firms
that execute or that provide research and advisory services to the Company. This may include situations
where the dealing commission on a particular trade or a series of trades is shared between one or more
providers of execution and/or research services. In this case a portion of the commission paid by the
Company to the executing broker is used to purchase third party research or execution services.
The Company made use of commission sharing arrangements during the financial year 2017 and 2016.
The brokerage firm has provided execution services in this period and a portion of commission paid has
been used to purchase third party research services. From January 2018, as part of new MiFid regulation,
all research and advisory services are now paid by the Managers/Sub-Managers and hence there is no
longer any use of soft commissions as part of trading.
6. Financial assets and liabilities designated at fair value through profit or loss
In determining an instrument's placement within the fair value hierarchy, the Directors separate the
Company's investment portfolio into two categories: investments and derivative instruments. Each of
these categories can further be divided between financial assets or financial liabilities.
Investments
Investments whose values are based on quoted market prices in active markets and are therefore classified
within Level 1, include active listed equities and bonds, certain U.S. government and sovereign
obligations, and certain money market securities. The Directors do not adjust the quoted price for such
instruments, even in situations where the Company holds a large position and a sale could reasonably
impact the quoted price.
Investments that trade in markets that are not considered to be active, but are valued based on quoted
market prices, dealer quotations or alternative pricing sources supported by observable inputs are
classified within Level 2. These include certain U.S. government and sovereign obligations, most
government agency securities, certain mortgage products, investment-grade corporate bonds, certain
bank loans and bridge loans and less liquid listed equities, bonds state, municipal and provincial
obligations and investments in other funds. As Level 2 investments include positions that are not traded
in active markets and/or are subject to transfer restrictions, valuations may be adjusted to reflect illiquidity
and/or non-transferability, which are generally based on available market information.
Investments classified within Level 3 have significant unobservable inputs, as they trade infrequently or
not at all. Level 3 instruments include certain investments valued using an estimate of fair value. When
observable prices are not available for these securities, the Directors use one or more valuation techniques
(e.g., the market approach or the income approach) for which sufficient and reliable data is available.
Within Level 3, the use of the market approach generally consists of using comparable market
transactions, while the use of the income approach generally consists of the net present value of estimated
future cash flows, adjusted as appropriate for liquidity, credit, market and/or other risk factors. The Level
3 investments are priced by the relevant competent party and the method is approved by the Directors.
Level 3 valuations are reviewed on a monthly basis by the FVPC. The FVPC considers the
appropriateness of the valuation model inputs, as well as the valuation result using various valuation
methods and techniques generally recognised as standard within the industry.

First State Global Umbrella Fund PLC
Notes forming part of the financial statements for the year ended
31 December 2017 (continued)
337
6. Financial assets and liabilities designated at fair value through profit or loss (continued)
Investments (continued)
As of 31 December 2017, the Company holds a Level 3 equity investment in First State China Focus Fund.
Wanhua Chemical Group was suspended on 5 December 2017 due to restructuring activities in the overall
Wanhua Group. On 6 December 2017, the FVPC decided to classify the investment as Level 3.
Derivative contracts
Derivative instruments can be exchange-traded or privately negotiated over-the-counter ("OTC").
Exchange-traded derivatives, such as warrants and future contracts, and OTC derivatives, such as forward
currency contracts, credit default swaps and interest rate swaps, are typically classified within Level 1 or
Level 2 of the fair value hierarchy depending on whether or not they are deemed to be actively traded.
The Company considers the transfers between different levels to occur when there is a change in
significant observable and unobservable inputs for a particular investment. There were no transfers
between levels of investments during the financial year ended 31 December 2017 and 31 December 2016.
The Company’s assets and liabilities (by class) not measured at fair value but for which fair value is
disclosed have the following levels: Level 1 - cash and cash equivalents, margin accounts, bank overdrafts,
Level 2 - remaining classes of financial assets and liabilities on the Statement of Financial Position. These
assets and liabilities are carried at amortised cost; their carrying values are a reasonable approximation
of fair value.
The following table presents the financial instruments carried on the Statement of Financial Position by
caption and by level within the valuation hierarchy as at 31 December 2017 and 31 December 2016.
First State Asian Growth Fund 31 Dec 2017
Level 1 Level 2 Level 3 Total
US$ US$ US$ US$
Financial assets
Equity securities 540,824,311 - - 540,824,311
540,824,311 - - 540,824,311
First State Asian Growth Fund 31 Dec 2016
Level 1 Level 2 Level 3 Total
US$ US$ US$ US$
Financial assets
Equity securities 521,843,085 - - 521,843,085
521,843,085 - - 521,843,085

First State Global Umbrella Fund PLC
Notes forming part of the financial statements for the year ended
31 December 2017 (continued)
338
6. Financial assets and liabilities designated at fair value through profit or loss (continued)
First State China Growth Fund 31 Dec 2017
Level 1 Level 2 Level 3 Total
US$ US$ US$ US$
Financial assets
Equity securities 4,454,529,259 - - 4,454,529,259
Investment funds - 56,110,250 - 56,110,250
4,454,529,259 56,110,250 - 4,510,639,509
First State China Growth Fund 31 Dec 2016
Level 1 Level 2 Level 3 Total
US$ US$ US$ US$
Financial assets
Equity securities 3,396,507,133 - - 3,396,507,133
Investment funds - 135,712,625 - 135,712,625
3,396,507,133 135,712,625 - 3,532,219,758
Steward Investors Worldwide Leaders Fund 31 Dec 2017
Level 1 Level 2 Level 3 Total
US$ US$ US$ US$
Financial assets
Equity securities 40,136,312 - - 40,136,312
40,136,312 - - 40,136,312
Steward Investors Worldwide Leaders Fund 31 Dec 2016
Level 1 Level 2 Level 3 Total
US$ US$ US$ US$
Financial assets
Equity securities 34,575,194 - - 34,575,194
34,575,194 - - 34,575,194
First State Hong Kong Growth Fund 31 Dec 2017
Level 1 Level 2 Level 3 Total
US$ US$ US$ US$
Financial assets
Equity securities 181,387,333 - - 181,387,333
181,387,333 - - 181,387,333

First State Global Umbrella Fund PLC
Notes forming part of the financial statements for the year ended
31 December 2017 (continued)
339
6. Financial assets and liabilities designated at fair value through profit or loss (continued)
First State Hong Kong Growth Fund 31 Dec 2016
Level 1 Level 2 Level 3 Total
US$ US$ US$ US$
Financial assets
Equity securities 151,675,896 - - 151,675,896
151,675,896 - - 151,675,896
First State Indian Subcontinent Fund 31 Dec 2017
Level 1 Level 2 Level 3 Total
US$ US$ US$ US$
Financial assets
Equity securities 539,101,180 - - 539,101,180
539,101,180 - - 539,101,180
First State Indian Subcontinent Fund 31 Dec 2016
Level 1 Level 2 Level 3 Total
US$ US$ US$ US$
Financial assets
Equity securities 311,472,556 - - 311,472,556
311,472,556 - - 311,472,556
First State Global Bond Fund 31 Dec 2017
Level 1 Level 2 Level 3 Total
US$ US$ US$ US$
Financial assets
Debt securities - 16,169,072 - 16,169,072
Forward contracts - 13,872 - 13,872
- 16,182,944 - 16,182,944
Financial liabilities
Forward contracts - 7,622 - 7,622
Future contracts 469 - - 469
469 7,622 - 8,091

First State Global Umbrella Fund PLC
Notes forming part of the financial statements for the year ended
31 December 2017 (continued)
340
6. Financial assets and liabilities designated at fair value through profit or loss (continued)
First State Global Bond Fund 31 Dec 2016
Level 1 Level 2 Level 3 Total
US$ US$ US$ US$
Financial assets
Debt securities - 15,027,774 - 15,027,774
Forward contracts - 3,323 - 3,323
- 15,031,097 - 15,031,097
Financial liabilities
Forward contracts - 45,894 - 45,894
Future contracts 1,641 - - 1,641
1,641 45,894 - 47,535
First State High Quality Bond Fund 31 Dec 2017
Level 1 Level 2 Level 3 Total
US$ US$ US$ US$
Financial assets
Debt securities - 83,249,471 - 83,249,471
- 83,249,471 - 83,249,471
First State High Quality Bond Fund 31 Dec 2016
Level 1 Level 2 Level 3 Total
US$ US$ US$ US$
Financial assets
Debt securities - 80,612,928 - 80,612,928
- 80,612,928 - 80,612,928
Financial liabilities
Future contracts 16,301 - - 16,301
16,301 - - 16,301

First State Global Umbrella Fund PLC
Notes forming part of the financial statements for the year ended
31 December 2017 (continued)
341
6. Financial assets and liabilities designated at fair value through profit or loss (continued)
First State Long Term Bond Fund 31 Dec 2017
Level 1 Level 2 Level 3 Total
US$ US$ US$ US$
Financial assets
Debt securities - 69,368,729 - 69,368,729
- 69,368,729 - 69,368,729
First State Long Term Bond Fund 31 Dec 2016
Level 1 Level 2 Level 3 Total
US$ US$ US$ US$
Financial assets
Debt securities - 66,175,534 - 66,175,534
Future contracts 2,453 - - 2,453
2,453 66,175,534 - 66,177,987
Financial liabilities
Future contracts 15,742 - - 15,742
15,742 - - 15,742
First State Greater China Growth Fund 31 Dec 2017
Level 1 Level 2 Level 3 Total
US$ US$ US$ US$
Financial assets
Equity securities 633,376,045 - - 633,376,045
Investment funds - 9,671,981 - 9,671,981
633,376,045 9,671,981 - 643,048,026
First State Greater China Growth Fund 31 Dec 2016
Level 1 Level 2 Level 3 Total
US$ US$ US$ US$
Financial assets
Equity securities 475,542,151 - - 475,542,151
Investment funds - 10,315,430 - 10,315,430
475,542,151 10,315,430 - 485,857,581

First State Global Umbrella Fund PLC
Notes forming part of the financial statements for the year ended
31 December 2017 (continued)
342
6. Financial assets and liabilities designated at fair value through profit or loss (continued)
First State Singapore and Malaysia Growth Fund 31 Dec 2017
Level 1 Level 2 Level 3 Total
US$ US$ US$ US$
Financial assets
Equity securities 49,600,772 - - 49,600,772
Investment funds - 992,270 - 992,270
49,600,772 992,270 - 50,593,042
First State Singapore and Malaysia Growth Fund 31 Dec 2016
Level 1 Level 2 Level 3 Total
US$ US$ US$ US$
Financial assets
Equity securities 47,829,755 - - 47,829,755
Investment funds 603,705 - - 603,705
48,433,460 - - 48,433,460
First State Asia Opportunities Fund 31 Dec 2017
Level 1 Level 2 Level 3 Total
US$ US$ US$ US$
Financial assets
Equity securities 41,110,842 - - 41,110,842
41,110,842 - - 41,110,842
First State Asia Opportunities Fund 31 Dec 2016
Level 1 Level 2 Level 3 Total
US$ US$ US$ US$
Financial assets
Equity securities 33,582,240 - - 33,582,240
33,582,240 - - 33,582,240
First State Asian Equity Plus Fund 31 Dec 2017
Level 1 Level 2 Level 3 Total
US$ US$ US$ US$
Financial assets
Equity securities 3,229,185,396 - - 3,229,185,396
Investment funds 22,963,777 39,262,005 62,225,782
3,252,149,173 39,262,005 - 3,291,411,178

First State Global Umbrella Fund PLC
Notes forming part of the financial statements for the year ended
31 December 2017 (continued)
343
6. Financial assets and liabilities designated at fair value through profit or loss (continued)
First State Asian Equity Plus Fund 31 Dec 2016
Level 1 Level 2 Level 3 Total
US$ US$ US$ US$
Financial assets
Equity securities 2,505,219,463 - - 2,505,219,463
Investment funds 18,122,499 26,942,155 - 45,064,654
2,523,341,962 26,942,155 - 2,550,284,117
First State Asian Bond Fund 31 Dec 2017
Level 1 Level 2 Level 3 Total
US$ US$ US$ US$
Financial assets
Debt securities - 31,244,738 - 31,244,738
Future contracts 22,610 - - 22,610
22,610 31,244,738 - 31,267,348
Financial liabilities
Future contracts 5,070 - - 5,070
5,070 - - 5,070
First State Asian Bond Fund 31 Dec 2016
Level 1 Level 2 Level 3 Total
US$ US$ US$ US$
Financial assets
Debt securities - 18,279,642 - 18,279,642
Future contracts 664 - - 664
664 18,279,642 - 18,280,306
Financial liabilities
Future contracts 1,805 - - 1,805
1,805 - - 1,805
First State Asian Quality Bond Fund 31 Dec 2017 Level 1 Level 2 Level 3 Total
US$ US$ US$ US$ Financial assets
Debt securities - 619,930,336 - 619,930,336
Futures contracts 125,984 - - 125,984
125,984 619,930,336 - 620,056,320
Financial liabilities
Futures contracts 82,420 - - 82,420
82,420 - - 82,420

First State Global Umbrella Fund PLC
Notes forming part of the financial statements for the year ended
31 December 2017 (continued)
344
6. Financial assets and liabilities designated at fair value through profit or loss (continued)
First State Asian Quality Bond Fund 31 Dec 2016
Level 1 Level 2 Level 3 Total
US$ US$ US$ US$ Financial assets
Debt securities - 628,017,439 - 628,017,439
Futures contracts 179,195 - - 179,195
179,195 628,017,439 - 628,196,634
Financial liabilities
Futures contracts 76,827 - - 76,827
76,827 - - 76,827
Stewart Investors Global Emerging Markets Leaders Fund 31 Dec 2017
Level 1 Level 2 Level 3 Total
US$ US$ US$ US$
Financial assets
Equity securities 1,247,476,783 - - 1,247,476,783
1,247,476,783 - - 1,247,476,783
Stewart Investors Global Emerging Markets Leaders Fund 31 Dec 2016
Level 1 Level 2 Level 3 Total
US$ US$ US$ US$
Financial assets
Equity securities 993,712,346
- - 993,712,346
993,712,346 - - 993,712,346
First State Global Resources Fund 31 Dec 2017
Level 1 Level 2 Level 3 Total
US$ US$ US$ US$
Financial assets
Equity securities 93,997,794 - - 93,997,794
93,997,794 - - 93,997,794
First State Global Resources Fund 31 Dec 2016
Level 1 Level 2 Level 3 Total
US$ US$ US$ US$
Financial assets
Equity securities 131,358,919 - - 131,358,919
131,358,919 - - 131,358,919

First State Global Umbrella Fund PLC
Notes forming part of the financial statements for the year ended
31 December 2017 (continued)
345
6. Financial assets and liabilities designated at fair value through profit or loss (continued)
First State Global Property Securities Fund 31 Dec 2017
Level 1 Level 2 Level 3 Total
US$ US$ US$ US$
Financial assets
Equity securities 19,491,878 - - 19,491,878
19,491,878 - - 19,491,878
First State Global Property Securities Fund 31 Dec 2016
Level 1 Level 2 Level 3 Total
US$ US$ US$ US$
Financial assets
Equity securities 15,420,965 - - 15,420,965
Investment funds 649,514 - - 649,514
16,070,479 - - 16,070,479
First State Asian Property Securities Fund 31 Dec 2017
Level 1 Level 2 Level 3 Total
US$ US$ US$ US$
Financial assets
Equity securities 10,095,841 - - 10,095,841
10,095,841 - - 10,095,841
First State Asian Property Securities Fund 31 Dec 2016
Level 1 Level 2 Level 3 Total
US$ US$ US$ US$
Financial assets
Equity securities 11,466,639 - - 11,466,639
Investment funds 262,264 - - 262,264
11,728,903 - - 11,728,903

First State Global Umbrella Fund PLC
Notes forming part of the financial statements for the year ended
31 December 2017 (continued)
346
6. Financial assets and liabilities designated at fair value through profit or loss (continued)
First State China Focus Fund 31 Dec 2017
Level 1 Level 2 Level 3 Total
US$ US$ US$ US$
Financial assets
Equity securities 189,861,618 - 9,389,399* 199,251,017
Investment funds - 7,733,773 - 7,733,773
189,861,618 7,733,773 9,389,399 206,984,790
First State China Focus Fund 31 Dec 2016
Level 1 Level 2 Level 3 Total
US$ US$ US$ US$
Financial assets
Equity securities 203,981,154 - - 203,981,154
Investment funds - 10,323,688 - 10,323,688
203,981,154 10,323,688 - 214,304,842
*Wanhua Chemical Group was suspended on 5 December 2017 due to restructuring activities in the overall
Wanhua Group. On 6 December 2017, the FVPC decided to classify the investment as Level 3. The
SHSZ300 price index was used to price the investment.
First State China Focus Fund 31 Dec 2017
Total
US$
Opening balance -
Purchases at cost 2,001,645
Sales at proceeds (10,921,670)
Realised gain 5,317,083
Net change in unrealised appreciation on financial assets at fair value
through profit or loss 3,792,954
Transfers in and/or out of Level 3 9,199,387
Closing balance 9,389,399
The unrealised gains as at the year ended 31 December 2017 for Level 3 financial assets amounted to
US$5,212,107 and are included in net change in unrealised appreciation/(depreciation) on financial assets
and liabilities at fair value through profit or loss in the Income Statement.
First State Global Listed Infrastructure Fund 31 Dec 2017
Level 1 Level 2 Level 3 Total
US$ US$ US$ US$
Financial assets
Equity securities 525,818,171 - - 525,818,171
525,818,171 - - 525,818,171

First State Global Umbrella Fund PLC
Notes forming part of the financial statements for the year ended
31 December 2017 (continued)
347
6. Financial assets and liabilities designated at fair value through profit or loss (continued)
First State Global Listed Infrastructure Fund 31 Dec 2016
Level 1 Level 2 Level 3 Total
US$ US$ US$ US$
Financial assets
Equity securities 293,581,194 - - 293,581,194
293,581,194 - - 293,581,194
First State Asia Pacific Select Fund 31 Dec 2017
Level 1 Level 2 Level 3 Total
US$ US$ US$ US$
Financial assets
Equity securities 125,703,363 - - 125,703,363
125,703,363 - - 125,703,363
First State Asia Pacific Select Fund 31 Dec 2016
Level 1 Level 2 Level 3 Total
US$ US$ US$ US$
Financial assets
Equity securities 88,870,078 - - 88,870,078
88,870,078 - - 88,870,078
Stewart Investors Worldwide Equity Fund 31 Dec 2017
Level 1 Level 2 Level 3 Total
US$ US$ US$ US$
Financial assets
Equity securities 24,550,250 - - 24,550,250
24,550,250 - - 24,550,250
Stewart Investors Worldwide Equity Fund 31 Dec 2016
Level 1 Level 2 Level 3 Total
US$ US$ US$ US$
Financial assets
Equity securities 20,794,094 - - 20,794,094
20,794,094 - - 20,794,094

First State Global Umbrella Fund PLC
Notes forming part of the financial statements for the year ended
31 December 2017 (continued)
348
6. Financial assets and liabilities designated at fair value through profit or loss (continued)
First State Emerging Markets Bond Fund* 31 Dec 2016
Level 1 Level 2 Level 3 Total
US$ US$ US$ US$
Financial assets
Debt securities - 26,251,489 - 26,251,489
- 26,251,489 - 26,251,489
* The First State Emerging Market Bond Fund terminated on 23 November 2017
First State Global Credit Income Fund 31 Dec 2017 Level 1 Level 2 Level 3 Total US$ US$ US$ US$
Financial assets
Debt securities - 67,746,460 - 67,746,460
Future contracts 76,062 - - 76,062
Interest rate swaps - 1,008,764 - 1,008,764
76,062 68,755,224 - 68,831,286
Financial liabilities
Forward contracts - 105,293 - 105,293
Future contracts 17,218 - - 17,218
Interest rate swaps - 203,046 - 203,046
17,218 308,339 - 325,557
First State Global Credit Income Fund 31 Dec 2016 Level 1 Level 2 Level 3 Total US$ US$ US$ US$
Financial assets
Debt securities - 109,483,228 - 109,483,228
Forward contracts - 260,375 - 260,375
Future contracts 12,286 - - 12,286
Interest rate swaps - 1,212,562 - 1,212,562
12,286 110,956,165 - 110,968,451
Financial liabilities
Forward contracts - 5,831 - 5,831
Future contracts 51,550 - - 51,550
Interest rate swaps - 638,250 - 638,250
51,550 644,081 - 695,631

First State Global Umbrella Fund PLC
Notes forming part of the financial statements for the year ended
31 December 2017 (continued)
349
6. Financial assets and liabilities designated at fair value through profit or loss (continued)
First State Asia Pacific All Cap Fund 31 Dec 2017 Level 1 Level 2 Level 3 Total US$ US$ US$ US$
Financial assets
Equity securities 83,273,088 - - 83,273,088
83,273,088 - - 83,273,088
First State Asia Pacific All Cap Fund 31 Dec 2016 Level 1 Level 2 Level 3 Total US$ US$ US$ US$
Financial assets
Equity securities 62,473,038 - - 62,473,038
62,473,038 - - 62,473,038
First State Japan Equity Fund
31 Dec 2017 Level 1 Level 2 Level 3 Total US$ US$ US$ US$
Financial assets
Equity securities 82,472,221 - - 82,472,221
82,472,221 - - 82,472,221
First State Japan Equity Fund
31 Dec 2016 Level 1 Level 2 Level 3 Total US$ US$ US$ US$
Financial assets
Equity securities 54,627,699 - - 54,627,699
54,627,699 - - 54,627,699
First State Sustainable Listed Infrastructure Fund*
Fu
31 Dec 2017 Level 1 Level 2 Level 3 Total
US$ US$ US$ US$
Financial assets
Equity securities 3,872,159 - - 3,872,159
3,872,159 - - 3,872,159
*The First State Sustainable Listed Infrastructure Fund launched on 20 December 2017.

First State Global Umbrella Fund PLC
Notes forming part of the financial statements for the year ended
31 December 2017 (continued)
350
6. Financial assets and liabilities designated at fair value through profit or loss (continued)
Transaction costs
The below table provides an analysis of the total transaction costs for the financial years ended 31
December 2017 and December 2016.
First State Asian
Growth Fund
First State China
Growth Fund
Stewart Investors
Worldwide Leaders
Fund
First State Hong
Kong Growth
Fund
First State Indian
Subcontinent Fund
2017 2017 2017 2017 2017
US$ US$ US$ US$ US$
Total transaction
costs 916,727 4,908,296 25,112 200,922 1,353,854
First State Global
Bond Fund
First State High
Quality Bond
Fund
First State Long
Term Bond Fund
First State Greater
China Growth
Fund
First State
Singapore and
Malaysia Growth
Fund
2017 2017 2017 2017 2017
US$ US$ US$ US$ US$
Total transaction
costs 4,152 3,306 1,401 484,122 24,380
First State Asia
Opportunities
Fund
First State Asian
Equity Plus Fund
First State
Asian Bond
Fund
First State Asian
Quality Bond Fund
Stewart Investors
Global Emerging
Markets leaders
Fund
2017 2017 2017 2017 2017
US$ US$ US$ US$ US$
Total transaction
costs 75,141 3,596,962 3,194 3,910 1,371,540
First State Global
Resources Fund
First State Global
Property Securities
Fund
First State Asian
Property
Securities Fund
First State China
Focus Fund
First State Global
Listed
Infrastructure
Fund
2017 2017 2017 2017 2017
US$ US$ US$ US$ US$
Total transaction
costs 248,561 47,284 23,202 294,153 1,307,343
First State Asia
Pacific Select
Fund
Stewart Investors
Worldwide Equity
Fund
First State
Emerging Markets
Bond Fund*
First State Global
Credit Income
Fund
2017 2017 2017 2017
US$ US$ US$ US$
Total transaction
costs 203,845 25,486 3,258 11,201
* The First State Emerging Market Bond Fund terminated on 23 November 2017

First State Global Umbrella Fund PLC
Notes forming part of the financial statements for the year ended
31 December 2017 (continued)
351
6. Financial assets and liabilities designated at fair value through profit or loss (continued)
Transaction costs (continued)
First State Asia Pacific
All Cap Fund
First State Japan
Equity Fund
First State
Sustainable Listed
Infrastructure
Fund
2017 2017 2017***
US$ US$ US$
Total transaction
costs 147,368 67,417 3,740
First State Asian
Growth Fund
First State China
Growth Fund
Stewart Investors
Worldwide Leaders
Fund
First State Hong
Kong Growth
Fund
First State Indian
Subcontinent Fund
2016 2016 2016 2016 2016
US$ US$ US$ US$ US$
Total transaction
costs 745,684 5,322,238 23,877 196,634 894,939
First State Global
Bond Fund
First State High
Quality Bond
Fund
First State Long
Term Bond Fund
First State Greater
China Growth
Fund
First State
Singapore and
Malaysia Growth
Fund
2016 2016 2016 2016 2016
US$ US$ US$ US$ US$
Total transaction
costs 3,332 3,525 2,076 698,185 29,934
First State Asia
Opportunities
Fund
First State Asian
Equity Plus Fund
First State
Asian Bond
Fund
First State Asian
Quality Bond Fund
Stewart Investors
Global Emerging
Markets leaders
Fund
2016* 2016 2016 2016 2016
US$ US$ US$ US$ US$
Total transaction
costs 65,452 3,364,250 3,792 34,977 1,235,059
First State Global
Resources Fund
First State Global
Property Securities
Fund
First State Asian
Property
Securities Fund
First State China
Focus Fund
First State Global
Listed
Infrastructure
Fund
2016 2016 2016 2016 2016
US$ US$ US$ US$ US$
Total transaction
costs 225,114 81,213 26,607 366,826 727,980
First State Asia
Pacific Select
Fund
First State Global
Agribusiness
Fund**
Stewart
Investors
Worldwide
Equity Fund
First State
Emerging Markets
Bond Fund
First State Global
Credit Income
Fund
2016 2016 2016 2016 2016
US$ US$ US$ US$ US$
Total transaction
costs 121,514 47,078 39,147 19,667 18,926
*Formerly known as First State Asia Innovation Fund.
**The First State Global Agribusiness Fund terminated on 8 November 2016.
***The First State Sustainable Listed Infrastructure Fund launched on 20 December 2017.

First State Global Umbrella Fund PLC
Notes forming part of the financial statements for the year ended
31 December 2017 (continued)
352
6. Financial assets and liabilities designated at fair value through profit or loss (continued)
Transaction costs (continued)
First State Asia Pacific
All Cap Fund
First State Japan
Equity Fund
2016 2016
US$ US$
Total transaction
costs 84,960 67,047
7. Incorporation and share capital
The initial share capital of the Company is 30,000 subscriber shares of EUR 1.25 each and the company
may issue up to 500,000,000,000 participating shares of no par value. Subscriber shares are not entitled
to any dividends or to participate in the profits of the Company beyond the amount of capital paid up on
issue. Subscriber shares in issue at 31 December 2017 have not been included in the financial statements.
Subscriber shareholders are entitled to one vote per share held in matters relating to the Company. The
subscriber shareholders are First State Nominees (Hong Kong) Ltd and First State Investments (Hong
Kong) Ltd.
Holders of participating shares of the Funds are entitled to one vote per participating share. Participating
shares of the Funds are also entitled to share in any dividends and profits of those specific Funds, and are
redeemable at the option of the shareholder.
An anti-dilution adjustment may be payable by the shareholders from time to time as determined by the
Investment Manager in respect of net subscriptions or net redemptions in a Fund. The amount of the anti-
dilution levy is intended to cover dealing costs in order to protect continuing shareholders in that Fund.
Transactions in shares during the financial year were as follows:
Subscriber shares At At
31 Dec 2017 31 Dec 2016
Issued at a price of €1.25 3 3
Participating Shares of no par value
At 31 Dec
2016
Shares
issued
Shares
redeemed
At 31 Dec
2017
First State Asian Growth Fund
Class I 6,791,629 384,444 (1,961,474) 5,214,599
Class II 14,368 - (1,713) 12,655
Class III 1,517,818 1,361,276 (2,197,117) 681,977
Class I (Dist) 349,734 48,339 (78,753) 319,320
Class IV 1,006,282 577,003 (568,987) 1,014,298
Class VI 11,765,460 3,097,350 (3,486,145) 11,376,665
Class VI (Dist) 5,209,287 3,942,735 (1,687,937) 7,464,085

First State Global Umbrella Fund PLC
Notes forming part of the financial statements for the year ended
31 December 2017 (continued)
353
7. Incorporation and share capital (continued)
At 31 Dec
2016
Shares
issued
Shares
redeemed
At 31 Dec
2017
First State China Growth Fund
Class I 30,722,644 3,468,020 (9,094,377) 25,096,287
Class II 16,334 - (3,555) 12,779
Class I (Dist) 227,209 5,806 (73,085) 159,930
Stewart Investors Worldwide Leaders Fund
Class I 2,777,438 690,736 (802,489) 2,665,685
Class III (G) 754,872 5,827 (85,906) 674,793
First State Hong Kong Growth Fund
Class I 1,669,307 232,162 (439,654) 1,461,815
Class III 713,695 14,257 (173,857) 554,095
First State Indian Subcontinent Fund
Class I 2,462,742 961,359 (777,748) 2,646,353
Class II 15,127 - (799) 14,328
Class I (Dist) 19,148 6,042 (6,388) 18,802
Class III 7,953,088 4,804,455 (1,488,840) 11,268,703
First State Global Bond Fund
Class I 342,445 33,386 (34,252) 341,579
Class III 595,808 18,230 (8,587) 605,451
First State High Quality Bond Fund
Class III 3,537,020 124,715 (132,665) 3,529,070
Class I (Dist) 285,268 138,275 (204,725) 218,818
First State Long Term Bond Fund
Class III 2,782,043 8,338 (1,992) 2,788,389
First State Greater China Growth Fund
Class I 6,424,647 879,434 (1,690,383) 5,613,698
Class I (Dist) 24,995 686 (11,906) 13,775
Class IV 984,586 294,613 (705,225) 573,974
Class III (Dist) 588,876 79,915 (73,150) 595,641
Class III 366,751 1,129,557 (436,847) 1,059,461
First State Singapore and Malaysia
Growth Fund
Class I 1,049,067 78,776 (231,809) 896,034

First State Global Umbrella Fund PLC
Notes forming part of the financial statements for the year ended
31 December 2017 (continued)
354
7. Incorporation and share capital (continued)
At 31 Dec
2016
Shares
issued
Shares
redeemed
At 31 Dec
2017
First State Asia Opportunities Fund
Class I 924,839 169,247 (219,841) 874,245
Class II - 118,465 - 118,465
First State Asian Equity Plus Fund
Class I 5,334,154 1,037,659 (1,662,878) 4,708,935
Class I (Dist) 55,422,260 488,468,716 (493,551,704) 50,339,272
Class III (Dist) 5,901,920 9,626,235 (3,936,205) 11,591,950
Class III 863,157 7,281,461 (1,080,040) 7,064,578
GBP III Hedged (Dist) 490,061 46,562 (186,560) 350,063
First State Asian Bond Fund
Class I (Dist) 2,242,454 2,434,530 (750,779) 3,926,205
First State Asian Quality Bond Fund
Class I 29,522,032 39,753,401 (35,395,576) 33,879,857
Class I (Monthly Dist) 10,664,964 1,611,466 (7,139,572) 5,136,858
Class I (HKD Monthly Dist) 4,498,233 1,162,948 (3,383,611) 2,277,570
Class III 1,166,669 700 (1,167,369) -
Class VI (Dist) 150 4 - 154
Stewart Investors Global Emerging
Markets Leaders Fund
Class I 6,127,628 146,248 (1,980,964) 4,292,912
Class III 32,917,110 2,650,950 (2,414,726) 33,153,334
Class IV 781,086 128,601 (391,934) 517,753
First State Global Resources Fund
Class I 14,542,232 8,434,598 (14,358,947) 8,617,883
Class III 1,816,613 925,077 (2,073,198) 668,492
Class IV 988,282 1,076,020 (1,117,628) 946,674
First State Global Property
Securities Fund
Class I 1,423,450 3,384,045 (3,231,312) 1,576,183
Class VI (Dist) 8,311 - - 8,311
First State Asian Property Securities
Fund
Class I 106,941 - (55,169) 51,772
Class I (Dist) 1,898,883 117,860 (542,046) 1,474,697

First State Global Umbrella Fund PLC
Notes forming part of the financial statements for the year ended
31 December 2017 (continued)
355
7. Incorporation and share capital (continued)
* The First State Emerging Market Bond Fund terminated on 23 November 2017.
At 31 Dec
2016
Shares
issued
Shares
redeemed
At 31 Dec
2017
First State China Focus Fund
Class I 15,410,484 2,391,390 (6,027,580) 11,774,294
Class III 30,554 18,086 (10,362) 38,278
Class IV 3,654,559 1,248,403 (2,095,037) 2,807,925
First State Global Listed
Infrastructure Fund
Class III 3,877,158 633,563 (1,075,421) 3,435,300
Class I (Dist) 6,894,570 10,921,989 (10,309,500) 7,507,059
Class VI 11,012,437 3,246,306 (2,301,099) 11,957,644
Class VI (Dist) 1,494,512 9,823,870 (3,793,724) 7,524,658
Class I 741,830 2,755,942 (217,339) 3,280,433
Class I EUR 31,605 11,330 (1,800) 41,135
Class VI GBP (Dist) 666,520 172,194 (174,193) 664,521
Class VI EUR 1,259,511 8,520,176 (3,985,797) 5,793,890
First State Asia Pacific Select Fund
Class I 600 5,684 - 6,284
Class III 6,334,389 1,201,517 (1,173,706) 6,362,200
Stewart Investors Worldwide Equity
Fund
Class I 217,796 - (25,126) 192,670
Class III 1,731,098 44,739 (79,382) 1,696,455
First State Emerging Markets Bond
Fund*
Class I 2,691 26,534 (29,225) -
Class I (Dist) 23,705 6,305 (30,010) -
Class I (Monthly Dist) 1,318 47 (1,365) -
Class I (HKD Monthly Dist) 291 5 (296) -
Class III 2,733,110 2,324,710 (5,057,820) -
First State Global Credit Income Fund
GBP III Hedged (Dist) 343 9 - 352
Class V 11,474,280 - (4,414,281) 7,059,999

First State Global Umbrella Fund PLC
Notes forming part of the financial statements for the year ended
31 December 2017 (continued)
356
7. Incorporation and share capital (continued)
At 31 Dec
2015
Shares
issued
Shares
redeemed
At 31 Dec
2016
First State Asian Growth Fund
Class I 7,450,461 821,196 (1,480,028) 6,791,629
Class II 14,385 - (17) 14,368
Class III 1,665,088 1,056,466 (1,203,736) 1,517,818
Class I (Dist) 1,649,541 124,114 (1,423,921) 349,734
Class IV 909,404 414,967 (318,089) 1,006,282
Class VI 12,212,027 4,373,685 (4,820,252) 11,765,460
Class VI (Dist) - 7,077,854 (1,868,567) 5,209,287
First State China Growth Fund
Class I 35,854,513 4,010,004 (9,141,873) 30,722,644
Class II 16,246 88 - 16,334
Class I (Dist) 359,785 4,487 (137,063) 227,209
Stewart Investors Worldwide Leaders
Fund
Class I 2,801,417 514,592 (538,571) 2,777,438
Class III (G) 783,926 8,712 (37,766) 754,872
**The First State Sustainable Listed Infrastructure Fund launched on 20 December 2017.
At 31 Dec
2016
Shares
issued
Shares
redeemed
At 31 Dec
2017
First State Asia Pacific All Cap Fund
Class III 5,246,016 145,533 (287,980) 5,103,569
First State Japan Equity Fund
Class III 1,659,217 997,203 (881,504) 1,774,916
Class VI EUR 2,438,800 580,900 (747,100) 2,272,600
Classs I 893 626,656 (1,817) 625,732
Class III JPY 1,216,480 1,638 (319,808) 898,310
First State Sustainable Listed
Infrastructure Fund**
Class VI - 67,000 - 67,000
Class VI (EUR Acc) - 57,000 - 57,000
Class VI GBP (Dist) - 50,000 - 50,000
Class E EUR - 57,000 - 57,000
Class E USD - 67,000 - 67,000
Class E GBP (Dist) - 50,000 - 50,000

First State Global Umbrella Fund PLC
Notes forming part of the financial statements for the year ended
31 December 2017 (continued)
357
7. Incorporation and share capital (continued)
At 31 Dec
2015
Shares
issued
Shares
redeemed
At 31 Dec
2016
First State Hong Kong Growth Fund
Class I 1,900,503 183,229 (414,425) 1,669,307
Class III 863,483 4,286 (154,074) 713,695
First State Indian Subcontinent Fund
Class I 2,570,201 465,123 (572,582) 2,462,742
Class II 15,327 - (200) 15,127
Class I (Dist) 50,000 619 (31,471) 19,148
Class III 3,439,942 5,203,274 (690,128) 7,953,088
First State Global Bond Fund
Class I 345,359 40,987 (43,901) 342,445
Class III 590,165 17,375 (11,732) 595,808
First State High Quality Bond Fund
Class III 3,653,642 25,384 (142,006) 3,537,020
Class I (Dist) 218,438 257,795 (190,965) 285,268
First State Long Term Bond Fund
Class III 3,183,157 9,236 (410,350) 2,782,043
First State Greater China Growth Fund
Class I 7,763,129 1,459,148 (2,797,630) 6,424,647
Class I (Dist) 80,192 - (55,197) 24,995
Class IV 1,019,889 384,697 (420,000) 984,586
Class III (Dist) 594,626 231,410 (237,160) 588,876
Class III 2,413,704 197,931 (2,244,884) 366,751
First State Singapore and Malaysia
Growth Fund
Class I 1,122,458 93,654 (167,045) 1,049,067
First State Asia Opportunities Fund*
Class I 916,677 217,187 (209,025) 924,839
* Formerly known as First State Asia Innovation Fund.

First State Global Umbrella Fund PLC
Notes forming part of the financial statements for the year ended
31 December 2017 (continued)
358
7. Incorporation and share capital (continued)
At 31 Dec
2015
Shares
issued
Shares
redeemed
At 31 Dec
2016
First State Asian Equity Plus Fund
Class I 5,854,584 2,392,911 (2,913,341) 5,334,154
Class I (Dist) 60,799,953 5,717,819 (11,095,512) 55,422,260
Class I GBP 2,500 - (2,500) -
Class III (Dist) 4,260,891 3,656,829 (2,015,800) 5,901,920
Class III 22,291 960,345 (119,479) 863,157
GBP III Hedged (Dist) 686,851 50,736 (247,526) 490,061
First State Asian Bond Fund
Class I (Dist) 1,851,775 1,258,362 (867,683) 2,242,454
First State Asian Quality Bond Fund
Class I 31,044,620 146,148,776 (147,671,364) 29,522,032
Class I (Monthly Dist) 1,208,604 12,785,358 (3,328,998) 10,664,964
Class I (HKD Monthly Dist) 845,244 5,595,175 (1,942,186) 4,498,233
Class III - 1,204,155 (37,486) 1,166,669
Class VI (Dist) - 150 - 150
Stewart Investors Global Emerging
Markets Leaders Fund
Class I 8,474,331 682,735 (3,029,438) 6,127,628
Class III 31,676,144 2,999,445 (1,758,479) 32,917,110
Class IV 807,165 178,647 (204,726) 781,086
First State Global Resources Fund
Class I 8,483,981 9,589,390 (3,531,139) 14,542,232
Class III 576,188 1,306,337 (65,912) 1,816,613
Class IV 994,624 603,800 (610,142) 988,282
First State Global Property Securities
Fund
Class I 1,139,291 5,563,534 (5,279,375) 1,423,450
Class VI (Dist) 74,697 8,311 (74,697) 8,311

First State Global Umbrella Fund PLC
Notes forming part of the financial statements for the year ended
31 December 2017 (continued)
359
7. Incorporation and share capital (continued)
* The First State Global Agribusiness Fund terminated on 8 November 2016.
At 31 Dec
2015
Shares
issued
Shares
redeemed
At 31 Dec
2016
First State Asian Property Securities
Fund
Class I 106,941 468 (468) 106,941
Class I (Dist) 2,089,032 99,531 (289,680) 1,898,883
First State China Focus Fund
Class I 17,368,096 4,961,343 (6,918,955) 15,410,484
Class III 3,474,202 9,426 (3,453,074) 30,554
Class IV 3,099,199 1,390,057 (834,697) 3,654,559
First State Global Listed
Infrastructure Fund
Class III 5,180,415 1,111,237 (2,414,494) 3,877,158
Class I (Dist) 4,015,928 6,733,611 (3,854,969) 6,894,570
Class VI 1,722,259 9,989,488 (699,310) 11,012,437
Class VI (Dist) 9,861 1,569,279 (84,628) 1,494,512
Class I - 741,830 - 741,830
Class I EUR - 31,605 - 31,605
Class VI GBP (Dist) - 701,495 (34,975) 666,520
Class VI EUR - 1,270,526 (11,015) 1,259,511
First State Asia Pacific Select Fund
Class I 28,138 2,010 (29,548) 600
Class III 6,732,910 13,256 (411,777) 6,334,389
First State Global Agribusiness Fund*
Class I 1,421,760 138,400 (1,560,160) -
Stewart Investors Worldwide Equity
Fund
Class I 170,132 55,275 (7,611) 217,796
Class III 1,832,293 71,160 (172,355) 1,731,098

First State Global Umbrella Fund PLC
Notes forming part of the financial statements for the year ended
31 December 2017 (continued)
360
7. Incorporation and share capital (continued)
8. Risk arising from financial instruments
The Company’s investment objective is to seek capital growth and/or dividend income from a portfolio
of securities in respect of the Funds. The holding of securities and investment activities undertaken
pursuant to this objective involves certain inherent risks. Below is a description of the principal risks
inherent in the Company’s activities along with the actions it has taken to manage these risks.
The Company’s assets and liabilities comprise financial instruments which include:
investments including equity shares, fixed income securities, floating rate securities, investment
funds, warrants, future contracts, forward currency contracts, credit default swaps and interest rate
swaps. These are held in accordance with a Fund’s investment objective and policies; and
cash, liquid resources and short-term debtors and creditors that arise directly from its investment
activities;
At 31 Dec
2015
Shares
issued
Shares
redeemed
At 31 Dec
2016
First State Emerging Markets Bond
Fund
Class I 1,201,241 4,030 (1,202,580) 2,691
Class I (Dist) 1,168,424 1,730 (1,146,449) 23,705
Class I (Monthly Dist) 1,254 64 - 1,318
Class I (HKD Monthly Dist) 277 14 - 291
Class III - 2,733,110 - 2,733,110
First State Global Credit Income Fund
GBP III Hedged (Dist) 334 9 - 343
Class V 13,964,280 11,774,280 (14,264,280) 11,474,280
First State Asia Pacific All Cap Fund
Class III 5,064,128 212,001 (30,113) 5,246,016
First State Japan Equity Fund*
Class III 1,545,811 113,801 (395) 1,659,217
Class VI EUR - 2,657,900 (219,100) 2,438,800
Class I - 893 - 893
Class III JPY - 1,216,480 - 1,216,480

First State Global Umbrella Fund PLC
Notes forming part of the financial statements for the year ended
31 December 2017 (continued)
361
8. Risk arising from financial instruments (continued)
As an investment fund, the Company buys, sells or holds financial assets and liabilities in order to take
advantage of changes in market prices or rates.
The main risks arising from the Company’s operations are market risk comprising equity price risk,
foreign currency risk, interest rate risk, credit risk and liquidity risk. The Board of Directors review and
agrees policies for managing each of these risks and they are summarised below. These policies have
remained substantially unchanged since the beginning of the financial year to which these Financial
Statements relate.
The Company is also exposed to custody risk. Custody risk is the risk of loss of securities held in custody
occasioned by the insolvency or negligence of the depositary. Although an appropriate legal framework
is in place that seeks to reduce the risk of loss of value of the securities held by the depositary, in the
event of its failure, the ability of the Company to transfer securities might be temporarily impaired.
The Depositary is under a duty to take into custody and to hold the property of each Funds of the Company
on behalf of its shareholders. The Central Bank of Ireland requires the Depositary to hold legally and
separately the non-cash assets of each Funds and to maintain sufficient records to clearly identify the
nature and amount of all assets that it holds, the ownership of each asset and where the documents of title
to such assets are physically located. When the Depositary employs a Sub-Depositary, the Depositary
retains responsibility for the assets of the Funds.
However, it should be noted that not all jurisdictions have the same rules and regulations as Ireland
regarding the custody of assets and the recognition of the interests of a beneficial owner such as a Funds.
Therefore, in such jurisdictions, there is a risk that if a Sub-Depositary becomes bankrupt or insolvent,
the Funds beneficial ownership of the assets held by such Sub-Depositary may not be recognised and
consequently the creditors of the Sub-Depositary may seek to have recourse to the assets of the sub-funds.
In those jurisdictions where the Funds beneficial ownership of its assets is ultimately recognised, the
Funds may suffer delay and cost in recovering those assets. The Funds may invest in markets where
custodial and/or settlement systems are not fully developed, where the assets of a Fund which are traded
in such markets have been entrusted to sub-depositaries, in circumstances where the use of such sub-
depositaries is necessary and may be exposed to risk in circumstances whereby the Depositary will have
no liability.
(a) Equity price risk
Equity price risk is the risk that the fair values of equities or future cash flows of a financial instrument
will fluctuate because of changes in market prices (other than those arising from interest rate risk or
currency risk).
The investments of the Company are subject to market fluctuations and the risks inherent in investment
in international securities markets and there can be no assurances that appreciation will occur. It is the
policy of the Investment Manager to maintain a diversified portfolio of investments for each Fund so as
to minimise risk.

First State Global Umbrella Fund PLC
Notes forming part of the financial statements for the year ended
31 December 2017 (continued)
362
8. Risk arising from financial instruments (continued)
(a) Equity price risk (continued)
The Company strives to invest in strong businesses with quality management and at sensible prices. The
Company’s preferred strategy is to hold equity investments for the medium-to-long term. The Investment
Manager is therefore not concerned by short-term equity price volatility with respect to its investments
provided that the underlying business, economic and management characteristics of its investments
remains favourable.
The carrying values of investments subject to equity price risk are, in almost all instances, based on
quoted market prices as of the Statement of Financial Position dates. Market prices are subject to
fluctuation and, consequently, the amount realised in the subsequent sale of an investment may
significantly differ from the reported market value. Fluctuation in the market price of a security may
result from perceived changes in the underlying economic characteristics of the investment, the relative
price of alternative investments and general market conditions. Furthermore, amounts realised in the sale
of a particular security may be affected by the relative quantity of the security being sold.
The Investment Manager manages the exposure to equity price risk by constructing a diversified portfolio
from which it expects the underlying companies it invests in to perform differently in reaction to different
risk influences. The Investment Manager monitors the equity price risk in a Fund’s portfolio through both
the volatility of the underlying holdings and their combined volatility. The Investment Manager expects
portfolios to carry a certain level of equity price risk and uses such risk measurement to highlight
unintended risks in the portfolio.
The investment concentrations within the portfolio for each Fund are disclosed in the schedule of
investments by investment type. The following table summarises the effect on the net assets attributable
to redeemable participating shareholders for equity funds, as at 31 December 2017 and 31 December
2016 of a reasonably possible change in the benchmark as applied to the respective beta reported by
Lipper and Barra Enterprise Performance.
The reasonably possible change in the benchmark has been determined by using the last five year
annualised benchmark returns. Where a Fund has a history of less than one year, since inception,
benchmark returns and beta will be used for calculation.
Also, the five year annualised benchmark returns and beta are not available for some of the Funds,
therefore, one and three year data has been applied for calculation. For the First State Asia Pacific All
Cap Fund the hypothetical change in the benchmark has been determined by using the 3 year benchmark
return and beta for calculations. For the First State Japan Equity Fund the hypothetical change in the
benchmark has been determined by using the 1 year benchmark return and the beta for calculations.
The performance of the equity Funds below does not necessarily follow the relevant benchmark and the
holdings of the Funds might be different to the benchmark.

First State Global Umbrella Fund PLC
Notes forming part of the financial statements for the year ended
31 December 2017 (continued)
363
8. Risk arising from financial instruments (continued)
(a) Equity price risk (continued)
The below sensitivity analysis is a relative estimate of risk. Please note that past performance should not
be used as a guide to future performance as future market conditions could vary significantly from those
experienced in the past.
Change in 5
Year
Annualised Benchmark
31 Dec 2017
%
Effect on Net
Asset Value
31 Dec 2017
US$
Change in 5
Year
Annualised Benchmark
31 Dec 2016
%
Effect on Net
Asset Value
31 Dec 2016
US$
Equity Fund
‘000 ‘000
First State Asian Growth Fund + 8.16% 33,013 +5.13% 20,856
First State China Growth Fund +10.12% 371,382 +5.29% 146,342
Stewart Investors Worldwide Leaders Fund + 12.20% 4,075 +10.70% 3,160
First State Hong Kong Growth Fund + 10.08% 15,414 +8.78% 10,995
First State Indian Subcontinent Fund + 12.30% 57,621 +6.78% 17,580
First State Greater China Growth Fund + 10.31% 58,464 +6.90% 28,346
First State Singapore and Malaysia Growth
Fund + 1.39% 565 -1.24% 503
First State Asia Opportunities Fund + 8.16% 2,397 +5.13% 1,257
First State Asian Equity Plus Fund + 7.29% 187,385 +4.98% 98,387
Stewart Investors Global Emerging
Markets Leaders Fund + 4.70% 43,121 +1.64% 11,943
First State Global Resources Fund -2.42% 2,112 -6.30% 7,974
First State Global Property Securities Fund + 4.90% 822 +4.99% 712
First State Asian Property Securities Fund + 3.69% 338 +9.06% 987
First State China Focus Fund + 10.12% 17,186 +5.29% 9,735
First State Global Listed Infrastructure
Fund + 10.66% 51,282 +9.65% 27,383
First State Asia Pacific Select Fund + 3.69% 3,535 +4.98% 3,544
Stewart Investors Worldwide Equity Fund + 11.40% 2,236 +9.96% 1,530
First State Asia Pacific All Cap Fund + 9.99% 6,451 +0.10% 48
First State Japan Equity Fund + 19.75% 7,589 +2.73% 834
First State Sustainable Listed Infrastructure
Fund* + 0.74% 29 - -
An equal change in 5 year annualised benchmark in the opposite direction would have decreased or
increased the net assets attributable to redeemable participating shareholders by an equal but opposite
amount.
*The First State Sustainable Listed Infrastructure Fund launched on 20 December 2017.

First State Global Umbrella Fund PLC
Notes forming part of the financial statements for the year ended
31 December 2017 (continued)
364
8. Risk arising from financial instruments (continued)
(a) Equity price risk (continued)
The Company may employ investment techniques and instruments including but not limited to futures,
forward contracts, options, interest rate swaps, contracts for difference and credit default swaps for the
efficient portfolio management purposes. Efficient portfolio management means investment decisions
involving transactions that are entered into for one or more of the following specific aims: the reduction
of risk; the reduction of cost; or the generation of additional capital or income for the Funds with an
appropriate level of risk, taking into account the risk profile of the Funds. Only the First State Global
Credit Income Fund may invest in financial derivative instruments for investment purposes.
Details of the Company’s investment portfolio and derivatives at the SFP date are disclosed in the
Schedules of Investments.
The Company uses the absolute value at risk (“VaR”) model to calculate the First State Global Credit
Income Fund’s global exposure. The Fund’s global exposure, using the absolute VaR approach, is
calculated on the following basis:
Calculation frequency: Daily
Absolute VaR limit: 20%
Confidence level: 99%
Holding period: 1 month (20 Business Days)
Historical observation period: More than 1 year (250 Business Days). A shorter observation
period may be used if justified by a significant increase in price volatility (example in case of
extreme market conditions)
Quarterly data set updates, or more frequent when market prices are subject to material changes
Model: Enhanced Historical VaR
The below table provides an analysis of the VaR measures and leverage levels for the Company for the
financial year ended 31 December 2017 and 31 December 2016.
First State Global Credit Income Fund
31 December 2017 31 December 2016
VaR as at the financial year end 2.02% 1.47%
Lowest VaR limit utilised during the financial year 0.72% 1.41%
Highest VaR limit utilised during the financial year 2.49% 2.38%
Average VaR limit utilised during the financial year 1.60% 1.91%
Leverage level employed during the financial
year/period 175.30% 172.50%
An inherent limitation of VaR is that it seeks to analyse historical experiences to assess risk. Risk events
may occur that are significantly different to those historically encountered. It may lead to an
underestimation of the loss estimate.
The Company uses the commitment approach to calculate the other Funds’ global exposure to ensure that
the use of financial derivative instruments is within limits specified by the Central Bank of Ireland.

First State Global Umbrella Fund PLC
Notes forming part of the financial statements for the year ended
31 December 2017 (continued)
365
8. Risk arising from financial instruments (continued)
(b) Foreign currency risk
Currency risk is the risk that the fair value of future cash flows of a financial instrument will fluctuate
because of changes in foreign exchange rates.
The Net Asset Value of each Fund is computed in the functional currency of that Fund, whereas the
Fund’s investments may be acquired in other currencies. The value in terms of the functional currency of
the investments of a Fund may rise or fall due to exchange rate fluctuations of individual currencies.
Adverse movements in currency exchange rates can result in a decrease in return and a loss of capital. It
may not be possible or practicable to hedge against the consequent currency risk exposure in all
circumstances. The international nature of a Fund’s investment activities gives rise to a currency risk
which is inherent in the performance relative to its base currency of its non-US Dollar denominated
investments. It is generally not a Fund’s policy to hedge this risk on a continuing basis, but the Fund may
do so from time to time. No foreign currency risk was calculated on Funds terminated during the year.
Monetary assets and liabilities are those fixed by contract or by their nature. They include monetary assets
such as cash, debtors and debt securities, and exist as money or as claims to specified sums of money.
Non-monetary items are assets and liabilities such as equity securities. The foreign exchange exposure
relating to non-monetary assets and liabilities is considered to be a component of market price risk not
foreign currency risk and is therefore not included in the sensitivity analysis below. Currency risk will
only be significant on the fixed income funds which are heavily invested in monetary assets and liabilities.
The First State High Quality Bond Fund and First State Long Term Bond Fund acquire their investments
in the functional currency; all other Funds acquire investments in a range of currencies other than the
functional currency. The following tables set out the total exposure to foreign currency risk in all Funds
with non-US Dollar exposure at 31 December 2017 with comparative figures as at 31 December 2016.
These tables also show the effect of an estimated 5% change in the underlying exchange rates applied
immediately and uniformly across all currencies. In considering this analysis however, it should be noted
that the Investment Manager has not applied this 5% change to the Hong Kong Dollar as this currency is
strongly linked to the US Dollar. Therefore the Investment Manager would expect this currency to move
in line with the US Dollar. The changes in value do not necessarily reflect the best or worst case scenarios
and actual results may differ.
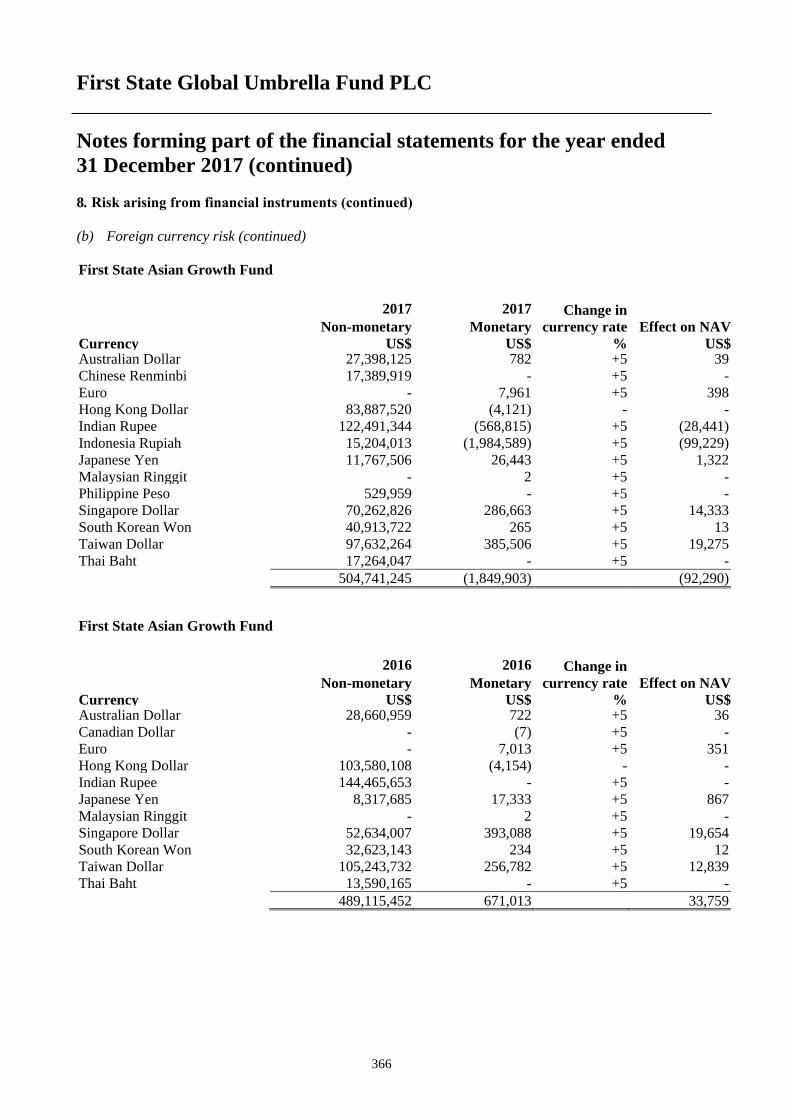
First State Global Umbrella Fund PLC
Notes forming part of the financial statements for the year ended
31 December 2017 (continued)
366
8. Risk arising from financial instruments (continued)
(b) Foreign currency risk (continued)
First State Asian Growth Fund
2017 2017 Change in
currency rate Effect on NAV Non-monetary Monetary
Currency US$ US$ % US$ Australian Dollar 27,398,125 782 +5 39
Chinese Renminbi 17,389,919 - +5 -
Euro - 7,961 +5 398
Hong Kong Dollar 83,887,520 (4,121) - -
Indian Rupee 122,491,344 (568,815) +5 (28,441)
Indonesia Rupiah 15,204,013 (1,984,589) +5 (99,229)
Japanese Yen 11,767,506 26,443 +5 1,322
Malaysian Ringgit - 2 +5 -
Philippine Peso 529,959 - +5 -
Singapore Dollar 70,262,826 286,663 +5 14,333
South Korean Won 40,913,722 265 +5 13
Taiwan Dollar 97,632,264 385,506 +5 19,275
Thai Baht 17,264,047 - +5 -
504,741,245 (1,849,903) (92,290)
First State Asian Growth Fund
2016 2016 Change in
currency rate Effect on NAV Non-monetary Monetary
Currency US$ US$ % US$ Australian Dollar 28,660,959 722 +5 36
Canadian Dollar - (7) +5 -
Euro - 7,013 +5 351
Hong Kong Dollar 103,580,108 (4,154) - -
Indian Rupee 144,465,653 - +5 -
Japanese Yen 8,317,685 17,333 +5 867
Malaysian Ringgit - 2 +5 -
Singapore Dollar 52,634,007 393,088 +5 19,654
South Korean Won 32,623,143 234 +5 12
Taiwan Dollar 105,243,732 256,782 +5 12,839
Thai Baht 13,590,165 - +5 -
489,115,452 671,013 33,759

First State Global Umbrella Fund PLC
Notes forming part of the financial statements for the year ended
31 December 2017 (continued)
367
8. Risk arising from financial instruments (continued)
(b) Foreign currency risk (continued)
First State China Growth Fund
Change in
currency rate Effect on NAV
2017 2017
Non-monetary Monetary
Currency US$ US$ % US$
Chinese Renminbi 1,032,623,314 14,702,837 +5 735,142
Euro - 47,351 +5 2,368
Hong Kong Dollar 3,071,798,900 1,945,704 - -
Japanese Yen 78,847,632 2 +5 -
Singapore Dollar - 3,750 +5 188
Sterling Pound - 4 +5 -
Taiwan Dollar 121,469,433 204,625 +5 10,231
4,304,739,279 16,904,273 747,929
First State China Growth Fund
Change in
currency rate
2016 2016
Effect on NAV Non-monetary Monetary
Currency US$ US$ % US$
Chinese Renminbi 490,070,705 22,090,799 +5 1,104,540
Euro - 41,841 +5 2,092
Hong Kong Dollar 2,548,695,072 893,015 - -
Japanese Yen - 2 +5 -
Singapore Dollar - 3,469 +5 173
Sterling Pound - 4 +5 -
Taiwan Dollar 228,651,242 446,561 +5 22,328
3,267,417,019 23,475,691 1,129,133

First State Global Umbrella Fund PLC
Notes forming part of the financial statements for the year ended
31 December 2017 (continued)
368
8. Risk arising from financial instruments (continued)
(b) Foreign currency risk (continued)
Stewart Investors Worldwide Leaders Fund
Change in
currency rate
Effect on
NAV
2017 2017
Non-monetary Monetary
Currency US$ US$ % US$
Canadian Dollar - 205 +5 10
Danish Krone 1,486,028 - +5 -
Euro 9,190,745 3 +5 -
Hong Kong Dollar - 98 - -
Indian Rupee 5,140,029 - +5 -
Japanese Yen 3,912,043 4,878 +5 244
Malaysian Ringgit - 1 +5 -
Norway Kroner - 14 +5 1
Singapore Dollar 1,647,310 - +5 -
South African Rand 726,494 - +5 -
South Korean Won - 3 +5 -
Sterling Pound 5,004,751 - +5 -
Swiss Franc 2,360,943 - +5 -
Taiwan Dollar - 1 +5 -
29,468,343 5,203 255
Stewart Investors Worldwide Leaders Fund
Change in
currency rate
Effect on
NAV
2016 2016
Non-monetary Monetary
Currency US$ US$ % US$
Brazilian Real 912,242 26,456 +5 1,323
Canadian Dollar - 191 +5 10
Danish Krone 1,215,293 - +5 -
Euro 6,986,320 (11) +5 (1)
Hong Kong Dollar - 99 - -
Indian Rupee 2,526,943 - +5 -
Japanese Yen 3,155,596 4,955 +5 248
Malaysian Ringgit - 1 +5 -
Norway Kroner - 13 +5 1
Polish Zloty 653,181 - +5 -
Singapore Dollar 1,444,923 - +5 -
South African Rand 1,166,351 - +5 -
South Korean Won - 2 +5 -
Sterling Pound 5,141,636 6,739 +5 337
Swiss Franc 2,584,751 - +5 -
Taiwan Dollar - 1 +5 -
25,787,236 38,446 1,918

First State Global Umbrella Fund PLC
Notes forming part of the financial statements for the year ended
31 December 2017 (continued)
369
8. Risk arising from financial instruments (continued)
(b) Foreign currency risk (continued)
First State Hong Kong Growth Fund
Change in
currency rate
Effect on
NAV
2017 2017
Non-monetary Monetary
Currency US$ US$ % US$
Euro - 2,129 +5 106
Hong Kong Dollar 166,595,526 468,688 - -
166,595,526 470,817 - 106
First State Hong Kong Growth Fund
Change in
currency rate
Effect on
NAV
2016 2016
Non-monetary Monetary
Currency US$ US$ % US$
Euro - 1,881 +5 94
Hong Kong Dollar 141,129,921 60,231 - -
141,129,921 62,112 94
First State Indian Subcontinent Fund
Change in
currency rate
Effect on
NAV
2017 2017
Non-monetary Monetary
Currency US$ US$ % US$
Bangladeshi Taka 4,061,938 1,531,133 +5 76,557
Euro - 3,675 +5 184
Indian Rupee 508,183,331 1,883,906 +5 94,195
Pakistani Rupee 9,220,634 - +5 -
Singapore Dollar - 757 +5 38
Sri Lankan Rupee 12,137,628 14,044 +5 702
533,603,531 3,433,515 171,676
First State Indian Subcontinent Fund
Change in
currency rate
Effect on
NAV
2016 2016
Non-monetary Monetary
Currency US$ US$ % US$
Bangladeshi Taka 3,936,501 72,543 +5 3,627
Euro - 3,247 +5 162
Indian Rupee 298,856,229 151,617 +5 7,581
Singapore Dollar - 701 +5 35
Sri Lankan Rupee 5,369,701 - +5 -
308,162,431 228,108 11,405

First State Global Umbrella Fund PLC
Notes forming part of the financial statements for the year ended
31 December 2017 (continued)
370
8. Risk arising from financial instruments (continued)
(b) Foreign currency risk (continued)
First State Global Bond Fund
Change in
currency rate
2017 2017 Effect on
NAV Non-monetary Monetary
Currency US$ US$ % US$
Australian Dollar - 284,513 +5 14,226
Canadian Dollar - 286,439 +5 14,322
Danish Krone - 82,851 +5 4,143
Euro - 5,399,233 +5 269,962
Japanese Yen - 3,398,461 +5 169,923
Malaysian Ringgit - 61,858 +5 3,093
Mexican Peso - 103,943 +5 5,197
Norway Kroner - 39,013 +5 1,951
Polish Zloty - 85,751 +5 4,288
Singapore Dollar - 49,945 +5 2,497
South African Rand - 79,741 +5 3,987
Sterling Pound - 850,088 +5 42,504
Swedish Krona - 63,321 +5 3,166
Swiss Franc - 21,508 +5 1,075
- 10,806,665 540,334
First State Global Bond Fund
Change in
currency rate
2016 2016 Effect on
NAV Non-monetary Monetary
Currency US$ US$ % US$
Australian Dollar - 238,159 +5 11,908
Canadian Dollar - 247,546 +5 12,377
Danish Krone - 78,321 +5 3,916
Euro - 4,786,877 +5 239,344
Japanese Yen - 3,291,157 +5 164,558
Malaysian Ringgit - 54,428 +5 2,721
Mexican Peso - 97,677 +5 4,884
Norway Kroner - 31,420 +5 1,571
Polish Zloty - 65,460 +5 3,273
Singapore Dollar - 43,753 +5 2,188
South African Rand - 66,809 +5 3,340
Sterling Pound - 852,860 +5 42,643
Swedish Krona - 59,380 +5 2,969
Swiss Franc - 25,824 +5 1,291
- 9,939,671 496,983

First State Global Umbrella Fund PLC
Notes forming part of the financial statements for the year ended
31 December 2017 (continued)
371
8. Risk arising from financial instruments (continued)
(b) Foreign currency risk (continued)
First State Greater China Growth Fund
Change in
currency rate
Effect on
NAV
2017 2017
Non-monetary Monetary
Currency US$ US$ % US$
Chinese Renminbi 100,731,352 3,211,201 +5 160,560
Euro - 6,946 +5 347
Hong Kong Dollar 361,623,836 5,205,804 - -
Taiwan Dollar 121,996,334 5,567 +5 278
584,351,522 8,429,518 161,185
First State Greater China Growth Fund
Change in
currency rate
Effect on
NAV
2016 2016
Non-monetary Monetary
Currency US$ US$ % US$
Chinese Renminbi 41,678,057 2,378,419 +5 118,921
Euro - 6,138 +5 307
Hong Kong Dollar 271,411,605 5,247,194 - -
Taiwan Dollar 123,139,145 535,888 +5 26,794
436,228,807 8,167,639 146,022
First State Singapore and Malaysia Growth Fund
Change in
currency rate
Effect on
NAV
2017 2017
Non-monetary Monetary
Currency US$ US$ % US$
Euro - 734 +5 37
Hong Kong Dollar 2,035,966 - - -
Indonesian Rupiah 475,047 - +5 -
Japanese Yen 592,402 2,878 +5 144
Malaysian Ringgit 11,505,165 5,651 +5 283
Singapore Dollar 28,721,231 68,699 +5 3,435
Thai Baht 2,859,970 - +5 -
46,189,781 77,962 3,899

First State Global Umbrella Fund PLC
Notes forming part of the financial statements for the year ended
31 December 2017 (continued)
372
8. Risk arising from financial instruments (continued)
(b)Foreign currency risk (continued)
First State Singapore and Malaysia Growth Fund
Change in
currency rate
Effect on
NAV
2016 2016
Non-monetary Monetary
Currency US$ US$ % US$
Euro - 649 +5 32
Hong Kong Dollar 2,297,429 - - -
Indonesian Rupiah 478,495 - +5 -
Japanese Yen 901,964 348,848 +5 17,442
Malaysian Ringgit 9,955,542 15,691 +5 785
Singapore Dollar 27,813,263 54,769 +5 2,738
Thai Baht 3,013,280 - +5 -
44,459,973 419,957 20,997
First State Asia Opportunities Fund
Change in
currency rate
Effect on
NAV
2017 2017
Non-monetary Monetary
Currency US$ US$ % US$
Australian Dollar 3,785,423 - +5 -
Chinese Renminbi 1,246,042 - +5 -
Euro - 373 +5 19
Hong Kong Dollar 6,852,272 1 - -
Indian Rupee 8,358,419 - +5 -
Indonesian Rupiah 1,404,660 1 +5 -
Malaysian Ringgit - 1 +5 -
Philippine Peso 979,488 - +5 -
Singapore Dollar 4,286,896 11,093 +5 555
South Korean Won 2,616,942 191 +5 10
Sri Lankan Rupee 809,789 2,216 +5 111
Sterling Pound - 15 +5 1
Taiwan Dollar 6,394,245 10,408 +5 520
Thai Baht 1,494,113 - +5 -
Vietnamese Dong 413,812 - +5 -
38,642,101 24,299 1,216

First State Global Umbrella Fund PLC
Notes forming part of the financial statements for the year ended
31 December 2017 (continued)
373
8. Risk arising from financial instruments (continued)
(b) Foreign currency risk (continued)
First State Asia Opportunities Fund
Change in
currency rate
Effect on
NAV
2016 2016
Non-monetary Monetary
Currency US$ US$ % US$
Australian Dollar 2,709,114 - +5 -
Euro - 388 +5 19
Hong Kong Dollar 7,434,851 1 - -
Indian Rupee 7,188,291 2 +5 -
Indonesian Rupiah 534,657 1 +5 -
Malaysian Ringgit - 1 +5 -
Philippine Peso 356,747 - +5 -
Singapore Dollar 4,058,800 24,587 +5 1,229
South Korean Won 2,374,094 169 +5 8
Sri Lankan Rupee 181,735 - +5 -
Sterling Pound - 14 +5 1
Taiwan Dollar 5,442,122 3,142 +5 157
Thai Baht 938,829 - +5 -
Vietnamese Dong 178,833 - +5 -
31,398,073 28,305 1,414
First State Asian Equity Plus Fund
Change in
currency rate
Effect on
NAV
2017 2017
Non-monetary Monetary
Currency US$ US$ % US$
Australian Dollar 242,936,716 2,464 +5 123
Chinese Renminbi 204,173,949 3,009,956 +5 150,498
Euro - 35,644 +5 1,782
Hong Kong Dollar 574,579,073 6,335,233 - -
Indian Rupee 562,675,137 (4,778,172) +5 (238,909)
Indonesian Rupiah 74,066,050 7 +5 -
Japanese Yen 264,724,837 83,573 +5 4,179
Malaysian Ringgit 30,872,703 - +5 -
Philippine Peso 207,966,753 65,031 +5 3,252
Singapore Dollar 146,792,897 - +5 -
South Korean Won 291,084,316 279 +5 14
Sterling Pound - 2,883,754 +5 144,188
Taiwan Dollar 366,605,739 45,434 +5 2,272
Thai Baht 106,484,645 - +5 -
3,072,962,815 7,683,203 67,399

First State Global Umbrella Fund PLC
Notes forming part of the financial statements for the year ended
31 December 2017 (continued)
374
8. Risk arising from financial instruments (continued)
(b)Foreign currency risk (continued)
First State Asian Equity Plus Fund
Change in
currency rate
Effect on
NAV
2016 2016
Non-monetary Monetary
Currency US$ US$ % US$
Australian Dollar 235,553,724 2,278 +5 114
Chinese Renminbi 33,633,113 691,765 +5 34,588
Euro - 31,496 +5 1,575
Hong Kong Dollar 417,501,637 2,231 - -
Indian Rupee 482,732,680 4,280,388 +5 214,019
Indonesian Rupiah - 7 +5 -
Japanese Yen 149,980,700 102,989 +5 5,149
Malaysian Ringgit 20,970,193 - +5 -
Philippine Peso 168,299,811 - +5 -
Singapore Dollar 154,652,925 532,246 +5 26,612
South Korean Won 254,996,057 234 +5 12
Sterling Pound - 3,930,148 +5 196,507
Taiwan Dollar 370,475,454 215,584 +5 10,779
Thai Baht 104,503,594 - +5 -
2,393,299,888 9,789,366 489,355
First State Asian Bond Fund
Change in
currency rate
Effect on
NAV
2017 2017
Non-monetary Monetary
Currency US$ US$ % US$
Australian Dollar - 181,832 +5 9,092
Chinese Renminbi - 1,262,769 +5 63,138
Euro - 226 +5 11
Indonesian Rupiah - 154,772 +5 7,739
Malaysian Ringgit - 124,745 +5 6,237
Turkish Lira - 153,510 +5 7,676
- 1,877,854 93,893

First State Global Umbrella Fund PLC
Notes forming part of the financial statements for the year ended
31 December 2017 (continued)
375
8. Risk arising from financial instruments (continued)
(b) Foreign currency risk (continued)
First State Asian Bond Fund
Change in
currency rate
Effect on
NAV
2016 2016
Non-monetary Monetary
Currency US$ US$ % US$
Chinese Renminbi - 462,768 +5 23,138
Euro - 200 +5 10
Indian Rupee - 216,423 +5 10,821
Indonesian Rupiah - 371,919 +5 18,596
Malaysian Ringgit - 112,270 +5 5,614
Singapore Dollar - 69,254 +5 3,463
Thai Baht - 28 +5 1
- 1,232,862 61,643
First State Asian Quality Bond Fund
Change in
currency rate
Effect on
NAV
2017 2017
Non-monetary Monetary
Currency US$ US$ % US$
Australian Dollar - 4,720,565 +5 236,028
Chinese Renminbi - 13,051,484 +5 652,574
Hong Kong Dollar - 603,348 - -
Indonesian Rupiah - 3,250,220 +5 162,511
Malaysian Ringgit - 3,742,335 +5 187,117
- 25,367,952 1,238,230
First State Asian Quality Bond Fund
Change in
currency rate
Effect on
NAV
2016 2016
Non-monetary Monetary
Currency US$ US$ % US$
Chinese Renminbi - 12,882,710 +5 644,136
Hong Kong Dollar - (310,430) - -
Indian Rupee - 7,220,908 +5 361,045
Indonesian Rupiah - 12,899,242 +5 644,962
Malaysian Ringgit - 3,368,106 +5 168,405
Thai Baht - 28 +5 1
- 36,060,564 1,818,549

First State Global Umbrella Fund PLC
Notes forming part of the financial statements for the year ended
31 December 2017 (continued)
376
8. Risk arising from financial instruments (continued)
(b) Foreign currency risk (continued)
Stewart Investors Global Emerging Markets Leaders Fund
Change in
currency rate
Effect on
NAV
2017 2017
Non-monetary Monetary
Currency US$ US$ % US$
Australian Dollar 44,947,406 - +5 -
Brazilian Real 60,556,654 378,789 +5 18,939
Chilean Pesos 52,339,604 2,071 +5 104
Czech Koruna - 45 +5 2
Euro 23,574,550 20 +5 1
Hong Kong Dollar 73,487,134 100 - -
Indian Rupee 351,191,957 58,844 +5 2,942
Indonesian Rupiah - 5 +5 -
Malaysian Ringgit 41,976,401 661,843 +5 33,092
Mexican Peso 10,679,726 1 +5 -
Nigerian Niara 22,867,532 - +5 -
Philippine Peso 7,441,154 - +5 -
Polish Zloty 26,175,992 1 +5 -
South African Rand 152,560,279 - +5 -
South Korean Won 24,950,881 780 +5 39
Sterling Pound 94,087,615 2 +5 -
Taiwan Dollar 155,740,832 36,226 +5 1,811
Turkish Lira 25,235,041 - +5 -
1,167,812,758 1,138,727 56,930

First State Global Umbrella Fund PLC
Notes forming part of the financial statements for the year ended
31 December 2017 (continued)
377
8. Risk arising from financial instruments (continued)
(b) Foreign currency risk (continued)
Stewart Investors Global Emerging Markets Leaders Fund
Change in
currency rate
Effect on
NAV
2016 2016
Non-monetary Monetary
Currency US$ US$ % US$
Australian Dollar 9,392,354 - +5 -
Brazilian Real 87,376,678 1,179,360 +5 58,968
Chilean Pesos 48,835,499 - +5 -
Czech Koruna - 37 +5 2
Euro 16,668,616 - +5 -
Hong Kong Dollar 83,102,473 101 - -
Indian Rupee 254,552,930 610,588 +5 30,529
Indonesian Rupiah - 5 +5 -
Israeli Shekel - 1,540 +5 77
Japanese Yen 15,672,104 41,515 +5 2,076
Malaysian Ringgit 12,151,594 (1,453,615) +5 (72,681)
Mexican Peso - 95 +5 5
Nigerian Niara 11,340,040 14,642 +5 732
Philippine Peso - 6 +5 -
Polish Zloty 29,752,252 - +5 -
South African Rand 105,878,419 - +5 -
South Korean Won 14,267,848 686 +5 34
Sterling Pound 112,270,491 2 +5 -
Swiss Franc - - +5 -
Taiwan Dollar 97,763,968 33,220 +5 1,661
Thai Baht - - +5 -
Turkish Lira 34,451,868 - +5 -
933,477,134 428,182 21,403
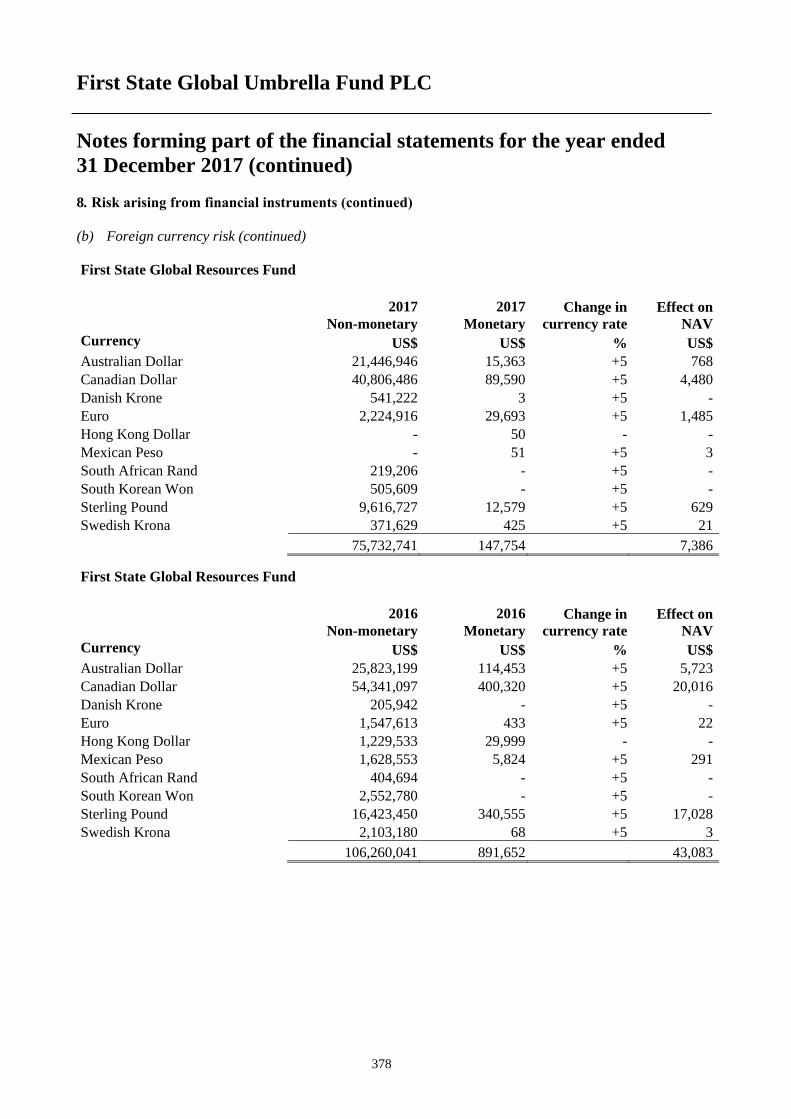
First State Global Umbrella Fund PLC
Notes forming part of the financial statements for the year ended
31 December 2017 (continued)
378
8. Risk arising from financial instruments (continued)
(b) Foreign currency risk (continued)
First State Global Resources Fund
Change in
currency rate
Effect on
NAV
2017 2017
Non-monetary Monetary
Currency US$ US$ % US$
Australian Dollar 21,446,946 15,363 +5 768
Canadian Dollar 40,806,486 89,590 +5 4,480
Danish Krone 541,222 3 +5 -
Euro 2,224,916 29,693 +5 1,485
Hong Kong Dollar - 50 - -
Mexican Peso - 51 +5 3
South African Rand 219,206 - +5 -
South Korean Won 505,609 - +5 -
Sterling Pound 9,616,727 12,579 +5 629
Swedish Krona 371,629 425 +5 21
75,732,741 147,754 7,386 First State Global Resources Fund
Change in
currency rate
Effect on
NAV
2016 2016
Non-monetary Monetary
Currency US$ US$ % US$
Australian Dollar 25,823,199 114,453 +5 5,723
Canadian Dollar 54,341,097 400,320 +5 20,016
Danish Krone 205,942 - +5 -
Euro 1,547,613 433 +5 22
Hong Kong Dollar 1,229,533 29,999 - -
Mexican Peso 1,628,553 5,824 +5 291
South African Rand 404,694 - +5 -
South Korean Won 2,552,780 - +5 -
Sterling Pound 16,423,450 340,555 +5 17,028
Swedish Krona 2,103,180 68 +5 3
106,260,041 891,652 43,083

First State Global Umbrella Fund PLC
Notes forming part of the financial statements for the year ended
31 December 2017 (continued)
379
8. Risk arising from financial instruments (continued)
(b) Foreign currency risk (continued)
First State Global Property Securities Fund
Change in
currency rate
Effect on
NAV
2017 2017
Non-monetary Monetary
Currency US$ US$ % US$
Australian Dollar 1,172,549 72,308 +5 3,615
Canadian Dollar 778,469 75,093 +5 3,755
Euro 1,113,058 35,162 +5 1,758
Hong Kong Dollar 1,722,323 32,864 - -
Japanese Yen 2,364,389 42,294 +5 2,115
Mexican Peso - 789 +5 39
Singapore Dollar 182,035 30,708 +5 1,535
Sterling Pound 1,405,475 43,654 +5 2,183
8,738,298 332,872 15,000
First State Global Property Securities Fund
Change in
currency rate
Effect on
NAV
2016 2016
Non-monetary Monetary
Currency US$ US$ % US$
Australian Dollar 1,894,223 36,802 +5 1,840
Canadian Dollar 182,566 4,668 +5 233
Euro 849,057 9,394 +5 470
Hong Kong Dollar 306,355 563 - -
Japanese Yen 1,546,444 31,807 +5 1,590
Mexican Peso - 750 +5 38
Singapore Dollar 892,017 24,785 +5 1,239
Sterling Pound 1,635,299 18,642 +5 932
7,305,961 127,411 6,342

First State Global Umbrella Fund PLC
Notes forming part of the financial statements for the year ended
31 December 2017 (continued)
380
8. Risk arising from financial instruments (continued)
(b) Foreign currency risk (continued)
First State Asian Property Securities Fund
Change in
currency rate
Effect on
NAV
2017 2017
Non-monetary Monetary
Currency US$ US$ % US$
Australian Dollar 2,387,506 26,177 +5 1,309
Euro - 174 +5 9
Hong Kong Dollar 2,910,662 1,373 - -
Japanese Yen 4,117,822 28,271 +5 1,414
Singapore Dollar 433,451 1,297 +5 65
Sterling Pound - 136 +5 7
9,849,441 57,428 2,804
First State Asian Property Securities Fund
Change in
currency rate
Effect on
NAV
2016 2016
Non-monetary Monetary
Currency US$ US$ % US$
Australian Dollar 2,678,819 28,160 +5 1,408
Euro - 153 +5 8
Hong Kong Dollar 2,640,958 45,420 - -
Japanese Yen 5,012,328 54,093 +5 2,705
Singapore Dollar 915,085 13,090 +5 655
Sterling Pound - 124 +5 6
11,247,190 141,040 4,782
First State China Focus Fund
Change in
currency rate
Effect on
NAV
2017 2017
Non-monetary Monetary
Currency US$ US$ % US$
Chinese Renminbi 20,517,632 15,074 +5 754
Euro - 2,916 +5 146
Hong Kong Dollar 169,112,380 (27,952) - -
Sterling Pound - 154 +5 8
Taiwan Dollar 9,621,005 5,469 +5 273
199,251,017 (4,339) 1,181

First State Global Umbrella Fund PLC
Notes forming part of the financial statements for the year ended
31 December 2017 (continued)
381
8. Risk arising from financial instruments (continued)
(b) Foreign currency risk (continued)
First State China Focus Fund
Change in
currency rate
Effect on
NAV
2016 2016
Non-monetary Monetary
Currency US$ US$ % US$
Chinese Renminbi 16,562,585 - +5 -
Euro - 2,576 +5 129
Hong Kong Dollar 168,536,310 (28,174) - -
Singapore Dollar 4,823,408 - +5 -
Sterling Pound - 141 +5 7
Taiwan Dollar 14,058,851 5,015 +5 251
203,981,154 (20,442) 387
First State Global Listed Infrastructure Fund
Change in
currency rate
Effect on
NAV
2017 2017
Non-monetary Monetary
Currency US$ US$ % US$
Australian Dollar 31,787,204 109,656 +5 5,483
Brazilian Real 16,345,105 - +5 -
Canadian Dollar 31,306,733 134,963 +5 6,748
Euro 55,017,507 2,099,912 +5 104,996
Hong Kong Dollar 36,707,255 75,184 - -
Japanese Yen 46,105,791 7,570 +5 379
Mexican Peso 2,146,368 75,372 +5 3,769
New Zealand Dollar - 709 +5 35
Sterling Pound 52,717,534 2,126,266 +5 106,313
Swiss Franc - 81 +5 4
272,133,497 4,629,713 227,727

First State Global Umbrella Fund PLC
Notes forming part of the financial statements for the year ended
31 December 2017 (continued)
382
8. Risk arising from financial instruments (continued)
(b)Foreign currency risk (continued)
First State Global Listed Infrastructure Fund
Change in
currency rate
Effect on
NAV
2016 2016
Non-monetary Monetary
Currency US$ US$ % US$
Australian Dollar 19,232,370 349,078 +5 17,454
Brazilian Real 7,448,687 - +5 -
Canadian Dollar 10,247,978 155,061 +5 7,753
Euro 44,308,515 2,201,222 +5 110,061
Hong Kong Dollar 20,630,567 130,137 - -
Japanese Yen 22,261,627 92,255 +5 4,613
Mexican Peso 2,998,955 46,593 +5 2,330
New Zealand Dollar - 693 +5 35
Sterling Pound 23,727,042 4,191,550 +5 209,578
Swiss Franc - 78 +5 4
150,855,741 7,166,667 351,828
First State Asia Pacific Select Fund
Change in
currency rate
Effect on
NAV
2017 2017
Non-monetary Monetary
Currency US$ US$ % US$
Australian Dollar 9,391,408 - +5 -
Chinese Renminbi 7,348,080 - +5 -
Euro - 1,276 +5 64
Hong Kong Dollar 19,753,005 515,186 - -
Indian Rupee 21,065,652 (203,868) +5 (10,193)
Indonesian Rupiah 3,231,561 - +5 -
Japanese Yen 14,352,736 10,666 +5 533
Malaysian Ringgit 1,189,703 11 +5 1
Philippine Peso 7,882,079 2,661 +5 133
Singapore Dollar 5,479,066 7 +5 -
South Korean Won 11,655,895 - +5 -
Taiwan Dollar 13,841,425 182 +5 9
Thai Baht 3,082,518 - +5 -
118,273,128 326,121 (9,453)

First State Global Umbrella Fund PLC
Notes forming part of the financial statements for the year ended
31 December 2016 (continued)
383
8. Risk arising from financial instruments (continued)
(b) Foreign currency risk (continued)
First State Asia Pacific Select Fund
Change in
currency rate
Effect on
NAV
2016 2016
Non-monetary Monetary
Currency US$ US$ % US$
Australian Dollar 9,517,415 - +5 -
Chinese Renminbi 433,534 - +5 -
Euro - 1,128 +5 56
Hong Kong Dollar 14,834,176 - - -
Indian Rupee 16,509,293 148,481 +5 7,424
Indonesian Rupiah - - +5 -
Japanese Yen 5,533,775 3,540 +5 177
Malaysian Ringgit 889,730 9 +5 -
Philippine Peso 5,863,750 - +5 -
Singapore Dollar 4,562,776 19,150 +5 958
South Korean Won 9,081,131 - +5 -
Taiwan Dollar 12,698,432 167 +5 8
Thai Baht 3,084,853 - +5 -
83,008,865 172,475 8,623

First State Global Umbrella Fund PLC
Notes forming part of the financial statements for the year ended
31 December 2017 (continued)
384
8. Risk arising from financial instruments (continued)
(b) Foreign currency risk (continued)
Stewart Investors Worldwide Equity Fund
Change in
currency rate
Effect on
NAV
2017 2017
Non-monetary Monetary
Currency US$ US$ % US$
Australian Dollar 627,363 - +5 -
Brazilian Real 444,992 2,448 +5 122
Chilean Pesos 797,673 - +5 -
Euro 5,287,843 - +5 -
Hong Kong Dollar 500,304 6,142 - -
Indian Rupee 2,087,086 - +5 -
Japanese Yen 1,677,269 69,639 +5 3,482
Nigerian Niara 172,052 - +5 -
Singapore Dollar 1,238,416 1,003,618 +5 50,181
South African Rand 1,198,926 - +5 -
Sterling Pound 4,065,780 1,259,268 +5 62,963
Swiss Franc 676,720 - +5 -
Taiwan Dollar 494,199 - +5 -
19,268,623 2,341,115 116,748
Stewart Investors Worldwide Equity Fund
Change in
currency rate
Effect on
NAV
2016 2016
Non-monetary Monetary
Currency US$ US$ % US$
Australian Dollar 295,278 - +5 -
Brazilian Real 530,445 2,511 +5 126
Chilean Pesos 1,064,779 - +5 -
Danish Krone 384,003 - +5 -
Euro 4,436,013 316 +5 16
Hong Kong Dollar 526,433 12 - -
Indian Rupee 1,586,270 - +5 -
Japanese Yen 1,190,236 2,030 +5 102
Malaysian Ringgit 226,389 - +5 -
Nigerian Niara 115,322 - +5 -
Norway Kroner 155,788 - +5 -
Singapore Dollar 624,675 - +5 -
South African Rand 541,464 - +5 -
Sterling Pound 4,456,843 2,251,872 +5 112,594
Swiss Franc 1,246,167 63 +5 3
17,380,105 2,256,804 112,841
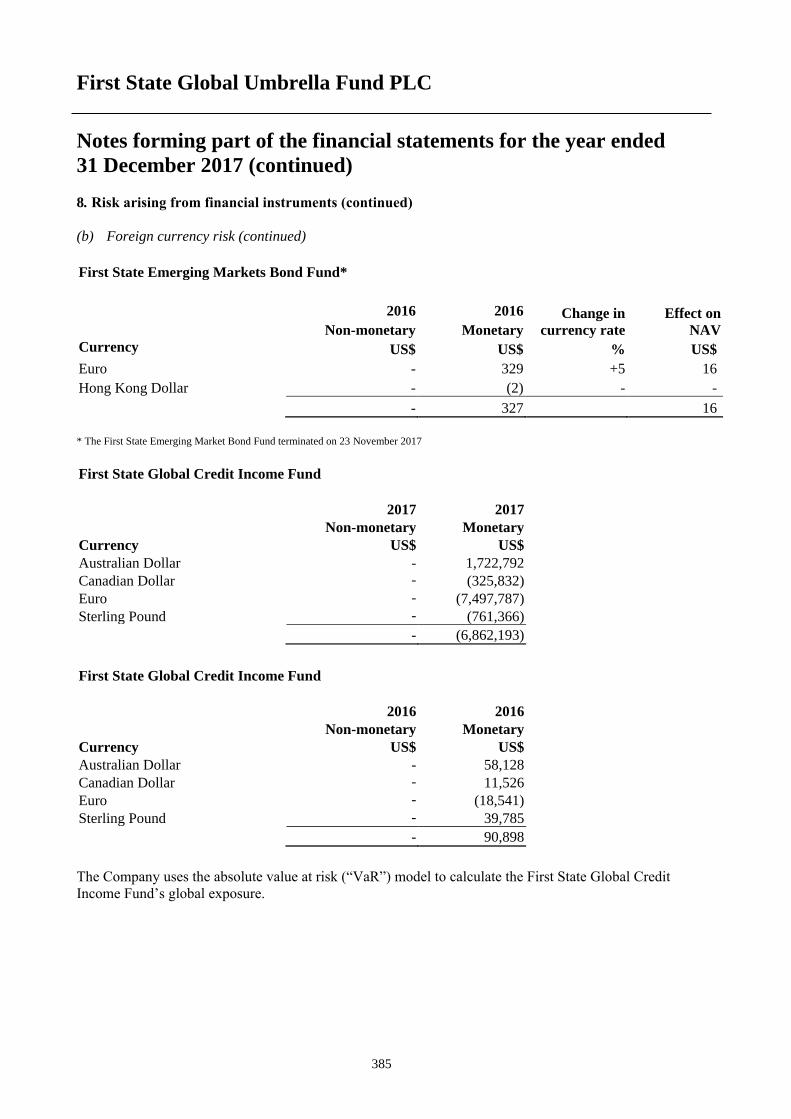
First State Global Umbrella Fund PLC
Notes forming part of the financial statements for the year ended
31 December 2017 (continued)
385
8. Risk arising from financial instruments (continued)
(b) Foreign currency risk (continued)
* The First State Emerging Market Bond Fund terminated on 23 November 2017
The Company uses the absolute value at risk (“VaR”) model to calculate the First State Global Credit
Income Fund’s global exposure.
First State Emerging Markets Bond Fund*
Change in
currency rate
Effect on
NAV
2016 2016
Non-monetary Monetary
Currency US$ US$ % US$
Euro - 329 +5 16
Hong Kong Dollar - (2) - -
- 327 16
First State Global Credit Income Fund
2017 2017
Non-monetary Monetary
Currency US$ US$
Australian Dollar - 1,722,792
Canadian Dollar - (325,832)
Euro - (7,497,787)
Sterling Pound - (761,366)
- (6,862,193)
First State Global Credit Income Fund
2016 2016
Non-monetary Monetary
Currency US$ US$
Australian Dollar - 58,128
Canadian Dollar - 11,526
Euro - (18,541)
Sterling Pound - 39,785
- 90,898

First State Global Umbrella Fund PLC
Notes forming part of the financial statements for the year ended
31 December 2017 (continued)
386
8. Risk arising from financial instruments (continued)
(b) Foreign currency risk (continued)
First State Asia Pacific All Cap Fund
Change in
currency rate
Effect on
NAV
2017 2017
Non-monetary Monetary
Currency US$ US$ % US$
Australian Dollar 5,182,596 - +5 -
Bangladeshi Taka 1,043,652 12 +5 1
Chinese Renminbi 2,739,015 - +5 -
Euro - 819 +5 41
Hong Kong Dollar 16,050,101 - - -
Indian Rupee 10,546,473 82,490 +5 4,125
Indonesian Rupiah 3,337,419 1 +5 -
Japanese Yen 5,605,670 13 +5 1
Philippine Peso 7,115,324 1,654 +5 83
Singapore Dollar 3,122,923 407 +5 20
South Korean Won 9,522,593 12,476 +5 624
Sri Lankan Rupee 3,170,793 - +5 -
Taiwan Dollar 7,965,173 591 +5 30
Thai Baht 939,426 - +5 -
Vietnamese Dong 2,236,798 - +5 -
78,577,956 98,463 4,925
First State Asia Pacific All Cap Fund
Change in
currency rate
Effect on
NAV
2016 2016
Non-monetary Monetary
Currency US$ US$ % US$
Australian Dollar 5,345,238 - +5 -
Bangladeshi Taka 474,155 - +5 -
Chinese Renminbi 248,556 - +5 -
Euro - 720 +5 36
Hong Kong Dollar 13,515,394 - - -
Indian Rupee 7,054,063 (756) +5 (38)
Indonesian Rupiah 1,533,746 1 +5 -
Japanese Yen 4,290,138 2,247 +5 112
Philippine Peso 5,310,832 - +5 -
Singapore Dollar 1,968,969 376 +5 19
South Korean Won 6,938,441 4,236 +5 212
Sri Lankan Rupee 998,965 - +5 -
Taiwan Dollar 8,113,216 1,793 +5 90
Thai Baht 1,605,337 - +5 -
Vietnamese Dong 577,866 235,463 +5 11,773
57,974,916 244,080 12,204

First State Global Umbrella Fund PLC
Notes forming part of the financial statements for the year ended
31 December 2017 (continued)
387
8. Risk arising from financial instruments (continued)
(b) Foreign currency risk (continued)
First State Japan Equity Fund
Change in
currency rate
Effect on
NAV
2017 2017
Non-monetary Monetary
Currency US$ US$ % US$
Euro - (572,198) +5 (28,610)
Japanese Yen 82,472,221 99,632 +5 4,982
82,472,221 (472,566) (23,628)
First State Japan Equity Fund
Change in
currency rate
Effect on
NAV
2016 2016
Non-monetary Monetary
Currency US$ US$ % US$
Euro - (5,724) +5 (286)
Japanese Yen 54,627,699 80,773 +5 4,039
54,627,699 75,049 3,753
*The First State Sustainable Listed Infrastructure Fund launched on 20 December 2017.
(c) Interest rate risk
Interest rate risk arises from the effects of fluctuations in the prevailing levels of markets interest rates
on the fair value of financial assets and liabilities and future cash flow.
Any cash and cash equivalents, time deposits and bank overdrafts held by the Funds are held in the short
term market rates and therefore are not exposed to significant amounts of interest rate risk. The majority
of the assets of the Funds are equity shares which neither pay interest nor have a maturity date apart from
the bond funds: First State Global Bond Fund, First State High Quality Bond Fund, First State Long Term
Bond Fund, First State Asian Bond Fund, First State Asian Quality Bond Fund and First State Global
Credit Income Fund
First State Sustainable Listed Infrastructure Fund*
Change in
currency rate
Effect on
NAV
2017 2017
Non-monetary Monetary
Currency US$ US$ % US$
Australian Dollar 245,863 4,807 +5 240
Canadian Dollar 206,135 850 +5 43
Euro 491,809 83,114 +5 4,156
Hong Kong Dollar 315,433 (2,102) - -
Japanese Yen 393,948 605 +5 30
Mexican Peso 23,359 25 +5 1
Sterling Pound 414,527 79,616 +5 3,981
2,091,074 166,915 +5 8,451

First State Global Umbrella Fund PLC
Notes forming part of the financial statements for the year ended
31 December 2017 (continued)
388
8. Risk arising from financial instruments (continued)
(c) Interest rate risk (continued)
The fair values of the Company’s fixed income investments will fluctuate in response to changes in
market interest rates. Increases and decreases in prevailing interest rates generally translate into decreases
and increases in fair values of those instruments. Additionally fair values of interest rate sensitive
instruments may be affected by the creditworthiness of the issuer, prepayment options, relative values of
alternative investments, the liquidity of the instrument and other general market conditions. Fixed interest
rate investments may be more sensitive to interest rate changes than variable rate investments.
The Company’s strategy is to acquire fixed income securities that are attractively priced in relation to the
perceived credit risk. The Investment Manager recognises and accepts that losses may occur. In the
financial years ended 31 December 2017 and 31 December 2016 the Company utilised derivative
products such as interest rate swaps in First State Global Credit Income Fund to manage interest rate risks
on a limited basis.
The Investment Manager mitigates interest rate risk by constructing a diversified portfolio of fixed
income securities with differing modified duration and term to maturity characteristics, which acts to
reduce the Funds’ overall exposure to interest rate risk. The Investment Manager constantly monitors its
view of the Funds’ exposure to interest rate risk and makes decisions accordingly about the composition
of the Funds’ portfolio of fixed income securities in order to ensure the interest rate risk in the portfolio
is maintained at an appropriate level.
The First State Global Bond Fund, First State High Quality Bond Fund, First State Long Term Bond
Fund, First State Asian Bond Fund, First State Asian Quality Bond Fund and First State Global Credit
Income Fund hold a majority of their assets in bonds. The following tables set out the interest profile of
these financial assets at 31 December 2017 with comparative figures as at 31 December 2016. An estimate
is also given of the effects of a hypothetical 100 basis points increase and decrease in interest rates on
assets that are subject to interest rate risk. The sensitivity analysis includes both fixed and floating rate
debt securities.
The basis of the calculation is using the modified duration of the Fund as a whole (being a weighted
average of the modified duration of each security). No specific assumptions have been made on the
durations other than that all securities make coupon and capital payments in line with their contractual
requirements. In using this method to show sensitivity to interest rate movements, it has been assumed
that an interest rate movement on the scale shown is replicated for each security to the same amount.

First State Global Umbrella Fund PLC
Notes forming part of the financial statements for the year ended
31 December 2017 (continued)
389
8. Risk arising from financial instruments (continued)
(c) Interest rate risk (continued)
This last assumption is the key limitation of using this methodology, since any general movement in
interest rates may result in a different movement in the rate for different securities; however it is believed
to be the most appropriate method of illustrating the effect of a theoretical movement in rates and
therefore the overall interest rate sensitivity of each Fund.
First State Global Bond Fund as of 31 December 2017
Floating rate
financial assets
Fixed rate
financial assets
Financial assets on
which no interest
is paid Total
Currency US$ US$ US$ US$
Australian Dollar 281,386 - 281,386 -
Canadian Dollar 377,484 - 377,484 -
Danish Krone 82,852 - 82,852 -
Euro 5,374,484 - 5,374,484 -
JJapanese Yen 2,893,908 - 2,893,908 -
Malaysian Ringgit 61,858 - 61,858 -
Mexican Pesos 103,944 - 103,944 -
Norway Kroner 39,013 - 39,013 -
Polish Zloty 85,751 - 85,751 -
Singapore Dollar 55,940 - 55,940 -
South Africa Rand 79,741 - 79,741 -
Sterling Pound 788,707 - 788,707 -
Swedish Krona 63,321 - 63,321 -
Swiss Francs 21,508 - 21,508 -
U.S. Dollar 5,859,175 - 5,859,175 -
16,169,072 - 16,169,072 -
Fixed rate financial assets
weighted average interest rate
Fixed rate financial assets
weighted average period for
which rate is fixed
Currency
Australian Dollar 4.47% 7.69 years
Canadian Dollar 3.35% 6.31 years
Danish Krone 1.07% 7.7 years
Euro 2.68% 9.08 years
Japanese Yen 1.27% 14.61 years
Malaysian Ringgit 4.18% 6.76 years
Mexican Pesos 10.00% 7.03 years
Norway Kroner 3.00% 6.29 years
Polish Zloty 4.00% 5.90 years
Singapore Dollar 3.00% 6.77 years
South Africa Rand 8.86% 21.79 years
Sterling Pound 3.34% 16.7 years
Swedish Krona 2.29% 12.15 years
Swiss Francs 4.00% 5.19 years
U.S. Dollar 2.86% 6.98 years

First State Global Umbrella Fund PLC
Notes forming part of the financial statements for the year ended
31 December 2017 (continued)
390
8. Risk arising from financial instruments (continued)
(c) Interest rate risk (continued)
First State Global Bond Fund as of 31 December 2016
Floating rate
financial assets
Fixed rate
financial assets
Financial assets on
which no interest
is paid Total
Currency US$ US$ US$ US$
Australian Dollar 239,623 - 239,623 -
Canadian Dollar 301,801 - 301,801 -
Danish Krone 78,190 - 78,190 -
Euro 4,046,994 - 4,046,994 -
Japanese Yen 2,238,140 - 2,238,140 -
Malaysian Ringgit 53,818 - 53,818 -
Mexican Pesos 83,578 - 83,578 -
Norway Kroner 30,753 - 30,753 -
Polish Zloty 65,012 - 65,012 -
Singapore Dollar 43,339 - 43,339 -
South African Rand 63,831 - 63,831 -
Sterling Pound 684,091 - 684,091 -
Swedish Krona 33,978 - 33,978 -
Swiss Francs 25,127 - 25,127 -
US Dollar 7,039,499 - 7,039,499 -
15,027,774 - 15,027,774 -
Fixed rate financial assets
weighted average interest rate
Fixed rate financial assets
weighted average period for
which rate is fixed
Currency
Australian Dollar 4.55% 7.63 years
Canadian Dollar 3.50% 6.52 years
Danish, Krone 1.50% 6.97 years
Euro 2.63% 10.25 years
Japanese Yen 1.32% 16.51 years
Malaysian Ringgit 4.28% 5.27 years
Mexican Pesos 10.00% 8.04 years
Norway Kroner 3.00% 7.31 years
Polish Zloty 4.00% 6.91 years
Singapore Dollar 3.00% 7.78 years
South African Rand 9.00% 23.42 years
Sterling Pound 2.72% 18.31 years
Swedish Krona 2.08% 11.49 years
Swiss Francs 4.00% 6.2 years
US Dollar 2.06% 5.79 years
At 31 December 2017, should interest rates have lowered by 100 basis points with all other variables
remaining constant, the increase in net assets attributable to holders of redeemable shares for the financial
year would amount to approximately US$1,296,567 arising substantially from the increase in market values
of debt securities (31 December 2016: US$1,119,250). An increase in interest rates of 100 basis points
would have had an equal but opposite effect.

First State Global Umbrella Fund PLC
Notes forming part of the financial statements for the year ended
31 December 2017 (continued)
391
8. Risk arising from financial instruments (continued)
(c) Interest rate risk (continued)
First State High Quality Bond Fund as of 31 December 2017
Floating rate
financial assets
Fixed rate
financial assets
Financial assets on
which no interest is
paid
Total
Currency US$ US$ US$ US$
US Dollar 83,249,471 4,188,282 79,061,189 -
83,249,471 4,188,282 79,061,189 -
Fixed rate financial assets
weighted average interest rate
Fixed rate financial assets
weighted average period for
which rate is fixed
Currency
US Dollar 3.17% 9.54 years
First State High Quality Bond Fund as of 31 December 2016
Floating rate
financial assets
Fixed rate
financial assets
Financial assets on
which no interest is
paid
Total
Currency US$ US$ US$ US$
US Dollar 80,612,928 5,097,583 75,515,345 -
80,612,928 5,097,583 75,515,345 -
Fixed rate financial assets
weighted average interest rate
Fixed rate financial assets
weighted average period for
which rate is fixed
Currency
US Dollar 3.42% 8.74 years
At 31 December 2017, should interest rates have lowered by 100 basis points with all other variables
remaining constant, the increase in net assets attributable to holders of redeemable shares for the financial
year would amount to approximately US$5,476,162 arising substantially from the increase in market
values of debt securities (31 December 2016: US$5,161,989). An increase in interest rates of 100 basis
points would have had an equal but opposite effect.

First State Global Umbrella Fund PLC
Notes forming part of the financial statements for the year ended
31 December 2017 (continued)
392
8. Risk arising from financial instruments (continued)
(c) Interest rate risk (continued)
First State Long Term Bond Fund as of 31 December 2017
Floating rate
financial assets
Fixed rate
financial assets
Financial assets on
which no interest
is paid
Total
Currency US$ US$ US$ US$
US Dollar 69,368,729 - 69,368,729 -
69,368,729 - 69,368,729 -
Fixed rate financial assets
weighted average interest rate
Fixed rate financial assets
weighted average period for which
rate is fixed
Currency
US Dollar 2.66% 14.47 years
First State Long Term Bond Fund as of 31 December 2016
Floating rate
financial assets
Fixed rate
financial assets
Financial assets on
which no interest
is paid
Total
Currency US$ US$ US$ US$
US Dollar 66,175,534 - 66,175,534 -
66,175,534 - 66,175,534 -
Fixed rate financial assets
weighted average interest rate
Fixed rate financial assets
weighted average period for which
rate is fixed
Currency
US Dollar 2.60% 14.04 years
At 31 December 2017, should interest rates have lowered by 100 basis points with all other variables
remaining constant, the increase in net assets attributable to holders of redeemable shares for the financial
year would amount to approximately US$7,561,704 arising substantially from the increase in market values
of debt securities (31 December 2016: US$7,026,511). An increase in interest rates of 100 basis points
would have had an equal but opposite effect.

First State Global Umbrella Fund PLC
Notes forming part of the financial statements for the year ended
31 December 2017 (continued)
393
8. Risk arising from financial instruments (continued)
(c) Interest rate risk (continued)
First State Asian Bond Fund as of 31 December 2017
Floating rate
financial assets
Fixed rate
financial assets
Financial assets on
which no interest is
paid
Total
Currency US$ US$ US$ US$
Australian Dollar 181,832 - 181,832 -
Chinese Renminbi 1,257,540 644,345 613,195 -
Indonesian Rupiah 152,202 - 152,202 -
Malaysian Ringgit 124,745 - 124,745 -
US Dollar 29,528,419 2,572,603 26,955,816 -
31,244,738 3,216,948 28,027,790 -
Fixed rate financial assets
weighted average interest
rate
Fixed rate financial assets weighted
average period for which rate is
fixed
Currency
Australian Dollar 3.86% 8.2 years
Chinese Renminbi 4.88% 2.27 years
Indonesian Rupiah 7.88% 1.31 years
Malaysian Ringgit 3.65% 1.86 years
US Dollar 4.67% 15.05 years
First State Asian Bond Fund as of 31 December 2016
Floating rate
financial assets
Fixed rate
financial assets
Financial assets on
which no interest is
paid
Total
Currency US$ US$ US$ US$
Chinese Renminbi 430,798 - 430,798 -
Indonesian Rupiah 362,503 - 362,503 -
Indian Rupee 211,221 - 211,221 -
Malaysian Ringgit 111,595 - 111,595 -
Thailand Baht 28 - 28 -
US Dollar 17,163,497 1,792,493 15,371,004 -
18,279,642 1,792,493 16,487,149 -

First State Global Umbrella Fund PLC
Notes forming part of the financial statements for the year ended
31 December 2017 (continued)
394
8. Risk arising from financial instruments (continued)
(c) Interest rate risk (continued)
First State Asian Bond Fund as of 31 December 2016 (continued)
Fixed rate financial assets
weighted average interest
rate
Fixed rate financial assets weighted
average period for which rate is
fixed
Currency
Chinese Renminbi 5.27% 1.73 years
Indonesian Rupiah 8.08% 5.21 years
Indian Rupee 8.13% 3.60 years
Malaysian Ringgit 3.65% 2.87 years
Thailand Baht 2.80% 0.79 years
US Dollar 4.51% 8.03 years
At 31 December 2017, should interest rates have lowered by 100 basis points with all other variables
remaining constant, the increase in net assets attributable to holders of redeemable shares for the financial
year would amount to approximately US$1,750,090 arising substantially from the increase in market values
of debt securities (31 December 2016: US$921,733). An increase in interest rates of 100 basis points would
have had an equal but opposite effect.
First State Asian Quality Bond Fund as of 31 December 2017
Floating rate
financial assets
Fixed rate
financial assets
Financial assets on
which no interest is
paid
Total
Currency US$ US$ US$ US$
Australian Dollar 4,720,565 - 4,720,565 -
Chinese Renminbi 12,935,216 2,884,731 10,050,485 -
Indonesian Rupiah 3,196,241 - 3,196,241 -
Malaysian Ringgit 3,742,335 - 3,742,335 -
US Dollar 595,335,979 49,990,688 545,345,291 -
619,930,336 52,875,419 567,054,917 -
Fixed rate financial assets
weighted average interest rate
Fixed rate financial assets
weighted average period for
which rate is fixed
Currency
Australian Dollar 3.84% 7.94 years
Chinese Renminbi 4.46% 1.89 years
Indonesian Rupiah 7.88% 1.31 years
Malaysian Ringgit 3.65% 1.86 years
US Dollar 4.41% 10.79 years

First State Global Umbrella Fund PLC
Notes forming part of the financial statements for the year ended
31 December 2017 (continued)
395
8. Risk arising from financial instruments (continued)
(c) Interest rate risk (continued)
First State Asian Quality Bond Fund as of 31 December 2016
Floating rate
financial assets
Fixed rate
financial assets
Financial assets on
which no interest is
paid
Total
Currency US$ US$ US$ US$
Chinese Renminbi 12,433,957 216,770 12,217,187 -
Indian Rupee 7,016,974 - 7,016,974 -
Indonesian Rupiah 12,661,372 - 12,661,372 -
Malaysian Ringgit 3,347,856 - 3,347,856 -
Thailand Baht 28 - 28 -
US Dollar 592,557,252 53,838,525 538,718,727 -
628,017,439 54,055,295 573,962,144 -
Fixed rate financial assets
weighted average interest rate
Fixed rate financial assets
weighted average period for
which rate is fixed
Currency
Chinese Renminbi 4.31% 1.68 years
Indian Rupee 8.13% 5.09 years
Indonesian Rupiah 8.10% 5.53 years
Malaysian Ringgit 3.65% 2.87 years
Thailand Baht 2.80% 0.79 years
US Dollar 4.18% 8.89 years
At 31 December 2017, should interest rates have lowered by 100 basis points with all other variables
remaining constant, the increase in net assets attributable to holders of redeemable shares for the financial
year would amount to approximately US$33,082,513 arising substantially from the increase in market
values of debt securities (31 December 2016: US$33,778,329). An increase in interest rates of 100 basis
points would have had an equal but opposite effect.

First State Global Umbrella Fund PLC
Notes forming part of the financial statements for the year ended
31 December 2017 (continued)
396
8. Risk arising from financial instruments (continued)
(c) Interest rate risk (continued)
First State Emerging Markets Bond Fund as of 31 December 2016*
Financial assets on
which no interest is
paid
Floating rate
financial assets
Fixed rate
financial assets
Total
Currency US$ US$ US$ US$
US Dollar 26,251,489 - 26,152,220 99,269
26,251,489 - 26,152,220 99,269
Fixed rate financial assets
weighted average interest rate
Fixed rate financial assets weighted
average period for which rate is fixed
Currency
US Dollar 5.50% 9.43 years
* The First State Emerging Market Bond Fund terminated on 23 November 2017.
At 31 December 2017, should interest rates have lowered by 100 basis points with all other variables
remaining constant, the increase in net assets attributable to holders of redeemable shares for the
financial year would amount to approximately US$Nil arising substantially from the increase in market
values of debt securities (31 December 2016: US$1,571,492). An increase in interest rates of 100 basis
points would have had an equal but opposite effect.
First State Global Credit Income Fund as of 31 December 2017
Floating rate
financial
assets
Fixed rate
financial assets
Financial assets on
which no interest is
paid
Total
Currency US$ US$ US$ US$
Australian Dollar 1,621,004 754,780 866,224 -
Canadian Dollar 405,258 - 405,258 -
Euro 11,846,947 495,203 11,351,743 -
Sterling Pound 2,380,964 540,938 1,840,027 -
US Dollar 51,492,287 2,081,288 49,410,998 -
67,746,460 3,872,209 63,874,250 -
Fixed rate financial assets
weighted average interest rate
Fixed rate financial assets weighted
average period for which rate is
fixed
Currency
Australian Dollar 6.13% 4.33 years
Canadian Dollar 3.55% 8.29 years
Euro 1.57% 6.44 years
Sterling Pound 7.52% 5.37 years
US Dollar 4.47% 4.69 years

First State Global Umbrella Fund PLC
Notes forming part of the financial statements for the year ended
31 December 2017 (continued)
397
8. Risk arising from financial instruments (continued)
(c) Interest rate risk (continued)
First State Global Credit Income Fund as of 31 December 2016
Floating rate
financial
assets
Fixed rate
financial assets
Financial assets on
which no interest is
paid
Total
Currency US$ US$ US$ US$
Australian Dollar 4,370,764 361,453 4,009,311 -
Canadian Dollar 381,230 - 381,230 -
Euro 7,538,385 576,050 6,962,335 -
Sterling Pound 3,441,987 641,279 2,800,708 -
US Dollar 93,750,861 3,628,931 90,121,929 -
109,483,227 5,207,713 104,275,513 -
Fixed rate financial assets
weighted average interest rate
Fixed rate financial assets weighted
average period for which rate is
fixed
Currency
Australian Dollar 5.58% 2.94 years
Canadian Dollar 3.55% 9.30 years
Euro 2.05% 5.51 years
Sterling Pound 5.69% 7.91 years
US Dollar 4.70% 4.93 years
The Company uses the absolute value at risk (“VaR”) model to calculate the First State Global Credit Income
Fund’s global exposure.
(d) Credit risk
The Company takes on exposure to credit risk, which is the risk that a counterparty will be unable to pay
amounts in full when due. Impairment provisions are provided for losses that have been incurred by the SFP
date, if any.
The Company’s investments in fixed income securities are subject to credit risk. Credit risk reflects the
possibility that a borrower will not be able to meet its obligation to make payments of interest or principal
when they fall due. The Investment Manager analyses the credit risk of the Company’s fixed income
investments prior to purchase and continues to monitor developments in credit quality subsequently.
The Company is also exposed to counterparty credit risk on trading derivative products. To reduce the
Company’s counterparty credit exposures, securities trading is primarily conducted on recognised exchanges
and on a delivery-versus-payment basis. In addition, the Investment Manager seeks to enter into netting
agreements with counterparties that would allow receivables and payables to that counterparty to be offset.
The counterparty has no right to sell or re-pledge this collateral asset received.

First State Global Umbrella Fund PLC
Notes forming part of the financial statements for the year ended
31 December 2017 (continued)
398
8. Risk arising from financial instruments (continued)
(d) Credit risk (continued)
To measure and manage the Company’s credit exposures, the Investment Manager primarily uses credit
limits. While the Company’s investment activities expose it to many different industries and
counterparties, the Company routinely executes a high volume of transactions with counterparties in the
financial services industry, including brokers and dealers and commercial banks, resulting in significant
relative credit concentration with respect to this industry. In the ordinary course of business, the Company
may also be subject to a concentration of credit risk to a particular counterparty, borrower or issuer;
however the Investment Manager controls this exposure through the use of counterparty, credit and issuer
limits. In general the limits applied (expressed as a value of each Fund) are 10% to individual issuers,
20% to deposit taking financial institutions, 5% (or 10% if an approved bank) to OTC derivative
counterparties, and 20% to combined issuers/counterparties. Lower limits may be applied to individual
issuers or counterparties if the Investment Manager feels it prudent to do so.
The Company’s assets are safeguarded and held by the Depositary. The Investment Manager analyses
the credit risk of the Company’s Depositary prior to appointment and continues to monitor developments
in its credit quality subsequently. In addition the Investment Manager makes use from time to time of
money market or exchange-traded funds or the placing of monies on deposit both in order to maximise
return and to diversify the exposure of such assets. The Depositary has a short-term credit rating of P-1
(2016: P-1). Further details of the cash and cash equivalents are shown in Note 10.
The central counterparty used during the financial year is CME, a financial market company operating
an options and futures exchange. Morgan Stanley centrally clear interest rate swaps with CME and the
credit rating of this broker is BBB+.
All transactions in listed securities are settled/paid for upon delivery using the Depositary or its Sub-
Depositaries. The risk of default is considered minimal, as delivery of securities sold is only made once
the Depositary has received payment. Payment is made on a purchase once the securities have been
received by the Depositary. The trade will fail if either party fails to meet its obligation. Substantially all
of the securities and cash of the Company are held by HSBC Institutional Trust Services (Ireland) DAC.
Bankruptcy or insolvency of HSBC Institutional Trust Services (Ireland) DAC may cause the Company’s
rights with respect to securities and cash held by HSBC Institutional Trust Services (Ireland) DAC to be
delayed or limited. The Company’s securities and other positions are segregated from the assets of the
Depositary. Thus in the event of insolvency or bankruptcy of the Depositary, the Company’s assets are
segregated from those of the Depositary. The Company, will, however, be exposed to the credit risk of
the Depositary, or any sub-Depositary used by the Depositary, in relation to the Company’s cash held by
the Depositary or sub-depositary. In the event of the insolvency or bankruptcy of the Depositary, the
Company will be treated as a general creditor of the Depositary in relation to cash holdings of the
Company.

First State Global Umbrella Fund PLC
Notes forming part of the financial statements for the year ended
31 December 2017 (continued)
399
8. Risk arising from financial instruments (continued)
(d) Credit risk (continued)
The below table shows the credit ratings for major counterparties of the Company as of 31 December
2017 and 31 December 2016 as provided by Standard & Poor’s.
2017 2016
Citi A+ A+
Commonwealth Bank of Australia AA- AA-
HSBC Bank AA- AA-
Westpac Banking Corporation AA- AA-
National Australia Bank AA- AA-
ANZ Banking Group Limited AA- AA-
BNP Paribas A A
Morgan Stanley BBB+ BBB+
JP Morgan A+ A+
UBS A+ A+
The carrying amounts of the financial assets best represent the maximum credit risk exposure at the SFP
date. Details of the Company’s financial assets exposed to credit risk are shown in the assets section of
the current and prior financial year SFP on pages 256-275.
The Investment Manager monitors the Fund’s credit position on daily basis. There were no changes in
the credit risk management policies and procedures from the prior financial year ended 31 December
2016.
The First State Global Bond Fund, First State High Quality Bond Fund, First State Long Term Bond
Fund, First State Asian Bond Fund, First State Asian Quality Bond Fund First State Global Emerging
Markets Leaders Fund, First State Global Emerging Markets Bond Fund and the First State Global Credit
Income Fund hold a majority of their assets in debt securities. An analysis of these debt securities
portfolios by credit rating as provided by Standard & Poor’s or Moody’s is shown in the following tables.
This analysis is performed on the basis of the respective published net asset value as calculated in
accordance with the provisions of the Company’s Articles of Association.

First State Global Umbrella Fund PLC
Notes forming part of the financial statements for the year ended
31 December 2017 (continued)
400
8. Risk arising from financial instruments (continued)
(d) Credit risk (continued)
First State Global Bond Fund
Portfolio by rating category
Rating 31 Dec 2017 31 Dec 2016
AAA 14.82% 11.01%
AA+ 22.81% 38.65%
AA 12.61% 13.71%
A+ 14.31% 15.32%
A 0.38% 2.58%
A- 1.17% 3.15%
BBB+ 16.79% 4.22%
BBB 12.29% 1.75%
BBB- - 7.76%
BB+ 0.50% -
N/A 4.32% 1.85%
Total 100.00% 100.00%
First State High Quality Bond Fund
Portfolio by rating category
Rating 31 Dec 2017 31 Dec 2016
AAA 4.08% 3.24%
AA+ 47.50% 36.51%
AA 1.29% 1.61%
AA- 1.51% 3.97%
A+ 5.07% 9.30%
A 2.85% 8.95%
A- 6.63% 12.15%
BBB+ 12.83% 7.36%
BBB 7.53% 6.84%
BBB- 8.07% 4.27%
BB+ 0.62% -
N/A 2.02% 5.80%
Total 100.00% 100.00%

First State Global Umbrella Fund PLC
Notes forming part of the financial statements for the year ended
31 December 2017 (continued)
401
8. Risk arising from financial instruments (continued)
(d) Credit risk (continued)
First State Long Term Bond Fund
Portfolio by rating category
Rating 31 Dec 2017 31 Dec 2016
AAA 1.26% 1.30%
AA+ 92.67% 90.61%
AA- - 1.65%
A+ 2.66% 1.90%
A 1.71% 0.43%
N/A 1.70% 4.11%
Total 100.00% 100.00%
First State Asian Bond Fund
Portfolio by rating category
Rating 31 Dec 2017 31 Dec 2016
AA+ 0.49% 1.20%
AA 1.39% 2.10%
AA- 0.49% 2.16%
A+ 9.17% 11.09%
A 1.53% 4.63%
A- 8.59% 10.55%
BBB+ 17.65% 16.60%
BBB 5.93% 4.14%
BBB- 10.19% 5.39%
BB+ 2.63% 7.42%
BB 3.78% 1.15%
BB- 2.81% -
B+ 5.19% 4.56%
B 1.32% 1.14%
N/A 28.84% 27.87%
Total 100.00% 100.00%

First State Global Umbrella Fund PLC
Notes forming part of the financial statements for the year ended
31 December 2017 (continued)
402
8. Risk arising from financial instruments (continued)
(d) Credit risk (continued)
First State Asian Quality Bond Fund
Portfolio by rating category
Rating 31 Dec 2017 31 Dec 2016
AAA 0.49% 1.30%
AA+ 0.33% 3.50%
AA 2.92% 3.01%
AA- 1.18% 1.98%
A+ 13.84% 15.83%
A 7.07% 6.37%
A- 15.06% 13.27%
BBB+ 20.80% 19.41%
BBB 8.77% 5.20%
BBB- 10.37% 6.79%
BB+ 0.86% 8.74%
N/A 18.31% 14.60%
Total 100.00% 100.00%
First State Emerging Markets Bond Fund*
Portfolio by rating category
Rating 31 Dec 2017 31 Dec 2016
AA - 0.75% A+ - 6.60% A- - 0.75% A - 0.83% BBB+ - 7.04% BBB - 7.16% BBB- - 10.56% BB+ - 11.66% BB - 10.33% BB- - 11.41% B+ - 4.81% B - 4.88% B- - 9.48% CCC - 0.78% CCC- - 1.58% N/A - 11.38%
Total - 100.00%
* The First State Emerging Market Bond Fund terminated on 23 November 2017.

First State Global Umbrella Fund PLC
Notes forming part of the financial statements for the year ended
31 December 2017 (continued)
403
8. Risk arising from financial instruments (continued)
(d) Credit risk (continued)
First State Global Credit Income Fund
Portfolio by rating category
Rating 31 Dec 2017 31 Dec 2016
AAA - 0.73% AA+ 0.31% 0.66% AA 0.41% 1.42% AA- 3.93% 4.59% A+ 2.57% 5.79% A 7.41% 10.31% A- 11.73% 16.58% BBB+ 25.97% 16.99% BBB 22.73% 15.28% BBB- 11.98% 6.63% BB+ 1.83% 2.82% BB 0.42% 2.38% BB- 1.29% 4.35% B+ 0.76% 3.45% B 0.40% 2.78% B- 0.35% 1.29% CCC+ - 0.18% N/A 7.91% 3.77%
Total 100.00% 100.00%
(e)Liquidity risk
Liquidity risk is the risk that an entity will encounter difficulty in meeting obligations associated with
financial liabilities.
The capital of the Company is represented by the net assets attributable to holders of redeemable shares.
The amount of net assets attributable to holders of redeemable shares can change significantly on a daily
basis as the Company is subject to daily subscriptions and redemptions at the discretion of shareholders.
The Company’s objective when managing capital is to safeguard the Company’s ability to continue as a
going concern in order to provide returns for shareholders, provide benefits for other stakeholders and
maintain a strong capital base to support the development of the investment activities of the Company.
As the Company may be exposed to daily cash redemptions of redeemable shares, it therefore invests the
majority of its assets in investments that are traded in an active market and can be readily disposed of; it
invests only a limited proportion of its assets in investments not actively traded on a stock exchange. The
Company’s listed securities are considered readily realisable as they are listed on major stock exchanges.
What is more, in the interests of shareholder protection, the Directors may limit the number of
participating shares of any Fund redeemed on any dealing day to 10% of the total number of participating
shares of that Fund in issue as discussed in Note 2 (k).

First State Global Umbrella Fund PLC
Notes forming part of the financial statements for the year ended
31 December 2017 (continued)
404
8. Risk arising from financial instruments (continued)
(e)Liquidity risk (continued)
The number of shareholders in each Fund who held 20% or more shares in issue as at the financial year
ended 31 December 2017 and 31 December 2016 are disclosed in Note 15.
The Company’s policy with regard to liquidity is to ensure continuity of funding. Short term flexibility
is achieved through overdraft facilities. The Company’s assets comprise mainly of readily realisable
securities which can be sold freely to meet funding commitments if necessary.
The Investment Manager monitors the liquidity positions on a daily basis and takes action as necessary
to maintain an adequate level of liquidity to meet all known funding requirements. There were no changes
in the liquidity risk management policies and procedures from the prior financial year ended 31 December
2016.
The table below analyses the Company’s financial liabilities into relevant maturity groupings based on
the remaining period at the Statement of Financial Position date to the contractual maturity date. The
amounts in the table are the contractual undiscounted cash flows. Derivatives settled gross include
forward currency contracts. Balances due within 12 months equal their carrying balances, as the impact
of discounting is not significant. The balances with no stated maturity are expected to be settled in less
than 12 months. This analysis has been prepared on the basis of the Company as a whole rather than for
each Fund as the majority of the financial liabilities for each respective Fund are due within one month
and have common contractual maturity dates. The financial liabilities at fair value through profit or loss
due within one month relate to forward contracts on Global Credit Income Fund.
At 31 December 2017 Less than
1 month 1-3 months No stated
maturity US$ US$ US$ Financial liabilities
Bank overdrafts 21,956,914 - -
Financial liability at fair value through
profit or loss 105,276 315,862 -
Due to brokers 13,838,775 - -
Due to shareholders 54,111,648 - -
Due to investment manager - 15,558,160 -
Accrued expenses - 3,318,745 -
Redeemable shares 13,406,207,232 - -
Total 13,496,219,845 19,192,767 -
At 31 December 2016 Less than
1 month 1-3 months No stated
maturity US$ US$ US$ Financial liabilities
Bank overdrafts 9,447,169 - -
Financial liability at fair value through
profit or loss 45,894 807,947 -
Due to brokers 22,856,845 - -
Due to shareholders 72,601,870 - -
Due to investment manager - 13,162,281 -
Accrued expenses - 2,855,722 -
Redeemable shares 10,730,923,791 - -
Total 10,835,875,569 16,825,950 -

First State Global Umbrella Fund PLC
Notes forming part of the financial statements for the year ended
31 December 2017 (continued)
405
9. Derivative contracts
Future contracts
Future contracts are commitments either to purchase or sell a designated financial instrument, currency,
commodity or an index at a specified future date for a specified price and may be settled in cash or another
financial asset. Futures are standardised exchange-traded contracts. Initial margin requirements for
futures are met in cash or other instruments, and changes in the future contract values are settled daily.
Future contracts have little credit risk because the counterparties are futures exchanges. Future contracts
result in exposure to market risk based on changes in market prices relative to contracted amounts. Market
risks arise due to the possible movement in foreign currency exchange rates, indices, and securities’
values underlying these instruments. In addition, because of the low margin deposits normally required
in relation to notional contract sizes, a high degree of leverage may be typical of a futures account.
As a result, a relatively small price movement in an underlying of a futures contract may result in
substantial losses to the Company.
Futures trading may also be illiquid. Certain futures exchanges do not permit trading in particular futures
contracts at prices that represent a fluctuation in price during a single day’s trading beyond certain set
limits. If prices fluctuate during a single day’s trading beyond those limits, the Company could be
prevented from promptly liquidating unfavourable positions and thus could be subject to substantial
losses.
Notional amounts are the underlying reference amounts to stock exchange indices, equities and foreign
currencies upon which the fair value of the futures traded by the Company are based. While notional
amounts do not represent the current fair value and are not necessarily indicative of the future cash flows
of the Company’s futures, the underlying price changes in relation to the variables specified by the
notional amounts affect the fair value of these derivative financial instruments. The fair value of future
contracts entered into by the Company as at 31 December 2017 is disclosed in the Schedule of
Investments. Realised and unrealised gains or losses on derivatives are disclosed separately in the SCI.
The counterparty for all futures contracts is JP Morgan Securities LLC.
Forward contracts
Forward contracts are contractual agreements to buy or sell a specified financial instrument at a specific
price and date in the future. Forwards are customised contracts transacted in the OTC market. The Funds
may enter into forward foreign exchange contracts to manage the currency risk arising from the Funds’
investment or anticipated investment in investments denominated in foreign currencies. Forward
contracts may be used for hedging and currency management of both local and foreign currencies.
Realised and unrealised gains or losses on derivatives are disclosed separately in the SCI. The
counterparties for all the forward contracts are Westpac Banking Corporation, ANZ Banking Group
Limited, HSBC Bank, JPMorgan Chase Bank N.A. New York and UBS AG Singapore Branch.

First State Global Umbrella Fund PLC
Notes forming part of the financial statements for the year ended
31 December 2017 (continued)
406
9. Derivative contracts (continued)
Interest rate swaps
Swaps are contractual agreements between two parties to exchange streams of payments over time based
on specified notional amounts. Interest rate swaps relate to contracts taken out by the Company with
major brokers in which the Company either receives or pays a floating rate of interest in return for paying
or receiving a fixed rate of interest. The payment flows are usually netted against each other, with the
difference being paid by one party to the other. The Company may obtain interest rate swaps for the
purposes of efficient portfolio management and to hedge against interest rate risk. Realised and unrealised
gains or losses on derivatives are disclosed separately in the SCI. The counterparties for the interest rate
swaps contracts are Commonwealth Bank of Australia, ANZ Banking Group Limited, National Australia
Bank Limited, Westpac Banking Corporation and Morgan Stanley.
Warrants
Warrants are recorded as an asset or liability at their fair value on the SFP. Fair value as determined by
the Administrator is the quoted market price as provided by electronic feed from one or more reputable
price vendors. The change in fair value, if any, is recorded as an unrealised gain or loss in the SCI.
Realised gains or losses on warrants are shown in the SCI. On the expiry of a warrant the amount
previously recognised in the SFP is recognised in the SCI as a realised gain or loss.

First State Global Umbrella Fund PLC
Notes forming part of the financial statements for the year ended
31 December 2017 (continued)
407
9. Derivative contracts (continued)
Offsetting assets and liabilities
Global Credit Income Fund
31 December 2017
Financial assets which are subject to enforceable master netting arrangements or similar agreements are
detailed in the following table.
Description of type of
financial assets
Gross
amount of
recognised
financial
asset
Gross amounts
of financial
liabilities
offset in the
SFP
Net amount
of financial
asset
presented in
the SFP
Gross amounts not offset in
the SFP
Net
amount
Financial
instrument*
Cash
collateral
received* Australian and New
Zealand Banking
Group Limited 229,221 - 229,221 (38,169) - 191,052
Commonwealth Bank 330,600 - 330,600 - - 330,600
National Australia
Bank 374,234 - 374,234 (2,179) - 372,055
Westpac Banking
Corporation 74,709 - 74,709 (74,709) - -
1,008,764 - 1,008,764 (115,057) - 893,707
Financial liabilities which are subject to enforceable master netting arrangements or similar agreements
are detailed in the following table.
Description of type of
financial liabilities
Gross
amount of
recognised
financial
liabilities
Gross amounts
of financial
assets offset in
the SFP
Net amount
of financial
liabilities
presented in
the SFP
Gross amounts not offset in
the SFP
Net
amount
Financial
instrument*
Cash
collateral
pledged* Australian and New
Zealand Banking
Group Limited 38,169 - 38,169 (38,169) - -
JP Morgan Chase
Bank NA New York 1,794 1,794 - 1,794
Morgan Stanley 162,715 - 162,715 - (162,715) -
National Australia
Bank 2,179 - 2,179 (2,179) - -
Westpac Banking
Corporation 103,482 - 103,482 (74,709) - 28,773
308,339 - 308,339 (115,057) (162,715) 30,567
*Cash collateral and other financial instruments amounts disclosed in the table above have been limited
to the net amount of financial assets or liabilities presented in the SFP to eliminate the effect of over
collateralisation.

First State Global Umbrella Fund PLC
Notes forming part of the financial statements for the year ended
31 December 2017 (continued)
408
9. Derivative contracts (continued)
Offsetting assets and liabilities (continued)
Global Bond Fund
31 December 2017
Financial assets which are subject to enforceable master netting arrangements or similar agreements are
detailed in the following table.
Description of type of
financial assets
Gross
amount of
recognised
financial
asset
Gross amounts
of financial
liabilities
offset in the
SFP
Net amount
of financial
asset
presented in
the SFP
Gross amounts not offset in
the SFP
Net
amount
Financial
instrument*
Cash
collateral
received* Australian and New
Zealand Banking
Group Limited 101 - 101 (101) - -
HSBC Bank 13,771 - 13,771 (3,544) - 10,227
13,872 - 13,872 (3,645) - 10,227
Financial liabilities which are subject to enforceable master netting arrangements or similar agreements
are detailed in the following table.
Description of type of
financial liabilities
Gross
amount of
recognised
financial
liabilities
Gross amounts
of financial
assets offset in
the SFP
Net amount
of financial
liabilities
presented in
the SFP
Gross amounts not offset in
the SFP
Net
amount
Financial
instrument*
Cash
collateral
pledged* Australian and New
Zealand Banking
Group Limited 2,178 - 2,178 (101) - 2,077
HSBC Bank 3,544 - 3,544 (3,544) - -
UBS AG Singapore
Branch 1,900 - 1,900 - - 1,900
7,622 - 7,622 (3,645) - 3,977
*Cash collateral and other financial instruments amounts disclosed in the table above have been limited
to the net amount of financial assets or liabilities presented in the SFP to eliminate the effect of over
collateralisation.

First State Global Umbrella Fund PLC
Notes forming part of the financial statements for the year ended
31 December 2017 (continued)
409
9. Derivative contracts (continued)
Offsetting assets and liabilities (continued)
Global Credit Income Fund
31 December 2016
Financial assets which are subject to enforceable master netting arrangements or similar agreements are
detailed in the following table.
Description of type of
financial assets
Gross
amount of
recognised
financial
asset
Gross amounts
of financial
liabilities
offset in the
SFP
Net amount
of financial
asset
presented in
the SFP
Gross amounts not offset in
the SFP
Net
amount
Financial
instrument*
Cash
collateral
received* Australian and New
Zealand Banking
Group Limited 469,267 - 469,267 (40,945) - 428,322
BNP Paribas 47,497 - 47,497 - - 47,497
Commonwealth Bank 345,917 - 345,917 - - 345,917
National Australia
Bank 594,788 - 594,788 (19,706) - 575,082
Westpac Banking
Corporation 15,468 - 15,468 (15,468) - -
1,472,937 - 1,472,937 (76,119) - 1,396,818
Financial liabilities which are subject to enforceable master netting arrangements or similar agreements
are detailed in the following table.
Description of type of
financial liabilities
Gross
amount of
recognised
financial
liabilities
Gross amounts
of financial
assets offset in
the SFP
Net amount
of financial
liabilities
presented in
the SFP
Gross amounts not offset in
the SFP
Net
amount
Financial
instrument*
Cash
collateral
pledged* Australian and New
Zealand Banking
Group Limited 40,945 - 40,945 (40,945) - -
Morgan Stanley 515,721 - 515,721 - (515,721) -
National Australia
Bank 19,706 - 19,706 (19,706) - -
Westpac Banking
Corporation 67,709 - 67,709 (15,468) - 52,241
644,081 - 644,081 (76,119) (515,721) 52,241
*Cash collateral and other financial instruments amounts disclosed in the table above have been limited
to the net amount of financial assets or liabilities presented in the SFP to eliminate the effect of over
collateralisation.

First State Global Umbrella Fund PLC
Notes forming part of the financial statements for the year ended
31 December 2017 (continued)
410
9. Derivative contracts (continued)
Offsetting assets and liabilities (continued)
Global Bond Fund
31 December 2016
Financial assets which are subject to enforceable master netting arrangements or similar agreements are
detailed in the following table.
Description of type of
financial assets
Gross
amount of
recognised
financial
asset
Gross amounts
of financial
liabilities
offset in the
SFP
Net amount
of financial
asset
presented in
the SFP
Gross amounts not offset in
the SFP
Net
amount
Financial
instrument*
Cash
collateral
received* HSBC Bank 421 - 421 (421) - -
UBS AG Singapore
Branch 2,902 - 2,902 (2,902) - -
3,323 - 3,323 (3,323) - -
Financial liabilities which are subject to enforceable master netting arrangements or similar agreements
are detailed in the following table.
Description of type of
financial liabilities
Gross
amount of
recognised
financial
liabilities
Gross amounts
of financial
assets offset in
the SFP
Net amount
of financial
liabilities
presented in
the SFP
Gross amounts not offset in
the SFP
Net
amount
Financial
instrument*
Cash
collateral
pledged* HSBC Bank 25,531 - 25,531 (421) - 25,110
UBS AG Singapore
Branch 20,363 - 20,363 (2,902) - 17,461
45,894 - 45,894 (3,323) - 42,571
*Cash collateral and other financial instruments amounts disclosed in the table above have been limited
to the net amount of financial assets or liabilities presented in the SFP to eliminate the effect of over
collateralisation.

First State Global Umbrella Fund PLC
Notes forming part of the financial statements for the year ended
31 December 2017 (continued)
411
10. Cash and cash equivalents/margin accounts
Bank balances were held with HSBC Bank Plc, HSBC Institutional Trust Services (Asia) Limited (a
wholly owned subsidiary of HSBC Holdings Plc), The Hong Kong & Shanghai Banking Corporation
(India, Indonesia, Japan, New Zealand, Philippines, Singapore, Seoul, South Korea, Taipei, Taiwan),
HSBC Bank Australia Limited, HSBC Bank (China) Company Limited, HSBC Trinkaus & Burkhardt
(Germany), HSBC Bank Malaysia Berhad (Malaysia), HSBC Mexico SA (Mexico), HSBC Bank Middle
East Limited (Palestine), HSBC Bank AS (Turkey) and HSBC Securities Services (Ireland).
Margin cash represents margin deposits or payables held in respect of open exchange-traded futures
contracts and swap positions. Margin accounts held with JP Morgan and Morgan Stanley as at 31
December 2017 amounted to US$1,193,294 (2016: US$2,199,130). This includes collateral of
US$935,526 (2016: US$981,524) for futures positions held in respect of First State Global Bond Fund,
First State Asian Bond Fund, First State Asian Quality Bond Fund and First State Global Credit Income
Fund and collateral of US$257,768 (2016: US$1,217,606) for interest rate swap positions held in respect
of First State Global Credit Income Fund.
Any temporary overdraft balances are secured by way of a charge on the cash and securities of the
relevant Fund.
11. Reconciliation of net assets attributable to holders of redeemable shares to the published net
asset value
Certain Funds’ investments are valued in the financial statements at last traded prices at close of business
on the final business day of the year (2017: 29 December 2017; 2016: 30 December 2016). These prices
are different from the prices obtained at 11:00 a.m. (Irish time) as utilised in the published NAV in
accordance with the prospectus. As at 31 December 2017 there were no differences between the published
NAV and the NAV shown in the SFP for any of the Funds.
31 December 2016
Global Resources Fund
USD
Published NAV attributable to holders of redeemable participating shares 137,287,218
Adjustments to reflect
– 30 December share dealing 3,323
– Movement in investments between 11am and close of business on 30
December 2016 (1,003,106)
Net Assets attributable to holders of redeemable participating shares 136,287,435
Class I Class III Class IV
Published NAV per share $7.98 $8.96 $4.96
Adjustment of NAV per share to close of business $(0.06) $(0.06) $(0.03)
NAV per share per financial statements $7.92 $8.90 $4.93

First State Global Umbrella Fund PLC
Notes forming part of the financial statements for the year ended
31 December 2017 (continued)
412
11. Reconciliation of net assets attributable to holders of redeemable shares to the published net
asset value (continued)
31 December 2016
Global Properties
Securities Fund USD
Published NAV attributable to holders of redeemable participating shares 16,342,454
Adjustments to reflect
– 30 December share dealing 27,000
– Movement in investments between 11am and close of business on 30
December 2016 120,867
Net Assets attributable to holders of redeemable participating shares 16,490,321
Class I Class VI (Dist)
Published NAV per share $11.44 $9.27
Adjustment of NAV per share to close of business $0.09 $0.07
NAV per share per financial statements $11.53 $9.34
12. Cross liability
The Company is an umbrella fund with segregated liability between the various sub funds. As such the
Company generally will not be liable as a whole to third parties as there is no cross-liability between the
Funds.

First State Global Umbrella Fund PLC
Notes forming part of the financial statements for the year ended
31 December 2017 (continued)
413
13. Delegation to sub-investment managers and a sub-sub investment manager
The Investment Manager has delegated the investment management of certain Funds to First State
Investment Management (UK) Limited, First State Investments (Singapore), Colonial First State
Investments Limited and Colonial First State Asset Management (Australia) Limited, all of which are
wholly owned subsidiaries of the Commonwealth Bank of Australia group of companies.
The table below sets out the details of the Funds which are managed or co-managed by the Investment
Manager and may be delegated to each of the sub-investment managers:
Investment manager/
Sub-investment managers
Funds
First State Investments (Hong Kong)
Limited
First State Asian Equity Plus Fund
First State Asia Pacific All Cap Fund
First State China Focus Fund
First State China Growth Fund
First State Hong Kong Growth Fund
First State Greater China Growth Fund
First State Japan Equity Fund
First State Investments (Singapore) First State Asian Growth Fund
First State Asia Opportunities Fund
First State Asia Pacific Select Fund
First State Indian Subcontinent Fund
First State Singapore and Malaysia Growth Fund
Stewart Investors Worldwide Leaders Fund
First State Investments (Hong Kong)
Limited and First State Investments
(Singapore)
(Co-Managers)
First State Asian Bond Fund
First State Asian Quality Bond Fund
First State High Quality Bond Fund
First State Long Term Bond Fund
First State Global Bond Fund
First State Investment Management (UK)
Limited
First State Emerging Markets Bond Fund*
Stewart Investors Global Emerging Markets
Leaders Fund
Stewart Investors Worldwide Equity Fund
Colonial First State Investments Limited First State Asian Property Securities Fund
First State Global Listed Infrastructure Fund
First State Global Property Securities Fund
First State Global Resources Fund
Stewart Investors Worldwide Leaders Fund
First State Sustainable Listed Infrastructure Fund
First State Global Mining Fund
Colonial First State Asset Management
(Australia) Limited and Monegy Inc. (Sub-
sub investment manager) (from 1 January
2017 to 7 April 2017)
First State Global Credit Income Fund
* The First State Emerging Market Bond Fund terminated on 23 November 2017

First State Global Umbrella Fund PLC
Notes forming part of the financial statements for the year ended
31 December 2017 (continued)
414
14. Related parties
Parties are considered to be related if one party has the ability to control the other party or exercise
significant influence over the other party in making financial or operational decisions. Under IAS 24
“Related Party Transactions”, any transactions carried out with the Company by the Promoter, Investment
Manager and/or associated or group companies are considered to be related party transactions. All such
transactions were entered into in the ordinary course of business and on normal commercial terms. The
details of the fees paid/payable to the related parties are disclosed in Note 3.
Each of the Directors was also a director of First State Funds plc during the period covered by this report.
Chris Turpin is the Regional Managing Director of Europe Middle East and Africa (“EMEA”) for First
State Investments and is also a Director of the following companies: FSIUK, First State Investment
Management (UK) Limited, First State Investment Services (UK) Limited, First State Investment (UK
Holdings) Limited, First State Investments International Limited, First State Investments (Hong Kong)
Limited, First State Investments (Singapore), First State Investments Fund Management S.à.r.l, First
State European Diversified Infrastructure S.à.r.l, First State Investments GIP Management S.à.r.l and
European Direct Infrastructure Fund II GP S.à.r.l.
Kate Dowling is the Head of Finance of First State Investments, Asia.
Adrian Hilderly is the Head of Risk and Compliance of First State Investments, EMEA and is also a
Director of FSIUK.
The Directors and the Secretary (including family interests) had no shareholdings in the Company at any
time during the year.
The Commonwealth Bank of Australia is considered to be a related party to the Investment Manager
which has delegated the investment management of certain Funds to the Sub-Investment Managers, all
of which are wholly owned subsidiaries of the Commonwealth Bank of Australia (except Monegy Inc.
which is owned by the Bank of Montreal Group). The market value of the investments and derivatives
related to the Commonwealth Bank of Australia is US$4,439,227 (2016: US$932,437) and the purchase
and sales during the financial year of these investments and derivatives amounted to US$3,474,058 (2016:
US$598,848) and US$Nil (2016: US$1,270,313) respectively. The Commonwealth Bank of Australia is
also a counterparty to forward contracts held by the First State Global Credit Income Fund. During the
financial year, the Fund entered into 4 forward contracts (2016: 14) with the Commonwealth Bank of
Australia. Please refer to the Schedule of Investments for investment positions held with Commonwealth
Bank of Australia as at financial year end. In addition, the Commonwealth Bank of Australia provided
brokerage services to the First State Global Credit Income Fund in the ordinary course of their investment
sales and purchases activities during the period.

First State Global Umbrella Fund PLC
Notes forming part of the financial statements for the year ended
31 December 2017 (continued)
415
14. Related parties (continued)
The table below summarises the value of transactions of the Funds affected through Commonwealth Bank
of Australia, the brokerage commission paid to Commonwealth Bank of Australia and average rate of
commission effected through Commonwealth Bank of Australia for the financial years ended 31
December 2017 and 2016.
Value of
transactions
effected through an
associated
company of the
Investment
Manager
% of total
transactions
Brokerage
commissions paid
to the associated
company of the
Investment
Manager
% of total
brokerage
commissions
paid
Average rate of
commission
effected through
the associated
company of the
Investment
Manager
31 December 2017 US$ US$ US$
Funds
First State Global
Credit Income Fund 1,187,913 1.48% - - -
First State High
Quality Bond Fund 1,127,701 0.90% - - -
First State Asian
Bond Fund 401,756 0.96% - - -
Value of
transactions
effected through an
associated
company of the
Investment
Manager
% of total
transactions
Brokerage
commissions paid
to the associated
company of the
Investment
Manager
% of total
brokerage
commissions
paid
Average rate of
commission
effected through
the associated
company of the
Investment
Manager
31 December 2016 US$ US$ US$
Funds
First State Global
Credit Income Fund 5,599,364 4.18% - - -
First State Asian
Quality Bond Fund 2,371,105 0.34% - - -
First State Global
Bond Fund 218,790 0.76% - - -
First State High
Quality Bond Fund 779,073 0.68% - - -
First State Asian
Bond Fund 324,343 1.12% - - -

First State Global Umbrella Fund PLC
Notes forming part of the financial statements for the year ended
31 December 2017 (continued)
416
14. Related parties (continued)
The Company invests in the First State China A Shares Fund of First State Funds plc (“FS China A Shares
Fund”). The Alternative Investment Fund Manager of FS China A Shares Fund is First State Investments
(UK) Limited (a related party to the Investment Manager). Transactions entered into during the financial
year in respect of the FS China A Shares Fund are as follows:
Funds 2017 2016
Purchase Sale Purchase Sale
First State China Focus Fund - 319,940 - 258,187
First State Greater China Growth Fund - 234,590 - 268,172
First State China Growth Fund 12,277 6,211,828 - 4,807,340
Please refer to the Schedule of Investments for investments in FS China A Shares Fund as at financial
year end.
The CFSLI Re CFS Wholesale Global Corporate Debt Fund, held Nil (2016: 100%) of Class GBP III
Hedged (Dist) and 100% (2016: 100%) of Class V units in the First State Global Credit Income Fund.
The CFSLI Re CFS Wholesale Global Corporate Debt Fund is managed by Colonial First State
Investments Limited which is a Sub-Investment Manager of the Company.

First State Global Umbrella Fund PLC
Notes forming part of the financial statements for the year ended
31 December 2017 (continued)
417
14. Related parties (continued)
Affiliated entities to the Investment Manager hold shares for the Funds. The percentage ownership per
Fund held by such affiliated entities as at 31 December 2017 is as follows:
Shareholdings
Nominee accounts in the name of First State entities as of 31 December 2017 are:
Asian
Growth
Fund
China
Growth
Fund
Worldwide
Leaders
Fund
Hong Kong
Growth
Fund
Indian
Subcontinent
Fund
First State Nominees (Hong Kong) Ltd 0.02% 0.71% 0.03% 0.81% 0.17%
First State Global Balanced Fund - - 20.35% - -
First State Global 100 Growth Fund - - 47.78% - -
First State Asia Pacific Growth Fund 4.26% - - - -
First State Regional India Fund - - - - 5.32%
Global
Bond
Fund
High
Quality
Bond
Fund
Greater
China
Growth
Fund
Singapore
and
Malaysia
Growth
Fund
Asia
Opportunities
Fund
Asian
Equity
Plus
Fund
First State Nominees (Hong Kong)
Ltd 0.13% 0.26% 0.25% 0.91% 0.22% 0.10%
First State Dividend Advantage - - - - - 40.25%
First State Bridge - - - - - 14.38%
First State Global Balanced Fund 35.02% - - - -
First State Singapore Growth Fund - - - 64.83% - -
First State Regional China Fund - - 42.84% - - -
First State Asia Innovation & Tech - - - - 42.23% -
Asian
Bond
Fund
Asian
Quality
Bond
Fund
Global
Emerging
Markets
Leaders
Fund
Global
Resources
Fund
Asian
Property
Securities
Fund
China
Focus
Fund
First State Nominees (Hong Kong)
Ltd 0.32% - 0.14% 0.86% 4.06% 0.20%
First State Bridge - 78.24% - - - -
First State Asian Quality Bond - 1.49% - - - -
Global Listed
Infrastructure
Fund
Global Property
Securities
Fund
First State Nominees (Hong Kong) Ltd 0.02% -
First State Global Property Investments - 99.48%

First State Global Umbrella Fund PLC
Notes forming part of the financial statements for the year ended
31 December 2017 (continued)
418
14. Related parties (continued)
Shareholdings (continued)
Nominee accounts in the name of First State entities as of 31 December 2016 are:
Asian
Growth
Fund
China
Growth
Fund
Worldwide
Leaders
Fund
Hong Kong
Growth
Fund
Indian
Subcontinent
Fund
First State Nominees (Hong Kong) Ltd 0.02% 0.78% 0.03% 0.77% 0.24%
First State Global Balanced Fund - - 22.47% - -
First State Global 100 Growth Fund - - 45.65% - -
First State Asia Pacific Growth Fund 4.78% - - - -
First State Regional India Fund - - - - 6.06%
Global
Bond
Fund
High
Quality
Bond
Fund
Greater
China
Growth
Fund
Singapore
and
Malaysia
Growth
Fund
Asia
Opportunities
Fund*
Asian
Equity
Plus
Fund
First State Nominees (Hong Kong)
Ltd 0.16% 0.28% 0.24% 0.77% 0.25% 0.10%
First State Global Balanced Fund 35.27% - - - - -
First State Dividend Advantage - - - - - 48.43%
First State Bridge - - - - - 16.07%
First State Asia Innovation & Tech - - - - 49.05% -
First State Regional China Fund - - 45.54% - - -
First State Singapore Growth Fund - - - 61.30% - -
Asian
Bond
Fund
Asian
Quality
Bond
Fund
Global
Emerging
Markets
Leaders
Fund
Global
Resources
Fund
Asian
Property
Securities
Fund
China
Focus
Fund
First State Nominees (Hong
Kong) Ltd 0.55% - 0.14% 0.54% 3.77% 0.24%
First State Bridge - 60.12% - - - -
First State Asian Quality Bond - 1.20% - - - -
Global Listed
Infrastructure
Fund
Global
Agribusiness
Fund**
Global Property
Securities Fund
First State Nominees (Hong Kong) Ltd 0.03% - -
First State Global Property Investments - - 99.42%
* Formerly known as First State Asia Innovation Fund. **The First State Global Agribusiness Fund terminated on 8 November 2016.

First State Global Umbrella Fund PLC
Notes forming part of the financial statements for the year ended
31 December 2017 (continued)
419
14. Related parties (continued)
The subscriptions and redemptions made by the affiliated entities in each Fund as at 31 December 2017
and 31 December 2016 are as follows:
31 December 2017 Subscriptions Redemptions
US$ US$
First State Nominees (Hong Kong) Ltd 84,575 9,137,839
First State Services (UK) Ltd 4,668 4,473
First State Asia Opportunities Fund 1,866,113 3,359,000
First State Global Balanced Fund 710,869 1,971,000
First State Bridge 6,321,165,543 6,255,836,566
First State Global 100 Growth Fund 2,853,178 3,091,000
First State Singapore Growth Fund 1,188,163 4,535,000
First State Regional China Fund 20,321,367 58,052,000
First State Dividend Advantage 17,824,891,919 17,968,140,702
First State Regional India Fund 20,870,709 10,280,000
First State Asia Pacific Growth Fund 4,291,986 11,309,000
First State Asian Quality Bond Fund 40,668,073 39,659,986
First State Global Property Investment Fund 42,399,939 40,564,113
31 December 2016 Subscriptions Redemptions
US$ US$
First State Nominees (Hong Kong) Ltd 459,007 4,738,158
First State Services (UK) Ltd 7,591 1,141
First State Global Agribusiness Fund* 88,181 2,672,067
First State Asia Opportunities Fund** 436,605 3,585,000
First State Global Balanced Fund 1,280,810 1,139,000
First State Bridge 2,302,115,696 2,317,814,707
First State Global 100 Growth Fund 1,909,463 2,161,000
First State Singapore Growth Fund 636,501 3,537,000
First State Regional China Fund 7,287,421 58,751,000
First State Dividend Advantage 107,040,908 134,539,000
First State Regional India Fund 5,746,689 4,177,000
First State Asia Pacific Growth Fund 2,949,364 7,126,000
First State Asian Quality Bond Fund 8,967,000 80,000
First State Global Property Investment Fund 68,423,471 65,131,546
*The First State Global Agribusiness d.Fund terminated on 8 November 2016.
** Formerly known as First State Asia Innovation Fund.
*The First State Global Agribusiness Fund terminated on 8 November 2016.
** Formerly known as First State Asia Innovation Fund.
The Investment Manager may conduct cross trades with other sub funds which are also managed by the
Investment Manager. During the year ended 31 December 2017, the Company transacted with another
sub fund which is also managed by the Investment Manager. The transaction was carried out at the fair
value of the investment on the date of the transaction. The decision was in the best interest of the Fund
and fell within the investment objectives and policies of the Fund.

First State Global Umbrella Fund PLC
Notes forming part of the financial statements for the year ended
31 December 2017 (continued)
420
15. Significant shareholders
The table below represents the number of shareholders who had an entitlement of 20% or more in shares
in issue of the Funds of the Company as at 31 December 2017 and 31 December 2016.
Sub-Funds Number of Shareholders
Who own 20% or more
Number of Shareholders
Who own 20% or more
2017 2016
First State Asian Growth Fund 1 -
First State Asia Opportunities Fund 1 1
First State Asia Pacific Select Fund 1 1
First State Asia Pacific All Cap Fund 1 1
First State Asian Equity Plus Fund 1 1
First State Asian Bond Fund 2 1
First State Asian Quality Bond Fund 1 1
First State China Focus Fund 1 1
First State Emerging Market Bond Fund - 1
First State Global Bond Fund 2 2
First State Global Credit Income Fund 1 1
First State Global Listed Infrastructure Fund - 1
First State Global Resources Fund - 1
Stewart Investors Worldwide Leaders Fund 2 2
First State Greater China Growth Fund 1 1
First State High Quality Bond Fund 1 1
First State Hong Kong Growth Fund 1 1
First State Global Property Securities Fund 1 1
First State Indian Subcontinent Fund 1 1
First State Long Term Bond Fund 1 1
First State Singapore and Malaysia Growth Fund 1 1
Stewart Investors Worldwide Equity Fund 1 1
First State Japan Equity Fund 1 1
First State Sustainable Listed Infrastructure Fund 1 -

First State Global Umbrella Fund PLC
Notes forming part of the financial statements for the year ended
31 December 2017 (continued)
421
16. Significant events during the financial year
On 25 January 2017, the Central Bank of Ireland approved the revocation of the First State Australian
Growth Fund.
A supplement to the prospectus was issued on 30 March 2017.
On 7 April 2017, Colonial First Asset Management became manager for First State Global Credit Income
Fund.
The First State Emerging Market Bond Fund terminated on 23 November 2017.
An updated prospectus was issued on 14 December 2017, which related principally to the establishment
of the First State Sustainable Listed Infrastructure Fund.
The First State Sustainable Listed Infrastructure Fund launched on 20 December 2017.
17. Subsequent events
Matheson was appointed as a legal adviser in Ireland on 16 March 2018.
The First State Global Agribusiness Fund was revoked by the Central Bank of Ireland on 22 March 2018.
The registered office of the Company changed to 70 Sir John Rogerson’s Quay, Dublin 2, Ireland on 6
April 2018.
Matsack Trust Limited was appointed as Company Secretary on 6 April 2018.
First State Investments has made the decision to exit its Global Resources capability as it believes that
this asset class is becoming ever more specialised with some investors increasingly using other means to
gain investment exposure to these sectors. As of the date of these accounts, the First State Global
Resources Fund continues to be actively managed by the existing portfolio management team. The
Company will provide formal notification to all investors in the fund should this change.
18. Approval of the financial statements
The financial statements were approved by the Board of Directors on 20 April 2018.

First State Global Umbrella Fund PLC
Supplementary Information (Unaudited)
422
Additional information for investors in Switzerland
1. On going charge
The on going charges for each share class of each sub-fund for the year ended 31 December 2017 and
31 December 2016 is as follows:
31 December
2017
31 December
2016
First State Asian Growth Fund
Class I 1.61% 1.60%
Class II 1.61% 1.83%
Class III 0.91% 0.92%
Class I (Dist) 1.61% 1.63%
Class VI 0.96% 0.95% Class VI (Dist) 0.96% 0.95%
First State China Growth Fund
Class I 2.08% 2.08%
Class II 1.58% -
Class I (Dist) 2.08% 2.09%
Stewart Investors Worldwide Leaders Fund
Class I 1.72% 1.74%
Class III (G) 0.51% 0.54%
First State Hong Kong Growth Fund
Class I 1.61% 1.62%
Class III 1.07% 1.08%
First State Indian Subcontinent Fund
Class I 1.90% 1.94%
Class I (Dist) 1.90% 1.99%
Class II 1.65% -
Class III 1.10% 1.14%
First State Global Bond Fund
Class I 1.21% 1.23%
Class III 0.51% 0.52%
First State High Quality Bond Fund
Class I (Dist) 1.10% 1.11%
Class III 0.36% 0.37%
First State Long Term Bond Fund
Class III 0.34% 0.34%
First State Greater China Growth Fund
Class I 1.60% 1.60%
Class I (Dist) 1.60% 1.68%
Class III 1.09% 1.12%
Class III (Dist) 1.11% 1.14%

First State Global Umbrella Fund PLC
Supplementary Information (Unaudited) (continued)
423
Additional information for investors in Switzerland (continued)
1. On going charge (continued)
The on going charges for each share class of each sub-fund for the year ended 31 December 2017 and
31 December 2016 is as follows (continued):
31 December
2017
31 December
2016
First State Singapore and Malaysia Growth Fund
Class I 1.73% 1.75%
First State Asia Opportunities Fund
Class I 2.00% 2.03%
Class III 1.77% -
First State Asian Equity Plus Fund
Class I 1.58% 1.59%
Class I (Dist) 1.58% 1.59%
Class III 1.05% 1.21%
Class III (Dist) 1.04% 1.05%
Class III (GBP Dist) 1.10% 1.10%
First State Asian Bond Fund
Class I (Dist) 1.26% 1.35%
First State Asian Quality Bond Fund
Class I 1.08% 1.08%
Class I (Monthly Dist) 1.09% 1.08%
Class I (HKD Monthly Dist) 1.09% 1.08%
Class III - 0.40%
Class VI Distributing 0.35% 0.38%
Stewart Investors Global Emerging Markets Leaders Fund
Class I 1.61% 1.62%
Class III 0.91% 0.92%
First State Global Resources Fund
Class I 1.74% 1.75%
Class III 1.07% 1.14%
First State Global Property Securities Fund
Class I 1.73% 1.77%
Class VI (Dist) 0.98% 1.01%
First State Asian Property Securities Fund
Class I 1.76% 1.96%
Class I (Dist) 1.77% 1.78%
First State China Focus Fund
Class I 1.88% 1.88%
Class III 2.23% 1.32%

First State Global Umbrella Fund PLC
Supplementary Information (Unaudited) (continued)
424
Additional information for investors in Switzerland (continued)
1. On going charge (continued)
The on going charges for each share class of each sub-fund for the year ended 31 December 2017 and
31 December 2016 is as follows (continued):
31 December
2017
31 December
2016
First State Global Listed Infrastructure Fund
Class I (Dist) 1.61% 1.65%
Class III 0.92% 0.93%
Class VI 0.86% 0.87%
Class VI (Dist) 0.86% 0.90%
Class I 1.61% 1.66%
Class VI (GBP Dist) 0.86% 0.91%
Class I (EUR) 1.61% 1.63%
Class VI (EUR) 0.86% 0.90%
First State Asia Pacific Select Fund
Class I 1.61% 1.62%
Class III 0.92% 0.92%
Stewart Investors Worldwide Equity Fund
Class I 1.94% 2.07%
Class III 1.16% 1.21%
First State Emerging Markets Bond Fund
Class I - 1.39%
Class I (Dist) - 1.40%
Class I (Monthly Dist) - 1.40%
Class I (HKD Monthly Dist) - 1.30%
Class III - 1.37%
First State Global Credit Income Fund
GBP Class III Hedged Distributing 0.79% 0.82%
First State Asia Pacific All Cap Fund
Class III 1.37% 1.37%
First State Japan Equity Fund
Class I 1.89% 2.01%
Class III 1.10% 1.15%
Class VI (EUR) 1.13% 1.19%
First State Sustainable Listed Infrastructure Fund
Class VI 0.89% -
Class VI (EUR) 0.89% -
Class VI (GBP Dist) 0.89% -
Class E 0.59% -
Class E (EUR) 0.59% -
Class E (GBP Dist) 0.59% -

First State Global Umbrella Fund PLC
Supplementary Information (Unaudited) (continued)
425
Additional information for investors in Switzerland (continued)
2. Publications
The Articles of Association of the Company, the Prospectus, the Supplements and Key Investor
Information Documents for each sub fund and the annual and semi-annual reports of the Company can
be obtained, free of charge from the Swiss Representative and Paying Agent, the Distributor and the
Administrator.

First State Global Umbrella Fund PLC
Appendix – Unaudited
426
UCITS V – Disclosure of Remuneration Policy
Headcount
Total
Remuneration
(US$)
Directors Fees paid by First State Global
Umbrella Fund 3 112,500
of which
Fixed remuneration 3 112,500
Variable remuneration -
Performance Fees -
In line with the requirements of the UCITS Regulations, the Company has adopted a remuneration policy
which is consistent with the principles outlined in the ESMA guidelines on sound remuneration policies
under the UCITS Directive (the “Remuneration Guidelines”). The remuneration policy is appropriate to
the Company’s size, internal organisation and the nature, scope and complexity of its activities.
The Company’s remuneration policy applies to certain identified staff whose professional activities have
a material impact on the risk profile of the Company. As at 31 December 2017 the Company did not have
any employees and the Company’s remuneration policy applies only to members of the Company’s
management body (i.e. the board of directors).
Those directors who are independent and not affiliated with the Investment Manager receive a fixed
annual fee which is set out in the table above (all three directors served the full year). Fee levels are in
line with the fees paid by other Irish funds and compensates these directors for their tasks, expertise and
responsibilities in relation to their service to the Variable Capital Company (“VCC”). Those directors
who are also employees of the Investment Manager (or an affiliate) do not receive any fees for their
services as directors on the VCC.
Cybersecurity Risk
Cybersecurity breaches may occur allowing an unauthorized party to gain access to assets of the Funds,
Shareholder data, or proprietary information, or may cause the Company, the Investment Manager, the
Distributor, the Administrator or the Depositary to suffer data corruption or lose operational functionality.
The Funds may be affected by intentional cybersecurity breaches which include unauthorized access to
systems, networks, or devices (such as through “hacking” activity); infection from computer viruses or
other malicious software code; and attacks that shut down, disable, slow, or otherwise disrupt operations,
business processes, or website access or functionality. In addition, unintentional incidents can occur, such
as the inadvertent release of confidential information (possibly resulting in the violation of applicable
privacy laws). A cybersecurity breach could result in the loss or theft of Shareholder data or funds, the
inability to access electronic systems, loss or theft of proprietary information or corporate data, physical
damage to a computer or network system, or costs associated with system repairs. Such incidents could
cause the Company, the Investment Manager, the Distributor, the Administrator, the Depositary, or other
service providers to incur regulatory penalties, reputational damage, additional compliance costs, or
financial loss. Consequently, Shareholders may lose some or all of their invested capital. In addition, such
incidents could affect issuers in which a Fund invests, and thereby cause a Fund’s investments to lose
value, as a result of which investors, including the relevant Fund and its Shareholders, could potentially
lose all or a portion of their investment with that issuer.

First State Global Umbrella Fund PLC
HSBC Institutional Trust Services (Ireland) DAC
1 Grand Canal Square, Grand Canal Harbour, Dublin 2, D02 P820, Ireland
Tel: 00353 1 635 6000 Fax: 00353 1 649 7542
Directors: Ronnie Griffin, Ciara Houlihan, Margaret Sweeney, Mark Synnott, John vanVerre (Dutch)
Registered in Dublin, Ireland: Reg No. 181767 V.A.T. 6581767L
HSBC Institutional Trust Services (Ireland) DAC is regulated by the Central Bank of Ireland.
427
Annual Depositary Report to the Shareholders
We, HSBC Institutional Trust Services (Ireland) DAC, appointed Depositary to First State Global Umbrella Fund plc
(the “Company”) provide this report solely in favour of the Shareholders of the Company for the year ended 31
December 2017 (the “Accounting Period”). This report is provided in accordance with the UCITS Regulations –
European Communities (Undertakings for Collective Investment in Transferable Securities) Regulations 2011, as
amended (“the Regulations”). We do not, in giving this opinion, accept or assume responsibility for any other purpose
or to any other person to whom this report is shown.
In accordance with our Depositary obligation as provided for under the Regulations, we have enquired into the conduct
of the Company for the Accounting Period and we hereby report thereon to the Shareholders of the Company as
follows;
We are of the opinion that the Company has been managed during the Accounting Period, in all material respects:
(i) in accordance with the limitations imposed on the investment and borrowing powers of the Company by the
constitutional documents and the Regulations; and
(ii) otherwise in accordance with the provisions of the constitutional documents and the Regulations.
On behalf of
HSBC Institutional Trust Services (Ireland) DAC
1 Grand Canal Square
Grand Canal Harbour
Dublin 2
Ireland
20 April 2018

428
Independent auditors’ report to the members First State Global Umbrella Fund Plc (the “Company”)
Report on the audit of the financial statements
Opinion
In our opinion, First State Global Umbrella Fund plc’s financial statements:
give a true and fair view of the Company’s and Funds’ assets, liabilities and financial position as at 31 December 2017 and of their results and cash flows for the year then ended;
have been properly prepared in accordance with International Financial Reporting Standards (“IFRSs”) as adopted by the European Union; and
have been properly prepared in accordance with the requirements of the Companies Act 2014 and the European Communities (Undertakings for Collective Investment in Transferable Securities) Regulations 2011 (as amended).
We have audited the financial statements, included within the Annual Report and Audited Financial Statements, which comprise:
the Statement of Financial Position as at 31 December 2017;
the Statement of Comprehensive Income for the year then ended;
the Statement of Cashflows for the year then ended;
the Statement of Changes in Net Assets Attributable to Redeemable Participating Shareholders for the year then ended;
the Schedule of investments for each of the Funds as at 31 December 2017; and
the notes to the financial statements for the Company and for each of its Funds, which include a description of the significant accounting policies.
Basis for opinion
We conducted our audit in accordance with International Standards on Auditing (Ireland) (“ISAs (Ireland)”) and applicable law. Our responsibilities under ISAs (Ireland) are further described in the Auditors’ responsibilities for the audit of the financial statements section of our report. We believe that the audit evidence we have obtained is sufficient and appropriate to provide a basis for our opinion.
Independence
We remained independent of the Company in accordance with the ethical requirements that are relevant to our audit of the financial statements in Ireland, which includes IAASA’s Ethical Standard, and we have fulfilled our other ethical responsibilities in accordance with these requirements.
Conclusions relating to going concern
We have nothing to report in respect of the following matters in relation to which ISAs (Ireland) require us to report to you where:
the directors’ use of the going concern basis of accounting in the preparation of the financial statements is not appropriate; or
the directors have not disclosed in the financial statements any identified material uncertainties that may cast significant doubt about the Company’s and Funds’ ability to continue to adopt the going concern basis of accounting for a period of at least twelve months from the date when the financial statements are authorised for issue.
However, because not all future events or conditions can be predicted, this statement is not a guarantee as to the Company’s and Funds’ ability to continue as going concerns.

429
Independent auditors’ report to the members First State Global Umbrella Fund Plc (the “Company”) (continued)
Reporting on other information
The other information comprises all of the information in the Annual Report and Audited Financial Statements other than the financial statements and our auditors’ report thereon. The directors are responsible for the other information. Our opinion on the financial statements does not cover the other information and, accordingly, we do not express an audit opinion or, except to the extent otherwise explicitly stated in this report, any form of assurance thereon. In connection with our audit of the financial statements, our responsibility is to read the other information and, in doing so, consider whether the other information is materially inconsistent with the financial statements or our knowledge obtained in the audit, or otherwise appears to be materially misstated. If we identify an apparent material inconsistency or material misstatement, we are required to perform procedures to conclude whether there is a material misstatement of the financial statements or a material misstatement of the other information. If, based on the work we have performed, we conclude that there is a material misstatement of this other information, we are required to report that fact. We have nothing to report based on these responsibilities. With respect to the Directors’ Report, we also considered whether the disclosures required by the Companies Act 2014 have been included. Based on the responsibilities described above and our work undertaken in the course of the audit, ISAs (Ireland) and the Companies Act 2014 require us to also report certain opinions and matters as described below:
In our opinion, based on the work undertaken in the course of the audit, the information given in the Directors’ Report for the year ended 31 December 2017 is consistent with the financial statements and has been prepared in accordance with applicable legal requirements
Based on our knowledge and understanding of the Company and its environment obtained in the course of the audit, we have not identified any material misstatements in the Directors’ Report.
Responsibilities for the financial statements and the audit
Responsibilities of the directors for the financial statements
As explained more fully in the Directors’ Responsibilities Statement set out on page 1, the directors are responsible for the preparation of the financial statements in accordance with the applicable framework and for being satisfied that they give a true and fair view. The directors are also responsible for such internal control as they determine is necessary to enable the preparation of financial statements that are free from material misstatement, whether due to fraud or error. In preparing the financial statements, the directors are responsible for assessing the Company’s and Funds’ ability to continue as going concerns, disclosing as applicable, matters related to going concern and using the going concern basis of accounting unless the directors either intend to liquidate the Company or to cease operations, or have no realistic alternative but to do so.
Auditors’ responsibilities for the audit of the financial statements
Our objectives are to obtain reasonable assurance about whether the financial statements as a whole are free from material misstatement, whether due to fraud or error, and to issue an auditors’ report that includes our opinion. Reasonable assurance is a high level of assurance, but is not a guarantee that an audit conducted in accordance with ISAs (Ireland) will always detect a material misstatement when it exists. Misstatements can arise from fraud or error and are considered material if, individually or in the aggregate, they could reasonably be expected to influence the economic decisions of users taken on the basis of these financial statements. A further description of our responsibilities for the audit of the financial statements is located on the IAASA website at: https://www.iaasa.ie/getmedia/b2389013-1cf6-458b-9b8f-a98202dc9c3a/Description_of_auditors_responsibilities_for_audit.pdf.
This description forms part of our auditors’ report.

430
Independent auditors’ report to the members First State Global Umbrella Fund Plc (the “Company”) (continued)
Use of this report
This report, including the opinions, has been prepared for and only for the Company’s members as a body in accordance with section 391 of the Companies Act 2014 and for no other purpose. We do not, in giving these opinions, accept or assume responsibility for any other purpose or to any other person to whom this report is shown or into whose hands it may come save where expressly agreed by our prior consent in writing.
Other required reporting
Companies Act 2014 opinions on other matters
We have obtained all the information and explanations which we consider necessary for the purposes of our audit.
In our opinion the accounting records of the Company were sufficient to permit the financial statements to be readily and properly audited.
The financial statements are in agreement with the accounting records.
Companies Act 2014 exception reporting
Directors’ remuneration and transactions
Under the Companies Act 2014 we are required to report to you if, in our opinion, the disclosures of directors’ remuneration and transactions specified by sections 305 to 312 of that Act have not been made. We have no exceptions to report arising from this responsibility.

First State Global Umbrella Fund PLC
431
Directory
Registered Office: 10 Earlsfort Terrace, Dublin 2, D02 T380, Ireland
(from 1 January 2017 to 5 April 2018)
70 Sir John Rogerson’s Quay, Dublin 2, Ireland
(from 6 April 2018)
Investment Manager and Promoter
First State Investments (Hong Kong) Limited
Twenty Fifth Floor
One Exchange Square
8 Connaught Place
Central
Hong Kong
Sub-Investment Managers
First State Investments (Singapore)
38 Beach Road
#06-11 South Beach Tower
Singapore 189767
First State Investment Management (UK)
Limited
23 St Andrew Square
Edinburgh EH2 1BB
Scotland
Colonial First State Investments Limited
Ground Floor Tower 1
201 Sussex Street
Sydney
New South Wales
2000
Australia
Colonial First State Asset Management
(Australia) Limited
Ground Floor Tower 1
201 Sussex Street
Sydney
New South Wales
2000
Australia
Sub-Sub-Investment Managers (from 1
January 2017 to 7 April 2017)
Monegy, Inc.
First Canadian Place
100 King Street W.
42nd Floor
Toronto
ON M5X 1A1
Canada
Directors
*Peter Blessing (Irish)
Kate Dowling (Australian)
Adrian Hilderly (British)
*Bronwyn Wright (Irish)
*Kevin Molony (Irish)
Chris Turpin (British)
*Irish Resident and Independent
Legal advisers in Ireland (from 1 January 2017 to 16 March 2018)
Arthur Cox
10 Earlsfort Terrace
Dublin 2
D02 T380
Ireland
Legal advisers in Ireland
(from 16 March 2018)
Matheson
70 Sir John Rogerson’s Quay
Dublin 2
Ireland
Administrator and registrar
HSBC Securities Services (Ireland) DAC
1, Grand Canal Square, Grand Canal Harbour
Dublin 2
Ireland
Depositary
HSBC Institutional Trust Services (Ireland) DAC
1, Grand Canal Square, Grand Canal Harbour
Dublin 2
Ireland
Independent Auditors
PricewaterhouseCoopers
Chartered Accountants
and Registered Auditors
One Spencer Dock, North Wall Quay
Dublin 1
Ireland

First State Global Umbrella Fund PLC
432
Directory (continued)
Distributors
London office
First State Investments (UK) Limited
Finsbury Circus House
15 Finsbury Circus
London EC2M 7EB
England
Edinburgh office
First State Investments (UK) Limited
23 St Andrew Square
Edinburgh EH2 1BB
Scotland
Hong Kong office
First State Investments (Hong Kong) Limited
Twenty Fifth Floor
One Exchange Square
8 Connaught Place
Central
Hong Kong
Singapore office
First State Investments (Singapore)
38 Beach Road
#06-11 South Beach Tower
Singapore 189767
Secretary (from 1 January 2017 to 5 April 2018)
Bradwell Limited 10 Earlsfort Terrace
Dublin 2 D02 T380
Ireland
Secretary
(from 6 April 2018)
Matsack Trust Limited
70 Sir John Rogerson’s Quay
Dublin 2
Ireland
Swiss Representative and
Paying Agent BNP Paribas Securities Services
Paris, Succursale de Zurich
Selnaustrasse 16
CH-8002 Zurich
Switzerland

First State Investments (Hong Kong) Limited
Level 25One Exchange Square8 Connaught PlaceCentral, Hong Kong
Telephone: (852) 2846 7555Intermediary Hotline: (852) 2846 7575Investor Services Hotline: (852) 2846 7566Fax: (852) 2868 4742Email: [email protected]*
* The SFC has not reviewed the contents of this website.