cma energy market investigation—critique of cma …€¦ · 3.3 effect of customer life...
TRANSCRIPT
CMA Energy Market Investigation—critique of CMA consumer detriment analysis
Prepared for ScottishPower
March 2017
www.oxera.com

Oxera Consulting LLP is a limited liability partnership registered in England and Wales No. OC392464, registered office: Park Central, 40/41 Park End Street, Oxford, OX1 1JD, UK. The Brussels office, trading as Oxera Brussels, is registered in Belgium, SETR Oxera Consulting LLP 0651 990 151, registered office: Avenue Louise 81, Box 11, 1050 Brussels, Belgium. Oxera Consulting GmbH is registered in Germany, no. HRB 148781 B (Local Court of Charlottenburg), registered office: Rahel-Hirsch-Straße 10, Berlin 10557, Germany.
Although every effort has been made to ensure the accuracy of the material and the integrity of the analysis presented herein, Oxera accepts no liability for any actions taken on the basis of its contents.
No Oxera entity is either authorised or regulated by the Financial Conduct Authority or the Prudential Regulation Authority. Anyone considering a specific investment should consult their own broker or other investment adviser. Oxera accepts no liability for any specific investment decision, which must be at the investor’s own risk.
© Oxera 2017. All rights reserved. Except for the quotation of short passages for the purposes of criticism or review, no part may be used or reproduced without permission.
CMA Energy Market Investigation—critique of CMA consumer detriment analysis Oxera

CMA Energy Market Investigation—critique of CMA consumer detriment analysis Oxera
Contents
1 Overview 1
1.1 CMA’s past detriment analysis 2 1.2 Oxera critique 2 1.3 Detriment analysis in the CMA final report 3 1.4 Scope of this report 4
2 Estimating the size of the CMA’s adjustments 8
3 The CMA’s adjustment for customer acquisition costs 9
3.1 The CMA’s approach 9 3.2 Potential shortcomings of the CMA’s approach 9 3.3 Effect of customer life assumption on the CACs adjustments 10
4 The CMA’s adjustments for overhead costs 12
4.1 The CMA’s approach 12 4.2 Potential shortcomings of the CMA’s approach 12
5 Did the CMA use an appropriate benchmark? 14
5.1 Changes in pricing incentives as market shares evolve 14 5.2 Quantitative modelling of pricing incentives 15 5.3 Academic literature on pricing strategies 16 5.4 Conclusions 17
6 Other issues raised with the CMA’s detriment analysis 19
6.1 Exclusion of Co-op Energy from the set of benchmarks 19 6.2 Benchmarking of wholesale costs 20
7 Split of estimated detriment between the SLEFs 23
7.1 Methodology 23 7.2 Results 23
A1 Model assumptions 26
A2 Sensitivity to dual-fuel detriment split between gas and electricity accounts 28

CMA Energy Market Investigation—critique of CMA consumer detriment analysis Oxera
Table 1.1 Corrections to CMA’s detriment analysis (£m per annum) 6 Table 2.1 Potential range of CMA’s CACs and OHCs adjustments (£m) 8 Table 3.1 Sensitivity of CACs adjustment to customer life assumption 10 Table 5.1 Description of the pricing scenarios tested by Oxera 15 Figure 5.1 Total number of customers lost (fixed tariff and SVT) 16 Figure 7.1 Average annual detriment, 2012–15 (£m) 24 Figure 7.2 Yearly detriment, 2012–15 (£m) 24 Figure A2.1 Average detriment, 2012–15 (£m) 28 Figure A2.2 Yearly detriment, 2012–15 (£m) 28
CMA Energy Market Investigation—critique of CMA consumer detriment analysis Oxera
1
1 Overview
On 24 June 2016 the Competition and Markets Authority (CMA) published its final report, in which it concluded that, between 2012 and 2015, domestic customers paid around £1.4bn per year more than they would have done in a properly functioning competitive market.1 This estimate was based on a comparison of tariffs charged by the established suppliers to tariffs charged by the benchmark companies chosen by the CMA, OVO Energy, and First Utility, subject to certain adjustments.
The CMA’s final estimate of consumer detriment had not been subject to consultation, and the final report contains only limited detail on how it was calculated; the CMA had not opened its analysis to detailed scrutiny. However, as the analysis in this report shows, adjustments for customer acquisition and overhead costs, which the CMA made for the first time in its final report, have a significant impact on the estimates of overall consumer detriment, of no less than £978m per year.
ScottishPower asked Oxera to review the analysis carried out by the CMA. Our key findings were as follows.
Customer acquisition costs: the CMA used an assumption on the average life of a customer that is likely to be inappropriate for the benchmark companies in its analysis. This could create an upward bias in its estimates of consumer detriment.
Overhead costs: the CMA’s methodology for calculating the overhead cost adjustment is unreliable, and this adjustment should not be applied to estimates of consumer detriment.
Wholesale costs: differences in wholesale costs at the time chosen for setting the benchmark may have been driven largely by luck rather than differences in efficiency, and hence should not form part of the CMA’s detriment analysis.
Benchmark companies: it may not be appropriate to use the historical prices of OVO Energy and First Utility as benchmarks for the market as a whole. These businesses have sought to achieve rapid growth in their customer base, and their pricing is therefore unlikely to reflect an equilibrium position. In addition, the CMA has not provided a reasonable justification for excluding Co-op Energy from the set of benchmark companies, which creates an upward bias in its estimates of consumer detriment.
Addressing these issues would leave the range of possible consumer detriment between -£720m and +£755m.
Finally, our analysis of the split of estimated consumer detriment among the large energy suppliers found that the two largest suppliers—Centrica and SSE—may account for around 75% of the overall estimated detriment, with ScottishPower and EDF appearing to make no contribution to the estimated detriment at all.
1 Competition and Markets Authority (2016), ‘Energy market investigation: final report’, 24 June.

CMA Energy Market Investigation—critique of CMA consumer detriment analysis Oxera
2
1.1 CMA’s past detriment analysis
The first estimate of customer detriment published by the CMA in the energy market investigation was set out in its provisional findings report.2 The CMA provisionally found that during the period 2009–13, domestic customers paid around £1.2bn per year more than they would have had competition functioned more effectively.
The CMA reached this conclusion by comparing the average prices offered by the Six Large Energy Firms (SLEFs) over the period 2009–13 with a ‘competitive benchmark price level’. The benchmark price was designed to approximate the price level that would have allowed firms to recover what the CMA considered to be an efficient level of costs and to earn a fair rate of return on capital employed. The CMA estimated the total prices that it considered the SLEFs would have charged in conditions of effective competition. It then calculated the total amount by which the actual prices charged by the SLEFs to domestic customers exceeded that estimated total competitive price. The difference between the two figures averaged £1.2bn per year.
The CMA published its provisional decision on remedies on 17 March 2016.3 This document contained a revised estimate of customer detriment, based on a substantially different methodology from that employed in the provisional findings report. Using what it described as a ’direct’ approach to assessing customer detriment, the CMA estimated that the detriment to the domestic customers of the SLEFs was approximately £1.7bn per year on average for the period 2012–15. The ‘direct’ approach involved comparing the average prices offered by the SLEFs with a different benchmark price. The new benchmark was constructed from the average of the prices offered by the ‘most competitive’ suppliers (specifically OVO Energy and First Utility), adjusted for exogenous cost differences relating to network costs and estimated costs associated with different payment methods. These adjustments were said to ensure that the price comparison between the SLEFs and the firms used in the calculation of the benchmark was broadly like for like in terms of underlying costs.
1.2 Oxera critique
We reviewed the CMA’s ‘direct’ analysis of consumer detriment through a confidentiality ring (opened on 17 March 2016) and made a confidential submission to the CMA. A non-confidential version of the submission (‘the Oxera Report’) was annexed to ScottishPower’s response to the provisional decision on remedies, which was submitted on 12 April 2016.4
In the Oxera Report, we identified a number of errors in the CMA’s analysis. The main error related to the CMA’s treatment of the costs of the social and environmental obligations to which energy suppliers are subject. Our analysis indicated that the CMA had not accounted for substantial differences between suppliers in the costs of these obligations, arising from: the fact that certain social and environmental obligations provide for an exemption or a lower obligation rate for smaller suppliers; and a time lag effect in how these obligations are calculated (such that businesses with growing customer bases are subject to lower costs per customer because the charges are determined by historical customer numbers). The CMA had, in effect, failed to adjust for the
2 Competition and Markets Authority (2015), ‘Energy market investigation: provisional findings report’, 7 July. 3 Competition and Markets Authority (2016), ‘Energy market investigation: provisional decision on remedies’, 17 March. 4 ScottishPower, ‘Competition and Markets Authority Energy Market Investigation, ScottishPower’s Response to the Provisional Decision on Remedies’, pp. 56–74.

CMA Energy Market Investigation—critique of CMA consumer detriment analysis Oxera
3
substantial cost advantage that OVO Energy and First Utility enjoyed as compared with the SLEFs, simply because they were relatively small and growing rapidly. This meant that the CMA’s pricing comparison had not in fact been like for like, and therefore the benchmark price did not represent a fair estimate of the prices that the SLEFs would have charged under conditions of effective competition.
We calculated that, had the CMA correctly accounted for these cost obligations, the effect would have been to reduce the detriment figure to less than one-quarter of the figure in the provisional decision on remedies (from £1.715bn to £362m, a reduction of £1.353bn). Other factors identified in the Oxera Report that further biased upwards the CMA’s estimate of consumer detriment related to:
i) the CMA’s decision to exclude another mid-tier supplier, Co-op Energy, from its benchmarking calculations;
ii) the CMA’s failure to adjust the benchmark price to allow a reasonable return on capital employed, despite the intermittently loss-making nature of the businesses of OVO Energy and First Utility during the benchmark period;
iii) the fact that the ‘direct’ approach implicitly benchmarked the wholesale costs of different suppliers, and hence differences in prices could reflect merely the differing fortunes of various equally efficient wholesale purchasing strategies in the reference period, rather than differences in efficiencies or a lack of effective competition.
The effect of correcting for these other factors was to eliminate the remainder of the CMA’s detriment figure.
1.3 Detriment analysis in the CMA final report
In its final report, published on 24 June 2016,5 the CMA concluded that, based on the direct method, the average domestic customer detriment between 2012 and 2015 was around £1.4bn per year. This was estimated to be due to a combination of higher profitability and lower cost efficiency of the SLEFs relative to the benchmark chosen by the CMA. The final report contains only limited detail on how the CMA calculated the final detriment figures. However, it appears that the ‘direct’ approach adopted in the final report is similar to that used in the provisional decision on remedies, subject to three additional categories of adjustment made in constructing the benchmark price, relating to social and environmental costs, customer acquisition costs (CACs) and (other) overhead costs (OHCs). The first additional adjustment appears conceptually the same as that proposed in the Oxera Report in respect of social and environmental costs, albeit the CMA was able to use data on the actual costs of the benchmark suppliers that was not available to us.
The overall change in the customer detriment figure between the provisional decision on remedies and the final report (£1.7bn reduced to £1.4bn) is smaller than would result from adjusting for social and environmental costs only. The CMA’s adjustment for social and environmental costs would have significantly reduced the detriment from £1.7bn per annum to around £0.4bn per annum (similar to that set out in the Oxera Report).6 The fact that the overall detriment was £1.4bn (a reduction of only £0.35bn) was because of the countervailing effect of two new adjustments, in respect of CACs and OHCs, made in the final 5 Competition and Markets Authority (2016), ‘Energy market investigation: final report’, 24 June. 6 ScottishPower, ‘Competition and Markets Authority Energy Market Investigation, ScottishPower’s Response to the Provisional Decision on Remedies’, pp. 56–74.

CMA Energy Market Investigation—critique of CMA consumer detriment analysis Oxera
4
report. In the absence of these two further adjustments, which did not feature in the provisional decision on remedies or any preceding analysis, the final report would have shown a much smaller detriment.
The two adjustments were as follows. First, the CMA capitalised the CACs of OVO Energy and First Utility, amortising them over a six-year period. It reasoned that these suppliers were rapidly growing their customer bases and would be incurring upfront acquisition costs that would not reflect the costs per customer that would be incurred in a steady state (i.e. in circumstances more like those of the SLEFs). The effect of this was to move costs from within the reference period to outside the reference period, and so, all else being equal, lower the benchmark price and increase the measured detriment.
Second, the CMA made a downward adjustment to the OHCs of OVO Energy and First Utility on the basis that, as their customer bases grew, the CMA considered that their costs would be likely to decline as a proportion of their revenue. All else being equal, the effect of this adjustment was also to lower the benchmark price and increase the measured detriment. The limited information disclosed in the final report does not allow us to determine the precise impact of these adjustments. However, it appears that the adjustments in respect of CACs and OHCs were significant enough to largely offset the effect of the adjustment for social and environmental costs. The CAC and OHC adjustments are therefore essential to the CMA’s finding of a detriment as high as £1.4bn.
1.4 Scope of this report
ScottishPower asked us to consider whether the detriment analysis carried out by the CMA for its final report was based on sound economic principles, and whether the analysis supports the CMA’s conclusion that energy consumers suffered a significant detriment during the period covered by the CMA’s benchmarking analysis. This document presents our findings given the information contained in the final report and associated appendices.
We understand that the CMA was unwilling to make the details of its latest consumer detriment analysis available in a confidentiality ring, in order to ensure that the process of iteration between responses to CMA outputs and the CMA making adjustments to its analysis would not continue indefinitely. While this is reasonable in principle, in this case the CMA’s latest detriment analysis contains new elements that have a major impact on the findings, and none of the industry participants has had a chance to analyse and comment on these. Our analysis shows that these adjustments could potentially account for the bulk of the consumer detriment estimated by the CMA.
We examined the CAC and OHC adjustments carried out by the CMA, which, on the basis of the limited information contained in the CMA’s final report and associated appendices, could increase estimates of consumer detriment by a range of £978m–£2,533m per annum. The key analysis of the CMA relating to the existence of customer detriment as a result of excessive pricing has not been tested and hence the CMA’s conclusions remain open to doubt.
With regard to CACs, we found that:
the CMA’s approach was vulnerable to differences in cost accounting between different suppliers; and
the CMA made an assumption on the average customer lifetime for the benchmark firms that is likely to be biased. Using different assumptions could lead to a significant reduction to the CAC adjustment.

CMA Energy Market Investigation—critique of CMA consumer detriment analysis Oxera
5
With regard to OHCs, we found that the CMA used a methodology that:
is unreliable, placing excessive weight on the costs of First Utility; and
creates the risk that the adjustment is driven simply by normal statistical variation in the OHCs of different suppliers.
We considered whether the CMA had used an appropriate benchmark in its detriment analysis by comparing established businesses to new entrants that have grown their market share rapidly by pricing aggressively to win new customers. Qualitative economic reasoning, as well as evidence from academic literature and the results of our modelling of consumer switching and supplier pricing incentives, all point to the conclusion that the mid-tier suppliers, whose prices were used by the CMA as the benchmark, face an increasing incentive to profit from their investment in a growing market share. Hence, historical pricing by the mid-tier firms is unlikely to represent an appropriate benchmark for the steady-state prices observed in a competitive market.
We also considered the arguments that the CMA used to justify not making adjustments for differences in wholesale costs between different suppliers and not including Co-op Energy in the set of benchmark companies, as we had argued in past submissions.
The reason used by the CMA to avoid having to make adjustments for differences in wholesale costs appears to be contrary to some aspects of its own approach.
With regard to excluding Co-op Energy from the set of benchmark companies, the CMA uses the dividends paid out to Co-op Energy customers as a basis for rejecting Co-op Energy as a benchmark, but provides no justification for not making a straightforward adjustment for these dividends. It also argues that factors that make Co-op Energy’s customers more representative of the population of UK households make the company less suitable as a benchmark. We do not consider these arguments to be valid, and consider that using just two suppliers to form the benchmark risks the results of the detriment analysis being affected by normal statistical variation in the suppliers’ costs.
Analysis that we have undertaken provides an indication of the extent to which the issues set out above could affect the CMA’s estimates of consumer detriment.
CACs: given that the benchmark firms have grown their market share rapidly by enticing some of the most mobile customers with low-priced offers, the average customer life of the benchmark firms is likely to be significantly lower than the industry average of six years.7 This suggests that the appropriate range of values for the CAC adjustment could be based on a three- to five-year customer life assumption.
OHCs: the CMA’s methodology for calculating the OHC adjustment is unreliable and this adjustment should be omitted entirely. The potential value
7 Data provided to Oxera by ScottishPower suggests that the average customer life of the benchmark firms is unlikely to exceed five years.

CMA Energy Market Investigation—critique of CMA consumer detriment analysis Oxera
6
of this adjustment can be based on the range of EBIT (earnings before interest and tax) adjustments reported by the CMA.8
Wholesale costs: differences in wholesale costs may be driven largely by luck rather than differences in efficiency. Hence it is not appropriate to benchmark them, either explicitly or implicitly, by benchmarking tariffs of firms with potentially different wholesale hedging strategies. Using the lower quartile of wholesale costs of the SLEFs over the period 2012–15 as a benchmark provides an upper estimate of an adjustment that could be made to capture potential differences in wholesale costs between the SLEFs and the benchmark firms.
Co-op: the CMA has not provided a reasonable justification for excluding Co-op from the list of benchmarks, aside from dividends being payable to Co-op Energy customers. We have estimated the effect of including Co-op Energy in the set of benchmarks after adjusting for dividends receivable by Co-op customers.
The cumulative impact of adjusting the CMA’s detriment analysis as described above is set out in Table 1.1.
Table 1.1 Corrections to CMA’s detriment analysis (£m per annum)
Low High
CMA estimate of consumer detriment1 1,371
Adjustment for CACs -269 -48
Detriment adjusted for CACs 1,102 1,323
Adjustment for OHCs -1,162 -375
Detriment adjusted for CACs and OHCs -60 948
Adjustment for wholesale costs2 -467 0
Detriment adjusted for CACs, OHCs and wholesale costs -527 948
Adjustment for inclusion of Co-op in set of benchmarks -193
Total adjusted detriment -720 755
Notes: 1 CMA (2016), ‘Energy market investigation: final report’, 24 June, p. 612. Average annual detriment is calculated by dividing total detriment for the period 2012–15 by the number of years covered by the analysis. 2 Since data on the wholesale costs of the benchmark firms was not available to us, it is not certain that those costs were higher than the corresponding costs of the SLEFs. Therefore, the minimum theoretical adjustment for wholesale cost differences is set at zero.
Source: Oxera.
Given the limited amount of detail provided in the CMA’s final report, the numbers set out above encompass a wide range. However, they show that the cumulative impact of the corrections to the CMA’s detriment analysis that we have identified would leave the range of possible consumer detriment between -£720m and +£755m.
Finally, we undertook analysis to estimate the split of consumer detriment calculated by the CMA among the SLEFs. Under a reasonable set of assumptions, the main finding from the analysis was that two of the SLEFs are likely to account for the bulk of the estimated detriment.
8 Competition and Markets Authority (2016), ‘Energy market investigation: Final report. Appendix 10.1: Domestic retail detriment direct approach – adjustments to competitive benchmark prices’, 24 June, p. A10.1–15.
CMA Energy Market Investigation—critique of CMA consumer detriment analysis Oxera
7
This remainder of this document is structured as follows:
section 2 estimates the size of the CMA’s CAC and OHC adjustments;
section 3 reviews the CMA’s adjustments for CACs;
section 4 reviews the CMA’s adjustments for OHCs;
section 5 considers whether the benchmark used by the CMA in its detriment analysis is consistent with a sustainable market;
section 6 considers other issues raised with the CMA’s detriment analysis that were not addressed in the final report;
section 7 estimates the split of detriment calculated by the CMA between the SLEFs.
CMA Energy Market Investigation—critique of CMA consumer detriment analysis Oxera
8
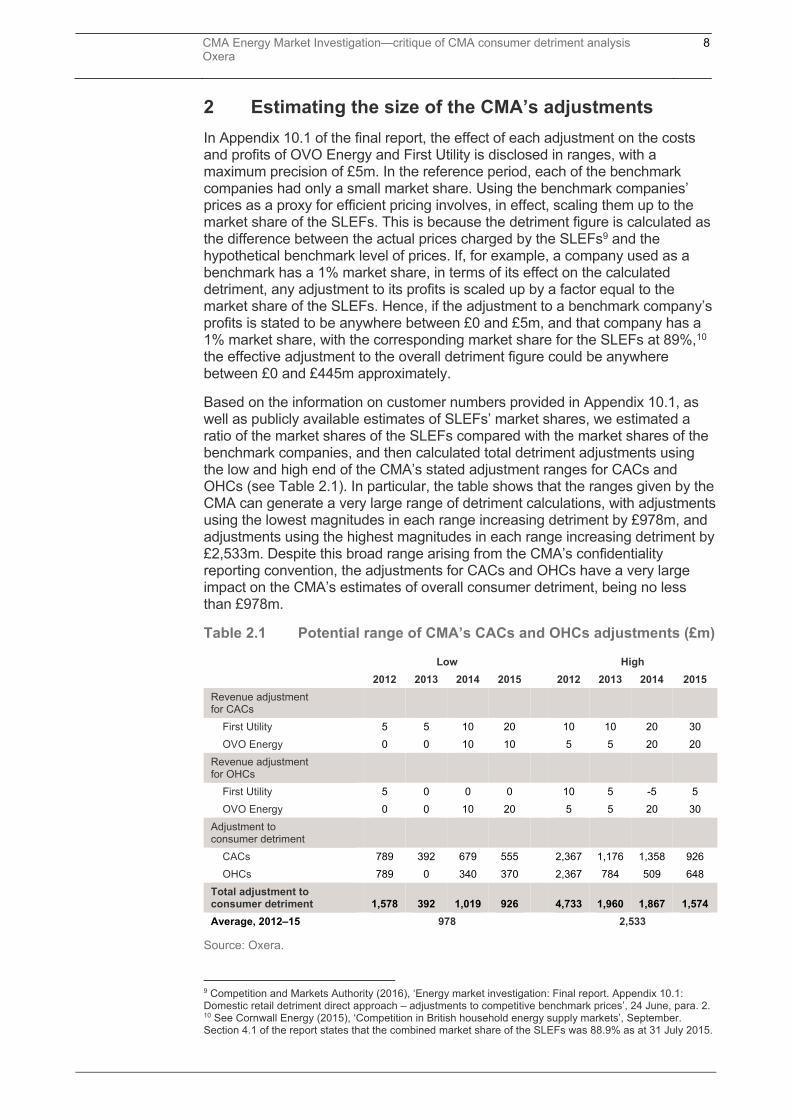
2 Estimating the size of the CMA’s adjustments
In Appendix 10.1 of the final report, the effect of each adjustment on the costs and profits of OVO Energy and First Utility is disclosed in ranges, with a maximum precision of £5m. In the reference period, each of the benchmark companies had only a small market share. Using the benchmark companies’ prices as a proxy for efficient pricing involves, in effect, scaling them up to the market share of the SLEFs. This is because the detriment figure is calculated as the difference between the actual prices charged by the SLEFs9 and the hypothetical benchmark level of prices. If, for example, a company used as a benchmark has a 1% market share, in terms of its effect on the calculated detriment, any adjustment to its profits is scaled up by a factor equal to the market share of the SLEFs. Hence, if the adjustment to a benchmark company’s profits is stated to be anywhere between £0 and £5m, and that company has a 1% market share, with the corresponding market share for the SLEFs at 89%,10 the effective adjustment to the overall detriment figure could be anywhere between £0 and £445m approximately.
Based on the information on customer numbers provided in Appendix 10.1, as well as publicly available estimates of SLEFs’ market shares, we estimated a ratio of the market shares of the SLEFs compared with the market shares of the benchmark companies, and then calculated total detriment adjustments using the low and high end of the CMA’s stated adjustment ranges for CACs and OHCs (see Table 2.1). In particular, the table shows that the ranges given by the CMA can generate a very large range of detriment calculations, with adjustments using the lowest magnitudes in each range increasing detriment by £978m, and adjustments using the highest magnitudes in each range increasing detriment by £2,533m. Despite this broad range arising from the CMA’s confidentiality reporting convention, the adjustments for CACs and OHCs have a very large impact on the CMA’s estimates of overall consumer detriment, being no less than £978m.
Table 2.1 Potential range of CMA’s CACs and OHCs adjustments (£m)
Low High
2012 2013 2014 2015 2012 2013 2014 2015
Revenue adjustment for CACs
First Utility 5 5 10 20 10 10 20 30
OVO Energy 0 0 10 10 5 5 20 20
Revenue adjustment for OHCs
First Utility 5 0 0 0 10 5 -5 5
OVO Energy 0 0 10 20 5 5 20 30
Adjustment to consumer detriment
CACs 789 392 679 555 2,367 1,176 1,358 926
OHCs 789 0 340 370 2,367 784 509 648
Total adjustment to consumer detriment 1,578 392 1,019 926
4,733 1,960 1,867 1,574
Average, 2012–15 978 2,533
Source: Oxera.
9 Competition and Markets Authority (2016), ‘Energy market investigation: Final report. Appendix 10.1: Domestic retail detriment direct approach – adjustments to competitive benchmark prices’, 24 June, para. 2. 10 See Cornwall Energy (2015), ‘Competition in British household energy supply markets’, September. Section 4.1 of the report states that the combined market share of the SLEFs was 88.9% as at 31 July 2015.
CMA Energy Market Investigation—critique of CMA consumer detriment analysis Oxera
9
3 The CMA’s adjustment for customer acquisition costs
3.1 The CMA’s approach
To put the CACs of the benchmark companies on a basis consistent with a stable customer base, the CMA appears to have taken the actual CACs for OVO Energy and First Utility in the reference years and made two adjustments:
the costs identified as CACs are removed from the total costs in the year in which they were incurred;
the CACs are then treated as capital costs and depreciated on a straight-line basis over a six-year period (such that, for example, one-sixth of the CACs incurred in 2012 are included as a cost in each year from 2012 to 2017).
The net effect of these adjustments is to reduce the CACs that are taken into account in calculating the profits for the reference years (2012–15), with the later years seeing the most marked effect. This effect is seen mainly because CACs incurred late in the reference period are removed from the reference period through being allocated in large part to years beyond 2015.
3.2 Potential shortcomings of the CMA’s approach
We have reviewed the CAC analysis conducted by the CMA, subject to the limitation of the information contained in the final report and associated appendices. In this process, we identified a number of aspects of the analysis that could result in estimates of consumer detriment being biased.
3.2.1 CACs incurred prior to 2012
The CMA did not adjust for CACs incurred prior to 2012, which should be partly depreciated over the reference period (e.g. costs incurred in 2009 should be depreciated until 2014). This is likely to lead to an upward bias in the CMA’s estimates of consumer detriment since the cost associated with depreciation of CACs incurred prior to 2012 would simply not be reflected in the CMA’s analysis, making the benchmark companies appear more efficient relative to the SLEFs.
3.2.2 Cost accounting
The CMA’s analysis of CACs is vulnerable to differences in cost accounting between different firms, which can bias the results of consumer detriment analysis. In particular, if an OHC item is incorrectly assigned to CACs for a firm whose costs are used as a benchmark, the proportion of the firm’s total costs treated as capital costs would increase. Since capital costs are depreciated over six years, a greater proportion of total costs will now fall outside of the reference period. The overall effect would be a reduction in the total adjusted costs of the firm in the reference period and an increase in the measured detriment. Although the higher CACs that have been treated as capital would eventually flow through into the cost base of the benchmark company, this increase would occur in large part outside the period of the CMA’s analysis.
3.2.3 Average customer life
In selecting the period over which CACs are depreciated, the CMA has used the assumption that the average customer life for OVO Energy and First Utility is six years. The CMA selected this figure on the basis that it is the average for the

CMA Energy Market Investigation—critique of CMA consumer detriment analysis Oxera
10
industry as a whole.11 This assumption is likely to be inappropriate and might bias the results of its calculations. OVO Energy and First Utility are likely to have shorter average customer lives. Given that the benchmark providers have rapidly grown their market share by pricing aggressively, partly supported by the exemption from certain social and environmental obligations for smaller suppliers, it is likely that they have acquired the most mobile customers. In view of the intermittent nature of most customer acquisition campaigns, these customers are unlikely to remain with their existing supplier for as long as the average energy customer.
The CMA states that assuming a shorter average customer life does not make a significant difference to the results of its analysis.12 However, the actual assumption as to customer life used by the CMA in this sensitivity analysis and its justification are not disclosed.
3.3 Effect of customer life assumption on the CACs adjustments
To test the CMA’s proposition—that assuming a shorter average customer life does not make a significant difference to estimates of the CACs adjustments—we analysed the potential effect of the assumption on the average customer life. Given that the CMA had not made its calculations or data available to us, this additional analysis relied on certain assumptions. In particular, data on the number of customers for OVO Energy and First Utility was published by the CMA in Appendix 10.1, but assumptions had to be made on the annual rate of customer churn (implying an average customer life) and on the average CACs for these firms. For the purposes of our analysis, ScottishPower made corresponding data available for its own business, which we used to proxy the customer churn rate and CACs of the benchmark firms.13
We replicated the CMA’s stated approach to capitalising and depreciating CACs of OVO Energy and First Utility, and then scaled the resulting changes in cost to calculate the effect of these adjustments on consumer detriment. The only change to the CMA’s methodology was to include 2011 CACs for OVO Energy and First Utility in the calculation. As explained above, this is the correct approach given that depreciation of 2011 CACs should be included in the benchmark period. Table 3.1 shows the sensitivity of the estimated CACs adjustment to the benchmark suppliers’ cost base to changes in the assumption on the average customer life.
Table 3.1 Sensitivity of CACs adjustment to customer life assumption
Average customer life (years) 1 2 3 4 5 6
Estimated adjustment to average annual consumer detriment (£m)
0 397 656 796 876 924
Source: Oxera.
The results of the sensitivity analysis presented above show that the size of the CACs adjustment to consumer detriment estimates can be significantly influenced by the assumption on the average customer life. If, in the process of rapidly growing their market share through aggressive pricing, OVO Energy and
11 Competition and Markets Authority (2016), ‘Energy market investigation: Final report. Appendix 10.1: Domestic retail detriment direct approach – adjustments to competitive benchmark prices’, 24 June, para. 30. 12 Ibid., para. 31. 13 The churn rate for the benchmark firms in each year was assumed to be the same as the average churn rate for ScottishPower in the period from 2009 up to the relevant year. Since ScottishPower data on the customer churn rate and per customer acquisition cost was available up to 2013 only (ScottishPower was not able to produce this data for 2014 and 2015), corresponding data for 2014 and 2015 was assumed to be the same as for 2013.

CMA Energy Market Investigation—critique of CMA consumer detriment analysis Oxera
11
First Utility have acquired the most mobile customers, who are unlikely to remain with their existing supplier for as long as the average energy customer, it is plausible that the correct assumption on the average customer life for these firms is significantly less than six years. For example, changing the assumption to two years results in a 57% decrease in the size of the adjustment (£397m instead of £924m).
Unless the CMA discloses data on the average life of the customers of OVO Energy and First Utility, it is not possible to tell the extent to which the CMA’s use of a six-year average life assumption is likely to bias the result of its consumer detriment analysis. However, given the results of the sensitivity analysis presented above, it is possible that this bias could be significant.

CMA Energy Market Investigation—critique of CMA consumer detriment analysis Oxera
12
4 The CMA’s adjustments for overhead costs
4.1 The CMA’s approach
Our understanding is that the CMA determined the benchmark for OHCs (excluding CACs) as a fixed percentage of revenues, to reflect the assumed steady-state OHCs of both OVO Energy and First Utility. We also understand that, in the process, the CMA controlled for exogenous differences in each supplier’s customer base that are likely to affect costs, notably network charges, and its estimates of the costs associated with different payment methods.14 From the information contained in Appendix 10.1, we were not able to determine exactly how this fixed percentage was calculated. The CMA indicates that actual OHCs of First Utility as a percentage of revenues played a significant role in this calculation.15 Paragraph 10.28(c) of the final report provides some further information, as follows:
We adjusted their overhead costs as a percentage of revenues to be in line with First Utility’s actual overhead costs in 2014 and 2015 and with OVO Energy’s forecast overhead costs to reflect the level of overhead costs that we would expect to see in a large firm operating with a stable customer base (ie one which was neither growing, nor shrinking materially year on year).
It is not clear whether the CMA took an average for First Utility’s OHCs as a percentage of revenues for the whole period or for the more limited period of 2014–15, or whether it weighted the later years more heavily in an overall calculation. It is also not clear what role OVO Energy’s actual or projected OHCs played in the calculation, although the CMA states:
[T]his adjustment has a relatively minor impact on First Utility’s cost base over the period, since it is based on its own achieved costs... [emphasis added]16
This indicates that OVO Energy’s actual costs during the reference period are given little weight.
To implement the adjustment, after subtracting actual OHCs net of CACs from the benchmark suppliers’ cost base, the CMA added the benchmark OHCs to the adjusted cost base of benchmark suppliers. Thus, the CMA replaced actual OHCs with figures calculated as a fixed proportion of revenues in each year. The CMA appears to have considered this approach to be necessary because OVO Energy in particular had incurred exceptional or otherwise unrepresentative costs in the reference period. The CMA reasoned that such costs would not be expected were the benchmark firm to have been operating on a larger scale and at a steady state (rather than growing rapidly).17
4.2 Potential shortcomings of the CMA’s approach
Given the lack of clarity on the precise methodology employed by the CMA, we were unable to replicate the basis on which the adjustments for OHCs were carried out. In addition, given that the CMA has not explained the rationale for judging some of OVO Energy’s costs to be exceptional, and that it has not set out the magnitude of these elements, we were not able to assess whether the
14 Incorrect estimates of costs associated with different payment methods would be likely to result in errors in the CMA’s detriment calculations. However, analysis of the CMA’s estimates of these costs is outside the scope of Oxera’s analysis. 15 Competition and Markets Authority (2016), ‘Energy market investigation: Final report. Appendix 10.1: Domestic retail detriment direct approach – adjustments to competitive benchmark prices’, 24 June, para. 38. 16 Ibid., para. 39. 17 Ibid., paras 33–38.

CMA Energy Market Investigation—critique of CMA consumer detriment analysis Oxera
13
effective exclusion of OVO Energy’s OHCs from the benchmarking calculations is justifiable.
Even without knowledge of the underlying data, the methodology itself appears to be unreliable and may bias the results of any calculations. By giving a very high apparent weighting to the OHCs of First Utility in its benchmarking exercise, the methodology employed by the CMA appears to be equivalent to predominantly employing First Utility as the benchmark for the OHCs of the SLEFs. Given the natural variation in actual OHCs and accounting between different companies and over time, if one company’s data over a short period is employed as a benchmark, there is a significant chance that the consumer detriment results are largely driven by the choice of the benchmark rather than any actual inefficiency in the OHCs of the SLEFs.
It is possible to illustrate the potential impact of the effect described above by using data from the SLEFs provided in their segmental accounts. As a proxy for OHCs, we used the indirect costs of the SLEFs for the 2012–15 period. Average indirect cost over the period for each of the SLEFs were used to determine the supplier with the lowest costs. This was done after adjusting indirect cost figures for company size by using either the total number of customer accounts or the total revenue to ensure that any comparison was on a like-for-like basis. Theoretical consumer detriment was then calculated using the average indirect costs of the lowest-cost firm as a benchmark.
Using the methodology described above, the average annual consumer detriment due to differences in indirect costs is between £721m and £1,006m, depending on whether indirect costs are scaled by company revenue or the number of customer accounts. These figures demonstrate the extent to which estimates of consumer detriment can be distorted by using the costs of just one company as the benchmark.
We have considered the imputed increase in the detriment calculated by the CMA due to adjustment for benchmarking of OHCs: the CMA provides a range for the impact of this adjustment on EBIT of both benchmark suppliers.18 Using data on the benchmark suppliers’ actual EBIT and customer numbers from the segmental accounts of each supplier, the impact of an adjustment to EBIT on the detriment calculation can be estimated.19 Using the lower end of the range of EBIT adjustments reported by the CMA is consistent with an annual average detriment of £375m, whereas using the higher end of the range reported is consistent with an annual average detriment of £1,162m, as reported in Table 1.1. Given that the CMA appears to have used an unreliable methodology in calculating estimates of consumer detriment related to differences in OHCs, this range provides an indication of the extent to which the average annual consumer detriment calculated by the CMA could be overestimated.
18 Competition and Markets Authority (2016), ‘Energy market investigation: Final report. Appendix 10.1: Domestic retail detriment direct approach – adjustments to competitive benchmark prices’, 24 June, p. A10.1–15. 19 Specifically, a change in EBIT due to the OHC adjustment in each year is multiplied by the ratio of First Utility and OVO Energy customers to SLEFs, yielding the additional detriment across the market; this is then averaged across the four years (2012–15).

CMA Energy Market Investigation—critique of CMA consumer detriment analysis Oxera
14
5 Did the CMA use an appropriate benchmark?
In its analysis of consumer detriment, the CMA used two energy suppliers—OVO Energy and First Utility—as a competitive benchmark for the prices charged by the SLEFs.20 The CMA’s implicit assumption behind its ‘direct’ benchmarking approach was that, if these suppliers were able to operate a sustainable business while charging their average level of prices, other suppliers should also have been capable of this. This assumption disregards differences in the pricing strategies of suppliers—in particular, differences driven new entrants’ desire to grow their market share by investing in customer acquisition, with the intention of reaping the profits of that investment at a later stage.
This section evaluates whether it is appropriate to use the prices of OVO Energy and First Utility as benchmarks for the market as a whole. In particular, we examine the dynamic evolution of pricing incentives as new firms enter and grow their market share. We find that suppliers have stronger incentives to price aggressively when they have a smaller market share, and that firms with a larger market share have stronger incentives to increase prices than smaller firms. The purpose of this analysis is to assess whether the historical prices that the CMA used as a competitive benchmark are likely to hold in a market where new entrants have reached a stable equilibrium market share.
5.1 Changes in pricing incentives as market shares evolve
One of the main levers available to firms when attempting to maximise profits is their choice of price level. In markets with switching costs and some degree of customer inertia, firms are able to increase prices without instantly losing all of their customers to lower-price suppliers. Such frictions may allow firms to charge higher prices before their market share starts dropping significantly.
Given that current pricing decisions affect current and future profits, firms have a trade-off between maximising current or future profits.
Charging low prices allows companies to grow their customer base, potentially increasing future profits. However, current per-customer profits will be low.
A high pricing strategy leads to high profits being made on current customers, but market share may remain limited or decrease in the medium to long run.
In this setting, when making a decision on current pricing, a firm must consider the ‘price’ and ‘volume’ effects of its decision. The price effect of a price increase is simply to increase the revenue and thus also the profit associated with every customer who stays with the firm. The volume effect of a price increase is the extent to which customers can be expected to leave the firm or be less attracted to join, driving down revenues and thus also profits, assuming that the leaving customers were profitable to begin with. Analogous effects exist for a price decrease: the price effect is the lost profit on existing customers when prices decrease, and the volume effect is the additional customers (and existing customers retained) due to the price decrease. The balance between these two effects determines the firm’s optimal pricing strategy.
For new entrants that are growing their market share from a low base, the price effect is low because their customer base is small. This favours a lower pricing
20 Before calculating the detriment, the CMA adjusted the benchmark companies’ cost bases to account for the fact that they are still growing and that they would have a different cost structure in equilibrium (overhead, customer acquisition and environmental obligation costs).

CMA Energy Market Investigation—critique of CMA consumer detriment analysis Oxera
15
strategy because the volume effect, or prospect of being more attractive to new (profitable) customers, is likely to dominate the price effect of lower profits from each customer. At this point in the cycle, firms may price below the sustainable level. Once firms have gained a significant market share, incentives may shift in favour of a higher pricing strategy. This is because raising prices allows firms to obtain a return on their earlier customer acquisition and retention efforts from a larger number of customers, even if it could trigger some customers to switch away.
5.2 Quantitative modelling of pricing incentives
Section 5.1 explains that the balance of incentives for a supplier to raise prices is determined by the balance of the price effect and the volume effect, and that the price effect would be expected to grow stronger as market share grows.
We used our simulation model of retail energy consumer behaviour, which was developed for the energy market investigation21 (the ‘Oxera model’), to investigate potential changes in the ‘volume effect’ of price increases as the market shares of mid-tier suppliers grow.22 The model reflects the key features of the GB retail energy market and is based on a database of actual households and their associated demographic characteristics.
5.2.1 Methodology
We defined a number of scenarios (A–D1, presented in Table 5.1) to test for differences in consumer response to (unilateral) increases in fixed tariffs (of 1–5%) by mid-tier suppliers at different market share levels.23 The length of time during which current pricing holds (mid-tiers lower than the SLEFs) was used as a proxy for market share—i.e. as time progresses with no changes in pricing, independents gain market share in the Oxera model. The analysis uses scenarios in which mid-tier suppliers raise prices at t = 5 (B, C, and D) to estimate customer response to price rises when market share is low, and scenarios with later price increases at t = 15 as a proxy for the effect of raising prices when market share is high (B1, C1 and D1).
Table 5.1 Description of the pricing scenarios tested by Oxera
Scenario Current pricing duration
Tariff increase (independents only)
Periods with higher prices
A (baseline) 25 periods - -
B 5 periods 1% higher than baseline 6–15
B1 15 periods 1% higher than baseline 16–25
C 5 periods 2% higher than baseline 6–15
C1 15 periods 2% higher than baseline 16–25
D 5 periods 5% higher than baseline 6–15
D1 15 periods 5% higher than baseline 16–25
Note: A period corresponds to a year in our model.
Source: Oxera.
21 For a description of the model, see Oxera (2015), ‘Oxera consumer switching model’, 2 December. 22 The representation of suppliers in the model is limited to their tariff levels. Since the model does not have a representation of suppliers’ costs, it could not be used to model changes in profitability of suppliers in response to price changes. 23 Fixed tariff levels were used as the basis for our analysis since the customers of the benchmark firms are predominantly on fixed tariff deals at any point in time, and hence these tariffs represent the closest real proxy for the benchmark prices used by the CMA in its detriment analysis.

CMA Energy Market Investigation—critique of CMA consumer detriment analysis Oxera
16
5.2.2 Summary of findings
The findings presented in Figure 5.1 show the total number of fixed tariff and SVT customers lost as a result of a fixed tariff increase, as compared with the baseline, for scenarios B–D1. While fixed tariff customers are lost directly as a result of a price increase, losses of SVT customers result from the indirect effect of a lower number of fixed tariff customers, which means fewer customers defaulting onto the mid-tier suppliers’ SVTs.
In each case, the absolute number of customers lost is lower when a price increase is implemented at a higher level of market share.
Figure 5.1 Total number of customers lost (fixed tariff and SVT)
Note: To compare customer losses for price increases of the same magnitude at different initial market shares (e.g. B vs B1, C vs C1 and D vs D1), we rebased our calculations to assess differences from the baseline in the ten time periods following the price increase—i.e. in periods 6–15 for scenarios B, C and D, and in periods 16–25 for scenarios B1, C1 and D1.
Source: Oxera calculations.
The results of our analysis of consumer switching show that the constraint that the ‘volume’ effect places on the mid-tier suppliers’ incentives to increase prices may weaken as a supplier’s market share grows.
5.3 Academic literature on pricing strategies
Several academic studies have focused on the evolution of pricing incentives in markets with switching costs. According to these studies,24 pricing decisions are the result of a trade-off between an ‘investment effect’, a ‘harvesting effect’, and a ‘current switching effect’.
24 Fabra, N. and Garcia, A. (2012), ‘Dynamic Price Competition with Switching Costs’, 6 May. Cabral, L. (2016), ‘Dynamic pricing in customer markets with switching costs’, Review of Economic Dynamics, 20, pp. 43–62.
0
200
400
600
800
1000
1200
1400
1 2 3 4 5 6 7 8 9 10
Tota
l num
ber
of c
usto
mer
s lo
st
Time periods after price increase
B B1 C C1 D D1

CMA Energy Market Investigation—critique of CMA consumer detriment analysis Oxera
17
The investment effect gives rise to incentives to maximise future profits and justifies the low pricing strategy in which firms seek to attract new customers, even if these additional customers bring low margins at the time they are acquired.
The harvesting effect describes a situation in which it is more profitable for the firm to set high prices to extract as much revenue as possible from its current customer base.
According to Fabra and Garcia (2012), a third effect—the current switching effect—mitigates the harvesting effect, and incentivises firms to lower prices to gain new customers as a source of current profits.
In summary, pricing strategies are the outcome of the combination of these three effects. In their dynamic model of competition with switching costs, Fabra and Garcia (2012) show that there is a critical market share below which the investment effect and current switching effect dominate (incentive to price low) and above which the harvesting effect becomes stronger (incentive to price high).
Furthermore, some papers show that the dominant effect is largely influenced by the degree of market asymmetry.25 In asymmetric markets, the harvesting effect strongly dominates the current switching and investment effects among the largest players, which charge higher prices, while the opposite incentives push new entrants to charge low prices. Within this strand of economic literature, Cabral (2016) puts forward a model that closely matches the observable characteristics of the energy market, accounting for market asymmetry, the presence of switching costs and the sellers’ ability to price-differentiate.
In Cabral’s model, price differentials decrease over time. New entrants grow their market shares and are more tempted to harvest, while incumbents lose customers and are more inclined to price moderately. Here, the presence of switching costs can lead to a slower transition towards the equilibrium in asymmetric markets and higher overall prices during the transition.26
The results from academic literature reviewed in this section match the reasoning set out in section 5.1. Suppliers with smaller market share, such as the two benchmark companies, are likely to raise their prices as they grow their market shares to a stable size.
5.4 Conclusions
Economic intuition, academic research and our simulation modelling analysis all indicate that, in an asymmetric market, new entrants have a stronger incentive to price low to grow their market share initially (potentially pricing below the sustainable level), and that increasing market share strengthens the relative incentives for increasing prices. The GB retail energy market is characterised by the key features of asymmetric markets as described above. Smaller players, such as the benchmark companies, offer attractively priced tariffs to induce consumers to switch away from incumbents. The SLEFs had a combined market
25 Asymmetric markets are characterised by the presence of certain players with significantly higher market shares than others and a likelihood to attract new customers. 26 At the extreme, Cabral (2016) finds that high switching costs create a lock-in effect of customers with incumbents such that there is no price at which switching to smaller suppliers is attractive.

CMA Energy Market Investigation—critique of CMA consumer detriment analysis Oxera
18
share of more than 85% as at 2016,27 and hence have a greater incentive to try to recoup the costs of customer acquisition and retention from their customers.
In light of the benchmark companies’ growing market shares and changing pricing incentives, it appears unlikely that historical prices charged by OVO Energy and First Utility represent equilibrium prices. Indeed, growth in their customer base may erode incentives for new entrants to maintain aggressive pricing strategies, as the incentives to recoup the costs on investment in customer acquisition become stronger, while the incentives to undertake further investment become weaker. Conversely, market share erosion is likely to incentivise the largest SLEFs to offer more competitive prices in the long run. All of this indicates that it may not be appropriate to use the historical prices of OVO Energy and First Utility as benchmarks for the market as a whole.
27 86% and 85%, respectively, for electricity and gas in 2016, down from 99% in 2012. See Ofgem, ‘Electricity supply market shares by company: Domestic (GB)’, https://www.ofgem.gov.uk/chart/electricity-supply-market-shares-company-domestic-gb; and Ofgem, ‘Gas supply market shares by company: Domestic (GB)’, https://www.ofgem.gov.uk/chart/gas-supply-market-shares-company-domestic-gb, accessed 7 November 2016.

CMA Energy Market Investigation—critique of CMA consumer detriment analysis Oxera
19
6 Other issues raised with the CMA’s detriment analysis
Through the course of the market inquiry, the CMA trialled different approaches and made various amendments to its analysis of historical consumer detriment. Some of those changes, such as the decision to adjust detriment estimates for differences in the cost of social and environmental obligations, were driven by feedback from respondents to CMA publications.
As highlighted in section 1, the last opportunity to respond to the CMA’s outputs on its consumer detriment analysis was after the provisional decision on remedies was published. At that point, we reviewed the CMA’s ‘direct’ analysis of consumer detriment through a confidentiality ring and made a confidential submission to the CMA. The Oxera Report identified several factors that resulted in an upward bias in the CMA’s estimate of consumer detriment, which are listed in section 1. In the final report, the CMA indicated that it did not deem the following factors to have biased its detriment analysis:
i) the decision to exclude a mid-tier supplier, Co-op Energy, from its benchmarking calculations;
ii) the fact that the ‘direct’ approach implicitly benchmarked the wholesale costs of different suppliers, and hence differences in prices could reflect merely the differing fortunes of various equally efficient wholesale purchasing strategies in the reference period, rather than differences in efficiency or a lack of effective competition.
This section assesses whether the CMA had a sound basis for setting aside the concerns outlined above.
6.1 Exclusion of Co-op Energy from the set of benchmarks
Paragraph 10.25 of the final report explains the CMA’s reasoning for excluding Co-op Energy from the set of benchmarks despite the arguments put forward in the Oxera Report. The CMA’s core arguments are as follows:
i) a large number of its customers have been acquired from the members of the Midcounties Co-operative which means that its customer base is unlikely to be as active and engaged as that of Ovo Energy and First Utility;
ii) those [customers] who were not acquired [from the members of the Midcounties Co-operative] have also been given the option of becoming members, entitling them to a share in the profits it generates from all business streams;
iii) it is a considerably smaller supplier than OVO Energy and First Utility with indirect costs on a per customer basis which were significantly higher than those of OVO Energy and First Utility in 2013 and 2014.
We examine below each of the reasons given by the CMA.
With regard to i), the fact that Co-op Energy has some customers who were not won through low-price offers makes it a fairer and more balanced benchmark than OVO Energy or First Utility. This is because its customer base is likely to be more representative of the whole population of energy consumers than the customer base of OVO Energy or First Utility. Section 5 set out in detail why suppliers that are looking to grow their market share quickly from a low base, as OVO Energy and First Utility had done, are likely to have an incentive to ‘invest’ by pricing below sustainable levels. This effect does mean that their customer base is likely to be more engaged than the wider population of energy consumers, but it is also likely to introduce a bias into the CMA’s detriment

CMA Energy Market Investigation—critique of CMA consumer detriment analysis Oxera
20
calculations through the incentive for such businesses to price low. In light of this, the existence of a certain number of ‘vested’ customers is not a good justification for excluding Co-op Energy from the set of benchmarks.
With regard to ii), in paragraph 10.76 of its final report, the CMA acknowledges that the amount of dividends payable to a typical Co-op dual-fuel customer is small, but maintains that it can still distort the benchmarking analysis. This position does not appear to have a good justification since the amount of dividends for any given consumer bill can be calculated and adjusted for in the same way as the CMA chose to adjust for CACs, OHCs and the costs of social and environmental obligations. Assuming that all eligible consumers would take advantage of the option to receive dividends would be a valid and conservative assumption. We undertook analysis of how dividend payments could affect the CMA’s benchmarking analysis. Having previously estimated that including Co-op Energy as one of the benchmarks would reduce the CMA’s estimates of annual consumer detriment by £220m, we estimated that accounting for dividend payments would reduce this amount by £27m only, to £193m.28
Finally, with regard to iii), while the size of the benchmark business can be a valid criterion on which to select appropriate benchmarks, the CMA does not appear to have done any analysis on what can be considered to be a minimum efficient operating scale for an energy supplier. Hence, the argument used by the CMA to judge Co-op Energy to be too small to compare with OVO Energy and First Utility could be used with equal justification to judge OVO Energy and First Utility to be poor comparators for the SLEFs. It is also concerning that the level of indirect costs per customer, among other factors, is used as part of the justification for excluding Co-op Energy from the set of benchmarks. Detriment analysis carried out by the CMA involves implicit benchmarking of indirect costs of suppliers. The explanation for this is the same as for the implicit benchmarking of wholesale costs, as explained in section 6.2. Selecting benchmarks solely on the basis of the level of cost carries a real danger of introducing bias in the analysis. Specifically, if a benchmark is excluded on the basis of its costs being ‘too high’, this is likely to introduce a downward bias to the average costs of the benchmark firms and thus an upward bias to the estimated detriment.
Overall, the CMA has not provided a robust justification for the exclusion of Co-op Energy from the set of benchmarks.
6.2 Benchmarking of wholesale costs
In the CMA’s consumer detriment analysis set out in the provisional decision on remedies, the updated indirect benchmarking approach did not seek to benchmark the wholesale costs of suppliers. This followed criticisms from a number of respondents to the provisional findings report, including ScottishPower, of the CMA’s previous attempts to benchmark wholesale costs of suppliers. These pointed out that the prices of wholesale hedging products are highly volatile and the timing of purchase of such products can have a substantial effect on the wholesale hedging costs of a supplier.
The CMA’s direct benchmarking approach, which was favoured by the CMA in both the provisional decision on remedies and the final report, compared the weighted average tariff levels of two mid-tier suppliers and the SLEFs on a
28 ScottishPower, ‘Competition and Markets Authority Energy Market Investigation, ScottishPower’s Response to the Provisional Decision on Remedies’, pp. 62–64, https://assets.publishing.service.gov.uk/media/571a07e9e5274a2017000006/ScottishPower_response_to_PDR.pdf. The effect of accounting for dividends is estimated by scaling expected dividend payments for an average dual-fuel bill by the total size of the market and the weighting of Co-op Energy in the overall benchmark.

CMA Energy Market Investigation—critique of CMA consumer detriment analysis Oxera
21
particular date. In making this comparison, the CMA implicitly compared all of the cost items of these suppliers and deemed the costs of the benchmark firms, including their wholesale costs, to be a reasonable benchmark for the costs of the SLEFs. Since wholesale costs are the single biggest item for energy suppliers, the results of the implicit wholesale cost benchmarking under the CMA’s direct approach are likely to account for a large part of the detriment estimates produced by the CMA under this approach.29
If OVO Energy and First Utility relied on shorter-term hedging strategies than the SLEFs in a period during which wholesale energy costs were falling, they would have had lower wholesale costs. Assuming that other costs and profits are the same across the comparators, this difference in wholesale costs would show up as an overcharge in the CMA’s benchmarking analysis.
As data on First Utility’s and OVO Energy’s wholesale costs is not available in the public domain, we were not able to estimate the difference in wholesale costs between these suppliers and the SLEFs. As an alternative, the two approaches to wholesale cost benchmarking considered by the CMA in the provisional findings report can be used to generate estimates of the degree to which wholesale cost differences can influence the detriment calculation.30 The two benchmarks suggested by the CMA were the average of wholesale costs for RWE and EDF and the lower quartile of wholesale costs for the SLEFs. Using the average wholesale costs of RWE and EDF as a benchmark, we calculate a theoretical detriment of £286m per annum, and using the lower quartile of average wholesale costs of the SLEFs, we calculate a theoretical detriment of £467 per annum.31 This shows the potential contribution of the effect of implicit wholesale cost benchmarking to the CMA’s overall detriment estimates. In paragraph 10.79 of the final report, the CMA gives the following reason for disregarding the issue identified with implicit benchmarking of wholesale costs:
We consider that any differences in energy costs arising from how any particular supplier has chosen to purchase energy does not provide a sound basis for adjusting a competitive benchmark. This is because in a well-functioning market, we would not expect those differences to influence retail prices materially.
The CMA’s logic appears to be that, in a well-functioning market, variations in wholesale hedging costs should be absorbed by the supplier, resulting in corresponding variation in profits, rather than being passed on to the final consumer. If correct, this logic is inconsistent with the CMA’s own benchmarking methodology, which adjusts the prices of the benchmark firms in order to bring them to a level that is consistent with a ‘reasonable’ profit margin. This approach is consistent with the logic that variations in the wholesale costs of the benchmark firms should result in corresponding variation in their prices, while the profits of these firms should remain constant.
Overall, the CMA does not appear to have a good justification for implicitly benchmarking the wholesale costs of suppliers in its direct benchmarking analysis. The best hedging strategy to pursue in any given period cannot be
29 Paragraph 10.106 of the final report states that: ‘The evidence on wholesale energy costs indicates that this is an important source of differences in profitability across the Six Large Energy Firms’. 30 Competition and Markets Authority (2015), ‘Energy market investigation: provisional findings report’, 7 July, pp. 417–18. 31 Calculations of theoretical detriment were based on data from segmental accounts of the SLEFs. We calculated average per-unit costs for gas and electricity for both benchmarks during the reference period (2012–15). The difference between these costs and the average per-unit costs for gas and electricity for each of the SLEFs was multiplied by the total volume of gas and electricity supplied by each respective supplier during the reference period. The sum of these values across the SLEFs gives the total difference in wholesale costs between the SLEFs and the benchmark firms across the reference period. The annual average is then immediately comparable with the CMA’s detriment calculation.

CMA Energy Market Investigation—critique of CMA consumer detriment analysis Oxera
22
predicted with any degree of accuracy, and therefore wholesale costs on a particular date cannot reasonably be deemed to be controllable from a supplier’s perspective. Since variation in wholesale costs can be a significant driver of a supplier’s financial performance, and can therefore significantly affect the result of the CMA’s benchmarking analysis, differences in wholesale costs between the SLEFs and the benchmark firms should be excluded from any analysis of consumer detriment.

CMA Energy Market Investigation—critique of CMA consumer detriment analysis Oxera
23
7 Split of estimated detriment between the SLEFs
As set out in section 1, the CMA found an average detriment of £1.4bn per year for energy consumers in Great Britain. The CMA has not released the contribution of each of the SLEFs to the overall detriment figure. In this section, we attempt to estimate the split of the detriment between the SLEFs. Section 7.1 details our methodology and section 7.2 sets out the results. Key assumptions and the results of sensitivity analysis with regard to one of the assumptions are set out in Appendices A1 and A2, respectively.
7.1 Methodology
The CMA’s approach to calculating consumer detriment was based on the difference in pricing between the SLEFs and a theoretical competitive benchmark. Hence, the split of detriment among the SLEFs can be calculated using data on the average revenues of each firm.
Using segmental accounts of the SLEFs,32 we calculated revenues per unit of electricity and gas sold in the years 2012–15 for each of the SLEFs. Combining this data with yearly detriment figures for electricity and gas, we back-calculated the benchmark unit electricity and gas prices of each supplier and each year.
Given that the CMA provided a split of the yearly detriment between dual fuel, electricity single fuel and gas single fuel, we apportioned the dual-fuel detriment between electricity and gas accounts on the basis of the ratio of average electricity and gas bills as calculated by the Department of Energy & Climate Change.33
Finally, the difference between the average unit prices of each of the SLEFs and the unit benchmark price for electricity and gas was multiplied by the total number of electricity and gas units sold, to obtain the detriment accounted for by each supplier.
7.2 Results
Figure 7.1 shows the estimated average detriment for each of the SLEFs across the period covered by the CMA’s detriment analysis. The two largest energy suppliers—Centrica and SSE—are estimated to account for around 75% of the overall estimated detriment.
32 Ofgem, ‘Energy companies’ Consolidated Segmental Statements’, https://www.ofgem.gov.uk/system/files/docs/2016/07/energy_companies_consolidated_segmental_statements_css_july2016.pdf, accessed 1 September 2016. 33 DECC (2016), ‘Average annual domestic standard electricity bills by home and non-home supplier’, 31 March, Table 2.2.1, and DECC (2016), ‘Average annual domestic gas bills by home and non-home supplier’, 31 March, Table 2.3.1, https://www.gov.uk/government/statistical-data-sets/annual-domestic-energy-price-statistics, accessed 1 September 2016.

CMA Energy Market Investigation—critique of CMA consumer detriment analysis Oxera
24
Figure 7.1 Average annual detriment, 2012–15 (£m)
Source: Oxera analysis.
Figure 7.2 shows a breakdown of the detriment by year. A similar pattern as in Figure 7.1 can be observed across all years. The share of each firm in the overall detriment remains relatively stable over time, with Centrica and SSE accounting for the bulk of the detriment.
Figure 7.2 Yearly detriment, 2012–15 (£m)
Source: Oxera analysis.
These estimates are consistent with the fact that, in the period covered by the benchmarking analysis, Centrica and SSE are consistently among the top three
832.5
-24.1
133.995.1
-26.4
360.2
-100
0
100
200
300
400
500
600
700
800
900
Centrica EDF E.ON RWE SP SSE
-200
0
200
400
600
800
1,000
1,200
Centrica EDF E.ON RWE SP SSE
2012 2013 2014 2015

CMA Energy Market Investigation—critique of CMA consumer detriment analysis Oxera
25
most expensive suppliers for gas and electricity among the SLEFs on a per-unit basis,34 and are the two largest suppliers for both gas and electricity.
The negative average detriment observed for EDF and ScottishPower means that, in our model, unit prices for EDF and ScottishPower are lower than the benchmark on an average basis.
34 They are the two most expensive suppliers on a per-unit basis on average across the 2012–15 period.

CMA Energy Market Investigation—critique of CMA consumer detriment analysis Oxera
26
A1 Model assumptions
Determining consumer tariffs: our analysis of the split in estimated consumer detriment is based on the assumption that the estimated detriment for each company is proportional to average unit prices and costs. In particular, the analysis assumes that the costs of energy suppliers are driven by the quantity of energy supplied, rather than by customer numbers, and does not account for potential heterogeneity in average fixed cost per customer. This means that suppliers with fewer high-consumption customers will account for a larger proportion of the detriment in the analysis because they would need to charge higher per-unit prices to pay the fixed costs associated with serving a customer.
While this is a simplification, it is both a necessary and a realistic assumption given the available data, because the largest components of energy bills depend on the quantity of energy supplied rather than on customer numbers. Wholesale costs of energy account for more than 40% of energy bills35 and are almost entirely dependent on the quantity of energy purchased by suppliers. Additionally, network costs and environmental and social obligations account for around 30% of energy bills36 and are primarily driven by the quantity of energy supplied.37
CMA adjustments: in its final detriment analysis, the CMA made a number of adjustments to make the SLEFs comparable with the benchmark companies.38 In particular, as described in section 1, the CMA deemed that OVO Energy and First Utility were not subject to the same environmental and social obligation costs as the SLEFs for the bulk of the benchmark period, paid significant CACs to grow their customer base, and incurred large OHCs that may not be representative of their longer-term performance.
The estimate of the split of calculated detriment does not adjust for potential heterogeneity in these factors among the SLEFs. In other words, we assume that the SLEFs are broadly comparable with respect to environmental and social obligation costs, CACs and OHCs.
SSE data: SSE publishes segmental accounts covering the period from 1 April to 31 March of the following year. The analysis underlying the split of detriment between the SLEFs assumed that SSE’s financial years correspond to the closest calendar years. For example, the 2013/14 financial year was assumed to correspond to the 2013 calendar year. Since the CMA’s detriment analysis covers a number of years, this assumption is unlikely to affect the split of detriment in a significant way.
Split of dual-fuel detriment: the results presented in Figure 7.1 and Figure 7.2 above apportion detriment associated with dual-fuel customers using relative single-fuel bill prices for electricity and gas. Our model includes a sensitivity that allows the dual-fuel detriment to be split between electricity
35 43.43% for dual-fuel bills, 46.54% for gas bills and 40.09% for electricity bills. See Ofgem website, ‘Understand your gas and electricity bills’, https://www.ofgem.gov.uk/information-consumers/domestic-consumers/understanding-energy-bills, accessed 22 September 2016. 36 31.5% for dual-fuel bills, 25% for gas bills and 38.1% for electricity bills. See Ofgem website, ‘Understand your gas and electricity bills’, https://www.ofgem.gov.uk/information-consumers/domestic-consumers/understanding-energy-bills, accessed 22 September 2016. 37 For example, ECO obligations for obligated suppliers are calculated based on the amount of electricity or gas supplied as compared with total electricity or gas supplied in the market. See Ofgem (2014), ‘Energy Companies Obligation (ECO): Guidance for Suppliers (Version 1.2)’, November. The Balancing Services Use of System (BSUoS) charge for electricity is also calculated on a per-unit basis. 38 Competition and Markets Authority (2016), ‘Energy market investigation: Final report. Appendix 10.1: Domestic retail detriment direct approach – adjustments to competitive benchmark prices’, 24 June.

CMA Energy Market Investigation—critique of CMA consumer detriment analysis Oxera
27
and gas accounts based on the SLEFs’ electricity and gas revenues Appendix A2 shows that the detriment split among the SLEFs is almost unchanged when the basis for splitting the dual-fuel detriment is changed.

CMA Energy Market Investigation—critique of CMA consumer detriment analysis Oxera
28
A2 Sensitivity to dual-fuel detriment split between gas and electricity accounts
Figures A2.1 and A2.2 show the split of detriment calculated by the CMA when the dual-fuel detriment is apportioned between gas and electricity accounts in proportion to total gas and electricity revenues.
Figure A2.1 Average detriment, 2012–15 (£m)
Source: Oxera analysis.
Figure A2.2 Yearly detriment, 2012–15 (£m)
Source: Oxera analysis.
821.8
-20.9
136.695.7
-25.1
363.1
-100
0
100
200
300
400
500
600
700
800
900
Centrica EDF E.ON RWE SP SSE
-200
0
200
400
600
800
1,000
1,200
Centrica EDF E.ON RWE SP SSE
2012 2013 2014 2015

www.oxera.com