cluster impact analysis
TRANSCRIPT
Cluster Impact Analysis
The real cluster case
Sonja Kind, Gerd Meier zu Köcker
Imprint
EditorsDr. Sonja KindDr. Gerd Meier zu Köcker
Institute for Innovation and Technology as part ofVDI/VDE Innovation + Technik GmbHSteinplatz 110623 Berlin, GermanyPhone: +49 30 310078-111Fax: +49 30 310078-222www.iit.de
LayoutAndré E. Zeich / Jennifer Büttner, VDI/VDE-IT
Contact/for questions regarding the report and its content:Dr. Sonja KindPhone: +49 30 310078-198Email: [email protected]
The authors would like to thank all those who helped to develop the Cluster Impact Analysis. Our particular thanks go to all enterprises that have dedicated their time to complete the online questionnaire as well as to the cluster management organisation which has coordi-nated the implementation of the survey.
Berlin, 2013

Table of Contents
1 Summary ............................................................................................................................................................................4
2 Introduction .......................................................................................................................................................................5
2.1 What is the Cluster Impact Analysis? ....................................................................................................................................6
2.2 Cluster Impact Analysis: Indicators ........................................................................................................................................7
2.3 Methodological Explanations and Visualisation .....................................................................................................................9
3 Cluster A – Cluster Impact Analysis – Findings ..............................................................................................................13
3.1 Survey Period and Feedback ...............................................................................................................................................13
3.2 Remarks on the Interpretation of the Results ......................................................................................................................13
3.3 Evaluation of the Effects and Priorities in the Cluster ...........................................................................................................14
3.4 Matrix – Cluster A ..............................................................................................................................................................16
3.5 Overall Monetary Benefit Resulting from Cluster Activities ..................................................................................................19
3.6 Involvement in Activities of Cluster A pays off .....................................................................................................................20
3.7 Sustainability ......................................................................................................................................................................21
3.8 Annotations by the Companies ...........................................................................................................................................23
4 Structural Data of the Cluster .........................................................................................................................................25
4.1 Company size in the Cluster ...............................................................................................................................................25
4.2 Development in the Cluster ................................................................................................................................................25
4.3 Commitment of the Companies in the Cluster ....................................................................................................................26
5 Annex: Evaluation in Figures ..........................................................................................................................................27
5.1 Qualification and Innovation ...............................................................................................................................................27
5.2 Co-operation ......................................................................................................................................................................29
5.3 Entrepreneurial Performance...............................................................................................................................................30
5.4 Image and Reputation ........................................................................................................................................................31
5.5 Sustainability ......................................................................................................................................................................32
FAQ About the Cluster Impact Analysis .................................................................................................................................33
4 Cluster Impact Analysis
1 Summary
The management of cluster A1 carried out a so-called impact analysis in co-operation with the Institute for Innovation and Technology (iit) in April/May 2012. The objective of the investi-gations was to find out in which fields and to which extent the players of cluster A had particularly profited from the networ-king and in which fields the members’ requirements, especially those of the enterprises, could eventually not have been met.
The results of the study clearly show that the enterprises in clus-ter A have generally been able to benefit well or even very well from the net-working activities.
Equally important is the fact that the surveyed enterprises had achieved excellent effects specifically in those fields that had been considered particularly important for a large number of cluster participants.
This fact illustrates that the management of cluster A had pre-dominantly focused its activities on the fields of high priority and has been able to achieve very positive effects.
In the context of limited resources available to the cluster management organisation, this finding is of high relevance.
The performance of the enterprises involved in cluster A can be described as good.
At least half of the network’s players range above the general industry average regarding typical indicators like turnover or productivity.
The impact analysis shows that public investments generally result in monetary benefits for the companies involved in a cluster initiative. The monetary effect (output) hereby has tur-ned out to be larger than the public sector invest-ments (input) made over the same period of time. The output/input leverage amounts to 2.3. Thus, each euro invested to the cluster by public authorities generates a monetary benefit of EUR 2.3 which is an encouraging result.
The overall analysis revealed that the sum of monetary effects had been larger than the total number of investments made by the public and private sector (the output-input-rate amounts to 1.3).
This result can in fact be interpreted as consolidated legitimisa-tion to public investments in recent years.
1 Cluster A represents an anonymous real cluster from the automotive sector that served as a pilot case for the Cluster Impact Analysis approach. The analysis was carried out in 2012.

The real cluster case 5
2 Introduction
Managers (f/m) of clusters and networks are increasingly inte-rested in the effective outcome of their work: To what extent do the enterprises involved in networks and clusters indeed benefit from their networking activities? Which fields can be identified where the positive effects for the networking companies are most apparent? Can the goals that are pursued in line with the entrepreneurial commitment for cluster activities finally be achieved?
The Cluster Impact Analysis helps to find adequate answers to these questions. The newly developed instrument is specifically tailored to the requirements of cluster management organisa-tions.
The findings of the Cluster Impact Analysis provide informa-tion to the cluster management showing whether companies derive benefit from networking activities and if so in which fields. Thus, the Cluster Impact Analysis aims at identifying the achieved effects that can be attributed to cluster and networ-king activities.
Generally, there are three possibilities for a company in a cluster to achieve and influence the development of effects:
ff by generally participating in a cluster (i. e. just by virtue of being involved),
ff through the specific activities and the commitment in and for the cluster initiative,
ff by making use of the services offered by the cluster manage ment organisation.
The results of the Cluster Impact Analysis serve the cluster manage ment organisation to legitimise the activities towards various groups of stakeholders; both towards the members of the cluster and towards funding bodies or political decision-makers. For this reason, the cluster managements’ prospective to reach sustainability will become more likely.
This report is the result of a first practical test performed in spring 2012. The participation was optional and free of charge.
During the performance of the practical test, numerous cluster managers (f/m) provided input in discussions about the ade-quacy and practicability of the applied indicators and raised questions.
Therefore, we have managed to develop an instrument which enjoys broad acceptance among practical users and which can be applied with all types of clusters – regardless their topics of priority or regional positioning.
Considering the achieved results, it is recommended to con-tinue using the Cluster Impact Analysis as an investigation method.
6 Cluster Impact Analysis
2.1 What is the Cluster Impact Analysis? The Cluster Impact Analysis aims to measure the effects that are achieved by companies that are members of a cluster.
Target group: The Cluster Impact Analysis explicitly and exclu-sively addresses organisations in clusters that are pursuing ent-repreneurial activities.
Implementation: Enterprises are asked to complete an online questionnaire providing information on hitherto achieved effects in five predefined categories of success. Previous to this, a set of potential indicators used in the survey is aligned with the respective cluster management organisation and varied if necessary. Thereby, cluster-specific features are adequately taken into account.
A link to an active online survey is sent to the cluster manage-ment who forwards it to the network’s participants via email. Thus, it is guaranteed that the cluster management organisa-tion maintains control over the circle of participants as well as over the start and end times, including the number of remin-ders.
In addition, information material is provided to support the pro-cess of addressing the network’s members (draft of a letter to the cluster’s companies including background information). The use of this material is optional (see also FAQ in the annex to the report)
The survey is carried out anonymously and does not allow for any conclusions on the responding companies.
Topics: The companies are asked questions that are categorised as follows:
ff Qualification and innovation
ff Co-operation
ff Entrepreneurial performance
ff Image and reputation
ff ustainability
The new and special feature of the Cluster Impact Ana-lysis: There are no questions raised about data considered as “sensitive” from the companies’ perspective (e. g. information on turnover).
The enterprises are just asked to provide qualitative assess-ments.
Specific characteristics of the clusters and networks are taken into account (e. g. age, intensity of the commitment in the clus-ter).
The indicators selected for the Cluster Impact Analysis have well been tested in co-operation with the cluster participants under aspects of practicability and are thus widely accepted.
This type of analysis ensures an independency from the avai-lability of statistical data and predefined sectors and regions, respectively. Technologies or activity fields often do not corres-pond to the sectors that are displayed according to the indus-trial classification. Moreover, clusters and networks are normally difficult to reconcile with statistically covered territorial units.
The analysis focuses on data that are comparably easy to coll-ect and to evaluate. No complex calculations are performed, leading to easily comprehensible results.
Prerequisite for participation of a cluster: The members of the initiative “Networks of Competence Germany” have had the opportunity to optionally participate in the study, free of charge. Principally, the cluster must have registered members (enterprises).
Benefit for the participating companies: The feedback of the cluster management organisation with regard to the question whether and in which fields the compa-nies do benefit from their participation in the cluster and from the work of the cluster management organisation helps the companies to improve their chances for:
ff a more precise tailoring of existing and future political ins truments to entrepreneurial
ff requirements,
ff a sustainable and secured cluster management. The cluster management organisation can use the survey’s findings for legitimisation purposes with regard to its own role.
Confidentiality of the study‘s results: With the present report, the cluster management organisation is provided a feedback on the achieved effects in the cluster. The findings mentioned in the report are exclusively presented to the cluster management, which decides on their eventual publication and further distribution of contents.

The real cluster case 7
2.2 Cluster Impact Analysis: Indicators
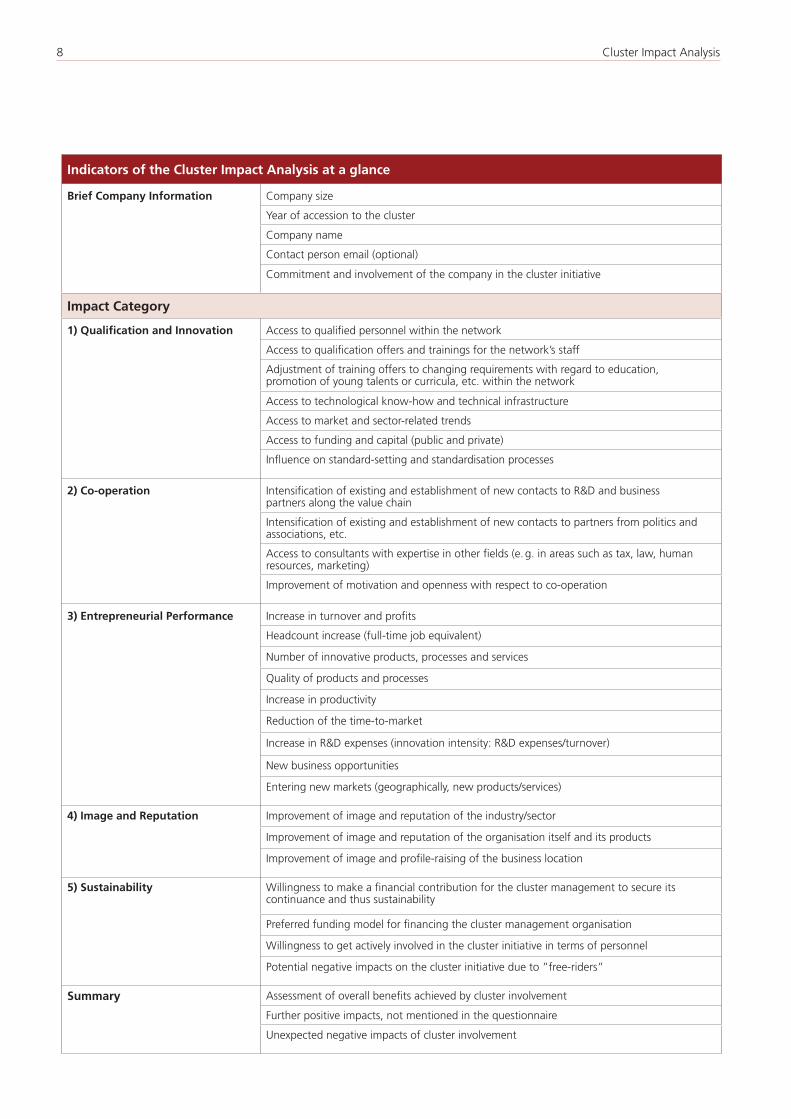
The following table below provides a comprehensive overview of the indicators and questions, respectively that are available for the Cluster Impact Analysis. The greyed-out lines characte-rise those indicators which have been excluded from the questi-onnaire upon request of the cluster management organisation.
The indicators are aspects and effects, respectively, which can-not necessarily merely be attributed to or influenced by the activities of the cluster management organisation. The in-fluence on standard-setting and standardisation processes may, for example, also improve through the involvement in the cluster initiative without prior engagement of the cluster management organisation offering specific measures. The same applies to other indicators, such as the adjustment of curricula to cluster-specific requirements.
8 Cluster Impact Analysis
Indicators of the Cluster Impact Analysis at a glance
Brief Company Information Company size
Year of accession to the cluster
Company name
Contact person email (optional)
Commitment and involvement of the company in the cluster initiative
Impact Category
1) Qualification and Innovation Access to qualified personnel within the network
Access to qualification offers and trainings for the network’s staff
Adjustment of training offers to changing requirements with regard to education, promotion of young talents or curricula, etc. within the network
Access to technological know-how and technical infrastructure
Access to market and sector-related trends
Access to funding and capital (public and private)
Influence on standard-setting and standardisation processes
2) Co-operation Intensification of existing and establishment of new contacts to R&D and business partners along the value chain
Intensification of existing and establishment of new contacts to partners from politics and associations, etc.
Access to consultants with expertise in other fields (e. g. in areas such as tax, law, human resources, marketing)
Improvement of motivation and openness with respect to co-operation
3) Entrepreneurial Performance Increase in turnover and profits
Headcount increase (full-time job equivalent)
Number of innovative products, processes and services
Quality of products and processes
Increase in productivity
Reduction of the time-to-market
Increase in R&D expenses (innovation intensity: R&D expenses/turnover)
New business opportunities
Entering new markets (geographically, new products/services)
4) Image and Reputation Improvement of image and reputation of the industry/sector
Improvement of image and reputation of the organisation itself and its products
Improvement of image and profile-raising of the business location
5) Sustainability Willingness to make a financial contribution for the cluster management to secure its continuance and thus sustainability
Preferred funding model for financing the cluster management organisation
Willingness to get actively involved in the cluster initiative in terms of personnel
Potential negative impacts on the cluster initiative due to ”free-riders”
Summary Assessment of overall benefits achieved by cluster involvement
Further positive impacts, not mentioned in the questionnaire
Unexpected negative impacts of cluster involvement

The real cluster case 9
Exemplary Trend Calculation
example indicator XY Number of replies In % Quantification
points
… has developed rather poorly or insuffiviently. 5 18 % 33 0,18*33
… is now given. 18 67 % 66 0,67*66
… is now very good or excellent. 4 15 % 100 0,15*100
total 27 100 % 65
Evaluation in points between … Conditional formatting Interpretation
70 and 100 á very good or excellent effects
60 and 69.9 ä good or very good effects
50 and 59.9 à effects are given = positive
40 and 49.9 æ few effects
0 and 39.9 â very few or no effects at all
2.3 Methodological Explanations and Visualisation
In order to facilitate the understanding of the charts and inter-pretations displayed in the chapter of findings, the methodolo-gical approach as well as the specific forms of visualisation are briefly ex-plained in the following.
Tabular Overview
Average RatingThe first table provides a quick overview of the evaluation of the individual indicators.
For this purpose, the average rating for every indicator has been illustrated by means of directional arrows and a colouring crea-ting either a positive or negative visual effect.
For the evaluation of the survey’s responses, the single reply categories have been scored on the basis of a point system (quantification) and the overall average has been calculated.
In the second table below, a calculation sample is given for an indicator with three reply categories. In this exam ple, the indi-cator XY has reached an average over all score of 66 points and has been coloured in light green visualizing a “positive trend” towards “very good or excellent effects”.
For the colouring, five different scales of points have been defi-ned resulting in an evaluation (see colour scale and directional arrow). This reflects whether the effects achieved in the cluster had been positive or less positive with respect to the individual indicators.
10 Cluster Impact Analysis
Evaluation of the Priority – Is this a pursued goal?
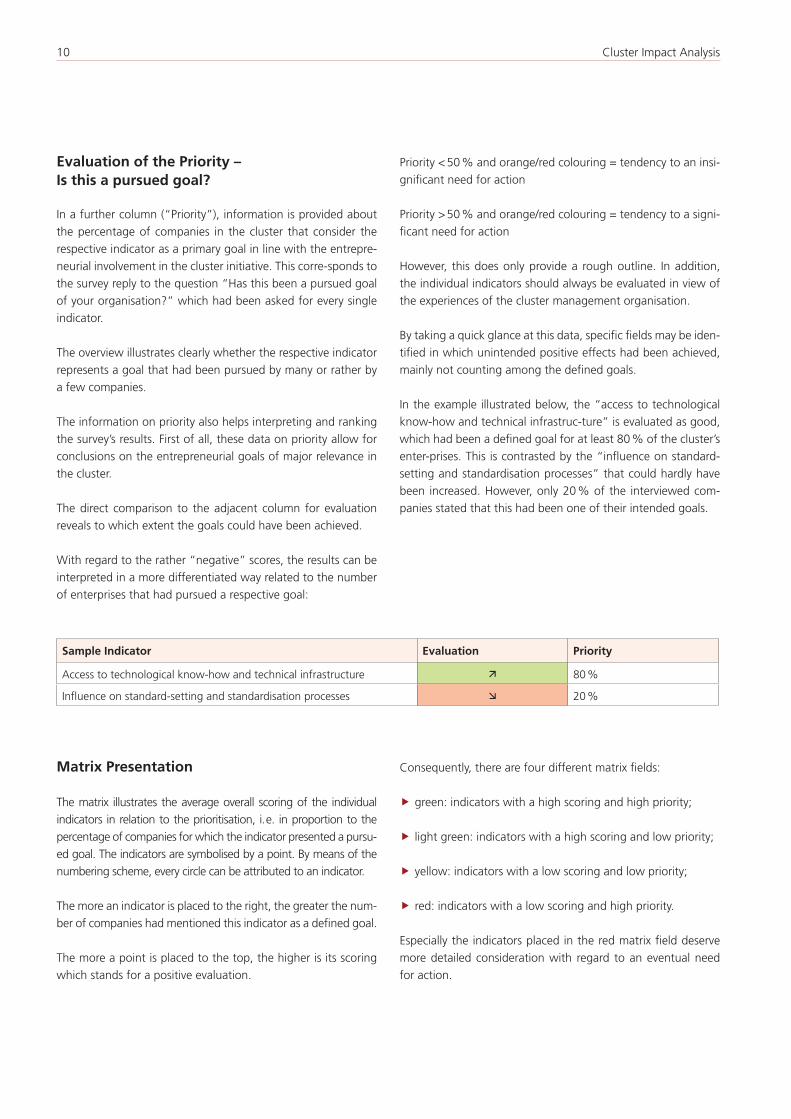
In a further column (“Priority”), information is provided about the percentage of companies in the cluster that consider the respective indicator as a primary goal in line with the entrepre-neurial involvement in the cluster initiative. This corre-sponds to the survey reply to the question “Has this been a pursued goal of your organisation?” which had been asked for every single indicator.
The overview illustrates clearly whether the respective indicator represents a goal that had been pursued by many or rather by a few companies.
The information on priority also helps interpreting and ranking the survey’s results. First of all, these data on priority allow for conclusions on the entrepreneurial goals of major relevance in the cluster.
The direct comparison to the adjacent column for evaluation reveals to which extent the goals could have been achieved.
With regard to the rather “negative” scores, the results can be interpreted in a more differentiated way related to the number of enterprises that had pursued a respective goal:
Priority < 50 % and orange/red colouring = tendency to an insi-gnificant need for action
Priority > 50 % and orange/red colouring = tendency to a signi-ficant need for action
However, this does only provide a rough outline. In addition, the individual indicators should always be evaluated in view of the experiences of the cluster management organisation.
By taking a quick glance at this data, specific fields may be iden-tified in which unintended positive effects had been achieved, mainly not counting among the defined goals.
In the example illustrated below, the “access to technological know-how and technical infrastruc-ture” is evaluated as good, which had been a defined goal for at least 80 % of the cluster’s enter-prises. This is contrasted by the “influence on standard-setting and standardisation processes” that could hardly have been increased. However, only 20 % of the interviewed com-panies stated that this had been one of their intended goals.
Matrix Presentation
The matrix illustrates the average overall scoring of the individual indicators in relation to the prioritisation, i. e. in proportion to the percentage of companies for which the indicator presented a pursu-ed goal. The indicators are symbolised by a point. By means of the numbering scheme, every circle can be attributed to an indicator.
The more an indicator is placed to the right, the greater the num-ber of companies had mentioned this indicator as a defined goal.
The more a point is placed to the top, the higher is its scoring which stands for a positive evaluation.
Consequently, there are four different matrix fields:
ff green: indicators with a high scoring and high priority;
ff light green: indicators with a high scoring and low priority;
ff yellow: indicators with a low scoring and low priority;
ff red: indicators with a low scoring and high priority.
Especially the indicators placed in the red matrix field deserve more detailed consideration with regard to an eventual need for action.
Sample Indicator Evaluation Priority
Access to technological know-how and technical infrastructure ä 80 %
Influence on standard-setting and standardisation processes æ 20 %

The real cluster case 11
low priority high priority
indicator
Priority in the cluster
high scoring, high priority
low scoring, high prioritylow scoring, low priority
high scoring, low priority
„Success“„Unintended effects“
„Options for development“ „Need for action“Eval
uat
ion
of
the
ind
icat
or
very high
very low
high
medium
low
1
Bar charts with information about the goal
For every individual indicator, the question of effects has been raised mostly in form of three given reply categories with nearly identical wording:
ff … has developed rather poorly or insufficiently.
ff … is now given.
ff … is now very good or excellent.
The chart below visualises the results in an exem-plary way; the number of companies that had replied for the respective cate-gories is given in per-centages. When displaying the evaluation results, a differentiation has been made between affirmative and negative answers to the question: “Has this been a pur-sued goal of your organisation?”
The evaluation for the group that had affirmed the indicator to represent a pursued goal can always be found on the left side, the results of the group not having primarily pursued the aspect can be found on the right side.
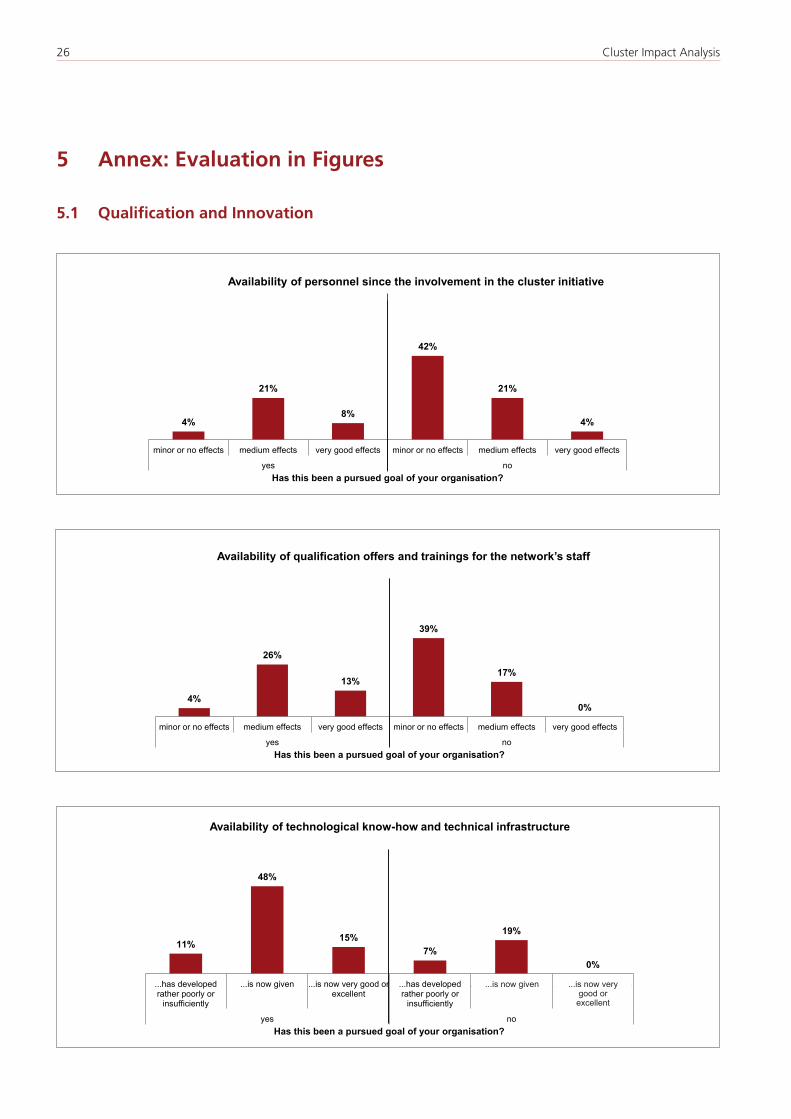
In the example below, 68 % (sum of 48 % + 19 %) indicate that the access to technological know-how and technical infrastruc-ture was “now given” in the cluster. The value of all percenta-ges in total is 100 %.
As can be seen from the chart, the major part of the interviewed enterprises had achieved their pursued goals.
The bar to the very left side is of particular interest when it comes to the identification of needs for action. It illustrates the rate of companies in a cluster whose expectations could have either been met to an insignificant extent or not at all with regard to a particular aspect.

12 Cluster Impact Analysis
11%
48%
15%7%
19%
0%
...has developedrather poorly or
insufficiently
...is now given ...is now very good orexcellent
...has developedrather poorly or
insufficiently
...is now very good orexcellent
...ist nun sehr gut bisausgezeichnet
yes noHas this been a pursued goal of your organisation?
Availability of technological know-how and technical infrastructure
The value of the sum of all ”yes“ and ”no“ answers is 100 %.
Need for action?
Access to technological know-how and technical infrastructure in the cluster...
...is now very good or excellent
...is now given
The real cluster case 13
3 Cluster A – Cluster Impact Analysis – Findings
3.1 Survey Period and Feedback
Start of the survey: (date)Reminder email: (date)End of the survey: (date)
Cluster A had sent out letters to 40 enterprises. 31 of them had replied according to the survey’s requirements which correspond to a response rate of 78 %. This represents a very good partici-pation rate allowing for valid statements about cluster impacts.
3.2 Remarks on the Interpretation of the Results
In the questionnaire, the companies were queried about the effects achieved since their involvement in the cluster initiative. The period of consideration varies among the individual enter-prises due to the different years of accession to the cluster. Aim of the survey was to measure the effects of the companies of the cluster initiative as an overall impact, regardless of their period of participation.The findings of the Cluster Impact Ana-lysis should have been evaluated in the context of the cluster management’s experiences, i. e. in relation to external frame-work conditions, developments within the cluster, specific requirements of individual companies etc.
The report refers to potential needs for action in the respective context. It is recommended to the cluster management organi-sation to start with a self-reflection of the results provided by the Cluster Impact Analysis.
In a further step, the different groups of stakeholders being relevant for the cluster – particularly the network’s enterprises – should be involved to discussions about potential needs for action, eventually revealing from the report’s results. In line with this, issues of particular priority should furthermore be identified.
3.3 Evaluation of the Effects and Priorities in the Cluster
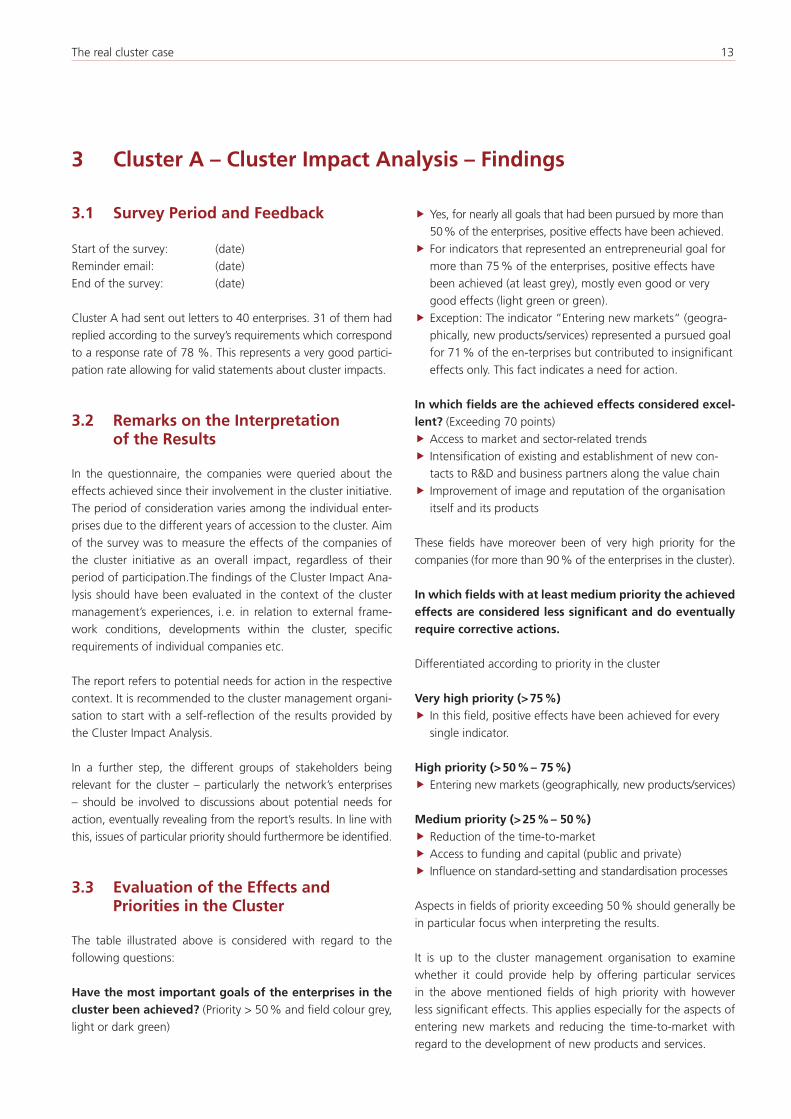
The table illustrated above is considered with regard to the following questions:
Have the most important goals of the enterprises in the cluster been achieved? (Priority > 50 % and field colour grey, light or dark green)
ff Yes, for nearly all goals that had been pursued by more than 50 % of the enterprises, positive effects have been achieved.ff For indicators that represented an entrepreneurial goal for more than 75 % of the enterprises, positive effects have been achieved (at least grey), mostly even good or very good effects (light green or green).ff Exception: The indicator ”Entering new markets“ (geogra-phically, new products/services) represented a pursued goal for 71 % of the en-terprises but contributed to insignificant effects only. This fact indicates a need for action.
In which fields are the achieved effects considered excel-lent? (Exceeding 70 points)ff Access to market and sector-related trendsff Intensification of existing and establishment of new con-tacts to R&D and business partners along the value chainff Improvement of image and reputation of the organisation itself and its products
These fields have moreover been of very high priority for the companies (for more than 90 % of the enterprises in the cluster).
In which fields with at least medium priority the achieved effects are considered less significant and do eventually require corrective actions.
Differentiated according to priority in the cluster
Very high priority (> 75 %)ff In this field, positive effects have been achieved for every single indicator.
High priority (> 50 % – 75 %)ff Entering new markets (geographically, new products/services)
Medium priority (> 25 % – 50 %)ff Reduction of the time-to-marketff Access to funding and capital (public and private)ff Influence on standard-setting and standardisation processes
Aspects in fields of priority exceeding 50 % should generally be in particular focus when interpreting the results.
It is up to the cluster management organisation to examine whether it could provide help by offering particular services in the above mentioned fields of high priority with however less significant effects. This applies especially for the aspects of entering new markets and reducing the time-to-market with regard to the development of new products and services.
14 Cluster Impact Analysis
Indicator Evaluation Priority
Brief Company InformationCompany size
Year of accession to the cluster Ø=2008
Name name
Commitment and involvement of the company in the cluster initiative à
1) Qualification and Innovation
Access to qualified personnel within the network à 33 %
Access to qualification offers and trainings for the network’s staff à 43 %
Adjustment of training offers to changing requirements with regard to education, promotion of young talents or curricula, etc. within the network
Access to technogical know-how and technical infrastructure ä 74 %
Access to market- and sector-related trends á 96 %
Access to funding and capital (public and private) æ 46 %
Influence on standard-setting and standardization processes æ 36 %
2) Co-operation
Intensification of existing and establishment of new contacts to R&D and business partners along the value chain á 100 %
Intensification of existing and establishment of new contacts to partners from politics and assiciations, etc. à 52 %
Access to consultants wirh expertise in other fields (e. g. in areas such as tax, law, human resources, marketing) æ 23 %
Improvement of motivation and openness with respect to co-operation ä 97 %
3) Entrepreneurial Performance
Increase in turnover and profits ä 75 %
Headcount increase (full-time job equivalent) à 47 %
Number of innovative products, processes and services ä 79 %
Quality of products and processes ä 63 %
Increase in productivity ä 55 %
Reduction of the time-to-market æ 48 %
Increase in R&D expenses (innovation intensity: R&D expenses/turnover) à 48 %
New business opportunities à 89 %
Entering new markets (geographically, new products/services) æ 71 %
4) Image and Reputation
Improvement of image and reputation of the industry/sector ä 58 %
Improvement of image and reputation of the organization itself and its products á 92 %
Improvement of image and profile-raising of the business location ä 63 %
5) Sustainability
Willingness to make a financial contribution for the cluster management to secure its continuance and thus
- with continuous achievement â
- with improved performance spectrum ä
Preferred funding model for financing the cluster management organization
Willingness to get actively involved in the cluster initiative in terms of personnel
- with continuous achievement æ
- with improved performance spectrum ä
Potential negative impacts on the cluster initiative due to “free-riders“ 22%
6) Summary
Assessment of overall benefits achieved by cluster involvement
Further positive impacts, not mentioned in the questionnaire
Unexpected negative impacts of cluster involvement
Cluster Impact Analyses

The real cluster case 15
low highPriority of the indicator
Eval
uat
ion
of
the
ind
icat
or
(eff
ects
)
very high
very low
high
medium
low
1 12
16
17
19
74
1021
13113
2214
8
15 2120
182
56
9
3.3 Matrix – Cluster A
1) Qualification and Innovation1 = Access to qualified personnel in the network2 = Access to qualification offers and trainings for the network’s staff3 = Access to technological know-how and technical infrastructure4 = Access to market- and sector-related trends5 = Access to funding and capital (public and private)6 = Influence on standard-setting and standardisation processes
2) Co-operation7 = Intensification of existing and establishment of new contacts to R&D and business partners along the value chain8 = Intensification of existing and establishment of new contacts to partners from politics and associations, etc.9 = Access to consultants with expertise in other fields (e. g. in areas such as tax, law, human resources, marketing)10 = Improvement of motivation and openess with respect to co-operation
3) Entrepreneurial Performance11 = Increase in turnover and profits12 = Headcount increase (full-time job equivalent)13 = Number of innovative products, processes and services14 = Quality of prodects and processes15 = Increase in productivity16 = Reduction of the time-to-market17 = Increase in R&D expenses (innovation intensity: R&D expenses/turnover18 = New business opportunities19 = Entering new markets (geographically, new products/services)
4) Image and Reputation 20 = Improvement of image and reputation of the industry/sector21 = Improvement of image and reputation of the organisation itself and its products 22 = Improvement of image and profile-raising of the business location
16 Cluster Impact Analysis
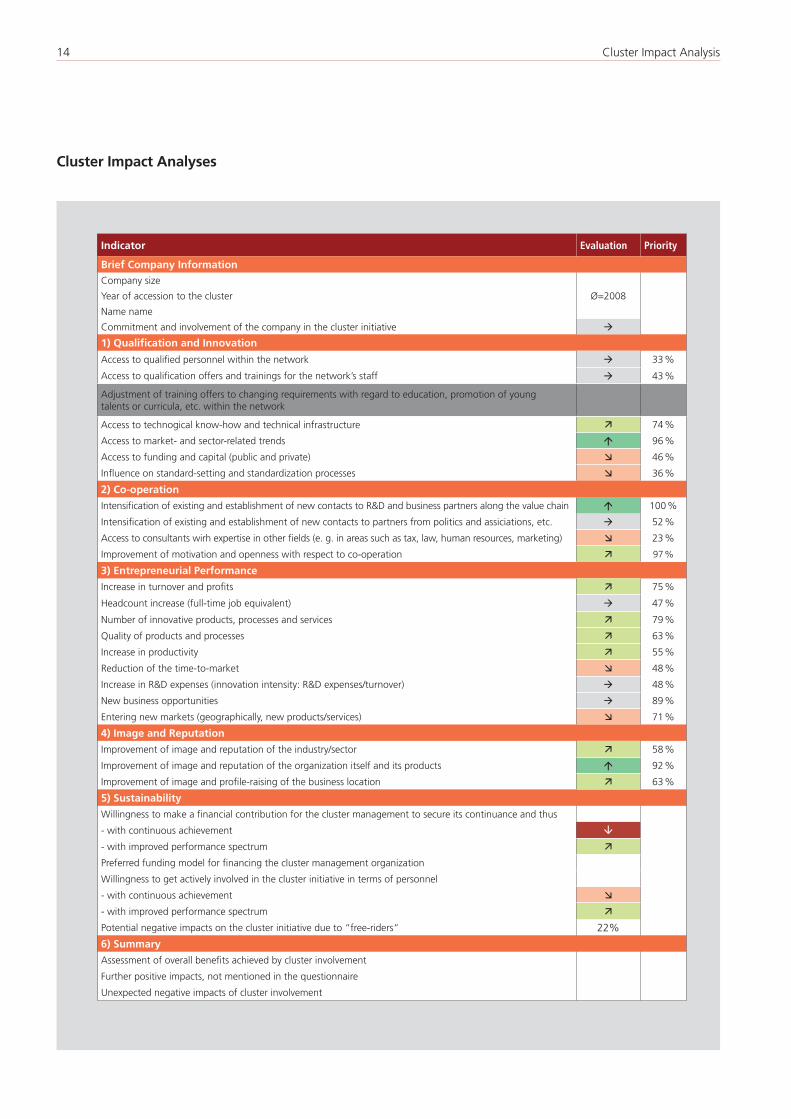
The matrix displays the evaluation of the indicators, and thus the achieved effects in relation to the prioritisation.
The result basically shows that the companies were able to achieve effects in all fields of significant priority (green zone). Particular emphasis must be given to the remarkable results in the following fields:
ff Access to market and sector-related trends (4)
ff Intensification of existing and establishment of new contacts to R&D and business partners along the value chain (7)
ff Improvement of image and reputation of the organisation itself and its product (21)
ff Improvement of motivation and openness with respect to co-operation (10)
In the fields of less priority (yellow zone), the achieved effects have had low or medium significance.
The points placed in the red zone and in the area of transi-tion to the green zone, respectively, are of special interest. It is noticeable that the effects corresponding to the intention of “Entering new markets” have comparably been modest, although this goal had ranked high in priority.
Result
The The matrix shows a clear upward trend from the left to the right side, i. e. the higher the priority of the goals had been evaluated in the cluster, the more effective their achieve-ment has been.
The aspects ranking high in priority for the cluster are all placed in the “green zone” without exception and are related to positive results.
The only clear exception is the indicator “Entering new markets”. For this aspect, the cluster management should exa-mine the eventual need for an optimisation of existing support measures or the provision of completely new services. Further options for development may be identified for the points in the yellow zone. These include particularly the “Reduction of the time-to-market” (16), “Increase of the R&D expenses” (17), “Headcount increase” (12) as well as the “Access to funding” (5).
1) Qualification and Innovation (Indicators 1 to 6)
Against the background of prioritisation, the effects achieved in this category have predominantly been good or very good.
ff With regard to “Access to qualified personnel” and “Access to qualification offers and trainings for the network’s staff”, effects of medium significance are obvious. In addition, more than 20 % of the companies, not having defined these aspects as explicit goals, have finally been able to benefit.
ff In the fields “Access to technological know-how” and “Access to market- and sector-related trends” the achieved effects have been good or very good.
ff 54 % of the enterprises had not explicitly striven for access to capital and funding, and have also not remarked any improvements concerning this matter. For the remaining 46 % that had mentioned this aspect as a pursued goal, the access to funding has widely been facilitated.
ff “Standard-setting and standardisation processes” had been a defined goal by a rather small group of 36 %. The major part of this group has been able to benefit from the cluster activities.
2) Co-operation (Indicators 7 to 10)
ff The results in the category “Co-operation” reflect a par-tially mixed picture and also have to be considered in the context of prioritisation.
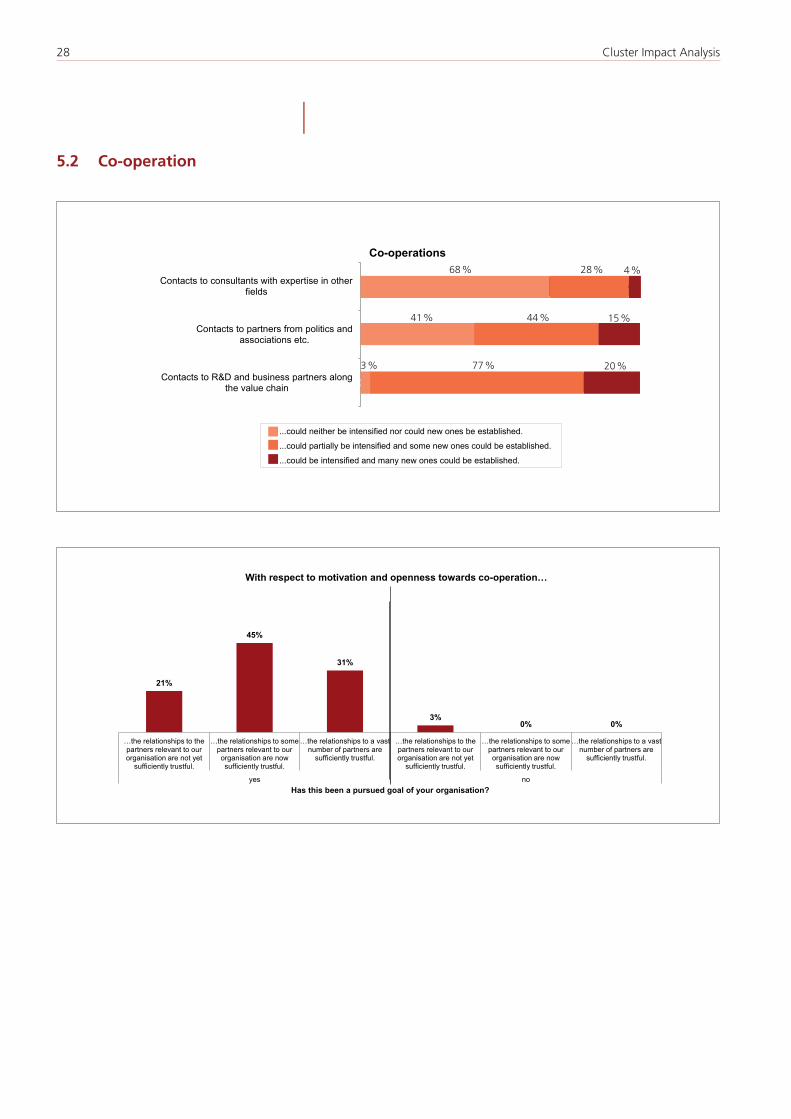
ff The companies have managed in an excellent way to inten-sify their existing and to establish new business contacts to organisations along the value chain. This was the only aspect having been mentioned as a prior goal by all, and thus by 100 % of the enterprises. 97 % of the companies stated that they had managed well or very well to deepen existing business relationships and to initiate new partner-ships.
ff Also the contacts to partners from politics and associations etc. could have been improved by 59 % of the companies. With respect to contacts to consultants with expertise in other fields (e. g. marketing, human resources), a majority of 68 % has not deepened existing or initiated any new contacts. However, the latter represented only for 23 % an entrepreneurial goal.
The real cluster case 17
ff Nevertheless, 24 % of the companies having sent their reply stated that they did not maintain trustful interactions with relevant partners. But in contrast, 45 % considered their relationships to at least a part of their potential partners as trustful. Another 31 % managed to establish relationships based on trust with the major part of the relevant organi-sations.
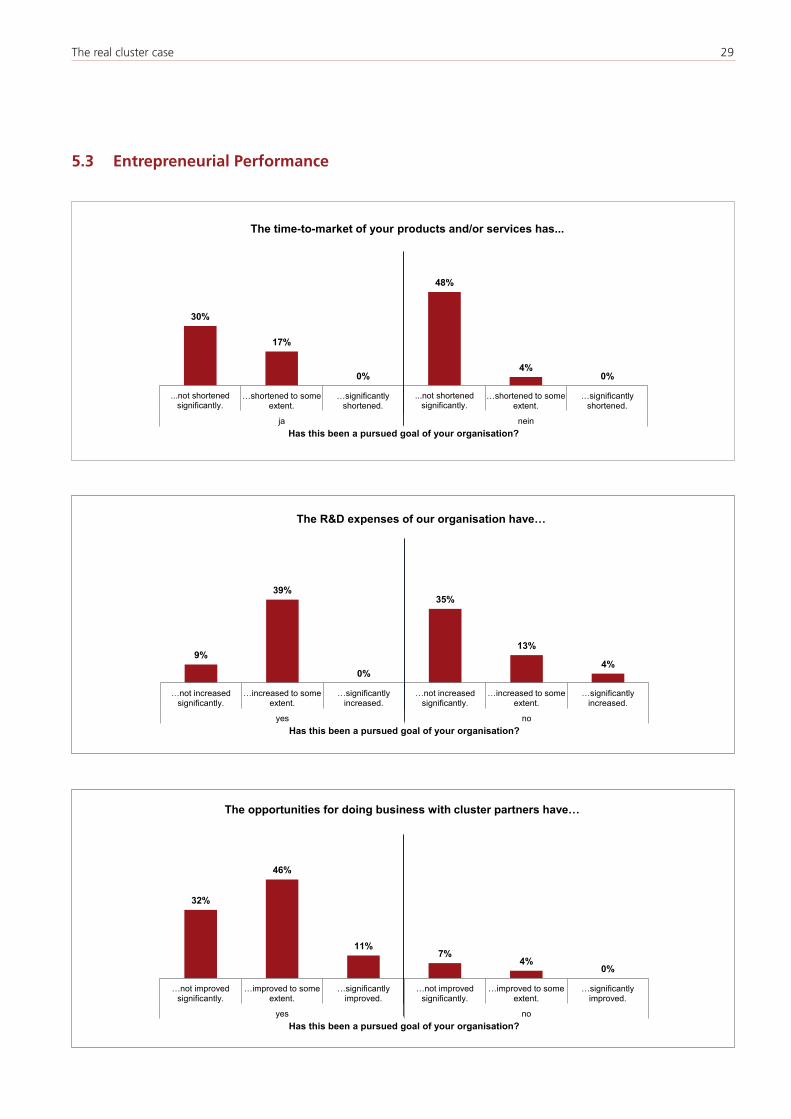
3) Entrepreneurial Performance (Indicators 11 to 19)
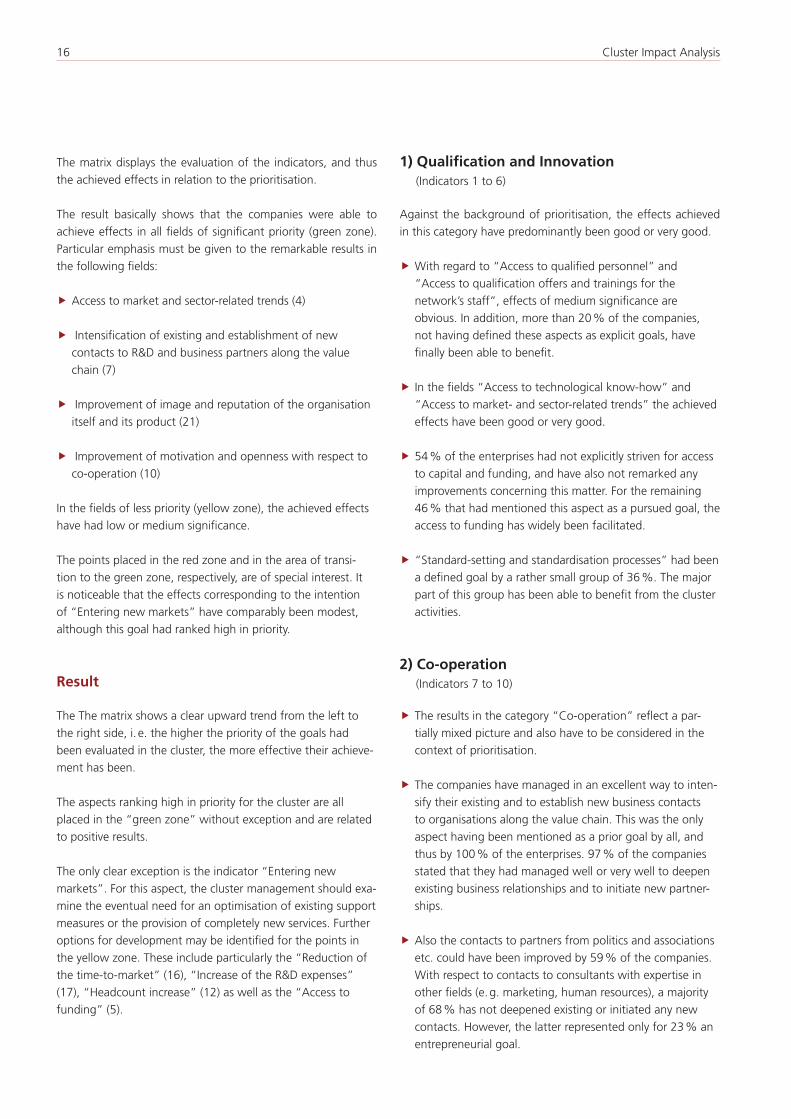
When asking the companies about the development of major performance parameters in comparison to the general indust-ry average over the last two years, a very positive picture was presented. For every parameter, at least one third of the res-pondents had outranged the industry average with their results.
ff Turnover: More than 46 % had been able to realise deve-lopments exceeding the industry average. 14 % even had outnumbered the average significantly. Only 10 % of the companies had observed a development trend below the industry average.
ff With respect to headcount increase, two thirds stated being in line with the industry average and about one third being slightly above.
ff Considering the number of innovative products, pro-cesses and services, nearly 50 % had recorded develop-ments above average.
ff With regards to quality of the products and proces-ses, about one third of the companies had surpassed the average performance.
ff According to 45 % of the respondents, their productivity had been improved above the industry average.
Turnover
Headcount increase
Quality of the products and processes
Productivity
Number of innovative products, processes and services
10 % 62 % 29 %
9 % 45 % 32 % 14%
64 % 9 %27 %
55 % 40 % 5 %
5 % 45 % 32 % 14%5 %
Clearly worse compared to the sector as a whole Worse compared to the industry average
In line with the general industry average Above the industry average Well above the industry average
18 Cluster Impact Analysis
In addition to the above mentioned performance parameters, the question has been raised as to further company-related effects. As they are only difficult to compare with the sector as a whole, the companies have been requested to give an assess-ment according to the following three reply categories.
The graphs for the following findings are displayed in the annex.
ff For the majority of the respondents (78 %), the time-to-market of products and services could have been only reduced to a very low extent or even not at all, although it represented a prior goal for about half of the companies.
ff The R&D expenses had been increased by more than one half of the surveyed enterprises (56 %), whereas 17 % of them had not defined this growth of expenditure as a cluster-related goal. About 10 % had deviated from their original plan and did only increase their R&D spending insignificantly or not at all.
ff Nearly all of the respondents were looking for opportu-nities to develop new businesses with other cluster partners. However, only one third of the companies had been able to implement this objective. On the other hand, about two third of the enterprises in the cluster initiative reported slight or significant improvements.
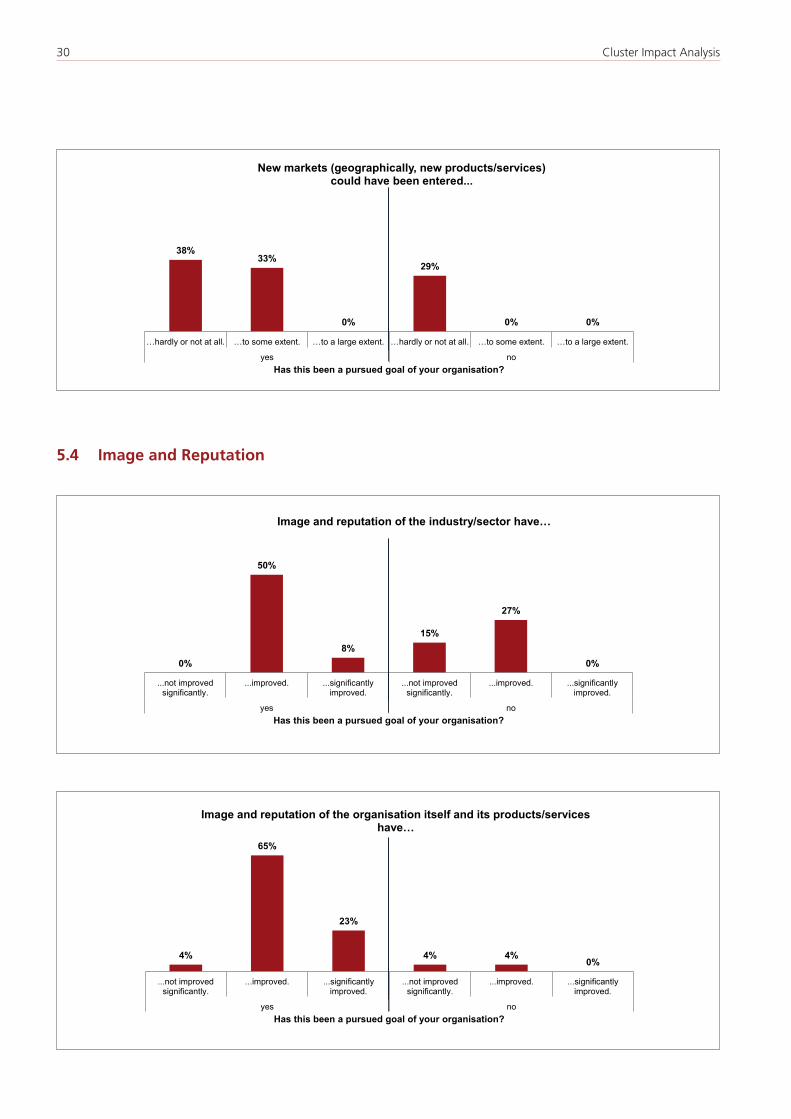
ff The entering of new markets (geographically, new pro-ducts/services) represented an important goal for approx. two thirds of the companies. Up to now, one third has successfully managed to explore in some cases even new markets. The other two thirds of the enterprises have succeeded in entering new markets only rarely or not at all.
4) Image and Reputation (Indicators 20 to 22)
According to the majority of the respondents, the cluster initiative has contributed considerably to an improvement of the companies’ image and reputation at various levels.
ff Sector: 85 % share the view that the image and reputation of the industry sector as a whole had been slightly impro-ved. 8 % of the respondents even reported a significant improvement.
ff Organisation itself including products and services: Also for this aspect, image enhancements are clearly noticeable . 69 % mentioned improvements, and about one fourth (23 %) observed even a significant improvement.
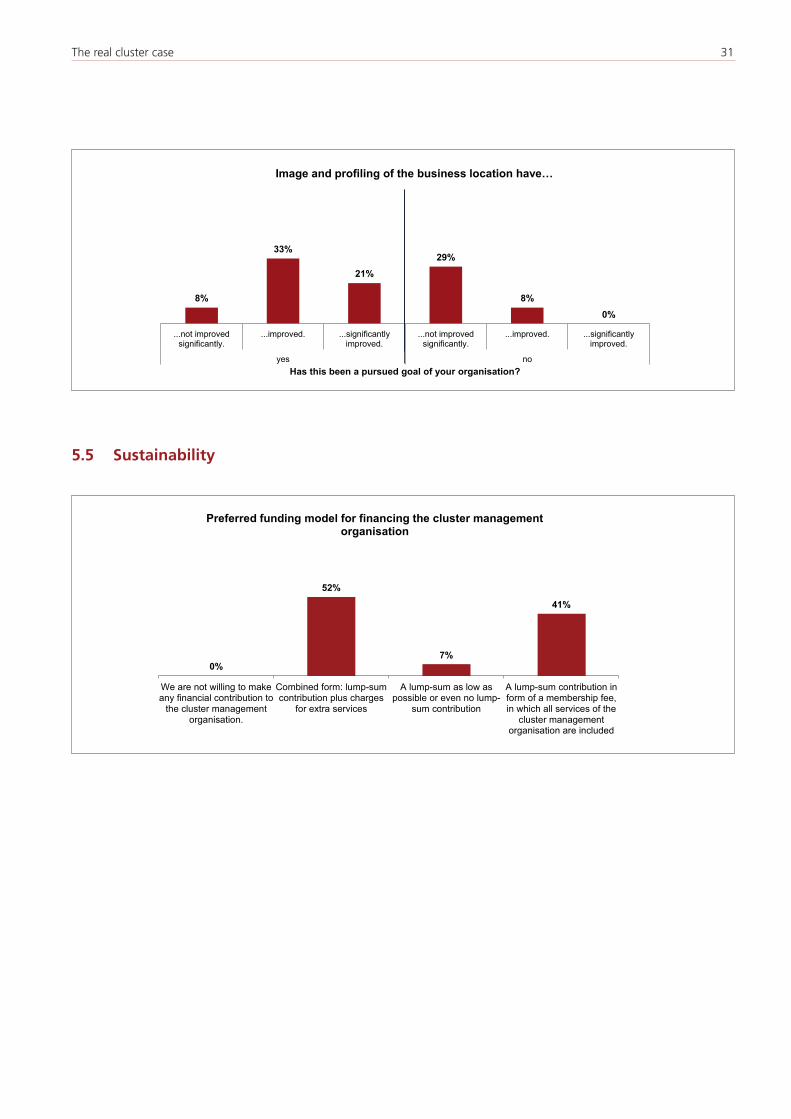
ff Profile-raising of the business location: Almost two thirds felt that the profile of their business location could have been raised. However, 37 % had hardly ever or not recognised any profiling improvement, whereas 29 % of those had not defined this as a cluster-related goal.
3.5 Overall Monetary Benefit Resulting from Cluster Activities
In the course of their involvement in cluster activities, compa-nies are making investments differing in their amounts. The most practiced form hereby is the deployment of personnel, but also the payment of financial contributions, as e. g. mem-bership fees, or the participation in chargeable events, whereas investments in R&D and development projects are explicitly not meant in this category. Consequently, the enterprises expect to benefit from their involvement also economically, besides other qualitative advantages.
Therefore, the companies have been asked to give an estimate about the monetary benefits they were able to realise over the last two years thanks to their participation in the cluster:The term “monetary benefit” may for example imply: additional revenues, licensing revenues, cost savings, reduced develop-ment time, lower financial risk etc.
Result Overall Benefit Cluster A:
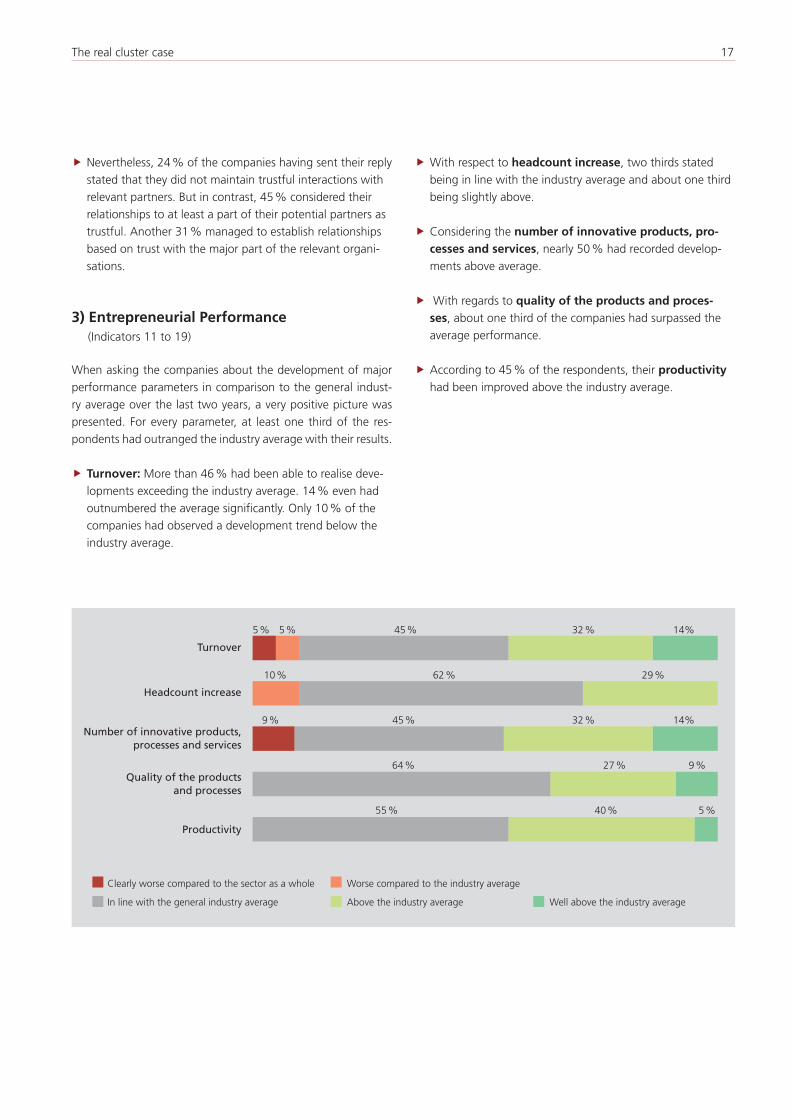
Round about three-fourths of the surveyed companies stated having profited also financially during the last two years.
ff A small group of 4 % have recorded benefits ranging from € 100,000 to € 250,000.
ff 16 % were able to achieve contributions between € 50,000 and € 100,000.
ff Almost one third estimated their monetary benefits to be less than € 10,000.
ff None of the survey participants responded having achieved benefits exceeding € 250,000.
What proves interesting is a comparison of the investments in the activities of cluster A over the last two years with the achie-ved monetary effects resulting from an active participation in the network according to the involved companies.
The total investment for the period from 2011 to 2012 amounts to EUR 1,350,000 (public and private investments). This num-
The real cluster case 19
ber includes human resources for the cluster management organisation as well as financial resources for innovation pro-jects, events, PR work, membership fees etc.
When relating this to the 70 participants of cluster A, the annual investment costs for each company would amount to EUR 9,650 (40 out of the 70 participants are enterprises). Only those can benefit financially from the involvement in the cluster initiative in the strict sense. On the other hand, the surveyed companies have reported an average “monetary value” [return on investment] of approx. EUR 12,600 per year resulting from their active participation in the cluster. This corresponds to a positive rate (monetary value/investments) of approx. 1.3.
This value is encouraging. Companies that show particularly active commitment to the activities of cluster A rea lise an ave-rage monetary benefit almost twice as high as the average value (EUR 26,000 Euro p. a.).
Having the public investments on focus, the corresponding leverage ratio amounts to 2.3. Thus, each euro invested by public authorities generates a monetary benefit for the com-panies involved in the cluster initiative of EUR 2.3. This can be considered to be an excellent result.
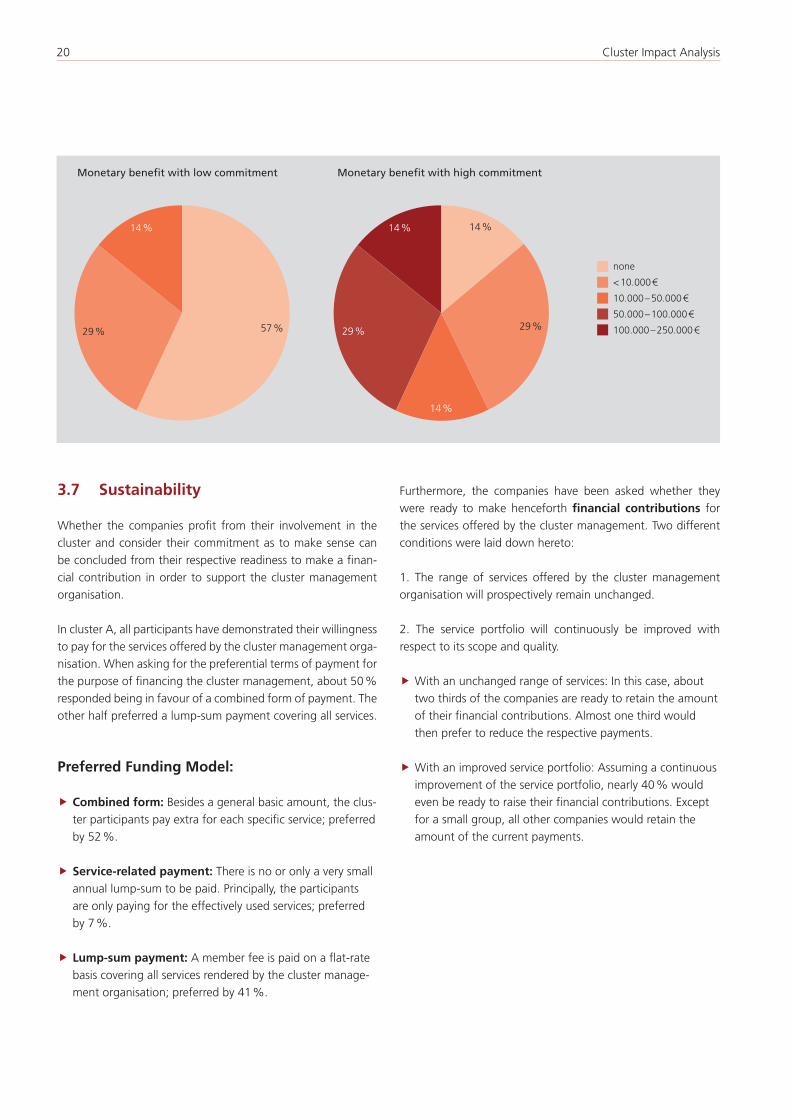
3.6 Involvement in Activities of Cluster A pays off
The direct comparison of companies that are very actively involved in the network’s activities, and that are spending more than two days for cluster work in terms of personnel resources, with those enterprises spending less than one day a month for cluster work, and being less active with regard to interactions, clearly shows that commitment also pays off in the light of monetary aspects.
The differences between the more committed and the less active group are clearly evident.
For further details with respect to the different commitments for cluster activities, see also chapter 3.3.
Group “high commitment”
ff Only 14 % responded not having achieved any monetary benefits. This percentage is considerably lower compared to the less active group of cluster participants.
ff Nevertheless, about 30 % have recorded benefits in the range of € 50,000 to € 100,000, and 14 % even between € 100,000 and € 250,000.
ff Group “low commitment”
ff About 30 % recorded benefits below € 10,000 and approx. 60 % did not profit financially at all.
ff The monetary benefit in this group does not exceed the maximum value of € 50,000.
Monetary benefit resulting from an active participation in cluster activities (in total)
none
< 10.000 €
10.000 – 50.000 €
50.000 – 100.000 €
100.000 – 250.000 €
4 %
16 %
16 %
28 %
36 %
20 Cluster Impact Analysis
3.7 Sustainability
Whether the companies profit from their involvement in the cluster and consider their commitment as to make sense can be concluded from their respective readiness to make a finan-cial contribution in order to support the cluster management organisation.
In cluster A, all participants have demonstrated their willingness to pay for the services offered by the cluster management orga-nisation. When asking for the preferential terms of payment for the purpose of financing the cluster management, about 50 % responded being in favour of a combined form of payment. The other half preferred a lump-sum payment covering all services.
Preferred Funding Model:
ff Combined form: Besides a general basic amount, the clus-ter participants pay extra for each specific service; preferred by 52 %.
ff Service-related payment: There is no or only a very small annual lump-sum to be paid. Principally, the participants are only paying for the effectively used services; preferred by 7 %.
ff Lump-sum payment: A member fee is paid on a flat-rate basis covering all services rendered by the cluster manage-ment organisation; preferred by 41 %.
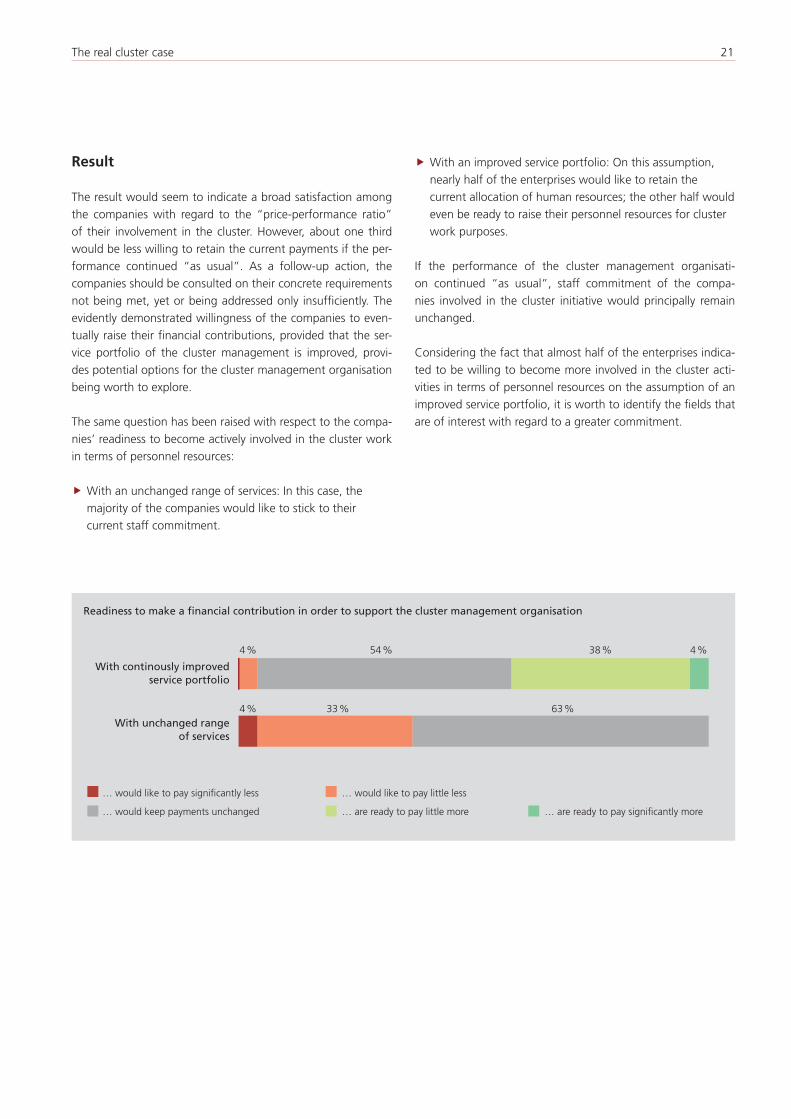
Furthermore, the companies have been asked whether they were ready to make henceforth financial contributions for the services offered by the cluster management. Two different conditions were laid down hereto:
1. The range of services offered by the cluster management organisation will prospectively remain unchanged.
2. The service portfolio will continuously be improved with respect to its scope and quality.
ff With an unchanged range of services: In this case, about two thirds of the companies are ready to retain the amount of their financial contributions. Almost one third would then prefer to reduce the respective payments.
ff With an improved service portfolio: Assuming a continuous improvement of the service portfolio, nearly 40 % would even be ready to raise their financial contributions. Except for a small group, all other companies would retain the amount of the current payments.
none
< 10.000 €
10.000 – 50.000 €
50.000 – 100.000 €
100.000 – 250.000 €
Monetary benefit with low commitment Monetary benefit with high commitment
14 %
29 % 57 %
14 %
29 %29 %
14 %14 %
The real cluster case 21
Result
The result would seem to indicate a broad satisfaction among the companies with regard to the “price-performance ratio” of their involvement in the cluster. However, about one third would be less willing to retain the current payments if the per-formance continued “as usual”. As a follow-up action, the companies should be consulted on their concrete requirements not being met, yet or being addressed only insufficiently. The evidently demonstrated willingness of the companies to even-tually raise their financial contributions, provided that the ser-vice portfolio of the cluster management is improved, provi-des potential options for the cluster management organisation being worth to explore.
The same question has been raised with respect to the compa-nies’ readiness to become actively involved in the cluster work in terms of personnel resources:
ff With an unchanged range of services: In this case, the majority of the companies would like to stick to their current staff commitment.
ff With an improved service portfolio: On this assumption, nearly half of the enterprises would like to retain the current allocation of human resources; the other half would even be ready to raise their personnel resources for cluster work purposes.
If the performance of the cluster management organisati-on continued “as usual”, staff commitment of the compa-nies involved in the cluster initiative would principally remain unchanged.
Considering the fact that almost half of the enterprises indica-ted to be willing to become more involved in the cluster acti-vities in terms of personnel resources on the assumption of an improved service portfolio, it is worth to identify the fields that are of interest with regard to a greater commitment.
none
< 10.000 €
10.000 – 50.000 €
50.000 – 100.000 €
100.000 – 250.000 €
4 % 54 % 38 % 4 %
4 % 33 % 63 %
With continously improved service portfolio
With unchanged range of services
Readiness to make a financial contribution in order to support the cluster management organisation
… would like to pay significantly less … would like to pay little less
… would keep payments unchanged … are ready to pay little more … are ready to pay significantly more

22 Cluster Impact Analysis
3.8 Annotations by the Companies
Finally an open question was raised as to whether the compa-nies had recorded further positive or negative impacts. More-over, they were asked about their impression regarding the exis-tence of “free-riders” in the cluster.
Positive Impacts
The respondents particularly emphasised the networking pos-sibilities and the facilitated initiation of contacts as a result of inter mediation as a positive effect. Apart from that, the following aspects have been mentioned as positive:
ff excellent possibilities to establish business relations with other industry players;
ff funded R&D projects that had been initiated in cluster A;
ff information about technological developments, such as alternative drives, lightweight construction etc.;
ff public recognition;
ff access to customers;
ff multiplier effects due to the active contributions in cluster A (moderation of working groups, lectures, newsletter etc.).
Critical Aspects
Regarding the aspects with potential for improvement, the respondents pointed out that the impulses from the working groups/lead projects should be implemented or executed con-sequently and in a professional manner. In this context, it was questioned whether this task could generally be performed by universities.
Furthermore, the apparent focusing on university B as R&D partner has been seen as critical. It has hence been suggested to strengthen the co-operation with other research institutes in the network.
As a negative impact of the work in the cluster, it has been found that project ideas originating from the cluster had dif-fused so that other interested circles were able to gain know-ledge about them.
A few respondents also have mentioned the high personnel expense resulting from cluster work as a critical aspect.
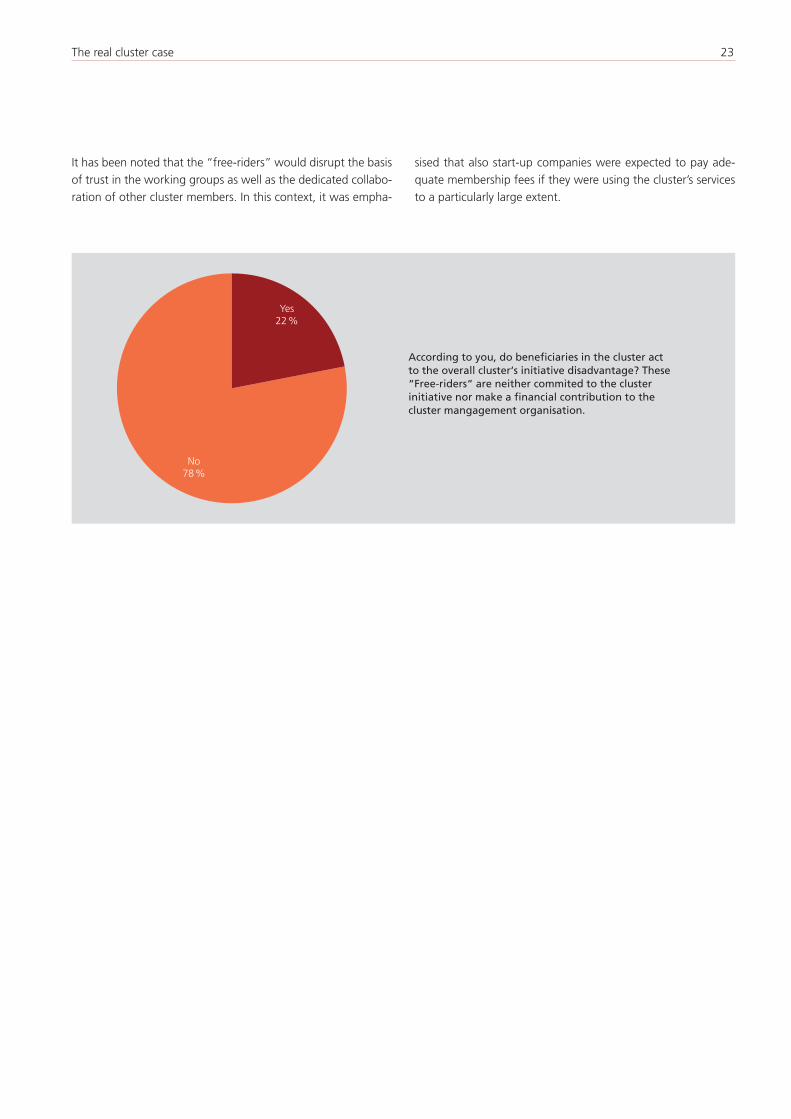
Number of Free-Riders in the Cluster
About one fifth of the cluster’s participants share the view that beneficiaries (“free-riders”) were benefiting from the cluster acti vities without showing commitment or making financial contributions to the cluster management organisation, and that they were thus acting at the expense of the network.
4 % 48 % 37 % 11 %
3 % 14 % 72 % 10 %
With continously improved service portfolio
With unchanged range of services
Readiness to become more actively involved in the cluster work in terms of personnel resources
… would like to reduce their commitment significantly in terms of personnel
… would like to slightly reduce their commitment in terms of personnel
… would keep their commitment unchanged in terms of personnel
… are ready to slightly increase their commitment in terms of personnel
… are ready to increase their commitment significantly in terms of personnel
The real cluster case 23
It has been noted that the “free-riders” would disrupt the basis of trust in the working groups as well as the dedicated collabo-ration of other cluster members. In this context, it was empha-
sised that also start-up companies were expected to pay ade-quate membership fees if they were using the cluster’s services to a particularly large extent.
According to you, do beneficiaries in the cluster act to the overall cluster‘s initiative disadvantage? These “Free-riders“ are neither commited to the cluster initiative nor make a financial contribution to the cluster mangagement organisation.
Yes 22 %
No 78 %
24 Cluster Impact Analysis
4 Structural Data of the Cluster
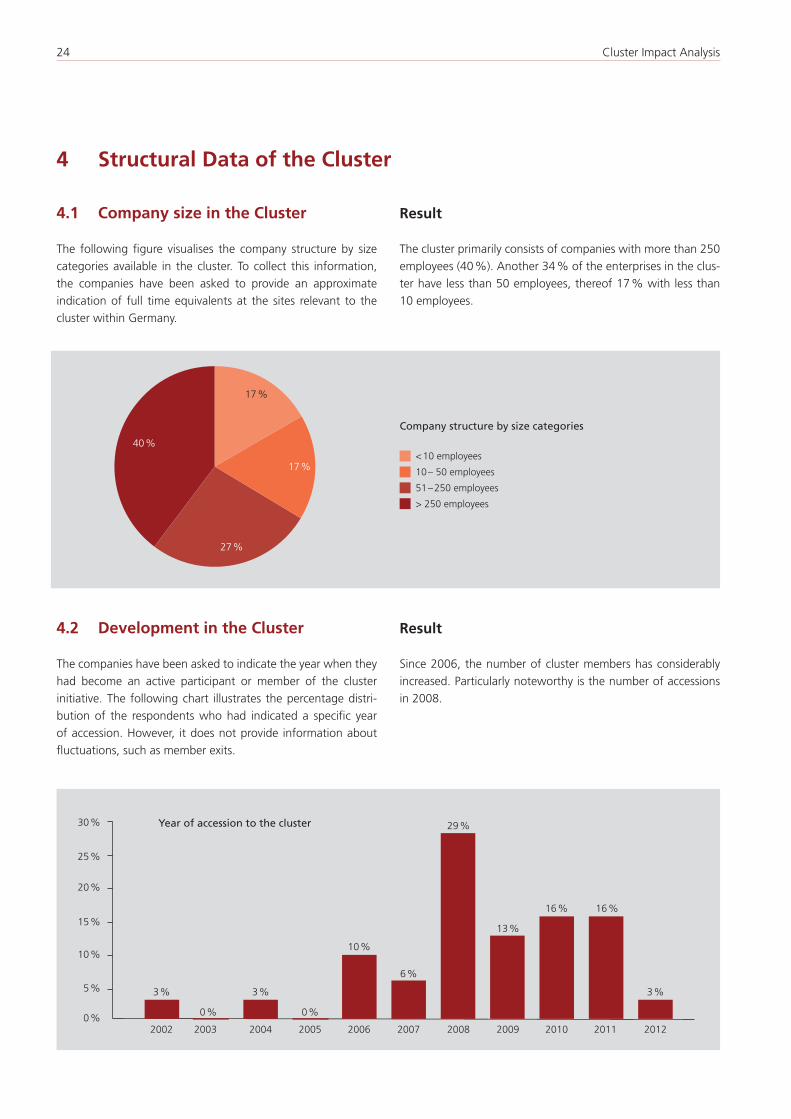
4.1 Company size in the Cluster
The following figure visualises the company structure by size categories available in the cluster. To collect this information, the companies have been asked to provide an approximate indication of full time equivalents at the sites relevant to the cluster within Germany.
Result
The cluster primarily consists of companies with more than 250 employees (40 %). Another 34 % of the enterprises in the clus-ter have less than 50 employees, thereof 17 % with less than 10 employees.
4.2 Development in the Cluster
The companies have been asked to indicate the year when they had become an active participant or member of the cluster initia tive. The following chart illustrates the percentage distri-bution of the respondents who had indicated a specific year of accession. However, it does not provide information about fluctuations, such as member exits.
Result
Since 2006, the number of cluster members has considerably increased. Particularly noteworthy is the number of accessions in 2008.
Company structure by size categories
Year of accession to the cluster
3 %
0 %
3 % 3 %
0 %
10 %
6 %
29 %30 %
2002 2003 2004 2005 2006 2007 2008 2009 2010 2011 2012
25 %
20 %
15 %
10 %
5 %
0 %
13 %
16 % 16 %
< 10 employees
10 – 50 employees
51 – 250 employees
> 250 employees
17 %
17 %
27 %
40 %
The real cluster case 25
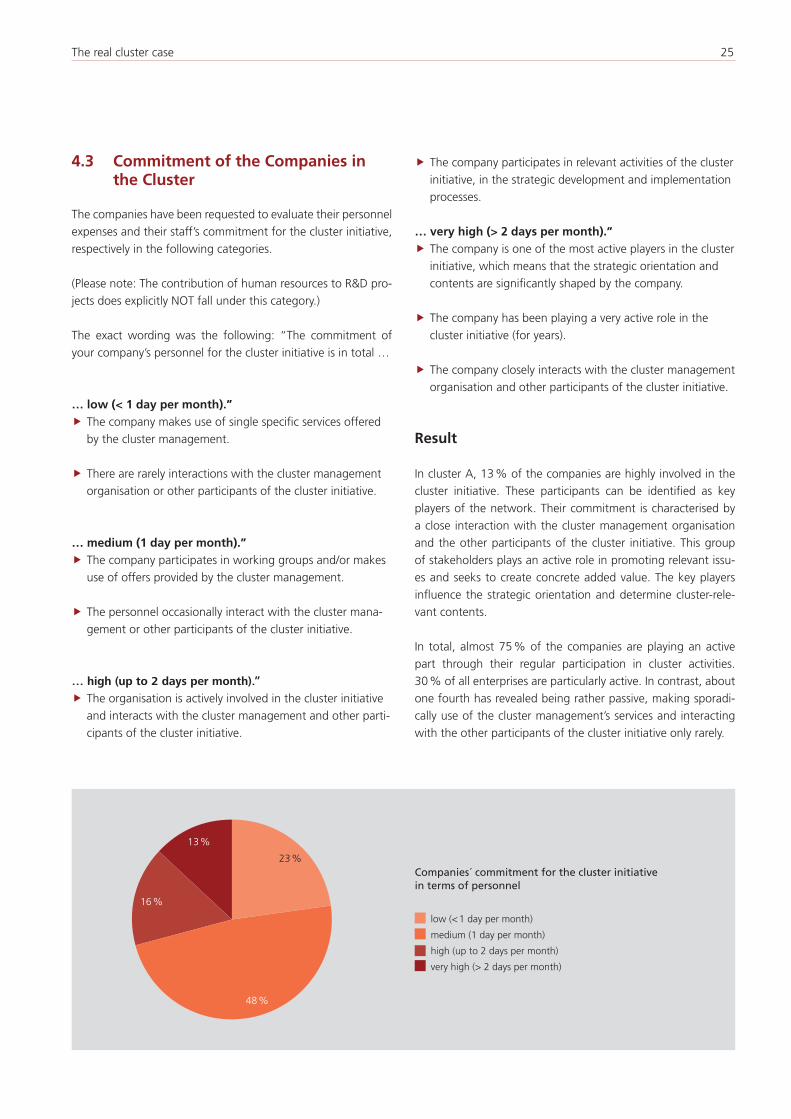
4.3 Commitment of the Companies in the Cluster
The companies have been requested to evaluate their personnel expenses and their staff’s commitment for the cluster initiative, respectively in the following categories.
(Please note: The contribution of human resources to R&D pro-jects does explicitly NOT fall under this category.)
The exact wording was the following: “The commitment of your company’s personnel for the cluster initiative is in total …
… low (< 1 day per month).”ff The company makes use of single specific services offered by the cluster management.
ff There are rarely interactions with the cluster management organisation or other participants of the cluster initiative.
… medium (1 day per month).”ff The company participates in working groups and/or makes use of offers provided by the cluster management.
ff The personnel occasionally interact with the cluster mana-gement or other participants of the cluster initiative.
... high (up to 2 days per month).”
ff The organisation is actively involved in the cluster initiative and interacts with the cluster management and other parti-cipants of the cluster initiative.
ff The company participates in relevant activities of the cluster initiative, in the strategic development and implementation processes.
… very high (> 2 days per month).”ff The company is one of the most active players in the cluster initiative, which means that the strategic orientation and contents are significantly shaped by the company.
ff The company has been playing a very active role in the cluster initiative (for years).
ff The company closely interacts with the cluster management organisation and other participants of the cluster initiative.
Result
In cluster A, 13 % of the companies are highly involved in the cluster initiative. These participants can be identified as key players of the network. Their commitment is characterised by a close interaction with the cluster management organisation and the other participants of the cluster initiative. This group of stakeholders plays an active role in promoting relevant issu-es and seeks to create concrete added value. The key players influence the strategic orientation and determine cluster-rele-vant contents.
In total, almost 75 % of the companies are playing an active part through their regular participation in cluster activities. 30 % of all enterprises are particularly active. In contrast, about one fourth has revealed being rather passive, making sporadi-cally use of the cluster management’s services and interacting with the other participants of the cluster initiative only rarely.
Companies´ commitment for the cluster initiative in terms of personnel
low (< 1 day per month)
medium (1 day per month)
high (up to 2 days per month)
very high (> 2 days per month)
23 %
48 %
16 %
13 %
26 Cluster Impact Analysis
5 Annex: Evaluation in Figures
5.1 Qualification and Innovation
4%
21%
8%
42%
21%
4%
minor or no effects medium effects very good effects minor or no effects medium effects very good effects
yes noHas this been a pursued goal of your organisation?
Availability of personnel since the involvement in the cluster initiative
4%
26%
13%
39%
17%
0%
minor or no effects medium effects very good effects minor or no effects medium effects very good effects
yes noHas this been a pursued goal of your organisation?
Availability of qualification offers and trainings for the network’s staff
11%
48%
15%7%
19%
0%
...has developedrather poorly or
insufficiently
...is now given ...is now very good orexcellent
...has developedrather poorly or
insufficiently
...is now very good orexcellent
...ist nun sehr gut bisausgezeichnet
yes noHas this been a pursued goal of your organisation?
Availability of technological know-how and technical infrastructure
...is now very good or excellent
...is now given
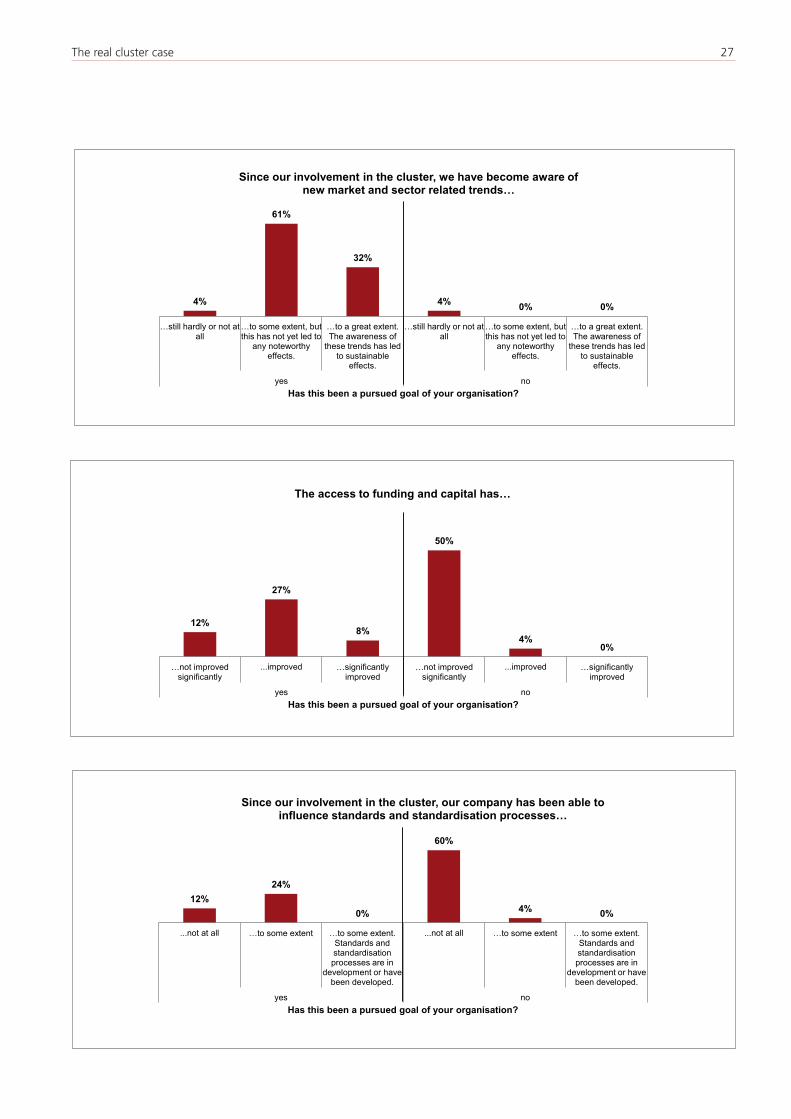
The real cluster case 27
4%
61%
32%
4% 0% 0%
…still hardly or not at all
…to some extent, but this has not yet led to
any noteworthy effects.
…to a great extent. The awareness of
these trends has led to sustainable
effects.
…still hardly or not at all
…to some extent, but this has not yet led to
any noteworthy effects.
…to a great extent. The awareness of
these trends has led to sustainable
effects.
yes noHas this been a pursued goal of your organisation?
Since our involvement in the cluster, we have become aware of new market and sector related trends…
12%
27%
8%
50%
4%0%
…not improved significantly
...improved …significantly improved
…not improved significantly
...improved …significantly improved
yes noHas this been a pursued goal of your organisation?
The access to funding and capital has…
12%24%
0%
60%
4% 0%
...not at all …to some extent …to some extent. Standards and standardisation processes are in
development or have been developed.
...not at all …to some extent …to some extent. Standards and standardisation processes are in
development or have been developed.
yes noHas this been a pursued goal of your organisation?
Since our involvement in the cluster, our company has been able to influence standards and standardisation processes…
28 Cluster Impact Analysis
5.2 Co-operation
21%
45%
31%
3%0% 0%
…the relationships to the partners relevant to our organisation are not yet
sufficiently trustful.
…the relationships to some partners relevant to our organisation are now sufficiently trustful.
…the relationships to a vast number of partners are
sufficiently trustful.
…the relationships to the partners relevant to our organisation are not yet
sufficiently trustful.
…the relationships to some partners relevant to our organisation are now sufficiently trustful.
…the relationships to a vast number of partners are
sufficiently trustful.
yes noHas this been a pursued goal of your organisation?
With respect to motivation and openness towards co-operation…
3%
41%
68%
77%
44%
28%
20%
15%
4%
Contacts to R&D and business partners alongthe value chain
Contacts to partners from politics andassociations etc.
Contacts to consultants with expertise in otherfields
Co-operations
...could neither be intensified nor could new ones be established.
...could partially be intensified and some new ones could be established.
...could be intensified and many new ones could be established.
68 % 28 % 4 %
41 % 44 % 15 %
3 % 77 % 20 %
The real cluster case 29
5.3 Entrepreneurial Performance
30%
17%
0%
48%
4%0%
...not shortenedsignificantly.
…shortened to some extent.
…significantly shortened.
...not shortenedsignificantly.
…shortened to some extent.
…significantly shortened.
ja neinHas this been a pursued goal of your organisation?
The time-to-market of your products and/or services has...
9%
39%
0%
35%
13%
4%
…not increased significantly.
…increased to some extent.
…significantly increased.
…not increased significantly.
…increased to some extent.
…significantly increased.
yes noHas this been a pursued goal of your organisation?
The R&D expenses of our organisation have…
32%
46%
11%7%
4%0%
…not improved significantly.
…improved to some extent.
…significantly improved.
…not improved significantly.
…improved to some extent.
…significantly improved.
yes noHas this been a pursued goal of your organisation?
The opportunities for doing business with cluster partners have…
30 Cluster Impact Analysis
38%33%
0%
29%
0% 0%
…hardly or not at all. …to some extent. …to a large extent. …hardly or not at all. …to some extent. …to a large extent.
yes noHas this been a pursued goal of your organisation?
New markets (geographically, new products/services) could have been entered...
5.4 Image and Reputation
0%
50%
8%15%
27%
0%
...not improvedsignificantly.
...improved. ...significantlyimproved.
...not improvedsignificantly.
...improved. ...significantlyimproved.
yes noHas this been a pursued goal of your organisation?
Image and reputation of the industry/sector have…
4%
65%
23%
4% 4%0%
...not improvedsignificantly.
...improved. ...significantlyimproved.
...not improvedsignificantly.
...improved. ...significantlyimproved.
yes noHas this been a pursued goal of your organisation?
Image and reputation of the organisation itself and its products/services have…
The real cluster case 31
5.5 Sustainability
8%
33%
21%29%
8%0%
...not improvedsignificantly.
...improved. ...significantlyimproved.
...not improvedsignificantly.
...improved. ...significantlyimproved.
yes noHas this been a pursued goal of your organisation?
Image and profiling of the business location have…
0%
52%
7%
41%
We are not willing to makeany financial contribution to
the cluster managementorganisation.
Combined form: lump-sumcontribution plus charges
for extra services
A lump-sum as low aspossible or even no lump-
sum contribution
A lump-sum contribution inform of a membership fee,in which all services of the
cluster managementorganisation are included
Preferred funding model for financing the cluster management organisation
32 Cluster Impact Analysis
FAQ About the Cluster Impact Analysis
Who are the survey participants?
The survey exclusively addresses organisations in clusters that are pursuing entrepreneurial activities.
The questionnaire is most suitable for manufacturing and/or developing companies.
To which person is the Cluster Impact Analysis directed in the organisation?
As a general rule, only one person per company should act as respondent and central contact.
In individual cases, it is possible to send to questionnaire to more than one person of the same company in order to get a comprehensive evaluation of the company’s effects.
What is meant in the questionnaire by the term “effects achieved through the participation of your organisa-tion in the cluster initiative”?
The purpose here does relate to the achieved benefits that may result from…
ff the general participation of the company in the cluster initiative;
ff the company’s activities and commitment for the cluster initiative;
ff the services offered by the cluster management organisation.
Does the Cluster Impact Analysis evaluate and measure the specific performances and the suitability of the services offered by the clus-ter management organisation?
No, the Cluster Impact Analysis aims to measure the general effects for the companies that may result from their involvement in the cluster initiative. This does also include the services offe-red by the cluster manage-ment organisation. However, effects may also be triggered by the companies’ participation in and their com-mitment for the cluster initiative in the aggregate.
If you are interested in an analysis of the suitability of the servi-ces offered by your cluster management organisation including a satisfaction survey, the adequate instrument for you would be a member satisfaction analysis.
Is it possible to test the survey myself?
Yes. A test can be conducted by simply clicking on the given link. But PLEASE MAKE SURE to insert “test” in the field named “Company Name”. Only then we will be able to identify the actual survey participants.
When will it be possible to start the survey?
As soon as the respective link has been provided, the survey behind is activated.
For how long will the survey be activated?
The start and end of the survey can be defined by yourself. It is up to you to decide on the duration of the sur-vey period.
In most cases, it is recommended to send out a reminder email. As a general rule, the survey should be carried out over a period of two weeks. An additional week should be allowed for sub-sequent to the reminder.
Moreover, public holidays and vacation periods should be taken into account.
How can I find out the number and names of the survey participants?
Please inform us about the starting time of your survey and about the expected number of respondents.
Approx. two weeks after the start date, we will be able to give you a detailed participation overview.
Will the clusters be compared to each other?
No. A comparison is not intended.

The real cluster case 33
What is the meaning behind CNE – Cluster and Network Evaluation?
CNE is a concept for the evaluation of networks and clusters. It relates to the cluster policy itself, the cluster management as well as the network players. Based on a combination of methods including surveys, interviews and workshops, short-, medium- and long-term results are measured with respect to various aspects.
The main CNE modules include:
Module Purpose
Benchmarking of the cluster management organisation
Positioning of the cluster management organisa-tion compared to others
Cluster Impact Analysis Effects achieved by the companies in a cluster initiative
Member satisfaction analysis Evaluation of the suitability of the services offered by the cluster management organisation.
What is CMG – Cluster Monitor Germany?
The Cluster Monitor Germany is a regular brief survey of the cluster managers on trends and prospects of their networks and clusters. The CMG is carried out once in each half year without reference to the Cluster and Net-work Evaluation.

34 Cluster Impact Analysis
List auf Authors
Dr. Sonja Kind | [email protected]
Since 2005 Dr. Sonja Kind has been working with VDI/VDE-IT, where she heads the competence center “Evaluation”. Sonja is mainly involved in consulting, supporting and accompany-ing innovation and technology policy processes for public commissioners on a regional, national and international level. She has been conducting various evaluations of R&D program-mes, R&D projects as well as organizations. Most recently she has led the evaluation of the the SME oriented German fun-ding programme Industrial Community Research (“Industrielle Gemeinschaftsforschung” – IGF). In the evaluation context Sonja’s work is particularly focused on the development of new approaches for cluster and network evaluation. To support trend and implication analysis she developed and applied the (visual) roadmap technique to identify socio-economic factors by using a special visualisation technique.
Dr. Gerd Meier zu Köcker | [email protected]
Dr. Gerd Meier zu Köcker has been working with VDI/VDE-IT since 1999, where he heads the section “International Tech-nology Cooperations and Clusters”. He acts in an advisory and expert capacity on various research and innovation programmes at regional, national and international level. Apart from his scien tific activity, a major and important part of his work is devoted to various project managements in the field of cluster policy and cluster development. He is Director of the Institute for Innovation and Technology (iit) and Head of German Cluster Excellence Initiative “go-cluster” on behalf of the Federal Minis-try of Economics and Technology. In the past, he also advised the European commission as a member of the “High Level Advisory Group on Clusters” on questions of cluster policy.
The Institute for Innovation and Technology (iit) is upheld by the VDI/VDE Innovation + Technik GmbH (VDI/VDE-IT). It covers the entire innovation spectrum on a national and transnational level. Its fundamental elements are the provision of assistance, analysis, evaluation, moderation and the accompaniment of innovative systems and clusters. Its seven departments provide the basis for these services and are as follows: Innovation Sys-tems and Clusters, Innovation Support, Predicting Success of Collaborate R&D Projects, Safety and Security Systems, Inno-vation Life Sciences, Evaluation in the area of technology and innovation policy as well as Technical Education and Training.
More than 130 scientific employees are part of the team at VDI/VDE-IT and contribute their technological and socio-economic expertise to project management. Their competencies range from diverse natural sciences, engineering and social sciences to economics. The VDI/VDEIT’s thirty-five years of experience are represented in the institute’s work.

To what extent do enterprises organised in cluster initiatives profit from their networking activities? Which fields can be identified, where the positive effects for the networking companies are most apparent? Where is still potential for optimising the cluster management process? The Cluster Impact Analysis developed by the Institute for Innovation and Technology (iit) helps to find adequate answers to these questions. Thanks to the cooperation of numerous cluster managers, a practice-oriented investigation method has been developed within the scope of a pilot study. The survey exclusively addresses organisations in clusters that are pursuing entrepreneurial activities.
The report presents the results of the Cluster Impact Analysis applied to a cluster initiative from the automotive sector. The enterprises of the analysed cluster have demonstrated their outstanding ability to benefit particularly from the networking activities. The study has revealed that companies showing notably active commitment to the cluster’s activities are profiting most. As a result, the cluster manage-ment organisation has gained valuable suggestions for improving its service portfolio as well as clear insights about the most important entrepreneurial goals and expectations.