clouds in the carina arm - nasa · molecular clouds in the carina arm david andrew grabelsky nasa...
TRANSCRIPT

NASA Technical Memorandum 87798
Molecular Clouds in the Carina Arm
David Andrew Grabelsky
NASA Goddard Institute for Space Studies
New York, New York
NI IXNational Aeronautics
and Space Administration
Scientific and Technical
Information Branch
1986
https://ntrs.nasa.gov/search.jsp?R=19870001353 2018-08-31T13:49:55+00:00Z

TABLE OF CONTENT5
ACKNOWLEDGEMENTS V
INTRODUCTION
A. The CarinaArm: A BriefReview
I.OpticalStudies
2. Radio Continuum
3. Radio RecombinationLlneStudies
4. HI Studies
5. MolecularLineObservations
B. PresentWork
I
5
5
8
9
10
11
13
II.INSTRUMENTATION AND OBSERVINGTECHNIQUES
A. Instrumentation
1. Antenna
2. Mount and Drive System
3. Receiver
4. 5pectrometer
5. Computer System
B. Calibration and Observing Techniques
15
15
16
17
19
20
21
24
III. OB5ERVATION5 30
r_:E'D_iQ PAGE BI.AF_ NOT FI_
iii

IV. LARGE-SCALE PROPERTIESOF MOLECULAR GAS
IN THE CARINA ARM
/_ Kinematics and Distribution of CO
in the Carina Arm
1. The /,v Diagram
2. The Spatial Maps
3. The Distribution About the
Galactic Plane
B. Comparison with H I
1. The /,v Diagrams
2. The 5patlal Maps
3. The z-Distribution
C. Summary
36
37
37
42
45
50
50
54
55
57
V. THE CARINA ARM MOLECULAR CLOUDS
A. Identificationof the Clouds
Distances
Masses
59
61
63
64
iv

B. The _ICarinaeMolecularCloud
I. Identificationof the Cloud Complex
Mass
2. The _ICarinaeNebula and the
MolecularCloud
StellarWinds
Rocket Effect
3. StarFormationEfficiencyinthe
TICarinaeMolecularCloud
4. Summary
C. The Carina Arm in the Galaxy
D. Notes on Individual Clouds
65
65
68
69
74
77
79
86
87
90
VI. SUMMARY 108
REFERENCES 112
APPENDIX A: TELESCOPEPOINTING
A. Determination of Pointing Parameters
B. Pointing Accuracy
1. Shaft Encoders
2. Starpointing
3. Sunpointing
120
121
122
122
122
123

TABLE5 124
FIGURE CAPTIONS 131
FIGURE5 142
APPENDIX B: ADDITIONAL /,v AND b,v MAPS
1. /,v at each b; full resolution
2. b,v at each /; full resolution
3. /,v at each b; 0.5" 5uperbeam
4. b,v at each 1; 0.5" Superbeam
197
197
251
312
333
vi

ACKNOWLEDGEMENTS
Working with Patrick Thaddeus, my adviser,has been one of the
highlights of my graduate studies at Columbia University. His passion for
science coupled with his gift for recasting complex concepts in intuitive
terms made studying under him stimulating and rewarding. It is a pleasure
to thank him for his support, guidance, and encouragement during the years I
spent on the Southern Millimeter-Wave Telescope Project.
Richard Cohen, my co-adviser, deserves thanks for numerous reasons,
but two in particular. First, he is largely responsible for the success of the
Southern Millimeter-Wave Telescope. Without Richard's scientific and
technical know-how and direction, the Southern Telescope would still be a
pile of nuts, bolts, waveguides, and transistors in New York. Second, with
his special brand of intellectual challenge, he did much to help me steer
clear of sloppy thinking. I learned a great deal working with Richard, and I
am pleased to express my appreciation to him for sharing his talents.
Throughout all phases of my work on this thesis, from helping to build
and test the telescope in New York to analysis and interpretation of the data
after I returned from Chile, Tom Dame provided valuable advice and
assistance, as well as encouragement and friendship. For this -- and for his
good company on several long runs in Central Park -- I am grateful.
I would like to thank many other people, in both New York, at the
Goddard Institute for Space Studies and Columbia University, and in Chile,
for helping make this thesis possible. Sam Palmer and Dennis Mumma helped
construct the telescope and taught me how to trouble-shoot its electronics.
Dorn Peterson had an integral part in the receiver effort. Leo Bronfman
assembled the receiver and kept it running, and, as my fellow graduate
vii

studenton the project,was an importantpartnerand companion inall
aspectsof the work. Joe Montaniand Mustafa Koprucu helpedbuildthe
telescopeand,with the aidofJorge May, HectorAlvarez,and Monica Rubio
of theUniversityof Chile,kept itrunningsmoothly. Pat Osmer, as director
of CTIO,alongwith VictorBlanco,John Graham and the restof the
observatorystaffput many of the observatory'sfacilitiesat thedisposalof
the Columbia Millimeter-Wave Projectand provideda harmonious working
environmentforthe Columbia group. Iam alsovery appreciativeof Victor
and BettyBlancofor theirwarm hospitalityduringmy stay inChile.
Thanks alsogo to the (pastand present)facultyof the Astronomy
Department at Columbia University,Bruce Elmegreen inparticular,fortheir
interestand support,and to my fellowgraduatestudentsfortheir
friendship.At the Goddard Institutefor5pace Studies,Richard5tothers
providedseveralinformativediscussionsregardingclustersand the use of
the intialmass function.Allison5mlth aidedinthe reductionof the data,
and Ellin5arothelped ironout some kinksinthe manuscript.
Iam indebtedtomy entirefamily -- my parents,my brothersand
sistersand theirchildren,and my in-laws-- fortheirperpetuallove,
support,and encouragement throughoutthe many years that ledto this
thesis.Finally,my deepestaffectionand gratitudego to my son Jonah for
preventingme from growing oldover the lasttwo years,and to my wife
Becky forher tolerance,understanding,and unparalleledloveduringthe
entirecourse ofthiswork.
viii

I. INTRODUCTION
A spiral arm in Carina was first proposed by Bok in 1937, just fourteen
years after spiral nebulae were conclusively shown to be distant,
extragalactic stellar systems. Having noted stellar concentrations
elongated in the directions of Carina and Cygnus, Bok (1937) concluded his
monograph The Distmbution of Stars in Space:
The observer in the tropics should not find it difficult toaccept as a working model for our Milky Way one with a distant centrein Sagittarius and fn which a spiral arm passes from Carina throughthe Sun toward Cygnus.
Since then, the Carina arm has been firmly established in allspiral tracers
as one of the best-defined major spiralarm segments in the Galaxy.
Following the pioneering studies of localspiral structure in the Northern
Milky Way by Morgan, Sharpless, and Osterbrock (1952) and Morgan,
Whitford, and Code (1953), complementary studies were undertaken in the
Southern galactic plane. Itsoon became evident that the Carina region was
host not only to Bok's "elongated" grouping of stars,but also to a rich and
varied collection of Population Iobjects which appeared to be spread out
over considerable distances. Whether the observed relative paucity of
optical spiral tracers preceding (ingalactic longitude)the Carina
concentration was due to overlying extinctionor represented a true
boundary to the bright feature was not certain. By comparing the optical
data and radio continuum obseP_ations in the region,Sher (1965) argued that
the edge was real and showed that the 0 and B stars,Cepheids, young
clusters,and emission nebulae appeared to trace a spiral arm aligned nearly
parallelto the lineof sight in Carina. Bok, who from the beginning had held
thata major spiralfeatureexistedinCarina,deliveredadditionalstrong
supportfor5her'sinterpretation.From a comparison study of PopulationI
inCarinawhich made use ofa substantialamount of new data,includingthe
OB starsurveyof Graham and Lyng_ (1965) and the (thenunpublished)radio
recombinationlinesurveyofWilson,Bok eta1(1970) providedwhat has
become the canonicalpictureof the Carinaarm: the arm opens outward
startingfrom a point--2kpc from theSun near / = 295"; itisviewed
tangentiallyat / = 283", where itcrossesthe solarcircle,then extendsto
--I0 kpc from the Sun as itbends back toward higherlongitudes.The
evidencethatledtothispictureofthe arm isreviewed below. How the
Carinaarm connectedwith otherspiralarms on the othersldefo the
galacticcenter(1_e.,inthe firstquadrant)was (andremains)a matter of
some debate and it is a question which will be addressed in this thesis.
Part of the problem of connecting the Carina arm with the rest of the
Galaxy comes from the difficulty in interpreting the neutral hydrogen
observations in terms of large-scale galactic structure. The early 21-cm
pictures of spiral structure differed from the optically-determined local
picture, the neutral hydrogen suggesting nearly circular arms whlle the
optical tracers indicated high-pitched arms. Ir the young stars formed from
the H I, shouldn't both trace the same arms? Although part of this
discrepancy could be traced to the different types of distances used --
optical versus kinematic-- no directobservationallinkexistedbetween
the massive starsand the neutralhydrogen from which presumably they
formed.
With the adventof millimeter-wave astronomy inthe late1960's,it
soon became apparent that molecular gas -- H2 in particular -- was at least
as important a constituent of the interstellar medlum in the lnterior
2

regions of the Galaxy as H I,and the J = 1_0 rotational transition of CO
emerged as the best tracer of the abundant H2 molecule. The placental
material of massive stars was discovered: giant molecular clouds. As the
birth sites of 0 and early B stars and theiraccompanying H Ifregions (see
e.g.,Blitz 1978), giant molecular clouds might at last provide a physical
link between the distant but obscured radio arms and the localoptical arms.
The firstCO surveys of the inner Galaxy showed that H2 was concentrated in
a broad "ring"about the galactic center,but they did not reveal any apparent
large-scale spiral structure (Burton et aL I975; Scoville and Solomon
Ig75). However, these early surveys were severely undersampled, and
subsequent, well-sampled surveys in the firstgalactic quadrant offer a
more complete view of CO spiralstructure (Cohen eta/. Ig80; Dame Ig83;
Sanders et aL 1985).
Observed in CO, giant molecular clouds now appear to be superior to
neutral hydrogen as a tracer of large-scale spiralstructure. Like the H I,
they are easily observed throughout the galactic disk and, tn the firstand
second galactic quadrants, delineate the same arms (Cohen eta/. 1980). But
unlike the H I, the CO appears to exhibit high arm-interarm contrast (Dame
1983). It does not necessarily follow, however, that molecular clouds are
more concentrated in the arms than H I, since streaming motions of only a
few kilometers per second can mimic spiral arms in the data (Liszt and
Burton 1981 ). Using the Columbia CO survey of the first quadrant, Dame
( i 983) argued that molecular clouds are indeed more confined to the arms
by demonstrating that the CO and H i share the same large-scale kinematics,
and thereby ruling out differences in streaming motions as the cause of the
apparently higher arm-interarm contrast seen in CO than in H I.
3

The degree towhich molecularcloudsare themselves confinedto the
arms, atleastinthe regionof the "molecularring,"isstillcontroversial.
Recently,forexample,5olomon etal (1985) argued thattwo distinct
populationsof molecularclouds,representedby ~2000 warm and cold
"cores"identifiedbetween I = 20" and 50",existInthe Galaxy.They claim
thatthewarm cores appeartoresideinthe spiralarms, while the cold
cores,outnumberingthe warm :3to I,show a Kinematicdistribution
consistentwith no concentrationto the arms. Alternatively,Dame etaL
(1985),takingpartialinventoryof the most massive molecularcloudsinthe
firstquadrantand locatingthem inthe Galaxyby a varietyof techniques,
found thatsplralarms are well tracedby the largestclouds.The mass
spectrum of molecularcloudsintheGalaxy beingdominated by the largest
clouds(see e.g.,Dame 1983; Sanders etal 1985),the questionof
confinementofmolecularcloudstothe arms isbetteraddressed
consideringcloudsby mass ratherthanby number. Inthlsthesisthe
approachofDame etal.isused toshow thatintheCarinaarm, as inthe
flrstquadrant,the largestmolecularcloudsare good splral-armtracers,
and thatjustoutsidethe Carlnaarm, the totalmass ofmolecular gas Is
relativelysmall.
A significantcharacteristicof theCarlnaregion,recognizedsincethe
earlieststudiesof the Carinaarm, IsItshlghopticaltransparency.Some
starsand opticalH IIregionscan be seen to distancesgreaterthan 10 kpc.
SeveralradioH IIregionshave distancesspanningthe same range,many of
them the radiocounterpartsof the opticalH IIregions.The Carinaarm
providesa rareexample IntI_eGalaxy ofa spiralarm which isdelineated
overmany kiloparsecsInalltheclassicradioand opticaltracers,and so
providesan opportunitytocompare the classicopticalspiral-armtracers
4

and their parent molecular clouds over the same large distance. Based on
the flrst well-sampled CO survey in the Carlna arm, this thesis offers an
initial contribution to such a comparison. To I_]ace the observations
presented here in the context of the known structure of the Carina arm, the
following brief review of previous observations of that region is given.
A. The Carina Arm: A Brief Review
1. Optical Studies
5tudles of OB stars in Carlna have been made by several authors, among
them Bok and van Wljk (1952), Graham and Lyng_ (1965), and Feinstein
(1969), whose main results are worth discussing briefly.
Based on the observations of Bok and van Wljk, Bok (1956) pointed out
the large concentration of OB stars in Carina from distances of _"1.5 to
4 kpc, and, expanding on his 1937 study of the region, suggested we were
viewing a spiral arm orlented roughly along the line of sight. Bok also noted
that throughout the reglon the optlcal extinction was generally low and that
there was an apparent edge to the stellar distrlbutlon at / _- 283".
Felnsteln obtained UBV photometry for 135 OB stars with known spectral
types In the region and found they extended at least to 6 kpc but no closer
than 1.6 kpc. Using the objective prism survey of Graham and Lyng§ of 436
OB stars, Graham (1970) determined that the stars span distances of 2 to
I0 kpc between / ; 282" and 292". He found the dlstribution to have a sharp
boundary that became more distant with longitude. Arguing that this
apparent boundary represented a true edge In the OB star distribution,
Graham proposed that we were seeing the outer edge of the Carina arm and
5

locatedthe tangentdirectionat I _ 285". Inaddition,he pointedout that
the starswere found primarilyatnegativelatitudes,with a z-displacement
thatincreasedwith distance.
A statisticalstudy of southernOB starsby Lyng_ (I970) ledtothe
identificationofeightOB concentrationsbetween / = 284" and 330 °,fiveof
them intheCarinaregion.5ome are galacticclusters,while othersare OB
associationswithin_3.5 kpc (Humphreys i972;i978). Young clustersinthe
Carinaregionshow a wide range of distances,and theirdistributiontraces
a spiralarm ingood agreement with thattracedby the individualOB stars
(Vogt and Moffat 1975b and referencestherein).
The listof stellarspiraltracersinCarinaalsoincludesyoung
Cepheids,observed to I0 kpc (Fernie1968;Tammann 1970),and supergiants
of allspectraltypes(Humphreys 1970). Based on the Schmidt rotation
curve,Humphreys (1970) found evidenceamong the supergiantsfor
noncircularmotions which variedsystematicallywithin the longituderange
280" to300". Since the supergiantsfitthesame spatialdistributionas tt_e
othertracers,Humphreys interpretedthe negativevelocityresiduals(/_e.,
with galacticrotationInthe fourthquadrant)between I - 280" and 292"
and the positiveresiduals(againstgalacticrotation)between I - 292" and
300" as streaming motions alongthe outerand inneredges of the arm.
Three propertiesof the stellardistributionsthatledinvestigatorsto
suggesta lengthwisespiralarm inCarinawere therichnessof thestellar
content(particularlytheOB stars),the greatdistancespresentinthe
narrow longituderange,and theratherabruptappearanceof the
concentration,beginningat I_-283". These same propertieswere evident
intheHc_surveysof Hofflelt(1953),Gum (1955),and Rodgers,Campbell,
and WhiteoaI<(1960, hereafterRCW), althoughdistancestoeach emission
6

region were not initially available. Particularly noticable in the RCW atlas
(Rodgers, Campbell, Whlteoak, Baily, and Hunt l g60) is the relatively low Ho<
intensity preceeding the large array of emission regions which sets in near
the OB star edge. The entire region between / = 283" and 297" is rich in
H_, as a glance at the RCW atlas demonstrates. Further evidence that the
edge near 283" marked the tangent direction of the Carina arm was provided
by the radio continuum observations, as described below. Some of the
brighter nebulae in the Carina region include RCW 53 (11 Carinae Nebula),
RCW 54, RCW 57 (NGC 3576 and NGC 3603), and RCW 62 (IC 2944).
Interferometric studies In H_ by Georgelln and Georgelln (1970a; 1970b)
yielded kinematic distances to enough H I I regions to trace the Carina arm
to _-8 kpc near ! = 290". A similar Investigation by Blgay eta/.(1972)
showed the H I I regions near / = 282" to lie between 2.5 and 5 kpc,
straddling the solar circle in that direction. Many of the H_ regions
Included in early catalogs were subsequently detected in radio
recombination lines, and the wide range of observed velocities implied that
the optical regions were spread out over considerable distances.
The large number of optical objects seen to such great distances in the
narrow longitude range of the Carina arm implies generally low optical
extinction. Indeed, this well-known characteristic of the Carina region
motivated some of the optical studies. With data available on Cepheids,
5her ( i 965) indicated that visual absorption was less than one magnitude
per kiloparsec out to ~5 kpc. Bok etal.(1970) estimated 0.5 magnitudes per
ki!oparsec between / = 282" and 305" to comparable distances, and more
recent studies of the large-scale distribution of interstellar extinction
(Sundman 1979; Loden and 5undman 1980; Neckel and Klare 1980) also noted
the high transparency of the Carina region.
2. Radlo Continuum
Mills (1959) suggested that steps in the radio continuum along the
galactic plane were due to lines of slght along tangent directions to spiral
arms, notlng one such a step (among others) at / = 281" In the 85.5 MHz
survey of Hl ll et el. (1958). 5her (1965) emphasized the coincidence of the
trough in the 1.4 GHz continuum map of Mathewson, Healy and Rome ( 1962a,
hereafter MHR) with the low HcxIntensity Just ahead of the bright edge of
the Carina concentration in the RCW atlas. 5her reasoned that the optically
dark region truly lacked Population I materlal since optical absorption
cannot be responsible for a radio continuum dip. The coincidence of the
sudden jump In the continuum at ! = 283" with the onset of the optical
Population I concentration then led to the conclusion that this longitude
marked the outer edge of the Carina arm.
In the MHR survey, which had a spatial resolution of 50', fourteen
discrete sources were Identified between I = 280" and 300"; between 270"
and 280" only two sources were found. Based on their spectral indices
(determined by comparison with the 85.5 MHz survey of Hill et el.) eight of
the fourteen sources were classified as thermal and two as nonthermal
(Mathewson, Healy and Rome1962b). 5urveys with higher spatial resolution
were carried out at 2650 MHz (Thomas and Day 1969), at 5000 MHz (Goss
and 5hayer 1970), and at 408 MHz (Shaver and Goss 1970a), all aimed at
observing previously identified sources. The spatial resolution of the
2650 MHz survey was 8.2'; the other two surveys had resolutions of 4' and 3'.
At 2650 MHz, 40 sources were found between ! = 289" and 300", six of them
identified (some tentatively) with MHR, Hill etaL, or RCW sources. At
8

408 MHz, 37 sources between I = 280" and 300" were found ( versus 29 at
5000 MHz); of these, 28 were observed at both frequencies. Where
determinations could be made, 15 sources were classified as thermal and
eight nonthermal (:Shaver and Goss 1970b). More recently, Haynes eta/.
(1978) carried out a high-sensitivity survey at 5 GHz with a 4' beam, flndlng
104 sources between I = 280" and 300" (Haynes et al 1979). A prominent
characteristic of the continuum maps of all these surveys is the clustering
of strong sources between / = 282" and 292".
In addition to these continuum surveys, hlgh resolution studies of
individual sources in the arm have also been made, Including 50" resolution
observations of NGC3576 and NGC 3603 (Retallack and Goss 1980) and the
TI Carina Nebula (Retallack 1983). These measurements wlll be considered
in Chapter V, where the molecular clouds associated with these objects are
discussed.
3. Radlo Recombination Line $tudles
The most comprehensive study of radlo recombination llnes In the
Southern Milky Way was by Wlison eta/(1970), In H109o_ Between
/ = 282" and 300" 24 sources were found, nine of them belonging to the
Carina Nebula. Less extensive observations have been made in the following
lines: H126o( and H127o( (McGee and Gardner 1968), Hel09o( and C109o(
(Mezger eta/. 1970), HlO9o((Caswell 1972), H90o(, He90o(, H137_, and
H 128_J (McGee et al 1975), and H76o_and He76(x (McGee and Newton i 981 ).
None of these found any additional sources in the Carina arm. The
significant result of all these studies (Wilson eta/., in particular) is that
within I = 280" and 300" the wide range of velocities observed implies a
9
wide rangeofkinematicdistances.As alreadynoted,the radioH Ifregions
painta pictureof the Carinaarm incomplete accord with the optical
picture.
The i1 CarinaeNebula has been the subjectof a number of
recombinationlineinvestigations;thesewillbe mentioned inChapter V ina
detaileddiscussionof the giantmolecularcloudassociatedwith thlsvery
brightH Ifregion.
4. HI Studies
An arm-likeconcentrationofH IinCarinawas evidentinthe earliest
21-cm surveysof the SouthernMilkyWay (see e.g.,Kerr eta/.1957 and Oort
etaL 1958).Taken together,Northernand Southernsurveyssuggestedthe
H IinCarinapassed throughtheSun toward Cygnus (althoughone might
interpretthe early21-cm plane-of-the-Galaxymaps as havingallthe
"arms"passingthroughthe Sun). Bok (Ig5g} quicklyrecognizedthe good
agreement ofthe neutralhydrogenresultswith thedistributionof OB stars,
H Ifregions,and Cepheids,and againargued fora Carina-Cygnusarm. A
generalpropertyof theH I inthe SouthernGalaxytoemerge from the first
21-cm studieswas an apparentwarping of the H Iplaneto negative
latitudes,which increasedwith distancefrom the galacticcenter.(Graham
[I970] found a similartrend IntheOB starsand pointedout the agreement
with theH Iresults.)Inlaterattempts to deduce the overallspiral
structureof theGalaxy from 21-cm observations,considerable
disagreementhas arisenon how toconnectthe Carinawith the Northern
spiralarms. For example,Kerr(Ig70) maintainedthatthe arms were nearly
circularand thatCarinaconnectedwith Cygnus throughthe Sun -- the
I0
picture Bok favored. Weaver (1970), on the other hand, proposed higher-
pitched arms, Joining Carlna and 5aglttarlus In a single arm. (A revlew of
the arguments for both alternatives carl be found in 51monson [1970]).
Recently, Henderson et a/.(1982) indicated that the Carina arm extends to
longitudes below 280" beyond the solar circle, which, If true, makes the
Carlna-Saglttarlus connection unlikely.
Aside from the question of how to match the north and south, all
21-cm studies conflrm three properltles of the H I distribution In the
5outhern Galaxy: the downward warping of the galactic H I plane, the
widening of the H I layer with galactocentrlc distance, and the persistence
of the Carlna arm to distances of --20 kpc. The Carlna arm ls unquestionably
a major spiral feature. In Chapter IV the 21-cm picture of the Carlna arm ls
examined in more detail and the question of its place in the Galaxy will be
considered in light of a comparison of the H I and the CO.
5. Molecular Line Observations
Molecular absorption-line surveys of the 5outhern Galaxy were carried
out in the 1667 MHz line of OH (Caswell and Robinson 1974) and in the
4830 MHz llne of i-12C0 (Whiteoak and Gardner 1970; 1974). The
observations, taken toward known continuum sources, detected lines over a
wide range of velocities in Carina, which, like the recombination line
measurements, Imply a wlde range of distances. The same conclusion can be
drawn from the 1662 and 1665 MHz OH emission-line observations of
Manchester et eL (1970). These studies provided the first indications that
molecular material flts the same pattern as the other spiral tracers in the
Carina arm.
11

Other molecules detected in the arm include NH3, H20, HCN, HCO, HCO+,
and CO(Whiteoak 1983 and references therein). Nine H20 masers, all
associated with known H II regions in the CaMna arm, have been discovered
between / = 284" and 300" (Scalise and Schal] 1977; Kaufmann etel. 1977;
Scalise and Braz 1980; Batchelor eteL 1980; Braz and Scalise 1982).
The first CO survey in the :Southern Galaxy was made in the J = 1--*0
line by Gil]ispie ere�. (1977). Five detections were made between / = 284"
and 300" in the direction of well-known H II regions, including the CaMna
Nebula, NGC 3576, and NGC 3603. Subsequently, the Carina nebula was
observed in the 2_1 transition of CO by de Graauw et eL (1981 ), who mapped
a small portion of the region. Further observations in the 241 line toward
individual sources were also made by White and Phillips (1983). In the
J = I-_0 COsurvey at b -- O" made with the 4 m telescope at CSIRO
(McCutcheon et el. 1982; Robinson et el. 1983) the distant portions of the
Carina arm were barely detected, because this part of the arm lies almost
entirely below the plane (see Chapter IV); the tangent region, lying beyond
the low-longitude boundary (294") of this survey, was completely missed. A
J = 2_1 survey by Israel etaL(1984) covered / = 270" to 355" at b = 0", but
again, owing to the survey's sparse sampling, restricted latitude coverage,
and low sensitivity, the Carina arm went largely undetected.
12

B. Present Work
This thesis reports the results of the first well-sampled, large-scale
CO (J = 1--_0) survey of molecular clouds In the Carlna arm. The survey was
made with the Columbia 1.2 m millimeter-wave telescope at Cerro Tololo,
Chile. Prior to carrying out the observations presented here, I participated
inthe constructionand testingof the instrumentinNew York Cityand its
subsequent installationat CerroTololo.Being a closecopy ofthe Columbia
millimeter-wave telescopeinNew YorkCity,the Chiletelescopenot only
Incorporateda proven design,but alsoofferedthe added benefitthatnew
SouthernCO surveysand previouslycompletedNorthernCO surveys(made
with the New York telescope)couldDe Joinedtogetherwlth almost none of
the calibration problems that have traditionally plagued the North-South
matching of galactic surveys made with different Instruments. Since the
largest molecular clouds In the first and second quadrants have proven to be
excellent spiral tracers (Dame et el. 1985), one would hope that a survey of
these objects In the Carina arm would provide an answer to the question of
the Carina arm's connection with the Northern arms as seen in CO. It does.
The first results of thls survey of the Carina arm were reported by Cohen et
el. (1985a). In that paper, we showed that the arm ls traced exceptionally
well over 25 kpc by the molecular clouds and that the Carlna arm apparently
joins the 5agittarlus arm, as defined by molecular clouds Identified In the
Columbia CO survey of the flrst quadrant (Dame et aL 1985). This thesis
presents the observations and analysis that led to these conclusions.
In the Chapter II the telescope and observing techniques are described,
and in Chapter III the observations of the Carlna region are presented in
various forms and some of the reduction techniques are described.
13

Chapter IV focuseson the large-scalecharacteristicsof the arm, including
a discussionofthe z-distributionofthe molecularlayerand a comparison
of theCO and theH I.InChapterV the individualgiantmolecularcloudsare
identifiedand cataloged,with specialattentiongiven tothe cloud
associatedwith the _ICarinaeNebula;the cloudsare used to tracethe arm
over25 kpc and compared with cloudsfound inthe firstand second
quadrantstodeterminehow the Carinaarm connects with the restof the
Galaxy.Chapter VIpresentsa summary of the results.
14

II. INSTRUMENTATION AND OBSERVING TECHNIQUES
The observations described here were carried out at the Cerro TO]GIG
Inter-American Observatory (CTIO) In Chile wlth the Columbia millimeter-
wave telescope (hereafter the Southern Millimeter-Wave Telescope, or Just
the Southern Telescope), a close copy of the Columbla millimeter-wave
telescope In New York Clty (the Northern Millimeter-Wave Telescope, or the
Northern Telescope). Prior to installation at CTIO, the telescope was
thoroughly tested In New York City on the roof of the Ooddard Institute for
Space Studies (GISS). In 1982 November it was dismantled and shipped to
Cerro Tololo where it arrived near the end of 1982 December; by the
beginning of 1983 January the Southern Millimeter-Wave Telescope was in
full operation. The first part of this chapter presents a description of the
instrument, and the second part a discussion of the calibration and
observing techniques.
A. Instrumentation
The telescope consists of flve principalcomponents: i) the antenna;
2) the mount and drive system; 3) the receiver; 4) the spectrometer; and
5) the computer system. Each of these isbriefly described. My primary
responsibilityhaving been the mount and drive and the computer system,
these sections will be emphasized. Results of the pointing tests are
presented in Appendix A; a more detaileddescription of the antenna and the
receiver can be found InBronfman (I985). See the theses of R.Cohen (1977)
and G. Chin (1977) and Cohen eta/. (1985b) for details regarding the
15

pointingand computer system of the NorthernMillimeter-Wave Telescope
thatare relevanttothe 5outhernMillimeter-Wave Telescope.
I. Antenna
The antenna is a Cassegraln system consisting of a 1.2 meter parabolic
primary reflector (f/D=0.375) and a 17.8 cm hyperbolic secondary reflector.
The effective focal ratio of the primary plus the secondary is 3.79. The
primary was manufactured by Philco Ford with a measured RM$ surface
accuracy of 36 microns, but was subsequently resurfaced to an RM$
accuracy of --6 mlcrons as a prototype for a balloon-borne telescope for
continuum observations in the far Infrared. Deformation of the primary
under gravitational stress contributes at most an additional 6 microns (Chin
1977), giving a total surface accuracy of 12 microns, corresponding to
~X/200 at 2.6 mm, about four tlmes the usual criterion for a diffraction
limited system.
To check that the primary, secondary, and horn were all properly
aligned and that the antenna was diffraction limited as claimed, the antenna
pattern was measured following the general procedure described by Cohen
(1977). With a 115 GHz transmitter located atop Cerro Morado, a mountain a
few kilometers from Cerro Tololo, the antenna pattern was mapped by
scanning across the transmitter in azimuth and elevation. The full width at
the half-power points (FWHM) of the beam was found to be 8.8', and
comparison of the measured pattern and the pattern calculated from scalar
diffraction theory showed good agreement (Bronfman 1985), assuring the
system was diffraction limited.
16

2. Mount and Drive System
Built by the machine shop of the Columbia University Phyics
Department, the altitude-azimuth mount of the telescope (Fig. II-1) Is
almost Identical to the New York telescope's mount, except for a sllghtly
larger housing for the azimuth section (allowing easy access for
maintenance). Each axis is equipped with a direct-drive torque motor, a
tachometer generator, and a 16-bit optical shaft encoder. The computer
reads the position and velocity of each axis l OO times per second and Issues
torque commands to the motors based on the commanded position and an
approximate solution to the telescope's equation of motion. The telescope
is made to track by converting source right ascension and decltnatlon to
altitude and azimuth five times per second. Data taken when pointing errors
exceed about one arcminute are automatically discarded. The telescope's
light weight allowed it to change position by as much a l 0" in about one
second, so position-switching (used for the observations presented in this
thesis) can be carried out quickly and efficiently. The entire telescope
system is housed under a 16-foot dome in a small building at the summit of
Cerro Tolo]o, A 5-foot wide sllt In the dome for observing is covered wlth a
low-loss (_0. I 5 dB) plastic fabric called Grifolin that mechanically
protects the telescope from the wind andallows a nearly constant
temperature to be maintained inside. The azimuth tracking of the dome is
control led by the computer.
A stringent check of the telescope pointing is achieved with a small
optical telescope coallgned with the radio axls of the primary. Startlng
with approximate pointing parameters (see Appendix A), the radio center _;f
i7

the Sun is located automatically by determining the symmetry points of
azimuth and elevation scans across its limb. The optical and radio axes are
then collimated to w.lthln --0.25' by tracking the Sun's radio center and
mechanically adjusting the optical telescope until the Sun's optical image is
centered In the reticle. Finally, the positions of about 40 stars, well
distributed across the sky, are checked with the optical telescope, and an
analysis of the pointing errors yields improved pointing parameters.
From this "starpointing" procedure, which included no corrections for
possible nonperpendicularity of the altitude and azimuth axes or the
altitude and radio axes, peak and RM$ polntlng errors of 0.5' and 0.2' were
found. Inclusion of nonperpendlcularlty corrections produced negligible
Improvements In the pointing accuracy so such corrections were omitted.
Subsequent periodic starpolntings showed a gradual deterloratlon of the
pointing accuracy due to a slow drift of the azimuth axls with respect to
the vertical. When the RM5 error exceeded about one arcmlnute, new
pointing parameters were determined and the accuracy restored.
As a daily check on the pointing, the radio positlon of the Sun was
monitored by scanning across lts limb, as described above. Using the
pointing parameters from the starpointlng procedure, an offset of about one
arcmlnute was found between the expected and observed positions of the
Sun. The source of thls discrepancy was never completely determined, but
being less than 1/8 of a beam it did not pose a serious problem.
At the beginning of each observing session, a spectrum was obtained
at the peak position of Orion A. The good day-to-day agreement of these
spectra (see Section B below) provided a further check on the pointing (as
well as a check on other components of the system).
I8

Detailsofthe pointingmodel can be found inthe thesisof R.Cohen
(1977);Itsapplicationtothe 5outhernMllllmeter-Wave Telescopeand a
summary of theresultsare givenhere Inthe Appendix A.
3. Receiver
A doublesidebandreceiver,based on a very stableliquidnitrogen
cooled(77 K) 5chottkybarrierdiode mixer,was used todetectthe Incoming
(RF)signal.Inthe firststage,the RF signalcollectedat a scalarfeedhorn
and the localoscillator(LO)signalIntroducedby means of a resonantring
injectioncavityaremixed to producea firstintermediatefrequency(IF)
signalof 1390 MHz. The LO signalIsthefrequency-doubledoutputof a 57
GHz klystronthatisphase-lockedtoa computer-controlledfrequency
synthesizer.By settingthesythesizerfrequency,the LO istuned to correct
forthe Dopplershiftof theCO linedue to the earth'smotion wlth respectto
the localstandardof rest.The firstIFsignalpasses throughan impedance-
matching transformerand isamplifiedby a low-noise(22 K)FET amplifier
with 30 dB ofgain. Exceptforthe feedhorn,allthe components inthe first
stageare maintainedat 77 K by liquidnitrogenina vacuum dewar. Inthe
second stage,the firstIFsignalisfurtheramplified,then down-converted
toa second intermediatefrequencycentered 150 MHz, and,after
amplification,the second IFsignalissentto the spectrometer.The single
sidebandnoise temperaturemeasured atthe feedhorn is~385 K.
For furtherdetailson thereceiver,see the thesisof L.Bronfman
(1985).
19

4. 5pectrometer
The filterbank spectrometer (or "backend"),builtat G155 from the
NRAO design (Mauzy 1974), has 256 channels, each with spectral resolution
of 0.5 MHz (1.3km s-i at 115 GHz), for a total bandwidth of 330 km s-i. The
150 MHz signal from the receiver enters the IF section of the backend where
it is divided intosixteen 8 MHz wide bands, each centered on 8 MHz. Each of
these signals is routed to one of sixteen identicalfilterboards; on each
filterboard,sixteen contiguous 0.5 MHz filtersfollowed by square-law
detectors yield the power spectrum of the input signal to the board. In the
next stage, 256 integrators on sixteen identicalintegrator boards integrate
the output of each detector for 48 milliseconds. A 5-millisecond hold
period follows during which each integratoroutput is read, digitized,and
sent to the computer where it is added to the sum of allprevious cycles for
that channel. The integrators are then reset Inpreparation for the next
integrationcycle.
During the course of post-observation data reduction itwas discovered
that a weak (_ l q) raise signal persisted In three channels, even In absence
of any real emission. The problem could be traced to a 5 -10% deviation
from square-law behavior of the detectors in these channels. At a given
source position, the final spectrum is the difference between a spectrum
taken on-source and a spectrum taken off-source (with the baseline
determined from a straight-line fit; see 5ectlon I I.B below); it can be shown
that, in the difference spectrum, the deviations from square-law behavior
lead to residual signal levels which are 3 - 6% above the level in the
remaining good (baseline) channels. These residuals account for the
2O

measured falsesignals.Inthe few dataprocessingprocedureswhere this
problem became noticable,e.g.,the summing togetherofseveralspectra
channel-by-channel(anoperationthatledto thediscoveryof the bad
channels),the bad channelswere replacedwith an interpolationusingtheir
neighboring,good channels.Aside from these cases,the bad channels
produced no effectgreaterthan thenoise,so the problem was generally
ignorable.(The bad channelshave sincebeen corrected.)
5. Computer System
The computer system, builtarounda Data GeneralNova 4/X
minicomputer with 128 K bytes ofmemory, controlsthe telescopepointing,
data acquisition,and synthesizerfrequencysetting.On-linedataprocessing
and a moderate amount of programming may be done by the observerwhile
the computer carriesout the primary telescope-controltasks.
FigureII-2shows a blockdiagram ofthe overallsystem. A crystal
oscillatorgeneratesan Interruptevery0.01siderealsecond;alltime-
keepingtasks are performed and thenthetelescopepointingprograms are
executed.The computer interfacewith the telescopedriveelectronics
receivestelescope(anddome) positionand velocityinformationand sends
torquecommands, effectlngthepointing(seeSection:2above).A
microcomputer-controlledreferencegenerator(notshown inFig.II-2)
issuesthe "Integrate-hold-reset"commands to thespectrometer's
integrators.The "_^_",,v,_command causesa ,_vvo"....interrupt,initiatingthe
readoutof the integratorsvia theNova/spectrometerinterface.The Nova is
interfacedwlth an IEEE-488 GeneralPurposeInterfaceBus (GPIB)for
21
communication with the frequency synthesizer (and other IEEE-488
programmable devices).
Data storage facilitiesconsist of a CDC 9427H moving head disk drive,
with a 5 megabyte fixed disk and a 5 megabyte removable disk cartridge,
and Cypher F IO0 dual density (800/1600 bits per inch) tape drive. After
each observation iscompleted, the data are transferred from a buffer In the
computer to the dlsk cartridge,along with an information header (position,
synthesizer frequency, date, etc.).Each cartrldge can hold about 2000
scans. A variety of telescope system and Data General system (RD05)
programs are stored on the fixed disk. Data are transferred daily and
weekly to tapes both for backup and for transport from the telescope to New
York, where full-scale processing ls carried out.
Operator Interaction wlth the system Is through a Hewlett-Packard
2623A Graphics Terminal. In addition to commanding the source
coordinates, the observer may dlsplay and manipulate both completed and
in-progress observations. Hard copies of graphics data may be obtained
from a built-In printer In the graphics terminal, and text may be output to a
dot matrix printer used to malntaln an automatic log of each observation. A
TV monltor, updated every second, displays the status of the system.
A second Nova 4/X computer ls available both as a backup and for
program development and data analysis without Interruption to the
telescope operations. A spare dlsk drive, tape drive, graphics terminal, and
a graphics printer are included.
The telescope operating system consists of a collection of elementary
("low-level") routines written in Data General assembler, and a collection of
complex ("high-lever'), interactive programs written in a language, similar
to FORTH, called the Dictionary. The low-level routines, always compiled in
22

the computer memory, carry out the telescope-control tasks and provide the
rudiments of the Dictionary in the form or approximately 270 permanent
"words" (subroutines) that can be commanded from the keyboard or from
other programs. The permanent words make the low-level telescope-control
routines accessible to the operator, provide a library of mathematical
functions, and allow the programmer to extend the Dictionary by "defining"
new words in terms of permanent and previously defined words. The
extended Dictionary code resides on the fixed disk, although during normal
operation part of it is compiled in the computer memory. Other programs
are compiled only at execution time and are subsequently discarded from
memory. The complete operating system, including the low-level routines
and about 1000 permanent and deflned Dictionary words, occuples about 90%
of the available memory. With the remaining 10% users may create
programs for special purposes.
Some of the hardware differences between the Northern and Southern
Millimeter-Wave Telescopes required modifications to the operating
system, the most complicated of these software changes being the
implementation or frequency-switching In the Southern Telescope. In the
Northern Telescope, frequency-switching was achieved by alternating
between two oscillators (with distinct frequencies) in the LO circuitry of
the receiver, the alternation being synchronized with the start of each data
acquisition cycle of the backend. The computer kept track of the switching
phase, but had no control over which oscillator was active. In the Southern
Telescope, a new scheme for frequency-swltching was used in whlch the LO
circuit had only one oscillator In place of these two, and the computer set
the switching phase and frequency of the LO signal through the
programmable frequency synthesizer. To effect this scheme, I developed
23

assembly-level and high-level routines that controlled the synthesizer. The
interrupt-servicing program was modified to allow a frequency-command
routine to be placed in a queue (with other routines) upon completion of the
dMve interrupt routine (similarly queued-up routines calulate and command
torques, recompute telescope pointing coordinates, and process backend
data; the order in which they are executed depends on their preassigned
priority). The final program gave the observer the MexJbJlJty to choose the
frequency difference and the switching rate.
Various other minor differences between the Northern and 5outhern
Telescopes required a number of less major modJMcatJons to the operating
system. For example, a larger calibration chopper wheel on the 5outhern
Telescope required more time to go from rest to its uniform rotation rate
than did the chopper on the Northern Telescope, and a time delay had to be
added Jn the program that processed calibration data from the backend.
B. Calibrationand ObservingTechniques
Weather conditions at Cerro Tololo are extremely favorable for year-
round observations at millimeter wavelengths and only few a days of
operation were lost because of rain or snow between 1983 January and
August. (Year-round, round-the-clock observing posed a challenge to
keeping the telescope system maintenance-free, but very little observing
time was lost to technical problems.) The approximately 7000 spectra on
which this thesis is based were collected in less than one year.
The receiver was calibrated using the standard chopper wheel
technique discussed by Penzias and Burrus (1973), with refinements
suggested by Davis and Vanden Bout (1973) and Kutner (1978). In the
24
original method the measured difference between a room-temperature
blackbody and the sky produces a calibration signal that, assuming the
ambient and atmospheric temperatures to be equal, depends on atmospheric
attenuation in the same way as does the measured spectral line signal. The
ratio of the measured line signal to the calibration signal then yields a line
temperature that is Independent of the atmospheric attenuation. The
calibration signal is obtained by pointing at the sky while rotating a two-
bladed chopper wheel across the feed horn and subtracting the sky signal
(clear horn) from the absorber signal (blocked horn).
Two refinements, suggested by Davis and Vanden Bout (]978), were
made to the original procedure. The first ls a correction applicable to
double sideband receivers. If the atmospheric opacity is different in the
two sidebands, the total calibration signal will be the sum of two terms
with differing amounts of attenuation, while the observed spectral line will
be affected only by the attenuation in one of the sidebands. In this case, the
ratio of line signal to total calibration signal will give the wrong result.
(Another potential source of error is unequal gains in the two stdebands, but
because laboratory measurements of the receiver on the Northern
Millimeter-Wave Telescope indicated very nearly equal gains in each
stdeband [Cohen et aL, 1985b], and since the present receiver and the
Northern Telescope's receiver have slml]ar electronics In the signal path, It
was assumed that the gains in the two sidebands of the present receiver
were equal.) The second refinement takes into account the difference
between the atmospheric and the amblent temperatures, the atmospheric
temperaturebeing generallylower. The effectof thistemperature
differenceon the originalmethod isto increasethe calibrationsignal,
leadingtoa derivedlinetemperaturebelow itstruevalue.Both corrections
25

are elevation dependent and require knowledge ofthe atmospheric opacity
as a functionof frequency.
Ina thirdrefinement,the primarysources ofatmospheric attenuation
inthe millimeterregion,molecularoxygen and water vapor,are treatedina
two-layeratmosphericmodel, followingKutner (1978).The upper,oxygen
layeriswell mixed throughouttheatmosphere and has a largescaleheight;
itstemperatureand opacity,stableover longtime scales,are taken tobe
constantInthe model. The water vapor layerisclose tothe ground,and its
temperatureand opacitycan change significantlyina matter ofhours or
minutes. The opacityand effectivetemperatureof the water are
determinedby antennatipping-- measuring the sky brightnessas function
of elevation-- and fittingthedata with the two-layer model.
With allthreerefinementstothe originalmethod, the finalcalibration
signalfor a givensource isa functionof: I) the measured calibration
voltage;2) the sourceelevation;3) the ratioof gains inthe two sidebands,
assumed forthe presentreceiverto be unity;4) the 02 layertemperature
and opacityinboth sidebands("s"forsignaland "i"for image),calculatedto
be: Tos = 255 K,T_ = 254 K,i;os= 0.2i,and _(_ = O.iO; 5) the H20
layertemperatureand opacity,determined from an antennatipping;and
6) Tit, the forward beam filling factor for the source, equal to the main
beam efficiency, TI, for a source that Just fills the maln beam. Uslng the
same chopper wheel method for the Northern Millimeter-Wave Telescope,
Cohen eta/(1985b) estimate the calibration is accurate to wlthln 15_. In
daily observations with the Southern Millimeter-Wave Telescope of the peak
position In Orion A, the peak temperature varied typically by 3% with a
maximum deviation of 12_; typical variation of the integrated temperature
was 3_ with a 15_ maximum deviation.
26

All line intensitiesreported in thisthesis are antenna temperatures
corrected for atmospheric attenuation and main beam efficiency,and are
equal to the radiation temperature, T_', for a source that just fillsthe main
beam. The main beam efficiency,11,having not been measured directly,was
inferred by scaling the data for a number of standard sources to the results
from the Northern Millimeter-Wave Telescope for the same sources. The
antenna temperatures (corrected for atmospheric attenuation),TA" ,of the
sources measured at the Southern Telescope were found to be about 17%
higher than those measured at the Northern Telescope, a result primarily
reflecting the slightlydifferent optics (and efflciencles)of the two
antennas, and a small error in the calculated oxygen opacities (and thus the
calibrated antenna temperatures) at the Northern Telescope (Dame, private
communication). Since T R" = TA'IT [ (fora source fillingthe main beam), and
the calculated main beam efficiency of the Northern Telescopels 0.81 (Cohen
et el. 1985b), then the requirement that TR'(Southern) = TR'(Northern)
implies that Tl = 0.95 for the Southern Telescope. This efficiency for the
Southern telescope, implied by the scaling,could be about I0_ too high due
to the oxygen opacity error just noted.
The temperature scale of the Northern MlllImeter-Wave Telescope
compared with that of the Bell Labs 7 m telescope is within 17_ for
individualmolecular clouds and within I0_ for totalgalactic plane
emission; comparison with the NRAO 11 m telescope gives 8_ for individual
clouds and 26_ for totalgalactic plane emission (Cohen et eL 1985b). The
two types of comparisons, using either individualmolecular clouds or
galactic plane emission, give different results because of the different
efficlencies with which these sources couple wlth the beam.
27

The 5outhernMilkyWay passes highoverhead at Cerro Tololo,and the
observationsreportedherewere allmade at elevationsbetween 45" and
70", and usually above 55". At the start of every observation a 5 second
calibration scan, at the same elevation as the source, was made in order to
determine a calibration signal for that observation. Antenna tippings were
done at the beginning of each observing session (about every eight hours).
The optical depth of the water vapor per air mass seldom exceeded O.12, and
during the dry winter months was often half this value.
Position-switching was used to remove instrumental contributions to
the spectrum, and yielded very flat baselines (Flg. II I-1). In thls standard
method of observing, a comparison spectrum of a positlon free or co
emission (OFF)is subtracted from the spectrum of the source (ON). For a
given observation, the telescope alternates, every 15 seconds, between the
ONand the OFF,the computer separately recording the spectrum at each
position. The final spectrum, the difference of the two, is formed at the end
of the observation. Since the sky contribution to the total power is
elevation dependent, It is important that the ms and oFFsbe at nearly equal
elevations. For this purpose, I developed a program that displayed
graphically, for a glven oNat any time, all oFFswithin some radius (usually
10") of the oN. The choice to observe the o_ (at a speclflc time) was then
based on finding an OFFwithin some acceptable elevation range. Using this
program, several hours of observations could be scheduled in a few minutes.
The results were m-OFFelevation differences of typically 0.2", and
extremely flat baselines. Reference positions, checked by position-
switching against one another, were verified to be emission-free to about
0.07 K, or half the tyical RM5 noise of the survey. Table I1-I lists the
reference positions used in this survey.
28

The receiver was tuned so that 0 km s-1 (with respect to the local
standard of rest) corresponded to the center of the spectrometer. All
positions were observed typically for five minutes, yieldlng an RMS noise
per channel of about O. 14 K. To determine the baseline of each spectrum, a
straight line was subtracted from it; the straight line was the least-
squares fit to the emission-free ends (usually the first and last 40
channels) of the spectrum. Any spectrum that, after this procedure,
exhibited baseline curvature greater than 1 to 2 times the RMS was rejected
and the point re-observed.
29

II I. OBSERVATIONS
The observations presented In this chapter comprise two large-scale
CO surveys in the fourth galactic quadrant which cover all the emission
arising in the Carina arm from / = 270" to 300", and provide most of the
evidence for conclusions drawn in this thesis. Where the Carina arm
extends beyond / = 300", the high longitude limit of these surveys,
observations from a third, adjoining survey, carried out concurrently with
the same telescope by L. Bronfman, will be used in the discussion.
Figure II I-i shows the region of the sky covered by the two surveys.
Both extended from / = 270" to 300" and covered 330 km s -1 (centered at
vLSR - O) with a spectral resolution of 1.3 km s -1, but differed in latitude
coverage and spatial resolution. The main or "full resolution" survey,
indicated by the region filled with small circles in the figure, had a spatial
resolution of 8.8' (one beam) and a sampling interval of O. 125", or 7.5' in
latitude and longitude. Although the nominal latitude range was within
b = _+1", all Carina arm sources (longitudes greater than "_280") were
followed in latitude until the line antenna temperature dropped below "_0.5
K. The irregularly-shaped latitude boundary in the figure reflects the
general pattern of those latitude extensions. For longitudes less than about
280", the emission is mostly local in origin (see Chapter IV), and not from
the Carina arm, so the full resolution survey includes only Ibl < 1" for
/ _ 280". The total area of the full resolution survey, about 85 deg 2, was
covered by _'5500 observations.
The second, companion survey had a spatial resolution of 0.5" and
covered a latitude range of Ibl _ 5" wltn a sampling Interval of 0.5" In
3O

latitude and longitude. Nearly 16 times the solid angle of the main beam,
the half-degree "beam" is obtained by stepping the telescope's position
through a 4x4 array during data acquisition. The resultant rapid, on-line
spatial smoothing permits mapping a large area in a relatively short time.
This survey, dubbed the "_uperbeam" survey (after the computer program,
developed by T. Dame, that controls the telescope in this observing mode),
was carried out for two reasons: 1) to provide a quick overview of the
emission in the Vela-Carina-Centaurus region of the galactic plane and 2)
to help determine appropriate latitude limits for the full resolution survey.
The 5uperbeam survey includes 1281 spectra coverlng 300 deg2.
Typical spectra from the full resolution survey are shown in
Figure 111-2. The RM5 noise per channel is about O.14 K; only first-order
(straight line) fits were used in determining the baselines of all the
spectra. The flat baselines and high signal-to-noise evident in this sample
are characteristic of the quality of the spectra in both surveys.
Recorded as a "cube" T(/i,bj,Vk), data in this and subsequent chapters
will usually be displayed by projecting the integral of temperature over one
of the independent variables onto the plane of the other two, the integration
limits depending on the emission characteristics being discussed. As
mentioned in Chapter II, three bad channels were discovered In the
spectrometer after the survey had been completed. The defect, no more than
1 (_ (0.14 K) in any individual spectrum, ls noticable only when llke
channels in several spectra are summed together ( e.g, in integrated /,v and
b,v maps), the result belng a false signai at the veloclty of the bad channels
(at least 9 spectra must be summed for the false signal to exceed the 3 (_
level of the sum). (The problem can be ignored in spatial maps where
different channels within individual spectra are summed, or in /,v maps at
31
singlevaluesof b,and b,vmaps at singlevaluesof /.)Maps displayingbad
channels(which appearas narrow linesat constantvelocity)have been
repairedby replacingthebad-channelsums with the interpolatedvalue of
the neighboring,good-channelsums.
The total molecular cloud emission from the 5uperbeam survey,
integrated from -50 to +50 km s-1, is shown in the plane of the sky in
Figure 111-3. Containing no velocity information, this map, analogous to a
continuum map, is useful for showing overall planar distribution of the
emission without regard for its distribution along the line of sight. For
example, between I = 270" and 280" the emission appears diffuse and has a
large latitude extent, while for longitudes above 280" the emission occurs
largely in well defined molecular clouds which are concentrated near the
galactic plane. It will be shown later that the wide-latitude emlssion ls
mostly local and that the narrow layer is the much more distant Carina arm.
The similar spatial map in Figure 111-4 is a hybrid of the 5uperbeam
data from Figure 111-3 and the data from the full resolution survey, also
integrated from -50 to +50 km s-1. This figure Illustrates that the latitude
coverage or the full resolution survey ls sufficient to cover all the Carina
arm clouds: outside the dotted line, where the 5uperbeam data is shown, we
see wide-latitude emission at / less than 280", but very little else. It is
also evident from the figure that the molecular clouds seen in the
5uperbeam map show considerable structure at full resolution. The region
between I = 280" and 285", in particular, is qulte complex. From I = 285"
to 295" strong sources Immersed In the complex low-level background
appear to be clustered on scales ~1 ", suggesting that the smaller beam is
resolving big molecular clouds.
32
To emphasize the most intense features, spatial maps were also
produced In which all spectral channels below about 3(_ (0.5 K) were
"clipped" (/_8., set to zero) before Integration; the resultant maps
(integrated from -100 to + I00 km s-l), are shown In Figures 111-5
(Superbeam) and 111-6 (full resolution comblned wlth 5uperbeam). Even wlth
the velocity-blending in these maps, having removed most of the weak
background by clipping, a few large clouds can now be recognized. For
example, most of the emission between / = 285" and 288" is part of a large
cloud complex associated with the 1l Carlnae Nebula. The emlsslon between
/ = 289" and 290.5" In the plane ls a cloud associated wlth the H II reglon
RCW 54a, and most of the emission between / -- 291" and 296" comes from a
cloud complex associated with the H II regions NGC 3576, RCW 60, RCW 6l,
and RCW 62. More will be said about these and other giant molecular clouds
in the Carina arm in Chapter V.
The kinematics of molecular gas In the galactic dlsk is best studied by
displaying the data In the longitude-velocity plane, as in Figure II 1-7.
Coverlng most of the fourth quadrant, the /,v map In this figure was
produced by Integrating the full resolution data over all latitudes where
observations have been made; we emphasize that the data have f/or been
c]lpped In this map. Although the INtegration llmlts are not uniform In /,
they should Include essentially all nonlocal (Carlna arm) emission at
longitudes between 280" and 300", as the total emlssion spatial map
(Fig. 111-4) Indicates. For / > 300" only full resolution data were available,
but the Carlna arm (seen in this part oF the /,v diagram as the lane of
positive velocity emission) is covered completely within the latitude ]imits
of the survey In this part of the fourth quadrant. The /,v map In Figure II I-7
will generally be referred to as the"/,v map" or the "/,v diagram."
33

The dominant featureofthe /,v map isthe open loopof emission
formed by a negativevelocitysegment from I = 280" to 300" and a positive
velocitysegment at I _ 280" joinedby the intenseemission centeredat
v = 0 km s-inear / = 280". This loopisthe Carinaarm, itsnear sidebeing
tracedby the negativevelocityemission,itsfarsideby the positive
velocityemission,and itstangentmarked by the strongemission connecting
the two. A more detaileddiscussionisdeferreduntilChapter IV. (The
strongemission inthe upper leftofthismap originatesinthe innerGalaxy
and willbe largelyignoredhere;see Bronfman [I985] fora fulldiscussion.)
FigureIII-8shows the corresponding5uperbeam /,vmap made by
integratingfrom b = -5" to +5". The weakness inthe5uperbeam map of the
laneofpositivevelocityemission seen inthe fullresolutionmap, and the
greaterintensityinthe 5uperbeam map of the emission below /= 280", are
readilyunderstood.Being closelyconfinedtothe galacticplane,the
positivevelocityemission isdilutedby the largebeam and wide latitude
coverageofthe Superbeam surveyand fallsbelow the 3(5level(roughlythe
firstcontour)of the5uperbeam /,vmap. At / _ 280" much of the emission
thatspillsout of the latitudeboundariesof the fullresolutionsurvey is
coveredinthe 5uperbeam survey(seeFig.III-4),so more emission is
includedinthe 5uperbeam /,vmap below I = 280" than inthe fullresolution
/,vmap. Bearinginmind these differences,both maps are fullyconsistent.
An /,vmap made by smoothing the fullresolution/,vmap inlongitude
to 0.5" (Fig.III-9)more closelyresembles the 5uperbeam /,vmap, the main
differencebetween the two beingthe differenceinthe strengthof the local
materialbelow I = 280". Between / = 280" and 300", the Superbeam map
containsabout 30% more integratedemission (abovethe 30"level)thanthe
34

full resolution map, again indicating that most of the emission at I _ 280"
isaccounted forinthe fullresolution/,vmap.
A set of54 fullresolution/,vmaps at each sampled latitudeinthe
survey (b = +2.5"to -4.125")isshown inFigureB-1 (placedinan appendix
due to theirbulk).ForIbl> I',where the latitudecoveragevaries,dotted
linesmark the separationbetween observedand unobserved sectionsof
longitude(exceptfor I < 280", therelittleorno emission isexpectedin
the unobserved portionsof eachmap, as we have Justseen).The positive
velocityemission inthesemaps Isstrongestbetween b = 0" and -I°,while
strongnegativevelocityemissioncan be seen over a wider latituderange,
roughlyfrom b = 1.5"to -2.5".The differinglatitudeextentsof the
positiveand negativevelocityemissionsimply reflectthe different
distancestothe farand nearsidesof theCarinaarm. Emission from the
tangentregionof thearm (I= 280",v = 0 km s-i),evidentbetween
b = 0.625" and -2.75",is,as inthe farside,strongestatnegative
latitudes.The loopthattracestheCarinaarm inthe integrated/,vmap is
apparentinthesemaps primarilyInthenarrow latituderange between
b = -0.25"and -0.875". Itisquiteclearfrom these maps thatthe Carina
arm couldbe overlookedina CO surveyrestrictedtob = 0".
There beingno otherCO surveyof theCarinaarm with comparable
coverage,itseems appropriateto includehere(alsoinAppendix B),in
additionto the maps to be used Inthe nexttwo chapters,a largersetof
maps forgeneraluse. FigureB-2 shows 241 fullresolutionb,vmaps ateach
i,,,,,,i_,,,_.. ,,,,,,_ov,_,_,v,,ourvey,FigureB-3 shows "_',v._,,_ observedinthe ,,,I,_..^,.._,^........ Zl
5uperbeam /,vmaps ateach latitudeobservedintheSuperbeam survey;and
FigureB-4 shows 61 5uperbeam b,vmaps at each longitudeobserved inthe
5uperbeam survey.The maps are presentedhere withoutfurtherdiscussion.
35

IV. LARGE SCALE PROPERTIES OF MOLECULAR GAS IN THE CARINA ARM
Between longitudes 280" and 300", the Carina arm has been well
established in a variety of optical and radio spiral tracers. CO, being an
excellent spiral tracer in the first and second quadrants (Dame 1983), may
be expected to join the list of tracers in the Carina arm. As we will see
below, the Carina arm is indeed traced exceptionally well by molecular gas,
and is actually the best example to date of a CO spiral arm in the Galaxy. As
the birth sites of massive stars and their accompanying H II regions, giant
molecular clouds provide an important physical link between the optical and
the classic 21-cm arms. In the Carina arm in particular, where the optical
tracers can be seen to very great distances ('_ l O kpc), the good agreement
between the optical and molecular pictures of the arm underscores the
importance of CO in the study of large-scale galactic structure in regions of
the Galaxy where the arms are optically obscured.
The optical transparency of the Carina region of the galactic plane ends
with increasing / near / - 298", but the molecular arm continues much
further: at least to / = 329 °, as will be shown. This chapter focuses on the
large scale characteristics of the arm. First, the Carina arm's appearance Jn
the /,v diagram is discussed. Using the /,v diagram to locate the near side,
tangent region, and far side of the arm in velocity space, these three
segments of the arm next are viewed as they appear in the plane of the sky.
Then, for the emission from beyond the solar circle, the distribution of
molecular gas about the galactic plane is examined, and the surface density
of molecular hydrogen as a function of galactocentric radius determined.
Finally, the CO results are compared with the large-scale distribution of
neutral atomic hydrogen observed at 21-cm.
36
A. Kinematics and Distributionof CO inthe Carina Arm
I. The /,vDiagram
Inthe fourth galactic quadrant, material within the solar circle
(Ro = I0 kpc) is generally overtaking the Sun in its galactic orbit,so radial
velocities in the local standard of rest are negative. Similarly, material
beyond the solar circle is fallingbehind,so radialvelocities are positive.
From previous optical and radio studies (see Chapter I),the tangent point of
the Carina arm is known to be near the solar circle at / = 28 I'. Within the
solar circle,the arm approaches a point about 2 kpc from the Sun near
I = 296", and beyond the solar circle itmoves further from the galactic
center (and from the Sun) with increasing longitude. The expected signature
of the Carina arm in the /,vdiagram, then, is a loop with the near side at
negative velocities between / = 281" and 296", the far side at positive
velocites at longitudes greater than "_281",and the connecting tangent
region near zero velocity at / = 281 ". This is exactly what is seen in the
integrated /,vmap (Fig.IfI-7). Because velocity crowding and noncircular
motions influence the appearance of the /,vmap (e.g.,Burton 1971 ),a closer
look at the Carina "loop" is worthwhile. For the following discussion, a
schematic representation of the main features in the /,v diagram is
displayed in Figure IV-lb beside the integrated /,v diagram to the same
scale (Fig. IV-la).
The correspondence of the near side of the arm with the high velocity
ridge between / = 280" and 300" raises the question of whether velocity
crowding, rather than a true density enhancement, could be responsible for
37
the enhanced emission in this part of the /,v diagram. While there are
undoubtedly some chance line of sight coincidences of distinct molecular
clouds near the terminal velocity, the sharp gap in emission between
/ = 289" and 291" (and to a lesser extent between / = 296" and 297") along
the high velocity ridge indicates that velocity blending of many small,
randomly distributedclouds is not likelyto be the originof this ridge. This
may be seen by considering the following two-dimensional picture.
The velocity extent of the emission gap at I = 290" -- through the
high velocity ridge and allthe way to zero velocity -- corresponds to a path
length of about 7 kpc through the galactic plane; the implied region of the
galacticplane that is free of molecular clouds is from the 5un to the solar
circlebetween / = 289" and 291". The area lies between 9 and I0 kpc from
the galactic center and covers about 8 x I05 pc2. Let :Ebe this total cloud-
free area,and letSM be the number surface density (pc-2)of all molecular
clouds in the mass range Mi _ M _ M 2 in the galactic plane between R = 9
and I0 kpc. Then, ifthe clouds in this mass range are distributed in the
plane with a Poisson distribution of mean SM, the probability, Po, that no
clouds with masses between M1 and M2 occupy T. is:
Po = exp(-SM_).
For a given mass range, Mi _ M _ M 2,with mean mass <M>, we can write
SM = fMC_/<M>, where c_ is the mass surface density of molecular gas, and fM
iS the fractlon of c_ contained in clouds with masses between Mi and M2.
From the axisymmetric distribution derived by Dame (1983) and relation
(IV-l) introduced later in this chapter, we have c_ = 3 Me Pc-2 between
R = 9 and 10 kpc. Using the molecular-cloud mass spectrum of Dame
38
(1983), f_ and hence sN have been estimated for six half-decade wide
logarithmic mass intervals with centers ranging from/og(M/i"l e) = 4.0 to
6.5; the smallest mass corresponds roughly to the sensitivity limit of the
full resolution survey for clouds at 7 kpc. The computed values of Po for the
respective mass intervals (least to most massive) are found to be: 0.002,
0.031, O.147, 0.320, 0.549, and 0.702. Evidently, if velocity crowding of
small clouds were the origin of the high velocity ridge in this part of the /,v
diagram, a gap such as the one observed at / = 290" would be a very unlikely
occurence. As larger and larger clouds are considered, however, the
existence of the gap becomes less unlikely, suggesting that the high
velocity ridge emission comes from large clouds. The gap at / = 290" in
the high velocity ridge is just the line of sight between very large clouds
that happen to lie near the terminal velocity.
Large clouds also are subject to velocity crowding, but they are
relatively few in number, and, out of four identified near the terminal
velocity between / = 280" and 300", two can be placed in the near side of
the Carina arm on the basis of associations with well-known optical
objects that trace the arm (see Chapter V). It seems reasonable, therefore,
to attribute the high velocity ridge emission largely to the near side of the
Carina arm.
Between ! = 280" and 284", near zero velocity the tangent region of
the arm is marked by intense COemission. A long path length through the
arm lies In a narrow range of longitudes near the tangent, accounting for the
observed brightness of the emission and rapid increase in the velocity width
as / increases from 280" to 284". Some local emission may be mixed in as
well, but the coincidence of the bright COedge with the classic Carina
tangent suggests that the local contribution is slight. The relatively weak
39

intensity just before / = 280" corresponds to an interarm region outward in
galactocentric radius from the Carina arm tangent.
The abrupt onset of the tangent emission as our line of sight sweeps
toward I = 280" from below is illustrated especially well in Figure IV-2,
which shows the emission from the full resolution survey integrated over
latitude and velocity as a function of longitude. Plotting the total intensity
of a spiral tracer versus longitude is a classic method for locating the
tangent directions of spiral arms. In such an intensity-longitude or
"1(/)" graph, the tangent directions appear as upward steps in the intensity,
and the ratio of brightness in the tangent direction to that in the preceding
interarm direction indicates the arm-interarm contrast of the spiral tracer
(Dame 1983). In the first quadrant, the CO I(/) graph shows a typical
tangent-interarm brightness ratio of about 2 to 1 (Dame 1983), and in the
fourth quadrant (Fig. IV-2) similar ratios are seen in the tangent directions
of the Centaurus and Norma arms, at / = 31 O" and / = 330". For the Carina
tangent at ! = 280", however, the ratio is much higher: about to 13 to 1.
(The nearby step down from ! = 270" to 272" results mostly from local
emission.) There are three possible explanations for such a high ratio.
First, the latitude coverage of the full resolution survey fans out at about
the same longitude as the step in the I(/) graph, suggesting that the
strength of the step might be an artlfact of the sampling. This possibility
was carefully considered by comparing I(1) graphs produced from the
5uperbeam survey to the full resolution I(I) graph smoothed in longitude to
0.5". The smoothed full resolution I(l) graph was found to be completely
consistent with the 5uperbeam I(1) graphs, and therefore, since the
sampling of the 5uperbeam survey is uniform in / and b, the irregular
sampling pattern of the full resolution survey fails to explain the high
40

tangent-interam brightness ratio. Second, since COemission from the
tangent region of the Carlna arm is klnematically indistinguishable from
local, low velocity COemission, the strength of the step in the I(/) graph
could be due in part to contributions from local emission. However, as noted
above, such contributions cannot be substantial, as evidenced by the
observation of distant, optically visible H II regions at the Carina arm
tangent (Bigay et aL 1972), and the absence of Population I material ahead
of (at lower longitudes than) the tangent coupled with the step in the radio
continuum intensity observed in the direction of the Carina tangent. Third,
the high tangent-interarm brightnesss ratio is a true indication of the
physical arm-lnterarm contrast in the Carina arm. Thls explanation is by
far the most plausible of the three, and the conclusion is unavoidable: there
is ~ 13 times more molecular gas in the Carina arm than in the interarm
region ahead of the tangent. This finding provides significant support for
the clalm that molecular clouds in the Galaxy are confined largely to the
spiral arms (Cohen eta/. 1980; Dame 1983), and demonstrates emphatically
the importance of COas a spiral tracer.
Above ! = 280", at positive velocities, the tangent region extends
continuously to the far side of the Carlna arm. Because the far slde lles
beyond the solar circle, there is no kinematic distance ambiguity in the CO
emission. A fairly sharp low velocity edge for longitudes above ~284"
marks the Inner side of the arm, and the relative emptiness of the region
between this edge and zero veloclty is very simllar to the interarm gap
observed between the local arm and the Perseus arm in the second quadrant
(Cohen eta/ 1980). As is the case with the near side, individual molecular
clouds identified in the far side between I = 280" and 300" colncide with
previously known Carina arm tracers, including some very distant optical
41

H II regions. Beyond / = 300", the arm extends to the top of the /,v map:
the small object at /= :329", v = 30 km s -i is not noise, but a distant,
6 x 10⁵ P1o molecular cloud in the Carina arm; an even more distant cloud
observed at / = 335" extends the arm even farther (Chapter V).
Running down the center of the /,v diagram, near zero velocity, is a
lane of emission mostly local in origin, although a small amount of weak,
distant emission may be present here as well. The local emission is
recognlzable by the narrow llnes and, In the case of the narrow-veloclty
component of the feature seen between /= 293" and 295", by Its large
latltude displacement (see the /,v maps from b ; -2" to -3" In Fig. B- I ). The
sparseness or the emlsslon that appears between the near and far sides In
the /,v diagram 1s also evident in the plane-of-the-sky map of the tangent/
reglon (Flg. IV-3b) discussed below.
Except for the local emlsslon near zero velocity, the region between
the near and far sides of the arm In the /,v diagram 1s remarkably free of
emission. This gap corresponds to the lnterarm region Interior to the Carina
arm. Wlth the exception of the Perseus arm (Cohen et aZ 1980), no other CO
spiral arm, when viewed in /,v space, exhlblts such a sharp intensity drop
lnslde Its inner edge; It 1s the relative emptiness of the reglon Inward of
the arm that makes the Carlna loop stand out In the /,v diagram.
2. The Spatial Maps
To view the near side, tangent region, and far slde of the Carina arm on
the plane of the sky, the emission was integrated over the approximate
velocity widths of these features as they appear In the integrated /,v
diagram. The velocity boundaries are indicated In the key to the /,v diagram
42
(Fig. IV-lb) as the dotted lines at constant velocity, and the resultant
spatial maps are shown In Flgures IV-3a to IV-3d. For / _ 300", the spatial
maps combine the full resolution and 5uperbeam data; from / = 300" to
330", only full resolution data are available. In the following discussion the
spatial maps are referred to according to the segment of the arm displayed,
Ze., the "near side map" (Fig. IV-3a), the "tangent region map" (Flg. IV-3b;
this map contains some local material as well -- see below), and the "far
side maps" (Figs. l V-3c and IV-3d).
For ! > 284", the near and far sides of the arm are well contained
within the adopted velocity ranges of the spatial maps. Below 284", where
the near and far sides of the arm merge continuously into the tangent, the
velocity boundaries at -9 km s-i, the inner edge of the near slde, and at
7 km s-1, the lnner edge of the far side, sandwich the tangent region
somewhat arbitrarily. Even so, these llmlts evidently enclose most of the
tangent emission, as a comparison of the tangent region map to the total
emission spatial map (Fig II I-6) shows. Almost all the peaks between
/ = 280" and 285" In the total emlsslon map appear In the tangent region
map. (Notable exceptions are the peaks at / = 283", b = 1.5"; / = 284.25",
b = 0.75"; and I = 284.5", b = 0.5 °, the first two being seen in the near
side map, the third in the far side map.) The abrupt onset of the tangent
emission, prominent in the total emission map, is no less evident in the
tangent region map; and although the total emission map is more intense
than the tangent region map between /= 280" and 285", the complicated
appearance of the emission is similar in each. This is because the large
path length sampled by the small velocity extent of the tangent region map
accounts ror most of the tangent region emission.
43

Two othercharacteristicsof the emission inthe tangentregionmap
shouldbe noted. First,the wide latitudeemission between I = 270" and
275" iscompletelyaccountedforwithin the low velocitiesof the tangent
regionmap (compare the nearand farsideand tangentregionmaps),
supportingthe earlierassertionthatthiswide latitudeemission islocal.
Second,the emission near zerovelocitybetween the near and farsidesof
the arm inthe /,vdiagram isweak when viewed inthe planeof thesky,
especiallycompared with the nearsldeand farsideemission between
/ = 285" and 300*. This clearlysupportsthe conclusionthatthe interarm
regioninteriortothe Carlnaarm iscomparativelyfreeof molecularclouds.
The spatialmap ofthe near side(Fig.IV-3a)ischaracterizedby well-
definedmolecularcloudsorcloudcomplexes between I = 284" and 296*.
For example, the cluster of strong peaks between / = 285" and 288" near
the galactic plane is a single cloud complex associated with the 11 Carinae
Nebula, the brightest optical feature in the Carina arm. The emission
between / = 292" and 295" comprises a large cloud complex associated
with a group of H II regions, including RCW 62 and NGC 3576, also
optically prominent Carina arm objects. Between / = 280" and 284" below
the galactlc equator, where the near side merges with the tangent region
(compare Figs. IV-3a and IV-3b), and for ! > 297", where our line of sight
moves toward the inner Galaxy, the emission has a more confused
appearance, making identification of Individual clouds less certain. The
total latitude extent of the near side is 3 to 4 degrees, corresponding to a
total thickness of about 160 to 210 pc, assuming an average distance of :3
kpc to this part of the arm.
In the far side of the arm (Figs. IV-3c and IV-3d), most of the emlssion
ls concentrated below the galactic equator. As the longitude increases, the
44

latitudewidth of the layershrinks,reflectingthe increasingdistanceto the
farsidewith longitude,inagreement with the kinematicpictureof the far
side.
3. The DistributionAbout the GalacticPlane
Because no kinematic distance ambiguity exists for emission beyond
the solar circle, a unique distance from the galactic plane, z, may be
assigned for the emission at each observed /, b and v for R > Ro, and the
distribution of molecular material about the galactic plane in the outer
Galaxy can be determined directly. In this section the dependence on
galactocentric distance of the average midplane, layer thickness, and
surface and volume density of molecular hydrogen beyond the solar circle is
derived, ignoring for the moment the dependence of these properties on
galactocentric azimuth.
A qualitative comparison between the observed radial distribution and
the assumed axial symmetry can be gleaned from Figure IV-4. In the figure,
the galactocentric rings of constant radlus are shown transformed to /,v
space (using a flat rotation curve, V(R) = 250 km s-1) and superimposed on
an outline of the /,v data. The opening outward of the Carina arm with
increasing longitude is quite apparent, particularly between ! = 280 ° and
310" Because this nonaxisymmetric structure is ignored below, and
individual clouds in the arm have velocity widths that "spread them out"
over a few kiloparsecs in kinematic radius, the arm will be largely washed
out in the following treatment. But even so, we will see that by considering
a restricted range of longitudes the arm and lnterarm regions are easily
distinguishable.
45

To convert the observed COluminosity at each postitlon to density, the
integrated emission, J'T*Rdv,denoted W(CO), is assumed to be proportional
to the column density of molecular hydrogen, N(H2). Even though the i2CO
line is optically thlck, W(CO)has been shown empirically to be a good tracer
of molecular cloud mass in the Galaxy (Lebrun et el 1983; Bloemen et el.
1985). We adopt here the W(CO)-N(H2) relation of Bloemen et a/.:
N(H2)/W(CO) = 2.8 x 1020 cm-2 (K km s-1)-l. (Jr-l)
Their result was derived using gamma rays as a tracer of the total gas
column denslty and the 21-cm llne as a tracer of the atomic hydrogen
column density.
Wrltlng expression (IV-1) in the differential form,
dN(H2) = 2.8 x10²o T*n dv (cm -2)
it follows that the density at any point (R,z) can be written as
p(R,z) : 6.17 TR*(/,b,v) x Idr/dvi -i Me pc -3, (IV-2)
where TR" is the CO line temperature; R and z (for R > Ro) are uniquely
determined by /, b, and v (in km s-i), r is the kinematic distance to the point
in parsecs, and the mean molecular weight per H2 molecule has been taken to
be 2.76 mH (Allen 1973). The factor Idr/dv1-1 can be calculated from the
rotatlon curve using the expression for the observed radial veloclty due to
differential galactic rotation,
46

VLSR = RO[LO(R)-LD(Ro)]SJB(/)COS(b),
where LoCR)is the angular velocity at radius R. As a reasonable first
approximation, and to facilitate comparison of the COresults with the H I
results of Henderson eta/. (1982), a flat rotation curve was used:
V(R) = 250 km s-1 The projected surface density, (_(R), is just j'p(R,z)dz,
where the integral runs over all z. In this analysis, the computed densities
at each point, (/,b,v), between / = 280" and 335", weighted according to the
respective volume elements, were summed in bins in R and z, yielding a
sampled mass per bin. Dividing the total mass sampled by the total volume
sampled in a given bin then gave the average density for that bin.
The results for p(R,z) are plotted as a function of z at fixed R, starting
at 10.5 kpc, in Figures IV-Sa-f; the data are shown by the solid line. At
each radius, a Gaussian with the form
p(z) = Po exp[-(Z-Zo) 2/n(2)/(zl/2)2] (IV-3)
was fitted to the data, and the parameters determined: Po, the peak density
of the Gausslan; Zo, the z-displacement of the peak; and zl/2, the half-
thickness at half the peak density. The fits, drawn with a dotted line in the
figures, are evidently fairly good representations of the actual distribution
at each radius. Table IV-I gives the parameters from the fits, the H2
surface density based on the fit, and, for comparison, the surface density
measured directly from the area under the solid (data) curves in the figures.
The CO midplane, layer thickness, and surface density are plotted versus
radius in Figures IV-12a-c.
47

The mean of the distributiondips below the plane for Ro < R < 12.5
kpc, reaching a maximum displacement of z = -166 pc at 12.5 kpc. The
half-thickness of the layer grows with increasing radius. By i3 kpc, there
is very littlemolecular hydrogen, and the measurements, as shown, are
highly uncertain. In general, the surface density of H2 beyond the solar
circleis known to be smaller than in the inner Galaxy (e.g.,Sanders et aZ
1984) and drops off with increasing radius beyond R o. Between / = 280" and
335", however, a peak is seen in (_(H 2) at R = 11.5 kpc. This peak is probably
caused by the three or four large molecular clouds between / = 290" and
320' that straddle the I 1.5 kpc ring in Figure IV-4. With the results of the
axisymmetrlc model for the inner Galaxy used by Dame ( ! 983), the H2
surface density at the 11.5 kpc peak is found to be only a factor of _,4
below the value at the peak of the "molecular ring" in the first quadrant.
Taking the peak at 11.5 kpc to be representative of the surface density in
the Carina arm suggests that a single spiral arm can account for a
significant fraction of the H2 surface density observed in the interior region
of the Galaxy.
If attention is restricted to longitudes 290" to 310" and just the two
rings at 10.5 kpc and 11.5 kpc are considered (refer to Fig. IV-4), we can get
some idea of the arm-interarm contrast in terms of surface density. In this
case, we find that d(H 2) - 1.1 M® pc -2 at 10.5 kpc, and 4.9 Me pc -2 at I 1.5
kpc, giving arl arm-interarm surface density contrast of _'4,5 to 1. Because
the preceding analysis tends to wash out nonaxisymmetric structure ( ie.,
spiral arms), the actual contrast is likely to be higher -- recall that a
13 to 1 contrast is seen in the I(I ) graph (Section A.I above). To a distant
extragalactic millimeter-wave astronomer with a face-on view of our
Galaxy, the Carina arm must be a prominent feature.
48

Finally, the total mass of H2 in the sector of the Galaxy considered
( / = 280" to 335", R = 10.25 kpc to 13.25 kpc) may be obtained by
multiplying the H2 surface density of each ring segment by the area of the
segment and summing over the segments. The result using the surface
densities from the fits is 1.0 x10⁸ Me, whereas using the measured surface
densities (the numerical integrals of the solid curves in Figs. IV-Sa-f) gives
1.1 x lO8 Me. These numbers are about 1.7 to 1.9 times the value obtained in
the next chapter by considering the total mass in a catalog of Carina arm
molecular clouds. This factor of ~2 difference can be largely reconciled by
evaluating the completeness of the molecular cloud catalog within the
projected area of the galactic plane considered in the present section. If
account is taken of: 1) molecular clouds too faint to be included in the
catalog, and 2) a few molecular clouds Interior to the Carina arm that
contribute to the surface density derived above but are not included in the
catalog of Carina arm clouds, about half of the "missing mass" is recovered.
The mass in clouds in category (2) may total as much as 107 M e (Bronfman,
private communication). Another ~ 107 Me is estimated to reside in clouds
below the mass threshold for Inclusion in the catalog. This estimate was
obtained by using the molecular cloud mass spectrum of Dame (1983), the
threshold apparent CO luminosity for clouds in the catalog, and an average
distance to each of the galactocentric rlng segements to calculate roughly
the fraction of the surface density (and hence of the total mass) in each ring
segment that falls below the threshold. With corrections ( 1) and (2) to the
total mass in the cataloged Carlna arm clouds, then, the total mass found
from cloud counting agrees to within ~25_ of the total derived from the
axisymmetric averaging of the COemission.
49

B. Comparison with H I
Inthissectionthe largescaledistributionofH2 and of H Iare
compared. 51mIlarcomparisons Inthe firstquadranthave shown a good
correlationbetween the CO and H I,althoughthe CO appears tobe more
confinedto the spiralarms (Dame 1983). The H Idataused to producethe
maps discussedbelow are from a neutralhydrogensurvey of the Southern
MilkyWay made with the Parkes 18 m telescope.A magnetic tape
containingthe surveywas kindlyprovidedby Dr.Frank Kerr.
I. The /,v Diagrams
Figure IV-6 is the H I /,v map integrated within Ibl _ 2 °, covering the
same region of /,v space as the CO /,v map in Figure 111-7. As in the first
quadrant ( e.g., Burton and Gordon 1978; Dame 1983; Sanders et el 1984), the
CO and H I termlnal veloclty curves are quite similar. For example, between
1 = 318" and 315", the slope in / of the hlgh velocity ridge becomes almost
vertical In both COand H I; at I = 313", a sllght positlve velocity
indentation flanked on either side (in I) by two negative velocity bumps is
seen in both the CO and H I high velocity rldges. These and other easily
recognizable coincidences of the COand H I terminal velocity curves
suggest that the two species share the same large-scale kinematics.
More quantitative evidence is provided by comparing the emission-
weighted mean velocities of COand H I along their respective high velocity
ridges. To make this comparison we define the mean velocity of the high
velocity ridge of species X (CO or H I) at longitude /, <v(/)Hv_x, to be
5O
<v( I)HVn>X= J'Vx(/)Tx( l,v)dv/J'Tx(/,v)dv, (IV-4)
where the integrals extend over +25 km s-1 of the assumed rotation curve at
the given longitude, and before Integrating, the CO data ls smoothed in / to
the resolution of the Parkes survey. The difference between these mean
velocities, L_<VHvR(I )>, where
A <V(/)HV_ - (V( I)HVI:PCO- (V(/)HV_H I, (IV-S)
should be approximately independent of the rotatlon curve used. Figure IV-7
shows these velocity residuals plotted against longitude; to demonstrate
the relative insensitivity to the rotation curve, the residuals were
calculated using both the Burton and Gordon (1978) rotation curve (solid
line for A<v(/)HVI_) and a simple straight line in the /,v plane from
v = -85 km -1, I = 330", to 0 km s-I, 270" (dotted line for A<v( / )HVR>).A
large discrepancy between the COand H ! terminal velocities appears near
/ = 290", the longitude of the gap in the COhigh velocity ridge, but because
there is no CO emission in this region, the weighting function in equation
(IV-4) is just noise and <v( / )_co is not well defined. Aside from this
direction, however, the magnitude of A<V( / )HV_>iS generally less than
5 km s-t, quantifying both the agreement of the COand H I terminal
velocities and the similarity of the large-scale kinematics of the two
species. (The possibility of differences between the small-scale
kinematics of the two species is not precluded by the foregoing
computation.)
51
In the outer Galaxy (v > 0), the H I is more widespread in velocity than
the CO,but by far the strongest H I feature is the Carina arm. A striking
resemblence between the CO and H I pictures of the outer Carina arm can be
seen by comparing the CO /,v diagram to an H I /,v diagram produced by
setting all spectral channels below 50 K to zero before integrating in
latitude. Such a map, shown in Figure IV-8, emphasizes the strongest H I
features. Nearly every H I peak in the outer Carina arm has a corresponding
peak or complex of peaks in the COmap, each of these CO peaks being a giant
molecular cloud (see Chapter V). Note especially the features at: / = 303",
v = 32 km s-t; /= 311", v = 35 km s-t; and /= 329", v = 30 km s-1.
The shapes of these objects, as can be seen, are generally simllar In both CO
and H I. The dominant features in neutral hydrogen, then, appear to be
closely associated with giant molecular clouds.
The tangent reglon ls a strong H I feature, but from the H I data alone It
ls not obvious that the far side of the arm ls continuous wlth the tangent
feature. This uncertainty of the far side-tangent connection is partly due to
the apparent continuity of far side at / > 280" with the H I at about the
same veloclty at ! < 280" (e.g., the concentration at / = 273",
v = 35 Km s-1 ln Flg. IV-6). Recently, Henderson ete/.(1982)examlned
H I In the outer Galaxy by considering emlsslon only at klnematlcally-
determined galactocentric radl! greater than 1I kpc. Intentionally omitting
the inner Galaxy from their analysis to avold the problem of kinematic
distance ambiguity, they excluded the tangent reglon, and Interpreted the
far side as continuing to / = 265" (as lnferred from their map of H I
projected surface denslty In galactlc plane). There are two properties of
the H I /,v map (especially the clipped /,v map) that do suggest that the far
side of the arm does not continue to longitudes less than 280". Flrst,
52

between v = 15 and 45 km s-i, there is a sudden rise of the H I contours
in the direction of increasing / between / = 279" and 280" which is
uncharacteristic of the more gentle slopes of the contours between the H I
concentrations at / > 280" in the far side. Second, a deep trough in the
emission centered at / _ 277", v _. 35 km s -1 that separates the far side
at /> 280" from the feature at /= 273",v = 35 km s-1 is un]ike the
shallower depressions between the other far side concentrations. The best
evidence against the interpretation that the far side of the Carina arm
extends to longitudes less than 280", however, comes from the CO /,v
diagram: the strength of the tangent and the clear continuity of the near and
far sides with the tangent. Without the CO data, extension of the H I
counterpart of the far side to / < 280" cannot be convincingly ruled out.
An interesting feature in the near side of the arm noted earlier is the
2" wide gap in the CO high velocity ridge centered near / = 290". This gap,
the existence of which argues against a widespread distribution of small
molecular clouds throughout the Carina region, can reasonably be attributed
to the line of sight between two large molecular clouds. In H I, a
corresponding feature near / = 290" appears as a shift of the high velocity
ridge toward more positive velocities and a spreading out in / of the
contours. This detour of the H I high velocity ridge was interpreted by
Humphreys and Kerr (1974) as evidence for a large-scale shock at the inner
edge of the Carina arm, but if the claim that we are just looking between
molecular clouds at / = 290" ls correct, and if CO and H I concentrations
are related, as appears to be the case in the far side of the arm, then this
notch in the H I high velocity ridge near / = 290" may just reflect a true
lack of neutral hydrogen near the terminal velocity at this longitude.
Nonetheless, it is possible that the absence of CO and (perhaps) H I in this
53
direction is the result of an energetic event or a large-scale disturbance
having cleared out the gas This region clearly deserves further study.
Aside from such Indirect evidence for correlation of H I and CO in the near
side, the general strength of the H I high velocity ridge makes it difficult to
trace the near slde of the Carina arm in the H I /,v map, an aspect of the H I
emission that, perhaps more than any other, masks the Carina "loop" in the
H I /,vmap
2. The 5patialMaps
The H I spatial map of the total emission between -I00 and I00 km s-i
displayed in Figure IV-9 is qualitatively similar to the CO total emlssion
map (Fig II I-6). The tangent region is recognizable, as is the general
latitude-shape of the layer at / > 280", although most of the individual
peaks are washed out The more diffuse appearance of the H I relatlve to the
CO is only partly due to the lower spatial resolution of the 21-cm
observations, since even when smoothed to the 48' resolution of the Parkes
survey, the COretains more definition than ls evident in the H I.
H I spatial maps of the near side, tangent reglon, and far side of the
arm made with the same veloclty windows used for the CO spatial maps are
shown In Figures IV-lOa-d. The tangent reglon map (Fig. IV-IOb) shows the
H ! counterpart to the CO tangent, although the H I tangent does not exhibit
as abrupt an outer edge at I = 280" as does the CO tangent, and the
inter"arm region at / > 285" is not as empty in H I as in CO In the near
side, where the high velolcity ridge dominates the H I /,v diagram, an
apparent H I concentration can be seen in the spatlal map (Flg. IV-lOa)
between I = 280" and 288"; the sudden shlft of the H I hlgh velocity ridge
54

toward positive velocities near / = 290" noted above is marked by a relative
trough in the spatla] map between / = 288" and 290", supporting the
interpretation that the notch in the high velocity ridge represents a true
]ack of material. In the far side spatial maps (Figs. IV-lOc, d), although the
latitude extent of the H I is everywhere greater than the CO, the projected
thickness of the H I layer generally decreases from / = 280" to 330", and,
as with the CO and H I /,v maps, the spatial maps of the far side show a
close correlation between H I concentrations and the CO peaks. A strong H I
feature in the far side map at /-_ 273", b = -1.5" could be interpreted as
an extension of the far side of the Carina arm to / < 280". The depression
of the contours separating this feature from the emission that begins
abruptly at / = 280" is, however, deeper than the troughs between any of
the H I concentrations farther along the far side of the arm ( / > 280"),
suggesting (as did the /,v map) that the far side of the Carina arm does not
connect with any feature below ! _ 280" in the outer Galaxy.
3. The z-Distribution
The distributionof H I about the galactic plane in the outer Galaxy has
recently been reinvestigated by Henderson et al (1982). In the 5outhern
Milky Way, their results,in agreement with earlierfindings,show an
increasing displacement of the H I midplane below the b = O" plane with
increasing distance from the galactic center,reaching an extreme value of
z = -850 pc at R = 17 kpc and a galactocentric azimuth of 260" (where 0 °
coincides with I = O" and the angle increases counterclockwise). The width
of the layer increases outward as well, attaininga half-thickness (defined
as the width about the midplane within which the projected surface density
55

equals one-half the total projected surface density) of about 2 kpc near the
outer edge of the Galaxy.
Most of the results of Henderson et el are presented In the form of
contour maps in the galactic plane, making a direct comparison with the CO
in the overlapping region discussed in Section A.3 above somewhat difficult.
For this reason, the same procedure used to obtain the results for the I-I2
was applied to the Parkes H I data. The results are shown in Figures IV-
I la-f (solid line). It is not certain to what extent the high-z wings in the
H I density proflles are real: the large velocity dispersion of the H I
causes some local high latitude material to appear kinematically at
R > 10 kpc and flctlclously high z (note especially Fig. IV-I la), but the
wings persist to R > 13 kpc; stray radiation entering the antenna's
sidelobes also might be partly responsible for the observed broad wings. A
simple Gaussian shape in the outer Galaxy is not necessarily expected,
since, for example, in an analysis of H I in the inner Galaxy, Lockman (1984)
found the layer's vertical shape between R = 4 and 8 kpc is fitted best by
the sum of two Gaussians plus an exponential. On the assumption that the
deviation in the shape of the H I layer from a Gaussian in the outer Galaxy
ls real, the half-thickness and the surface denslty from the flts (dotted llne
in figures) have not been used. Instead, the half-width at half-maximum
was measured dlrectly from the plots of the data (solld line), and the
surface density was taken from the numerical integral (in z) under the same
curves. The symmetry of the curves made it possible to measure the
average midplane directly off the plots as well. Considering the differences
between this analysis and that of Henderson ete/., there is good general
agreement of the derived quantities; in particular, the surface density as a
56

function of galactocentric radius derived here is generally within about 20_
of that found by Henderson et a!
Comparisons of the COand H I z-distribution parameters are shown in
Figures IV-12a-c. (Because or the hlgh velocity dispersion of the H I, the
results at R = 10.5 kpc were omltted from this comparison.) The H I
midplane is within about 25 pc or the COmidplane out to 12.5 kpc, beyond
which very little COemission ls seen. The H I layer thickness is about
twice that of the CO at all radii. Similarly, the H I surface density is much
greater than the H2 surface density in the outer Galaxy, although, owing to
the presence of the Carina arm, the ratio of H2 surface density to H I surface
density is about twice as high as that derived by Sanders et aL (1984) in the
first and second qu3drants. The absence of a counterpart in H I to the peak
in the H2 surface density at 11.5 kpc again indicates the higher velocity
dispersion of the H I.
C. Summary
The Carinaarm has the characteristicsignatureofa spiralarm inthe
CO /,vdiagram. Integratingthe CO emissionovervelocityand latitude
revealsa 13 to 1arm-interarm contrastbetween the tangentdirectionand
longitudesprecedingthe tangent.The continuityof the near side,tangent
region,and farside,and the relativeabsenceof molecularcloudsinthe
interarmregionare seen more clearlythaninany otherCO spiralarm inthe
Galaxy. inthe planeof the sky,the angularwidth of the layer,as itshould,
diminisheswith distancealong the arm. The principalfindingsof an
axisymmetric analysisof the out-of-planedistributionof CO inthe outer
Galaxy are: an increasingdisplacementofthe H2 midplane below the b = 0°
57

plane with galactocentric radius; an increase in the width ofthe layerwith
galactocentricradius;and a lower limitof "_4.5to I for the ratioof surface
densitiesinthe arm tothe interarmregioninteriortothe arm.
A comparison with H Iusing the Parkes 18 m 21-cm survey of the
SouthernMilky Way shows a close correspondenceof the farsideand
tangentofthe arm, althoughtheconnectionof these two featuresinthe /,v
diagram isnot as apparentinH Ias inCO. The nearsideof the arm ismore
difficultto identifyinH I,making theCarinaarm looplessapparentinthe
H Ithaninthe CO /,vmap. Inthe regionof the planewhere the 21-cm
observationsoverlapwith theCO survey,the well-known warping of the H I
layerfollowscloselya similartrendfound here inthe molecularlayer;the
flaringof theH Ilayerwith galactocentricradiuswas alsofound tohave a
molecularcounterpart,althoughthe H Ilayerisabout twice as thickas the
molecularlayer.
58

V. THE CARINA ARM MOLECULAR CLOUDS
To place the Carina arm in the Galaxy, we now turn to a discussion of
the individual clouds that trace the arm in the /,v and /,b maps presented
earlier, focusing on the largest ones: those with linear dimensions of 50 to
100 pc and masses greater than lO 5 M e. The significance of these objects
as galactic spiral tracers, although suspected almost since the discovery of
giant molecular clouds, has become clear only in the last five or six years,
and owes its recognition largely to extensive, well-sample CO surveys made
with the Columbia Northern Millimeter-Wave Telescope. As the study of
molecular clouds associated with such nearby star-forming regions as Orion
began to provide evidence for the existence of large cloud complexes ( e.g.,
Tucker eta/. 1973; Kutner eta/. 1977), the prospect was raised that giant
molecular clouds, as represented by the local examples, are commonplace
throughout the Galaxy. Being closely associated with Population I material,
giant molecular clouds were obvious candidates for spiral arm tracers. A
mass of 106 M e found for the giant cloud complex associated with M 17
(Elmegreen and Lada 1976) further suggested that giant molecular clouds
are among the most massive objects in the Galaxy. Although there was
evidence from early galactic CO surveys that perhaps as much as 50% of the
total molecular cloud mass in the Galaxy resided in a relatively few clouds
more massive than 106 Me ( e.g., Solomon eta/. 1979), the small beamsizes
and resultant severe undersampling of these early surveys all but precluded
the systematic study of such massive clouds as distinct objects, and hence
of their galactic distribution. By 1980, CO surveys undertaken with the
Northern Millimeter-Wave Telescope had covered enough of the first and
second quadrants with sufficient sampling to reveal a string of molecular
59
cloudsthattracethe Perseusarm, as well as to identifythe molecular
counterpartsofthe classic21-cm arms (Cohen eta! 1980). With the
completionof these surveysitbecame possibletosystematicallysearch
the innerGalaxy CO emission fordistinctgiantcloud complexes and to study
theirdistributionon a galacticscale.Using the Columbia CO surveyof the
firstquadrant,Dame (1983;alsosee Dame eta/. 1985) identified25
molecularcloudcomplexes more massive than5 xlOs Me, including13 more
massive than I06 M®. These objectswere found tobe excellentspiralarm
tracers,with even thosecloudsatvery greatdistancesstandingout Inthe
dataas discretefeatures.
The approach takenby Dame isa familiarone inastronomy: toassume
thatthepropertiesof a locally-observedclassof objectscan be used inthe
globalstudy of these objects.We adopt the same approach inthischapter,
usingthepropertiesof locally-observedgiantmolecularcloudsto aid inthe
identificationof the Carinaarm clouds.Prototypesofgiantclouds,such as
thoseassociatedwith W 44 and NGC 7538, have been discussedelsewhere
(see e.g.,Dame 1983 and Dame eta/. 1985),and furtherdiscussionhere of
localexamples isomitted. Itisshown below thatthe Carinaarm cloudsnot
onlydelineatethe arm overnearly25 kpc -- not a surprisingresult
consideringthe prominence of the loopInthe /,vdiagram -- but when
viewed inthe planeof the Galaxytogetherwlth the largestcloudsinthe
firstand second quadrantstheysuggesthow theCarlnaarm connectswith
the arms inthe firstgalacticquadrant.
First,the generalprocedurefor identifyingand locatingthe cloudsIs
described,then,as an example, the largecloud associatedwith the
T1CarinaeNebula Isexamined indetail.Next,from a catalogof43
molecularcloudsidentifiedbetween I = 270" and 336", a subset of those
6O

generally more massive than l O5 M(_ is used to trace the Carina arm in the
plane of the Galaxy, and the implications for large-scale galactic structure
are discussed. Finally, a brief description is given of each cloud in the
catalog between / = 270" and 300".
A. Identification of the Clouds
The Carina arm loop in the /,v diagram consists of about 35 strong,
fairly isolated emission features that resemble the largest clouds in the
first and second quadrants, with velocity widths of _,10 km s-1 and linear
sizes (from their angular extents and estimated distances) of _,100 pc.
Based on these discrete features picked out from the /,v diagram, a
preliminary list of cloud identifications was compiled. In the far side of
the arm most of the clouds are not connected even at the lowest contour
level; usually each such isolated feature was considered a separate cloud.
In the near side of the arm collections of peaks, as seen for example
between / = 291" and 296", were tentatively considered as cloud
complexes, pending identification of associated optical objects with known
distances. Cloud identifications in the tangent region were least certain
and still remain subject to revision. Clouds interior to the loop, except for
clearly local ones, were included in the preliminary list as well.
Cloud identifications were also made using the full resolution spatial
maps in Figures IV-3a-d and a set of spatial maps smoothed to 0.25" (Figs.
V-- I -..J_,,',l _ TI_^I _ U,. I I1_ smoothed maps provided higher signal-to-noise, and
highlighted large clouds in the near side. Again, emission features were
considered clouds or cloud complexes if they resembled in spatial
appearance giant clouds in the first and second quadrants. In general, the
61
same cloudsand cloudcomplexes were identifiedinboth the /,vdiagram and
the spatialmaps, supportingthe initialidentifications.Ina few cases the
spatialmaps showed thatseparatecloudsat the same longitudehad been
combined Inthe /,vmap as a resultof integrationacross the plane.For
example,at I _ 283" the two peaks atb = +1"and b = -1.5"inthe near
sideofthe arm form a singlepeak at I = 283", v = -15 km s-iinthe /,v
map. Comparing FiguresV-la and b indicatesthatthe featureatb = -1.5"
iscontinuouswith the tangentregionemission,whereas the featureat
b = +I" shows no continuationintothe tangentregionmap; these two
featureswere thenconsideredtobe distinct.
The frequentassociationof giantmolecularcloudswith H Ifregions,
young starsand OB associations,and otherPopulation Imaterialprovided
an importantcriterionforrefinementof preliminarycloud identifications,
particularlyinthe nearsideand the tangentregion.The associationof
theseyoung objectswith molecularcloudswas determined on the basisof
closespatialand velocityoverlap.Occasionally,clearevidenceof
interactionbetween themolecularcloudand an adjacentH IIregion
providedan additionalargument for association.Insome cases,such as the
TlCarinaemolecularcloud(discussedbelow),an apparentgroupingof CO
peaks inthe /,vand spatialmaps couldbe identifiedas a singlecloud
complex based on associationwith variousopticalobjectsknown to be at
the same distance.At thesame time, theseopticalobjectswhich have only
theirsimilardistancesincommon, couldbe shown to be physicallyrelated
throughassociationwith a parentcloud.
The finallistof identifiedcloudsisgiven inTable V-2 and their
runningnumbers are indicatednear theirlocationson the spatialmaps in
FiguresV- 1a-d.
62

Distances:
Distances to the clouds were usually determined either klnematlcally
or, when possible, by association with optlcal objects of known distance,
preference being given always to optlcal distances. It was possible to
assign optical distances to two of the tour clouds identified in the near
side; the other two were placed klnematlcally on the subcentral locus.
About halt" the clouds In the tangent reglon of the arm could be glven optical
distances; for those glven far kinematic distances, the near-far amblgulty
was resolved by one of two ]lnes of evidence: 1) foreground absorption or an
associated H II reglon where the absorption line veloclty Is more extreme
than the H II reglon velocity, Indicating that the H II region (and the cloud)
is on the far side of the subcentral polnt; or 2) the implled radius of the
cloud at the far distance was clearly favored over that at the near dlstance
by the power law relation between cloud radius and cloud velocity width
derived by Dame eta/. (see "Masses" below for the definitions of cloud
radlus and veloclty wldth). In the far side of the arm where there Is no
kinematic distance ambiguity, all but two clouds (placed optically) were
given kinematic distances. A few clouds near zero veloclty at longitudes
above the tangent reglon were placed according to the radius-line wldth
relation, the proximity to the b = 0" plane, or by the probable association
wlth local dust clouds.
63

Masses:
The mass of each cloud, Mco, was determined from. its CO luminosity,
using expression (IV-!) to convert from integrated CO intensity to H2
column density, and a mean molecular weight per H2 molecule of 2.76 mH
(Allen 1973). Denoting the total Integrated emission over the face of the
cloud in units of K km s-1 as Ico, and the heliocentric distance to the cloud
In kiloparsecs as r, the total mass of a molecular cloud (including helium)
can be expressed as:
Mco = 1.9x 10³ Icor2 Me. (V-I)
Icoisobtainedby integratingthe emission over the fullvelocitywidth of
the cloudas deduced from the /,vdiagram,and over the faceof the cloudas
definedinthe spatialmaps.
Forcomparison,a virialmass, M_r, foreach cloudwas computed by
assuming the cloudtobe Invirlalequilibrium,supportedagainstgravityby
Internalmotions. Inthe case ofa uniformdensitysphere wlth radlusR,
totalmass M, and 3-dimensional(Isotropic)velocitydispersion(_,the virial
theorem can be writtenas:
M(52 - 315 GM2/R - O, (V-2)
assuming magnetic pressureand tidaldisruptionare negligible.5inceM Is
the mass of a cloud invirialeqilibrium,we write M = M_r; for thecloud
radiuswe take R = Rerr-=_'(A/Tr),where A isthe projectedarea ofthe cloud
(inpc2).The isotropicvelocitydispersion,O, and the observedvelocity
64
width of the cloud (in km s-+), Av, as measured from the FWHM of a Gaussian
fit to the sum of all spectra covering the cloud, are related by:
= [3/(2/n2)]1/2 AV/2.
Solving equation (V-2) for M_r and substituting more convenient units then
gives:
M_r = 210 Rerr AM2, (V-3)
where M_p ls in solar masses, Rerr ls In parsecs, and AV ls In km s-;. If the
observed velocity width includes contributions due to expansion or
contraction of the cloud, the expression for o' gives an erroneously high
velocity dispersion, and M_p will then be an overestimate of the actual
mass. Under the assumptions above, the viriai mass is thus an upper limit
to the cloud's true mass.
B. The TI Carinae Molecular Cloud
I. Identificationof the Cloud Complex
The generalprocedureused foridentifyingmolecularcloudsinthe
survey isillustratedby consideringthegiantmolecularcloudassociated
with the TtCarinaeNebula,one of thebrightestgiantH iiregionsinthe
Galaxy,and certainlyone of themost interestingobjectsinthe Carinaarm.
InFigureV-la, a stringof fivecloudsisseen lyingapproximatelyon a line
from I = 285",b = 0.5"to I= 288",b = -I" Similarinspatial
65

appearance to, for example, a 106 Me complex in the Scdtun, arm designated
[22,53] in Dame et el., this grouping of clouds can also be seen in the /,v map
(Fig. 111-7) bewteen ! = 285" and 288" in the near side. (The cloud at
! - 288", b = 1.5" in Figure V-la blends with the rest of the group in the
/,v map.) To determine if it is indeed part of a single cloud complex, known
optical objects in this region with distances on the near side of the arm
were identified, and evidence for the association of these objects with the
molecular emission was sought.
Figure V-2 shows a blow-up of the near side of the arm (full resolution
from Fig. IV-3a) overlaid on a mosaic of the ESO J plates of this region. The
Carinae Nebula, also known as NGC 3372, is the bright object between
/ = 287" and 288" in the figure. Its position at the edge of the cloud is
similar to that of many other H I I regions associated with giant molecular
clouds, such as Orion ( e.g Kutner et aZ 1977), W3, W4, and W5 (Lada et el.
1978) and the Rosette nebula (Blitz and Thaddeus 1980). The positional
coincidence is strong evidence for an association of the molecular cloud
with the nebula. Radio recombination line measurements of the nebula
indicate that its mean velocity is -20 km s-1 while the mean velocity of the
molecular cloud from its CO emission in this region is -19 km s-1, making
the association almost certain. The optical distance to the Carina Nebula
being _2.7 kpc ( e.g., Walborn 1973), this is taken to be the distance to the
molecular cloud. The relationship of the cloud to the nebula is discussed in
detail below.
At / = 286.2", b -- -0.2" the cluster NGC 3324 can be seen, its location
between two CO peaks and along a CO ridge suggestive of association with
this molecular gas. The cluster's age is _ 2.2 x 10⁶ years (Clarla 1977) and
it contains the 06-7 star HD92206 (Goy 1973). The H_ region G 31, also
66

seen inthisdirection,apparentlyisionizedby the brightstarsinthe
cluster(Gum 1955). NO directvelocityinformationisavailableforG 31,
but Humphreys (1972) gives -21.2km s-ias thevelocityofthe cluster
based on measurements ofstellarvelocities(usingthe notationafter
Hoffleit(1953),Humphreys referstoG 31 as H 31).The good agreement in
velocitybetween the clusterand the molecularcloud,coupledwith the
spatialcoincidence,againindicatesthatthe two are associated.Various
distancestoNGC 3324 and (531 range from 1.9to3.28kpc (Humphreys
1976; Hoffleit1953;Georgelin1975; Turner eta/.1980; Claria1977;
Moffat and Vogt1975), the averagebeing2.7kpc,which isthe distanceto
the CarinaNebula.A connectionbetween the CO emission seen toward the
CarinaNebula and the emission toward NGC 3324 seems likely,since in
each case the opticalsourcesareassociatedwith the coincidentmolecular
gas and both sourcesare at the same distance.
Another cluster,NGC 3293, iscoincidentwlth the Ho_regionG 30 and
sitson a steep ridgeofCO emissionat I= 285.9",b = O.1°.This clusteris
olderthan NGC 3324 -- about 5- I0 x106years accordingtoTurner etaL
(1980) and 5tothers(1972).The velocityof the clusteris-25.5 km s-i
(Humphreys 1972),ingood agreement with the molecularcloud'svelocity.
Distanceestimates againaveragearound2.7kpc (e.g_ Humphreys 1972;
Turner eta/.1980),and we concludethatNGC 3293 isalsoassociatedwith
thesame cloudas theCarinaNebulaand NGC 3324.
Based on Itspossibleassociationwith the clusterIC 2581, againat
about 2.7kpc (Turner1978),theCO cloudat I= 285.2°,b = 0.4"may alsobe
partof thissame cloudcomplex. At I = 284.7°,b = 0.I',IC 2581 sits
near theedge of thlscloud;the clusterhasan age of about IOTyears
(5tothers1972). The velocityof the clusteris-1:3I<ms-i(Humphreys
67

1972) whereas the strongest emission from the clump lies between -23 and
-21 km s-i (see Fig. V-4d), so the agreement isnot so good as inthe three
cases justconsidered.Nevertheless,inview ofthe cluster'sdistanceand
proximityto a CO cloud atthe same velocityas the restofthe cloud
complex,itseems likelythat IC 2581 isassociatedwith the CO cloudand
thatthecloud ispartof thesame complex.
Allthe emission from / = 284.7" to289" alongthe plane,then,
apparentlyforms a singlegiantmolecularcloudcomplex. At a distanceof
2.7 kpc,itsprojectedlengthis~150 pc,typicalforthe largestcomplexes
foundinthefirstand second quadrants.Turner etaL (I980) suggested
IC 2581, NGC 3292, NCG 3324, and the clusterswithinthe CarinaNebula
(Tr 14,15, 16,and Cr 228),are allgeneticallyrelated,based on the
similardistances,the sequentialorientationnearlyalongthe galactic
plane,and the apparentage gradientfrom theyoung clustersinthe Carina
Nebulatothe olderIC 2581. The largecloudcomplex we have identifled
confirms thispictureby revealingthe common parentmaterialof these
clusters.
Mass:
Using expression(V-I),theCO mass of the cloudcomplex was found to
be 6.7x 10⁵ Me, somewhat smallerthan the largestmolecularcomplexes in
the firstand second quadrants.With a fullvelocitywidth,AV, of9.9km s-i
and an effectiveradius,Reinof 66 pc,thevirialmass of the cloudcomplex
from expression(V-3) is i.4x i06 Me.
68

2. The T1 Carinae Nebula and the Molecular Cloud
We now compare the distribution and kinematics of the molecular gas
just in the vicinity of the T1Carinae Nebula with what Is known about this
spectacular object from observations at optical, radio, infrared, ultraviolet,
and X-ray wavelengths. Taken together, these data suggest a simple,
preliminary model for the geometry and interaction of the gas and stars in
this region. In the following discussion we first establish the spatial
relationship and relative motions of the H II region and its constituents, and
the molecular cloud, showing that a portion of the cloud is apparently
expanding away from the main body. Then giving brief consideration to the
posslble dynamical relationship between the H II region and the expanding
cloud fragment, we show that sources within the H II region can supply
sufficient mechanical energy to drive the expansion.
The TI Carlnae Nebula covers about 4 deg2 centered near / = 287.5",
b = -0.5" (Fig. V-2); dark dust lanes are seen to cross the bright central
portion of the nebula. In the immediate vicinity of the bright gas the dust
lane is vee-shaped, but it extends beyond the H II region in the direction of
NGC 3324 and NGC 3293. For the purposes of this discussion, the
apparently connected dust lanes are divided into four pieces as follows (see
the schematic diagram in Fig. V-3): 1) eastern leg, extending from
I = 287.8", b = -0.4" on the eastern side of the bright gas to / = 287.6",
b = -0.7" at the vertex of the vee; 2) western leg, extending from the
vertex of the vee to / = 287", b = -0.5", just beyond the bright gas to the
east of this dust (the eastern leg and the western leg comprise the vee); 3)
western extension, the continuation of the western leg to I = 286",
69

b _, -0.3°,the region below NGC 3324 and NGC 3293; 4) northern
extension, passing between NGC 3324 and NGC 3293.
Near the nebula'sbright center is a large collectionof early type stars
making up the young clusters Tr 14 and Tr 16. Tr 16 (I = 287.61 °,
b = -0.65°) iscentered just above the vertex of the vee-shaped dust lane,
and Tr 14 (I = 287.42 °,b = -0.58") sits about 5' east of the western leg.
A far-infraredcontinuum peak in the western leg is likelydue to the heating
of the dust by Tr 14 (Harvey et al 1979). Among the many young stars
found in these two clusters are at least 16 0 stars, Inlcuding five classified
by Walborn (1971; 1973) as 03 V. Another young duster, Cr 228
( I = 287.52", b = -1.03°),seen toward the bright gas beneath the vee,
contains 6 0 stars (Walborn 1973). All three clusters are at about 2.7 kpC
(Turner eta/. 1980; Feinstein et aL 1973, 1976; Walborn 1973) and have
ages less than 3 x10⁶ years, perhaps as young as 106 years (Feinstein eta/.
1976; Turner eta/. 1980). Tr 15 (! = 287.40 °,b = -0.36°),a cluster north
of Tr 16, also at about 2.7 kpc, may be slightlymore evolved than the
others (Feinstein et aL 1980; Walborn 1973). This large concentration of
young stars,the coincidence with the bright H IIregion,and the
identificationof an associated molecular cloud provides strong evidence for
the true spatial localizationof these clusters in a massive star-forming
region.
A good correlation is apparent between the obscuring dust and the
observed molecular cloud. A small CO peak can be seen in Figure V-2 at
l = 287.8", b = -0.8 ° coincident with, and having the same general shape,
as the eastern leg. A bright peak at / = 287,5 °, b = -0.6" marks the
boundary between the bright gas and the western leg. 5ome of this intense
CO emission overlaps with the western leg, indicating a connection between
7O

the CO and thisdust,but a largeamount ofthe moleculargas isspatially
coincidentwith the brightgas to the leftof the western legand must
thereforecorrespondto molecularmaterialbehindthe nebula.The CO
emission at ! < 287" mimics thegeneralshape of the western and the
northern extensions. Physical contact between the ionized gas and the
western leg is apparent from the existence of bright rlms along the
projected boundary. This boundary is also marked by an enhancement of the
diffuse X-ray emlsslon that pervades the entire nebula (Seward and
Chlebowskl 1982). The COpeak seen In thls direction provides further
evidence for the interaction between the lonlzed gas and dust, and so
between the ionized gas and the molecular cloud.
Two radio continuum sources, Car I and Car I!, are observed in the
nebula. Observations at 3.4 cm, 6 cm, 1! cm, and 21 cm (Huchtmeler and Day
1975; Gardner et al 1970; Beard and Kerr 1966) confirm that both are
thermal. Car I peaks at the interface of the brlght gas and the western leg,
about :3.5' from TR 14. High resolution observations at 1415 MHz show
Car I to be elongated parallel to the western leg dust lane, suggesting the
source marks an ionization front at the gas-dust boundary (Retallack 198:3).
Car II peaks about 6' west of Tr 16, above the vertex of the vee. Radio
recombination lines throughout the nebula show a mean velocity of about
-20 km s-I. In the immediate vlclnlty of Car II, double lines wlth
separations of up to 45 km s-1 are seen; the overall distribution of
recombination lines suggests the presence of an expanding shell of lonlzed
gas (Huchtmeier and Day 1975; Beard and Kerr 1966; Wilson eta/. 1970).
The OH and H2CO absorption line measurements of Gardner et a/ (197:3)
and Dickel et al (1973) identified the vee-shaped dust lane as the molecular
cloud In the T1 Carinae Nebula. Dickel and Wall (1974) demonstrated the
71

physicalassociationof the dust(inthevee) with the moleculargas by
comparinga map of Av inthe nebula(derivedfrom the ratioof the 5 GHz
continuum intensityto the Ho<intensity)to theOH opticaldepth map of
Gardner etaL The mean dustvelocityof -24 km s-ifrom theOH
measurements shows the neutralmaterial inthevee isblueshiftedwith
respectto thebulkof the ionizedgas behindIt.A somewhat more extensive
molecularcloudwas revealedby the CO (J = 2 -_i)observationsof de
Graauw etal (1981),who found two CO sources,one associatedwith what
we have calledthe easternleg,the othercorrespondingto the western leg
plusmaterialbehindthe ionizednebula,east of the western leg.They
proposedthatnear the lineof sightto Car If,the molecularcloud lies
below and on the nearsideofTr 16 (correspondingtothe easternleg),and
inthedirectionofCar I,the cloudstretchestothe west ofTr 14 and bends
aroundtothe farsldeof the nebula.Itwas evidentto de Graauw eta/.that
the molecularcloudextendedbeyond the limitsof theirmap, making some
of theirconclusionstentative.The CO observationspresentedhere confirm
the essentialfeaturesof theirmodel and place itinthe contextofthe large
cloudcomplex inthisregion.
The CO emission as a functionofvelocitythroughthe cloudfrom -31
to -I0 km s-iisshown ina set of eightspatialmaps inadjacent,2.6km s-i
(two channels)wide velocitywindows (Figs.V-4a-h). Inconjunctionwith
the optical,OH absorption,and recombinationlineobservations,thesemaps
demonstrate thatradialvelocityisa good indicatorofposition(alongthe
lineofsight)inthe cloudinthe vicinityof theCarinaNebula.The most
intenseCO emission liesbetween -20 and -18 km s-i(Fig.V-4e),the same
as themean velocityof the H IIregion.Inparticular,the emission between
I = 287" and 287.5"being spatiallycoincidentwith the brightgas,must lie
72

behind the H II region. The CO counterpart of the vee, seen most strongly
between -28 and -23 km s-1 (Figs. V-4b,c), clearly represents only a small
part of the whole cloud complex (accounting for less than l O_ of the total
mass, as shown below). This molecular feature or filament, as it wlll be
referred to here, corresponds to the structure identified by Gardner et ai.
(197:3) in OH absorption. As we approach the mean cloud velocity of
-19 km s-1 from -30 km s-I the portion of the filament corresponding to the
eastern leg disappears, while, between -26 and -20 km s-l, the COpeak near
the western leg shifts from a region of hlgh optical obscuration to a line of
sight coincident with the brightest nebulosity. Thus, the filament on the
near slde of the nebula Joins the more massive portion of the cloud on the
far side in the region to the west of Car I. The most negative velocities
correspond to material on the near side of the cloud, 1:e.,the obscuring dust
lanes, while more positive velocity material lies next to, and behind the
nebula. The difference between the mean velocity of the filament and that
of the rest of the molecular cloud is ~7 km s-1.
A schematic representation of the molecular cloud and its surroundings
is shown in Figure V-5. The expanding H II region sits at the eastern edge
of the cloud, wlth a portion of the cloud seen In projection behind the H II
region (near Tr 14). The filament passes in front of the ionized gas and,
west of Tr 14, wraps around the nebula to connect wlth the main body of
the cloud. The far-infrared peak to the west of Tr 14 arises in this region
where the filament joins the rest of the cloud. This picture of the
molecular cloud cradling the nebula was also deduced by de Graauw et a/.,
but because most of the cloud lies beyond the boundaries of their map, they
could not recognize that the filament represents only a small portion of the
total cloud. Since our observations show that the mean velocity of the
73

entirecloudisthe same as the H IIregionwhile the filamentisblueshifted
with respectto the restofthe cloud,itislikelythatthe filamentis
expandingaway from the main body ofthe cloud.The situationresembles
thatinthe Pelicannebula(Ballyand 5coville1980),with an H Ifregion
forminginsidea molecularcloudand then breakingout intothe intercloud
medium when the expanding5tomgren sphere rupturesthe edge ofthe cloud.
The questionarisesas towhether the motion of the filamentcan be due to
sourceswithinthe nebula.BriefconsiderationIsnow given totwo possible
mechanisms: stellarwinds,and the rocketeffect.The rough calculations
made below placeusefulconstraintson our preliminarycloudmodel and are
not intendedto be a rigoroustreatmentof the dynamics within the cloud.
StellarWinds:
Observationsofopticaland ultravioletInterstellarabsorptionlinesIn
the directionof severalstars Inthe nebulashow velocitiesrangingover
550 km s-i(Walborn 1982; Walborn and Hesser 1982; Laurent eta/.1982),
indicatingthatthe starsare injectinga lotofmechanical energy intothe
surroundingmedium. Assuming the absorptionlinesariseinstellarwinds
and an age of --3 x 10⁶ years for the clusters, Walborn (1982) estimated a
total energy output of :3 x 1051 ergs from the known 0 and WN-A stars. The
observation of diffuse X-ray emission throughout the Carina Nebula can
likewise be interpreted as a result of stellar winds with a similar energy
input (Seward and Chlebowski 1982). To compare the mechanical energy
from stellar winds with the kinetic energy of the expansion, the COmass of
the filament is determined by integrating lts emission over velocity. This
integration, from v = -31 to -24 km s-1, yields a COmass of
74

2.2 X10⁴ Me, only 3% of the total COmass found above for the entire
complex, so the filament is really only a small part of the whole cloud.
Taking the expansion velocity to be 7 km s-I and a mass of 2.2 x10⁴ Me
yields a kinetic energy of ~1049 ergs, well within the energy available from
stellar winds.
The energy supply being sufficient, a further constraint is the
momentum or the filament, Pnw,me,t = 3.1 x1043 gm cm s-1. For a single star
with a constant mass loss rate, all'l/dr, and a constant wind veioclty Vw, the
momentum supplied directly from stellar mass loss to the surrounding
medium over a time _: is simply Pin -- (dtl/dt) vw_:. Waiborn (1982) tabulated
the numbers of 0 and WN-A stars in the Carina Nebula along with the mass
loss rates and wind velocities (taken from the literature) for the various
spectral types. Following Walbom, we take the age of the clusters to be
3 x10⁶ years and assume the WN-A and luminosity class I stars have existed
as supergiants for 105 years. The total momentum input from stellar winds
is then found to be P_n-- 1.9 x 1043 gm cm s-l, only marginally enough to
account for Prilament.The momentum that can actually be transferred
directly from the wind to the filament ls P_nreduced by the fraction, f, of
41Tsteradians subtended at the stars by the filament. From the spatial map
(Fig. V-2) the projected area of the filament is approximately 1000 pc2;
taking this to be its true area and assuming a distance of 20 pc between the
stars and the filament (the projected separation between the tip of the
eastern leg and the COpeak west of Tr 14) then gives f = 0.2. Therefore
the filament could have acquired a momentum of 3.8 xlO 42 gm cm s-I from
stellar winds, about a factor of ten below its observed value.
The effect of a strong wind from a star on the surrounding medium has
been investigated by Castor et a/ (1975). They show that an expanding
75

cavityor bubbleforms aroundthe star,bounded by a thinshellof material
swept up by theexpansionintothe ambient medium. Between the shelland
the cavityisa layerof hot,shockedgas which acts likea pistondrivingthe
shelloutward. The momentum ofthe shellcan be greaterthan thatsupplied
directlyby the wind. To examine thispictureinthe contextof the T1
Carinae molecular cloud, the ambient medium with density Po is taken to be
the molecular cloud, with the filament corresponding to the shell. Castor et
eL give for the radius of the shell:
Rs(t) = 0.76 [(dM/dt)vw2/(2po)] 1/s t3/5.
Differentiatingwith respectto time,and Identifyingthevelocityof the
shell,vs,with thatof the cloudfilament,vc,we have:
vc= dRs(t)/dt= 2.7xlO3 [(dMldt)vw2 no-i_{-2/5km s-i,
where dM/dt is in units of Me yr-I Vw is in km s-1, t is in years, and no is
particle density in cm-3; a mean molecular weight per particle of 2.76 mH
(Allen 1973) has be assumed. As a lower limit on no we take 8 cm-3, the
average density in the entire cloud obtained from Mco and R.rr (Section B. 1
above). 5ince the density in regions of the cloud where stars are forming
will be higher, an upper limit for no is taken to be the density in the
filament. Assuming the filament is sheet with area 1000 pc2 and thickness
5 pc, and mass 2.2 x ! 04 Me, we have no = 80 cm-3. The tabulation in Walborn
(1982) is used to estimate an average mass-loss rate, <dM/dt>, and average
wind velocity, <Vw>,for the young clusters in the Carina Nebula, giving
<dM/dt> = 1.1 x lO -5 Me yr-1, and <Vw>= 2900 km s-l. Substituting these
76

values Into the expression for the velocity of the fllament yields:
v¢ - 7 - 11 km s-1, In good agreement with the observed velocity of the
filament re]atlve to the mail_ body of the T1 Carlnae molecular cloud.
We conclude that, while direct transfer of stellar-wind momentum to
the filament cannot account for the fllament's observed motlon, the
expansion of a wind-dMven bubble in the cloud easily explains the moton of
the filament with respect to the main body of the cloud.
Rocket Effect:
As discussed by Bally and 5covllle ( 1980, and references therein),
when an H II region bursts through the edge of a molecular cloud from
within, the resulting depressurlzation wlll tend to Increase the flux of
lonizlng radiation at the remaining boundary between the molecular cloud
and the Ionization front, but the density of Ionlzed gas between the stars
and the cloud will be essentially unchanged. Ionized molecular gas at this
boundary wll] stream away from the cloud, accelerating the cloud llke a
rocket ( e.g., 5pitzer 1978). If the cloud has mass M, velocity re, and loses
mass at a rate dM/dt, then It accelerates according to
ve (dM/dt) = M (dye/dr), (V-4)
where ve, the exhaust velocity of the freshly ionized gas from the cloud, is
taken to be the Isothermal sound speed in the H II region, ~ 10 km s-1.
Integrating this equation gives
v¢= ve In(Mo/M)÷ Vo, (V-5)
77

where Mo and Voare the initial mass and velocity of the cloud. Assuming
Vo = O, taking M to be the presently observed mass, and estimating I"1o,we
can evaluate the rocket effect for the fl]ament by comparlng the predicted
cloud velocity with the observed velocity.
The Initlal mass of the cloud can be estimated as follows. The flux or
ionization off the back of the filament is nil, %, where nil, is the density of
the ionized gas in the H II region at the filament. The filament then loses
mass at a rate
dMldt = AnH. %,
where A = !000 pc 2 is the area of the filament. As noted by Bally and
5coville, nHi I is about the same before and after the H II region bursts
through the edge of the cloud and, at radius r of the H II region, is given by
nHiI = [3Q/(4Tfo_2)r3)]l/2,
where Q Is the emlsslon rate of Lyman continuum photons from the lonlzlng
stars, and o42) Is the recomblnatlon coefflclent to all levels wlth n > I. For
the Carlna nebula Smlth etal (1978) glve Q = 13 xlO 49 s-i for the
continuum sources Car I and Car II. Considering only ionlzed hydrogen and
assuming a temperature for the H II reglon of ]04 K then, at the fl]ament
(r = 20 pc, as above), nil, _ 21 cm-3, and
riM/tit= 5.3xl0-_M_ yr-I
78

Assuming this rate to be constant, then in3 x106 years the filamenthas
lost_ 1.6x10⁴Me, and itsinitialmass was thereforeMo = 4.7x10⁴Me.
Equation(V-5) thengivesvc = 4.I km s-i,which iscloseto the filament's
presentlyobservedvelocityof 7 km s-1relativethe restof themolecular
cloud.We concludethatthe rocketeffectisalsoapparentlycapableof
explainingthe observedmotion of the filament.
The actual H il region-molecular cloud interaction is undoubtedly more
complicated than so far assumed, but the basic picture of the H II region
breaking through the cloud's surface and ejecting neutral material (the
filament) outward offers a plausible explanation for the observed motions
of the molecular cloud and the ionized gas. It is interesting to note that for
the parameters used above, r = 20 pc and v¢ = 7 km s-1 the expansion time
scale is about 3 x10⁶ years, in good agreement with the estimated age of
the young clusters that power the H II region. The possibility that the
expansion of the filament is driven by a supernova was not considered here
because no confirmed SNR exists in the vicinity of the Carina Nebula.
Although the small nonthermal radio source G286.5-0.5 is claimed to be a
supernova remnant (Jones 1973; Becker eta/. 1976; Elliot i 979), Seward
and £hleblowski (1982) pointed out that, at the distance of the Carina
Nebula, the source's X-ray luminosity ls too low for a SNR.
3. Star Formation Efficiency In the 11Carlnae Molecular Cloud
The interaction between the TI Carinae Nebula and its associated
molecular cloud offers an outstanding example of the destructive effect
that massive stars can have on the cold, quiescent gas from which they
79
form. By dispersing the molecular cloud, massive stars can disrupt star
formation in their Immediate neighborhood, leading to a low overall star
formation efficiency in the cloud. In thls section the star formation
efficiency,5FE - M.I(M. + Mcloud),isdetermined forthe entire
T[Carinaemolecularcloud.The result,5FE = 0.02,Illustratesthatthe
efficiencycan Indeedbe low inlargecloudsthatspawn massive stars,and
providesa check on the starformationefficienciesrecentlydetermined for
InnerGalaxy cloudswhere starformationIsgenerallyhighlyobscured.As
definedhere,the starformationefficiencydepends on the totalmolecular
cloud mass, Mdoud , and the total mass of stars associated with the cloud, M..
For Mdoudthe CO mass determined in Section B. 1 above is used. The
determination of the total stellar mass Is the maln focus of the following
discussion.
The initial mass function (IMF) of Miller and 5calo (1979),
t,( logm) = (exp[-1.09( logm + 1.02)2], (V-6)
where ( is a proportionality constant, can be used to estimate M,. The main
drawback of this approach ls that, being derived from field stars, the
Mlller-Scalo IMF Is least certain at the high-mass end, so Its appllcatlon to
the young clusters in the T1 Carinae Nebula may not be appropriate. For
example, Garmany et a/ (1982) find that the slope of the IMF for early-type
0 stars is less steep than the the Miller-Scalo IMF, with a higher proportion
of massive stars in young clusters than in the general field. It is possible
too that the IMF varies from cluster to cluster. However, because the IMF
method is the only way at present to account for the Intrinsically faint, low
mass stars which (collectively) contain most of the stellar mass, we adopt
8O

thatapproach here,making some attemptto alleviatethe uncertaintyatthe
high-mass end.
The unusuallylargenumber ofmain sequence0 starsobserved Inthe
CarinaNebula suggeststhata substantialfractionof the existingmassive
starscan be seen,and theirtotalmass obtainedsimply by countingthem.
We assume thisto be the case and relyon the IMF onlyfor the lessmassive
stars.Specifically,the observedstarsarebinnedinlogarithmicmass
intervalsevery/klogm - O.I (where m isinsolarmasses) beginningwith
the bincenteredat /Ogmrr_;themass, /ogmc,at which the countsappearto
fall off is taken as the dividing line between those stars (m 2 mc) which are
completely tallied and those (m < mc) which are not. A discontinuity in the
slope of tiN/d(Iogm) indicates where the counts become incomplete clue to
selection effects since, if all the stars present could be seen, then the
counts would continue to rise with decreasing mass. The IMF contribution
to the total mass is obtained by integrating the IMF between logmc and
lOgmmin, where mmin is taken to be O.1 Me, and the proportionality constant
in the Miller-5calo IMF follows from fixing the computed number of stars in
A/ogm about logmc to the observed number. The total stellar mass is then
the IMF contribution plus the total observed mass for stars with m > mc.
Table V-1 lists all the known early type main sequence stars in the
clusters Tr 14, Tr 16, and Cr 228. The primary references are Walborn
(1973), and Levato and Malaroda (! 981; 1982); these sources include all
cluster members with known spectral type tabulated elsewhere in the
literature. To convert from spectral type to mass, a graph (not shown here)
of log(M/Me) versus logTef r was constructed using the empirical relation
between mass and effective temperature given by Habets and Heintze (1981)
for spectral types later than (and including) 08.5 V. The graph was extended
81

to 03 V, the assumed most massive type in the Carina Nebula, by connecting
the points [ IogTerr, log(MIMe)] for the 08.5 V and later types and a single,
corresponding point for an 03 V star with a smooth curve. Conti and
Burnichon (1975) give IogTerr = 4.74, and M = 120 Me for an 03 V star; this
mass is highly uncertain, but probably reasonable for the present purposes.
Using the effective temperatures for spectral types 08.5 V and later from
Habets and Heintze, and from Contl and Burnlchon for earlier types, the
masses of the stars in Table V-I were read off the logTef r - log(M/Me)
graph.
The mass spectrum of the stars In Table V- 1 ls shown In Figure V-6;
the solld line shows the logarithm of the number of stars In each mass bln,
while the dotted line shows the (log of the) cumulative number as less and
less massive stars are considered. If the five 03 V stars [ log(M/Me) = 2.08]
are excluded for the moment, a gradual (albiet uneven) rise in number with
decreasing mass can be seen between log(M/Me) = 1.85 and 1.15. With the
stellar data available It Is not possible to say whether the apparent drop In
the counts for log(M/Me) < 1.15 represents the expected turnover as
Intrinsically fainter stars are observed or Just a fluctuation slmllar to the
ones seen at log(M/Me) > 1.15. Since member stars that are much less
massive than log(M/Me) = 0.95 would be difficult to distinguish from field
stars, it is likely that the turnover does occur at or near log(M/Me) < 1.15.
Therefore, we assume that all the existing stars in the Carina Nebula for
which log(M/Me) 2 1.15 (Including now the five 03 V stars) are accounted
for, and take Iogmc = 1.15.
From the IMF, the number of stars with mass between ml and m2,
N(mi,m2), is just
82

N(mi,m2) - [_(/ogm)d/ogm, (v-7)
and the total mass between ml and m2, M(mi,m2), is
M(mi,m2) = i'm((/ogm)d logrn, (V-8)
where the integrals extend from ml to m2.
quantities can be written,
For theMiller-ScaloIMF these
and
ml
N(ml,m2) = 0.85( err[1.04(logm+ 1.02)]
m2
ml
M(ml,m2) = 0.27 ( err[1.04/ogm-O.04]
m2
(V-9)
(V-lO)
where erf is the error function. As mentioned above, t, is set by
fixing N(m_,m2) to the number of stars actually observed between
/ogml = /ogmc+ (A /ogm)/2 and /ogm2 = /ogmc- (A /ogm)/2. In this
interval 12 stars are observed, yielding ( = 1.g x 104, and the IMF
contribution to the stellar mass, M_rF, is then:
MiME --M(mc,O.1Me) = 104 Me.
The total mass observed with m > mc, Mobs,is 1.6 I03 Me, SOthe total mass
in all stars, M T ---MIME + M_s, is:
83
MT = 1.2 xlO4M®.
For comparison with the observed numbers of stars, the values of /ogN
predicted by the IMF in the mass intervals with /ogm < logmc are also
shown in Figure V-6 (filled circles). In the Carina Nebula the massive stars
appear to exhibit a flatter distribution than that implied by the Mtller-$calo
IMF, supporting the slmllar flndlngs of Garmany et al. from a more general
survey of early type stars.
Taking Mcloud = 6.7 xl 0s Me (Section B.I, this chapter) and M. = MT, the
resulting star formation efficiency is:
5FE = 0.018.
A relative uncertainty of a factor of 2-3 is estimated for SFE, with
approximately equal contributions from Mdo_ and M.. Improper choice of
the cloud boundary and the uncertainty in the W(CO)-N(H2) conversion lead to
a relative uncertainty of --2 in the cloud mass. The estimate for M. may be
influenced by a number of factors. By using the mass of the entlre cloud we
have made the assumption that the mass present In the clusters whlch are
not part of the Carlna Nebula (NGC 3324, NGC3293, and IC 2581 ) ls
accounted for in the preceeding stellar mass estimate. This assumption ls
reasonable because the stars in these clusters, primarily later types than
those in the Carina Nebula, lie in the regime of the IMF calculation. A more
accurate mass might be obtained by considering these clusters separately.
From an analysis of NGC 3293 Herbst and Miller (1982) derived a mass of
~ 1500 Me; If approximately the same amount of mass is associated with
84

NGC 3324 and IC 2581, M. could be increased by about 40% More critical is
the assumption that all stars with m = mc are observed, since M. ~ M_ and
M_r_ depends linearly on the number of stars in the mass bin centered at me;
this number could be off by a factor of 2-3 owing to obscuration by the dust.
A similar factor probably applies to the number of stars with m > mc, but
the total mass of these stars, Mobs, is only about 15% of M.. (We note also
that the number of ionizing photons available in the Carina Nebula as
estimated from radio continuum measurements [Smith et al. 1978] is
reasonably consistent with the observed numbers of early-type stars,
indicating that the star counts are probably not far off.) Finally, even if
Mo_ correctly measures the total mass in stars more massive than mc, no
allowance has been made for 0 stars which are no longer present. However,
judging from the effects of the _1 Carinae Nebula on the molecular cloud, it
is not likely that the number of such stars is much greater than the present
day value of N(m>mc) since the molecular cloud remains largely intact in the
vicinity of the older clusters, and near the _1 Carinae Nebula the motions of
the cloud are consistent with the energetics of the present star-forming
epoch.
The star formation efMciency derived here for the _1 Carinae molecular
cloud agrees well with the efficiencies for giant molecular clouds in the
inner Galaxy recently derived by Myers et aL (1985). To obtain M. for each
molecular cloud in their sample, Myers et al. used the measured radio
continuum and far infrared fluxes of H II regions associated with the clouds
to infer the mass, m_, of the most massive star present in each H !1
region. The Miller-5calo IMF, normalized to one star of mass mr..., was then
used to calculate the mass of a single cluster containing just one such star,
and mass-luminosity relations from the literature were used to predict the
85
total luminosity of the cluster. With the assumption that the total stellar
luminosity equals the observed FIR luminosity or each H II region, the total
stellar mass associated with each H II region followed from the number of
identlcal clusters required to produce the observed total luminosity. For a
given molecular cloud, M, was then just the sum of the total stellar masses
in each H II region associated with the cloud. An important principle of
this method is that, for a given H II region, the ratio of the observed FIR
luminosity to the Lyman o<luminosity (inferred from the radlo continuum),
denoted IRE for infrared excess, is an indicator of the amount of nonionizing
stellar luminosity present. If IRE is too small, as turns out to be the case
with the TI Carinae Nebula, the method doesn't yield consistent results.
From their sample of about 50 giant molecular clouds, Myers et el. found a
median 5FE of 0.02. Aside from the use of the Miller-Scalo IMF, the method
of Myers eta/. is quite different from the one used here for the _1Carlnae
molecular cloud, and the good agreement between the star formation
erflciencies found here and in the inner Galaxy, then, probably indicates that
the results are reasonable.
4. Summary
A glant molecular cloud complex was found to be associated with the
_1Carlnae Nebula, NGC 3324, NGC 3293, and IC 2581. The linear extent of
the cloud is ~ 150 pc (Rert = 66 pc) and its total mass is --7 x lOs Me, both
values typical of giant molecular clouds found elsewhere In the Galaxy. In
the vicinity of the Carina Nebula, the interaction of the young stars, Ionized
gas, and the molecular cloud can be understood wlth a simple model In whlch
the prominent dust lanes crossing the race of the nebula trace a fragment of
86

the molecular cloud that is expanding away from the bulk of the cloud.
Sufficient energy is available from sources within the nebula to drive the
expansion. The main body of the cloud sits beside the H II region and
extends along the galactic plane in the direction of NGC 3324, 3293, and
IC 2581. By summing the mass In the observed early type stars and using
the IMF to obtain the mass in the late type stars, a star formation
efficiency of 0.018 was derived for the entire molecular cloud. This number
agrees well with the star formation efficiencies for giant molecular clouds
In the Inner Galaxy.
C. The Carlna Arm in the Galaxy
How does the Carlna arm connect with the rest of the Galaxy? Thls
question goes back to Bok, whose original idea was a single spiral arm from
Carlna through Cygnus. The early hopes that 21 cm line studies of neutral
hydrogen would reveal global spiral structure were never realized because
of the ubiquity of H !, the complications arlslng from nonclrcu]ar motions,
the difficulties In comparing different surveys, and the different
Interpretations by workers uslng the same data. One of the maln polnts or
controversy has been the way In whlch the Carlna arm connects wlth the
rest of the Galaxy.
Weaver (1970) presented a model in which the Carina and Saglttarius
arms form a single major splral arm wlth a pltch angle of about 12.5".
Alternatively, Kerr (1970) favored Bok's model which joins the Carina arm
with Cygnus in a low-pitch arm; the low density of Population I beyond the
Sun In the directions of Carina and Cygnus suggested a localized reglon of
low density where the arm passes through the solar neighborhood (51monson
87

1970).Kerr and Kerr (1970) pointedto a gap from / = 292" to 305" inthe
i1 cm continuum and H109o< fluxesas evidenceagainsta Carina-
Sagittariusconnection,arguingthatsuch an arm would be expectedto pass
justinward of the Sun inthislongituderange.They maintainedinsteadthat
the onlyH Ifregionsseen inthisgap were distantand could not representa
connectingstretchbetween Carinaand Sagittarlus.
Usinga varietyof spiraltracers,Humphreys (1976) tracedthe Carina
arm intothe firstquadrantand,likeWeaver, connecteditwith the
5agittariusarm. Similarly,Georgelinand Georgelin(1976),using optical
and radioH IIregionsas tracers,proposed a Carina-Sagittariusarm.
However, theirCarina-Sagittariusarm isleastwell-definedinthe region
connectingthe two arm segments,and between /= 30" and 45" inthe
5agittariusarm thereisa 6 kpc gap,which isdifficultto reconcilewith the
claim of large-scalecontinuity.
The evidenceofferedby the largestmolecularclouds-- those more
massive thanroughlyi0S Me -- stronglysupportstheCarina-Sagittarius
connection.FigureV-7a shows alltheCarlnacloudsgenerallymore massive
than IOs Me locatedinthe planeof theGalaxy;alsoshown are similarly
massive cloudsidentifiedinearlierCO surveysmade with the Columbia
millimeter-wave telescopeinNew York City.The dominant featureisthe
Carinaarm. Itistracedover a 23 kpc path lengthby 37 clouds.Spiralarm
segments delineatingthe Perseus and Sagittariusarms are alsoreadily
apparent.From the figure,theCarinaand Sagittariusfeaturesevidently
form a continuousspiralarm. The wedge from I = 300" to 12",a regionfor
which the data have not yet been fullyanalyzedforcloud identifications,
representsa path lengthof "_I Kpc alongthe arm, onlyslightlylargerthan
theaverageintercloudspacingof the Carinacloudsof700 pc. The dip inthe
88
continuum and H109o( fluxes between / = 292" and 305" noted by Kerr has
no counterpart in reduced CO emission. Rather, the /,v and spatial maps
show the near side of the arm continuing into the inner Galaxy emission,
where it becomes difficult to trace.
A large gap can also be seen between the inner-most clouds in the
Carina arm and the clouds in the direction of Cygnus. But while the
unanalyzed wedge between the Carina and Sagittarius arms is bridged
optically by young clusters (Vogt and Moffat 1975b), giant stars (Humphreys
1976), and weak H II regions (Gerogelin and Georgelin 1976), as well as a
tentatively identified molecular cloud (Bronfman, private communication),
no similar link can be found between the near side of the Carina arm and
Cygnus. The Carina arm would have to spiral outward from / = 300" to
~85" to meet Cygnus, making further unlikely any Carina-Cygnus connection.
The linear mass densities of the CaMna and Sagittarius arms are the
same, also supporting the hypothesis that the two are connected. The total
cloud mass in the Cartna arm, 58 x106 Me, extends over 23 kpc, for a linear
mass density of 2.5 xlO 6 Me pc-l; in the Sagittarius arm, 39 xlO 6 Me
extends over 16 kpc, again for 2.5 x 10⁶ Me pc-l. By comparison, in the
Perseus arm wlth 9.8 x lO 6 Me extending over 8 kpc, the llnear density is
much lower, only 1.3 x IOGMe Pc"1
In a plot of galactocentric angle versus the logarithm of
galactocentric radius (Fig. V-7b), in which logaritmic spirals will appear as
straight lines, the continuity between the Cartna and Sagittarius clouds is
even clearer. All of the Carina and Sagittarius clouds are seen to fall close
to a 10" spiral with a tangent at /= 281" (the best-fit inclination is
9.75"). Figure V-8, which shows the clouds in the plane of the Galaxy with a
10" logarithmic spiral superimposed, illustrates the conclusion well: the
89

Carinaand the Sagittariusarms form a singlespiralarm nearly40 kpc long
wrapping atleast2/3 of the way aroundthe Galaxy.
D. Notes on Individual Clouds
Table V-2 is a catalog of all the clouds identified between / = 270"
and 300 °, as well as all the clouds in the far side of the Carina arm beyond
I = 300" Identified in the COsurvey of L. Bronfman (1985). The catalog is
ordered in increasing longitude and Includes, with the coordinates (/,b,v),
distances, velocity widths, effective radii, and COand virlal masses of the
clouds.
All the clouds identified between ! = 270" and 300" are described
briefly in the notes below, which summarize cloud identifications, distance
determinations, and identification of associated objects. For a description
of the Carina arm clouds beyond ! = 300", see Bronfman (1985).
1) / = 270.g', b = -0.5", v = 52.5 km s-i
There isno kinematicdistanceambiguityfor thiscloud,itsvelocity
placingitwell beyond the solarcircle.The clouddoes not appear tohave
any associatedobjects.Itslongitude,about I0" ahead of the Carinatangent
(at /= 280"),and itsdistanceindicatethatthe clouddoes not lieinthe
Carinaarm. Itmay be relatedto theH Ifeatureinthe outerGalaxy noted In
FiguresIV-6 and IV-8.
90 C

2) l=279.9, b=-1.6",v=35.1kms-1
This very weak feature has no associated objects.
distance, beyond the solar circle, is unambiguous.
Its kinematic
3) 1=281.4, b =-l.l',v=-5.1kms -1
In the heart of the tangent region of the Carina arm, this feature is
probably a blend of more than one cloud. The spatial maps of this region
(Figs. IV-lb and V-lb) and the integrated /,v map (Fig. I I1-7) exhibit several
peaks between / = 280" and 283". Spatial maps in adjacent velocity
windows (Figs. V-ga-j) show a fair degree of continuity in the emission
between 1 = 280" and 283" as we progress from about -18 to 8 km s -1,
although the centroid of the emission shifts from about / = 282.7",
b = -1.7" to / = 281.6", b = -0.7". Because of the confused nature of the
emission from / = 280" to 283", no attempt was made to subdivide this
emission further (with two exceptions noted below), any such division being
arbitrary.
This cloud complex was placed at :3.2 kpc, based on the optical distance
to G282.2-2.0 (Blgay et aZ 1970), an associated H II region. With an H_
velocity of -12.2 km s -1 (Bigay eta/), G282.2-2.0 sits blueward (in
velocity) of a CO peak in this direction.
Three other H Ii regions between / -- 280" and 283" may also be
associated with various components of this cloud; they are: RCW 45,
RCW 46, andReW 47. RCW 45(/= 282.2",b = -O.l') sits at the edge of
the CO peak at / = 282.3", b = -0.5"; its He<velocity, -9.8 km s-1 (Bigay et
al), places it to the blue of this peak in velocity. No optical distance is
91

available for RCW 45. RCW 47 ( / = 283.0", b = -2.7") is situated at the
low latitude edge of the cloud where the emission ls relatively weak; its Ho<
velocity of -11.6 km s-1 (Bigay eta/) shows that this region, too, is
blueward of the the cloud's velocity. Georgelin (1975) gives a distance of
2.7 kpc for RCW 47. (The /,v maps at b = -2.0" and -2.75" indicate that the
association between the cloud and G282.2-2.0 ls probably more certain than
the association between the cloud and RCW 47; for this reason the distance
to G282.2-2.0 was used as the cloud's distance.)
The other H !1 region, RCW 46 ( / = 282.4", b = -1.3"), has an Ho(
velocity of -10.6 km s-1 (Georgelln 1975) and slts between two COpeaks,
one, at I = 281.7", b = -1.5", near the center of the tangent region under
discussion, the other at / = 282.75", b = -1.25". In the Integrated /,v map
and the /,v maps at each latitude between b = - !.5" and O" (Fig. B- 1), the
higher longitude peak appears as a distinct feature and was cataloged as a
separate cloud, #6 in the llst. It is not clear whether RCW 46 is associated
with cloud #3 or #6.
The other exception to the decision not to subdivide the tangent region
emission between / = 280" and 283" is cloud #5, which blends with #3 In
the integrated /,v map giving the impression of a continuous feature. The
spatial maps of the near slde of the arm (Flgs. IV-3a and V-la) clearly show
#5 as a distinct cloud at / = 282.9", b = 1.3", with little spillover into the
tangent region.
After excludingthe emission from #5 and #6, the remainingemission
for_3 yieldsa CO mass of 2.3x10⁶ M e. Alhoughsome localemission Is
probablymixed in,the derivedmass isnot atypicalofother largecloudsin
theGalaxy.
92

4) / = 282.0°,b = -0.8°,v = i7.3km s-_
This cloud is apparently associated with the H109o< recombination line
source 282.0-1.2 at a velocity of 22.4 km s-1 (Wilson etaL i970). Bigay
et aL (1970) report an Ho<velocity of 21.6 km s-1 for the same source, but
no optical distance determination is available. The cloud was therefore
placed at its kinematic distance, which has no ambiguity since the velocity
is positive.
5) / = 282.9", b = 1.3", v = -18.7 km s-!
No known H II regions, continuum sources, OH or H2COemlsslon or
absorption features, or apparent optical obscuration are seen toward this
cloud. It has not previously been detected in CO. Its velocity places it at
the tangent point.
6) / = 282.9", b = -0.7", v = -4.5 km s-1
This cloud appears as a distinct feature in the /,v map at / = 282.9",
v = -5 km s-1. The emission near thls longitude and latitude varies
continuously in the spatial maps in adjacent velocity windows
(Figs. V-ga-j) between -10 and -2 km s-l; the strongest emission appears in
the -5 km s-! map at /= 283", b = -I". It was therefore considered to be
separate from cloud #3. Although possibly associated with RCW 46 at
1.8 kpc (Georgelin i975), a connection is not completely convincing. The
cloud was assigned the far kinematic distance on the basis of the radius-
93

linewidth relation(Dame eta/.1985),which clearlyfavorsthe far
distance.
7) I= 283.8",b = 0.0°,v = -5.4l<ms-i
Thiscloud Isprobablyassociatedwith RCW 48 and RCW 49, placingIt
at about3 to 5 kpc. RCW 48, at I = 283.5",b = -I.0",iscrescent-shaped,
both inthe opticaland inthe radiocontinuum,Indicatingthatthe concave
sideofthe opticalcrescentisnot due to obscurationbut to an obstruction
-- a molecularcloud -- adjacentto the crescent'sinneredge. There Is
littleotherevidence,such as a brightCO peal<,of directcontactbetween
the ionizedgas on the concave sideof the crescentand the molecularcloud.
The mean cloudvelocityof -5.4l<ms-iisclose tothe mean Ho_velocityfor
RCW 48 of -8.2l<ms-i(Bigay etal 1972),and the angulardisplacement
between the nebulaand the cloud'sedge Issmall,leadingtothe conclusion
thatthe two are associated.
RCW 49 consistsofan opticallybrightcentralportioncoincidentwith
a strongcontinuum sourceat I = 284.3",b = -0.3",and a regionofmore
diffuseHo_emission extendingroughlyhalfa degreeabout the center.The
center of RCW 49 liesmidway between two CO peaks Inthe cloud,and the
mean H_ velocityof -7.8l<ms-i(BIgayetal} compares well with the mean
cloudvelocity,so RCW 49 alsoIsbelievedto be associatedwith the cloud.
The HI09o<recombinationlinevelocityof RCW 49 measured onlytoward the
continuum source Is-0.7l<ms-_(Wilson eta l),a valuenot toodiscrepant
from the CO and Hc_velocities,consideringtheseare mean velocitieswith
spreadsof about _+5Km s-i
94
Bigay et e/suggest that RCW 48 and RCW 49 form a single H II region
complex, citing as evidence both the similar velocities, and at about the
same velocity, a third, more diffuse Ho(emission region (designated
283.9-0.6) that ]inks the two. RCW 48 is at about 3 kpc, based on the the
distances to two exciting stars (Georgelin 1975). RCW 49 lies between
3 kpc, based on the distances to two exciting stars (Georgelin 1975), and
5 kpc, based on the distance to the apparently associated cluster Wd2
(Moffat and Vogt 1975). Here a distance of 4 kpc for the cloud is adopted.
Although this distance could be off by a kiloparsec, such an error has little
effect on the large scale picture of the Carina arm since this cloud is
certainly near the tangent of the arm.
8) / = 284.5", b = -0.2", v - 11.6 km s-i
This cloud lles beyond the solar circle, so its kinematic distance is
unambiguous. The radio continuum source G282.0-1.0 sits near the edge of
one of the cloud's two COpeaks; the velocity of the source from its H1090(
recombination line ls 4.5 km s-1 (Wilson eta/1970), placing It near the
edge of the cloud in velocity space; the radio object is very likely to be
associated with the molecular cloud. The weak Ho(source H 8 is also
coincident with the radio H II region, but its association with it, while
probable, is not certain; no optical distance is available to H 8.
9) I = 285.3", b = 0.0", v = 0.0 km s-1
The velocityof thiscloudputs iton the solarcircle,eitherlocalor
quitedistant(5.3kpc forthlslongitude).The farkinematicdistanceis
95
chosen here not only because this compact cloud lies at b = 0", but, more
important, because H I absorption of a bright continuum source coincident
with the cloud is clearly due to nonlocal, intervening gas (Goss et aZ, 1972).
The small Ho<source H 18 is the apparent optical counterpart of the radio
H II region.
I0) I = 286.4",b = -0.3",v = 14.3km s-i
This cloud was assigned a kinematic distance that places it beyond the
solar circle. It has no associated radio or optical objects.
11) / = 287.5",b = -0.5",v - -19.4km s-i
This is the large cloud complex associated with the _1 Carinae Nebula,
NGC 3324, NGC 3293, and IC 2581. Its distance was taken to be 2.7 kpc,
the distance to the associated objects. A detailed discussion of this cloud
is presented in Section B of this chapter.
12) I = 288.6 °, b = 1.5", v = -21.9 km s-i
The kinematic distance to this source places it at the subcentral point.
Although the filamentary H_ source RCW 54b lies at the edge of this cloud,
no convincing association can be deduced because no information regarding
velocity is available for the Ho<source. No continuum, OH or H2COabsorption
or emission sources are observed toward this cloud.
96
13) / -- 289.3", b -- -0.6", v -- 22.4 km s-1
This is one of two clouds in the far side of the Carina arm that can be
assigned an optical distance. The associated H II region, RCW 54a
( 1 = 289.7", b = -1.3"), is situated near the edge of one of the cloud's two
COpeaks. The H109o< recomblnatlon llne velocity (Wilson eta! 1970) and
the H_ velocity (Georgelin and Georgelin 1970b) of RCW 54a are 21.9 and
20.7 km s-1, respectively, placing the H II region slightly to the blue of the
associated COpeak in velocity space, and implying that ionized gas is
streaming away from the molecular cloud that lies partly behind the H II
region. That RCW 54a is observed optically is consistent with the cloud
forming a backdrop to the bright gas.
Another H II region, 6289.1-0.4, also associated with the molecular
cloud, is seen directly toward the other COpeak, its H109o_ recombination
line (Wilson etaD coinciding with the COpeak in velocity, as well.
6289. I-0.4 was first identified as nonthermal (Milne eta/1969), but was
subsequently determined by Shaver and Goss (1970) to be thermal.
Two other objects are seen close to the smaller £0 peak. One is the
supernova remnant MSH11-6/A at / = 290. 1", b = -0.8", which is
extremely bright in the radio continuum (Shaver and Goss 1970) and exhibits
a faint optical shell (Kirshner and Wlnkler 1979, hereafter KW; Elliot and
Malin 1979, hereafter EM). Although the close spatial coincidence of
MSHI 1-6/A with the cloud suggests an association between them, the
supernova's distance, between 3.2 and 5.8 kpc (KW; EM) argues against such a
connection. The distance to MSH11-6/A, however, may be substantially
greater than 5.8 kpc (KW; EM), so an association between the molecular
cloud and the SNR cannot be ruled out. The other object, the H II region
97

G28g.g-0.8, has an HlOga_ velocity of 5 km s-! (Dickel 1973) making its
assocation with the cloud unlikely. Given the evidence available, no strong
arguments can be made regarding the possible relationships between these
two objects and the molecular cloud.
14) / = 2g0.2", b = -0.2", v = -1.4 km s-i
The far kinematic distance was chosen for this cloud based on its
small angular size, its proximity to the galactic plane, and the radius-line
width relation which favors the far distance. No optical obscuration is
apparent toward this cloud, and any possible connection with the optical
H II region G 37 (RCW 54(:), near the cloud's edge, is ruled out by the Ho(
velocity of about -22 km s-I for G 37 (Georgelin and Georgelin lg7Ob).
15) / = 290.6", b = -0.2", v = 15.4 km s-1
The composite spectrum (the sum of all the spectra over the face of a
cloud) of this feature shows two velocity components at about g and
18 km s-_. From the /,v and spatial maps, though, the feature would appear
to be a single cloud. Individual spectra in the sum exhibit wide, single lines
(near the velocity of the feature) offering little evidence for a second peak
other than a mild asymmetry, and so this feature was considered to be a
single cloud. The supernova remnant MSH11-62 at / = 291.0", b = -0.1",
near the edge of the cloud, is at an estimated distance of 9.9 kpc (Milne
1979), in good agreement with the kinematic distance to the molecular
cloud of 8.7 kpc, although this does not confirm an association between the
cloud and the SNR. The kinematic distance is adopted for the cloud.
98

Another weak, nonthermal continuum source, G290.4-0.9, offset
slightly from the cloud's edge, ls probably extragalactic (Shaver and Goss
1970).
16) I - 291.4", b = -0.2", v = -7.0 km s-i
The coincidenceofthisfeaturewith a dark dustcloudon the E50 J
plateinitsdirectionindicatesthattheCO emission Islocal.On an opacity
scaleof I-6 with 6 correspondingto theapparentlydarkest,5andqvist
(1977) ranked the dustcloud(number 127 inhisTable 1)class .5.
Formaldehyde absorptionobserved Inthedirectionof the dustcloudhas a
velocityof -6.5km s"i(Goss eta/1980), furthersupportingthe connection
between the molecularcloudand theobscuringdust. The virtualabsence of
starsnear the dustcloud'scoreimpliesthatthe dust,and thereforethe CO,
isquitelocal.
17) I = 291.6", b - -0.4", v = 14.7 km s-i
This cloud ls associated with the giant H II region NGC 3603 seen
directly toward the COpeak and Just at the blue end of the cloud in velocity.
The optical dlstance of 7.2 kpc (van den Bergh 1978) was assigned. This
cloud coincides spatially with cloud #18 but has a velocity 14 km s-i higher.
A composite spectrum of the region containing clouds _'17 and _18 gives the
impression that these two may be different velocity components of a single
cloud complex, but the vlrlal mass of the two-cloud system ls about 10
times the sum of the CO masses of each component, so clouds #17 and #18
were considered to be two separate clouds.
99

18) I = 291.6°,b = -0.5",v = 28.8km s-i
This cloud was has a kinematic distance which places it beyond the
solar circle. It is associated with the H II region H 58 at / = 291.9 °,
b = -0.7 °. H 58 has an H109o_ recombination line velocity of 25.5 km s-1
(Wilson eteZ 1970) and an Ho_velocity of 22.3 km s-i (Georgelin and
Georgelin 1976). No optical distance is available for H 58.
The possibility that this cloud and #17 might form a single complex is
discussed in the notes to #17, where it is concluded that clouds #17 and
#18 are two separate clouds.
19) I = 292.'6 ", b = -0.3 °, v = 4.0 km s-i
Thisweak featurehas no counterpartatany otherwavelength. Itwas
placedat the farKinematicdistancebased on theradius-linewidth relation.
20) I = 293.3 °, b = -1.4 °, v = -25.1 km s-1
This cloud complex was placed at 2.4 kpc based on its association with
the bright H II region RWC 62 (also referred to as IC 2944, after the young
cluster containing the ionizing stars), one of four associated H II regions.
RCW 62 has an HlO9ocveloclty of -20.9 km s-1 (Wilson eta/. 1970) and
lies at one end of the cloud, near I = 295 °. Based on similar distances and
comparisons of the Ho_and radio continuum morphology, Georgelin and
Georgelln (1976) considered RCW 62 wlth RCW 60 and RCW 61 as a single
H II region complex. The average Ho_velocity of these three is -27.6 km s-1,
100
ingood agreement with both theradiorecombinationlineand the molecular
velocities.The common molecularcloudprovidesfurthersupportfor the
connectionof these threeregions.Of thethree,the best established
distanceisto RCW 62 (IC 2944) and,followingGeorgelinand Georgelin
(1976),itsdistanceisadoptedhere forthemolecularcloud.The fourthH If
region,NGC 3576, has an HlO9o(velocitgof -23 km s-i(Wilson eta/.1970),
and issituatedimmediatelynext toa strongpeak intheCO emission near
/ = 291.5",atthe otherend of the cloud.Variouspublishedoptlcal
distancesto NGC 3576 place itbetween 2.5and 3.3kpc (Georgellnand
Georgelin1970b, 1976; Humphreys 1978),the spreaddue inpartto
uncertainidentificationof the excitingstars(Georgelin,private
communication). Withinthe distanceerrorsand giventhe apparent
connectionby a common cloud,NGC 3576 may be consideredto be at the
same distanceas RCW 60, RCW 61, and RCW 62. At 2.4kpc,the cloudhas a
projected length of about 160 pc (P_fr = 77 pc) and a mass of 7 x 10s Me,
both values typical of other large clouds in the Galaxy, so the assumption
that the four H II regions are the offspring a single large cloud is
reasonable.
An alternative interpretation ls that we are viewlng two clouds In
projection, one associated with RCW 60, RCW 61, and RCW 62 at 2.4 kpc,
and the other associated with NGC 3576 at 3.3 kpc. Such a picture 1s
suggested by: ! ) the different morphological appearance of the two
possible clouds (see to Fig. V-la), one very bright and compact (NGC 3576),
the other weaker and more diffuse (RCW 60, RCW 61, RCW 62); 2) the
relatively weak link bewteen the two; and 3) a hole in the emission
centered approximately between the clouds near / = 292.5", b = -1.0".
There are no obvious explanations for the emission gap, such as a bright H II
I01

region or supernova remnant. (A similar hole centered near I = 294.5 °,
b = -2.0 ° is partially filled by the ionized gas of RCW 62, indicating that
the molecular gas in it may have been cleared out by the expanding H II
region.) However, even if 3.3 kpc is accepted as the distance to NGC 3576,
a distance error of no greater 15% to this object and to RCW 62 places the
lower limit on their separation of 50 pc, well within the typical size for
large cloud complexes. In addition, the velocities of the "two" clouds,
measured from a composite spectrum of each, are nearly identical:
-25.1 km s-i versus -24.9 km s-i; and spatial maps of the region in
adjacent, narrow velocity wlndows (Figs. V-10a-h) show that the strongest
components fade in, peak, and fade out at the same velocities. The "one
cloud complex" interpretation is therefore adopted here.
Although in Cohen et a/(1985a) we chose the "two cloud" picture (124
and 16u_entries in Table 1), it should be emphasized that our conclusions
about the large-scale structure of the Carina arm, including its connection
with the rest of the Galaxy, remain essentially the same, regardless of
which interpretation is accepted for this cloud.
21 ) I = 294.0", b = -0.9", v = 32.3 km s-1
Thiscloud was placedat Itskinematicdistance.Itdoes not appearto
have any associatedobjects,exceptpossiblythe supernovaremnant
G293.8+0.6at 9.6kpc (Mllne1979).The separationbetween the cloudand
the 5NR, assuming the cloud'sdistanceof 10.7kpc,isabout 90 pc,making
any connectionbetween the two questionable.
102

22) / = 294.4", b - -0.7", v -- -2.7 km s-1
This cloud does not appear to have any associated optical or radlo
objects. Its proximity to the galactic plane and radius-line width relation
imply it is at the far kinematic distance.
23) / = 295.1 ", b = -0.8", v = 26.0 km s-1
With multiple velocity components, this feature has a ragged
appearance in the integrated /,v map, making its classification as a single
molecular cloud (or cloud complex) suspect. Four reasons can be suggested,
however, to support its being one object. First, with a distinct peak at
/ = 29125", b = -0.75", its spatial appearance resembles that of many of
the other clouds in our survey. Second, the individual /,v maps at
b = 0.625" and -0.75" (Fig. B-l) show that all the emission near
/ = 295.25", from v = 20 to --40 km s"1, is connected. It seems unlikely
that within such a narrow range of longitude and latitude a chance
coincidence of clouds would be spread out over these velocities. A more
probable explanation for the wide velocity extent is the occurence of a
violent event, such as a supernova, in a single cloud. Third, the H II region
G295.2-0.6 ls seen almost directly toward the cloud's peak. The H l09o(
recombination line velocity of this source is 51.1 km s-_ (Wilson eta/); on
the /,v map at b = -0.625" this H II region lies about 15 km s-1 beyond the
highest velocity COpeak in the cloud. Although such a large velocity
discrepancy would usually be considered evidence against an association
between a cloud and an H II region, in this case the velocity displacement
may be consistent with the cloud's already large velocity width. If the large
1O3
velocityextentof the cloudisindeedrelatedtoenergeticphenomena, then
perhapsdisagreementbetween theH IIregion'svelocityand the cloud's
velocityisnot surprising.Fourth,at leastone otherexample of such a wide
velocitymolecularcloudcomplex exists:the cloudassociatedwith the
supernovaremnant W 44 inthe firstquadrant.The W 44 molecularcloud
has been shown to be a singleobjectaccountingforthe emission over nearly
40 km s-iwithin a 2" wide longituderange (Dame 1983).
Inview of theseconsiderations,thisfeatureisconsideredtobe a
singlecloudwith a kinematicdistanceof 10.5kpc.
24) I = 297.4",b = -0.5",v = 21.5km s-i
Itisdifficulttoestablisha clearseparationbetween thiscloudand
#26. Ifallthe emissionbetween I = 297" and 299.75" representeda single
cloudcomplex,itsprojectedlengthwould be unreasonablylarge:about 500
pc atan assumed (kinematic)distanceof 1I kpc. From the integrated/,v
and spatialmaps of thisregion,I = 298" would appear a reasonable
dividinglinebetween thiscloudand cloud#26. The radiocontinuum (Shaver
and Goss 1970a),which exhibitsa clusterof sourcesbetween I = 298" and
299" thendrops offJustbelow 298", lendingsupportto thlssubdivision.
Evidenceforthe physicalconnectionofthe emission between I = 297" and
298" atvelocitiesgreaterthanabout I0 km s-ican be found by comparing
the spatialmap (Fig.IV-3c)and the /,vmaps (Fig.B-I) between b = -1.0"
and 0.25".Two components Inthe spatialmap at I = 297.25",b = -1.0"
and I= 297.375",b = -0.125"appear as distinctfeaturesat:30km s-iand
17 km s-i,respectively,inthe /,vmaps at those latitudes.At intervening
latitudesthe /,vmaps show these featuresjoinedby a bridgeof wide-
104

velocity, low-level emission. The dividing line between this cloud and _26
is taken to be 1 = 298".
This cloud is placed according to its kinematic distance. The
supernova remnant G296.8-0.2 at 8.7 kpc (Mllne 1979) sits near its edge and
may well be associated. At the cloud's assumed distance of 11 kpc, the
projected separation between It and the SNR Is about 50 pc. No other
associated objects are apparent.
25) / = 298.6", b - O. I', v = -34.9 km s-1
This feature may be a blend of more than one cloud, but there are no
associated objects that aid in the placement or identificationof possibly
separate components. In the absence of further evidence the kinematic
distance is adopted, placing the cloud at the subcentral point. This distance
should be regarded as highly uncertain,given the cloud's location along the
high velocity ridge. The adopted distance makes this the only major cloud
between / = 280" and 300" that appears not to fit into the Carina arm. Two
obvious explanations are: 1) the cloud represents part of a real feature
interior to the Carina arm, perhaps a spur (such a picture of the Inner edge
of the Carina arm has been discussed by Humphreys ( 1976)); or 2) the
adopted distance to the cloud is too big, and the cloud actually resides in
the near side of the Carina arm. With regard to the latter possibility, two
other major clouds in the near side of the Carina arm, _'11 and 4'20, have
been assigned optical distances quite a bit closer than their implied
kinematic distances on the subcentral locus. No attempt has been made here
to "correct" for streaming motions when computing kinematic distances,
although has Humphreys (1970) reported evidence for such motions in
105

supergiantsinthe Carinaarm. Ifthe velocityresidualsfor the starsare
used toadjustthe observedvelocitiesof clouds#I 1 and #20, their
"corrected"kinematicdistancesagree with theiropticaldistances.A
similaradjustment couldbe appliedtocloud #25, but seems unwarrented
without a more systematic comparison of stellarand molecularcloud
velocities.
26) ! = 298.8", b = -0.2", v = 24.9 km s-i
The threepeaks between I = 298" and 300" inthe farsidespatialmap
(Figs.IV-3c and V-I c)are groupedtogetherand assigneda kinematic
distanceof 11.9kpc. (The establishmentof / = 298" as the dividingline
between thiscloud and #24 isdiscussedinthe notes to#24.) The
classificationof allthisemission as a singlecomplex was suggested in
partby theclusteringofdistantH IIregionsand supernovaremnants
between I = 298" and 300". A feature at 1 = 299.5", v = 27 km s-1 in the
/,v map was included because its kinematic distance is nearly the same as
that of the rest of the complex. H109o( recombination line velocities of
30.6 km s-1 and 24.2 km s-i for G298.2-0.3 and G298.9-0.4 (Wilson eta/
1970), respectively, show that the H II regions are closely associated with
cloud components at the corresponding spatlal and velocity coordinates.
G298.2-0.3 is apparently an extremely bright H II region. Infrared
continuum observations of thls object yield the highest measured 1-20jJ
lumlnoslty for any galactic H II region (Frogel and Persson 1974), and from
infrared emission line measurements Lacy et a/(1982) estimate that four
05.5 V stars are required to provide the ionlzlng radiation for this H II
region. A third HlO9c(source, G298.8-0.3 (v = 25.0 km s-i), is also
106

associated with the cloud, although this H II region may be part of
G298.9-0.4 (Wilson eta/. 1970).
Three supernova remnants are also seen in the direction of this cloud
complex: 6298.5-0.3, 298.6+0.0, and 299.0+0.2 at distances 16.1, 17.2, and
10.6 kpc, respectively (Milne 1979). Assuming distance errors of 30% to
these SNRs, it is possible that all three are related to the cloud; given the
spatial coincidence with a cloud that appears to be the site of ongoing,
massive star formation, the association of at least one of these $NRs with
the molecular cloud seems quite likely.
27) / - 299.4 °,b - -0.I',v = -6.0 km s"_
The far Kinematic distance for this cloud is favored by the radius-line
width relation. A closer distance (but not the near kinematic distance) of
2.3 to 3.5 kpc ls possible if a small He<source at I = 299.9", b = 0.4" is
associated with the cloud. Georgelin and Georgelin ( ! 970) give an optical
dlstance of 2.3 kpc and an Hc_velocity of about - 10 km s -i for the source,
but subsequently (Georgelln 1975) the distance was revised to 3.5 kpc and
the source excluded from a list of measured Ho(velocitles (Table V in
George]in 1975). Since the evidence for an association of the Ho_source and
the molecular cloud is not very compelling, the far kinematic distance is
chosen for the cloud.
107

Vl. SUMMARY
The distribution of molecular clouds in the Carina arm was determined
by surveying the J = 1-_0 line of COin the Southern Milky Way with the
Columbia University Millimeter-Wave telescope at Cerro Tololo. Ranging
from ! = 270" to 300", and covering more than 60 deg2 about the galactic
plane at O. 125" resolution and 300 deg2 at 0.5" resolution, the survey
provides the first large-scale CO observations of this region, one of the
most interesting in the Milky Way. Various representations of the data were
presented, including latitude-integrated _v diagrams, /,v maps at individual
latitudes, velocity-integrated spatial maps, and b,v maps at each observed
longitude.
The Carina arm stands out with the loop-like signature of a spiral arm
in the 7,v diagram. Its abrupt tangent near ! = 280" at zero velocity
connects with the near side of the arm, at negative velocities (within the
solar circle), and the far side, at positive velocities (beyond the solar
circle). Extending toward higher longitudes, the near and far sides become
separated by as much as 60 km s-1, with only weak or local emission in the
velocity gap between them. When the emission is integrated over velocity
and latitude a 13-fold jump in intensity is seen as ! crosses 280" from
below, indicating an arm-interarm contrast of at least 13 to 1. The near
side, tangent region, and far side of the arm were viewed in the plane of the
sky by considering the emission within the velocity ranges of these
kinematically defined features. In the resultant spatial maps, the thinning
of the CO layer with kinematic distance, which is an expected projection
effect, supported the kinematic interpretation of the data.
108

At galactocentric distances beyond the solar circle the COand H I are
well-correlated in both space and velocity, tracing the same large-scale
segment of the arm and exhibiting coincident concentrations of emission
along lts length. Within the solar circle, the CO and H I define similar
terminal velocity curves, but the near side of the arm is more difficult to
dlscerh as a distinct feature In the H I than In the CO. The relative
emptiness of the interarm region in the CO /,v diagram likewise has only a
weak counterpart In the H I /,v diagram. In general, the Carlna arm loop, an
obvlous feature In the CO /,v dlagram, ls riot outstanding In the
corresponding H I map. The absence of apparent contlnulty between the
near and far sldes of the 21-cm arm may partly account for the different
Interpretations by Kerr (1970) and Weaver (1970) of the Carlna arm's
connection with the rest of the Galaxy.
The radial dependence In the outer Galaxy _f the average CO mldplane,
molecular layer thickness, and H2 surface density were determined by
averaging the H2 density at each observed positlon with R > Ro over
longitude. There being no kinematic dlstance ambiguity for emlsslon arlsing
at points beyond Ro, a unique distance, z, from the galactic plane could be
assigned to all such points. For comparlson with the H I, a parallel analysis
of the recent Parkes 18 m 21-cm survey data was carried out. The CO
midpiane bends downward increasingly from the b = O" plane wlth distance
from the galactic center, dropping from z = -48 to -167 pc between
R = 10.5 and l2.5 kpc. A similar warp has been recognized in H I ever since
the earliest 21-cm surveys of the southern galactic plane, and the
treatment here of the Parkes data shows the H I midplane to be within
about 25 pc of the molecular mldplane at all radll considered. Again, the
half-thickness of the CO layer, expanding from 112 to 182 pc between 10.5
109

and 12.5Kpc from the galacticcenter,mimics the longestablishedflaring
of theneutralhydrogenlayer,althoughthe scaleheightof the H Iisabout
twice as greatatthatof theH2 overthe same range of radii.Three or four
very largemolecularcloudsinthe CO survey thatliekinematicallybetween
11 and 12 kpc from the galacticcentercause an apparentpeak of43 M® pc-2
inthe H2 surfacedensityatR = 11.5kpc. No similarpeak isseen inthe
neutralhydrogensurfacedensity,a resultdue inpartto thehighervelocity
dispersionof theH I.Comparison of the molecularsurfacedensitiesinthe
arm and interarmregionsyieldsan arm-interarm contrastof about4.5 to I
fortheCarinaarm. Thls ratioislikelya lower limitsince I) Itfollows
from ananalysisthattends towash out nonaxisymmetric (spiral)structure
by assigninga distinctdistancetoevery point(atR > Ro) in(/,b,v)-space
and averaging over longitude, and 2) a ratio of 13 to I ls Indicated by the
step at I = 280" in the total (b- and v- Integrated) CO Intensity dlagram.
To place the Carlna arm in the Galaxy, a catalog of individual molecular
clouds that trace the arm in the /,v and spatial maps was compiled, the
clouds at longitudes greater than 300" having been Identified In an adjoining
CO survey made with the same telescope. The catalog lists the positions,
distances, linear dimensions, and masses of the clouds; the masses were
calculated from an assumed proportionality between Integrated CO line
intensity and H2 column density. The identification of each cloud within
/ = 270" and 300" is discussed briefly, including its distance determination
and possible association with other radio and optical objects. One cloud,
that associated with the 11 Carinae Nebula, was studied in some detail. The
giant H II region NGC :3372 (_1 Carinae Nebula) is severely disrupting its
immediate surroundings, driving a fragment of the associated molecular
cloud away from the main body of the cloud. The star formation efficiency
110

in the Tl Carinae molecular cloud was found to be "-0.02,in good agreement
with the recent results of Myers et el (1985) for inner Galaxy molecular
clouds.
By locating the cataloged clouds inthe plane of the Galaxy, clouds more
massive than 105 M e were shown to trace the Carina arm over a length of
nearly 25 kpc. From I = 280" to 300", where the Carina arm had previously
been traced optically to distances as great as 12 kpc, the close agreement
between the molecular arm and the opticalarm emphasized the importance
of giant molecular clouds in the study of spiral structure on the galactic
scale With the largest clouds identifiedin earlierColumbia CO surveys of
the first and second quadrants added to the picture,the Carina and
Sagittarius arms appear to form a single l O'-spiral arm 40 kpc long,
covering at least 250 ° in galactocentric angle.
111

REFERENCE5
Allen,.C.W.,1973, AstrophysicalQuantities,The Anthlone Press,University
ofLondon.
Bally,J.,and 5coville,N.Z.,19[}0,Ap.J.,2:39,121.
Batchelor,R.A.,Caswell,J.L.,Goss,W.M.,Haynes,R.F.,Knowles, S.H.,and
Wellington,K.J.,1980, Austral/anJ.of Phys.,33, 139.
Beard,M.,and Kerr,F.J.,1966, AustralianJ.ofPhys, 19, 875.
Becker,R.H.,Boldt,E./L,Holt,5.5.,Pravdo,5.H.,Rothschild,R.E.,
5erlemitsos,P.J.,and Swank, J.H,1976, Ao.J.(letters),209, L65.
Blgay,J.H.,Gamier, R.,Georgelin,Y.P.,and Georgelin,Y.M.,1972, Astr.Ap.,
18, 301.
Blitz,L.,1978, Ph.Ddissertation,Columbia University.
Blitz,L.and Thaddeus,P.,1980, A_.d (Letters),226, L39.
Bloemen,J.B.G.M.,Strong,A.W.,Blitz,L.,Cohen,R.5.,Dame, T.M.,
Grabelsky,D.A.,Hermsen, W.,Lebrun,F.,and Thaddeus, 1985,
Astr.Ap, Inpress.
Bok,B.,1937, The D/str/but/onofStars inSDace Universityof Chicago
Press.
Bol<,B.J.,and van Wijk,V.,1952, ,4J.,57, 213.
Bol<,B.J.,1956, V/stas/nAstronomy 2, 1522.
Bok,B.J.,1959, The Observatory,79, 58.
BoI<,B.J.,Hine,A._, and Miller,E.W,1970, In IAUSymposium 38, The Spiral
Structureofour Galaxy ed.,W. Becker and G.Contopoulos(Dordrecht:
Reidel),p.246.
Braz,M.A.,and 5calIse,E.Jr.,1982, Astr.AD.,107, 272.
Bronfman,L.,1985, Ph.Ddissertation,Columbia University.
112

Burton, W.B., 1971, Astr. Ap.,IO,76
Burton,W.B.,Gordon,M.A.,Banla,T.M.,andLockman, F.J.,1975,
A,o. ,./., 202, 30.
Burton, W.B., and Gordon, M.A., 1978, Astr. Ap, 63, 7.
Castor, J., McCray, R., and Weaver, R., 1975, Ap. J. (Letters), 200, L107.
Caswell, J.L., 1972, Austral/an J. of Phys., 25, 443.
Caswell, J.L., and Robinson, B.J., 1974, Australian J. of Phys, 27, 597.
Chln, O., 1977, Ph.D. dlssertatlon, Columbla Unlverslty.
Claria, d.d., 1977, Astr. Ap. Suppl., 27, 145.
Cohen, R.5., 1977, Ph.D. dlssertatlon, Columbla Unlverslty.
Cohen, R.5., Cong, H., Dame, T.M., and Thaddeus, P., 1980, A_. J. (Letters),
239, L53.
Cohen, R.5, Grabelsky, D.A., May, J., Bronfman, L., Alvarez, H.,
and Thaddeus, P., 1985a, Ap. J. (Letters), 290, L15.
Cohen, R.5., Dame, T.M., and Thaddeus, P., 1985b, Ap. J. Suppl., in press.
Conti, P.5., and Burnlchon, M.-L., 1975, Astr. A_., 38, 467.
Dame, T.M., 1983, Ph.D. dissertation, Columbla University.
Dame, T.M., Cohen, R.5., Elmegreen, B.G., and Thaddeus, P., 1985, Ao. J.,
in press.
Davis, J.H., and Vanden Bout, P., 1973, Ap. Letters; 15, 43.
de Graauw, T., Lindholm, 5., Fltton, B., Beckman, J., Israel, F.P.,
Nieuwenhuljzen, H., and Vermue, J., 1981, Astr. Ap, 102, 257.
Dickel, J.R., and Mllne, D.K., 1972, AustrallanJ. of Phys., 25, 539.
Dickel, J.R., 1973, A_. Letter_ 15, 61.
Dickel, H.R., and Wall, J.V., 1974, Astr. Ap., :51, 5.
Dlckel, H.R., 1974, Astr. Ap., :3 I, 1I.
Elliot, K.H., 1979, M.N. RA S., 186, 9P.
113
Elliot, K.H.,and Malin, D.F., 1979, MNR A.5, 186, 45P.
Elmegreen,B.G.,and Lada,C.J.,1976, Ap.Jr 8 I, 1089.
Feinstein,A.,1969, M N R A.5.,143, 273.
Feinstein,A.,Marraco,H.G.,and Muzzio,J.C.,1973, Astr._ Suppl.,12, 33 I.
Feinstein,A.,Marraco,H.G.,and Forte,J.C.,1976, Astr.z_. 5uppl,24, 389.
Feinstein,A.,FitzGerald,M.P.,and Moffat,A.F.J.,1980, A.J.,85, 6.
Fernie,J.D.,1968, A.J.,73, 995.
Frogel,J.A.,and Persson,5.E.,1974, _. J_ 192, 351.
Gardner,F.F.,Milne,D.K.,Mezger,P.G.,and Wilson,T.L.,1970, Astr.Ap.,7,
349.
Gardner,F.F.,Dickel,H.R.,and Whlteoak,J.B.,1973, Astr.AD.,23, 51.
Garmany, C.D.,ContI,P.5.,and Chlosl,C.,1982, Ap.J.,263, 777.
Georgelin,Y.,1975, Ph.D.dissertation,Universitede Provence,Observatoire
de Marseille.
GeorgelIn,Y.M.,and GeorgelIn,Y.P.,1976, Astr._2.,49, 57.
Georgelin,Y.P.,and Georgelin,Y.M.,1970a, Astr._., 6, 349.
Georgelin,Y.P.,and Georgelin,Y.M.,1970b, Astr._., 7, 133.
Gillispie,A.R.,Huggins,P.J.,Sollner,T.C.L.G,Phillips,T.G.,Gardner,F.F.,
and Knowles, S.H., 1977, Astr. Ap., 60, 221.
Gordon, M./_, and Burton, W.B., 1976, Ap. J., 208, 346.
Goss, W.M., and Shaver, P./L, 1970, Austral/an J. ofPhys. Supp/e., 14,1.
Goss, W.M., Radhakrishnan, V., Brooks, J.W., and Murray, J.D., 1972,
A#. J. Suppl, 24, 123.
Goss, W.M., Manchester, R.N., Brooks, J.W., Sinclair, M.W., Manefleld, G.,
and Danziger, I.J., ! 980, M. N. R A S., 19 i, 533.
Goy, G., 1973, Astr. _ Supp/, 12, 277.
Graham, J.A., and Lyng§, G., 1965, Mere. Mr. Strom/o Obs., No. 18.
114

Graham, J.A., 1970, A J., 75, 703.
Gum, C.5., 1955, IYem. R. A. 5, 67, 155.
Habets, G.M.H.J., and Helntze, J.R.W., Astr. Ap. Suppl., 46, 193.
Harvey, P.M., HOffman, W.F., and Campbell, M.F., 1979, Ap. J., 227, 114.
Haynes, R.F., Caswell, J.L., and 5imons, L.W.J., 1978, AustrelianJ. of Phys.
Supple.,45, I.
Haynes,R.F.,Caswe11,J.L.,and 5imons,L.W.J.,1978, AustralianJ.ofPhys
Supple.,48, I.
Henderson,A.P.,Jackson,P.D.,and Kerr,F.J.,1982, Ap.J.,263, 116.
Herbst, W., and Mlller, D.P., 1982, A J., 87, 1478.
Hl11, E.R., 5lee, O.B., and rlllls, B.Y., 1958, Austrai/anJ. of Phys., I 1,530.
Hofflelt, D., 1953, Harvard Ann., I 19, 37.
Huchtmeier, W.K., and Day, G.A., 1975, Astr. Ap, 41, 153.
Humphreys, R.M., 1970, A J., 75, 602.
Humphreys, R.M., 1972, Astr. Ap., 20, 29.
Humphreys, R.M., 1976, Pub. A 5. P., 58, 647.
Humprheys, R.M., 1978, Ap. J. 5upp/, 38, 309.
Humphreys, R.M., and Kerr, F.J., 1974, A,o.J., 194, 301.
Israel, R.P., de Graauw, T., deVrles, C.P., Brand, J., van de 5tadt, H.,
Habing, H.J., Wouterloot, J.G./k, van Amerongen, J., van der Blezen, J.,
Leene, A., Nagtegaal, I., and 5elman, F., 1984, Astr. Am., 134, 396.
Jones, B.B., 1973, Australian J. of Phys, 26, 545.
Kaufmann, P., Zlsk, 5., 5callse, E. Jr., 5chaai, R.E., and Gammon, R.H., 1977,
A J., 82, 577.
Kerr, F.J., Hindman, J.V., and Carpenter, M.5., 1957, Nature, 180, 677.
Kerr, F.J., 1970, In IAU Sympos/um 38, TheSpiral Structure or our Galaxy
ed., W. Backer and G. Contopouios (Dordrecht: Reidel), p. 95.
115
Kerr, F.J., and Kerr, M., 1970, Ap. Letter_ 6, 175.
Klrshner, R.P., and Wlnkler, F.P. Jr., 1979, Ap. J, 227, 853.
Kutner, M.L., Tucker, K.D., Chin, G., and Thaddeus, P., 1977, AZ_.J., 215, 521.
Kutner, M.L., 1978, Ap. Zetter_ 19, 81.
Lacy, J.H., Beck, 5.C., and Geballe, T.R., 1982, _. J., 255, 510.
Lada, C.J., Elmegreen, B.G., Cong, H-I., and Thaddeus, P., 1978,
Ap J. (Letters), 225, L39.
Laurent, C., Paul, J.A., and Pettinl, A., 1982, A#. J., 260, 162.
Lebrun, F., Bennet, K., Bignami, G.F., Bloemen, J.B.G.M., Buccherl, R.,
Caraveo, P.A., Gottwald, M., Hermsen, W., Kanbach, G.,
Mayer-Hasselwander, H._, Montmerle, T., Paus, J.A., 5acco, B.,
5trong, A.W., Wllls, R.D., Dame, T.M., Cohen, R.5., and Thaddeus, P., 1983,
Ap. J., 274, 231.
Levato, H., and Malaroda, 5., 1981, Pub. A. S. P., 93, 714.
Levato, H., and Malaroda, 5., 1981, Pub. A. 5. P., 94, 807.
Liszt, H.5., and Burton, W.B., 1981, Ap. J., 243, 778.
Lockman, F.J., 1984, Ap. J., 283, 90.
Loden, L.O., and 5undman, A., 1980, Astr. Ap., 9 I, 59.
Lyng_, G., 1970, Astr. Ap., 8, 41.
Manchester, R.N., Robinson, B.J., and Ooss, W.M., 1970, Australian J. of Phys.,
23, 75 I.
Mathewson, D.5., Healy, J.R., and Rome, d.M., 1962, AustralianJ. of Phys., 15,
354.
Mathewson, D.5.,Healy,J.R.,and Rome, J.M.,1962, AustralianJ.ofPhys.,15,
369.
Mauzy, B., 1974, NRAO Electronics Division InternalRepor_ No. 146.
116
McCutcheon, W.H.,Robinson, B.J., Whiteoak, J.B., and Manchester, R.N., 1983,
In Kinematics,Dynamics, and Structureof theMilky Way,
ed.W.L.H.5huter (Dordrecht:Reidel),p.165.
McGee, R.X.,and Gardner,F.F.,1968, AustrallanJ.o£Phys, 2 I,149.
McGee, R.X.,Newton, L.M.,and Batchelor,R.A.,1975, AustralianJ.ofPhys_
28, 185.
McGee,R.X.,andNewton,L.M.,198I,M N R.,4.S, Ig6, 889.
Mezger, P.O., Wilson, T.L., Oarnder, F.F., and Mllne, D.K., 1970, Ap. Letter_ 6,
35.
Miller, G.E., and 5calo, J.M., 1979, Ap. J_ 41,513.
MIlls,B.Y.,1959, In IAU SymposIum 9,ParisSymposium onRadio Astronomy,
ed.R.N.Bracewell(5tanfordUniversityPress),p.431.
M11ne D.K.,Wilson,T.L.,Gardner,F.F.,and Mezger,P.G.,1969, Ap.Letter_ 4,
121.
M11ne,D.K.,197g, AustralianJ.ofPhys.,32, 83.
Moffat,A.F.J.,and Vogt,N.,1975, Astr.AD.5uppL,20, 125.
Morgan,W.W.,5harpless,5.,and Osterbrock,D.E.,1952, ,4.J.,57, 3.
Morgan,W.W.,Whltford,h_E.,and Code,kD., 1953, Ao. J_ I18, 318.
Myers, P.C.,Dame, T.M.,Thaddeus,P.,Cohen,R.5.,5ilverberg,R.F.,Dwek, E.,
and Hauser,M.G.,1985, Inpress.
Neckel,Th.,and Klare,G.,1980, Astr._o.Suppl.,42, 251.
Oort,J.H.,Kerr,F.J.,and Westerhout,G.,1958, M N.R.,4.S.,I18, 379.
Penzlas,A.A.,and Burrus,C./_,1973, Ann.Rev.Astr.AD.,I I,51.
Retallack,D.5.,and Goss,W.M.,1980, MNR. A.5, 193, 261.
Retallack,D.5.,1983, M N.R.,4.S, 204, 669.
117
Robinson, B.J., Manchester, R.N., Whiteoak, J.B., 5anders, D.B., 5covllle, N.Z.,
Clemens, D.P, McCutcheon, W.H., and 5olomon, P.M., 1983,
Ap. J.(Letters),283, L31.
Rodgers, A.W.,Campbell, C.T.,Whlthoak, J.B.,BaIly,H.H.,and Hunt, V.O.,1960,
An Atlas of H_Emisslon m the Southern Milky Way, Canberra.
Rodgers, A.W.,Campbell, C.T.,Whithoak, J.B.,1960, MNR./{ 5_ 121, I03.
Sanders, D.B.,5olomon, P.M.,and 5coville,N.Z.,1984, A_. J.,276, 182.
Sanders, D.B.,5coville,N.Z.,and 5olomon, P.M.,1985, Ap. J_ 289, 373.
5andqvlst, Aa., 1977, Astr. Ap., 57, 467.
5calise, E. Jr., and 5chaal, R.E., 1977, Astr. Ap_ 5?, 4?5.
5callse, E. Jr., and Braz, M.A., 1980, Astr. Ap_ I}5, 149.
5coville, N.Z., and Solomon, P.M., 1975, Ap. J. (Letters), 199, 535.
5eward, F.D., and Chlebowskl, T., 1982, Ap. J., 256, 530.
5hayer, P.A., and Goss, W.M., 1970a, AustralianS. of Phys., 14, 77.
5hayer, P.A., and Goss, W.M., 1970b, Austral/an J. ofPhys., 14, 133.
5her, D., 1965, Ouart. J. R. A. Jr 6, 299.
51monson, 5.C. III, 1970, Astr. Ap_ 9, 163.
Smith, L.F., Biermann, P., and Mezger, P.G., 1978, Astron. Ap., 66, 65.
5olomon, P.M., Sanders, D.B., and 5coville, N.Z., 1979, in /AUSympos/um 84,
The Large-Scale Characteristics of the Galaxy,ed. W.B. Burton
(Dordrecht: Reldel),p.35.
5olomon, P.M.,5anders, D.B.,and Rivolo,A.R.,1985, Ap. J. (Letters_ 292,
LI9.
5pitzer,L.Jr.,1978, Physical Processes in the InterstellerMedium,
John Wiley and 5ons, New York.
5tothers, R.,1972, Ap. J.,175, 43 I.
5undman, A., 1979, Astr. Ap. Suppl.,35, 327.
I18

Tammann, G.A.,1970, in /AUSymposium o'8,The SpiralStructureofour
Galaxy,ed.,W. Becker and G.Contopoulos(Dordrecht:Reidel),p.236.
Thomas, B.,and Day,G.A.,1969, Austra/ianJ.ofPhys.Supple.,II,3.
Tucker,K.D,Kutner,M.L.,and Thaddeus,P.,1973, AD.J.(Letters),186, L13
Turner,D.G.,1978, A.J.,83, 108 I.
Turner,D.G.,Grieve,G.R.,Herbst,W.,and Harris,W.E.,1980, A.J.,85, 1193.
vanden Bergh,5.,1978, Astr ,_o_63, 275.
Vogt,N.,and Moffat,A.F.J.,1975, Astr.Ap, 39, 4?7.
Walborn,N.R.,1971, ,_.J.(Letters),167, L31.
Walborn,N.R.,1973, Ap.J.,179, 517.
Walborn,N.R.,1982, ,_.J.Suppl,48, 145.
Walborn,N.R.,and Hesser,J.E.,1982, Ao.J_ 252, 156.
Weaver, H.,1970 in /AU Symposium 38, TheSpiralStructureofour Galaxy,
ed.,W. Becker and G.Contopoulos(Dordrecht:Reidel),p.126.
White,G.J.,and Phillips,J.P.,1983, MN.R. A S.,202, 255.
Whiteoak,J.B.,1983, in Surveys of theSouthernGalaxy,ed.W.B.Burtonand
F.P.Israel(Dordrecht:Reidel),p.31.
Whiteoak,J.B.,and Gardner,F.F.,1970, Ap.Letter_ 5, 5.
Whiteoak,J.B.,and Gardner,F.F.,1974, Astr.Ap_ :37,389.
Wilson,T.L.,Mezger,P.G.,Gardner,F.F.,andMilne,D.K.,1970, Astr._o.,6,
364.
119

APPENDIXA
TELESCOPEPOINTINO
Telescopetrackingwas carriedout under computer controlby
continuoustransformationofsource rightascensionand declinationto
azimuth and elevation,the telescope'spointingbeingmaintained by an
alogrithmthatutilizedpositionand velocityfeedback.The pointingmodel,
described in detail in Cohen (1977), was based on the assumption that, for a
perfectly vertical azimuth axis and a mechanically perfect mount, all
pointing errors can be corrected by applying constant offsets in azimuth and
elevation only. Atllt of the azlmuth axis with respect to the vertical is
equivalent to a shift in the true geocentric latitude and longitude of the
telescope and can be accounted for by using the apparent latitude and
longitude in the transformation from right ascension, declination to
azlmuth, elevation. Nonperpendlcularity of either the altitude and azimuth
axes or the altitude and optical axes is easily corrected by including an
elevation-dependent term for each in the azimuthal pointing. In order to
point the telescope, then, a total of six parameters must be determined: one
offset each for the elevation position encoder, the azimuth encoder, the
latitude, and the longitude; and two constants describing the degree of
mount imprecision (nonperpendlcularlty terms). The determination of these
parameters is described briefly in this appendix, and the pointing accuracy
of the telescope is discussed.
120

A. Determination of Polntlng Parameters
Because the planets and other small continuum sources are not
sufficiently bright at millimeter wavelengths to be readlly detected by the
1.2 m antenna, the polntlng parameters were determined wlth a small
optical telescope mounted on the back of the antenna. First, with rough
alignment of the optical axes of the radio and optical telescopes, and with
approximate values for the latltude and longitude of the mount, the optical
telescope was pointed at the Sun to obtain approximate azimuth and
elevation encoder offsets. Next, using these offsets, the radio center of the
Sun was located to -0.3' by finding the symmetry points of radio scans (in
azimuth and elevation) across the Sun's llmb; more accurate encoder offsets
were derived in this way. Then, with the antenna tracking (under computer
control) the radio center of the Sun, the optical telescope was mechanically
adjusted until the solar image was centered, to within a fraction of an arc
minute, in a circular reticle that has the same apparent diameter as the Sun.
This last procedure assured good alignment of the optical axes of the radio
and optlcal telescopes. The two nonperpendlcularlty parameters were
assumed to be small and were taken to be zero in the pointing model (see
Cohen 1977 for the procedures for the determination of these parameters);
the assumption that these terms could be ignored was later justified by the
results of the pointing tests.
Having collimated the radio and optical telescopes, Improved
parameter valueswere determined throughan optical"starpointing'"
procedure.With the encoderoffsetsderivedfrom the Sun pointingand the
approximate latitudeand longitudeinplace,but no correctionsforpossible
nonperpendicularityof themount axes,thetelescopewas made totrack,
121
under computer control, a number ofbrightstarsspread across the sky.
Each starwas centeredinthe opticaltelescsopeby using a paddleto offset
the automatictracking,and the deviationof the truepositionfrom that
predictedby the pointingmodel was recorded.The computer then makes a
least-squaresfitofthe model to the data,yieldingthe new parameter
values.
B. PointingAccuracy
I. ShaftEncoders
Azimuth and elevationaremeasured with Baldwin 16 bitopticalshaft
encodersconnectedto the azimuth and elevationaxes by flexiblecouplers.
Each bitcorrespondsto I/2i6revolutionsor0.33 arc minutes;the specified
precisionby Baldwin ofthese encoderswas _+Ibit.The angularoffset
between the absolutezeroof each encoderand zerodegreesazimuth or
elevationwas determined from the starpointingprocedure.
2. Starpointing
A second starpolnting,againwithoutany correctionsfornon-
perpendicularityofthe mount axes,was carriedout using the encoder
offsetsand telescopecoordinatesdetermined from the previous
starpointlng.The peak pointingerrorfrom thisnew testwas 0.48'and the
RM5 errorwas 0.19'.These numbers compared with the 8.8'beamwidth of
the antennaindicatedthatthe mount was sufficientlypreciseto ignorethe
nonperpendicularityterms inthe pointingmodel. FigureA1 shows the sky
122

coverage of the 37 stars used in this test, and Figures A2a-d show the
errors as a functlon of azlmuth and elevation. A quantlzatlon of the points
in error results from the discrete step-size (//-half bits) of the offsets
commanded from the paddle.
Periodic starpointlngs were performed to check the pointing. The peak
and RM5 errors from a third point done about two weeks after the second
were 0.64' and 0.35', respectlvely. After about one year of operation a drift
of the azimuth axls wlth respect to the vertical resulted In peak errors of
1.6', and new parameters were installed.
3. 5unpointing
A daily check on the pointing was made by measuring the deviation
between the observed position of the radlo center of the 5un (located by the
method described above) and the expected position. These tests Indicated a
systematic elevation error of about I' with respect to the starpolntlng
parameters, the observed position of the 5un almost always being lower (in
elevation) than the expected position. The source of the error could not be
determined, although a slow drift of the azimuth axis may have been a
contributing factor since these errors, as well as smaller azimuth errors,
appear to have generally worsened with time (Fig. A-3). For 74
sunpointings, the peak total error [(Se2+6a2.cos2e) !/2] and RM5 of the total
errors were 1.7' and I. l', repectlvely (excluding one pointing at 6"
elevation).
123

TABLE II- I
CO-FREEREFERENCEPOSITIONS
I(') b(')
272.00 -5.00
273.00 -5.00
274.00 -4.00
275.00 -5.63
276.18 -4.95
278.95 -5.04
282.24 3.71
283.50 2.20284.12 -3.43
284.50 0.88285.00 3.00
288.00 5.00
288.47 -3.09291.00 0.75291.70 3.70
292.30 4.00292.67 3.01
292.76 - 1.18293.00 5.00294.71 1.46295.00 5.00297.00 4.00
124

TABLE IV- 1
Z-DISTRIBUTION OF H2 IN THE OUTER GALAXY TOWARD THE CARINA ARM
Radius < Z0 > Zl/2 p(< Zo >) Ofit Omeisure d
(kpc) (pc) (Me pc-3) (M@ pc-2)
10.5 -48 ± 18 112±21 0.0078_+0.0015 1.88±0.50 2.18±0.08
11.0 -73 ± 16 120± 16 0.0077±0.0008 1.96±0.34 2.11 ±0.06
11.5 -109t 19 128t25 0.0104±0.0017 2.79t0.71 3.00t0.04
12.0 -145t20 141 ±26 0.0060±0.0008 1.78t0.41 2.02±0.04
12.5 -167±25 182±31 0.0034±0.0004 1.32±0.28 1.40±0.04
13.0 -113±70 277±86 0.0017±0.0014 0.95±0.38 1.02±0.04
125

TABLE V- 1
MA551VE MAIN 5EQUENCE 5TAR5 IN THE _1 CARINAE NEBULA
HDINo. 5p.Type ref Iog(M/M e) Cluster
93161 06.5V((f)) 2 1.58 Tr 16
93204 05V 2 1.76 Tr 16
93205 03V 2 2.08 Tr 16
93250 03:V((f)) 2 2.08 Tr 16
93343 08Vn 2 1.42 Tr 16
303308 03V((f)) 2 2.08 Tr 16303:31 I 05V 2 1.76 Tr 16
1 09.5V 2 1.25 Tr 16
2 B 1.5:V: 2 1.02 Tr 16
3 O9:V: 2 1.41 Tr 16
5 B2:Vn 2 0.96 Tr 16
8 B 1.5Vb 2 1.02 Tr 16
9 09.5V 2 1.25 Tr 16
10 BOVn 2 1.19 Tr 16
13 B2Vnn 2 0.96 Tr 16
16 B2Vb 2 0.96 Tr 16
19 09.5V 2 1.25 Tr 16
20 BI:V 2 1.08 Tr 16
23 07Vn 2 1.54 Tr 16
31 BOVn 2 1.19 Tr 16
34 08109:V: 2 1.36 Tr 16
64 B 1.5V:b 2 1.02 Tr 16
94 B IVn 2 1.08 Tr 16
IO0 05.5V 2 1.69 Tr 16
104 07:V: 2 1.54 Tr 16
1I0 07V 2 1.54 Tr 16
112 04.5V((f)) 2 1.84 Tr 16
115 ogv 2 1.41 Tr 16
305536 08.5V I 1.36 Cr 228
305522 BO.5V I I.12 Cr 228
305534 BO.5V:+B IV I I.12 Cr 228
93056 B IVb I 1.08 Cr 228
305521 BO.5V I I.12 Cr 228
21 07.5Vn I 1.46 Cr 228
305437 BO.5V I I.12 Cr 228
126

TABLE V-1 (continued)
MASSIVE MAIN SEQUENCE STARS IN THE _1 CARINAE NEBULA
HDINo. 5p. Type ref log(M/Me) Cluster
305438 07.5V I 1.46 Cr 228
305535 B2.5V I 0.92 Cr 228
93208 08.5V I 1.36 Cr 228
305543 B 1V+B IV 1 1.08 Cr 228
30 B 1.5V I 1.02 Cr 228
305516 BO.5Vb I I.12 Cr 228
36 BO.5:V:+BO.5:V: I I.12 Cr 228
37 B2Vb 1 0.96 Cr 228305532 05V I 1.76 Cr 228
39 08V I 1.42 Cr 228
43 B2Vb 1 0.96 Cr 228
305515 B 1.5Vsn 1 1.02 Cr 228
305533 BO.5:Vnn+shell I I.12 Cr 228
48 B 1.5Vb I 1.02 Cr 228
93146 06V I 1.61 Cr 228
66 09.5V I 1.25 Cr 228
67 ogv I 1.41 Cr 228
68 B 1V 1 1.08 Cr 228
305528 B2V 1 0.96 Cr 228
81 BO.5Vb 1 1.12 Cr 228
305538 BOVb I I.19 Cr 228
89 B2V 1 0.96 Cr 228
93576 09Vn 1 1.41 Cr 228
305539 07V 1 1.54 Cr 228
95 BOVb 1 1. I 9 Cr 228
97 05V 1 1.76 Cr 228
305525 06V I 1.61 Cr 228
127

TABLE V-I (continued)
MASSIVEMAIN SEQUENCESTARS IN THE T1 CARINAE NEBULA
HD/No. Sp. Type ref log(M/M e) Cluster
93027 og.5v 3 1.25 Cr 228
93128 03V((f)) 3 2.08 Tr 14
g312gB 03V((f)) 3 2.08 Tr 14
-58 2620 06.5V((f)) 3 1.58 Tr 14
Referencesforspectral types:
I. LevatoandMalaroda(1981).2. LevatoandMalaroda(1981).3. Walborn(1973).
128

TABLE V-2
CARINA ARH MOLECULARCLOUDS
No. ] b v AV dist Refr Mco M_p Notes
(') (kin s-i ) (kpc) (pc) (10 s Me)
1 270.9 -0.5 52 7 6.8 57 2.2 5.1 a,d,g,n
2 279.9 - 1.6 35 5 7. ! 37 1.0 2.1 a,d,g3 281.4 - 1.1 -5 13 3.2 101 22.5 37.5 a,d,h
4 282.0 -0.8 17 5 6.1 88 2.7 4.6 c,e,g5 282.9 1.3 -19 6 2.2 26 .7 2.2 a,d,g,k6 282.9 -0.7 -5 9 3.2 31 2.8 5.6 a,d,g,i7 283.8 0.0 -5 10 4.0 65 6.3 13.1 b,e,h
8 284.5 -0.2 12 8 6.6 123 20.3 14.9 b,e,g
9 285.3 0.0 0 10 5.3 88 4.5 17.4 b,e,g,j10 286.4 -0.3 14 8 7.5 84 8.3 9.9 a,d,g11 287.5 -0.5 - 19 10 2.7 66 6.7 13.6 a,d,h
12 288.6 1.5 -22 7 3.2 56 3.5 5.8 a,d,g,k13 289.3 -0.6 22 15 7.9 132 31.2 64.9 a,d,h
14 290.2 -0.2 -1 5 6.8 55 2.7 3.2 a,d,g,i15 290.6 -0.2 15 10 8.7 80 4.3 15.1 c,e,g16 291.4 -0.2 - 7 4 ........ a,d,o17 291.6 -0.4 15 10 7.2 73 4.1 14.1 b,e,h
18 291.6 -0.5 29 6 10.3 105 12.5 6.7 a,d,g19 292.6 -0.3 4 4 8. I 31 12.0 9.1 b,e,g,i20 293.3 -1.4 -25 8 2.4 77 7.1 9.2 a,d,h
21 294.0 -0.9 32 8 11.3 102 12.2 13.1 a,d,g
22 294.4 -0.7 -3 10 8.0 109 12.2 22.0 a,d,g,i23 295.1 -0.8 26 11 11.0 64 4.5 16.3 a,e,g24 297.4 -0.5 22 18 11.2 154 32.1 102 a,d,g25 298.6 0.I -35 10 4.7 139 26.5 26.3 a,d,g,k26 298.8 -0.2 25 16 12.0 157 30.8 83.5 a,d,g
27 299.4 -0.1 -6 9 9.4 66 4.6 12.0 b,e,g,i28 300.3 -0.2 31 9 12.9 61 7.0 10.4 g,l,m29 300.6 -0.2 10 7 1I. 1 61 4.2 6.4 g,!,m30 301.8 0.0 24 7 12.7 44 4.2 4.5 g,l,m31 302.3 -0.7 32 11 13.6 97 29.4 24.6 g,l,m32 303.9 -0.4 29 13 13.7 144 46.2 5 I. 1 g,l,m
129

TABLE V-2 (continued)
CARINA ARM MOLECULAR CLOUDS
No. / b v AV dist Rerr McO M_r Notes
(') (kin s -1) (kpc) (pc) ( 105 Me)
33 306.9 -0.5 25 7 14.2 50 5.6 5.2 g,l,m
34 308.0 -0.7 32 11 15.1 113 21.0 28.7 g,l,m
35 311.3 -0.3 27 17 15.5 210 109.2 127 g,l,m
36 313.2 -0.3 42 10 17.6 100 18.2 21 g,l,m
37 314.0 -0.I 28 7 16.4 59 4.2 6.1 g,l,m
38 315.3 -0.3 14 I0 15.4 72 11.2 15.1 g,l,m
39 318.0 -0.3 30 15 17.6 148 2.8 69.9 g,l,m
40 320.5 -0.5 26 17 17.8 155 12.6 94.1 g,l,m
41 325.3 -0.1 28 12 19.3 115 19.6 34.8 g,l,m
42 328.5 -0.1 30 6 20.4 55 5.6 4.2 g,l,m
43 335.5 -0.5 27 5 22.0 24 >0.6 1.3 g,l,m
NotesonTableY-2:
a) YelecityfromOaussianfittocompositespectrumb) Velocityfromhand-drawn"eyeball"fittocompositespectrumc) Yelacltyfrom /,v mapd) FWHMfrom eaussianfit to compositespectrume) FWHMfrom hand-drawn "eyeball" fit to compositespectrumf) FWHM from /,vmapg) Kinematicdistanceh) Opticaldistancet) Distanceambiguity resolved with radius-line width relation (Dame eta/. 1985)j) Distanceambiguity resolved with foreqr'oundabsorptionk) Yelocltyplacescloudat subcantralpointI) Cloudidentfication from Bronfman(1985)m) Cloudparameters from 8ronfman ( private communication)n) Thiscloudis probably not in theCar'inearm -- see"Noteson IndividualClouds"in ChapterVo) Associatedwith localdust; distance unknown-- see "Noteson IndividualClouds" In ChapterY
130

FIGURECAPTIONS
Chapter II
Figure !1-1: Schematic diagram of telescope mount and antenna. The
housing shown on the base of the mount actually corresponds to the Northern
Millimeter-Wave Telescope, but otherwise the Northern and Southern
telescopes are mechanically Identical. Individual components are discussed
in the text.
Figure 11-2: Block diagram of telescope system. Analog and digital signals
are drawn in thick and thin lines, respectively. The main components are
discussed in the text.
Chapter III
Figure III-1: Survey coverage and sampling. Observed full resolution
positions are marked by circles of 8.8' diameter (one beam); spacing is
O.125". The entire area within the map was observed every 0.5" in / and b
In the 0.5" Superbeam survey; a few squares indicate the 0.5" beam sampling
pattern.
131
FigureIII-2:Sample spectrafrom the fullresolutionsurvey.Allspectra
coverabout 330 km s-iwith 256 channels,eachl.3km s-iwide. A straight
line,from a fitto the firstand last40 channels,was removed from each
spectrum. Typicalintegrationtimes were 5 minutes,yieldingRMS noiseof
about O.14 K per channel.The temperaturescaleon the rightisinunitsof
radiationtemperature.
FigurellI-3:Spatialmap from the 5uperbeam survey showing allemission
between v = -50 and +50 km s-i.Contoursare at6, 12, 18,..K km s-i.
Figure 111-4: Spatial map combining both the full resolution and Superbeam
surveys showing all emlsslon between v = -50 and +50 km s-i. The full
resolution data are shown withln the dotted lines, the 5uperbeam data
beyond the dotted lines. Contours are at 6, 12, 18,... K km s-1.
FigureIII-5:Spatialmap from clipped5uperbeam datashowing emission
between v = - IO0 and +I00 km s-i.Allspectralchannelsbelow 0.5K (_,3d)
were set tozero beforeintegrating.Contoursare at 3,6 12, 18,...K km s-i.
FigureIII-6:Spatialmap combiningclippedfullresolutionand clipped
5uperbeam datashowing emission between v = -I00 and + I00 km s-_.All
specatralchannelsbelow 0.5K (_3d) were set to zerobeforeintegrating.
Contoursare at3,6, 12, 18,...K km s-_.
Figure 111-7: Full resolution integrated /,v diagram. The CO emission has
been integrated over all latitudes where data were taken (see Fig. II I-1 for
outline of survey coverage). Contours are at 0.35, 0.7, 1.4, 2. I,... K deg.
132

Figure 111-8: 5uperbeam integrated /,v diagram. The COemission has been
integrated over all latitudes where data were taken (b = +5" to -5").
Contours are at 1.0, 1.5, 2.0, 2.5,... K deg.
FigureIII-9:Integrated/,vdiagram of fullresolutiondata smoothed In / to
0.5"forcomparison with the 5uperbeam Integrated/,vdiagram (Fig.III-6).
Contours are at 1.0,1.5,2.0,2.5,...K deg.
Chapter IV
FigureIV-l: (a) FullresolutionIntegrated/,vmap; identicaltoFigureIII-5
but on a smallerscale.(b) Key. Approximate heliocentricdistancesare
marked off alongthe Cartnaarm. The darklinesare schematic and not
derivedfrom a model. The regionsenclosedIndottedlinesand labeled4 4
6;and d show the velocitylimitsused inthe spatialmaps ofthe near side,
tangentregion,and farsideof the Carinaarm (Figs.IV-3a-d and V-I a-d).
Figure IV-2: COemission Integrated over all covered velocities and
latitudes (in units of K km s-1 deg) as a function of longitude. Tylcal RM5
noise (lo) per longitude point ls 2.2 K km s-1 deg.
133

Figure IV-3: Spatial maps of COemission integrated over the indicated
velocity ranges. Part a contains the near side of the Carina arm; part b the
tangent region; parts c and d the far side. Full resolution data are shown
inside the dotted lines in the maps covering / = 270" to 300" (a-c);
Superbeam data are shown beyond the dotted lines. At 1 > 300", only full
resolution data are available. The contour interval is 5 K km s-i.
FigureIV-4: Galactocentricringsof radii10.5,11.0,11.5,12.0,12.5,and
13.0kpc are shown transformed to the /,vplaneusinga flatrotationcurve,
V(R) = 250 km s-i.An outlineof thedata isalsoshown (shadedregion).
FigureIV-5: Volume densityofH2 as a functionofverticaldistance,z,from
the galacticplane atfixedgalactocentricradiibeyond the solarcircle.Each
pointinz representsan averageover20 pc binsinz and 500 pc ringsinR
(seeSectionIV.A.3forprocedure).Solidlineshows the data;dotted lineis
the best-fitGaussian.The radiiindicatedinparts a - f mark the centerof
the 500 pc rings.
Figure IV-6: Longitude-velocity map of H I emission integrated in latitude
from b = +2" to -2". Data, from the Parkes 18 m 21-cm survey of the
Southern Mllky Way (Henderson et al 1982), are In units of brightness
temperature. Contour interval is 25 K deg.
134

Figure IV-7: Comparison of CO and H I high velocity ridges. The difference
between the mean CO high velocity ridge and the mean H Ihlgh velocity ridge
Is plotted. The mean high velocity ridge at each I is defined as the
velocity-weighted emission (CO or H I)within +25 km s-I of the expected
rotation-curve velocity at that L The solid llneshows the result using the
rotation curve of Burton and Gordon (1978), and the dotted lineshows the
result using a simple straight line drawn in the /,vplane from
v = -85 km s-I, I - 330", to v = 0 km s-I, I = 270".
Figure IV-8: Longitude-velocity map of c11pped H Iemission integrated In
latitude from b - +2" to-2". All spectral channels with Tb < 50 K were
set to zero before integration.Contour intervalis 25 K deg.
Figure IV-9: Spatial map of H Iemission integrated from -I00 to
+ 1O0 km s-i. Contours are at 500, 2000, 4000, 6000,...K km s-i.
Figure IV-lO: Spatial maps of H Iemission in the Carina arm integrated
over the indicated velocity ranges. These maps correspond to the CO spatial
maps of the near side, tangent region, and far side of the Carina arm
(Figs.IV-3e - d ). Contours are at I00, 200, 400, 600,...K km s-I.
135
FigureIV-II- Volume densityofH Ias a functionof verticaldistance,z,
from thegalacticplaneatfixedgalactocentricradiibeyond the solarcircle
(analogoustoFigs.IV-5a -f). 5olidlineshows the data;dotted lineis
best-fitGaussian.The radiiindicatedinparts a - f mark the centerof the
500 pc rings.FollowingHenderson etaL (1982),an opticaldepth correction
was appliedincalculatingthe number densityat each /,b,and v:
nHi(_b,v)= i.823xiO 18T5 _'(/,b,v)Idv/drlatoms cm -2(km s-i)-i
where r isthe (kinematic)distanceto the point,Ts (= 125 K) isthe
(assumed uniform)spintemperature,and _(/,b,v)isthe opticaldepth;
_(/,b,v)= - In[i- Tb(/,b,v)/Ts].Each pointinz representsan averageover
50 pc binsinz and 500 pc ringsinR (seetextforprocedure).
FigureIV-12: Parameters of theverticaldistributionsofH2 (circles)
and H I(diamonds)intheouterGalaxybetween R = 10.5and 13.0kpc:
(a)averagemidplanes,Zo; (b)thicknesses,zl/2;and (c)surfacedensities,
(_(notethatthe H Isurfacedensityisdividedby iO to fiton the same
scaleas the H2 surfacedensity).For H2 theparameters are taken from
Gaussianfits(dottedlinesinFigs.IV-5a -f) to the data(solidlinesin
same figures).Errorbars on theH2 parameters representthe formal errors
from the fitineach ring(ofaverageradiusR) multipliedby a galactocentric
dependentcorrectionfactor,_T(N),where N isthe number of resolution
elements (/,b,and v)subtendedby a typicalcloud(50 pc diameter,6 km s-i
wide) atthe averagedistancetothe ring;the correctionfactor
approximatelyaccounts forcorrelationof thedata over the emission volume
of discetemolecularclouds.Because ofthe uncertaintyof the trueform of
theH I layerdistribution,no attempt has been made to estimate the errors
on theparameters.
136

Chapter V
Figure V-1: 5patlal maps of COemission integrated over the Indicated
velocity ranges. Part a contalns the near side of the Carina arm, part b the
tangent region, parts c and d the far side. Inslde the dotted llnes In the
maps coverlng I = 270" to :300" (a-c) and at I > 300" (d), full resolution
data are shown smoothed to 0.25" resolution. Beyond the dotted lines in
parts (a-c), where 0.5" 5uperbeam data are shown, all spectral channels
with T < 0.5 K were set to zero before integration. The contour interval is
3 K I<ms-1. The bold-face numbers on these maps ldentlfy the molecular
clouds in the survey according to their running numbers in Table V-2. For
extended clouds, a palr of llnes radiating from the ID number indicates the
cloud's extent; where the identification may appear ambiguous, a single line
from the ID number points to the cloud. A pair of numbers separated by a
comma indicates that two clouds with nearly the same spatial coordinates
have been blended together in velocity by the integration. The parenthetical
"3" in the near side map (part a) refers to a portion of cloud #3 that spills
over from the tangent region map (part b).
Figure V-2: Optical mosaic of the 11Carinae Nebula and its surroundings
from ESOJ plates of the region. The CO contours overlaid on the mosaic are
from a blowup of the region shown In the near side spatial map (Fig. IV-3a);
the emission ls integrated from -50 to -9 km s-i, and the contour interval is
5Kkm s-1.
137

Figure V-3: Schematic representation of the dust, ionized gas, star
clusters, and COemisslon In the _1Carlnae Nebula.
Flgure V-4: Variation of COemission wlth velocity through the TI Carlnae
molecular cloud. Each spatial map shows the emission integrated over two
spectral channels (2.6 km s-iX The eight maps ( a -h) are contiguous in
velocity and cover the emission from -31 to -10 km s-1. The contour
intervalis 1.4K km s-i.
FigureV-5: 5chematlc illustrationof the giantmolecularcloudassociated
with the _lCarinaeNebula.From righttoleft,the starclustersrepresent
IC 2581, NGC 3293, NGC 3324, Tr 14,Tr 15 (top),Tr 16 (center),and
Cr 228 (bottom).The featurelabelled"wisp"correspondstothe filament
discussed in the text; the arrow indicates its direction of motion with
respect to the main body of the cloud.
Figure V-6: The distribution of massive main sequence stars in the clusters
Tr 14, Tr 16, and Cr 228. All observed early-type stars with spectral
classifications have been binned In O.1-decade wide logarithmic mass
intervals centered at Iog(M/M e) = 2.15, 2.05, 1.95,... 0.95. (See :Section
V.2.C for a description of the stellar mass determinations.) The solid line
shows the logarithm of the number of stars In each interval, and the dotted
line shows the logarithm of the number in each interval plus the sum of all
higher-mass intervals. The number of stars predicted In the indicated mass
intervals by the Miller-Scalo (1979) IMF is shown by the filled circles show.
138

Figure V-7: (a) Face-on view of the Ga]axy with the locations of the
largest molecular clouds. The cloud shown wlth a dashed circle has a very
inaccurate distance and may actually lle In the Carlna arm (see notes to
cloud "25 in Section V.D.). (b) Same as Figure V-8 a replotted in
rectangular semi]og coordinates. The ]lne follows a 10" logarithmic spiral
with a tangent at / = 281"
Figure V-8: Same as Figure V-7a with a I0" logarithmic spiral with a
tangent at /= 281" drawn in.
Figure V-9: Variation of COemlssion wlth veloclty through the tangent
reglon of the Carina arm. Each spatial map shows the emission integrated
over two spectral channels (2.6 I<ms-i). The ten maps (a -j) are contiguous
in velocity, and cover the emission from -18 to +8 km s-1 (see notes to
cloud #3 in Section V.D.). The contour Interval ls 1.4 K km s-_.
Figure V-10: Variation of COemission with veloclty through the molecular
cloud associated with NGC 3576, RCW 60, RCW 61, and RCW 62 (see notes
to cloud _20 in Sectlon V.D.). Each spatial map shows the emission
Integrated over two spectral channels (2.6 km s-_). The eight maps (a -h)
are contiguous In velocity, and cover the emission from -31 to -10 km s-i.
The contour interval Is 1.4 K km s-l.
139
Appendix A
A-I: Azimuth and elevationsof the 37 stars used inthe finalstarpointing
testused to check the pointingaccuracy of the telescope.
A-2: Pointingerrorsof the37 starsfrom the finalstarpointingtest.
(a) Elevationerrorsas a functionof azimuth;(b) azimuth errorstimes
cosineof the elevationas a functionazimuth;elevationerrorsas a funciton
of elevation;and (d) azimuth errorstimes cosineof the elevationas a
functionof elevation.The quantizationinerrorresultsfrom the discrete
stepsizeof the appliedpointingoffsets(seetext).
A-3: Sunpointingerrorsplottedagainstday of 1983. The verticalaxis
shows the totalerror,[Sel2+ 8az2cos2(el)]i/2.
APPENDIX B
FigureB-I: Fullresolution/,vmaps ateach latitudebetween b = 2.5"and
-4.125"(Z_b= 0.i25").At Ibl> i',where longitudecoverage was not
uniform,pairsof dottedlinesmark the longitudeintervalssampled;an odd
number of dottedlinesindicatesthata dottedlinenearestthe top or bottom
longitudeboundaryof the surveyispairedwith thatboundary.Contours are
at 0.5, 1.0, 2.0, 3.0,.. K.
I40

Figure B-2: Full resolution b,v maps at each longltude In the survey
(270" _ I _ 300", NI = 0.125"). The latitudeboundaries of the maps show
the maximum range observed in the fullresolutionsurvey. In general, pairs
of dotted lines mark the latitude intervalssampled; an odd number of dotted
lines indicates that a dotted linenearest the top or bottom latitude
boundary is paired with that boundary. Contours are at 0.5, 1.0,2.0,3.0,...K.
Figure B-3: 5uperbeam /,vmaps at each latitudein the Superbeam survey
(b = +5" to -5", Ab = 0.5").Contours are at 0.5, 1.0,2.0,3.0....K.
Figure B-4: 5uperbeam b,v maps at each longitude in the survey
(270" _ / _ 300", A / -- 0.5"). Contours are at 0.5, !.0, 2.0, 3.0,... K.
141

J
RECEIVERBOX
;HOMETER
NCODER
FIGURE II-1
142

,- .,.I==_ =-=
m
I ¢= ",,'
I_
/,mm
:II-: I
i
.,tu
|
I=_ _
I_' =NO
'°..=-I
li;I,_"] 4_1L __J
J_..=.I ==_-_'_
_, _,1;I I_/
"=_J ._.,_ __I I [
---_T
|
'- ,.=,I
""1J;3 j
I
II(,_ ,--I
¢l[ ,"_
FIGURE 11-2
143

ZM
..JQ.._.-CZ:
Z_r-
hi(.3a:E:L_J
U
>--L_J
E
ORIGINAL PAGE ISOF POOR QU_LITY
%

TYPICAL SPECTRA
L -286. 375
I I I I I I 1 I I
B = 0.375 _'- .... _-_--- _'
0. 250 - -- - --- -- _ --- .- -.--._.-'
-0. t25 -- _ /_. -- - -,- J
-0.250 _ -_- _ L ......
-0. 375 -. .... "_ ....
-0.500 _ ._... _ AJ_._. _ ._,
286. 250
I I I I I 1 I I i
- "_ ,__,, o,T_
A
286.125
'l I I I I I I I I
/
-.__.._.-.L_
- " J= - - -v-- 'r - =.L
]_ 6K
,, ,, _
.. _ .A
A
IIIlllllliI
J I i I i I I I II !
IIIIllllltl
_0_000O00
LSR RADIAL VELOCITY (km s'I_)
FIGURE 111-2
145

'7U')
0LD
%
%
E_I.,-
I
I!
gBZ
N
w
0
._1
I,--
I-.,..
0
%
%
@
%
:lOfll I ll:l] 31.13UTUO
FIGURE 111-3
%!
146
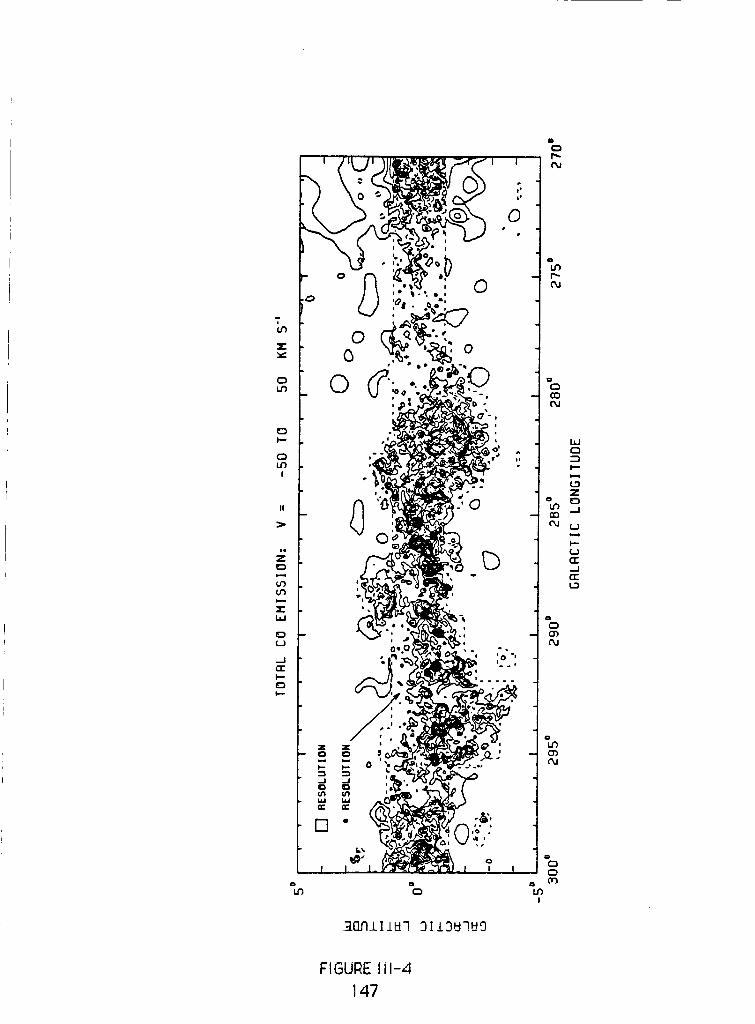
Q
E_
(3
I
II
{3
(_
hi
OO
.J(3:IIOI"
%
00
©
%
%
%
%
%I
_0_±II_7 31±3UqU9
WQ
(3ZO.J
U
UE..J(3:L_
FIGURE Iii-4
147
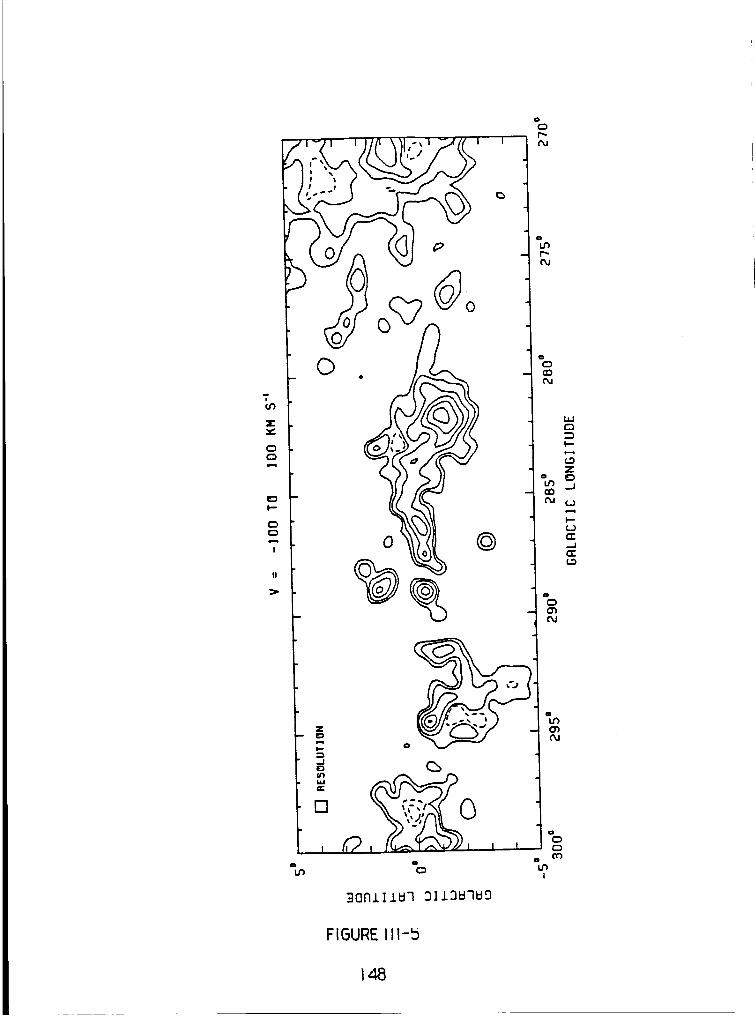
%
,.e
(:3
!
I!
%
©
©
I0
_ o
-, Q:_
E
[]
I _l_ I I
%
_OniIiW_ 3II3WqWO
%
C3O_
%!
FIGURE lll-b
148
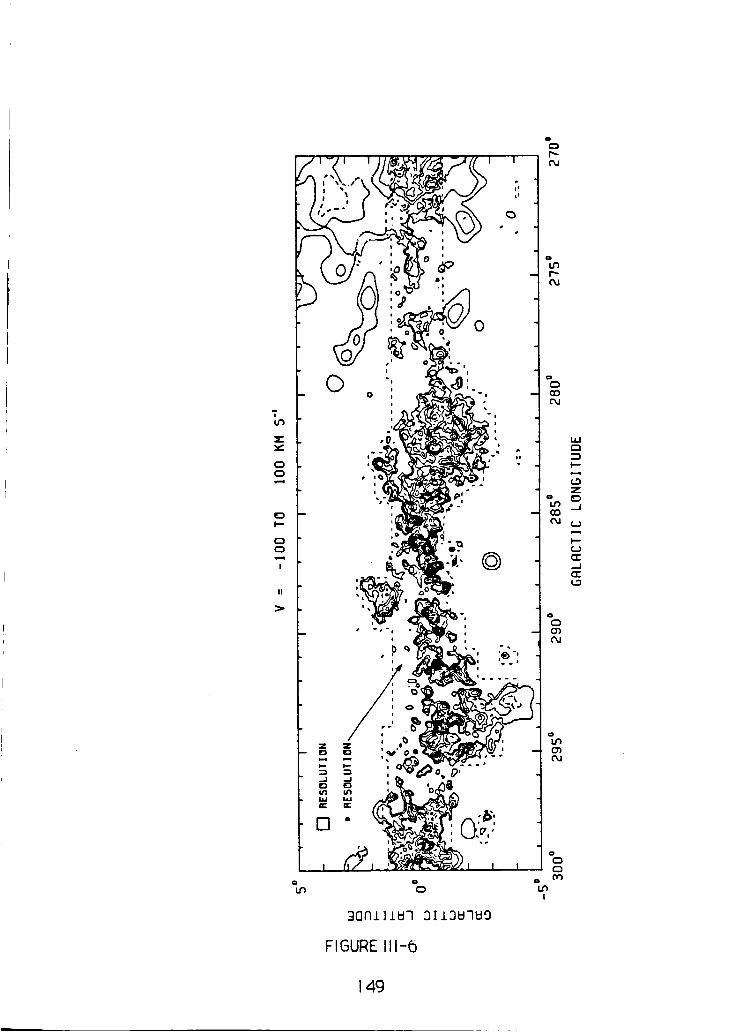
T
oi,-
c3
I
II
I
i Iii
%
%
%('%1
%
_0AI11_7 3113_7_0
oo -/
FIGURE III-6
iI(_I
_J
%
(3")
%c_
%I
149

ORIGINAL PAGE IS
OF POOR QU_Lilr3f
C_
I--
Z
ED
_J
L.)
I.-
L-)
.-1
t'r
(.3
320 =
INTEGRATED L,V HAP
o -
- RESOLUTIONo
290 = "- .
280 =
270 = ' ' ' I ' ' ' I ' I ' I ' ' ' I ' * '1_LL_'' I ' ' ' I ' ' ' I ' ' ' I ' ' I
-100 -80 -60 -_O -20 0 20 _0 60 80 100
LSR RADIAL VELOCITY (KM S")
FIGURE I I I-7
150
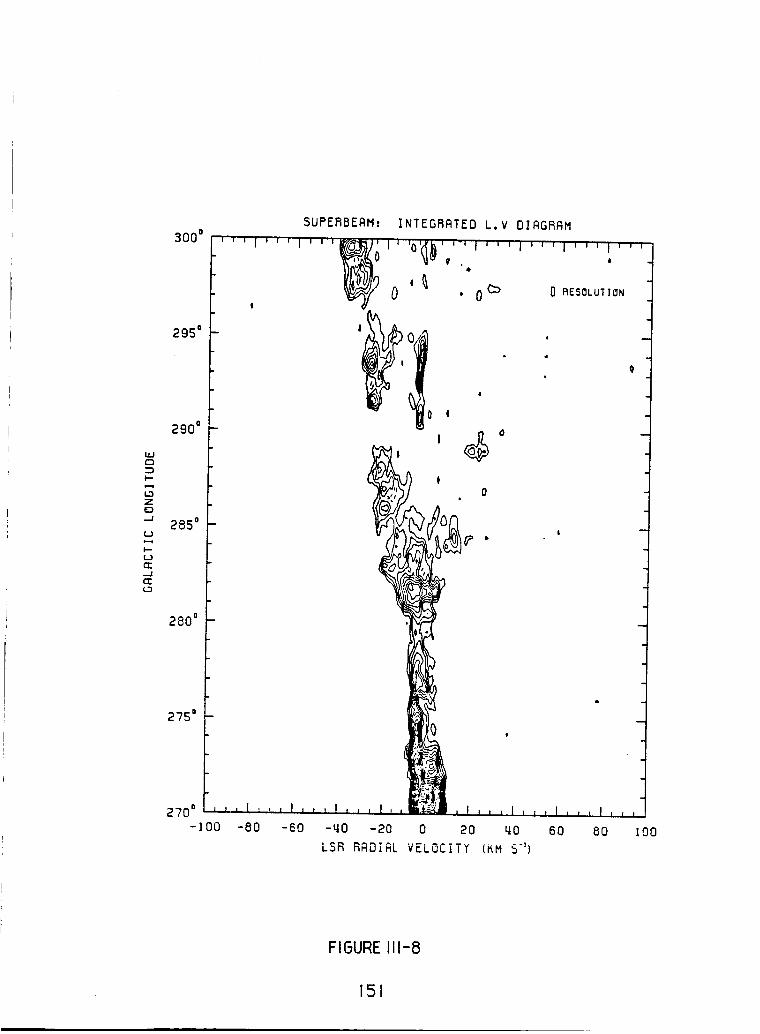
L_Jr_
I'--
C_Z
(J
l--t.Jrr-Jrr(.3
300 o
2g5 °
290 o
285 o
280 o
SUPERBEAM:
,,,I,,,I,,_
275 °
270 o
-100 -80 -EO -qO -20 0 20 _0
LSR RADIAL VELOCITY (KM S")
6O 8O I00
FIGURE 111-8
151

b.lr-,
I--
Z
.=J
i,=..(J
-Jm-
300 o
295 °
290 o
285 o
280 o
275:
270 °
-100
INTEGRATED L,V DIflGF_AN SMOOTHED IN L
' ' ' I ' ' '"'I ' ' '_' ' I" ' ' I" ' ' I ' ' ' I ' ' ' I ' ' ' I ' ''O RESOLUI'ION
<:21)
0
, , , I , , , I , , , I , , _ I , _ ,_,,
-80 -60 -_0 -20 0
,I.... I,,,I,,, I, ,,
20 qO 60 80 100
LSB RADIAL VELOCITY {lIM S")
FIGURE III-9
152

ORIGINAL PAGE
OF POOR OUALiTY
00
°
3017119N07 3113vqv9
FIGURE I V- I
153
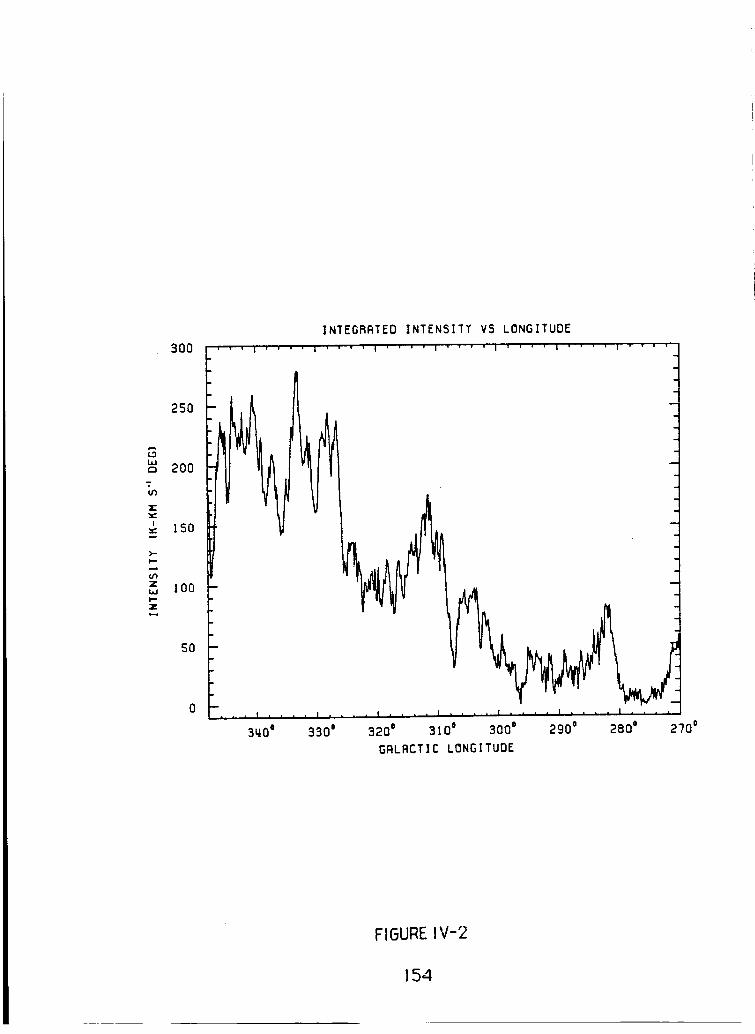
LIJf--i
T
U')
Z
I
w
>-
Z
Z
30O
25O
2OO
150
I00
5O
3qO*
INTEGRATED INTENSITT V5 LONGITUDE
330' 320 ° 310° 300 o 290=
GALACTIC LONGITUDE
280 o 270 o
FIGURE IV-2
154

mi
u')
O)I
oI--
C:)
u')I
ii
=D
c2
E:(3:hiZ
%
zD •
.Jo
[]
* l--
..Jo
u.l_P
# I
@
B
• te*
i
e
n.
o_.. :,"1 ° " o,
. i 0
• .o. ° an
*0
*! , "l
oQ * _#
| i
'.:o_- ,-,o :,
-- t_ Q_
0 I
%
30n±iluq o_±3uquo
FIGURE IV-3a
r,,,,
%r,,-
%
hl
I"
Z
%6o0 _I
I--
_.I
%mo,,i
%o)
%I
155

(a")
i"',-
9
II
io
I,,-,Zh,
ZCI:t--"
rmZCI:
--ICI:¢-)
_1
,_..,¢__Jf_'-_g---._,'-'2'(' ',,• ! . 11
" _
•_, /,A :o_- :
O , ": _',,..:-.
', o,
, , • ('_J_L,%_R' 0 ,
v.' ,,"i_,_ ,,-
: _ --,
_ . . jl)qll IlbO "'"
, • "!
in .o
I oo
#,• l _ " . l
o
(_ o 'O %
" & Io o.. ,
I .....
e
I
o • 8 ._.
l •
o •o o
I |
! i i o
_l i I •• I
el, I _ i
0 • i _ 0I I I..'I I'_I I I
% %
]Ofllll_7 3113U7U9
FIGURE IV-3b
%
%
%
P=
.-I
%
%
t%I
%0
%!
156

(,t")
,s-
¢3
oI,,,,,-
I",,,
II
ou
L,t,J
r,""(:2:
Q.
ORI_,,_._oL PAGE i_
OF POOR QUALITY
I I I _ I' g,_i_ i
0
o
,p
I
|o
• ,_", 0
t, _ _'. e
o .
.o e e • i. 'lb } A0 i II
! ..,'_s
•:,_ .__;.,,_..!:.°'_.,_"_"'iii"'! • • o
i O o
..:'. _ ._";" ,_Di . '_-°-,, -,,. "o,,_0_;... :-- -
0 • m. ---
ir_• ill'
I I_ _l I
%
%¢M
%og
%
z
¢M ¢._
_JG_
FIGURE IV-3c
%O3¢kl
",.,.,O3¢kl
("t3%
I
157

i
0
II
,,7
u-_r
__ 0_
n-O
I
O
o_
_°
Q
%c:)
%
%
I-.
z
l--
.,J_r
%0")
%(_o3
• Q
, I I %or)cr_
I
30AII167 al l_tJ71_9
FIGURE IV-3d
158

ORIGINAL PAGE ISOF PCC_
330 o
310 o
290 °
280 °
GRLRCTOCENTBIC RINGS IN L,V PLANE
i
-60 -_0 -20 0 EO _0 60
LSR RADIAL VELOCITY (KM S"}
8O 100
FIGURE IV-4
159
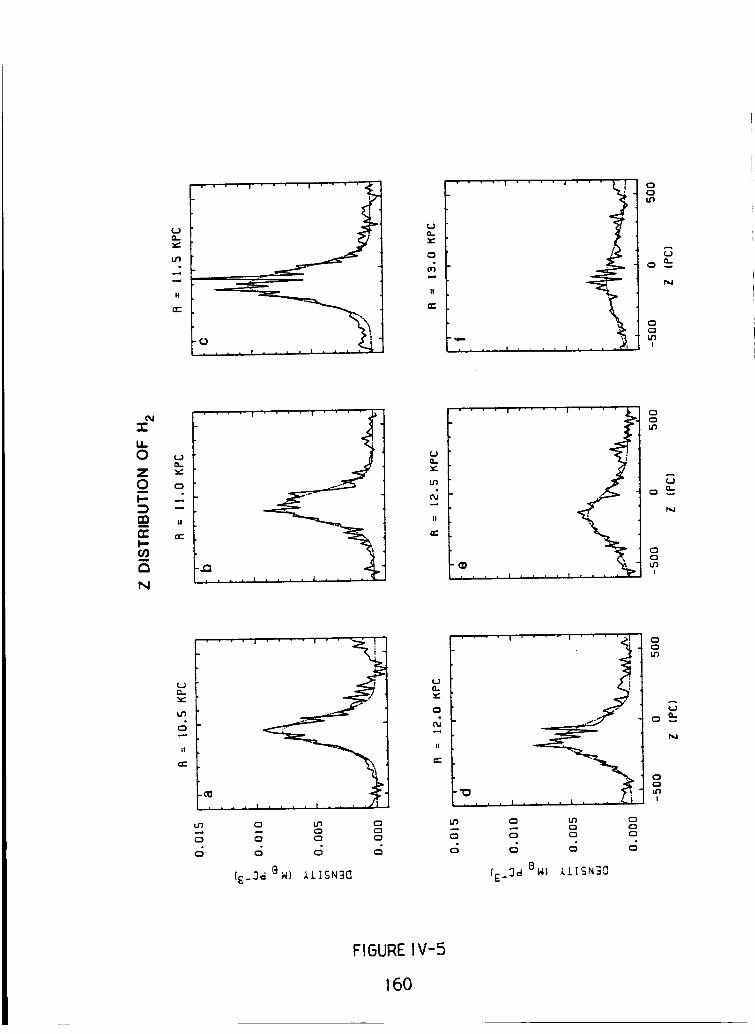
Q.
II
n_"
, • • • i .... I ' ' ' '
O
.=_
I!
nm
. , , i ( , , i . I L , •
IIi
'i",¢
ii°C_C_
U_!
"1-
u.O
ZOI
t--
on-F=.00I
a
N
(.J
C_
tl
nm
• I .... I ....
• I
O-
U')
n
.,,,..
.... I .... i ....
J
• , , , I L , i , I
0
CZ.C_ w
r_J
OC_
Ln!
LJ_
.... ! I I
(__3d 8W) 111SN30
rj
Q,.
it
u')
.......JlN
C_
, I , I
(__3d 8N) I
330 oNEUTRAL HTDROGEN INTEGRATED L,V DIAGRAM
310 =
290 o
280 o
8O 100
FIGURE IV-5
161

=
.r
w
).-
_JL_
C_
T_W
aC
15
10
5
0
-5
V
330 °
CO AND HI HIGH VELOCITT RIOGE COMPARISON
320*
i i i i i i ,
310 ° 300 ° 290 °
GALACTIC LONGITUDE
i
280 a 2700
FIGURE IV-7
162

ORIGINAL P,-_C_
POOR QUALITY
330 °
NEUTRAL HTOROGEN INTEGRATED L.V DIAGRAH
Ia.I
I--
Z0_J
_J
_Jrr
320 o
310 °
300 o
290 o
280 °
270 o-I00 -80 -6O -ltO -20 0 20 LtO
LSR RADIAL VELOCITY (KH S"}
60 80 100
FIGURE IV-8
163 "

,?(,0
_Jr
C_
C_
I
I!
Ill
%
%
%
Z
1,1
rr"
%
F IGURE IV-9
164
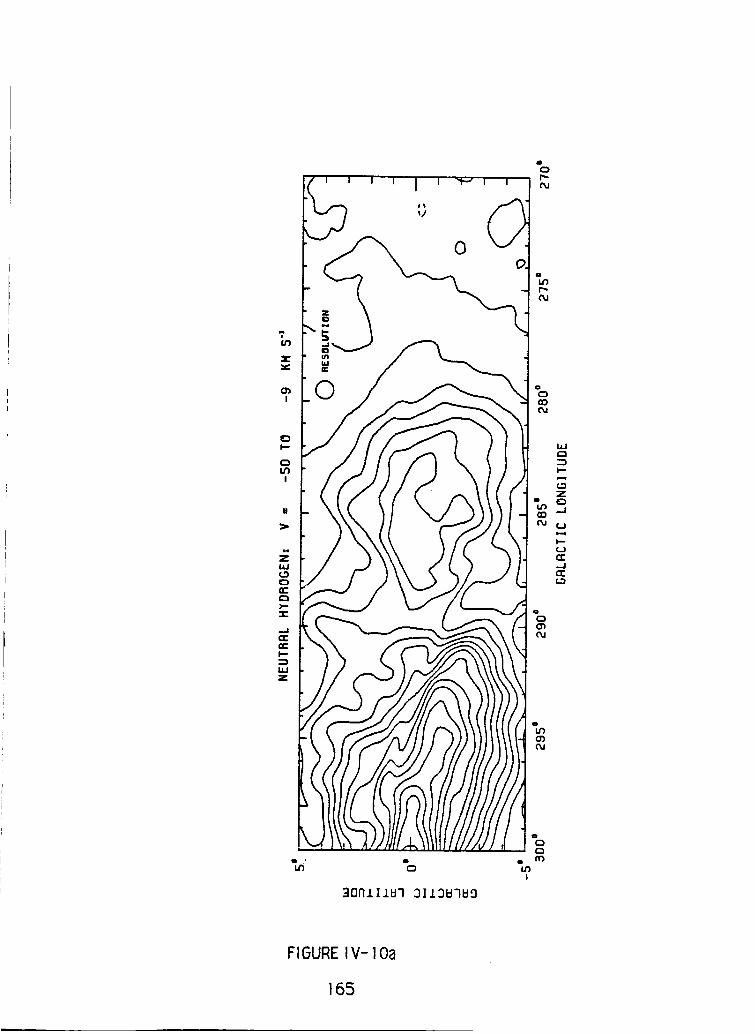
,?U')
Gr_I
0
C_
I
I!
i.i.i
n'-C2).-
-.iGC:
I-.
lidZ
%
%
%
Z
L.I
%
%
%
3flfllllUq 3113_qU9
%
%!
FIGURE IV-lOa
165

T
0
0')I
II
w
.,.ICEn-II-._hiZ
%p.._J
%E)
%
%
%C_
I
FIGURE IV- 10b
166

Z
II
W
"r-
WZ
a"%
30nlII_7 3113_7_9
%f,,,.
%f_
%
ml
%O'J
C_
%
%!
FIGURE IV-lOc
167
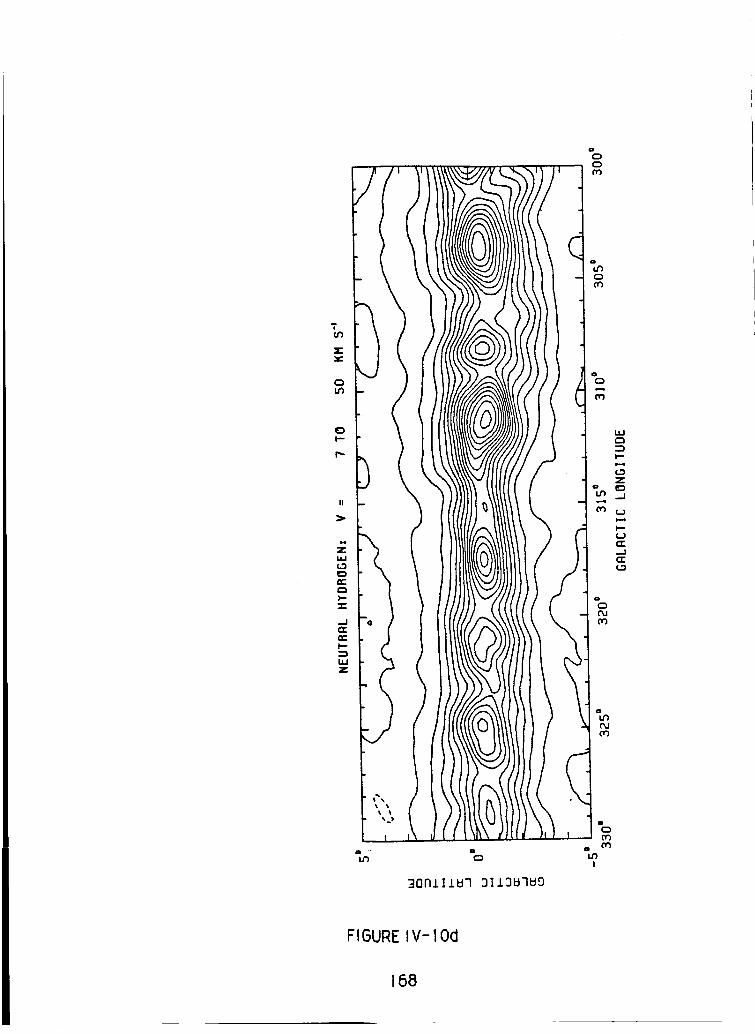
%
'TOr)
Z
Lt_
EDI--
II
n-r-,)-.".r-
..J
_..
hiZ
FIGURE IV- 10d
168

I.)
il
et"
' ' • I .... I
)ii
u• , , l .... I .... I
IJ0-
0
II
n"
• • • ! .... I ....
t
i , ! ......
O
r_,
N
OO
!
m
I.I.O
zON
f-
en
r,-l--_Jm
IZl
N
l.J
C_
II
• • • I .... l .... l
.... t .... i .... i
0,.
II
O
OO
_r
N
OC_
I
ii
er
llJ
F,
• • • I .... I .... I
1
(____d 8WI IIISN30
UO-
0
#
n-
.... I " • • ! • • ' I
6")
, , , , I h , • , I ....
0
(£_3d 8HI 11[SN30
iI
C_
O
c5
O
O
N
OC_
C_
!
FIGURE I V- 11
169

-5O
t.)
__ -1oo
A
o -150 -NV
-200 -
AVEBAGE H2 RNO HI MIDPLANES
0
-250 ' ' 'I0 II 12
i,@,
%
13
a
H2
500
__ l_O0
tnw 3004"
",- 200!
,.J,-.,-- 100-r
0
THICKNESS OF H2 AND HI LAYERS
IO
@
I , I |
II 12 13
H2
I)
7.J
I-4
II
7I
3.00I
t.)
" 2.50OD
w
2.00
l--
_n 1.50Z
o 1.00bJt.)a:__ 0.50fr
u_ 0.00
H2 AND HI SUBFACE DENSITIES
+@ @
I0
! &
11 12
GALACTOCENTBIC BAOIUS (KPC)
FI5URE IV- 12
i
C
t H2 _HI/10
& ,
13
170

ORIGINAL PAGEOF POOR ,'_,t^, r,-v
"7
=E
I
¢3p,-
I
II
U'_
_CaC
Z
I I
%
ZO
.,JIDU_I,LIR-
[]
i I I I
,,i!
$
0
uJn-
O
I
I I
I |.
i "|
,i °_-
'_ "_ -
": <
',,-, <,:
• -0
i ',__"'" ©"!
o
!
I I
, ', ,%
30NIIIU_ 31t_UT_9
FIGURE V- 1a
%
%1%
r_9
Z
._I
I--
_IGI:
%
OJ
%
I
171
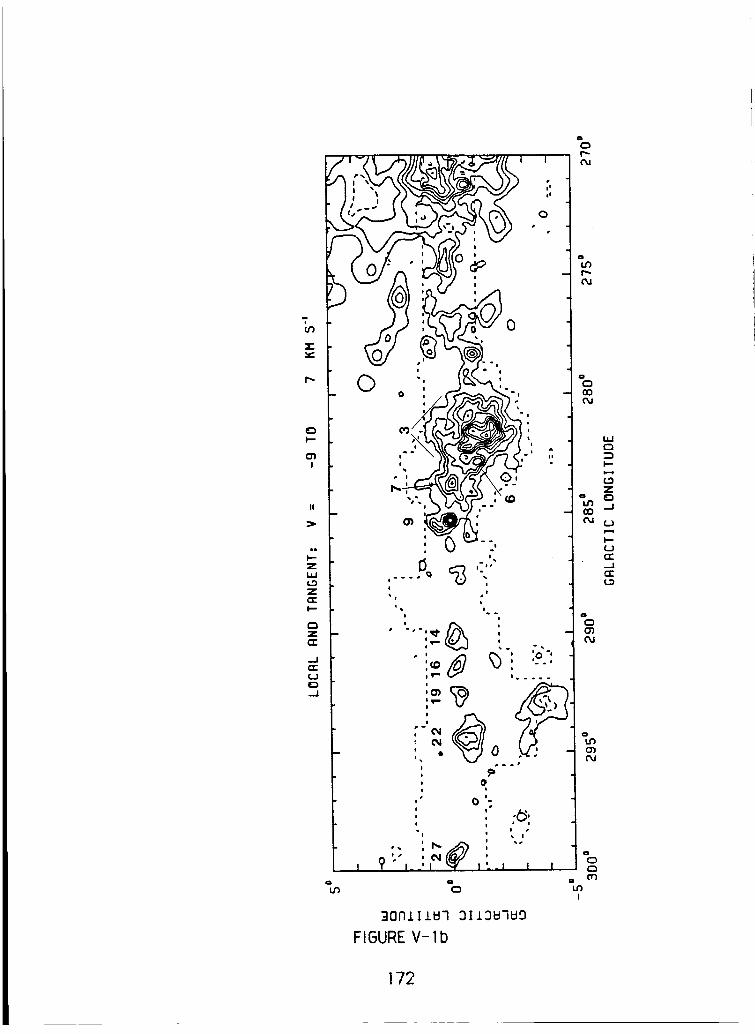
'T(J1
E3t--
O_I
II
mi
)--zhi
Zn"
OZn"
-.In"UE).-J
%
O %
ii
i
i
ii
"1
|P. | _I. i
%
%
%|
0
0
:(3:
_o
I ? I'_.I I
%
300ilI_ 31i3H3HO
FIGURE V- Ib
172

!
u1
:E
(3ul
Ii
,,7
(/1
n-
la.
t%
d,
I
0_ ,,
I
o I
I i
i •
O° %o _ _" o°
%
o!
I"
I
:jo°
i ':o, t
:."I 1 t I
%
_OnlllU7 3113_7_9
%f_
I I I ¢M
ii
%f_
%oo
I-.
Z
._J
In
..Iel'-
FIGUREV- 1c
%03£M
%0'}('M
%{3(_
7.,.,I
173
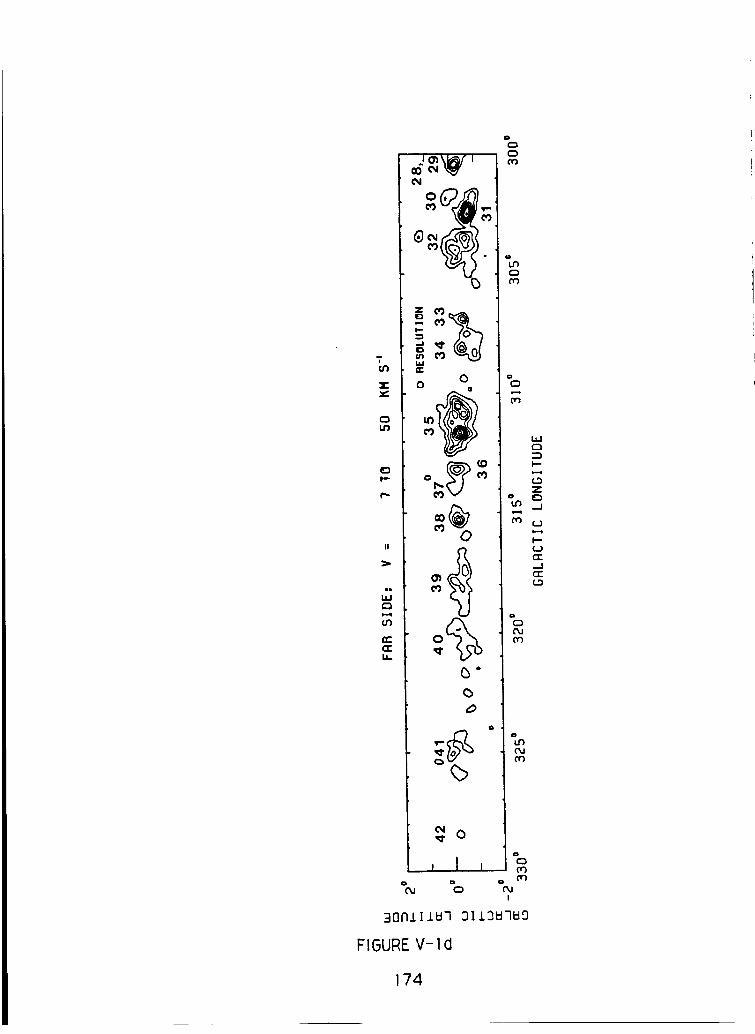
ii
oiI.
I!
n
I,i_
d¢¢)w
0
0
0
o
Q
%
%
%
I--
z
._I
I--(_I
%
%
0
% % %I
30fllllU7 3113_7U9
F IGURE V- 1d
174

0
ORIGINAL PAGE _
OF POOR QUALITY
0
0
3OnlllV7 9119V7V9
0
I
FIGURE V-2
175
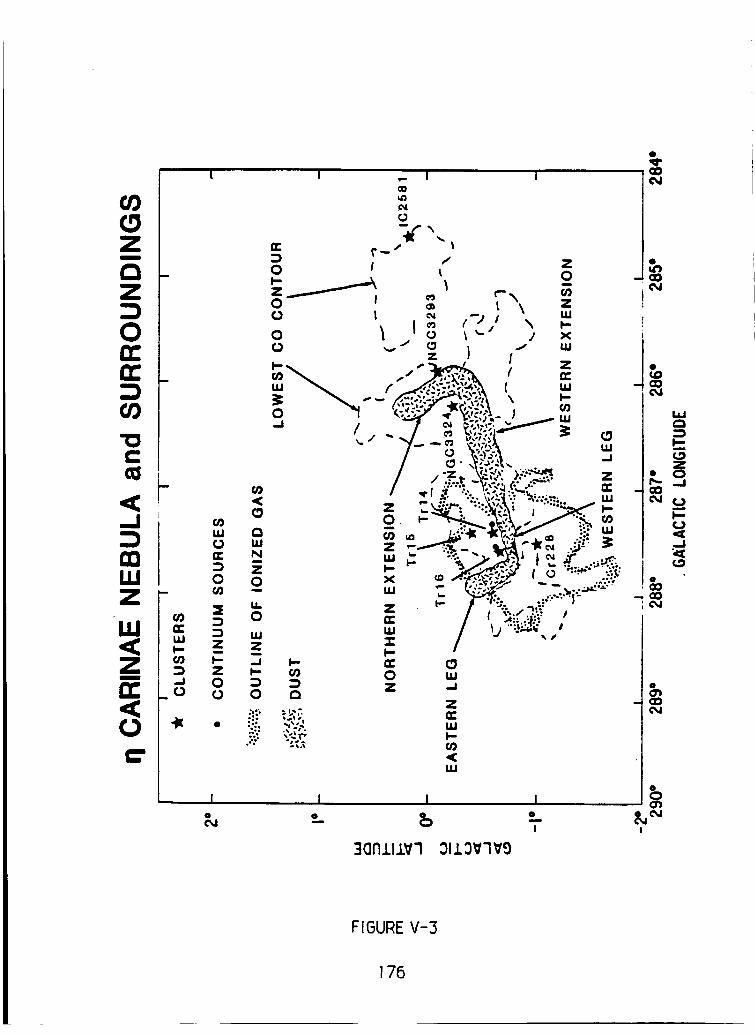
8z_
_I:3ElIiiZ
LU
Z
0
3(:in.l.l.i.vl :311:3v"i'_9
FIGURE V-3
176

V =-3].2 TO-28.6 KH S"
"-'' ...... I ..... _"'1 ...... '"1 ......... I ......... I ...... '''..o.o
2o " I_• .- ...... RESOLUTION
' @ "":
, j, ....... **
0 RESOLUTION
_|o.---. • .......... •
w--• , , * ....=..- ,
, .°" ,0
B
i •" "... ,
, to o.o |
_2 0 erf_v_,%,l, ........ I,,,,,,,,,I ....... ,,I ......... l,,,,_,,,,r
290' 289 a 288 o 287 o 286 o 2851 28_'
GALACTIC LONGITUDE
MJ
I.,-¢Z,.J
¢.)
o'-Jel-
a
t,I.J
¢JN
ee-
...J
V = -28.6 TO -26°0 KH S"_
Iz.......... ' '. '.'. '.'.;' ' ' _; ........ _ ......... I ......... ' .........
2* If.... o_o
"2"
' ;
D'
_le " _
..., .... , _.-'"? :.-.......... ....i ....... • °.• 'l
.o° ,
_2I T TT 1 1_', , I ......... I ......... I .... I ......... r , , ,',',',',',"
290' 289 o 208' 287 o 286* 205 o 28u,'
GRLACTIC LONGITUDE
b
FIGURE V-4
177
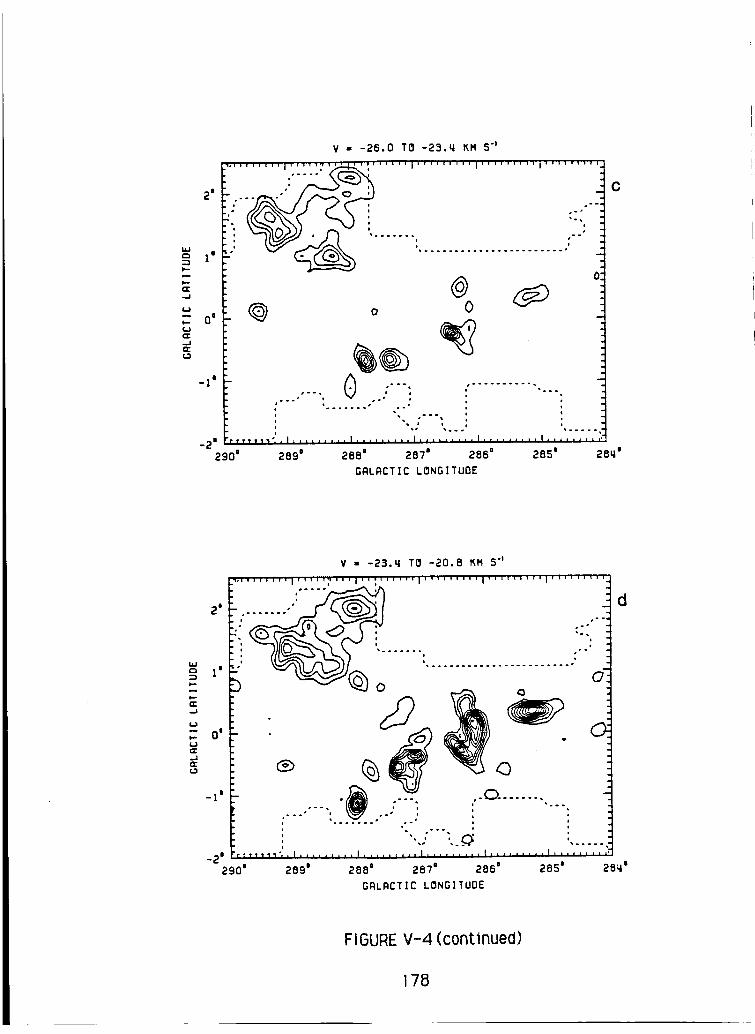
laJ
I,--
o--
er,..J
(.JN
,-r--J(2:
21
l I
01
_1 °
V • -26.0 TO -23o_ KN 5"'
.......... ,. ,.,, ,;, ,>.___,, ..... , ......... , ......... , .........
oi
O ooo.• g •
....... e "° .
o •
0
.o°o
i
_21 rTvT,_'_',, I, ,,, ,, p , , I, ,,, ,, , ,,
290 = 2890
o.o
i• a o oo.
c
288 = 287 = 2860 285 = 28_ =
GALACTIC LONGITUDE
ElJe-,"--t
7=.J
¢J
k--
,.,r...IG:
0 |
d
288 = 287 = 286 = 28_ °
GALACTIC LONGITUDE
FIGURE V-4 (continued)
178

MJ
c: |'
N
--J
_J
E o'¢¢
.JrP(.3
V - -20.8 TO -]8.2 t_H S"
"ii..... .......................
.le ,_o- -.
. .°-_ ...i o _°'°
6:" '. • ° '
e • °. _D ,
-2' rr"'" " '_'_: ' I ....... ,,I ......... t ..... ,,,,I, ........ I .... ,_,,,r
290" 2890 2850 28_ °
e
288 t 287' 2860
GRLRCTIC LONGITUDE
k--
.J
¢J
--J¢¢
2'
1'
DO
-1'
V • -18.2 TO -]5.6 KH 5 4
"_" ........ ,I:..........__ I ......... I ......... I ......... I .........
o. ...... ,
[7
Li -..... , • °°
......,_:_i_ ..;'", :' .......... "--- ,°- • ....... * °s
"" .... C,- _ ',r,vT,,_ °, . I ......... I ......... I ......... ! ......... t ......... ."
289' 288 = 287' 286' 285 = 28_ =
GRLRCT IC LONGITUDE
FIGURE V-4 (continued)
179

UJ
w,.N
iJ
t.a
eT,-I¢¢_D
1]
01
.1 °
-2'290 e
V - -15.6 TO -13.0 KH S"
_"' ....... I' .... ;.... I'' ....... I ...... '''I ......... I'' .... '''joo..
i6
.......
:.:
o _.o..o°_ • o
,.o : .................. I .
. C_ c,
........,._.....,._ii_..._................,_• i 0• e '_
r t...'w'_', , I ......... I ......... | .... I ......... I,.
289 e 285 °
g
2880 2870 2860
GRLRCTIC LONGITUDE
28_ °
laJ
p-
eep,.J
AJ
,-e.,.J
21
1 I
0 °
.1 °
V ,, -13.0 TO -lO.q KH $.1
.......... I ..... _'''1 ......... I ...... "''1 ...... '''1 .... ''''o|....., _
o
h
288' 28_" 286 _
GRLRCTIC LONGITUDE
FIGURE V-4 (continued)
180

n-U.II--
O
o o
I.I.I
O
I.I.I
ZI
r,-
O
I.IJNI
Z
OI
FIGURE V-5
181

Z
0m
2.0
1.8-
m
1.6-
m
1.4-
m
1.2-
m
I.O-
m
0.8-
0.6!
m
0.4-
m
0
Number per
------- Cumulative
• IMF
bin
|mmm
IDllm _IIIDI
!I
gp,=. =.I
II
_D a,=, J
!_=,mA •I
mmo
III
i--- III!I
m m lill
II
|mu |
IIII!
mm m
Im, .,,. |
I I I1.6
I
2.0 .8I I I I I
1.4 1.2 1.0
log M/Mo
0.8
FIGURE V-6
182

180"
ORIGINAL PAGE t3
OF POOR Q_ALITY
a
270" ........................... 90"
z
_ UNANALYZED
• =0 °
_ OBSERVATIONSINCOMPLETE
15 :_ _ii_:._,ii_.i!!ii.i_i_!i:i ili i!iiiiiiiiiiii_izii!iTiii:i: _!i!_:!,
_i:,i::::,i_i • • _ _!i_,:_i.ii_-i_il.i:,i: 4R_:I: ::::::::::::::::::::::::::::::: ...............
ao_:_:i:_:i_i%_!_!::iiiii:ii_:_ii:iii::::i_!_::_!_i_:/_!!!_i_i!!!_!i!**'_o_ ®_::i_ii:i:i::_ ii:!i::i!_iii!::ii_ _!!_!i!!}!i_:!;i:.i_:i_i:_i}_iiiii:_i:::_iii!!!i_:iiiiii!!i_:?!i_:_:_::._!:?ii_iii;iiiiii::i:_i!i:_:_!::_i_:::..,e.o;_ili:'i;;::,:f:}_ _iiiii!i_;ii,i_Ca Iii_:!!:i_i!!i;i_!i_!_::i_i!!!_:._ii!!!!i_i!_i!ii!:!iiiiii!!i!!i_i_!_::._..:.:!_!F!iii! ":::::' ,_,_ !i:i_!i!!3ii_!i_i
l_i:i-:i:::i:i:i:::!:!::!:i:i:i:i::i:!:i:i:!:i:i:_:3:::!:3::::: i:i::i:i:i:iii:i!!ii_]i!i:iiiii!!i!:i::ii!_i!jiiii_iil]iiiii[:i:i:_ "r//,_ i:i:i::!:i:!.!:i:i.
--" .i:::.:.:!::-.:.::i:::.::::::::::::::::::::::::::::::::::::::::::::::::::.:.:.:.:i.i._i...::.:.i::.::/:i.:i:::..ii:::::ii_:._i::.:i:ii::_• ,_. .i.::::i:::.:!::1'_ :::::::::::::::::::::::::::::::::::::::::::::::::::::::::::::::::::::::::::::::::::::::::::::::::::::::::::::::::::::::::::::::::::::::::::::::::• • _,_1_, :::::::::::::::::::::
_! i',iiii!ii}'_} i: %•e • _',:,i?:!i SUN : !i!:::.::::iii; ii::i::i?iii::ii::i::i::::i3iii:.::i?)::i::i::;!g!i::::igii::ii:.i::i!i:.}?!iiiiigi:• • iii::._::s:+:
[)_::'!_':,_: iiii:i!'_!ili_'ii',i_,, _ ,I°'_" I"180 e "90" 90 °
b
0 °
8180 •
FIGURF V- 7
183
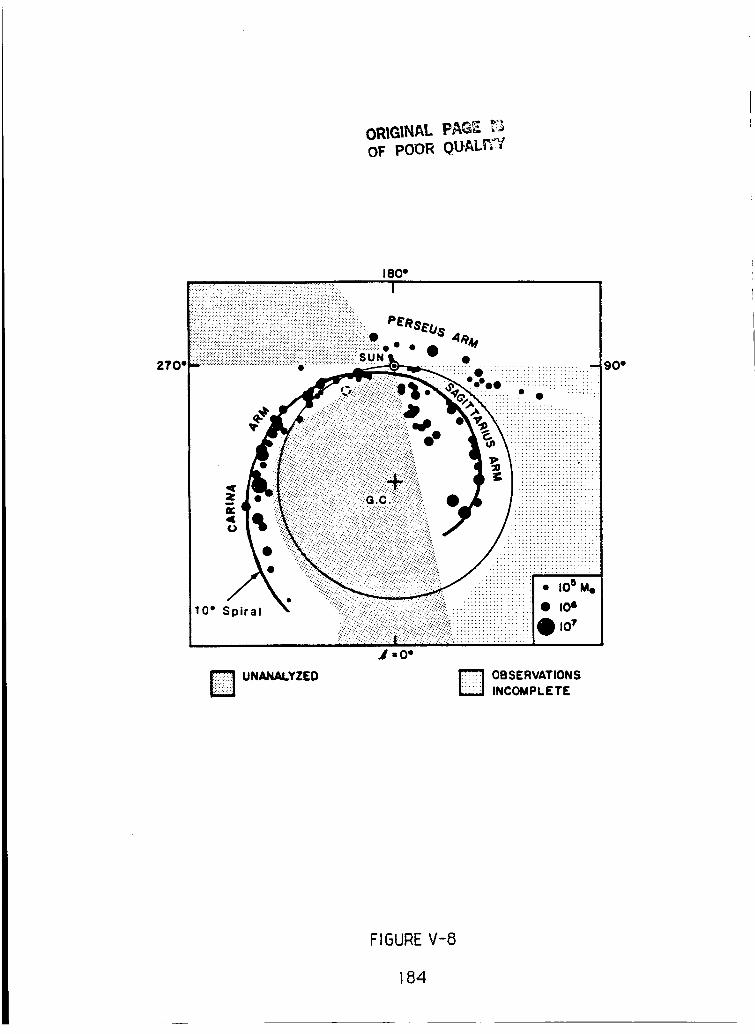
oRtGINAL PAGe. _
or pOORQUAL_
10" Spiral
:iiiiiiii!iiiiiiii!iiiiii!.iiiii!i!i!!ii!iiii!iiiiii:
.iiii fiiiii!i::::::,.:.....!i::::::.....
_ UN_ALYZED
,_=C, •
_ OBSERVATIONINSCOMPLETE
90 •
FIGURE V-8
184

]O
01
L,Jr',
I"
-1"
f,._)
f.Jrr..I
-2'
-3 °
V • -18.2 TO -15.6 KH S"_
(_ 0 RESOLUT ]ON
.0
Q"; O
0 .
n °'* _'°°*
RESOLUT|ON ..... , ,
.°
......... I ......... I ......... I ...... ,,,I ......... I ........
285' 28_ I 28S" 282 a 28 ] • 280 o
GRLRCT 1C LONGITUDE
.
i ....... :ot
a
2798
V - -15.6 TO -13.0 KH S"
|e
......... I ........ I ' ' ' '_.y ' I ...... '''1 ......... I ........
o' O
LIJ
-1' O
G0
_2 ° "",,,,,(_ ta........
o
:•. ..... "Do ° - **" •..*
-3' ..... ,
......... I ......... I ......... I ......... ! ......... I .........
285' 28L1° 280 °
b
283 = 282 = 2B] °
GRLRCTIC LONGITUDE
279 =
FIGURE V-9
185

0 8
W
¢...
-I e
...¢
_-_-2e
-3*
V - -13.0 TO -I0,_ KH 5"_
,, __ _ :........
@ '
.... _t _mo
i|,ll.,,I ......... I ......... I.,,ILIIII ] ......... ) .........
285 ° 20_I ° 200 °
i
c
2831 282 ° 281 m
GRLRCTIC LONGITUOE
279 m
1 I
01
we_
.-J
,,.p
-2 e
-3*
V " -10.4 TO -7.8 KH 54
4m,
285 m 283 m 282 a 281 m
i o °
28u, m 280 m
d
279 °
FIGURE V-9 (continued)
186

1 I
0 =
..J
t-,-
-2'
-3'
V • -'/.8 TO -..= 2 KM $°'
.
i °) 0 "
G
......... t ......... t ......... I ......... I ......... I ...... nil
285 ° 28q" 283 ° 282 = 28 ! ' 2800 279 °
e
GRLRCTIC LONGITUDE
1 I
01
-1 =.-I
,.,t
g -2'
_3 =
°
285' 283 = 282 = 281 =
GRLRCT IC LONGITUDE
V • -5.2 TO -2.6 KM $"
..... ''''1 '_u" ...... I ....... ''1(_ ..... ''1' ........ I ......... .
....... ......,,.............., ,_
....... ,I,,, ...... I ..... ",',*,*,'I , , , , , _ , , , I ......... I ........
284' 280 = 2780
FIGURE V-9 (continued)
_' _ 187
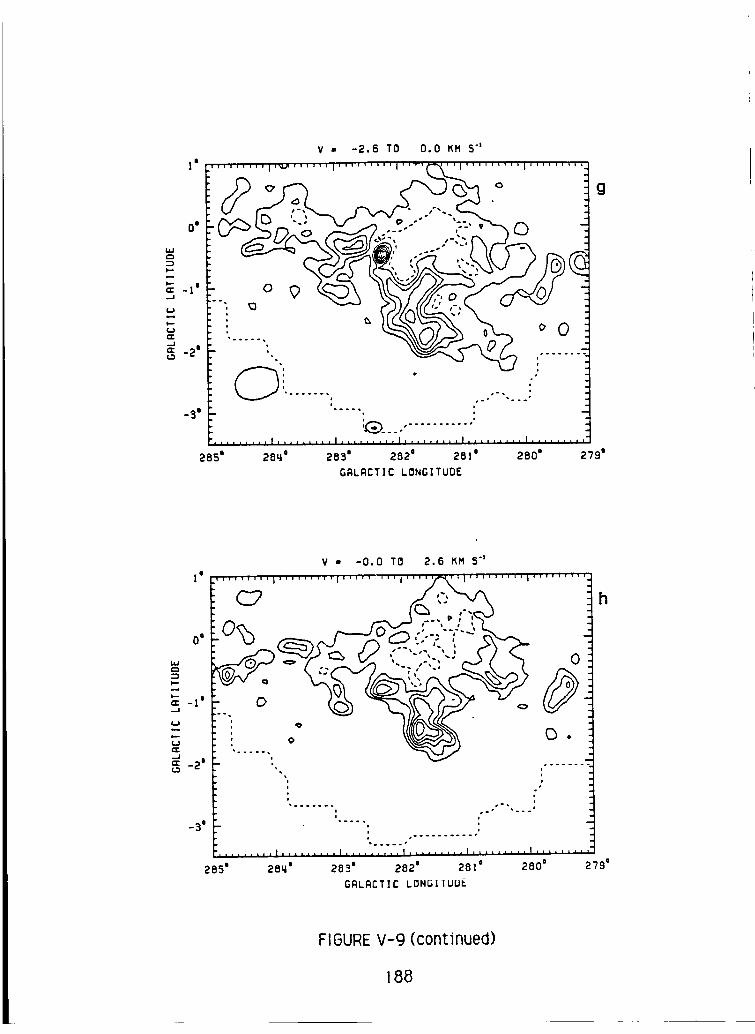
1 I
0"
wJ
"1 I
...J
tI
-2'
-3'
V • -2.6 TO 0.O KM S"
i
I
lililll.,I ..... ,,,,I,,,,,,,,,I ......... I,,,,,,,,,I ...... ,,,
!85 = 28_ = 2800
g
283 = 2820 281 m
GALACTIC LONGITUDE
2790
1 I
0 =
N
7= -1'
-21
-3'
V = -O.0 TO 2.6 KM 5"
(27
...... , o'> _ _ •
i i
= .o
:• ....... .-.
i
: . .......... o=
,, ...... I .... , .... I ....... ,_1, ........ t,_ ....... I,_ .......
285 = 28_" 280=
h
283 = 282 = 281 =
GRLRCTI£ LONGITUOE
279 =
FIGURE v-g (continued)
188

V - -31.2 TO -28.6 KM S"
1l ....... ''1 ......... i ......... I ......... I' ........ I .........
0 °
uJ
I--
..J
¢.)
-2 =
-3'
0 R[$OLUTION
o oii
, ®0
,'rl'rrrrf*, ,, . t'_-.-,-,-, .............. 1_,
@0
oo
RI[$_LU11 ON
.--;---,:I i i i * I i I i I I i i
,ll,,,,
296 = 295 = 29_ = 293 = 292 = 291 =
GRLRCTIC LONGITUDE
a
290 =
1'
P,
=1
I.-.m
_|e
{.JN
(J
-2"
-3'
V - -28.6 TO -26.0 KM S"
' ........ I ......... I .... '''''l ......... I ..... ''''l ........
f ;i #--o_
........ "rl-rrrrt, ,_ Jt','_'i',', ..... I ......... I!,
296 =
.--..... , ,,;'":, ....
b
i
295' 29'; = 293 = 292' 291 ' 290'
GALACTIC LONGITUDE
FIGUIRE V- I0
189

I!
0 °
u=
a: -i °
¢T-
g -2'
-3'
296'
V ', -26.0 TO -23.u, KM 5 "1
......... _0_"_'......° '......... ' ......... ' ......... '_-_ .... l_c
i
°-° ° .....
........ •r_ ..... ;,, "._,-,-,-.- ...... * ......... i:...... (., i, , ,': ....
;=95" 29_ = 293 ° 292 = ;=9 ! = 290 e
GRLRCTIC LONGITUDE
11
0 g
I....-
..J
_ -2"
V - -23.4 TO -20.8 KM S"
..... ,'"L ......... i''"' .... i'''' '"''' I""'" ''I'" ......
-3'
0
° " ° _i
°.
0 d
J
-<2
i
296 = 295 = 29_ m 2930 2920 291 o 290 I
GRLACTIC LONG!TuBE
FIGURE V- 10 (continued)
190

1 =
01
MJ
-! =
e.r..I
-2 °
_3 =
V - -20.8 TO -18.2 KH 5"
'''''''''1 ......... I ......... I ....... ''1 ......... I .... _''
0®o
i
i
e
o-o . ..... •......... "r_'r rr, f; , o ,'l-I-,-,-,-, ...... | ......... I_ ...... t', , I .... '. .....
296 = 295 = 291 = 290029q = 293' 2920
GRLRCTIC LONGITUDE
V • -18.2 TO -15.6 KH S"
|e '''''''''1 ....... ''1 ......... I ......... I'''''''''l .........
D e
uJ
I,--N
_l =
i.r
-2 e
_3 =
296'
........ "-_..... :"';1 ............. , ......... ,'...... ,"T;_'"'. ....295= 29_* 293' 2920 291 *
GRLRCTI C LONGITUDE
©0
290 °
FIGURE V-I 0 (continued)
191

11
0 O
I,,,,,
a: -I I..-j
_ -2 o
_3 =
V ,, -15.6 TO -13.0 KH $"
'''''''''1 .... ''"''¢'''' ..... I ...... '''1 ...... '''i'''''''''
"0_, _ o
°0i
, ..o
296 m 295 m 29_ ° 293 m 292 ° _9!m
GALACTIC LONGITUDE
i
0 :
g
290 =
1 I
01
7=-I'
(.J
_2 =
-3'
v = -l_.O TO -IO.q XM $-m
©
Q
00
,. °, %
o
) o ............. .
......... "r I" r r r r | I i i , t.-=-=-¢-_-.
296 m 295 = 29_ =
h
.... ! ......... I! ...... $',, I, , ,;; .....
293 = 292 = 29] = 2900
GALACTIC LONGITUDE
FIGURE V- I0 (continued)
192
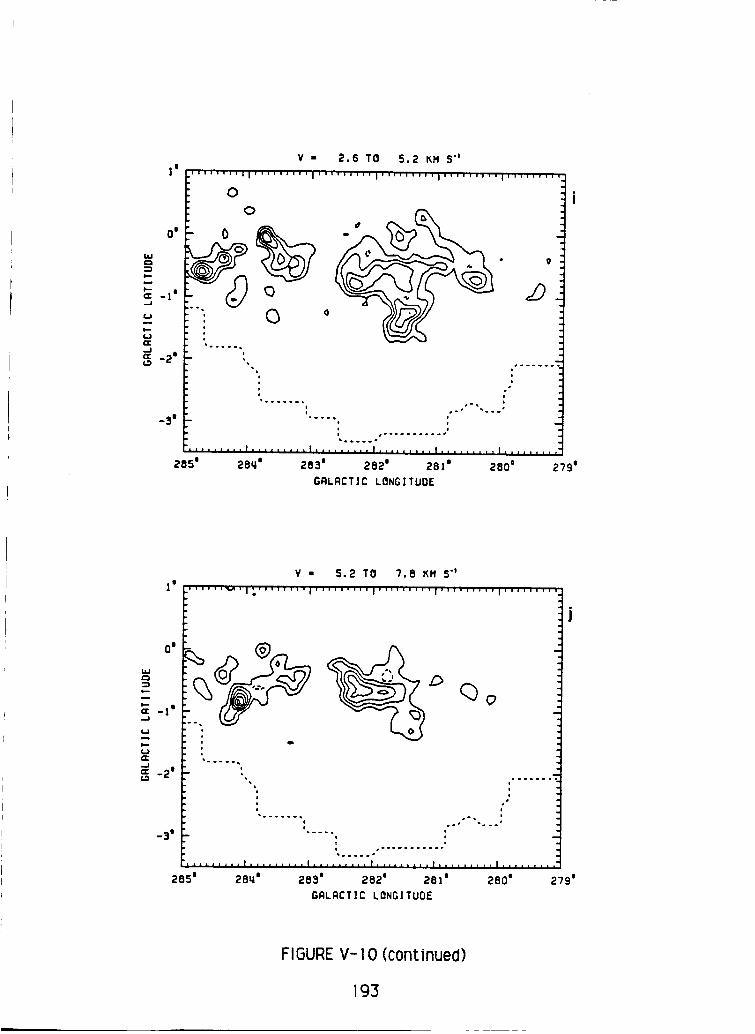
V = 2.6 TO 5.2 KI'I S"
|O _; ..... _1 ......... I ......... I ......... I ......... I ........
O° .
_ O
_ ,.,......
i ..... .............._3e '. !
........ I ,.,,I .... ' ..... f,,, ...... l. ,._j,_,
285' 28_' 280 o
i
i
283' 282* 281* 279 o
GRLRCTIC LONGITUDE
1 I
.=m
-1' 0-J
(.,I
I,--
-3'
V - 5.2 TO ?.O KH S'_
''''"_'l; ...... ''1 ......... I ......... I ......... I ........
• o ......
• iIi
i .ii i
• ...... • .o_ |I o°. .°oo*i._.°_ i
I i
i • ...... °°°--• ..... o
......... I ......... I ......... ! .... ,,,,,I, ........ I .........
285'
!
J
28_' 283" 282= 28 ! ' 280" .>?9=
GRLRCTIC LONGITUDE
FIGURE V- 10 (continued)
193

SKT COVERRGE
90 °
5O
Z
0
_Jw
o
¢ •
0@
@
o
O
0 °
0 °
I I
60 ° 1200
I
16)0o
AZIMUTH
I I
2LtO° 9000 8_0 °
FISURE A- 1
194

ORIGINAL P;_.;I/; ;:-_
OF POOR QU.ALi'__,/
_===m
,,4
0::
_3
E:
C_
I i I
o
o
$
II •
e
e
I-!
0
%
J r i %
i
(NIW 7Hl:l) (73) 0
I l :
0
o
i
I
"o
"o
"o
I%
$
J
$
I I I
(73) S03 X (ZU]O
i I I
I
(NIW 3UU)
|
$
@
$
I :
(731S{}3 X (Z_}C]
p.,
Ze_
%
%N
I
%
.=
%
FIGUREA-2
195
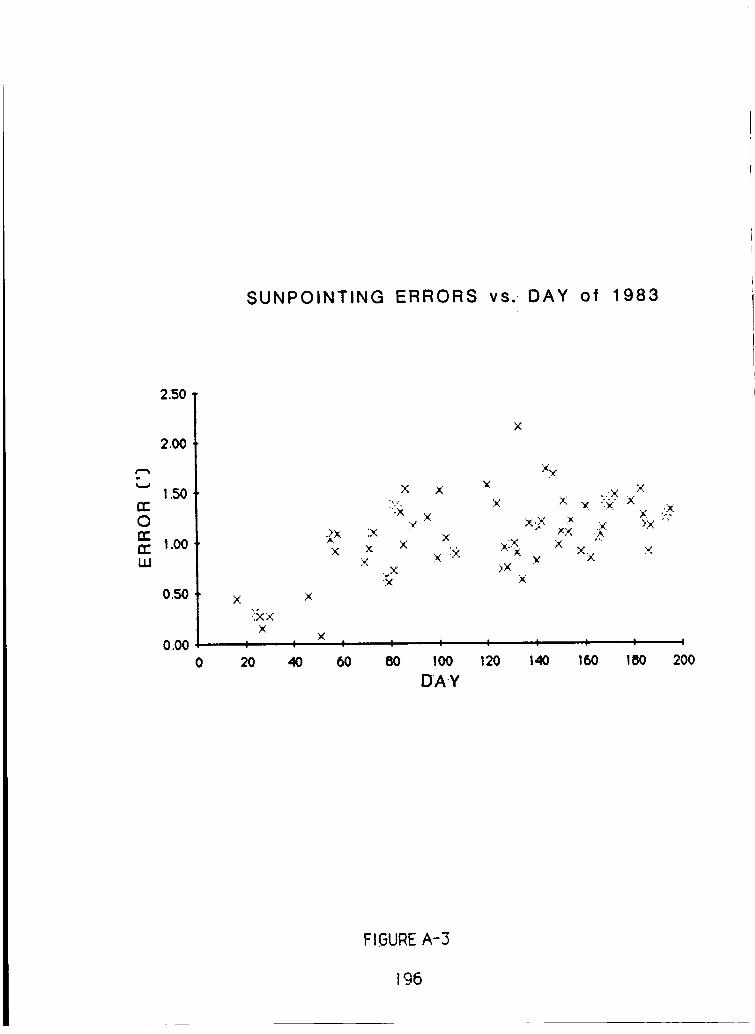
SUNPOINTING ERRORS vs. DAY of 1983
rt-O
rrLU
2.50
2.00
1.50
1.00
0.50
0.000
X X
:,._. :x'.
:._:_X :X ×X x X
x × :'_.X
X X
::kx:x:
XI I I I I I
80 100 120
DAY
×
;(.,.<
x :'::
.x.-'._
>×:x:
...× . .X
x ._ .:_:. ;_.X ':.:_
:x: .X >X '"
X X X
I I ! I
140 160 !80 200
FI6URE A-3
196

OF POOR QUALITY
tlJ
ZID.=I
t=)
I-.¢_)CZ:
n"
300 o
295 o
E90 °
E85 o
280 °
275 o
I I i i i i i i i i i i i i i i 1 i i i i i i i i i i i i i..... J ...... I......... J .......... L L J I................. ......... .... ::::::::::::::::::::::::::B • 2".5
• RESOLUT ]ON
. ......... .... ...... ...%. .... . .......... . ...... .° ............
=
-.. ..... oo..° ...... ..°°.o. ........... . .... °..o... .... . .........
,,,I,,,I,,,I,,,I,,,I,,,I,,,I,,,I,l_llll
-80 -60 -LtO -20 0 20 _0 60 80 100
LSR RRDIRL VELOCITY (_M S"]
FI GURE B- 1
197

3DO °
B - 2:375
• RESOLU'T l ON
C_
t-,,
Z
{_1
r,J
rr
rr
295 °
290 o
285 o
280 °
2?5 o
270:
-I00 -80 -60 -_0 -20 0 20 _0 60 80
LSR RADIAL VELOCITT (KM S")
I00
FIGURE B- 1 (continued)
198

300 °
295 °
290 o
hiC_
I"iiq
ZE)
--' 285 o(..)
I.-I.J¢r...I
2800
275 °
' ' ' I ' ' ' I ' ' ' I ' ' ' I '" ' I ' ' ' I ' ' "I ' ' ' I ' ' ' I ' ' '
B = 2:25
• RESOLU7 ION
..................... .(_..t ................................. _-
,,,I,,,I,,,I,,, I,,,I,,,I,, ,I,,,I,,, I,,, I
-80 -60 -140 -20 0 :_0 140 60 80 100
LSR RRDIRL VELOCITT {KM S"}
FIGURE 1:3-1(continued)
199

300 ° ,,, I,,,I ,, , I, ,, I, ,, I, , ,I,, ,I ,, ,1, ,_ I,, ,
295 °
2900
U.l
l--
t.2Z0
•-J 285o
t'-'-
rr
280 o
275 o
270 o
-lO0
%. ...... . ............. . ....................................... :
,,,t,,,I ,t , l, , , I, ,, I, ,,I ,, ,I ,,,I ,,, I, i,
-80 -60 -YO -20 0 20 u,O 60 80 100
LSR RADIAL VELOCITT (KH S")
FIGURE B- 1 (continued)
200
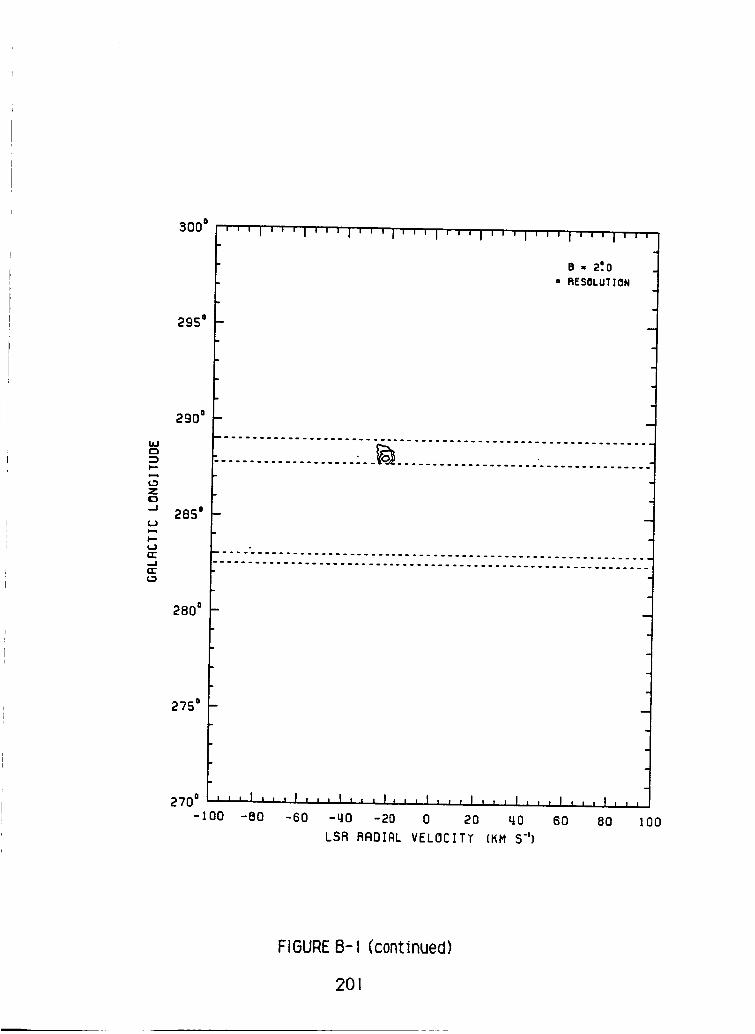
U3C3
F.-
X0
t-q
rr
300 o
295 o
290 o
285 o
280 o
275 o
, , , I , , , I ,', , I ,', , I , , , I , , , I , ,', I , , , I , , , I , , ,
S - 2:0
n RESOLUT ION
.......... ....°._ ...................... .°..°. ...............
tlt|llsIil|]tt L]lll]tll_11 tlltt]ttl]tlt
-80 -60 -LlO -20 0 20 u,O 60 80 100
LSR RADIAL VELOCITY (KM S")
FIGUREB-1 (continued)
201

b'-
ZID_.1
I_t
I'-"
n"--I(3:
300 _
295 a
290 °
285=
, _, I _, ,I,, , I, ,, I,,, I, , _ I,, ,I ,, , I , ,, I, ,,
= I'.e7s
,= RESOLUTION
280 °
275 °
2700 , , , I , i i I , , , I i , , l , , , t , , , I , , , I , , , I , , , I , , ,
-100 -80 -60 -40 -20 0 20 40 80 80 100
LSR RRDIRL VELOCITY (KH S")
FIGURE B-I (continued)
202

l--
Z0...J
L.J
I.-1..1rr
n-
300 o , , , i , , , i , , , I , i , i , , , i , , , i , , , i , , , i , , , i , , ,
295"
290 o
285 o
280 D
275 °
270 o-100
............................................ . ................
...................... ...................................
',,I,,,I,,,l,,,I,,,Ijz,ltl ,I,,,It,,I,,,
-80 -60 -u,O -20 0 20 ;0 60 80 lO0
LSR RADIAL VELOCITY (KM S")
FIGURE B- 1 (continued)
203

I.=,J
iI
Z
.3
h-
n-
M"L.3
295"
290 =
285 =
280 o
275 o
270 o
-I00
,,,I,,,I,,,I,,,I,,, I,,,I,,._1,,,I,,, I,,,
-80 -60 -ttO -20 0 20 u,o 60 80 100
LSR RRDIRL VELOCITT {KM S")
FIGURE B- I (continued)
204
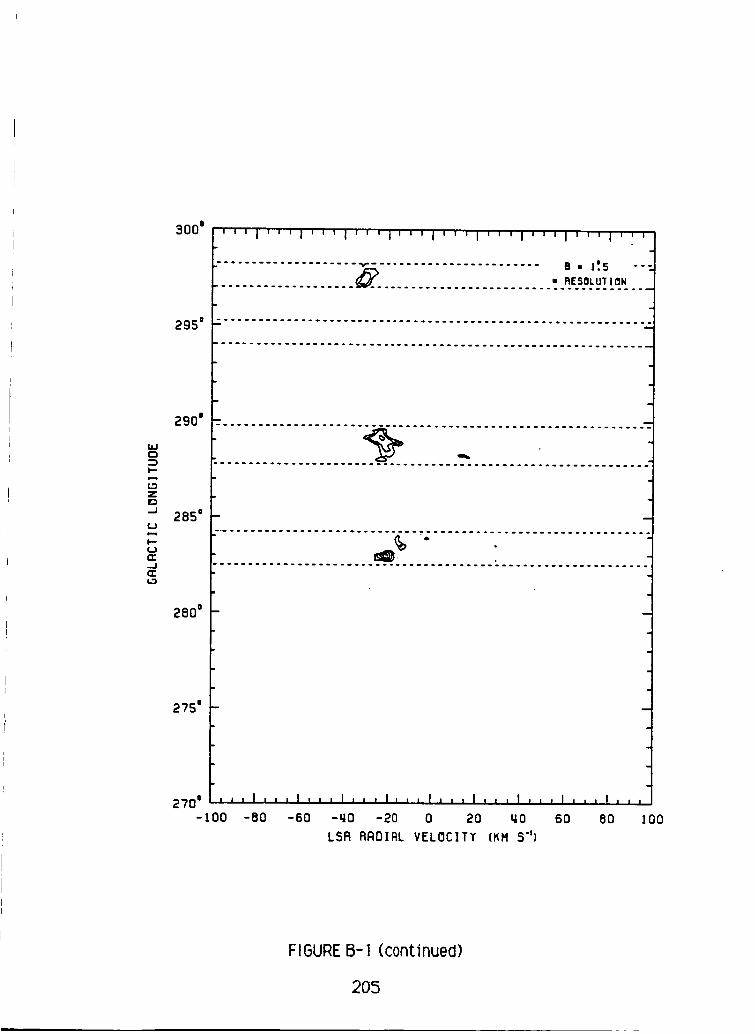
tkJ
::)I--
LOZE:>,--I
0
I--0(3:..Irr
300 o
295 o
290 o
285 =
280 o
275 =
270 =-100
' *' I '' '1''' I '' '1' '' I ' ' '1 '' '1'''1 ' '' I '' =
.................... _ ....................... B = 1'.5 --
................... ¢_.. ........................ . .nE.S.O.LU! _._......
. ......... ..oo. ........ .o .... . ..... _ ...... . ..... . ...........
,,,I,,,!,,,I,,,I,,,I,,,I,,,I,,,I,,,I,,,
-80 -60 -;0 -20 0 20 t;O 60 80 100
LSR RRDIRL VELOCITT (KM S"]
FIGUREB-I (continued)
2O5

b.Ir-_
..,J
0
l--¢..)rr._1wr(._
300 o ,, , , i , , , 1 , , , i , _ ,'1 , , , I , , , I , , , I , , ,'1 , , , I , , '
295 o _- ........................ :...................................
.............................. .°-° .............. - .............
290 ° --.:- ................................
_ ...,_,.... -.o_.. ..........................
285 o
......................... _-.._-----. ............. . ............
2800
275 o
270 a-I00
,,, I,, ,I ,,, I_, , I,,, I j , ,I ,, ,I ,, , I , , , I , , ,
-80 -60 -u,O -20 0 20 u,O 60 80 100
LSR RADIAL YELOCITT (KM S")
FIGURE B- 1 (continued)
206
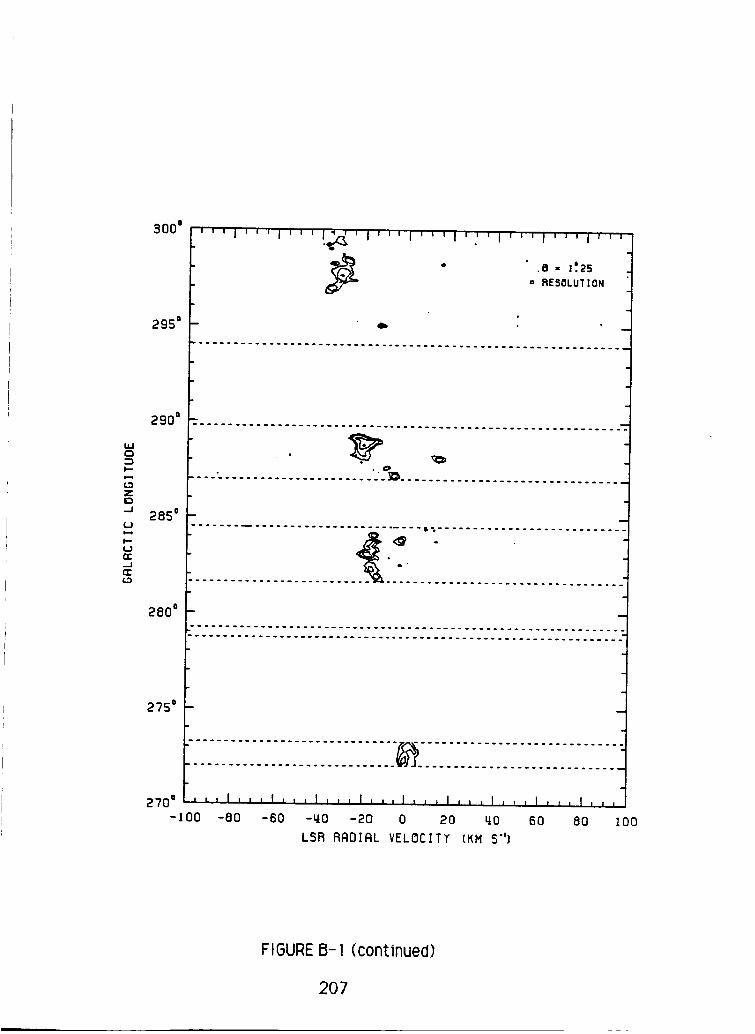
1.1.10::3I'-
Z
,_1
(J
I,,-UIT"...Irt-
300 °
* .B = I*.25" RESOLUTION
295 = =.
..... ............ o... ................... . ................... .m
290 = .............................................................
.... _..................... ".._m=................................
285 =
-
o
280 °
275 =
2713o , , , I * , , I , , , I , , , I * i , i * ] _ t _ , i I , , , I , , , I , , ,
-tO0 -80 -60 -_0 -20 0 20 LtO 60 80 100
LSR RADIAL VELOCITT (KId S")
FIGURE B- 1 (continued)
207

hl
I--
300 °
2950
•.J 285 oI,..1
I,,-.
(Z:_,.IO:{.3
B +:12s" RESOLU'I' tON
290 ° .............................................................
" _ *
......................... "_.-.-_ ...... .-........ .................
.......... -+ ....................
_+,_<,+o.......................+_:...............................
280 °
275 o
270 °
-I00
.., , , I , , t I , , , I , , , I , , , I , , , I , , * I , , , I , , , I , , ,
-80 -60 -u,O -20 0 20 LIO 60 80 lO0
LSR RADIAL VELOCITT (I_M 5"4
FIGURE B- 1 (continued)
208
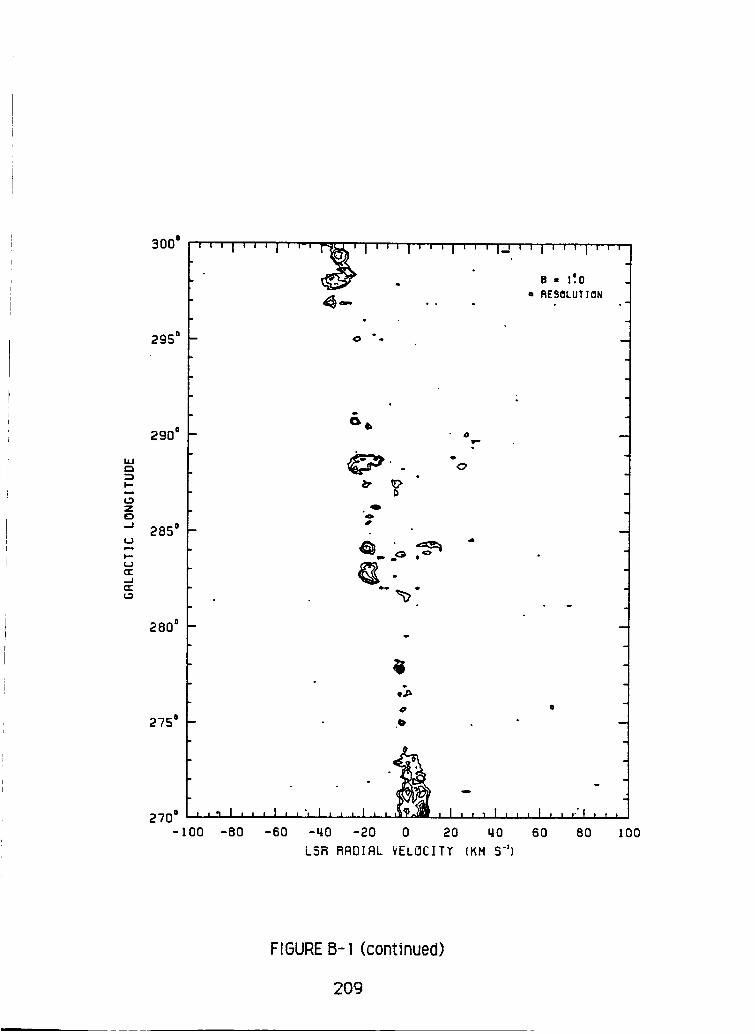
h,f-,
(.3Z0,..I
{_)
I--UE.-1E
300 o
295 °
290 o
285 o
280 °
275 °
270 o
' ' ' I ' ' ' I ' '-' _ I ' ' ' I ' ' ' I ' ' ' l-J ' ' I ' ' ' I ' ''.. • . e " I'.O
4_ a... o RESOLUTION
o,o -
I)Q
0p,.
O
0
I °1"1_
, ,_ I , , , I , ,', I , , , I ,
-I00
, I , , I I., , , I , , ,'I , , ,
-80 -60 -LIO -20 0 20 _I0 60 80 I00
LSR RADIAL VELOCITT (KM S-')
FIGURE B- 1 (c0ntinued)
209

300 o
295"
290 °
WC)
I--
Z
{3
" 2850(,J
l--
I,,J
.../
GE
280 o
275 °
270 _
-I00
'' "I' ' ' I '."___i
Q
Q
I I I I I I I I I '1 I''I I I I I I [ I I I ; I I
0
0
Q,.Z
GI.
• o . _ °
l,, I,, ,I ,, I I_ , , I, , , I ii ,I ,', ,I ,,, I, ,,
-80 -60 -u,o -20 0 20 LtO 60 80 100
LSR RRD]FIL VELOC]TT (KM S"}
FIGURE B- I (continued)
210

hi{3
II
Z0.J
rr.Jrr
300 o
295 o
290 o
285 o
280 o
275 o
' ' ' I ' ' ' I ' '__1 ' ' ' I ' ' ' I ' ' ' I ' ' ' I ' ' ' I ' ''. " e - 0°.75
w FIESOLUT ]ON
_"
_ i ° D"
.0 ._-_ .
o4 •
-100 -80 -60 -LtO -20 0
,I,,,ll,,I,,,l,,,
20 _0 60 80 100
LSR RADIAL VELOCITT (I_M 5"1
FIGURE B- I (continued)
211
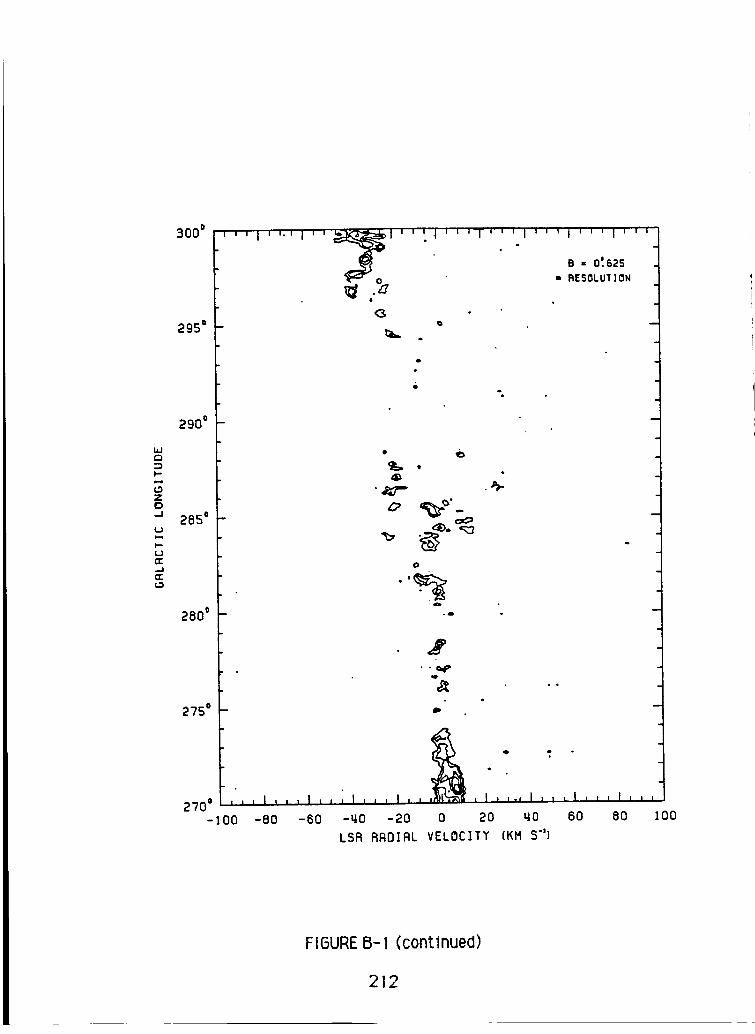
LU
I--
ZO,,..I
I,,--
,.=1mrk.3
30D °
295 =
290 =
285 =
280 °
275 =
' ' I I ' "' I ' ' __ I ' ' ' "1 ' ' !T' ' _ I ' ' ' I ' ' ' I ' ''. " " . " " I BRESOLUl.]ON= 0°'625
o
°
t=,. ,
-_=_"
O
° a
D
,,, I,,,I,, ,I,,,l, , II .... I,, ,I,,_ Ix ,,
-80 -60 -riO -20 0 20 _0 60 80 100
LSR RADIAL VELOCITY (KM 5"1
FIGURE B-I (continued)
212

U./t-,
k,-
Z
--,l
(,J
iI,fJrr,.,.Irr
300 o
2956
290 o
285 o
280 o
275 o
i270 o
-I00
' ' ' I ' ' ' I ' ' "W_I "' ' I ' ' ' I ' ' ' I ' ' ' I ' ' ' I ' j'.
.-0.." RESOLUI' I ON
, , , I , , , I ,, , I, ,,I, ,
'_, eo._o
•.o. T, "
0
°
,I,, II,,,I,,,I,,,
-80 -60 -_0 -20 0 20 _0 60 80 I00
LSR RRDIRL VELOCITT (KM $")
FIGURE B- 1 (continued)
213

I,--
ZD,...I
I.--
,nr-...Jrr
300 °
295 °
285 °
280 °
FIGURE B- 1 (continued)
214
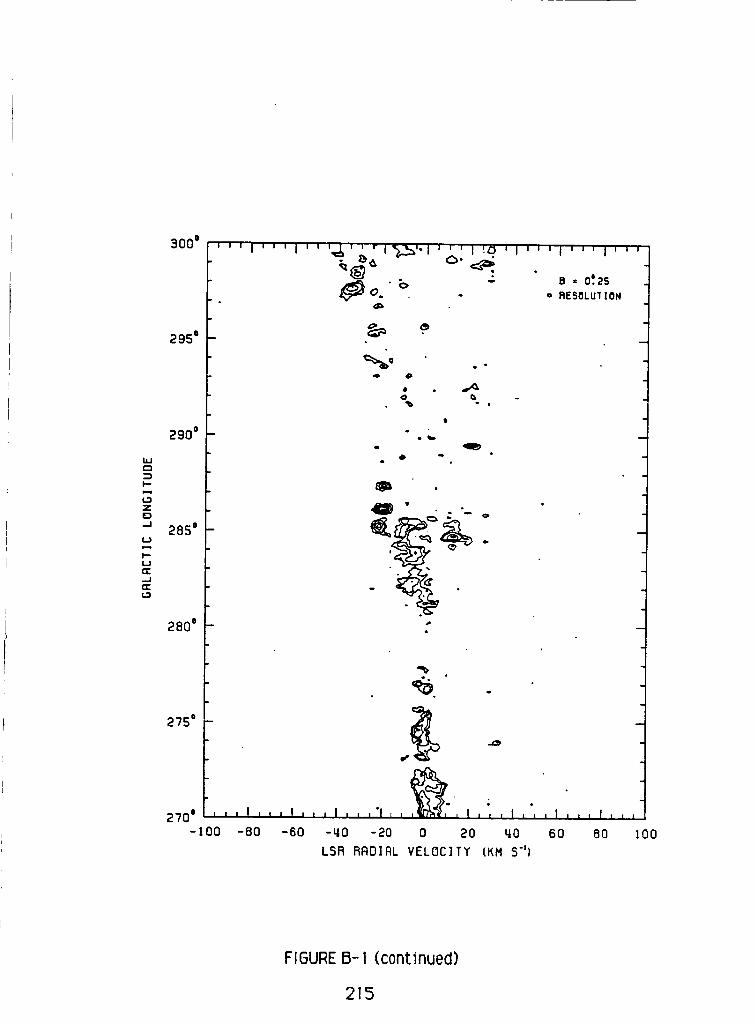
MJC_
I,,-
C_
ZE:3
..J
tJ
tJrr,,..In-
300 o
295 o
290 o
285 o
280 o
'''l'''l''',J,,, rJ3..._=,.i,,,i,q, j,,,i,,,j,,_=E__ o. ,_.
J_O." _' - B - 0=.2s- '= RESOLU'I ION
Q _
Q, .
t
I
o _
275= .'_ "_
.270 = , , , I , , i I , , , I , , ,'1 , , I , , , I , , , I i i , I , , ,
-I00 -80 80-60 -40 -20 0 20 40 60
LSR RADIAL VELOCITY {KM 5"1
100
FIGURE B-I (continued)
215

I--
Z{:)
._I
l.-
rr.J1"I-
300 o
295 °
290 °
285 D
280 °
275 o
e = 0'. 125" " _ " RESOLUT ION
o
°_
o" '1'° _0 :
Q
2-70 o , , , I , , , I , , , t , , v I , ,-100 -80 -60 -LtO -20
"_ 0 °l
i I i , , I , , , I', , , I , , ,
0 20 _0 60 80 100
LSR RADIAL VELOCITY (KM S"}
FIGURE B- 1 (continued)
216

LI.I
::)
Z
-.I
0
iD
rr..,I
300 a
295 °
290 o
285 °
280 o
2.,/5o
270 o
-100
''' I''' I''' I ''_' I'_,-_1'_ -_' I_','_,'_ I''' I''' I ' ' '
e. o'.o
'_ 4,. = RESOLUTION
%%
.0 • °,
o
o
• _
' 1LI,, ,I ,, , I , , D I = f i"
-80 -60 -qO -20 0 20 BO 60
LSR RRDIRL VELOCITY (KM S")
8O 100
FIGURE B- 1 (continued)
217

300 °
2g5 °
290 o
L,n
Z
0
- 2850LJ
F-
U
E
E
280 o
275"
I I .,,, I.,, a I ' ' ' I ' ' ' I ' ' '
oV • •
O _ " o RESOLU_ION
8
_ o_ "°U
O
t _t Qo
O
o °_
..
270 o , ,, I .... I , i , i , I , I .... I ,7 ,
-100 -80 -60 -_0 -20 0 20
LSR RADIAL VELOCITY (KM S"}
I , , , [, ,_ I , , ,1
_0 60 80 I00
FIGURE B-1 (continued)
218

300 o
295 o
290 o
Z
0
-J 285 o
F',,,
rr
,_J
rr
280 °
0 ° '°q*
LSB RAOIAL VELOCITY (KH S"}
FIGUREB- l (continued)
219
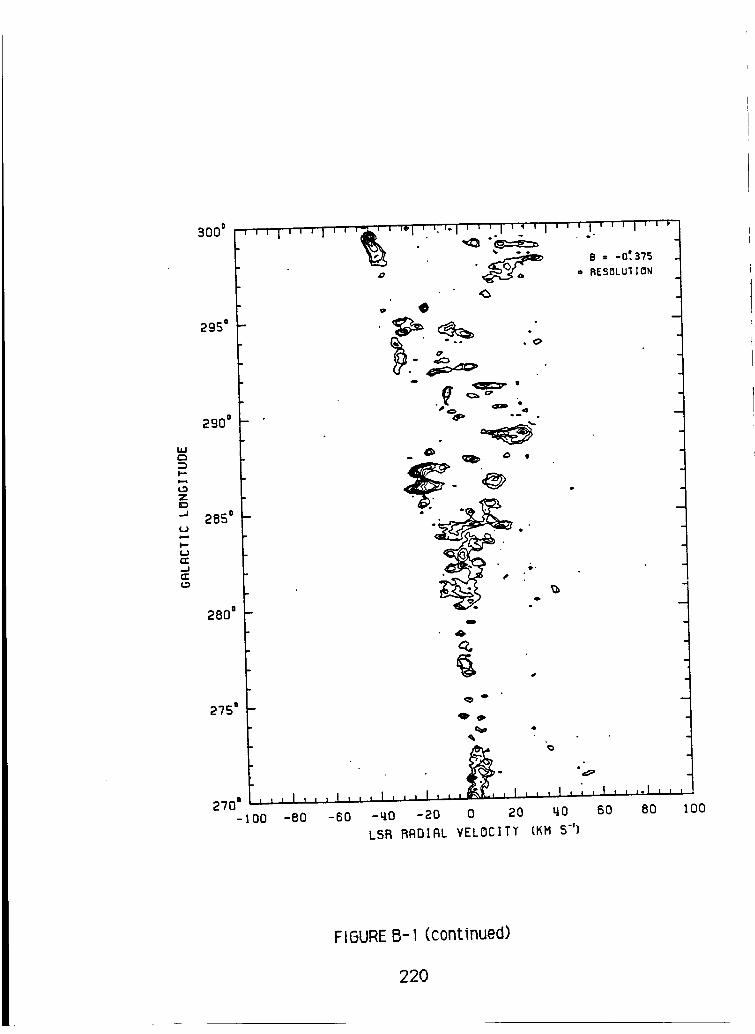
I.-
Z
..J
l.--_J
.J
SO0 °
295 °
290 °
285 o
280 °
275 °
'"_ I '' 'I I, r_,_, , ,_I _ L _-I' _ _ I ' _ 'I '' ' I ' ' ' I 'i' "7• _ "
• ._ B = -0'.375
o ,_._ o RESOLUTION
,. •
• C>
o
o
qP' _.
-60 -_0 -20 0 20 _0 60 80 100
LSR RADIAL VELOCITY (lIM S")
270" , , , I z i i I , , , I , , , I , _ , *, I , , , 1 , , , I'_ .... I , , ,
-100 -80
FIGURE B- I (continued)
220

ORIGINAL PAGE E
OF POOR QUALITY
I,--
ZO-J
I--
t-r"
300 o
295 o
2900
2850
280 o
2750
270 o-100
I ' ' I ' ' ' I ' I_'_) ' * I ' ' ' I ' ' ' I ' ' ° I ' ' ' I ' ' ' I'_ ' '
- . -__-." _ e = -o's=' RESOLUT ]ON
o4 .
_4_ Qo
o
,,,I,,,I,,,I,,,I,, i I ,.,', t', ll,,l,,i
-80 -60 -L_O -20 0 20 u_O 60 80 100
I VC_t_r'TTY CKH S")ISR RAO,A,.
FIGURE B-I (continued)
221

I-"
Z
E:)
(_}p-Q
I--
(..)
rr
,...1
O:
300 °
295 =
290 =
285 =
280 °
275 =
°_
=
'bI
.°
-80 -60 -u,o -20 0 20 u,o BO 80 100
LSR RADIRL VELOCITY (KB $-')
FIGUREB- 1 (continuecl)
222

ORIGINAL PAGE IS
OF POOR QI3ALITY
300 o
295 °
290 a
285of,J
=,
280 °
_ "°._ _> o... B = -O'.7S
• c_ _ a RESI_LU'r ] ON
i
" " _
_ ...o
¢
2_' -.,_ -
i270 o , , , I , , , I , , , I , , , I , , , I , , , I ,-r I i f , I , , t
-100 -80 -60 -LtO -20 0 20 40 60 80 100
LSR RRDIRL VELOCITT (KH $"]
FIGUREB- 1 (continued)
223

LUC_
Z0.J
w-q
_-)O:.J
300 °
295 =
290 =
285 =
280 °
275 °
270 =-100
' '' # ' ° ' i ° ' '_'_' I ' ' ' i ' ' ' i'"_ ' i '' ' i ' '' I' ' 'I,,, --o_"4F_ _ ,, RESOLUT ]ON
• ._ • .
"__ .[__ .°_ _- .°=,
_o ._
• ,_..._ _
_ __ ._.
e,
o D
:,O
o
Q
, , , I ,, * I , , , I , , , I, ,, I ' ' ' I '='?I ' '' I ' ''
-80 -60 -rio -20 0 20 i;O 60 80 100
LSR RADIAL VELOCITY (KM S")
FIGURE B-I (continued)
224

ORIGINAL PAGE
OF POOR QU'ALITY
ILlC_
I--
tOZED,--I
I""
(3:.--ICE(.D
300 o
°' O = -le.O
295 =
_90° _ ._
2850
2800 _ ,
_ 6o
_. .
,ib°
275"
II ot
o
" .
270" , , , I , , , I , , , I , , , I .... I , , = I , , , I , , , I , , ,
-100 -80 80
• o _ _s
°o m
-60 -qO -20 0 20 qO 60
L$R RADIAL VELOCITY (KM S';)
100
FIGURE B-1 (continued)
225

3000
295"
290 °
ILl
t..)
m"
-,.I
rr
2800
275 °
270 o
-I00
.. ...... . ....................... . .......... . ........... . ....
,,, t,, iI,,, I, , , I,,, l, , ,I,, ,f,,, I,, , l, I,
-80 -60 -LtO -20 0 20 u,O 60 80 100
LSR RADIAL VELOCITY (KM $")
FIGURE B-I (continued)
226
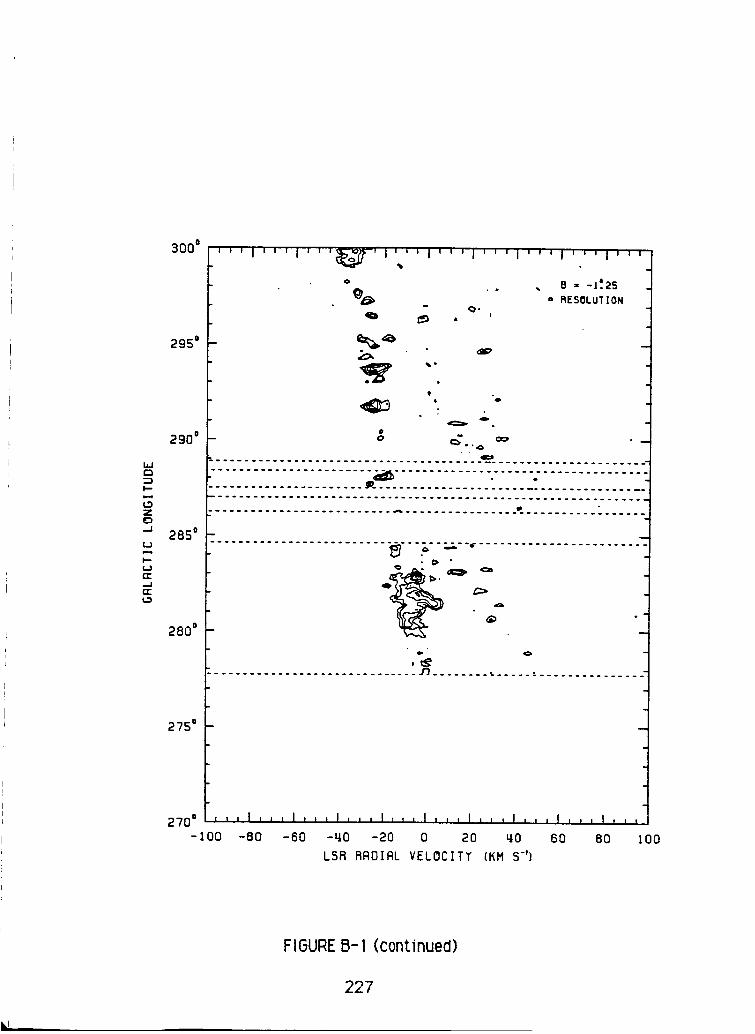
Z
¢3
_.1
(,..)
I.,',,-
CE
,,--Itr
300 o
295 o
290 o
285 o
2.80 o
275 °
270 o
-100
' ' ' I ' ' ' I ' ' J____,_' I ' ' , I , , , I , , , I , , , I , , , I , , ,
o .. , B = -I;;t5_ = RESOLUTION
ii
s ",o. o
o
o
o ¢_ ,o
P
.° ........................... _ ........ % ..... ". ...............
,,,l,,,l,,,l,,,l,,,l,,,l,,,l,,,l,,,llll
-80 -60 -u,o -20 0 20 u.O 60 80 100
LSR RADIAL VELOCITY (KM S")
FIGURE B-I (continued)
227
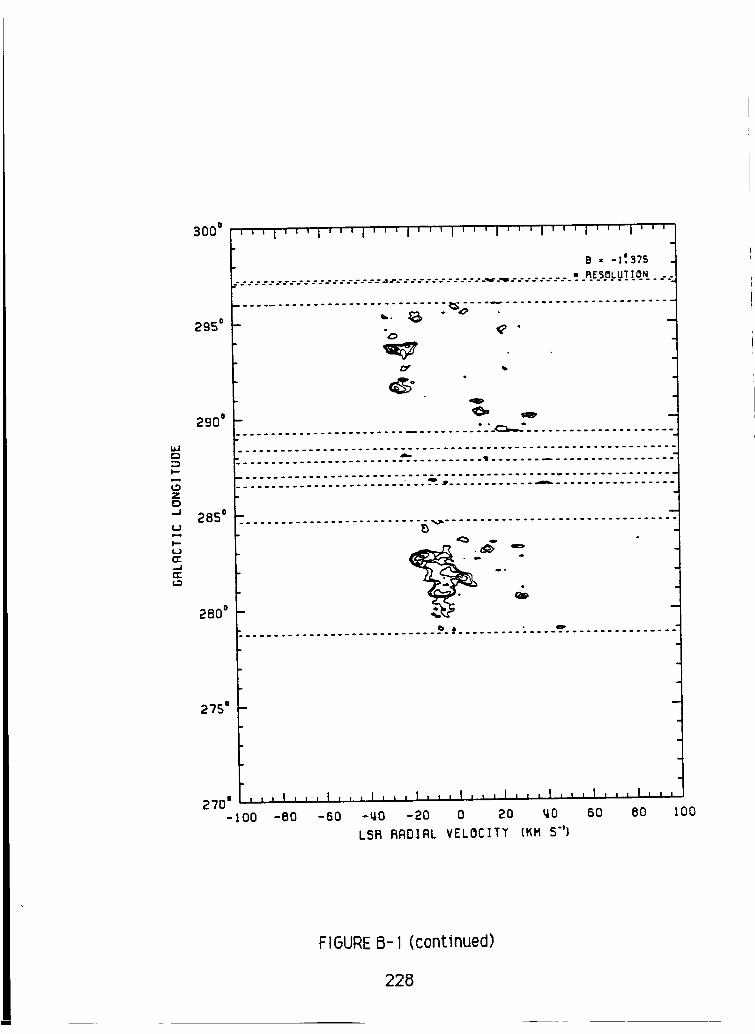
3000 , , , i , , , i , , , I , , , I , , , I , , , i , , 0 I , , , I , , , I , , ,
2950
2900
I,IJ
==
0, 285=
5=,==
280 =
2750
270 °-lO0
a - -_37s
o RESOLU_ION
.................... .......................
ITS::>" °
................................. : .'._..,..°. ....................,,,,.
,lllh.
,,,I,,,I,,,I,,,I,,,I,,,1,,,I,,,I,,,I,,,
-80 -60 -LtO -20 0 20 _0 60 80 100
LSR RRD]RL VELOC]'I'T (KPI S"}
FIGURE B-l (c0ntinued)
226

ORIGINAL PAGE
OF POOR QUALITY
1.1.1C_
I--
U3
Z
ID
._/
U
In
U
cr
(3:
300 °
295 =
290 a
285 =
280 =
275 =
B = -115• RE$0LU_10N
O 6
°-OI , !
dD=
• Q
D
........................... . ._. .............. 9 ...............
270 o , , , I , , , I , , , I , , , I , , , I , , , I , , , I , , , I , , , I , , ,
-100 -80 80-60 -_0 -20 0 20 _0 60
LSR RADIAL VELOCITY (KM S")
100
FIGURE B- 1 (continued)
229
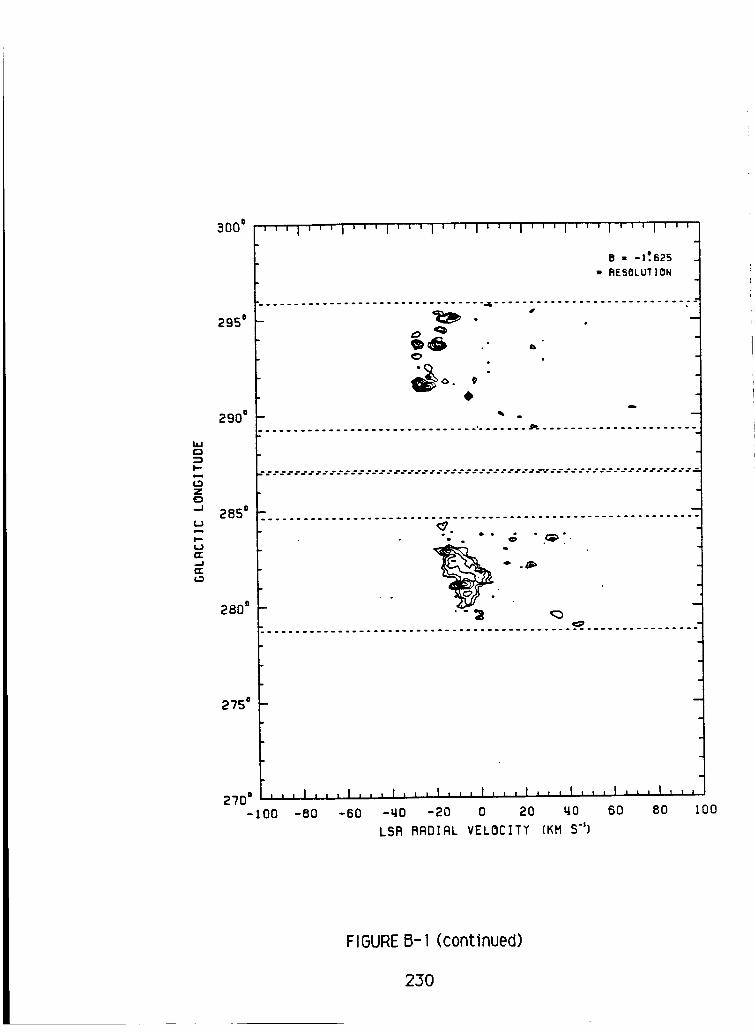
300 ° , , , i o , , i , , , I , , o I o , , I , _ , I ' ' ' I ' ' ' i ' ' ' i ' ' '
295 D
290 °
_' 285"
I--
_J
,.J
280 °
275 °
e - -J:s25
• RESOLUT 18N
Q
o
_' 0. #
270 o , , , I , , , I , , , I , , , I , , , I , , , I , , , I , , , I , , , I ' '-100 -80 -60 -YO -20 0 20 1.10 60 80
LSR RADIAL VELOCITY (KM S"}
!
I00
FIGUREB-1 (continued)
230

hiC_
C_Z0
(a
In{JrrIIer(3
3000 i i i i i i i i i i i i i i i i i i i i i i i i i i i i i i i i i i i i i I i
s . -_:TS= RESOLUTION
29s.: ........................ ......................... ....
285 o
2800
275 o
"ZZZ-'ZZZZ-ZZ;-'ZZZZZ-'ZZ--A.'Z-;Z-ZZZZZZZZZZZZZZZ_ZZZZZZZZZZZZZZ_
-.° •°..° ............. .... ..... ;o ............................... -
270 o , , , I , , , I , , , I , , , I , , , I , , , I , , i I , , , I , , , I , , ,
-100 80 100-80 -60 -WO -20 0 20 _0 60
LSR RRDIRL VELOCITY (KM S")
FIGURE B-1 (c0ntinued)
23I

295 °
290 o
hlr-i
I-'-
ZE:)
-J 285 o
l,"-
rr
rr
280 °
275 D
270 o-I00
,,,I,,,l,,, f,,,i,,,l,,,J,,,I,,,l,,,l,,,
-80 -60 -_O -20 O 20 _0 BO 80 100
LSR RADIAL VELOCITY (KM $")
FIGURE B-I (continued)
232
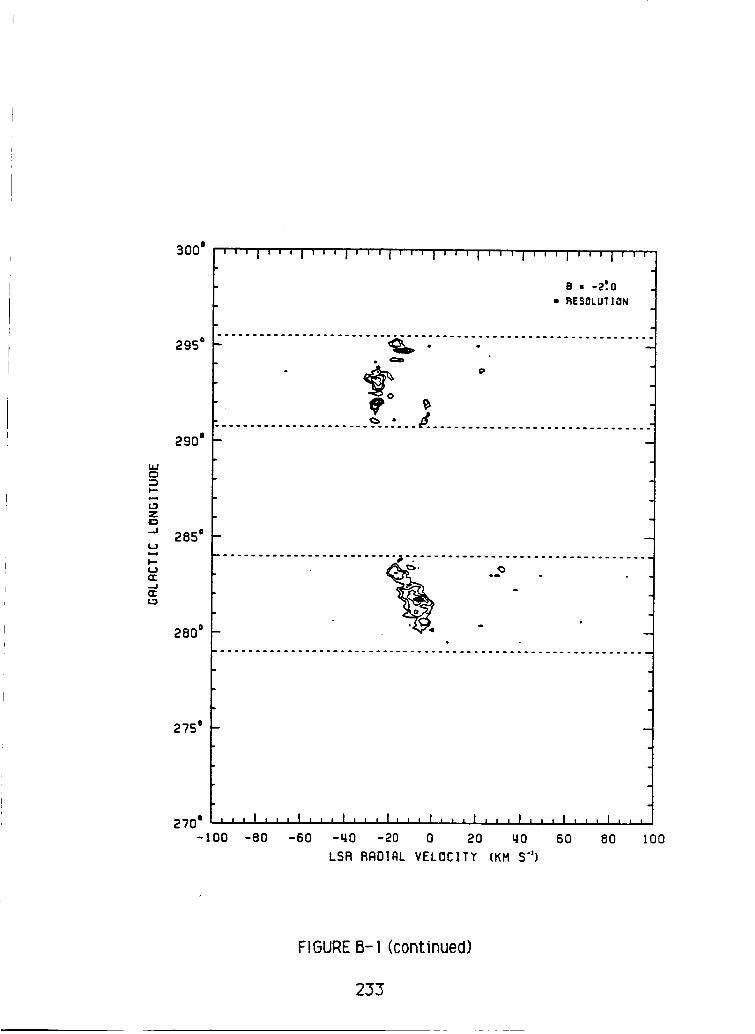
,,fr_
iI
ZID..J
(.3
l--t.3tl-
-JQ:
300 o
295 o
290 o
285 o
280 o
275 o
....................... _- -. ...... ; .......................
p
"''" ...... - .......... _ --eo °- -_- ..............................
II
............. : .......... _tL_:.......... _,.....................oo
, ,, I ,, , I ,,, I ,, , I, ,, I,, , I , , , I , , , I , ,, I, ,,
-80 -60 -_0 -20 0 20 _0 60 80 100
LSR RADIAL VELOCITY HiM S")
FIGURE B- I (continued)
233
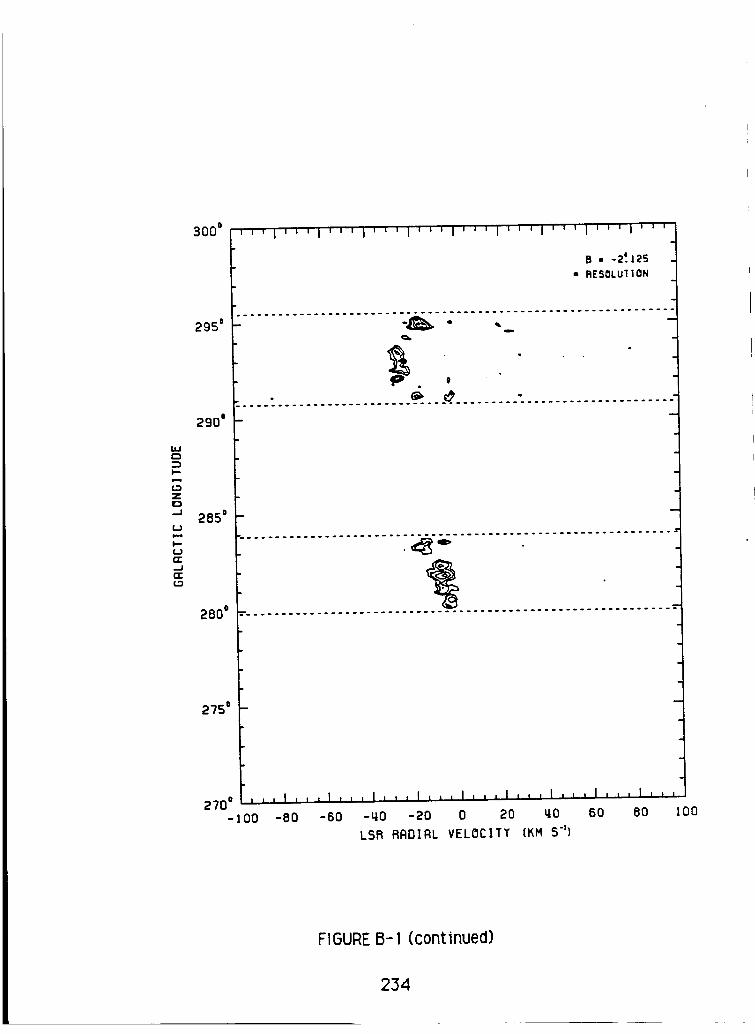
300 ° ,,,I,,,I,,,I,*,10,,I,,,I,, ,I,0,1,,,I,',
295 D
290 o
285o
5
280 o
275 °
270 o
-I00
...................... :_L: ......: .......................
, ,, I,, ,I,, , I, ,, I , °, I , , ,I ,, ,I ,, , I, ,, I , ,,
-80 -60 -_0 -20 0 20 _0 60 80 100
LSR RADIAL VELOCITT _l_H $")
FIGURE B-I (continued)
234

t-_
I'-."
Z
0
-J
(,J
II
rr
.,.J
rl-
300 ° , , , i , , , i , , , i , , , I , i , i , , _ 1 , , , i , , , i , , i i , , ,
2950
290 o
285 °
2800
2"75o
270 o
-I00
...... " ............................ 4P .........................
o
"°
I
- ........................ .......... ..... ...............
z:_ .-°
,,,I,,,I,,,I,,,I,,,I,,,I,,,I,,,I,,,I,,,
-80 -60 -40 -20 0 20 40 60 80 I00
LSR RADIAL VELOCITY (KM $"1
FIGURE B-I (continued)
235
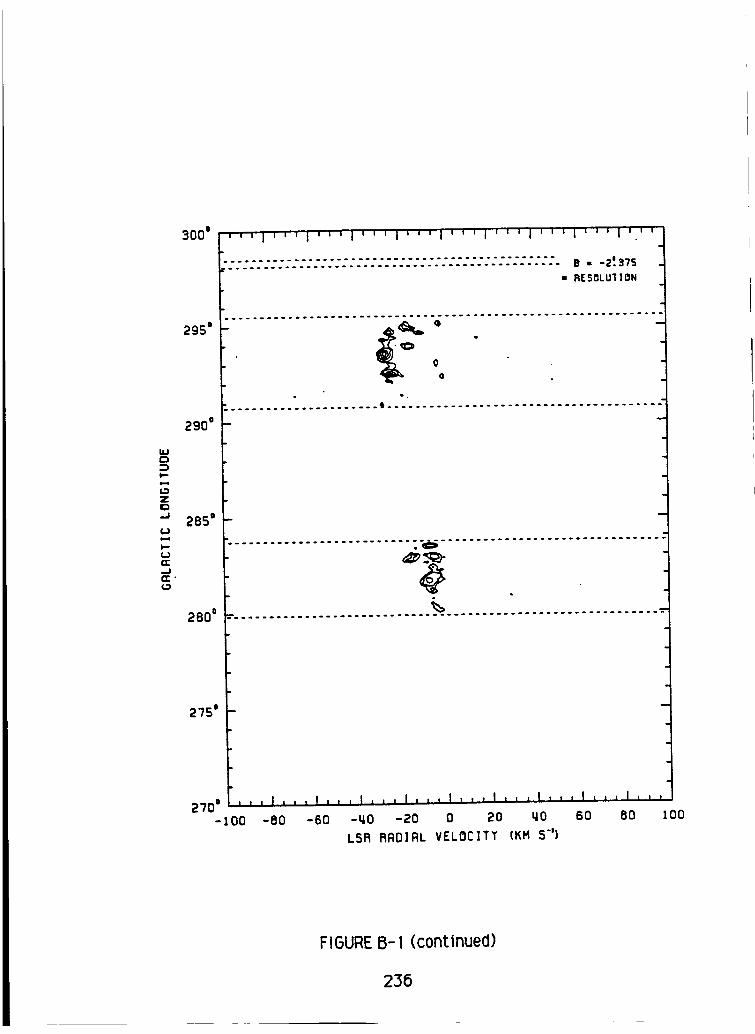
UJ£3
I--=-i
Z0.,J
t_
I.-(..)rr,,.Irr.
300 ° ,', , i , , , i ,', , I , , , i , , , i , , , i , , , i , , , i , , 0 i , , ,
295 °
290 o
285 °
280 =
275"
270 °
=°.° ........ ° ........... .° .... ....°......._...°............................................... B - -2'. 3"IS
• RESOLLI_" 1 ON
.
.
,,, I,, , I ,, , I, , , I, ,, I, ,, I,, ,I,,, I , ,, I, i =
O0 -80 -60 -40 -20 0 20 40 60 80 100
LSR RRD]RL VELOCITT (KM S"]
FIGURE B- 1 (continued)
236

¢:3
I--
Z
E:)
-.I
(.J=,-,.e
I--
rr
300 o
295 =
290 =
285 o
'''1 '' '1''' I' ''1' ''1'' '1'' '1'''1 '''1''_
:.. " 0 e . -2:s".............. .... ............. ...... . .... . .....
'= RESOLU'I I ON
; ..................... _-_=_- _-.... ............................
I Q •°. ...... . ......... . ..... . ...................... . ......... ....
.
......... .°..° ..... .° ..... -_ .......... . .................... ."
-.280 ° .............................................................
275 =
I
' '' I ,, ,I ,, , I,, , I,, , I , ,, I ,, , I ,, j I, ,, I, , ,
-80 -60 -qO -20 0 20 u=o 60 80 100LSR RADIAL VELOCITY (iiMS")
270 =-100
FIGUREB-1 (continued)
237

t,lC:3
t--i1--1
ZD,-I
lit
I,--Urr.--I
rr
300*
295 °
290*
285*
''' I'' '1'''1'''1''' I'''1'' '1'''1'''1'''
-........ .... ... ..... .°_p._°..= ............. ....... ..... O,,... ° °.
" B = -2.6;+5............................................. • _FSOLU;ION "
_........°.. ..... ... .... .°.._ .... ....o°..°.. ..... .°... .......0
280 o .............................................................
2750
2700 , , , I , , , I , , , I , , , I , , , I , , , I , , , I J , , I , , , I , ,-I00 -80 -60 -_0 -20 0 20 _0 60 80
LSR RRDIRL VELOCITY filmS")
!
lO0
FIGURE B- I (continued)
238

300 o
295 °
290 °
II111111111111 IIIIIIIIIIII Iltl IIIII IIII
".. ......... ......... .......... _ ..... ..... .................... °
• B - -2:'tS..................... ...." ..... _ ................ • BFSOLUIION
..................................................0
..........°.°. ............ . ....... .o ................ . .........
275 o
2?0 o
-I00
,,, I,, i{,, ,l_ ,, I,,, I,,,I,, ,I ,,,I , _ I,,,
-80 -60 -_0 -20 0 20 _0 60 O0 IO0
LSR RADIAL VELOCITY (KM S")
FIGURE B- I (continued)
239

IaJ
I,,-
ZID.,.I
/.)
I--¢.Jrr,-J
3000 ,,,,,I,,,I,, ,I,,, I,,, I,, ,I ,,'¢I,,, I,,, I,,,
295 =
290 =
285 =
280 =
275 =
270 =
-I00
............................. ' ................. B - -2 =,B75" . ................... .e,..... ,_. ................ • RESOLUTION
O
..... ...l.....'-......-. ..... .... ...... ........ ..... .... ......
.. .... .... ........ .... ............ . ......... . ......... . .....
,,,I,,,I,,,I,,,[,,,I,,,I,,ll,,,I,,,I,,,
-OO -60 -'.iO -20 0 20 LtO 60 BO 100
LSR RRD]RL VELOC]TT (KM S"}
FIGUREB- 1 (continued)
240

i.I,J
M
Z
0
tJ
I-.-
..I¢r
300 o
295 D
290"
285 o
/280 o
275 °
270'
''' I'' ,1,,, I,,,i,,, I, , ,I ,, ,1,, ,I , ,, i, ,,
•" .............................................. B • -3_0• RESOLUTION "'
:..................................................• °
, ,, I,,,I,,lll lllii,ll ill,, ,I,,,tilill li
-100
m
-80 -80 -40 -20 0 20 40 60 80
LSR RADIAL VELOCITY (KM S")
100
FISURE 0-1 (continued)
241

:DI--
ZID..I
(..)
I.,-¢..)er..IQ:
300 ° , ,'''1'''1'''1'''1'''1'''1'''1'''1'''1'''
295*
2900
285 °
280 o
2750
2700-I00
,e,°............. _ ................................ .: ............ .°
--° ...... - .................... 4" .... " ............ °-°-" .........
.... ........ .. ........... . ....... .°... ........................
i
i i i J i i iI i i i It i i|,.i I | i ¢ i ti it II llt J I i t I i I !
-80 -60 -qO -20 0 20 qO 60 80 100
LSR RRDIRL VELOCITY {KM S"}
FIGUREB-I (continued)
242

(__
Z
[:3
..J
0,,-e
I--.
f.J
n-
..Jrr
300 °
295"
290"
285 o
280 o
275 o
270 o-100
° t°
.............................. 0 ............... e" ..............
,,,I ,,,I,,, I,, ,11,, I,, ,I ,, , I,, ,I,,, Ii i,
-80 -60 -u,o -20 0 ;tO qO 60 80 100
LSR RROII:IL VELOCITT (KM S")
FIGURE B- l(continued)
243

I,l.I
M
Z!:)..J
IJ
I-.
n"...I(3:
300 o
295 o
290 a
285 o
280 °
275 °
m
,,,I,,,I,,,I,,,I,,,I,,,I,,,I,,,I,,,I,,,
-6)0 -60 -tlO -20 0 20 I;0 60 80 I00
LSR RRDIRL VELOCITY (KH S")
FIGUREB-I (continued)
244

I.i.It-,:DI.D
ZO._J
iI
rr..JC=
300 ° , , , I , , , i , , , i , , , i , , , i , , , i , , , i , i , i , , , i , , ,
295 =
290 °
285 o
280 °
275 °
,,,I,,,I,,, I,, ,I,,, I,,,l,i iI Ii II,,,I,,,
-80 -60 -L_O -_0 0 20 qO 60 80 I00
LSFI RADIAL VELOCITT (KM $")
FIGURE B-I (continued)
245

hi
Z
II
.JIT"
3000
295 °
290 °
2850
2800
275 °
2-/00 , , , I , , , I , , , I , , , t , , i I , , , I , , , I , , , I , , , I , _ ,
-I00 -80 -60 -_£0 -20 0 20 _I0 60 80 100
LSR RRO]RL VELOC]TT (KI4 S")
FISURE B- 1+(cont+nued)
246

LIJr-,
I--
Z0-J
t-)
)-.
rr..Jrrc.=
300 o , , , i , , , i , , , i , , , i , , , i , , , i , , , i , , , i , , , i , , ,
295 °
290"
285 °
280 °
275 D
270 o
-100
|||[llalllllll iltlllllllll IIIIII t Illll!
-80 -60 -_0 -20 0 20 40 60 80 lO0
LSR RP,D!RL VELOCITY (Kff S")
FIGURE B-1 (continued)
247

bJ
t--
Z0.-I
(J=-qI,.-f,Jrr,.Jn-
300 o ,,,1',, ,I,, ,I, , ,I, ,, I,,,I ,, ,I ,,, I ,,,I, ,0
295 =
290 =
285 o
280 °
275 =
270 °-I00
L.
::::::::::::::::::::::::::::::::: -- .-.- ----:- .................. .
u
,,,I=L,I,,,I,,,I,,,I,,,I,, ,l,,,I,,,I,n=
-80 -60 -qO -20 0 20 u,O 60 80 100
LSR RADIAL VELOCITY {KM 5")
FIGURE B- I (continued)
248

e-t
i.-
zE__J
(,J
i.,,-(.._t'r",,.Jer(..3
300 o
295 o
290 o
_uJ
280 o
275 o
270 o
-I00
,, , I ,, _ I,,,I,,, I,,, I,, ,I , , ,I ,,,I, ,, I, ,,
B " -_,'.0= RESOLUTION
,,,I,,,I,,,I,,, I,,,I,,,I,,,I,,,I,,,I,,,
-80 -60 -_0 -20 0 20 40 60 80 100
LSR RADIAL VELOCITY (KM 5")
FIGURE B- 1 (continued)
249

295 °
290 _
r-,
I-
U_ZED
-J 285o
a-i
I.,-(..)O:ml(3:
280 °
275 °
L,, I ,, ,I , , , I, , , I, ,, t, , , I,, , I ,, , I, ,, I, , ,
-80 -BO -LIO -20 0 aO LIO 60 80 100
LSR RADIAL VELOCITY (KM S"}
FIGURE B-1 (continued)
250

ORIGINAL PAGE I_OF POOR QUALITY
(%1ilop,.t%l
ii
.J
'I'''I'''I'''
Oo l
'''I'''I'''
.l...l...l...l...l.,,l,_.
% 0... % "_ % % %.I I I I
30nlILU7 3113U7U9
O
Ip.q
It')
O
b')
I
I
p.
I
{3
I
N
w-I
3
,,-4,
ra
'I''' I,,,I,,,i,,,i,.,i,,,
IIi
II
% "_ % ".. % % %.I I I I
30AIIIU7 3113U7U0
r _to')
w
3
U') .-I
I_-
!
7"
Io
r_
I
'I'''I'''I"''
O
i
i
''' I' '' I'''
i . i , .. i.. • i .l. i ... i... i...ii
% "_. % "_. % % "::,.I I I I
30NIIIU7 3113U7U9
C)
O
i
w
_3
v
O_
I
I
'1'''t'''1'''
E)
' ''1 '''1 ' ''1 _1
cr)
ico
3
_ -J
f_
!
Q
I, I...I ... I... i...I ...i ili ii w
% "._ % "_ % % "= ,I I I I
_ONI 11U7 OI13U7UO
FIGURE B-2
251

"df_
I
,i.,?'i,.,i,., t,.l,,'tl,.,
|i
i
i
% ._ % o % %I I I I
30fll I I_7 3113_7U9
r_.
tt_r_
i
i
i
7"
_ R
_ .,..1
_1
U_
_J
,l_,,l_,l,,,i,,,l,,,l,,,l
i
)i
% ".. % % % % %I I I I
30niIl_7 3]138780
w
(3
U3 .A
i
_3
_3
I
%
I
, i , 1 i .,,i,.,1'.,.I,,,i.,.
i!
|
i
• ,, l , . . t . , , I . ,, I, ,,
- % "_ % %
30fill 167 31i3U7U9
U
e,-"
¢¢)
I._ --II",-
|
I
I
n
' I' ' ' I '' ' I' ' '
% _ % "_ % % %I 1 I I
30_II I I_7 3113U7U9
N
t,_
T
tO
Ode-:-.
'N
_ ee"
ff'l
_') ._1
I
!
FIGUREB-2 (continued)
252

r,-t_J
..J
,i,,,i,,_l,,, °''1'''|'''
% "_ % "... % % "=,,I I I I
3ONIIIU7 3113_7U0
0
!
o
b_
('U
!
!
f_
!
C3
0
T
w
F-
..IOC
n-
,.3
'l'''l'''l''' '''1'''1'''
,f,,,I,,,_,..l,,,l,,,f,,,I
% "._ % "... % % "=,I I I l
3OAIIIU7 3113_7_0
O
O_
w
3E3
C_Y
n _.-
U'_ .-Ii_-
I
C_
(:3
T
,,.,.,o.
I'-
II
.,.,JI
' I ' ' ' i,,,l,,,i,, ,i,,,i,,,
iiiiz
I
• 1,i
o
i
nla.,J...I...I...I...I.,.I
% "_. % ",.-, % % %.I I I I
30nlIIU7 31i3U7_D
H
w..d
3
O_ rr
0
I.,o .-II"-
I
C:::)
I
,i,,, ,,,|,,, .... I'''l'''
.I...I...l...I...I..,Itl h
% ..... % o.., % % 7=.I I I I
30_III_7 3IIOU7UO
I C3
U')
w
(..J
0
.-J
U'_ _J
C3
i n-
O%
I
C3
C3
I
FIGURE B-2 (continued)
253
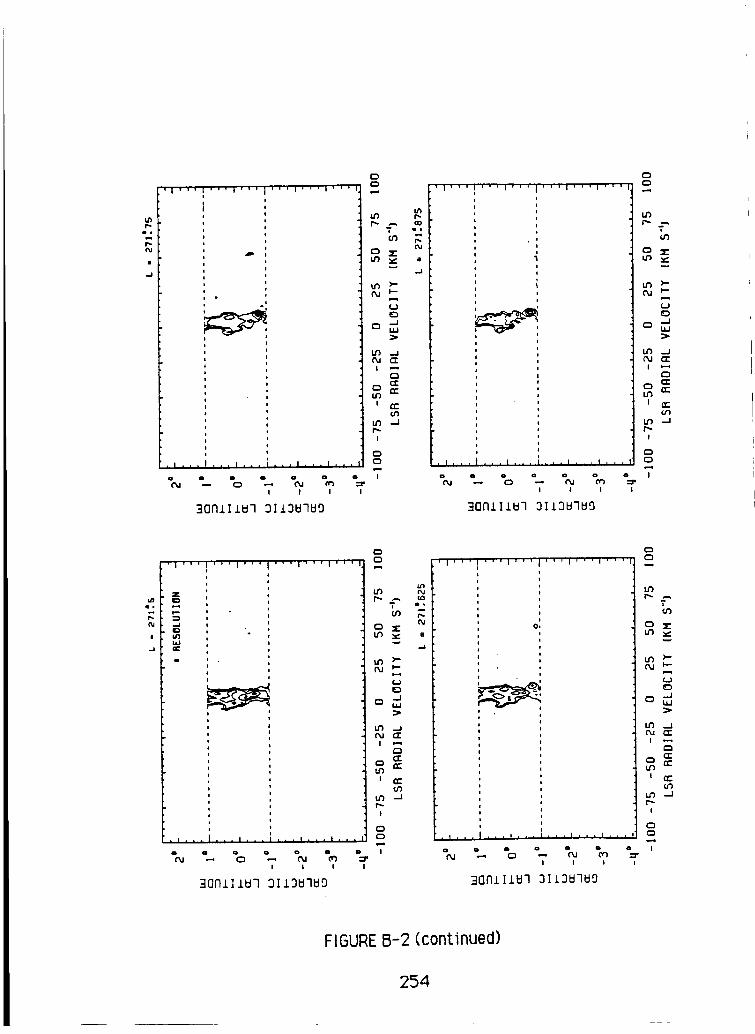
Lnp..
i.
..J
'I'''I'''I''' '''i'''l'''
,|,ll I, 'I'''I'''I'''I''"
o ._ % ._ % %I I I i
30AIIIU7 3113_7U9
CD
i ,..,
U')f,.
O
U')
I
I
U')
I
C)
O
7"
w
U
Q
.--I(I
..J
'1'''1'''1''' '''l'''l'''
,I..,I,,,I,,, I...t. ,.I, , ,
% "_. % ".. % % "=I I I I
30171] 1U7 3113_7U0
CD
CDI
U_
tU'_
iI
(__
O
U_ ..J
C_
I n-
U') --I
!
(D
I
u_i.
f,,.
I
,,.i
'1'''1'''1'''
=..
i
'''l'''l'''l
% "_ % "_ % % "=I I I I
30nlllU7 gI13N7N0
CD
CD
U')
AT
O
U') --Icu CC
I ,--,
Cl
i QC
U') --I
r--
!
C)
CD
I
¢oi.
II
i,,,i,,,l,,,I,,,I.,,
ii
II
I
,1,,.I ,,,I,.. Ir.,I.,.I,.i
% "_ % "_ % %I I I I
30AI11_7 3113U7UO
0
UO
T
Cn
(_
.,J_ M
_'1 _J
I ee"
r_
I
Q
I
FIGUREB-2 (continued)
254

(%1
r_c_
I
.I.._I...I...I...I...I...i
% % % o....% % %I I I I
3OnlIIU7 3113U7_0
!
r,,-
i
I
r,-
!
o
i
ru
w
o
m-
r-i
.-I
,I,,,i,,,i,,,;,,,l,,,i,,
.l,..l...1,,,i.,,l,,,l,,,
I I I
30NIIIU7 3113_7U0
U')
r',..0
_'_ C_
o_
U') ...J
I
C_
7"I
0
I
--I
'I'''I'''I'''
• o
°,
'''l'''i'''
.I. .......II I .I...I...I.. . i
% "_. % % % %I I I I
30fllII_7 3113U7_D
uw
0
p...
I
0
C_
I
.|... '''I'''_'''I'''I'''
.!
.l ...... J...t..illlilll i
I I I I
_0_I11_7 3113_7_9
r',-
o_
it) --i
b") .-i
I
i
FIGURE B-2 (continued)
255

i_-fu
|
..d
'''I'''|"''
-_ % *._ % % "::,,I I I I
30f1111_7 3113_7U0
0
U_
p_
0
U')
I
I
I
I
==4
g.
N
-J
r|r.'|,,,l.,,, ' ' ' I ' ' ' I ' ' ' I
.i.,.I...t.,,i..,r...t...
% "..,, % ".... % % "=,I I I I
30Nll 1_7 ZI13_7UO
C_
r _
u'l
hl
OU CI_
r'_
t
I_-
I
C_
I
U_
f_
|
.t,,,i.,,I,,O
m
i,,,i,,,i,,.
!i
i
iiii
i
i
!i
i
,t, It I I I I
% "... % "_. % %I I I I
30AIIIU7 3113_7U9
0
w
U') --I
i
!
L_
II
'1'''1'''1'''
• 0
o
' ' 'l ' ' 'i' ' '
,i..,I ..,i... ,,, ,I.._1 . ,,
% "_ % "_ % %I I I I
30nIl1_7 3113_7U9
C_
I_-
W
!
I
FIGUREB-2 (continued)
256

u_
--I
'I'''I'''I''' '''I'''I'''
,I.,:I...I,,,I,,,I.,.I,, I
I I I I
30A±I1_7 3113_7U0
CD
C)
U_
f,,
o
O
U_N
I
I
U_f,.
I
O
O
..q
I
wJ
O
>
.J
{E
C_
==
u_
.J
'I''' l,,,l,,,l,,,l,,,l,,,
iib
ii
,l,.. ,,,I,,,I,,.I,,,I,,,
% % % "_ % % "=.I I I I
30NIIIU7 3113U7U0
C)
C_4-,
r,- ,-,,
(.J
o
I
t _
p_
!
I
OI°
I
.,J
'I'''I'''I''' '''I'''I'''
_OO '
,l,-!l.,,l...l..,l,,,l,,,
% "_ % ".. % % "=.I I I I
30nlIIU7 3113_7U9
O
O
N
w,,J
O
o ,.-I,
U'I ...1
I
O
I
'I'''I'''I' ..... I'''I'''
I,,,I,., I,.,I,.,I,,,I,,,I
% "_ % "_ % %I I I I
30nl 111_7 3113U71_g
I:D
I_-m
f_l
lid
O -JbU>
U_ _JOU CC
'NN_
m .,.i
f_!
c_
!
FIGURE B-2 (continued)
257
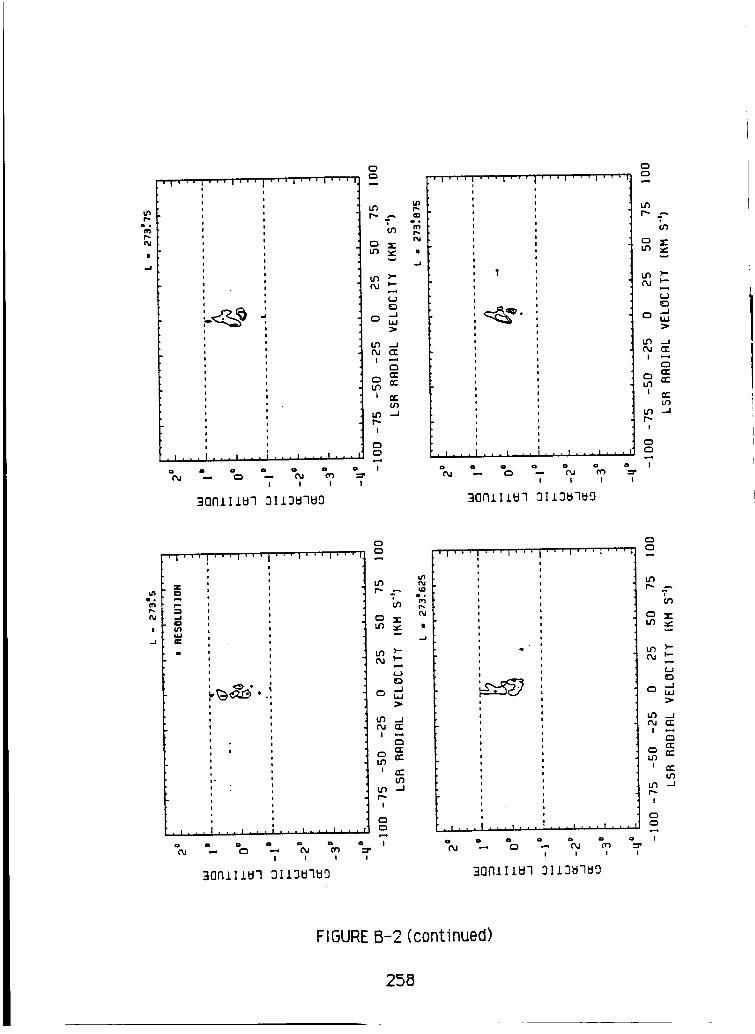
p-
IM
I
,i,,,i,..i_._ ., , i', °, i, , ,
% ._ % o._ % %I ! I
3flflIIIU7 3113_7U9
C_
i (:3
w
¢.J
..Jrr
bO
I
{3¢3
TI
#
..3
,l,_,l,,,l,,,,,,+l,,,l_.,
% "_ % % % % %I I I I
(:3
I.¢)
I'_ ..,t(P},
E)
U_ -J
t'X.l rr"I ,-"+
e-i
I ,nr-
(PJ
Ltl ..I
p,,.
!
!
I.
ii
.,,.i
,|,,l ,lii.,l
IIIIi
II
II
I"
,,,I, ,+ I,,,I
.I, ,.I... l...i.,,a. ,_IL. I
% "_ % "_ % % %I I I I
30All IU7 3113U7U9
¢3¢3
Mw
¢_)
rr
C_
m ¢¢
I
¢3C3
ii,i, +,,i,f+ ,+_11'_,i,,,
% % % __ % % %I I I I
30AIII_7 _113_7_0
U_
?
m _J
_ ee"
m -.Ip,..
!
!
FIGUREB-2 (continued)
258

t,n
('M
i
'''1'''1'''
,J,., I,,.t,,,I,,,I..,t,.,
% -- % 0_. % %I I I I
30All IU7 3113_7_9
I
U')
I
oI
U')
I
0
I
I i+
w
,I,,,I,,,i,,_
0I0
II
-J
' I ' ' ' i ' ' ' | ''.' '''|' ''1'''
.... % o... % % 0=,.I I I I
30AIII_7 31131::17_9
II
w
IX') ....J
'V,
I
C:)
I
.o
' ' ' I ' ' 'I ' ' '
,I.L .i '',I. ,, IL..I.I,I ill
I I I I
30A111_7 3113_7_9
b_
i
°,.-4,
r_
C_
b'_ -..J
I
i
FIGURE B-2 (continued)
259

U'_r',-
I.I
(%,I
ii
.J
,,,i,0,i,,,i
C:)
n.
w.=.I
CP 0
I._ ..I
I ,'=,
C:3
I _C:
¢rJ
l._ il
l'..
I
• 0
,...0
I ! l I
30Al11_7 3113M7UO
C_
C_
iU')
0
I._ _£
C2:
r'_
I rr"
cr_
I._ --J
I
,I,,,l,,,_,,,i,..i,,,i,,,_
% "_ % +,_ % % _ '! I I I
3017111_7 O113U7_0
o,
|
'I'''I'''I ''+ '''I'''I''' I 0
-g .
N
I
+-1
% .... % o._, "m ",,-, % 'I I I I
30nlIid7 3113d7dO
,i,,.i,,,i,+,
FIGUREO-2 (continued)
260

t_
|
,l'''l'''l'''J'''l,,,I,,
iis
I,l...I,,,I,,,I,,,],,,i,, ,
% % % % % % =,I I I I
30FII l IU7 31J.9_7_9
U')
0
U')
I
!
I
C3
!
LI
(3
../
C)
llZCY)
-J
Ii
.J
, i , 0 , I ,, ,I,,, I,, ,I,,,I, , ,
II
.I
O
I o
,l...I..,I... I,,,I,,,I,.,
% "_ % % % %I I I I
30N1 IIUq 3113U1_9
C_
If)
0
U')
w
L_ >-
U_ ._;
C_
I._ --J
I
C)
0
I
, | , _ ,
.j hr.
I
''' I '' ' '' ' I' ' ' I' ' '
% o % % % % %I I I I
qOiTl I IU7 311 31:171:19
C)
IIw
0
I_ ,_I
'F=
!
i
'1' ''1 ''' I'''i!aviiii
iti!i
' ' ' I ' ' '1 ' ' '
I ...... I , . . I , . , t . • • j I I I
I ! I I
301"III lld7 3113ki71:19
C_
O_
I._ _J
I
I
FIGURE B-2 (continued)
261

l,np,,,,,
p,.<'%,I
|
,.,J
,li,,|w,,l,,,' li,l'Tvr|+iT
"<.,, ".... +<:::, +.... % % %I I I I
3017111_7 311_17_9
j
U'_
f,_
(3
N
I
I
!
7"
A
'7
(.h
q,J
O
.--I(=
rf-(,_
H
..I
o
+ I ..... , I +., I .,. T. , , I , , ,
% ".... +<:::, "... % % :=,.I I I I
30fill 1B7 3I 13U71dO
t_
r'- .--,ior)
or) i.i
P,..I
I
c,..,,
MmU')
!
"7
i,a
|
i
''' l''' I'''I'''I'''
iI+
o'.
,.,=_
. I ...... I , , , i . . . I , . , I , . i
% "..., ",:::, ".., % ",,..> +::,.I I I I
3OFII I I_7 3113_7_D
C_
U')f...
C_
0 r,-
U') -_
f,,..
I
(3
C_
I
M
..I
"11"°'|'''I''' '''I'''I'''
' ,o,;
• I . . , I . , , l , , . I , + , I . . . I , , +
% ".... % ".-. +<,,., % 7:,.I I I I
30A111_7 3113_7_9
ubr _-
i
o'}
._.IQ.I
rr
n A,-
or}
f,,,,.
I
C_
I
FIGUREB-2 (continued)
262

U'){M
"Gp.
--I
'1'''1'''1'''iiiii
ii
• o 61
'''1'''1',,
,I ...... I...I.,,I,,,|,,,!
% "... % ".. % % ":,I I I I
30NIIIU7 3113_7U9
tt_
p-
!
o!
I
0(3
I
T
30
.-4,
--I
-I
'1'''1'''1'''
}_:_ " ._,.
'''1'''1'''!
, t ...... I . . . I , , , i , . . i . i i I
% ".. % "... % % "=I I I I
30AIIIU7 3113U7Ng
I_-0
(Jr)
p.q
W
!
!
oa.
|
--i
'1 ' ' ' ' '' I '' .... i' '' I' ' '
,I...I,,.I...I...I,a,l,,,
% "_ % "_ % % "=I I I I
30NlIIU7 3]13_7U9
0
uw
--I
3
(A
f,,.I
!
'I''' I , , , i , . , i , , , i , , . i , , ,
ii
$
#i
|!t
, I . • • : , , . I , , • I • i , I , , , I , , ,
"_ % % ".. % % "=I I I I
3ONIIIU7 3113N7_9
C)
0 ,_I
I._ ,--I
0"1
f_
I
0
I
FIGUREB-2 (continued)
263

,i,,,i,.,I ,'_ ''°I'''I'''I
% "_ % "_ % % ":,,I I I I
30fl111_7 3II3U7UO
0
T
tt_
o
OJ
I
I
UO
I
C_
0
T
w--I
(.J
O
IIn"
C3
00
'I'''I'''I''' '''I'''I'''
,I ....... I,.,I,,,I.,,I...
% "_. % ".. % %! I I
3OAIIIU7 3113U7_9
(:3
C)
U_I_-
03
O
l.m,3
If) .-I
OC
n-
I el"
03
u'% .-I
I
TI
I
..J
,|,.11,,,i,,,i,,,I,,'I'''I
I
I
M"
I
.I. ,, I,,,I ,.. I,,.I...I, ..
% % % "_ % % %I I I I
30rlll 1_7 31131:171:19
C3
U3
1:3
I
I
U')
p-
I
(3
I
0
,.-4,
,--In"
==ee"
it%
..J
u5
I!
,i,,,i,,,i,-,,i,,,i,,,i,,,I
"1
,Iii, ii .I.,,I,,,II''I'``
% "_ % "_ % % "_-I I I I
30Nl11_7 3113_7N9
03
rr
C_
O0
r _
I
_3
I
FIGURE B-2 (continued)
264

&n
a.r_
i
,.J
' ' ' I' '' I' ' '
,I,,. I,,.t,,.f,,,I,,, I,,,
% o._ % o._ % % %I I I I
30n111_7 311D_7UD
('D
i
L_
f_
0
tt_
I
I
I
C_
== ...I
0
.-4
.-I
r_
erU'}
.,.I
'l'''I'''l''''''l'''l'''
,I ...... I,,,I.,,I.,,I,,, J
% __ % _.. % %I I I I
30AI11_7 9113_7_0
U')
I_- ...u
(._
I._ ..I
('y (3:I M
r_
f rr
r'-
I
C_
(::3
I
0m.
fY
I
_..i
'I'''I'''I''' '''I'''I'''
,l ...... I...I,,,I,,,I.,.
I I I I
30AIIIU7 3113_7U_
; e',
II
°.-4
_') .--I
fy _,-I ,.-,
i n-
O')
p,..
!
_b
I
'I''' '''I''' ,, ,i,, ,i, ,
. I ...... "I. , , I . , , I . . , I , , •
% % % _ % % =,I I I I
30AIII_7 3113_7U0
(_
, (_
U_p.,-
?
Of')
i n"
L_ -_
r--
I
Q
;
FIGUREB-2 (continued)
265
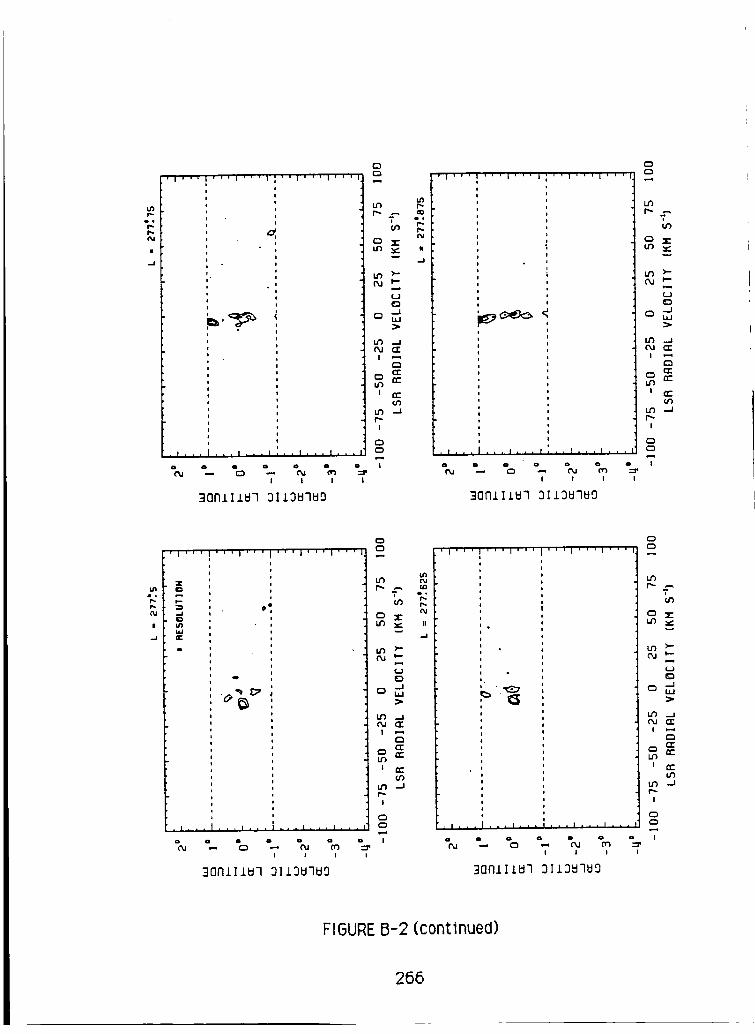
P-I.
(%1
I
--,I
I
|!
I|
iiooii
• 0iii
_,_ '
% "._ % "._ % %I I I
30AI11_7 3113_7_D
E)
I
tOp.
(:3
t_
I
I
tO
I
C3{3
?
I
-- o.
b_ F-
0
m
.J
II
I
% "_ % "._ % _ "=.I I ! I
30AIIIU7 3113U7_0
U'_
p- .--.i
U(D
D./
t_ ..J
i .-,
r._
! ¢v-
,or)
U') -J
!
C:)
t_
I
,..I nr'
i,,,i,,,i,,,I,,,ll''l
IIiiIM
°_i0iieiii
i
I
CD
t_
¢..J
_D
t_ --_
i ee
I
r'_
_D
I
II
..I
,I,,,I,,,I,,,I,,,I,,,I '''
IIIooI
I
% "_ % "_ % % ":,I I I I
_0AI11_7 _I13_7_0
_D
CD
t_
N...
(:3 t_
_r
t_ -Jf_
I
(:3(:D
I
FIGURE B-2 (continued)
266

Ln
g..,.
n
.=.t
% % % : % % %I I I I
30rll I II:#7 3II3U7Ug
(3
1%
I./')
t'_
I
I
U')
I
C_
(3
I
w..i
0
/,-r"i.=..i
E::
/
'l'''l'''i'''l ''l;''l'''
% % % % % %I I I I
30_I]I_7 3113_7_0
O
I
U_
i
O')
O
°,,-4,
U_ ..a(%1 er
e_
I ee
1,1")
I _-
I
O
I
OI°
f_N
|
'J'''l'''l'''l ''1'''1'''
,Ioailn..O...l'..l...t...
% ".. % "... % % "=.I I I I
30NIIIU7 3113U7_9
O(:3
u_r _ _
uw
Jl
I,_ ._I
ey
s ee
U'_ ,_I
!
I
'1'' .... I'''| ''1'''1'''
°oiI
, I , . . I , , , I . , , I, ,,1,, , I . , ,
% -_ % "_ % %I I I I
30fll I1_7 3113N7Ug
0"%
t n-
U3 -J
!
!
FIGURE B-2 (continued)
267
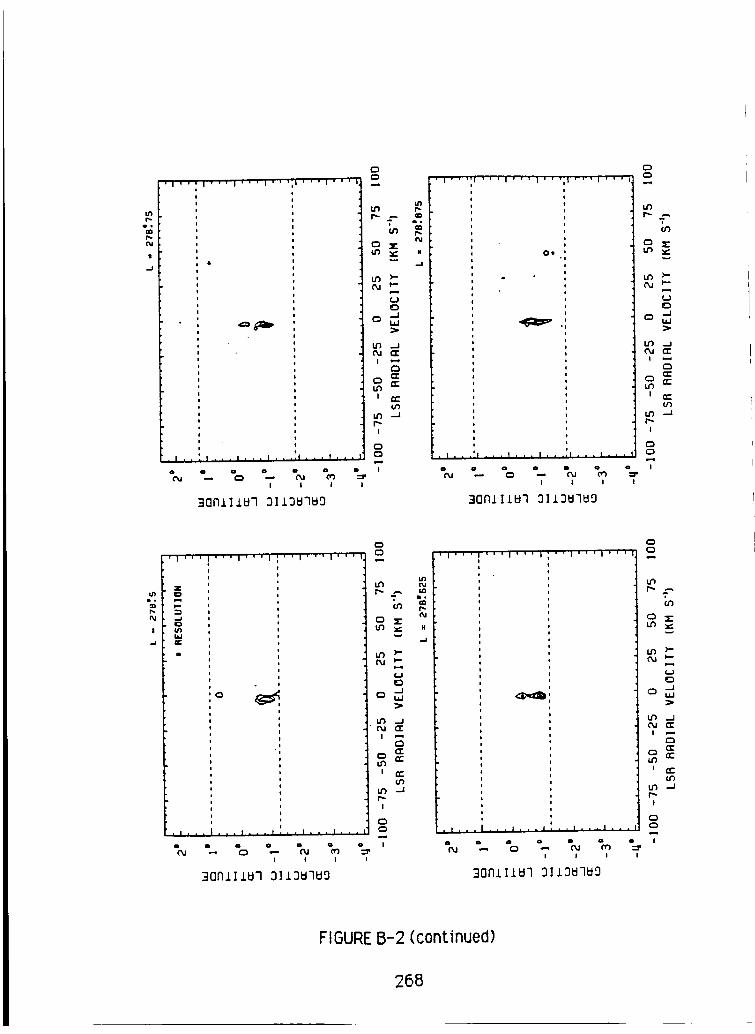
I
.J
,i , ,_ i , ,, i,,, i,, ,i, ,,i', ,,
•i,.:I,.,i,,,i,,,[a,,._,,,
% ".. % "_ % % =
30rill IW7 3113W7UO
(:)
C:)4
C_
!
I
f-..
!
C_
7_
== .
r_.
.-I
rr"
Cr_
,,--I
,i,,,il'''l'''l''';l','l',,
iIIi
iIi6i
Ot ._
• I...!I...I...I .... 1.111,,,
% "_ % "_ % % 0_I I I I
30flI11_7 3113U7B9
0
IX')
r-- ...
(/I
u') ;'-
(-_ P-
0
(_ er
C_
m-.
I OC
u_ .-I
f_
I
C:)
I
p.
I
.J
'1''' '''1'''1 ''1'''1'''
g
*l .... l,lJ,**_J*,Jl*tllfl,
% -- % -- % %I I I I
30NIIIN7 3113_7N9
C_
L_
b
I
U') ..I
r_
If) -Jp,.
!
(_
I
N
..I
Ii,,.i,,.i,,, I ..l.,,l,,r
, I ....... I • • • I • • , I • • • I i i i
% -- % "_ % % %I I I I
30AIIIU7 3113_7_9
0
r'.-?
r-_
i rr"
b_ -._
I
I
FIGURE B-2 (continued)
268

p..r_J
I
..-IQ o
% -- % -- % % 0:.I I I I
:10fll I IU7 3I 131:I7UD
CD
(3
t_
f,..
(3
U'_r_
!
i
f,,.
i
(3c)
7"
O
--I
Of:
CC
fJ_
u
,..,I
I...I...i...I...i...
lIl+
II
ll+I
_:
.I...I...I... l...l...l..+
% -- % -- % % ":.I I l I
30All 1U7 3113U7_0
(D
tA
f-,-i
U')
ED
o ,.-4,
t$) ..JOU CC
C_1:2:
I¢r
U_
I/_ --J
r--i
o(D
oIo
e_f,w
I
..i
.I..+i...i...i...
+_.
i
...i..°i
,I, tl J I I ,llllld
% -- % -- % % %.I I I I
]0NIIIU7 3]13U7U9
(D
O
It)
(D
It)
I
.q!
t_I'-
I
(3
CD
I
..J
o
O
,.Jrr
Cl
ec(n
'I''"I'''I'''I''' '''I'''
.l...l|...l...l...i...ll+l
% "... % -- % % "=.I I I I
]0AIIIU7 3113U7_0
I C)
t,C)
T
(jr)
fw..)
_D
(:3 .--I
U') _j
('_ CE
r_
(2:
i ,'I"
0r}
I._ --/
p..
I
(:3
(D
I
FIGUREB-2 (continued)
269
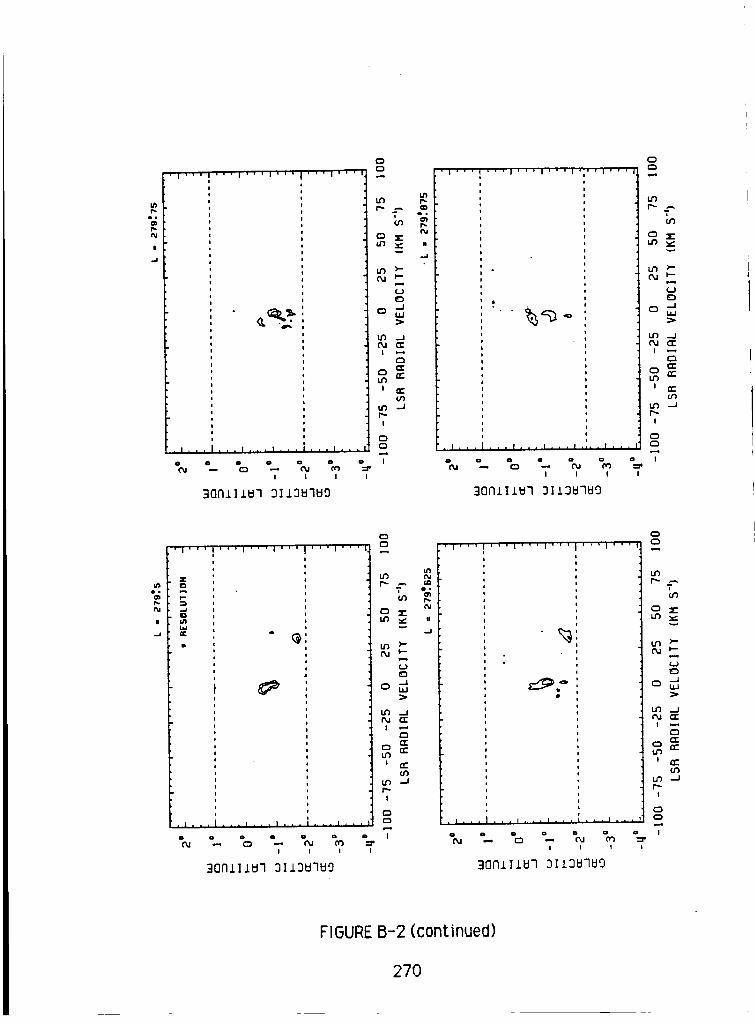
p-i,
I
,j,D,jv,'_j,,,j,,, ,,,|,,,
.i...l...t...T...i...i...
% _ % "_ % %I I I
30171111:170I 13_7_O
O
I
I
r_
i
OQ
TI
0
,,-I
er
.,J
.l...l...l...l...l..,rllll I
% % % % % %I I I I
30Nl11_7 3113B7U9
If)
6
°,:4,
U'_ --J
I
O
Q
I
I
'I''' l ,,,i , , , i,, , i, ,,i, , ,
i
ili
.,...l...,..._...i..,l,,,
% "_ % ".. % % %.I I I I
30fllllU7 _113U7_0
L
b_
w
6_ ,--I
,,-r
I rr
f_
!
t_
T
.J
'I'''I'''I'''I''' '''I'''
• I ...... I . . , I , , . I,,, I , . .
I I I I
30_I 11_7 3113_7Ug
t
If) _I
rr
I ,,.?,
b_ ,.-I
!
C_
I
FIGURE B-2 (continued)
270
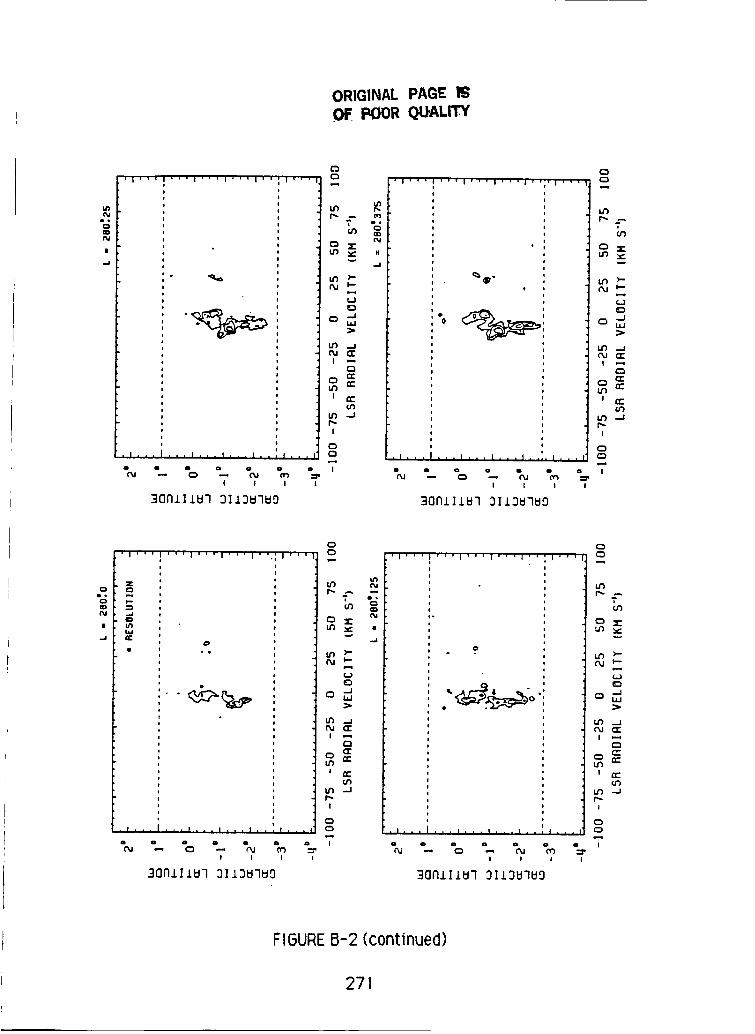
ORIGINAL PAGE 16
POORQUALITY
In
i,
¢o
i
-i
'l'''l'''l''' I''' I'';1'''
I ...... I * • , I , , , I , , , I , , ,
% "_ % "_ % % %,! I I I
30NIII_7 9I 131::17_D
wJ
E_
g') .j
C_
O
L_ ,-J
I
0(_
t
']'''|'''l'''l'''i'';'l''
i
_'_°
t
,I...[,,,I,,,I...I,,j,J.,,
% ".. % "_ % %I ! I I
30AII1_7 3113_7_0
U')
i
x.-
o ,.-4,
I._ _J
rr
0 n-
O')
t_ .--i
r"-
I
CDC_
7"
e=,i.o
i
.,,i
'I''' I'''l'''l'''l''.;l'''
0
,f,,,I ,,,i.,,I,,,|, ill,, , j
% -- % "..., % % "=.I I I I
30All lt_7 3113U7_9
I. (_
(%1
w
(%1 rr
(/1
g') ..Jr_
I
C_
I
,i, , , i ,, , i , , , i, , ,i , ,
!ii|iiI
io
o 0
i,,i
,I,,,I ,,, I , , . I , , ,I,, ,1,, I
% "..., % "_., % % %.I I I !
3OAt 1lt_7 3113U7U9
I CD
ti_
r'.- .-.|
ct_
w
E)
o,.-4
t_ .--I
ry el:I ,--,
C:l
C=
t e,-
(.f)
t_
p,.
I
(3C_
I
FIGURE B-2 (continued)
271

6°
I
11,'' IVll
C_
I
r..
(%1I
!
t_f_
!
c_c_
i
w
(.3,
o
.-i
(:2:M
r_
-J
'l''II'''l'''l'''i'''l_'''
0
Pi 0
.l...Ii,,l,,i|i,,l.,,l,,
% ".. % ".. % %I I I
30rill lU7 3113U7_0
Q
I"- .-.lu')
r_j
(:3 "_
fr
I nr"
r'--
i
C3
7"I
u_
%
I
,-I
, | i , , ' ' ' I ' ' ' I ' '-' I ' ';' I ' ' '
Q
i.
, i, , , [ i.. I., ,I,,,I .... I . .
% ".. % ".. % %! ! !
30f7111_7 31131_7Ug
o
E_
o,-4,
rr
I ,,,r-
t_ ._I
!
f_
-=.,I
00
",4n
....I
'l'''l'''l'''i''II''ii
i
titI|
,I ...... l,i,ILi .I,,,I,,,
% - % "_ % % "=,I I I I
30fllII_7 3113_7W9
(3
O
Or)
¢.J
U'_ .J
r_ rr
r7
i rr"
U'_ -.J
r_
!
0
!
FIGURE B-2 (continued)
272

IX)
ii.
¢ci
II
,...4
' I ' ' ' i, ,,i*,,i ,,. i, ,, i_,, ,
.l..,l.., t..,l,,,l, ,, f ....
% o... % t... % % o=,,I I I I
30AIIIU7 3113U7_0
0
0
I
!
U_
I
(:3
I
,-I
I0
,.-4,
M
n"
.,,/
'l+''l,.,l,,,l,,,l,,,ll
IooiI!+
.1...I
%
,, , I... I, ..l , , ,I,,, ,t
".. % % % %I I I I
30NlI 1_7 3113_7U9
iU')
.,,?,
Q ._1b6/
b_ --J
O er"
br) ,--Im,_
!
(:31:3
!
olo
i
..i
'I'''I'''I'''I'''I'''I_'''
%
• o
, . . l . . , I . . . I . , . i ....
-_ % "_. % % %I I l I
3017111_7 3113_7U9
Q
B
¢.J
-J
r_
-.J
I
!
'I''' '''l'''l'''l'''l_''
. , , I . , , I,.. I . , . Ill i i
I I I l
30NI 11_7 3113U7UO
0
' I C=,
Lt_
r......
(3")
O
r',
u r_-
U')
l._ .--I
I
(:3
I
FIGURE B-2 (continued)
273
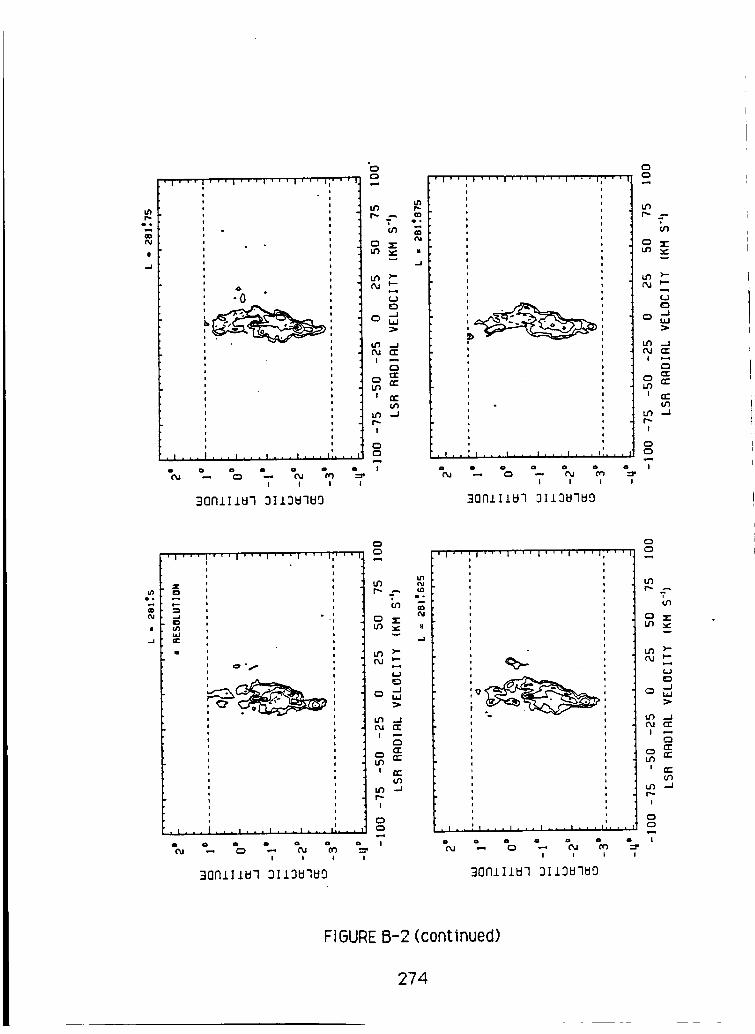
ol
t_
o
.J
,I,,,I,,,I,,Vl,,,l,,,i;,,,
4S
.i ...I... i...i .,,i, ,_ i ....
% "_ % 0_.. % % %,I I I I
3on1] 1_17 3113_7u9
"o
t_m
f_
C_
U')
I
I
r_
!
t_
!
w
U
rr
n"
' I ' ' ' I ' ' ' I ' ' ' I 1 ' ' I ' ' ' 1; ' ' ,
. I. • °.l . , .I, . , I* . .I , , ,!,, , ,
% "_ % 0_ % % %,.I I ! I
30F1111_7 3113U7_O
I M
T
U'J
I._ .--J
I nr"
U9 ---_
I
C_
I
U_e.
I
-I
i|,,,
n,-
'''1'' '1 '''1' '' If' ''
{p, ",_
% 0... % "_, % % 0=,,I I I I
30Nli IU7 3113U7U9
r_
i¢r)
rr
r_
I
t_
I
m.
co
H
..I
'1'''1'''t'''1'''1'''];'''
% ".., % 0._, % % %.I I I I
3onl 111d7 3113U7N9
L_
T
It) .--1
¢_1 rr-
m .--If_
I
t
FIGURE B-2 (continued)
274

u'J
II
-I
'l'"'l'''l'''l'''i'''l;',
oii
iiii1i
I
,l,.!.l...l,,.l,,.l.,lli,,
% "... % "._ % % "=,.I I I I
3QAIII_7 _II3U7UO
C)
I
I/3
I
I
t_
I
C3
I
w..I
310
.-I
CI:
_I
'I''"I'''I'''I'''I'''I
• I..'.1 ,, ,I... I. , .|, , ,I...
% "._. % ".... % % "=,,I I I I
3OAf IIU7 3113_7_0
C3
,O0
w
3O
m n-
oo
Lt_ .-I
I
C3C3
T
0o°t_
#,I
,l,,,l,,01,,,l,,,l,,,l_,,
=..
¢=
nr-
. I .
%
4,
0 .Q_
",_, % ",_. % % %.I I I I
30AIIIU7 3II3t_7tJ9
r_
iiw
¢.J
0
¢_ rr
r'a
I r?
oO
If) -J
p_
I
I
,l,,,,l,,,l,,,l,,,l,,,li,,
o
% ",-. % ",.. % % %.I I I I
30All1_7 3113_7U0
C3
I. (:3
b_
I_-
b'3
c.J
U') .-I
'3
rr-
It)
f_
!
C3
(3
I
FIGUREB-2 (continued)
275

U_
gD
.,.I
IP,_t
|o
, I . . . I . , . I . . , f , . . 1 .... I . . .
% "_. % ".... % % %I I I I
3017111_7 3113_171:19
C:)
U')
f.,.
I
!
U')
!
O
_a
..I
n"
...I
,I,,,I,,,I,,,I,,DI,,, I,w,[
% "_. % *_. % % %.I I I I
30N1]1_7 3[13U7U9
tt_
a
C)
U_ .--I
(%1 (:K
tA ,-/
I
C_
7"
,1,,,i,,,i.,,i,,, |,,,|I,Tii
Z
C
0
% ".. % *... % %I I I
3017111U7 3I 13U7UO
w
U') --I
f_
!
!
!
II
'i'''l'''l'''l'''l'''_U'''
% ".. % ".-, % % =I I I I
30AIIIU7 3[13U7_9
w
U'I ,--I(%1 _"
I t,-
g_
U_ ,--If_
I
C_
"7
FIGUREB-2 (continued)
276

tn
m
,..i
% ".. % "_ % % %I I I I
3QAIIl_l 3113_3HD
0
U')
r'-
0
i
i
i
C}
!
w.,4
o
,..i
C:)
/=
11,,,l,,,l',,,l,,,l,_,l,r,
o
• • _ °"
% 0_ % % % % "_I I I !
30fill 1_7 3113_7_0
C3
J03
0
bO ._
I n-
f_
I
C3C3
I
o
I
f
ZC3
_Jn_
• t
, I , , . I , , . I , , , I , . , I .... I , , ,
% _ % -_ % % %I I I l
30AIII_7 3113U7UD
0
C3
w
14") .J
U3 .J
I
I
,ll,,,I,,,l,,,l,,,|..,,l,,,
% "_ % -_ % % "_I I I I
NiC_
..J
e_
J _
I
!
FIGURE B-2 (continued)
277

U')r.,.
-,i
,l,,.I,''l'''i'''l,';.I.''
._) "8
% "_ % ".... % % "=,I I I I
C)
!
I
I
C>
!
..J
M
_J
0
,.-4,
(Z
o')
--l
.I,',,i,,,l_,,i,,,i
_"
i1,|,,,
% "._. % ".... % % %.I I I !
30NIZ1_7 3[13_7_9
]
U')
0
°,.-4,
(%1 _r
I
!
|
..J
i,, , , ,,, ,,i , l,,'1 I' I I I I ';'i'
i
_o_J
O,
- .
.| .llll.l...|...| .... |..i
% "... % "... % % -=,I I I !
]0_III_7 311DU7U9
fl
-J_r
.J
I
!
I
C_
!
4'|,,.i,,,i,,,l,,,1,,_,1,,,
% ".., % "..., % % -=,I I I I
_OAI II_7 _113_7_9
U_
U')
w
E)
(:_ ..I
U'_ _J
! ,..-,
r-_
* n-
U')
U'_ --J
I
C_
!
FIGURE B-2 (continued)
278

ao
.,.i
,1_,,i,,,i,,,i , ,
+it,
,o i
11 , , i I , ,
,l!:.t,,,I,..I,,,I, .,I., . I
% % % +._, % % %I I I !
3ONII I_7 3113_7_0
j
I/3
r_
o
i
i
u')I_-
i
C3
tn
w
3,-
o
3
el,-
, i ,' , _ i , , , i , , , i , ,
°
4C3'
% +_.. % % % % "=,,I I I I
30Nl11_7 3113_7_0
i
(.J
-.IC3 b.l
t--+
eT-
l er"
60
U3 .--I
I
C3
!
io
I
'l'''I'''l'''l'''
y
aP
..,i,11
. i . . i , . . i ...i,.. i... i,,.
% "._ % ".., % % "=I I { I
9ONIIl_7 3113U7U9
(3
I 63
IIw
°d
U3 ,--I
I ,.-,
l a,"
tn
U3 ._l
I
C3
!
,i_ ,,i ,,,l. ,, i , ,
0
i,,+|,,,
.l!..l,,.;,,.l,..l,,,l+.,l
% % % t.. % % +=,,
90NIIiU7 3113U7_0
_3
o_
I._ _,1
C_I t'l"
t"r
_,.,-i re'
,,.-I
I
I
FIGURE B-2 (continued)
279

knr_
-#
I
._J
'i'''l'''l'''l
.t .,.I ... t...t .... l..,t,..
% "--. "(::) "..., % % 7=.i I l I
30_7111_7 311_7_9
O
IU_
O
>
O_I CC
U'_ -./f_
!
O
(D
i
a,
H
% 0.. % ".... % % "=,l I I I
30NI 11U7 3113tJ7U9
i
w
e__l
i .-,
! Jr-
U'_ --1p,.
!
!
I
-I
'I'''I'''I'''I''
-m
|,,,|_,,
. I . i I I . i kl i i i ] i i . I
I I I I
]00111_7 3113UTU9
II
w
.,.J
m
f_
I
I
,i,,,i,,_i, ,, i,,|m
s
I
i
o,i
%
,..i,..I,,,I,,,I,,,
% % % %i I I
30AI11_7 3113U769
CD
CD
U_
w
o--J
_D tU
>
6") __
CU _:
C3C[
I erif')
I
!
I
FIGURE B-2 (continued)
280

ORIGINAL PAGE 16
OF POOR QUALITY
t.__J
{D
I
.,J
'I'''I'''I'''
0 ¸
'''i'''i'''
i I I !
30rllI IU7 31131:17UD
I
U'%
o
t Jr)
I
oI
U_
I_-
I
C3
T
T
O
_=
¢t)
...I
',,i,,,l,l,
.I ...... f,,.I,,,I,,,l,,,
I I I I
30NI11_7 3113U7_9
O
U_
U') .--i
¢_I CXZ
_=
I
O
e_
¢y
|
' i ' ' ' ' '' I '' ' I_'' ' I' '' I' ' '
I I I I
30_7111U7 3113_7UD
II
w
'3
f-.!
!
'l'''l'''l''' ' ' ' I ' ' 'i ' ' '
'_.,O
I ! I ;
30rll 111::1731131d7_9
Q
i_-
t n-
LO ,-J
i.,,.
I
i
FIGURE B-2 (continued)
281

I
_I
0
Q'N=°o 0,
_r(b
'''I'''I''"
,I...I.,,I...;...t...I,..I
% "... % "_. % % "=.I I l I
30NII IU7 3I 131_7_0
C_
i CD
tt_
c_
U_
I
I
U_
f-.
I
CD
CD
I
7
== ,,w
.J
o
>
..Jc_
_c
U_
-U
'l'''l''"i''' ''+l'''i'''
+
Ib
l
ii
% % % _ % % "=.I I i I
30NI11_7 3113_7_
CD
..q
u_
U_
_D
>
u_ .__
CU C_
u_ --J
r--
I
_D
CD
T
u_
I
'J'''l'''J'''
i
i
'''l'''l'''l
i.
I,l ...... I,,,I.,,I,,,I,,,
% "., % "._ % %I I I
30nlII_7 3113_7_a
(D
CDM
U5f.,.
_D
U'_
I
I
U_
r..-
!
_DCD
I::T
!
T
w,..I
_D
-4,>
..,I
r,-
U_--.I
'l'''l'''l''' '''I'''I'''
,,_<_
,,.,,l..,,.,.i,,,,,.,,,.,_
% "_ % "_ % % "=.I ! I l
30NI 11U7 3113_7_
CD
u')
_D
>
I.D ._j
bU'_
I/_ --J
I"-
I
CD
I
FIGURE B-2 (continued)
282
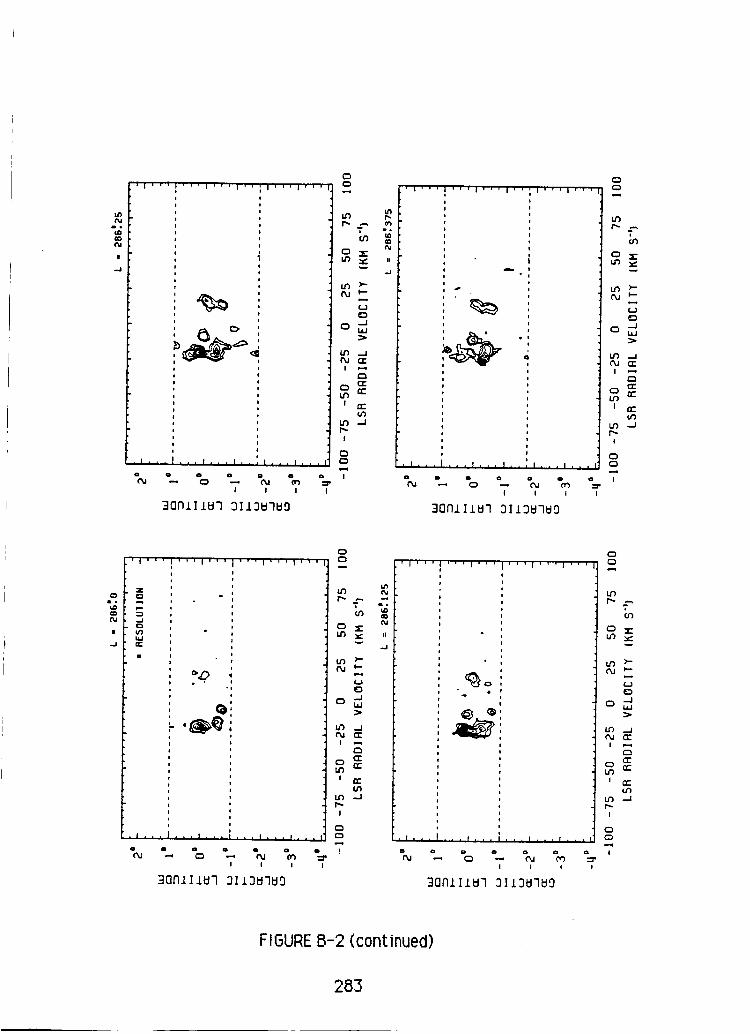
z,n_a
(,o_o
I
,l'''l','l',,i,,,i,,,i,,,i
ii
zii
! I I !
3QNJ. I .LU-] 31 .L3bl71:10
I
IJ_
I£)
I
I
IPJ
I
C)C_
I
.J
r..z
0
..J
C=
r-,
n-*
-.I
'l'''l''"l'''l'''l'''l'''I
I
IIIIiI!
,I.,,I ,, ,I,., I,,'1,.,I,,,!
I I ! I
30171 11U7 3113_7_0
t_
r_iO0
;>
r_
I n-
LD -J
r_!
O
T
OI°
I
..l
tl,,,i,,,i,,,
I
*1i
I
'''1'''1'''
,t,..I,,._...;,,._,,.I..._
% ",.-. % _ % %I I I I
3OAII IU7 3113_J7_JO
C_
l_. _
IIw
.d
l n-
L_ -J
r.-
i
C_
c_
!
'I'''I',,I''' '''l'''I'''
.1..,I,,,i,,,j,,,l...l...
I I I I
(3(:3
T
_ el-
l er"
if') ....1
I
I
FIGURE B-2 (continued)
283
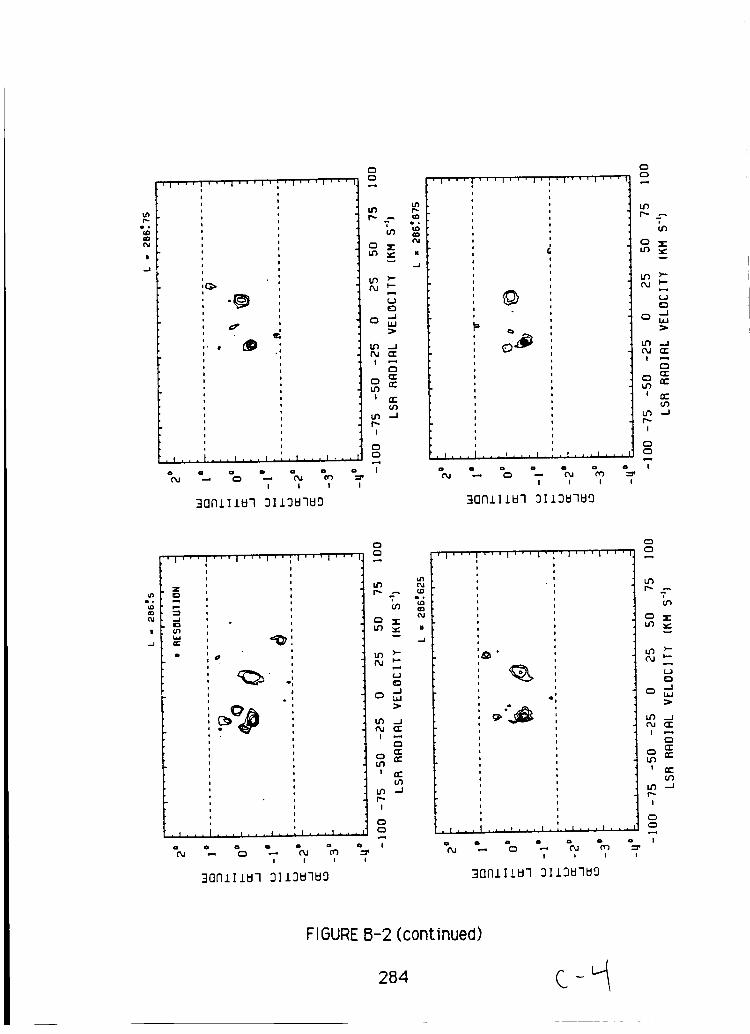
o_
|
,|'''1'''|'''1'
.@
dP '
, I , ' ' I ' ' ''1
.f.,. ,,LI...I,*,|*, .1''"
I I I I
30AIII_7 3113H7H9
0
C3
tO
I
I
U_f_
I
C3(:3
T
u
-J
U
.J
n-
-J
'1'''|'''1'''1'_'1'''1'''/
aII
III*II
% o._ % ... % % =I I ! I
30171 1 1H7 31 13H7HO
0
0%
LO ._
! P-4c_
! r,-
LO -Jp-
I
Q
(:3
I
I
,.J
' I '' ' I ''' I ' ' ' I ''
-%
I 0
I' ''1'''1
% "_ % "_ % %I I I
30rli I lld7 31131:171d9
I
O
Q
p.
LD
I
I
I
I
==
-.IG:
or_
u
' I' '' I '' ' I* ' ' 1'
, I , , ,
%
,l,,11,,,
QI
. . . I . . . I h . . t • * . I • • .
- % "_ % % =I I I I
30AIIIU7 31 1DI:17_9
O
?
Or)
o_
bO .__
r_r
_O
I
!
FIGURE B-2 (continued)
284

U_f_
m,_a
|
.J
' I ' ' ,i,,,i,,,i,,,i,,,i,.,
iiiiii
ii
i
J
o'_o
• I . • I • • • I , , , I . , , I , , . I , . .
% -.. % -.. % % -=,I I I I
30AI I II:17 3113_I7UD
0C)
I
U';
o
U')
I
I
It)
I
C3
0
I
== ,w
.J
..I(Z
Ul
/
' I ' ' ,i,,,i,., i.,,I,,,i,,,
i6!i
iiiiiiii
i°
i!i q0
,I..'1.,, I,., t,..I,,.I,,,
% -_ % -.. % % -=,I I I I
3OAII 1U7 3113_7U9
C3
U')
m
O0
IJ
u_ .-J
0 e_-
go
u3 -J
r_
i
c3
(:3
i
o
|
' I ' ' ' I ' '' I '' ' I ''
M
• I . .
%
.o (i:_
I ' ' ' I I I
I ,,,I,.,I.,,i, ,.I.,,
- % . % %I I I
30NIIIU7 3I 131:17N9
0
I _, _
IIw
...I
0
_d
Ul ..J
0
I
0
I
I
, [ , , Jl'''i''' |'''1'''1'''
iii
iIiiI0
"1
d
6
o
.I, , i ! , ! I I I
% % % "_ % % %I I I I
30AIIIU7 3113_7U9
0
b_
l_- ..i
_0
0
p..I
I
FIGURE B-2 (continued)
285

r'-
I
''i'''l'''
% 0.. % "._ % % "=.I I I I
3GNIII_7 3113U7_0
O
f_
U_
t_I
I
f_!
O
O
T
w
_J
O
rr
' I ' ' ' I ' ' ' I ' ' ' I '
0
" Do_
''1'''1'''
,I,,,I,,,I,,,I .... I...I...
% ".. % ".. % % %I I I I
30NIIIU7 3113_7U9
6
°,.-4,
Lt_(-_ rr
p.
I
O
T
0__J
l
.J
I'1'''1'''1'''1;''1'''1'''1
i
!
,..8>
,li,:l...i...l*..I...I...
% "_. % "._. % % "=.! I I I
30nlII_7 3113_7_9
O
p-
O
b
,,-4,
..J
m-
S
ar
,_J
I
I
p-
I
!
eO
il
.J
.i,,,l,.,l, _'
D
. I • ,
%
''I'''I'''
=... % "._. % % %I I I I
30NlII_7 3113_7_0
O
P- ._
it') --J¢_ rr
rr
i rt-
r_
I
I
FIGURE B-2 (continued)
286

I,D
.,.J
ifiill,.,l,,,l .... I,.L|,,.I
% "_, % "... % % %I I I I
30NIII+7 3113+7_D
C_
i
it)
V_,
o ,.-4,
U') .-I
OJ rr
r_
I n,-
I",-
I
C_
II
,.I
'I'''I'''I'''I'
o+ "0
0
0
''I'''I'''
, I , . , I ,,.I. ,, I,,..l , .,t , , ,
% ".. % 0... % % %I I I I
30Nli 1U7 3113_7_9
i
)....
0
Q -.IW
p-
I
!
0
%
|
, i , + , i , ,, i .... p ,
Zt_
++.I,Ll
II
''I'''I'''
o I
_>o
,e
, I , . . I, ,. I ,, , I ,,, , I, ,, I, , ,
% ",.. % ",,_. % % %1 i I #
30FllI IU7 3113U7_0
I (_
w_J
U') .__
f_ rr
t_ --J
r"-
I
0
I
'I'''I'''I'''I' ,,i,,,i,+,
*1'' II ill I''' I .... I + , , I , • ,
% ".- % ",.., % "t,.,., %I I ! I
30CII 11_7 3113_171d0
p,.,
O0
°,.-4,
b') .-I
(,#)
UO .,-Ir _
I
C_
I
FIGURE B-2 (continued)
287

p..
nFl
|
-I
'l'"''l'''i'''l
l
s
lI
I.I
¢
l I
,,,|,,,|,,,
_1. .91 li|lll I • I I
% "_ % "_, % % "=,I I I I
30AIIIU7 3113U7_0
0
U')
I
I
U_
I
C)
C:)
I
w--I
0
n-
e-,
GC
--J
, i , . , i ,, . i ,., i , , i , _ , i , , ,
i
.t
|¢s
l
' ._"..i
i 6
,
i
i*' _ 4b*',
|i,
,ii
.,
I|
I , . , I , . , I • • , I . . I • • i [ i i I
% "._ % "_, % % "=,I I I I
30AI 11U7 3113_7U9
I
If)
T
W
Lt%
C_
C_
U')
b_ -J
I
C_
"7
6_Ib-
f'd
|
--I
''l ' ' ' I ' ' ' I ' ' ' Ii
ZI0
0
IT.
• .",%
'''i'''i'''l
% ".. % "_ % % "=.I I I I
30fl_11_7 311_7_9
U')
m
0
U') ...I
O_ rr
U_ -.J
I
_m
I
i
i
# ,
-J
i,i
I' ' 'I '' ' I' '' I
,i! •
t
'''I'''I'''
11 I I, I., I I
% ".. % _ % % %i ! i I
30_IIIU7 3113_7_9
c_
b'%
'7
(£)
,-,iuJ
* 0c
u%
u% --_
i
c_
i
FIGUREB-2 (continued)
288

u')(%1
m,J
,p,,,i,,,i,,,l_.,i,,,i ,,,
% ".., % ".... % % %.I I I I
3QNl11_7 3113_7U9
C3I
UO
O
U')
tXII
I
b3
I
C3(:3
7"
E3
cA
iI'llll,.,I..,I..,;I...I,..
% ".... % "._ % % "=,I I I I
30NLII_7 3113U7_9
¢=1
i.n
I_i¢n
f.Jo
..ii.iJ
u') ._1
¢_1 a:
u_ .-_
i
c_
T
gl
,I,,.i,,,i,,, I
i
' ' I' '' I' ''
% "_, % "_, % % %,I I I I
3017111_7 3113_7_g
C3
u
(:3
I
i
'I" ' 'I '' ' I' '' ''I '' 'i'' '
, II, , , I ,,,l,,,l,,,l,.,l.,,
% "... % "..., % % "=.I I I I
301711 lt_7 3113_Md0
U'I
I'_
it')
c_
U'; ,--Ieu _"
CA
U_ .--I
f_I
C3
¢3
i
FIGUREB-2 (continued)
289

inr-
I
-i
o
% "...% "_ % % %,I I I I
30nlI 1_7 3113_7_9
0
w
0
I
I
t_I
I
w
.J
C_
_2
¢.n
,l,,,l,.,l,i,l,,
• I...I.,.I...I,.lliiilil i
% "_ % "_ % % "=,I I I I
30nl11U7 3113_7_0
,,.-,,
I.£1
I"" .-,4
i¢i
I ,--*
I.£1 --I
r',-
!
I
_>
i
'I .... I'''I'''I '''|!
-m¢,
|,,,|,,,
6 .i
o •
o
% "_ % % % % "_I I I I
30R111_7 3113_7_9
Q
w
C0
rm
I
I
N
,.J
' I"''1 '' '1' '' I' ''1' ''1 '''
o
i
[I Ii , i . i i . I . . . II .... I • . , I • • •
% % % "..., % %! I I
_Or)J.] 1_7 31131:t7t_9
I''- --,-,
w
,£) >,,-¢%.1 I,.,-
C.l
..,.1l,i.l
I.£1 .,..i
I ,,,-,
,-m
i./'l .,,,.I
I
C,
I
#
FIGURE B-2 (continued)
290

I%i
{M
|
..I
'l'''l'_'i'''l'''_l,''l'''
0 *
i.
i I , i • I , , , I , , , I .... I • , , I . , *
% -_ % ; % % %I I I I
30r111 II:17 311DW7W9
I
f...
0
U'i
I
I
It)
!
I
-- I,
,,J
-J
n"
,,,J
,I.,,i,,.1_,_1.,,
i t>
0o
II
t,.,i,+
,I. , , I , , . I + , , I .... I , , , I , ,,
% -.. % -.. % % =.I I I I
30171111:17 31131:171:i0
C_
I_
U
o,,-4,
i_l C£
i li:
I
C_¢:)
I
0
Q)
I
Jl
'l'''l'''l'''i'''
=..
Is
I. I . + ,
%
i,,,1+,1
,,,I...I..,l|,,,I..,
-_ % % % % %I l I I
30NIII_7 3113U7_9
II
w
(...i
0
i_ i:Z
i {Z:
u") .-i
I"'-,
I
Q
0
i
'I' '' '' ' I ' ' ' I' .... ' I ' '
1.
r0
Q
t o Q
% -_ % % % % =.I I ! I
30171111:17 31131:171:19
C:i
U_
L_ .--i
C_I CI:
i n-
I._ .-I
I
I
FIGURE B-2 (continued)
291

U_
¢D_J
|
-/
b 8"
0
.... I .!,, t , , , i • • I , , , I , , • I
% ._. % o._ % %I ! I
30Ali IU7 3113t_7UO
' I
r _ _
w_i
o
u'_ .-J
o
I a.-
14-
i
. TI
,|,,, ' ' ' ! ' ' ' I ' ' ' I '_' ' t ':' '
9m,,J_ *i
i
% o._ % _ % %I ! I
30fill 1U7 3113U7U9
I --
U
0
OJ
rr
i at"
I
o. C)
I=P
I
oa_fy
I
.J
' I'' ' I '' ' I''' I '' ' ' '' I' ' 'I
i
.%.
I Iiii
,I . . , ] ,,. I *., I ,, ,,J. *- I* * •
% o_. % o._. % %I I I I
30NIl ItS7 3113_7t_9
0
o
I
I
p-
I
C_
I
0
--I
a_
' I'''l ''',''' I'' ':l' ' 'l',':' J
• ¢>
t o
l'
% o_. % . % %I I I I
30NIIIU7 3113_7_9
I--
I a'-
U') .--Jp..
I
i
FIGUREB-2 (continued)
292

a,
.J
, i , , , i , , , i , , , i , _ , i ,a. , i ,,,
. I ...... I • , , I . , , I .... I .I..
% -- % 0.. % %I I I
]GNIII_7 3113_7U9
0
I n-
I
I
!
-- lie0
II
'1'''1'''1'''1'''1'_''1''
• I ...... I... I • . • I .,. a | , i ,
% ... % o_ % %I I I I
30N111U7 3113_7_9
C_
C_
0
I
C:)C_
I
o.
|
.,J
,i,,+
ii
+,,,I'''I'''I'''I , I'"
t
_ q
"o _
._,
"Q
I I l I I I °I' ' ' ............... r
% -- % __ % %I I I
]OnlI1_7 31131:17U0
0
+
II
w
C...I
0
o ,,-4,
It') --I
'S
If) ,._f....
I
I
I
'1'''1'''1'''1'''1 , I'"'i
q i0
• _
, I • • • I , . • I • • • I . . . I " + I .l: +
I I I I
30nlIIU7 3113_71_9
T
NI
e'r
tt_ .-1
!
!
FIGURE8-2 (continued)
293

t--iPi
t_
I
..a
,.,,
Q
, I ...... I , . . I , . . I .... I. , • I
% ".. % "_ % % "=,I I t I
3OAIIIU7 3113U7U9
0
j CD
tt_
U
E)
I et-
t_ .4p-
I
C_
I
u
,J, , ,| ,,,i. ,, |, , ,l ,;_ ,i ,, ,
, I , , . I . , , I , , . I . . . I .... I . . .
% ".. % ".. % % "=,I I I I
30NI 11U7 3113_7U9
CD
j CD
t_
i
0")
t_ _J
czi
! re"
l._ .4
p.
I
I
|
'l'''l'''l'''l'''l'_''l'''l
=.,
o E_ _"
"_ % "_ % % %I l I I
30r7111_7 3113U7UO
N
r_.
c_
u')
i
!
i_-
!
i
T
..J
l.
II
'l''']'''l'''l'''l' ''1'''
,l,,,l ,.,I. ,, l,, ,l " ,I, . ,I
% ".., % "_ % % "=,I I I I
30nlllU7 3113U7UO
E_
If) .4
¢_ (3:I
I
I
FIGURE B-2 (continued)
294

u')
or)
I
,,_J
' ' ' I ' ' ' i ' ' ' I ' ' ' i ' ' '
,, o-o
o
o
q
,I ...... I,. ,f,. ,l, .. I,, .I
% ".. % "_ % %I I I I
301711 It:f7 31131:17t:10
C_
I
b_
p-
{:3
b_
OO
!
I
f_
I
C_
!
f_
w.J
..J
r_
a-
..J
'l'''l'''l'''l'''l'''i'''
_T
q
,I ...... I, ,, I, • .l,. ,I , .,
% "...% 0.. % %I I I I
3001 I1_7 3113_7_9
e
ff_ _.1
¢_1 I:Z
!
I
o
i
't:''l'''l'''I'''i'''l'''
%
• ..I ...t...t. ,.tLh I
% % "_ % %I I I
301711II:173113t:17UO
(:3
I
II
..J
c_
i rr
LO ._
f-.
I
(D
!
'I'''I'''I'''I'''I'''I'''
o
i [ ...... l " " . l ' ' " I ' " . l's | l l
% % % "_ % % %I I I I
3017111_7 3113U7UO
bo
o#
bo .j
t oror)
i
CD
i
FIGUREB-2 (continued)
295

U_f_
I
..J
,i,_,i,,,1_%,i,,.i,,,i 'r,
.l..,|..,l,..l,.,i, ,,I.,
% % % o_ % %I I I
30AI Illd7 3113U7_0
C)
0
ii_. Lr)
ii
i
'- _i• i
i
:" _iiii
|i
• i I
ii
, _,i-
it
i
' 0
.h _
i
w.J
-.J
e'r
.-,I
il..,i,,,i,,,i.,,j,_,l,.
P
I I I
]00111_3 3113_7_0
0
iiij, I./')
i, Cr_
i
$, _ "Jr
i w6i
, _>-
g 0
o_i
ii I.r) ...l
i,
6
' L/_ ..4
I
' C3
I
"d
I
...J
%
,,_j,r,l,,.i,,,I,,
_0 e
, . . I , . , t , , , I . . . t . .
- % % % %! I I
30_IIIU7 3113_7_0
C:)
O:3
6i
U_
i
6I
:._j _
i6
,. ('_ I_
, _' Ni.
, I ¢,¢,-
6 if3 _
i Ii
.6,1 _
I
u)
o,1
,|,,, '''I'''I'''I'''I''
0
% "_ % "_ _ %I I I
]0_I11_7 3113U7_0
';I C)
ii
it)6.
, i, 0")
i
6
..J(_ b.J
6, _ ..J,. ('_ C_
, el:
' ! /'i"i
i Ii
66
.,i (_
-=.,I
FIGURE B-2 (continued)
296
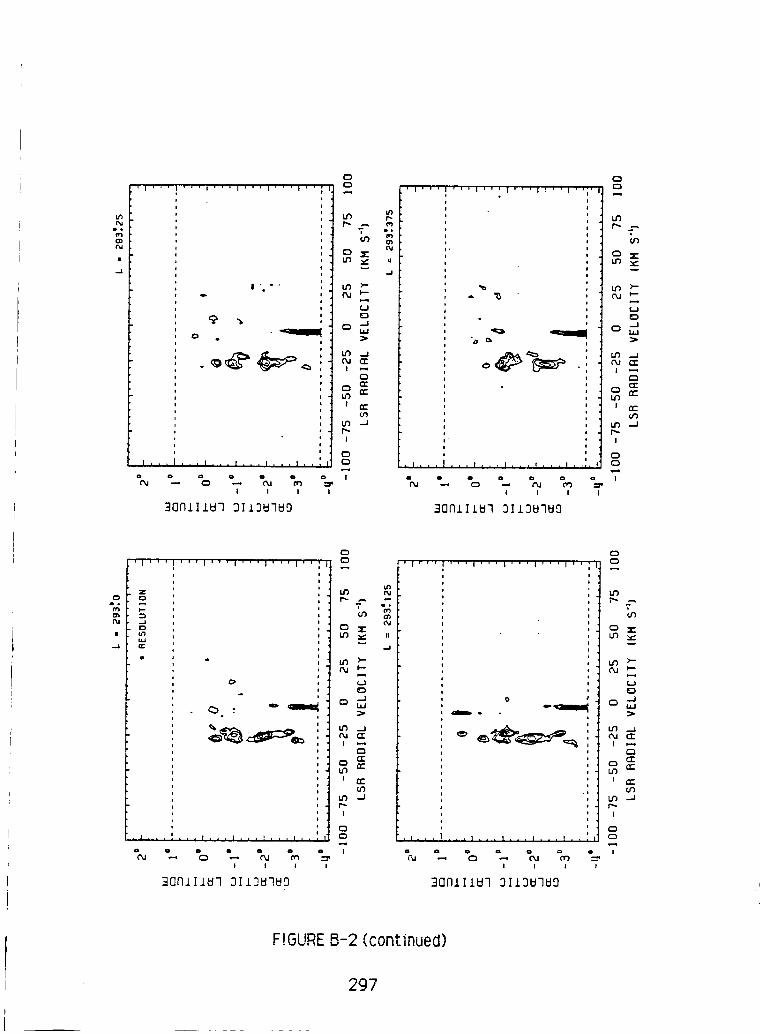
L_e_
.,4
't'''1'''1'''1'''|'''1''
I ' " "
o
0 e
,I, ,,_,..t.,,t,,,f, ,,t,.,
% o... % o... % % %I I I I
30171111_7 3113_7_9
0
0, [
U_
o
C3
U3
i
oI
I
C_C3
I
w-I
U0
_e
'l','l,,,i.,,l_,,[_,,l,. I ,
lI
Ill
I.
"0
.I...I.,.w.,,_,,,,,,,, .... f
% t. % o.. % %I I I I
30A1] lt_7 3113_7t_9
U')
T
,e"
0
.--IbJ
C_I er
I I",-
U3 .-I
I
00
I
o_o
I
'i'''l'''l'''l'''l'''i''
5
6
C_
• .,t,,. 1.,. ! , ,, I , . ,
% % "... % % %I I | I
30NI]I_7 3113N7U9
:i, c3
IIw
--I
_3
U3 --I
cr
ee
O')
p-
!
C3
I
'I''' '''l'''l'''l'''l'':
0
e
,_,,,I ,,,i.,. i,,,,, ,,_,,, I
% % % "_ % % :-I I I !
30AI 11U7 311367_9
¢D
u')
T
J _
p,,.
I
i
FIGURE, _R-'_/_(continued)
297

t_np,.
o_
i
...i
.._;__. o.i
o
0_0
- .mlP.
' ' I
. I + . . I , , , I . . . I . . . I • . . | • • •
% "_ % % % % %I I I I
30fill 21:17OI I _I::171:19
Qr-_
...+
{+
0
U'_ --i
i'%i
I er
¢t)
l.r'J .-I
I"-I
C)
C)
I
cO
II
.J
6
.0
,[,,,l,,*'l'''l*''l'''l+'L
% +.. % 0_ % %I I 1
30NIII_7 3IID_7_9
0
I "_,
Or)
¢_ (I:
oF)
f_
I
I
ol1%1
I
-I
ii
'''I'''I'''I'''I'_''I
ql
, I . , • [ , . + t , , , I , . , I . . . I ....
% o.. % ._. % %I I I i
3017111U7 DII3U7U9
Q
ii
_.I {2:
C:I
...J
I
!
11,,, ,,,l,,,l,S,l,,,l'+_+I"i
70 <'°i
, I +,, I , , + i , , , f , , , I , , , P ....
% _ % ".,-. % %I I I I
3Q17111U7 31 13U71::19
C_
0
?
U_ ..J
(Y)
b_ .=J
I
I
FIGURE B-2 (continued)
298

U5
e.:P
I
..J
0
' 'I
% o_ % % % %I I l I
30All 1U7 3lI_U7_0
(D
.-,i
I,D
(A
(,,J
O
U') -,J
(%1 CE
I .,...*
t .-
u')
U_ .-J
t"
t
O
!
' i'
It
• I ,
%
,_1_,,I,,,I,,.I,,,1_,,I.
ql "
C).,b
_.. % "_ % % "=I I I I
30AI11_7 3113U7_9
(:D
CD
Lr)
r--..-.tul
x:w
3E:J
Ul _I
OU ,-r"
l .-,,.C3
t CC
U_ ._Ip,.
!
(3C)
I
_D,Io
i
.,.i
'|'''1'''1'''1'''I'''1';''1.
PP
C>
% "._ % "_ % %I t t t
30Al11_7 3113U7_9
?
li
..J
f.J
E)
o ,,-4,>,
U') _I
CU C_
P,
(.li
UT_ -J
p.
!
(D
C=I
!
'i'''l'''l'''l'''l'''
, I .
%
. I ... I... 1, , , t .., I..,
% % % % % =,I I I I
30NI 11N7 3113_7_9
I (D
"F"U'_
w
E_
._I(D ,,,
I._ .J
I ,-'.
t C:C
LD
r'...
I
¢D
C:I
|
FIGURE B-2 (continued)
299

IJir-
Qi
i
°,
.
• I • .I...I,..li..I. • • I ....
% "_. % ".., % % "=,,I I I I
30f'11I Ii:17 31 131:171:t9
! .....
it)
I"""
¢:)
N
I
!
u'lI"',,-
I
0C)
I
w.-i
r-(-,1,
,,-4,
,,--I
rr
,,,r-
,,.,,.I
''I'''I'''I'''I'''I'''I'_''I,
.._ - .,
, I • i I , f I I , i , I ,i i
% "_ % "_ % %I I I
30C111 li:17 31131:17i:19
e(#')
io
°.-4,
i._ .-i
I "-,
V'i
U_ ..I
!
c_, I C:i
%,I
-g
|
..I
'1'''1'''1'''1'''1'''1'_''
I,,,,,
+e
,I, ,l,l,li,,l,,,l,,,l ....
% "_ % ".., % %I I I
30F11111:1731131d71:19
0
r,-
li")(%1
i
i
it)i"'..
!
C_
I
I
(%1
w.-i
,-4,
--J¢I"
it)
..J
'l'''l'''l'''l'''J'''l_'''
• I i I I t I I,_ I i
% ",. % "_ % % %I I I I
301"11111:173] 13ti71:iO
I. (_
o
o <,-4,
If) .--I
(A
If) .--iI"'-
!
C_
!
FIGUREB-2 (continued)
3OO

i,n
i
,i,,,l'''l'''t','l,,_'l'''
i I i ' |''' |''' ]''' |' I '' | ' ' I
% "_. % "... % % %.I 1 I I
3CIFIIIIU7 31138780
p-
o
!
I
I
0
7
w
Q
,.-4,
-J
t_
-J
'l'''l'''l'''|'''l''
,0t
0
_)"° o
'1'''1
% "._ % "._ % % %.I I I I
30nI11_7 311387U0
(::)
s
w
I
?
I
,l,,,t,,,U,,,i,,,i,,,i,_,,
- EZo,(_ o ,i °
t I i I I I I I I I
% "... % ,- % % %,i I | |
3OClll IU7 3113U7U9
uw
| ,re'
I
I
'l'''l'''l'''l'''l'''l'_''
It
, I , ! I I I I I
% ".. % ".. % % "_i l I f
3QAII187 3113U7U9
|
...J
iS') .--i
<'_ {_I ,,_
| e¢-
t_
!
|
FIGURE B-2 (continued)
301

r'-
cr_
I
'|'''I'''l'''l''
°t
" 4• 'qB <_
,i,''I'''
% ".... % "._ % % "::,.I I I I
30NIIIU7 3113uquo
C:)
I .-6
It)
r"
O
U_
N
I
I
U_
r-
I
I
0D
w.=L
.-J
el)
-J
'l'''l'''l'''|'''I'''I'''!
I
II
Bqp
t,,_l,,,I,,,I .... I,_.l,,,
"... % % % %I I I I
30AI11_7 3113U7U9
Q
t_
I'_|
w
I--
O
CD --Ila=l
U') ,..Jl'_ O:
C_
I¢v=
IS) --I
I
CD
I
t_e°u_
|
,_i
'l'''l'''l'''l'''i''_'l'''l,
_P
, I , e I I , , I I I
% "_ % "_ % % "=.I I I I
30NIl 1U7 3113U7U9
O
CD
t_
_=_
_D
U_
rU _r
I er
t_ .-I
I
CD
I
P,
#
-J
'I'''I'''I'''I''
Q
II
'|'''I'''
I• l , , , I , , . I , , . I , ,i, I , , , I • • •
% ".. % "_ % % "=I l I I
0
M
w
0
h_
I ¢e"
L_ .--1
!
I
FIGUREB-2 (continued)
302

ta_{%J
I
..J
,i,,ll,,,|,,,|
o
_°
,,I,.,10,,
,I,,_l...I...I..,I.._llJ,I
% "_. % "_ % % %I I I I
30fllllU7 3113U7U9
0
I
l""
Q
U')
I
I
I
{3
(:3
T
t'_
f_J
0
(/I
iI
• i
9 '
ii
<ID
J I, .
%
'' I' ' '1 ' ' '
l • • • l • • • l , . . | i , , | , , ,
% % 0._ % % %I I I I
30rII 11_17 3113_17U9
0
I_-
30
r_
bO
IS) --Ip-
I
C3(:3
7"
o°
|
..J
't'''1'''I'''1'
O=
''l'''l'''
0.o
.I..!llllll..I .... I...|,,,i
% % % "_ % % %I I I I
30nlIIU7 3113_7U9
m
w
0
=,.-4,
b_
b3 -.l
I
(:3
!
'i:'
. i , .
%
,i,_,i,,,i.,,i,,,i,,,
• • o:
• i
i
e
I , . . I , _ . I . . . I . . , I . . .
% 0.. % % 0=I I I 1
3017111U7 311_U7U9
0
r_
_0
3o
= ,,-I,
ff'l
U'_ --J
p-
!
0
!
FIGUREB-2 (continued)
303
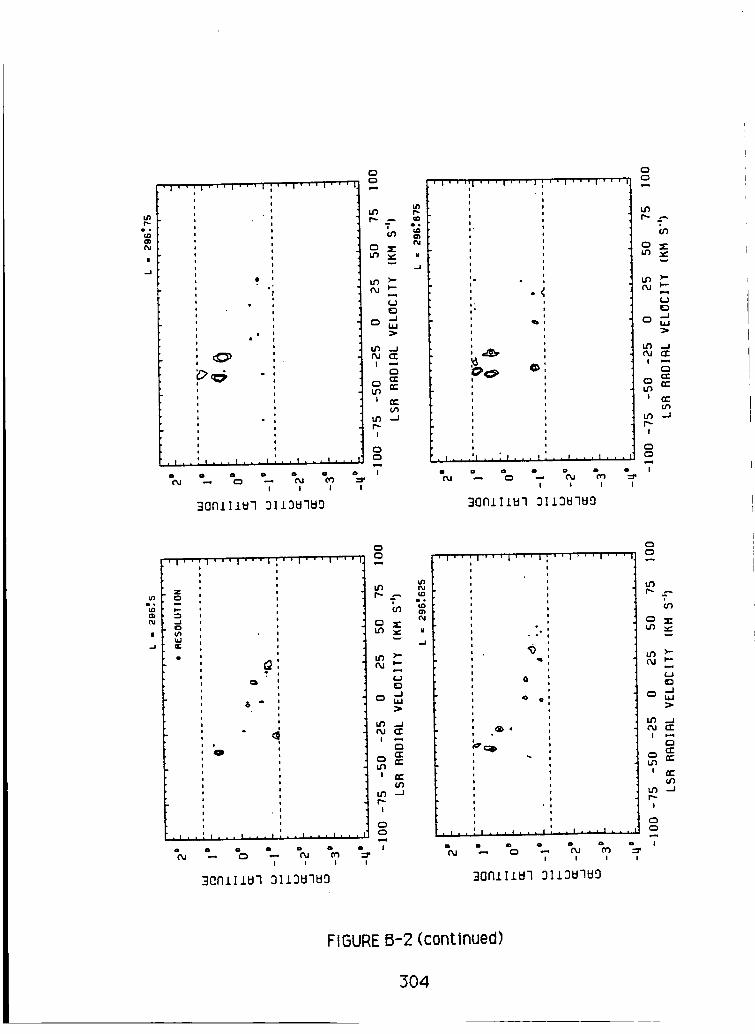
l"-
f_
|
.-i
,l,_ll..ll,,,l
|i
,11,,,i,.,
% -_ % 0_ % % %I I I I
30011i_7 3113_7_0
I
U_
_f_
I
|
U_r'-
I
I
..J
0
11
er
..J
si
o
il
i
l
''i'''l'''
,I,,,'I . , * I , , , I, ,.I,,,I.. i
% "_ % ",_ % % %I ! I I
30NIII_7 3113U7_9
i 0
u$
lo9
w
0
r_
o_
r'-
I
C_
T
o,
N
i
.=4
'l'''l'''l'''l
_P
''I'''I'''I
0
.I.. I,,,I.,,I,,,I,.,i., I
% "_ % - % % "_I I ! I
_O0111U7 3113U7_9
t_
U_
r'-
!
!
p-
!
I
.J
_J
n-
O0
..J
'i'''l'''i'''l
°°• o
0
Q
m'c:w
''I'' 'I ' '
% "_ % % % % =I I I I
30AIIIU7 3113U7_0,
e,_ o:
c_
O0
r,,-I
C_
!
FIGUREB-2 (continued)
304

U_(%1
lop.
|
.J
'I'''I'''I'''I'
odo8
'I'''I'''
% "_ % "_ % %l I l I
30ni 1It:17 31131:171:19
(3
I .=q
tt_
o
tf_N
I
o!
I
0(3
I
I%1
w,-I
El
,--I
I=
..I
,i,,,i,,,I,W,i ''1'''1'''
.l,.:l,,,I,,.l,,,l,,,l,,,l
% ".. % ".. % % "=,I I I I
30NIIIU7 3113U7_9
C)
I qD
tt_
I_-a
w
CD .--I
t_ ,--I
C_
I e,-
14") ,-I
I
I
O
I
' I ' ' ' I ''' I' ' ' ''1'''1'''
. I , ! I I I l I i
% "_ % % % % "=! ! | i
30171111::1731131:171:19
CD
u
w_i
t_ .J
C_
0 or-
or;
t_ -J
I
i
'1' ' '1 '' ' I'' ' I'
l
0 'i
i• i6
'l'''l'''
• t. II t I " I lill
I I I I
30AI11_7 3113_7_0
C3CD
U'_
r--
o(Jr)
3_D
U5 .-I
Cu (3:
o ,'c
U_
U') .._
;.,,.I
C3
I
FIGURE B-2 (continued)
305

ed
I
'I'''I''"I'''I_ 'I'
6 ,l!,_,"
i!0i
ii
D!
,I,:.'..._...'
%
is!
"..1._.I...
I I ! I
30f1111B7 3113k17k19
C_i i
o
I
!
!
c_
!
Y-
o
--I
'I'''I'''I'''I_''I'
o
'I'''!
I I I I
30fill 1_7 3113_7_9
i
i ¢¢
m',,,-
i
i
|
,i, i''l'''l'''l_'''l' '
ii!i|i
i|o
t
O "l
t
i|
0
#
. I . _ I I I. 1
I I
|!
00
|il|
S
II
i I
I I
_:_ . , .
30_111U7 3113U7U9
C3m
I _
I
I
#
Ii
'l''_l'''l'''l_''l''
iI|i
%
o
"D
'I'' 'I.
' ' I! . . . f . . . I . . , I ......
"_, % _ % % %I l I I
30fllI 1U7 3113t17UO
w
o ,.-4,
ey
c_
I
!
FIGURE B-2 (continued)
306

o_
|
-J
'1'''1'''1'''1
ii
i .
!
!it
t. _.t..,t...t
%
''t .... i'''
" , . i . I .....
"._ % _._ % % %I f ! I
3017111_7 31131:171:19
r'.-
c_
O.I
I
I
!
CD
I
fu
w
>
--I
o0
, i. , , i , , , i , , * i i , i ,l, ,_1 , ,',
• ,..:i... ,... I'...,.'..h...
% ".. % -_ % % "=I I I I
30fllII_7 31131_71:19
O
C5|,
u_r,- .-,
J
w
(-i
ED
CD -Jb_>
I/) .uOu C_
C_
G:
i A-
U_ --J
f-.
I
CD
CD
7"
CD
|
'l'''l'''_'''l;''l':'l'''
°i_).,
i
I _ I I I I l , . I * I . i i
% -_ % % % % %I I I I
3C]rll I ll:l'l 31 131:171:19
C_
IIw
..I
>
Ul .,_
_U (3:
t E:(/)
U_ -Jr--
I
C_
!
'l'''l'''l'''li
,_,,_,,._..,_':.._,'.._ ....
% -_ % "_ % % ":,I I I I
30_I]I_7 3113_7_9
t
l_NIo")
w
(,J
L,.J>
¢.o
f,..i
7"
FIGURE 8-2 (continued)
307

IJ')
l
i oo o
o |
o oo o
i si uo I
_ o J
o ::o i
Ni o
! o
_,'._. ,-'o ooo i o
! oo i
! o
! oo ¢
o |
% - % -_ % % %.I ! ! I
30171111:173113_7U0
C_
M
th
I_
o
f-.
I
C_
7"
¢w
n
.d
,U,.,U,,,U,,,i
I
• I,,_1,,,I," I,,,I, I i
% o._ % _ % % %I I I I
30fli]IU7 3113U7UO
U')
|
(ar_
0
0
lad
; w-,
C=
I ef-
U') ,.,I
{,,.
I
!
"d{%1
I
-I
'l'''l'''_''',:''u':':l'''
0
b."
Q
i
oi
14
% - % - % % -=.I I I I
_OAIII_7 3113_7U9
C:I
th
a,
tt_ ..a
erI ,,-,
O _-
U')
I
E}
I
'l'''n'''l''.'l:',l,::l,,,
o
4 _ . o
n 00 0
II' il l I I ll,,
% - % - % % %.I I I I
_O_IIIU7 3113_7_0
U'II _
?
p,-I
!
FIGUREB-2 (continued)
3O8

U_
{n(%1
|
.J
''1'''1'''' I ' ' ' t ' ' ' I ' ' ' IInn!
Jo
o,o
oii
' 11! o
'i
oi •
': 0ii
i •i
_ . °
• I i
|! ii o
i 4i i
i !i |i i
J i I I I _ i ! ! |
% % % -_ % % %I I I I
]01711 II:17 3113N71_9
o
i o
it)
I
I
I
0
I
v.J
o
m"p.q
' I ' ' ' I ' ' ' I ' ' ' I ' ' I ' ' ' I ' ' '
"_.
ioa
o is io oo !
o o
i oi !
, I , • ', I • • * I , : • I ° I !
% % % % % % "=,I I I I
3017111_7 3113U71_0
0
t 0
o')
w
L,u
.m.-
_ ,,,,-t
r,--
i
i
|
'l'''l'''l'''l
o
''1' '' I'''
% -_ % -_ % % "=I I I I
3017111U7 311D_7_ID
i
,,_I
,-, ,,-,,
("y
ft')
-J
r,,.-
i
i
:l'''l'''l''' I ''1'''1'''
ii
,iii
ii
'iai
'l
io
o .
1!
,io
o
,a
i
_ a, I . . , I . . , I . . . I , , , I , , , I , , ,
I ! l i
]Orll I II:17 3113_71:19
i (_
r',,...-,
(/'I
v
,_.i
i._ ,.j
u')
r..-
i
(_.
i
FIGURE B-2 (continued)
3O9
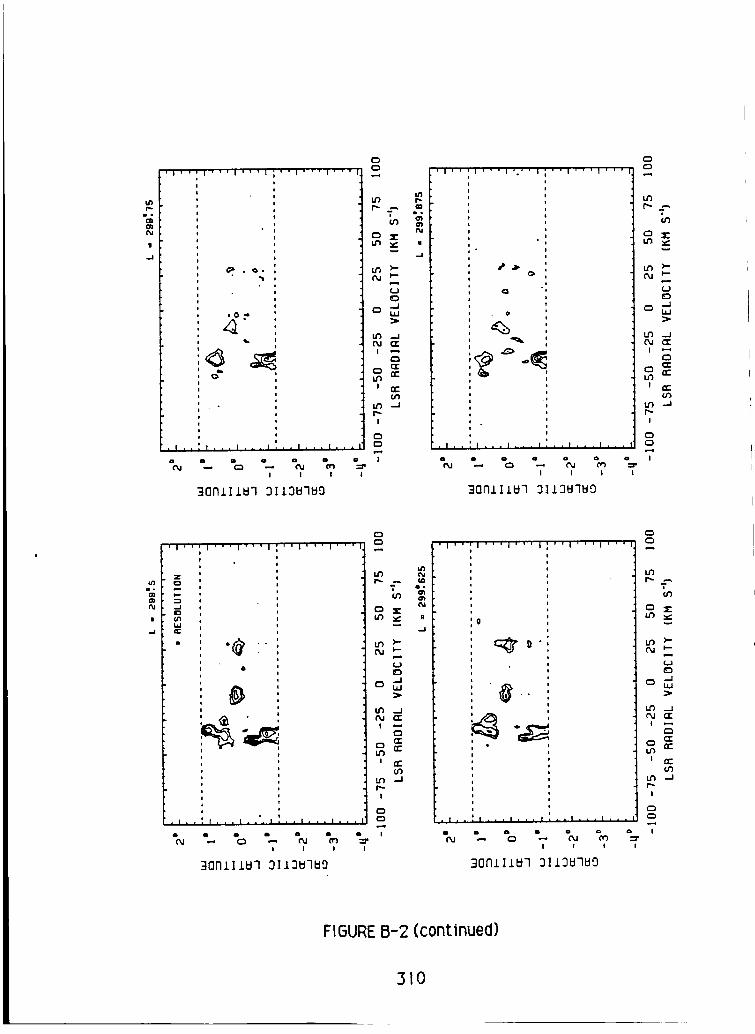
ObOa
I
,,..i
,i,,,l,,,i,,.l
° ,o.
.04
''l'''l'''
oiiia!
iiii
I.,_t.,.I,..l' I 1 I
% % % % % %I I I I
:i01711 II:i7 31131:171:19
CD
O
i.rl
_o
p=q
(_i
IO
°.-4,
i_i ¢',r
i er"
I
CDC)
7"
¢%1
II
-i
' I ' ' ' I '' ' i '.' ' i ''I'''I'''
Q
@
Ili
.i
• I,. I..,l,,.I,..l.,hl,j,
% ".. % "_ % % %I I I I
30n111_7 3113U7_0
CZI
I_-I
(_}
°.-4,
rr
"I
! ¢#-
l.rl il
i
cD
CD
I
I,
i
,_i
'l'''l'''l'''l
- o_
il
• I . .
%
''l'''i'''
iii0o
ii1o
if I •..... l,..l...i.il
"_ % "_ % % 0_I I I I
30nlllU7 31I3U7UO
e,-,,
i l:::)
i.l-)
o
!
i
r.-
I
c)
i
m
o
,,-4,
,,--Ier
,,--I
(%i
II
'I'''I'''I'''I ' 'i ' ' 'i ' ' '
• I , I I I , I , I • I
% "_ % "_ % % %I I I I
_0_1 flU7 3 ] 131:171:t0
U")
f',,......i
¢.,,i
°,,-4,
it') ,..IC,,i (:i:
_,,,-
i'.
i
I
FIGURE B-2 (continued)
310

0
o0
|
ml
,i,,,i,,.i,.,.i
5
f!m
cP"• i
''1'''1'''
# I I !
30All±U7 3113U7U9
I
I
I
0
I
¢t)
0
,,-I
rr
r-,
rr"
-J
FIGUREB-2 (continued)
311

W
p-
Ze3..J
(...)
a:.J(3:
300 o
295 o
290 o
285 o
280 °
275 a
lllIlllill lJlli]lll illiilll illtilllJlll
B • S_.Otl RESOLUTION
!
,,,I,,,I,,,I,,,I,,
-80 -60 -_0 -20
.
!
, ,,, I ,,, I, ,,I,,, I, o,
0 20 _0 60 80 I00
LSR flRDIRL VELOCITT [KM S"}
FIGURE B-3
312
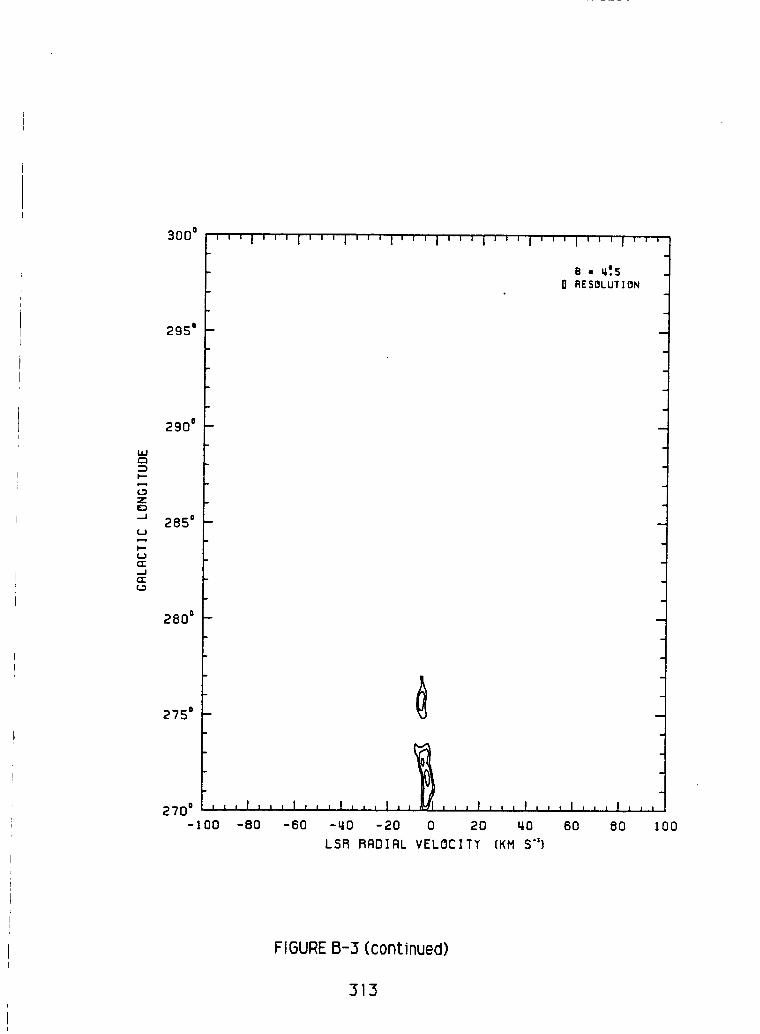
I.LIC_
I"-'-
Z0--J
in(,_CE
C_
300 o
295 o
290 o
285 o
280 _
275 °
270 o
-I00
F,,,,,,,,,,,-80 -60 -LtO -20 0
e - _'.S0 RESOLUTION
,,,I,,, I,,,I,,,I,,,
20 4O
LSR RADIAL VELOCITT (KM S")
160 80 100
FIGURE B-3 (continued)
313
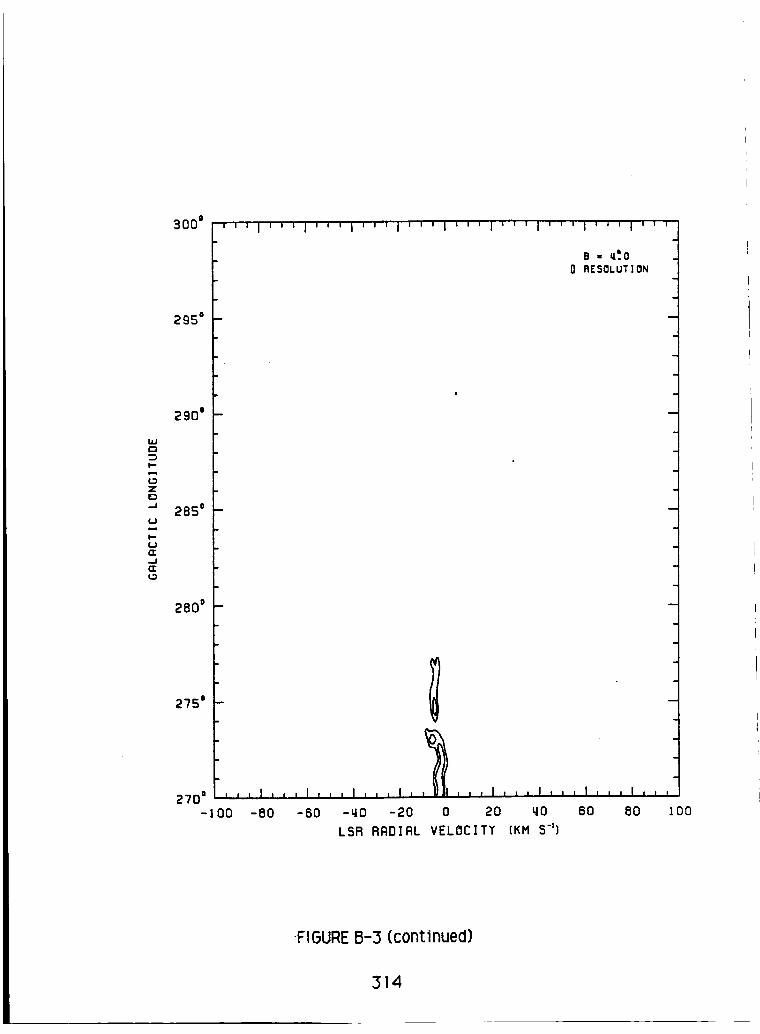
U.I
ZtD--I
(..)
,,'r-...I(Z(.0
295 o
2850
2800
275 °
B • _".0
D RESOLUTI ON
,FIGURE B-3 (continued)
314

laJ
:::3i,--
(.--3Z
,--I
C.,3
l.-
n"..Jn-
_000 lllllllllllllllllllilllllllllllllllllll
295 °
290"
285 o
280 °
275 °
270 o-100
B= 3_.S11 RESOLUTION
0
=
,,,I,,,I,,,llllll,_l,,,I,,,I,,,I,,,ll,i
-80 -80 -LtO -20 0 20 I.lO 60 80 100
LSR RADIAL VELOCITT (KM 5")
FIGURE B-3 (continued)
315

300 o
B • 30.0C) 0 R(SOLUTI ON
295 °
290 °
1,1.1
zo
285 _
p-tjcz..J
(:z:
280 °
275 °
270 o ,,, t,
-I00 -80
-0
I O
lint,,, I,,,I,,,I,,,
20 _0 60 80 100
LSR RADIAL VELOCITY (KM S")
FIGURE B-3 (continued)
316

Wr'-,
Z
-,J
C_:...Jrr'L3
300 o' ' ' I ' ' ' I '' ' I_' ' I ''' I ' ' ' I ' ' ' I' '' I '' ' I , , ,
0e . z_.s
0 RFSOLUT ] ON
295 o
290 °
-0
285o ° •e
280 °
I '275 o
270 • , , , I , i , ! , , | I , , , i , , , I I I i i i I , i , I i | | I , , ,
-I00 -80 -60 -LIO -20 0 20 LIO 60 80 I00
LSR RADIAL VELOCITY (KM $")
FISURE B-3 (continued)
317

LIJ
:DI'--
G_Z0.J
(_)
(--1
_Jrr
295 =
290 o
285 o
280 o
275 °
B - 2:0
C) 0 RESOLUT ] ON
0
270 o , ,, I , , , I , , , I , , , I , ,
-100 -80 -60 -LiD -20
0
O te
O Oo
__, , I , , , I , , , I , , , I , , ,
0 20 _O 60 80 IO0
LSR RRDIAL VELOCITY (KM S")
FIGURE B-3 (continued)
318
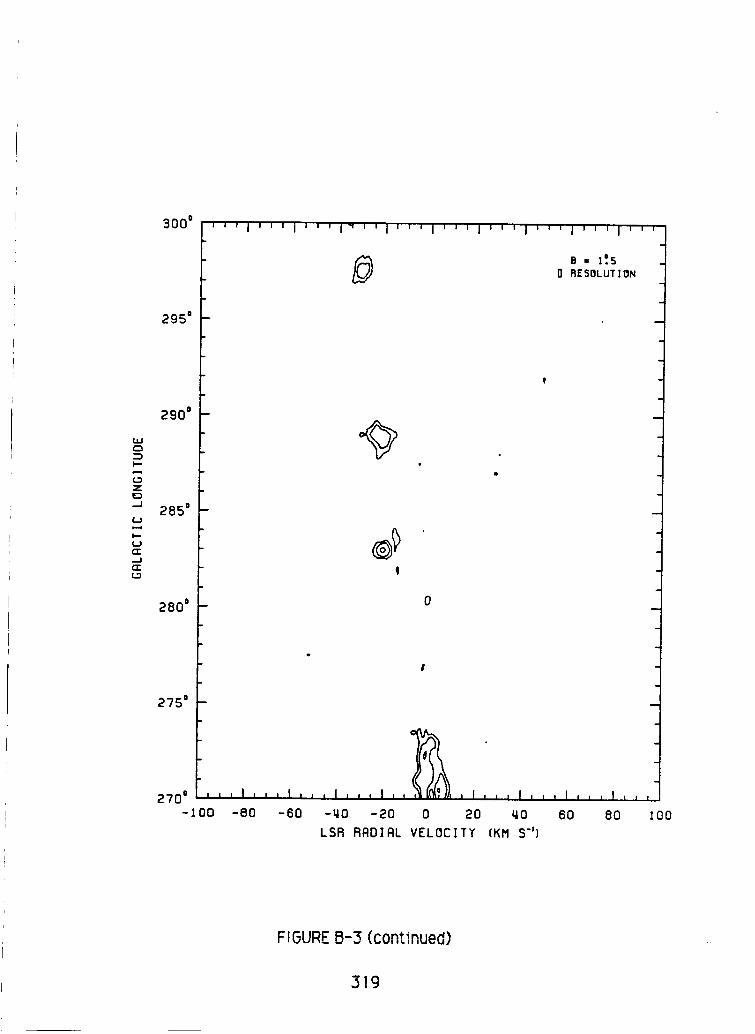
L_C_
I--
Z0.J
¢.)
Ii¢_1C_.-I
300 ° ,,
295 °
290 °
285 o
280 o
275 Q
2700 1, , , I , , , I , ,
-I00 -80 -60
B • ]a.5n RESOLUT]ON
!
0
°
-LIO -20 O 20 _0 60 80 100
LSR RADIAL VELOCITY (KM S")
FIGURE B-3 (continued)
519

I.U¢3
t,--.
Z
.J
(.J
I,,,-(.J
300 °
295 =
290 =
285"
280 =
275 Q
270 =
' ' '1 ' ' ' I' ' '_' I
'" ' I ' ' ' I ' ' ' I ' ' ' I ' ' ' I "' '111RE$OLU'r]oNB" ]:0
I
@-o
0
#
%
O0 -80 80 I00-60 -_0 -20 0 20 qO 60
LSR RAO]RL VELOCITY (KH S")
FIGURE B-3 (continued)
320
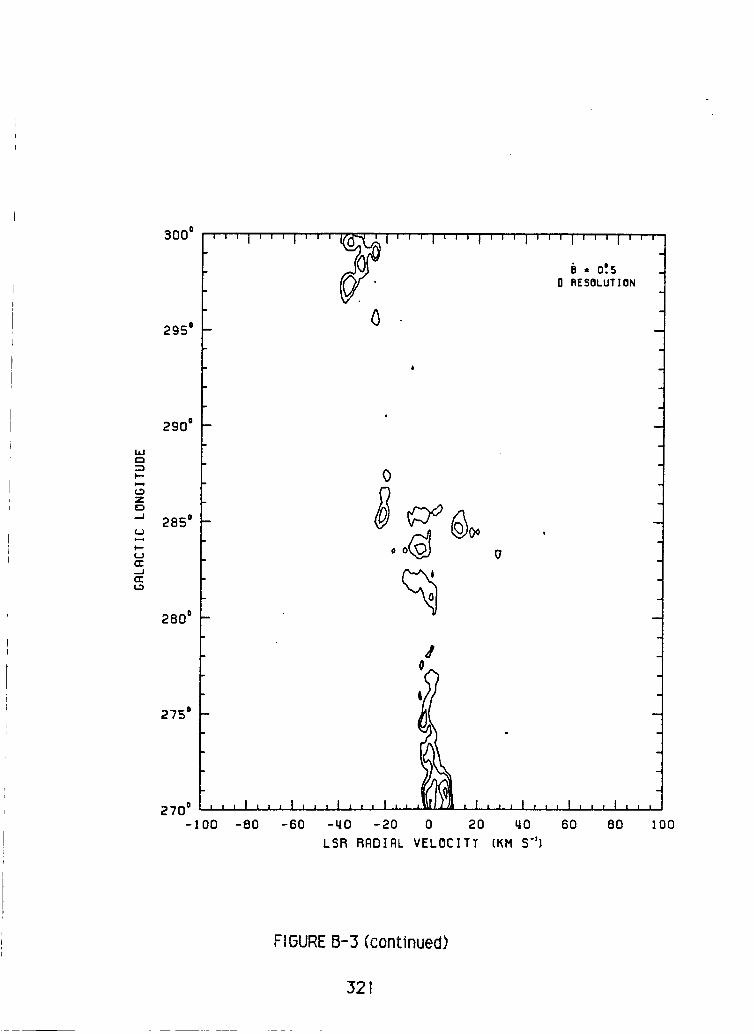
L_C_-%I--M0Z
_.1
I.-
el:
300 o
295 °
290 °
285 o
280 °
275 °
270 °
-I00
° ' ' I ' ' ' I ' ' ' I_.' I ' ' ' I ' ' ' I ' ' ' I ' ' ' I ' ' ' I ' ''D PIE$OI,.UTION_" 0_5
0
8
,r0
,1
,,,i,,,I,,,i,,, I,, i_
-80 -60 -_0 -20 0
o
,I,,,I,,,I,,+1,,,
2O qO 6O 8O IO0
LSR RRDIRL VELOCITY (KH S")
FIGURE B-3 (continued)
321

hi1:3
I--
QZE_J
U
I--UE.,JOCQ
3000
295 °
290 o
2850
280 =
275 =
270 =-100
, , , I , ' ' I ' ' ' I ' ' ' I_I ' '(J'_ ' I ' ' ' I ' ' ' I ' ' '(_ ' B- 0=.0
6 g RESOLUT ] ON
-80 -60
O t
4 1
@
-u=O -20 0 20 I.tO 60 80 lO0
LSR RFIO]RL VELOCITY {KM S"]
FIGURE B-3 (continued)
322

ILl
t-"
ZE)._J
(J
f,JG:.-J(2:L3
300 o
295 o
290 o
285 o
280 o
2"/5"
''' I''' I'' '_'' I '6''Q I'''0_C_) "I ' ' ' I ' ' ' i ' ' ' I ''oRESOLUTIONB=-0°.5
e_
Q
° ol
6
o
e,
• 9
I _ Oo
I"
<
e
D
, , , I , , , I , , , I , , , I ,,,_,
-80 -60 -40 -20 0
,I ,,] I,,,I,,, I,, ,
20 _0
LSR RADIAL VELOCITY (KM $")
I60 80 I00
FIGURE B-5 (continued)
323

Wt-,
I--p=o
Z
.-I
i=..U
_..It'r1.3
300 °
oo 6>
O
0
LSR RADIAL VELOCITY {KM S"}
FIGURE B-3 (continued)
324

¢3
I-,,,.M
ZE_..,,J
oiqI,i(,J
-.I
300 o
295 o
290 o
285 o
280 o
275 o
270o I, , , I ,
-100 -80
, , , I , _ , i , , , _j, , i , , , i , , , i , , , i , i , i , , , i , , ,
B • -_e. 5I1 RESOLUTION
cO9
• o
t °Q
O
, , I , , , I , , , I ,, ,/_,
-60 -40 -20 0
°
, I , , , I , ,_71 , , , l , , ,
20 4O 60 80 ZOO
LSR RADIAL VELOCITT (KM S"}
FIGURE B-3 (continued)
325

Wr_
Z
._J
I--
CZ..I
¢,D
300 o
295 o
290'
285 o
280 o
275 D
2-/0o , , , I , , , I ,
-100 -80 -60
q
|0 RESOLUT|ON
!
P
-_0 -20 0 20 _0 60 80 100
LSR RADIAL VELOCITT (KM S")
FIGURE B-3 (continued)
326

tlJ
I--
ZED..J
(_)
t-.0(2:..Jrr
300 o
295 °
290 o
285 o
280 °
275'
270 o
-100
' ' ' I "' ' I ' ' ' I '' ' 1' ' ' I ' ' ' I '' ' 1 ' ' ' I ' ' ' I ' ' '
I _ e - -2:5U 0 RESOLUTION
9
_o
"C)
, , , I , , , I , , = I , , , I , , , I(_, , I , , , I , , , I , , , I , , ,
-80 -60 -40 -20 0 20 40 60 80 ]00
LSR RADIAL VELOCITT (KM S")
FIGURE B-3 (continued)
327

LUr_
f--i=..i
Z!0--,I
I.--t._
___
300° ' ' ' I ' ' ' I ' ' ' I '.' '
6
295"
290 a
285 °
280 °
275 °
270 °-100
oO4
oe . -3:o
0 RESOLUTION
0
I
-80 -60 -_0 -20 0 20 _0 60 80 ]00
LSR RRDIRL VELOCITT (KH S")
FIGURE6-3 (continued)
328

LIJ
I--.
ZID..,I
i.-,=
(,...IEl:.,..ICi:
300 ° , , , i , , , I i , , i , , , i , , i i , i , i , , , i , , i i , , i i , , ,
295 o
290 °
285 °
280 _
275 o
270 o
-lO0
_0
8 • -3:5I1 RESOLUTION
0
o,,, ,I , , ,I , , , I ii it i ill i i i I I i , I , , , I , , , I , , ,
-80 -60 -ltO -20 0 20 ltO 60 80 100
LSR RADIAL VELOCITY (KM S"}
FIGURE B-3 (continued)
529

uJC_
I--
ZC_,-J
(..)
l--
..J
300 °
295"
290 o
285 o
280 o
275 °
270'
-100
' _ ' I _ ' ' I '' ' I ' "' I ' ' '01 ' ' ' I ' ' ' I ' ' ' I ' ' ' I ' ''.
8 - -4°.00 RE$OLUT ] DN
t0
J
,_,l,,,I,,]l,,,I,,,I,,,l,,,I,,,I,,,I,,, !
-80 -60 -40 -20 0 20 40 60 80 100
LSR RADIAL VELOCITY (KM $")
FIGURE B-3 (continued)
330

LJJ
I-,-
(.DZE).J
(_1
I--(.J(3:
(3:
_OOO II III III II III III III I I I I I I I III III I I I i i i i
0 B • -_'.5O RESOLUT 1ON
b
295 =
290 =
285 o
280 °
275 =
270 =
" 0 I
,, , I , ,,I ,, , I ,,, I, ,,I, ,,I ,, , I,,, I , , i I i = i
-100 -80 80
o
-60 -_0 -20 0 20 u,o 60
LSR RRO]FIL VELOCITT [KM S"_]
I00
FIGURE B-3 (continued)
331

I.I.Ir",
I.--
ZO._l
O
I--On-...IO:LD
300 a
295 D
290 °
285 °
280 °
275 °
2700-100
B • -5;00 I1 RESOLUTION
t}
0
-80 -60 -40 -20 0 20 qO 60 80 100
LSR RRDIRL VELOCITY (KM 5")
FIGURE B-3 (continued)
332

ool
|
...I
.,t,.,l.,,l..,f..,l,,.l..,l,,,l.,.|i i
%'=%%'..%._%%.=%I I I I I
BONllI_7 3113U7_9
C:)
p-
O
t_
I
I
Lf)r',-
I
CD
CD
I
T
w
f.=)
E)
,..I
a:
#v.
(.t)
..I
,,,i,,,i,,,i,,,i,,,i,_,l,,,i,,,l,,,i,,
t4_ml
r'-C%1
II
..J
,,'=,%%'_%'_%%':,%I I I I I
30NIl 1U7 3113tJ7tJO
(:3
,.,.,,
tt_
r "_i
CO
w
1.11 .--J
I ,--,
r-.
C=
U')
tO
I
(:3
0i°o
|
'''I'''I'''I'''I'''I'''I'''I'''I'''I''
Z0
Ul
8,.
I
0
• .1...I * ..I., ,I,,,I...I...I...I...I i I
%%%%%%:%%'_%I I I I I
30F1111U7 3113U7U9
, (D
tt_
r'-
{3
tr)
!
i
f,,,.
i
e=,
i
w
o
,.-4,
...I_r
¢,-.
-./
,_,l;;,i.,,i,*,l,r*l,,,i,,,i,,,i,..i.,
,.l,.,l,,,l,,.l,,,l,,,l,..l,,,l,,,l,, I
._'_-%%'_%%%%%%I I I I I
_0AII 1U7 3113U7U9
it}
I_T
..I
p,,.I
I
FIGURE B-4
333

0
|
..J
,,,i,,,i,,,i,,,1,,,i,,.i,,,i,,,i,,,i,,,
(3
C_.,,,.
It)
0
:D
G:
re"U')
-J
I
I
I
,,,i,,,f..,I..,I,.,I,,,I,..I.,,I.,,I,,
%%%%%%_%%_%Tl I I I I
30AII187 3113U78D
m
,,,t.,.l.. ,I, ,,t,,.t,.,l,.,l.,.t, • ,I,,
%
O
m
_ ..J
L_ _
!
0
"=.%%'._%*..%%%%'I I I I I
30f7111U7 3I138788
o
I
.J
'''l'''l'''l'''l'''l'''l'''l'''l'''l'''
Z
,.J0UltoJC
im
|.,i,,,i.,, l,.,t,.,l,, .i,,,I.,,I,,,I,,
%%
0
I
!
!
%%%%%%%%%'I I I I t
30flllI_7 311387U9
w
°,.-4,
.-I
ee
O0
_5
_tJ
I
%
'''i'''l'''|'''l'''l'''i'''l'''l'''I''
m_
s
!
O
,,I,,,I,,,f,,,I,,,I,,,l,,,I,,,|,.,I.,
%%%_%%%%%%'I I I I I
30NII187 311387U8
FIGURE B-4 (continued)
334

CI
-,++;r,,.
,=.i
''l'''l'''l,,,l,,.l,,,l,,,l,.,l.,L1,,
% _ 0<.,...,. o.., % o._ % 0<,,.o=,. %I I I I I
30_111_7 311_U7_0
D
V.-
u9
!
I
u_
I
O
7
i
(-JO
J
N
nr
.-J
ul
i
,.,,J
,..I,..I,..I,,,I..,I,.,I..,i,,,i,,,i,.
% o=., o,., % o._ % o. 0..,,.o<.,.0=,,%I I I I I
30NI 11U7 3113_71_9
p,- ..i
3C_ _
I ¢y-
I._ .-Jr_
i
Q
i
oe.
i
,.J
%
+,,l,,,l,,,l,,,l,,,l,,,l,,+l,,,l,,,l,,
,Z0 -
Ul
i
o
, .I.,,I,..I.. ,I,.,I,..I ,.,I,,,i ,,,i.,,
+=.,% +<.,.,+.... +o 0_ % % -:=,.%I ! ! ! I
301711187 311387_D
It')f_
I
I
f-.I
I
w
0
..J
..J
,,,i,,,i,,,i,,,!,,,!,,,],,,t,,,I,,,i,,
,,l,,,l,,,l,..l,,,l,.,l,,.l,,,l,,,l,,,
%0=.%%%%+..%%0=.%! I I I I
30AI11_7 3113_7_
, 0
uO
ioO
0
1.1")-J¢Urr
oO
I
C_
I
FIGURE B-4 (continued)
335

0
41
...J
'''i'''l'''l'''i'''l'''i'''l'''l'''l'''
% %, % % "_. % "....% % % %I I I I I
30_IJ.I J._7 31J.3_7_
C:)
b_
O
U') --.I
I
C_C_
I %_%_%%'.-,%%%%I i I I I
30_111_7 _II3W7W9
C_
t
_z
C_ -J
n
t_ .-I
i_-
I
O
T
O
II
-a
'''l'''l'''l'''l'''l'''l'''i'''l'''l'''
Z
I
Q
t.C)
IOw
..J
1.1") .--I
,"r
!
...I...|...i...I...i...I...i...I...I..
% % %%_ %',..% % %.%'I I t I I
30171111:17311387_9
0
'''l'''l'''l'''l'''l'''l'''l'''l'''l''
,.l,,.l,,.l,,,l...l,,,l.,,l,,.l,,,l,,
%-_%%'_%'_%%._%I I I I I
3Ofll IlU7 31131:171:19
i
(_)
£U rr
'F=
p..
!
C_
I
FIGUREB-4 (continued)
336

o
I
...I
,,,IJ,,I,,,|,,,I,,,|,,,I,,,V,,,I,,,I , ,
o C_D
l.l...I...l...I...I...I...I...I...I.. I
o %%%...%._%%0= ._I I I I I
3017111U7 3113U71_9
w..J
O
U'_ ._
('U C_
U_ -.Jr'-
I
C_{3
i
...i...i...t...i ...i...l...I...i,ijl _
%0=%%._%0_%%0=%I I I I I
30171111:173I 13U7UO
(3
,-Q
m
0
U') ..J
I N
LO -.Jp-
I
O(3
T
o°
|
'''I'''I'''I'''I'''I'''I'''I'''I'''I'''
Z0
m
(3
(:3
Ul
,9= i
w.J
E)
U_ .Jf_J
E)
: n"
($I
Ul -J
p-
I °
(3
%%%%-..,%'__%%'=%'I I I I I
3Of_lIIN7 3113U7N9
'''I'''I'''I'''I'''I'''I'''I'''I'''I'''
,,I,..I.,,I.,.I,,.I,.,I..,I,,,I,,,I,. I
C_
0
I/I
irJ1
EP
C3 ..Ihl
Ul ..Irr
I {E
(.f)
U'I ..I
I"-
I
C3
% "=, % % "._, % ".., % % %, % 'I I I I I
30_7111U7 3113U7U9
FIGURE B-4 (continued)
337

C)ol
IM
I
.J
0
U')
T
(J
rr
C:I
I n"
I,_ ,--I
I
% % % %-.. %-__ % %'=, %'I I I I I
30171111:17 3113_7U9
ini,
"''1'''1'''1'''1'''1'''1''']'''1'''1'''
lii|.,,I,,,I,,,I.,,I,,,l,,,I,..I,,.I,.
%_%%'..%'_%%_%I I I I I
30NI 1li:17 3113U7UO
i
O -J
C=
I n-
..-J
f_
I
I
o
I
.J
'''l'''l'''l'''l'''l'''l'''i'''l'''l''
z0
dtnwh-
i
C_C:)
{.JD
c:D
u') /
i n-
ul
t_ .Jp.
i
(3
% % % %-.. %-__ % % ":, %'I I I I I
301711 II:17 g 1 131:171:19
U'iI_ _ li'i
II
'''l'''|'''l'''l'''l'''i'''i'''l'''l'''
,,,I,,,I,,,t.,,i...I,,,I,.,I,,,l..,l,.
0
t_
p- ....i
E_
--J(3 ,,I
U1 ..J
CE
a:
I {Z:
U'_ -Jr'-
I
C_C_
%-:, % % "_ % "_ % %'_ % 'I I I I I
30f711 lI_7 3113U71:19
FIGURE B-4 (continued)
338

0
,GOn.I
I
.,,.I
(::)
C_
I
I
0
Oil.t,..I,.,I,.,I,,,t..,|.,,I...I.,.I,,
I I I I I
30NIIIU7 3113_7_9
:!.-J
N
_,_l,,_l,,,i,,,i,,,i.,,i,,,i,,.i,.,i,,,
• ,,l,,,|,,,l,,,l,,, |,,,I, ,,I,,,I,,,I., ,
%%%%%%%%%%%l I l I I
30FII 11_7 3113U7_9
(:3
M
If')
iCn
30
If) ._OJ rr
I n--
U3
U3 .--I
I
7"
o
I
.J
'''l'''l'''l'''l'''l'''l'''l'''l'''l'''
Z0M
Wn"
elm
C:)
(:3
I
0
%_%%_%%%%%%'! I I I I
3OfllIIU7 3113U7_9
w
U') .__
..I
'''l'''l'''l'''!'''!'''l'''!'''!'''!'''
..|...I.,.I,.. I... I.. ,I...I...I...|..
% %. % % "., % ",. % % % %I I I I I
3017111_7 3113_7U0
0
m
!
I
FIGURE B-4 (continued)
339
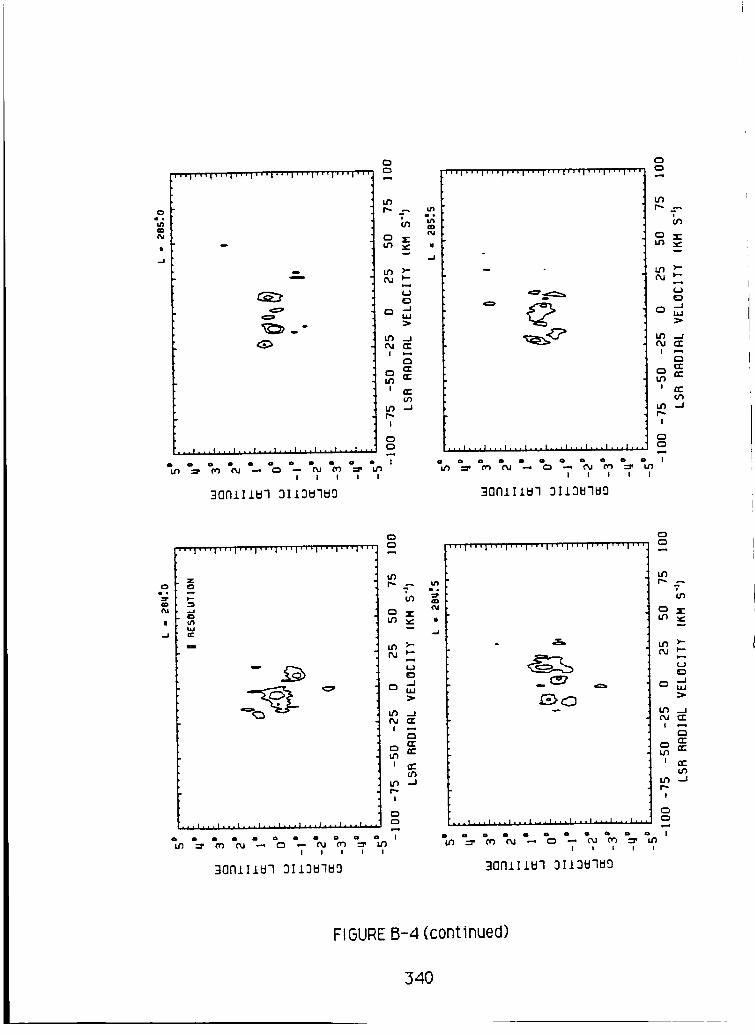
0e,u'Jco
_J
'''1'"''1'''1''"1'''1"''1'''1'''1'''1''
mQ
,,,I, ,,I,.,I. ,,I,,,I, , ,I,,.I, , ,t, ,,I,,
%%%%%%_%%_%I I I I I
3017111U7 31 13U7UD
(3
u3
;Q
..m
f.J
O
rrI ,,-*
I n,-
or)
U') --;
r,,,-
i
t3
T
,,,I,,,I,,,I,,_I,,,I,HI,,,I,,9'I,,,I,,,
o @
I_|
I.f) ,_
e_l OIl
!
c_
I I I I I
30fill 1U7 311"_U7U9
|
..I
z0
M-
m
, 0
kf')
N
,il
0
1%1 I:_
(t)
I_ ,--I
!
0
C_
% % % %',..%'_ % % _ %'| I I I !
301"11111:17 3113U7Ug
I I ! I !
30fllllU7 3113U7U9
0
C3
U9
O9
LU
U9 _J
_U C_
rr
It) --_
O
I
FIGURE B-4 (continued)
_40

0
ID
|
.J
_,,i,,,'1,,,i.,,i.,,i,,,i,,_1,,,i,,,I,,,
0
O
U
O,ClI.
4,
D
• .11.,I ,..I,. ,I,,.I,..I..,I, .,1...I,.
{3
{3
U')
w
f.J
0
{3,-4,
U1 ._J
(M (=
{3
: IE
U'I /
I
{3
{3
%.=%%._%._%%.=%7I I I 1 I
30AIIIU7 31131:171:19
I/I
{%1
J
'''l'''l'''l'''l'''|'''l'''|'''i'''l''
{3{3
I.h
IU")
w
¢JE)
/(:3 bJ
I,r) ...I
¢_1 el"
I _'qt-I
CI:
p,.
I
(3
• ,I.. ,I., .I..,I,,,I..,I,,,I,..I, , .I., {3
%_%%%%%%%%%'I I I I I
30AIII_7 3IIOUTUO
e_Oo
|
..J
'''1'''1'''1'''1'''1'''1'''1'''1'''1'''
Z0
I/)1.1IT"
m
IP
,.,I,.l|i i u It,,l., ,I,, ,I, ,,I,,,I,,,|,,,
%':,%%;%;%%'= mI I I I I
30nllIU7 3113U7U9
{3
(3
Lt_
0
I n."
O')
U'_ --I
p-I
(:3
{3
I
Od
I
,,,!,.,l,,,i,,,|,,,l,,,l,,,i,,,i;;,i,i,
i,,I,, ,1..,1, ,,1.,, I,,, Ill,l,,,I,, ,I, ,,
% "=, % % "_ % ".. % % _ %I I I I I
3OAf IIU7 311gU7UO
{3
{3
(/I
30
{3..-I,
U'_ .,.J
'r,
m .,.i
!
{3{3
!
FIGURE B-4 (c0ntinued)

0
II
.,.,.I
,,,i,l,l,,,i,,,t,,,i,,,|,,,i,,,i,,,|,,,
oI
...I, ..I. ,,I,..I..,t, ,,I, ,.I...I. ,.I ,,,
%_%%%',::,*..%%_ ,.,-,I I I I I
301J. ] J._7 31J._I:I7EI_
0
t,£)
(%1
I
I
!
I
-_ 0
w..I
(.3
0
...I
¢Z:
QC
.,.I
'''l'''l'''l'''l'''l'''l'''l'''l'''l''
c
w
0
t--I
I
O
-.,..,_ % % ..... % % % % _ %TI I I I I
30171111:173113_7_9
0
rip,N
%
,,,i,,,i,,,i,,,i,,,i,,,i,,,i,,,10,,I,,,
Z0M
(n
M,,
i
o
,.I..,I ,,lllllll.ll,..l,, .l,.,ll,,l,.,
%%%%%%%%%%I I I I I
30rllI J.U7 3113u7_0
le
..i
0
o ,,-i,
.,.I
i er"
r,,.-
I
i
'''l'''l'''l'''l'''l'''l'''l'''l'''l'''
o
,,,I,.,I,, ,1.,, |.,, I,.,f,,,I,, /i/, ,1, ,,
I ! I I I
3Olll 11_7 31131_7U0
w
t.--
0
O ...IW
r'U _C
r-,
I t_-
If) --J
I
I
FIGURE B-4 (continued)
342

om
ml
o
o
i,|,.,f,..i,,,i,..|.,,I,,.|,,,I,,,I,.
I--9
wI
I
0
Lt'l ,--I
I ,,,r"
r--
I
(_(3
I I I I I
30A111_7 3113_7U9
i,M
I
i
o.
,_':, % % ".. % "_. % % _ %I I I I I
30Al 111::17 31131:171:19
U_
mi(,_
M-
la.I
_f} ..a
('_ ,-'e'
I _,-
(.n
U') ..I
I
7"
I
''_l'''l'''l'''l'''l'''t'''l'''l'''U''
ZO
(/!t_
II o <:3
I
, C_
t/1
N
w,.J
E)
U_ J
r_i {E
(/)
L/_ --J
r-
i
(:3
C3
% 0=, % %'_ %'.. % % % %'i i i I I
30rllI 1_7 31131:17_9
,,,i,,,i,,,i,,,I,,,|,,,i,_i,,,i,,,i,,P_
i
(_
U_ .J
U_
U') -_r--
I
C_
I I I I I
30AI11_7 3113_7U9
FIGURE B-4 (continued)
343

0
ml'u
I
,,,l,,,l,,,'l_,,l,,,l,,,l,,,i,,,l,,,l,,iC_
P.- _ It)
(,..) .
C)
U') .d
I ,'.'.
I IX:
U') -J
!
(:3
I I I I I
3017111U7 3113_7B9
,,1.,,I,,,I ,,.I ,..I,. ,t,,.I . ,,t , ,,I ,,
%_%%%%%%%_%| I ! I I
30AlI 1_7 3113_7U0
..,.,
U';
w
U_ ..J
(%1 (_
It') ,--I
;.,..I
{:3
C_
7"
oI°(%;
I
,,,i,,,i,,,i,,,i,,,i,,*i,,,I,,,i,,,i,,,
Z0
dVlw
o
0
Q
U_
iw
..I
0
(M CC
Ul -J
r'-
I
...i.i,i...i...|...i,,.i...i...i.,.i..
%%%%'__%'__%%'=%'I l I I I
30ill 11U7 3113_7UD
0
C3
J''l'''l'''l'''l'''l'''I'''l'''l'''l'''
I
_3
w
C.3
_3
U_ .J
(11
_'} .J
p-
I
{3
%'=%%%%%%%_%'l I I I I
30AI 111_7 3II3U7UO
FIGURE B-4 (continued)
344

o
¢D
._J
,,,i,_,i,,,i,,,i,,,i,,,i,,,i,,,i,,,i,,,
..I...I...t...t,..tq,,I,,,f.,,f,..i..,
% 0=, % % "_. % ".. % % 0=, -_ ,I I I ! I
3flNllIU7 3II3UTUD
CD
CD
It)
_ in
iw
0
l._ .iJ
I
rl_
_n
p,.
!
0
'W'i'''ill'l'''ilg'|l''l'l'|r;li'''|,,
O
O'
O *O
"'l'''f''.l,,,I,..I..,f,,,I,,,I,,,I...
• ¢:J
It')
f'_ ....I
U')
'r"
p..
00
--Jt.IJ
LI_ ...J
C_J ¢C
g rr"
..J
f_
I
0
C_
% "=. % % "... % ".. % % "=. %,I I I I I
30N111U7 3113_7_9
oI°
|
,-I
'''l'''l'''l'''l'''l'''l'''U'''l'''l''
Z0
t.iJ
,, I ,.,I,..1,..I, ,,I..,l.,.i,,.i,..I.,
C_
, (:3
U')
#w
..I
(.J
U'_ _J(_J G:
o rr
U')
U') .-J
r_
I
C:)
C_
%'=.% % -- %-- % %'=, %,I I I I I
30AIIIU7 3113U7_9
'''1'''1'''1'''1'''1'''1'''!'''!'''1'''_
4m,
• .I. • .1...I ... I... I... I...|...I...l...
U")
(.q')
I$') _
0
,,-r"
n (Z:
(....)
IJ")I'...
!
"_ _ % %'_ %'_ % % %,%'I I I I I
_OAi flU7 31138789
FIGURE B-4 (continued)
345

o
I%1
.4
,,,i,,,i,,,i,,,i,,,i,,,1,,,I,,,1''']'''
o
o
0
Lfl
r'- _ u1
itw
,-t
(J
0
:P
U') ,-I
I'M (3:
t CC
b')
ul --Ir,-
I
%%%%._.%%%%o . ,I I I I I
30All I_7 3I13_7_9
0
'''l'''l''']'''i'''i'''l'''l'''i'''l'''
00
, ,,I,,,I,,,I,,,I ,,, I,, .I., *t, ,,I,,,1,
% "=, % "_ ; % ".. % % ":, %I I I I I
30NII IU7 3113U7_0
O
U'I
0
U
O
t IE
p,.
I
I
O
N
|
'''l'''l'''l'''l'''|'''l'''l'''i'''I'''
Z
Wa-
t
,,t.,,I,,,[, .,I , ,,I ,,.i,,,[., .I, ,,I.,
",.,.,"=. % % ".-. % "-. % % "=,. ,.r,I I I I I
3Onll 1U7 3I 13U7W9
U_
#
w
f_
I
0
I
'''l'''l'''l'''l'''|'''l'''l'''l'''l'''
'lip 0
C3
C3
k£)
m|U')
w
_3
=l.
U_ -J
£M (3:
I a:
Ln /p-
I
(:3
% -=,. % % -__ % -._. % % "=. % 'I I ! I I
30AI 11U7 3]13U7_9
FIGURE B-4 (c0ntJnued)
346

0
_J
|
..I
4I
o
00
,.I,,.I.,,I.,,I,,,I.,,I...I.,,I,,i|ll
%%
w
0
o ,.-I,
.Jer
• ,D ff_
I
Igl
!
%%'...%_%%_%'I I I I I
30171111:17 3113U'lU9
Q
o
0 o
,.I...I,. ,I..,I,, ,I...I.,,t,,,I , ,,I,, ,
% "=, % % 0.. % "_. % % 0=, %I I I I I
30All ltJ7 3113U7U9
N
IS')
p,,- ....i
(,_
Yw
(J
E3
la.I
U_ .--I
e"l
CE
U'l ,.,.I
p-
I
C_
(3
I
O
|
.,.I
'''l'''l'''l'''l'''l'''l'''!'''|'''l'''
zO
1.1.1ee"
I
, ,I..,I ,,.I,,,l, ,,I,, ,i,,,I,.,I.,,I,,
%%%%'-.%'...%%%%I l I I I
30AlIIN7 3I 13U7U9
O
r _
it) _J
_1 el:
ul
u1 .,.if,,,..
i
I
(M
ii
'''|'''l'''l'''i'''|'''i'''t;;'l'''l''
Q
%%%%'-%%%%'=%I I I I I
30ill I187 31131:171:19
0
, CD
p,- ,..,
0
o ,.-4,
t_ ,./
C_
Or_
U'_ ,.=I
r..-
!
i
FIGURE B-4 (continued)
347

0
c_
|
.J
'''1'''1'''1'''1'''1'''1'''1'''1'''1'''
zr_M
L,Jn_
I
Q
m Q
C::)
r,.-
i
o
_ ,,-',
LI_ ,..,I
,,,,y.
t ,,,,.,.
(j..)
U")
r...
i
c:)
% "= % % ",_,% "._, % % 0=,,"_ 'I I l I I
30NI li_7 3113U7_9
FIGURE B-4 (continued)
348
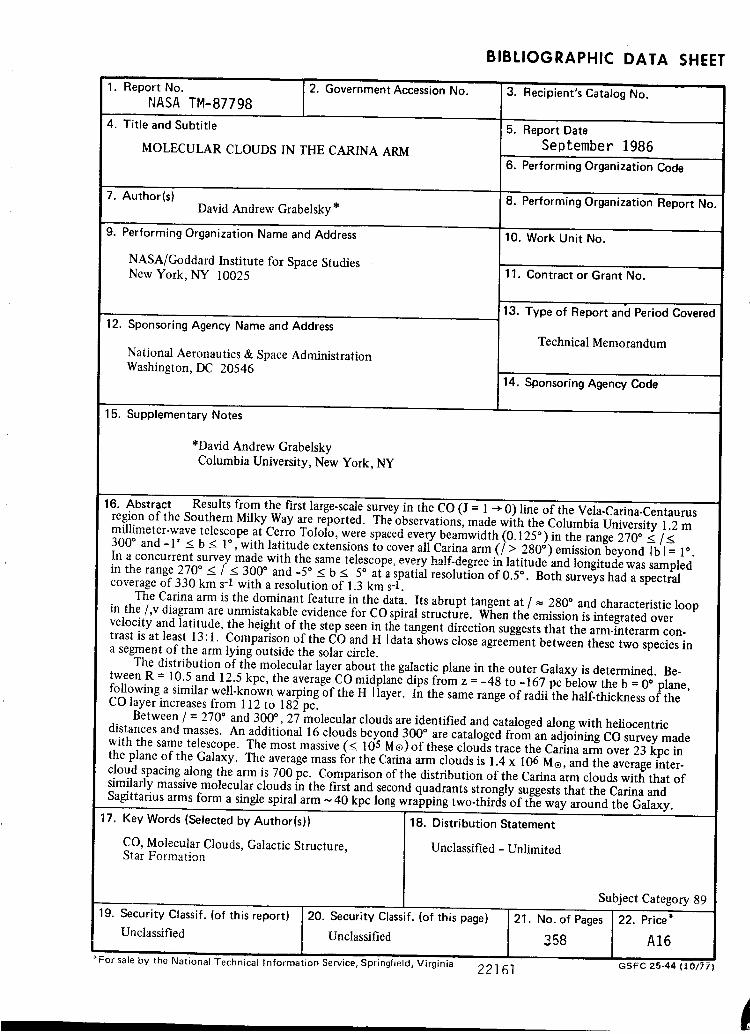
BIBLIOGRAPHIC DATA SHEET
1. Report No. 2. Government Accession No.
NASA TM-87798
4. Title and Subtitle
MOLECULAR CLOUDS IN THE CARINA ARM
3. Recipient's Catalog No.
5. Report DateSeptember 1986
6. Performing Organization Code
7. Author(s) 8. Performing Organization Report No.David Andrew Grabelsky*
10. Work Unit No.9. Performing Organization Name and Address
NASA/Goddard Institute for Space StudiesNew York, NY 10025
12. Sponsoring Agency Name and Address
National Aeronautics & Space AdministrationWashington, DC 20546
11. Contract or Grant No.
13. Type of Report anti Period Covered
Technical Memorandum
14. Sponsoring Agency Code
15. Supplementary Notes
*David Andrew GrabelskyColumbia University, New York, NY
16. Abstract Results from the first large-scale survey in the CO (J = 1 _ O) line of the Vela-Carina-eentaurusregion of the Southern Milky Way are reported. The observations, made with the Columbia University 1.2 mmillimeter-wave telescope at Cerro Tololo, were spaced every beamwidth (0.125 °) in the range 270 ° < /<300 ° and -1 * < b < 1° , with latitude extensions to cover all Carina arm (/> 280*) emission beyond (b I= 1".In a concurrent survey made with the same telescope, every half-degree in latitude and longitude was sampledin the range 270 ° </" < 300* and -5 ° < b < 5* at a spatial resolution of 0.5*. Both surveys had a spectralcoverage of 330 km s-1 with a resolution of 1.3 km s-1.
The Carina arm is the dominant feature in the data. Its abrupt tangent at / _. 280* and characteristic loopin the/,v diagram are unmistakable evidence for CO spiral structure. When the emission is integrated overvelocity and latitude, the height of the step seen in the tangent direction suggests that the arm-interarm con-trast is at least 13:1. Comparison of the CO and H Idata shows close agreement between these two species ina segment of the arm lying outside the solar circle.
The distribution of the molecular layer about the galactic plane in the outer Galaxy is determined. Be-tween R = 10.5 and 12.5 kpc, the average CO midplane dips from z = -48 to -167 pc below the b = O* plane,following a similar well-known warping of the H Ilayer. In the same range of radii the half-thickness of theCO layer increases from 112 to 182 pc.
Between / = 270 ° and 300 °, 27 molecular clouds are identified and cataloged along with heliocentricdistances and masses. An additional 16 clouds beyond 300 ° are cataloged from an adjoining CO survey madewith the same telescope. The most massive (<_ 105 Me) of these clouds trace the Carina arm over 23 kpc inthe plane of the Galaxy. The average mass for the Carina arm clouds is 1.4 x 10⁶ Me, and the average inter-cloud spacing along the arm is 700 pc. Comparison of the distribution of the Carina arm clouds witla that ofsimilarly massive molecular clouds in the first and second quadrants strongly suggests that the Carina andSagittarius arms form a single spiral arm ~ 40 kpc long wrapping two-thirds of the way around the Galaxy.
17. Key Words (Selected by Author(s))
CO, Molecular Clouds, Galactic Structure,Star Formation
19. Security Classif. (of this report)
18. Distribution Statement
Unclassified - Unlimited
20. Security Classif, (of this page)
Unclassified Unclassified
*For sale by the National Technical Information Service, Springfield, Virginia
Subject Category 89
21. No. of Pages 22. Price*
358 A16
22161GSFC 25-44 (lO/?l
|I