closing the savings gap - microsoft · pdf file1 closing the savings gap insights from money...
TRANSCRIPT
September 2016
Closing the savings gapInsights from Money Advice Service research
The Money Advice Service: 2015/16 Business PlanMoney Advice Service: Debt Advice Quality Framework IFC2
SectionSection
moneyadviceservice.org.uk
ContentsIntroduction: Mind the savings gap 1
Saver behaviour: 3
Overview of saver types 3
Pen portraits 5
Non-Savers 5
Irregular Savers, Low Balance 7
Monthly Savers, Low Balance 8
Irregular Savers, High Balance 10
Monthly Savers, High Balance 11
The three ‘S’s of saving: Situation, Skills and Stance 12
Situation 12
Skills 14
Stance 16
Bridging the gap: Encouraging people to save 20
Success factors 22
A push to get started 22
Starting small 24
Showing progress against a goal 25
Forming a habit 25
A challenge not a chore 26
Providing information – but making it personal 26
Doing it together 27
Making it tangible 28
Closing the gap: Conclusions and next steps 29
Appendix: The research 31
1
Closing the savings gap – Insights from Money Advice Service research
Introduction: Mind the savings gapHow would you manage if you were faced with an unexpected bill? If your car needed a repair, your washing machine broke down, or your dog had to go to the vet? Many people have sufficient income or savings to cover such unforeseen expenses. However, a substantial minority of working-age adults do not. These people are at risk: they may go (further) into debt; resort to expensive, short-term credit; or go without something they need. Even the prospect of an unexpected bill can cause considerable stress and worry – a savings gap affects the wellbeing as well as the financial health of the household.
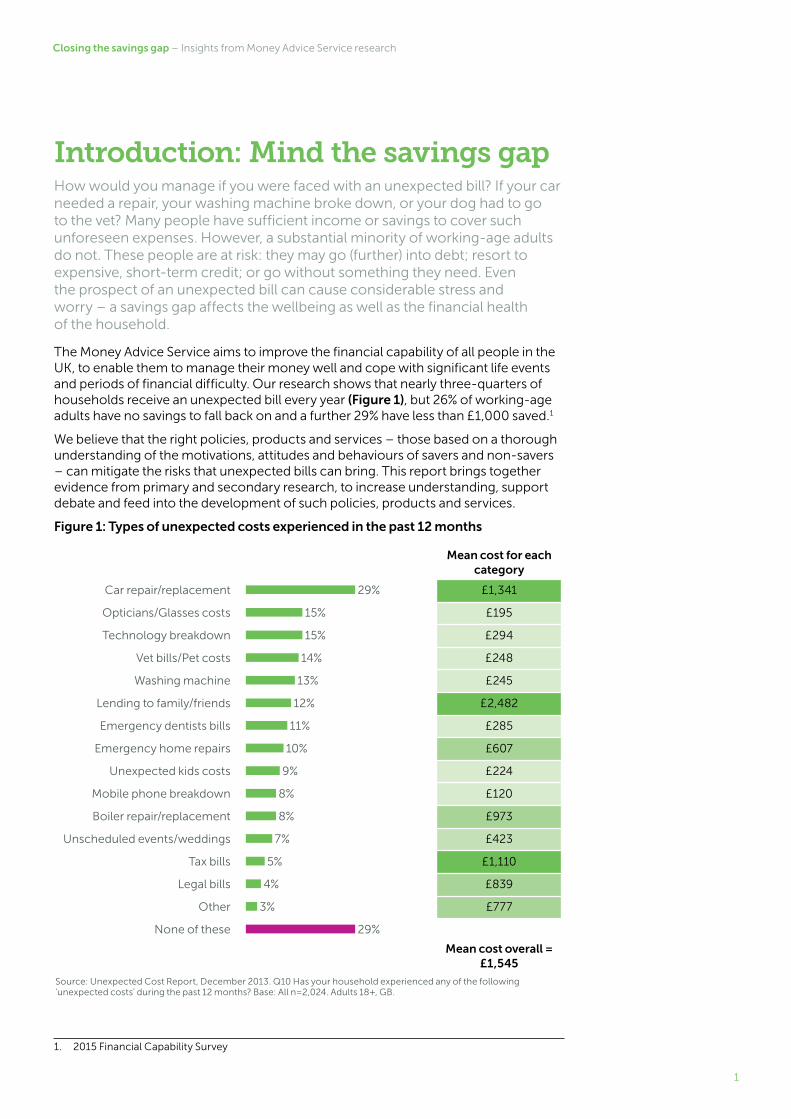
The Money Advice Service aims to improve the financial capability of all people in the UK, to enable them to manage their money well and cope with significant life events and periods of financial difficulty. Our research shows that nearly three-quarters of households receive an unexpected bill every year (Figure 1), but 26% of working-age adults have no savings to fall back on and a further 29% have less than £1,000 saved.1
We believe that the right policies, products and services – those based on a thorough understanding of the motivations, attitudes and behaviours of savers and non-savers – can mitigate the risks that unexpected bills can bring. This report brings together evidence from primary and secondary research, to increase understanding, support debate and feed into the development of such policies, products and services.
Figure 1: Types of unexpected costs experienced in the past 12 months
Mean cost for each category
Car repair/replacement 29% £1,341
Opticians/Glasses costs 15% £195
Technology breakdown 15% £294
Vet bills/Pet costs 14% £248
Washing machine 13% £245
Lending to family/friends 12% £2,482
Emergency dentists bills 11% £285
Emergency home repairs 10% £607
Unexpected kids costs 9% £224
Mobile phone breakdown 8% £120
Boiler repair/replacement 8% £973
Unscheduled events/weddings 7% £423
Tax bills 5% £1,110
Legal bills 4% £839
Other 3% £777
None of these 29%
Mean cost overall = £1,545
Source: Unexpected Cost Report, December 2013. Q10 Has your household experienced any of the following ‘unexpected costs’ during the past 12 months? Base: All n=2,024. Adults 18+, GB.
1. 2015 Financial Capability Survey
2
Closing the savings gap – Insights from Money Advice Service research
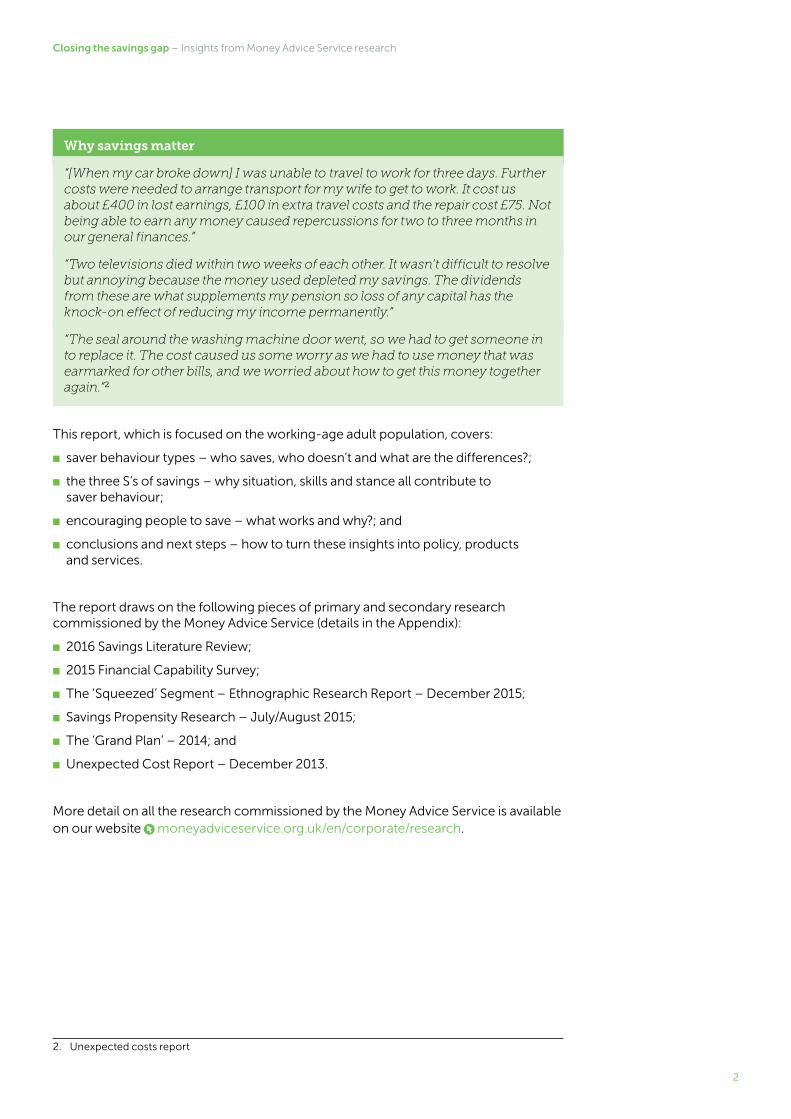
Why savings matter
“[When my car broke down] I was unable to travel to work for three days. Further costs were needed to arrange transport for my wife to get to work. It cost us about £400 in lost earnings, £100 in extra travel costs and the repair cost £75. Not being able to earn any money caused repercussions for two to three months in our general finances.”
“Two televisions died within two weeks of each other. It wasn’t difficult to resolve but annoying because the money used depleted my savings. The dividends from these are what supplements my pension so loss of any capital has the knock-on effect of reducing my income permanently.”
“The seal around the washing machine door went, so we had to get someone in to replace it. The cost caused us some worry as we had to use money that was earmarked for other bills, and we worried about how to get this money together again.”2
This report, which is focused on the working-age adult population, covers:
■ saver behaviour types – who saves, who doesn’t and what are the differences?;
■ the three S’s of savings – why situation, skills and stance all contribute to saver behaviour;
■ encouraging people to save – what works and why?; and
■ conclusions and next steps – how to turn these insights into policy, products and services.
The report draws on the following pieces of primary and secondary research commissioned by the Money Advice Service (details in the Appendix):
■ 2016 Savings Literature Review;
■ 2015 Financial Capability Survey;
■ The ‘Squeezed’ Segment – Ethnographic Research Report – December 2015;
■ Savings Propensity Research – July/August 2015;
■ The ‘Grand Plan’ – 2014; and
■ Unexpected Cost Report – December 2013.
More detail on all the research commissioned by the Money Advice Service is available on our website moneyadviceservice.org.uk/en/corporate/research.
2
2. Unexpected costs report
3
Closing the savings gap – Insights from Money Advice Service research
Saver behaviour:
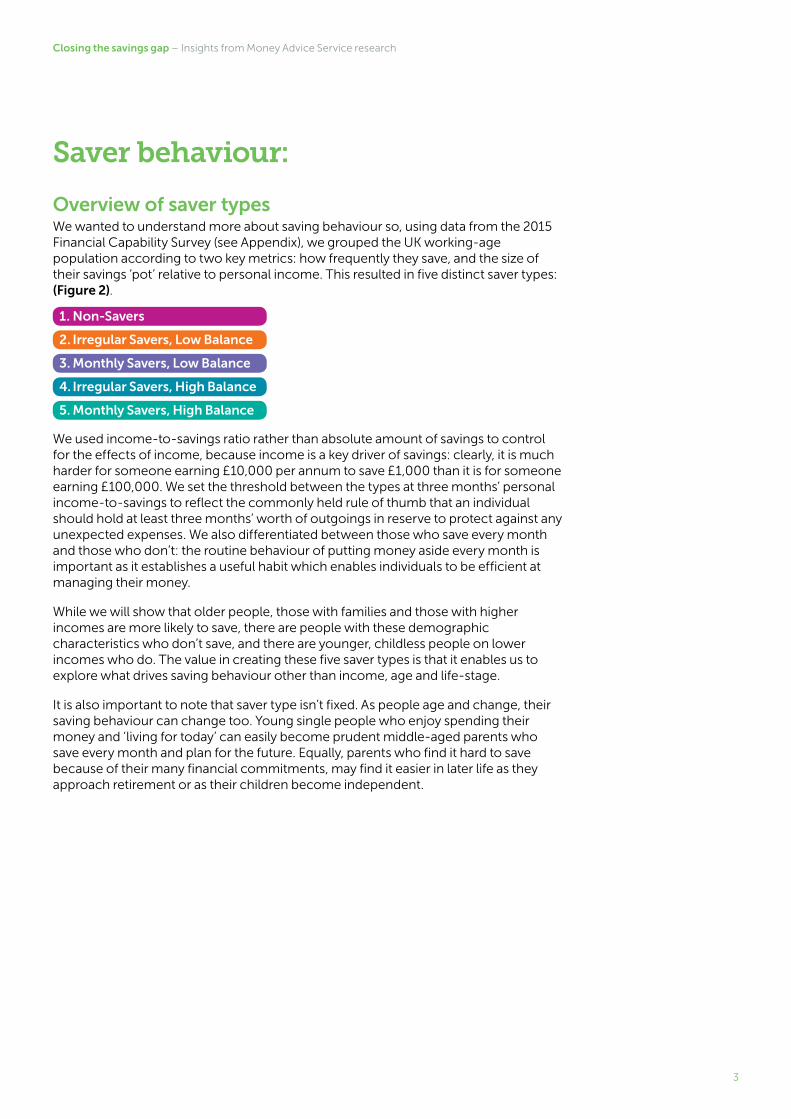
Overview of saver typesWe wanted to understand more about saving behaviour so, using data from the 2015 Financial Capability Survey (see Appendix), we grouped the UK working-age population according to two key metrics: how frequently they save, and the size of their savings ‘pot’ relative to personal income. This resulted in five distinct saver types: (Figure 2).
1. Non-Savers
2. Irregular Savers, Low Balance
3. Monthly Savers, Low Balance
4. Irregular Savers, High Balance
5. Monthly Savers, High Balance
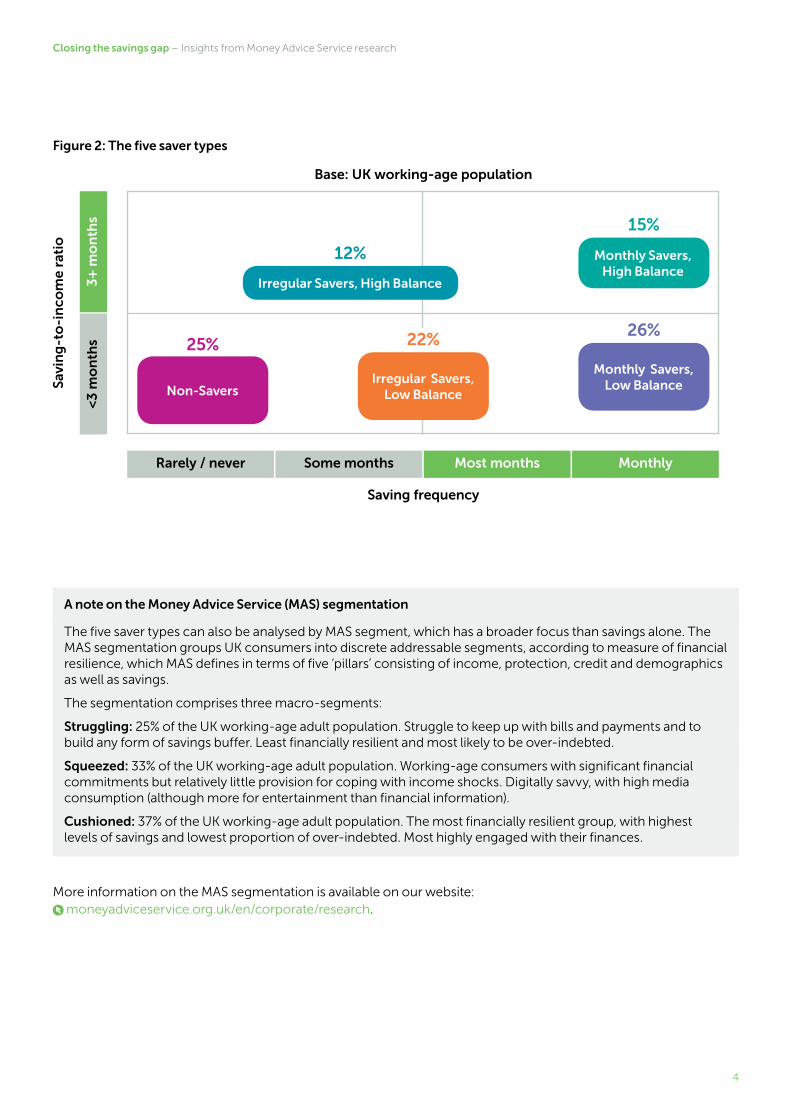
We used income-to-savings ratio rather than absolute amount of savings to control for the effects of income, because income is a key driver of savings: clearly, it is much harder for someone earning £10,000 per annum to save £1,000 than it is for someone earning £100,000. We set the threshold between the types at three months’ personal income-to-savings to reflect the commonly held rule of thumb that an individual should hold at least three months’ worth of outgoings in reserve to protect against any unexpected expenses. We also differentiated between those who save every month and those who don’t: the routine behaviour of putting money aside every month is important as it establishes a useful habit which enables individuals to be efficient at managing their money.
While we will show that older people, those with families and those with higher incomes are more likely to save, there are people with these demographic characteristics who don’t save, and there are younger, childless people on lower incomes who do. The value in creating these five saver types is that it enables us to explore what drives saving behaviour other than income, age and life-stage.
It is also important to note that saver type isn’t fixed. As people age and change, their saving behaviour can change too. Young single people who enjoy spending their money and ‘living for today’ can easily become prudent middle-aged parents who save every month and plan for the future. Equally, parents who find it hard to save because of their many financial commitments, may find it easier in later life as they approach retirement or as their children become independent.
4
Closing the savings gap – Insights from Money Advice Service research
Figure 2: The five saver types
A note on the Money Advice Service (MAS) segmentation
The five saver types can also be analysed by MAS segment, which has a broader focus than savings alone. The MAS segmentation groups UK consumers into discrete addressable segments, according to measure of financial resilience, which MAS defines in terms of five ‘pillars’ consisting of income, protection, credit and demographics as well as savings.
The segmentation comprises three macro-segments:
Struggling: 25% of the UK working-age adult population. Struggle to keep up with bills and payments and to build any form of savings buffer. Least financially resilient and most likely to be over-indebted.
Squeezed: 33% of the UK working-age adult population. Working-age consumers with significant financial commitments but relatively little provision for coping with income shocks. Digitally savvy, with high media consumption (although more for entertainment than financial information).
Cushioned: 37% of the UK working-age adult population. The most financially resilient group, with highest levels of savings and lowest proportion of over-indebted. Most highly engaged with their finances.
More information on the MAS segmentation is available on our website:
moneyadviceservice.org.uk/en/corporate/research.
Base: UK working-age population
Saving frequency
Savi
ng
-to
-in
com
e ra
tio
Rarely / never Some months Most months Monthly
<3 m
on
ths
3+
mo
nth
s
Non-Savers
25%
Irregular Savers, Low Balance
22%
Monthly Savers, Low Balance
26%
Monthly Savers, High Balance
15%
Irregular Savers, High Balance
12%
5
Closing the savings gap – Insights from Money Advice Service research
Pen portraitsIn this section, we draw some ‘pen portraits’ of each of the five saver types, covering their demographic makeup, attitudes, confidence, financial behaviour and goals, and noting where they are significantly different from the other types,3 or from the UK working-age population overall, with a view to learning about who saves and who doesn’t and the barriers and incentives to saver behaviour.
Non-Savers Non-SaversPeople in this saver type have the lowest average income; are least likely to be economically active; and, perhaps as a consequence, are least likely to be satisfied with life or their financial circumstances. They are least confident about managing money and about making financial decisions. Non-Savers are also most likely to be part of the MAS ‘Struggling’ segment.
Non-Savers are the most anxious about their finances, and the most likely to feel that there is nothing they can do to improve the situation, so it is perhaps not surprising that they are also the most likely to ‘live for today’ (49% agree with this statement vs. 30% overall). They are least likely to save instead of borrow, and the most likely to save only for a specific purpose (rather than for saving’s own sake). They are least likely to have financial goals for the next five years and where they do have a goal, it is most likely to be simply making ends meet. They are also least likely to have plans in place to meet these goals: 46% of Non-Savers have plans vs. 64% overall.
This lack of planning extends to retirement and end-of-life planning: only 38% of Non-Savers have a pension that they have paid into vs. 59% overall; 34% expect to depend on the state pension; and a further 31% don’t know how they will fund their retirement. They are also least likely to have made a will or planned for the costs of care.
Non-Savers are the most likely to be over-indebted (defined as either finding it a heavy burden to keep up with their bills and credit commitments, or having missed payments in three of the last six months) and their debts are, on average, slightly larger than those of the other behaviour types (in absolute terms). They hold fewer credit products than other types (33% hold none, vs. 21% overall) – this includes mainstream products such as credit cards and car finance, as well as less formal products such as logbook loans or informal, unregulated lending. However they are most likely to have borrowed money from friends and family (20% vs. 13% overall). Those Non-Savers who do have credit cards are most likely to be paying off only the minimum every month. They are also least likely to be protected from financial shocks by insurance, such as home insurance (held by 27% vs. 46% overall), life cover or critical illness insurance.
Despite being the group that have most to gain from taking control of their finances, they are the least well equipped and the least likely to do so. Non-Savers are the least likely to have shopped around for good deals on financial products such as insurance or credit cards, or on services such as utilities or mobile phone tariffs, and they are most likely to be on a prepayment electricity plan (39% vs. 17% overall). Prepayment can be more expensive but is sometimes the only option available, particularly for someone with poor credit history. They are the least likely to use tools such as spreadsheets or online banking, least likely to read the financial press and most likely to feel that they don’t have time to sort out their finances. They are least likely to keep track of income and expenditure by reviewing their statements, although they are acutely aware of how much (or little) available cash they have – they are the most likely
3. In statistical terms, a significant difference between two research results is a difference that is large enough that it’s likely it didn’t arise by chance. Where there is a significant difference between two saver types, or between a specific type and the overall working population, it means that a real difference is likely to exist and is not just an artefact of the survey process.
6
Closing the savings gap – Insights from Money Advice Service research
to check their balance every day, and therefore also the most likely to know within £50 how much they have in their current account.
Compounding the difficulty of building up a savings buffer, as for all saver types, is the pressure to spend. Non-Savers are just as good as other types in resisting many of the pressures that exist, such as peer pressure and impulse purchases, but are least able to resist buying for their children ‘even when I can’t afford it’ (39% vs. 27% overall)4. While having a family can be a trigger for wanting to save, it can be hard to balance this with the natural desire for your children to have what others have; this may be a critical barrier to savings for people in this type.
Lower levels of engagement with finances – whether due to lack of skills, time or confidence – when combined with circumstances such as low income or unemployment, can be very limiting: 42% say keeping up with bills is a constant struggle or that they are falling/fallen behind. People in this saver type are often trapped in a downwards cycle: they don’t shop around and they may be less able to access cheaper deals. For example, landlord requirements in rented property, or defaulting on previous bills, may prevent them from getting discounts for paying for utilities by direct debit. Understandably, they are focused on the short term. When asked a hypothetical question: “Would you rather have £200 now or £400 in two months’ time?” 35% (vs. 21% overall) chose the quick win, rather than waiting for the bigger prize. The risk for this saver type is that an unexpected bill of £300 would have a serious impact on their financial wellbeing: 18% would not be able to pay at all, 14% would resort to credit and 19% would have to borrow from friends.
4. 2015 Financial Capability Survey, To what extent (on a scale of 0-10) would you say the following statements apply to you personally? Those scoring 8-10. Base: Working-age respondents
£
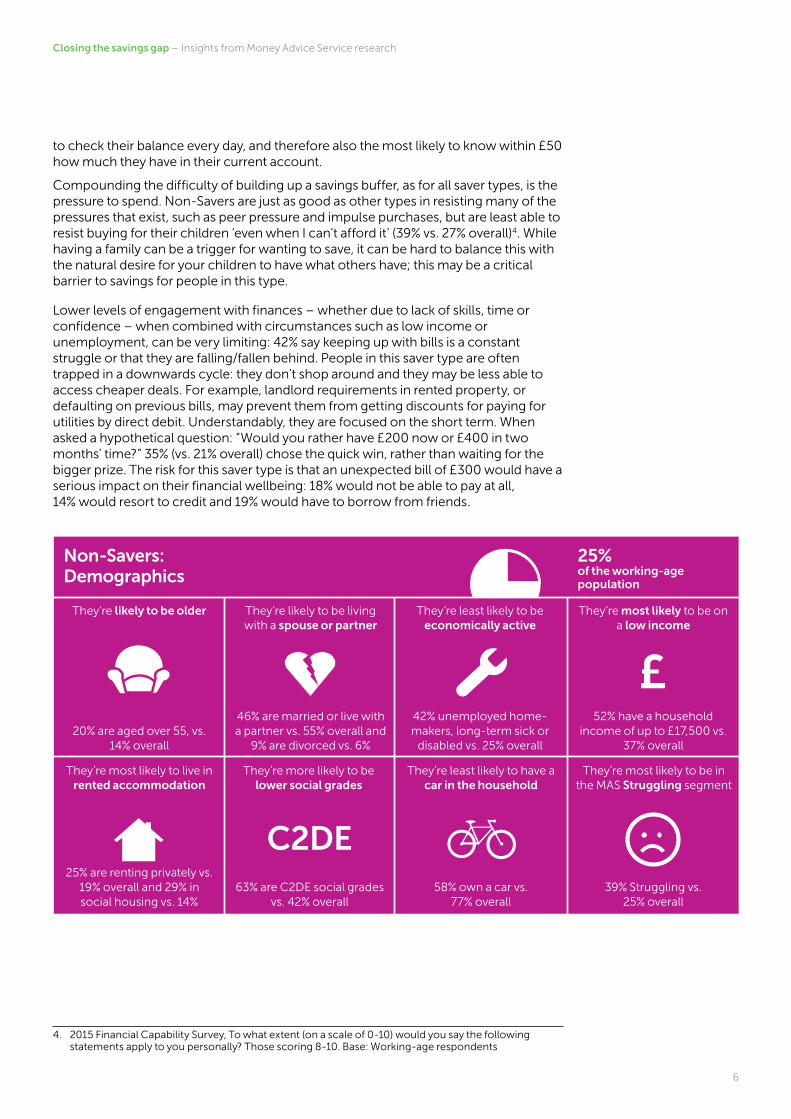
Non-Savers: Demographics
25%of the working-age population
They’re likely to be older
20% are aged over 55, vs. 14% overall
25% are renting privately vs. 19% overall and 29% in social housing vs. 14%
46% are married or live with a partner vs. 55% overall and
9% are divorced vs. 6%
63% are C2DE social grades vs. 42% overall
42% unemployed home-makers, long-term sick or
disabled vs. 25% overall
58% own a car vs. 77% overall
52% have a household income of up to £17,500 vs.
37% overall
39% Struggling vs. 25% overall
They’re most likely to live in rented accommodation
They’re likely to be living with a spouse or partner
They’re more likely to be lower social grades
They’re least likely to be economically active
They’re least likely to have a car in the household
They’re most likely to be on a low income
They’re most likely to be in the MAS Struggling segment
C2DE
7
Closing the savings gap – Insights from Money Advice Service research
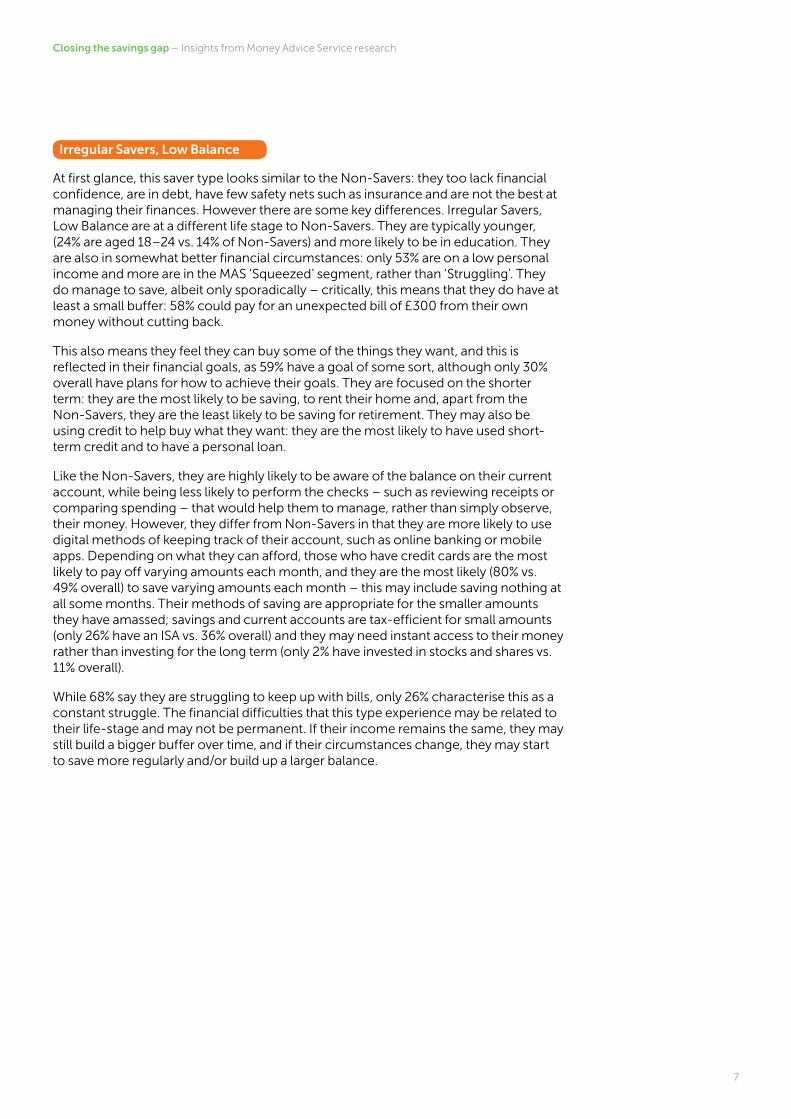
Irregular Savers, Low Balance Irregular Savers, Low BalanceAt first glance, this saver type looks similar to the Non-Savers: they too lack financial confidence, are in debt, have few safety nets such as insurance and are not the best at managing their finances. However there are some key differences. Irregular Savers, Low Balance are at a different life stage to Non-Savers. They are typically younger, (24% are aged 18–24 vs. 14% of Non-Savers) and more likely to be in education. They are also in somewhat better financial circumstances: only 53% are on a low personal income and more are in the MAS ‘Squeezed’ segment, rather than ‘Struggling’. They do manage to save, albeit only sporadically – critically, this means that they do have at least a small buffer: 58% could pay for an unexpected bill of £300 from their own money without cutting back.
This also means they feel they can buy some of the things they want, and this is reflected in their financial goals, as 59% have a goal of some sort, although only 30% overall have plans for how to achieve their goals. They are focused on the shorter term: they are the most likely to be saving, to rent their home and, apart from the Non-Savers, they are the least likely to be saving for retirement. They may also be using credit to help buy what they want: they are the most likely to have used short-term credit and to have a personal loan.
Like the Non-Savers, they are highly likely to be aware of the balance on their current account, while being less likely to perform the checks – such as reviewing receipts or comparing spending – that would help them to manage, rather than simply observe, their money. However, they differ from Non-Savers in that they are more likely to use digital methods of keeping track of their account, such as online banking or mobile apps. Depending on what they can afford, those who have credit cards are the most likely to pay off varying amounts each month, and they are the most likely (80% vs. 49% overall) to save varying amounts each month – this may include saving nothing at all some months. Their methods of saving are appropriate for the smaller amounts they have amassed; savings and current accounts are tax-efficient for small amounts (only 26% have an ISA vs. 36% overall) and they may need instant access to their money rather than investing for the long term (only 2% have invested in stocks and shares vs. 11% overall).
While 68% say they are struggling to keep up with bills, only 26% characterise this as a constant struggle. The financial difficulties that this type experience may be related to their life-stage and may not be permanent. If their income remains the same, they may still build a bigger buffer over time, and if their circumstances change, they may start to save more regularly and/or build up a larger balance.
8
Closing the savings gap – Insights from Money Advice Service research
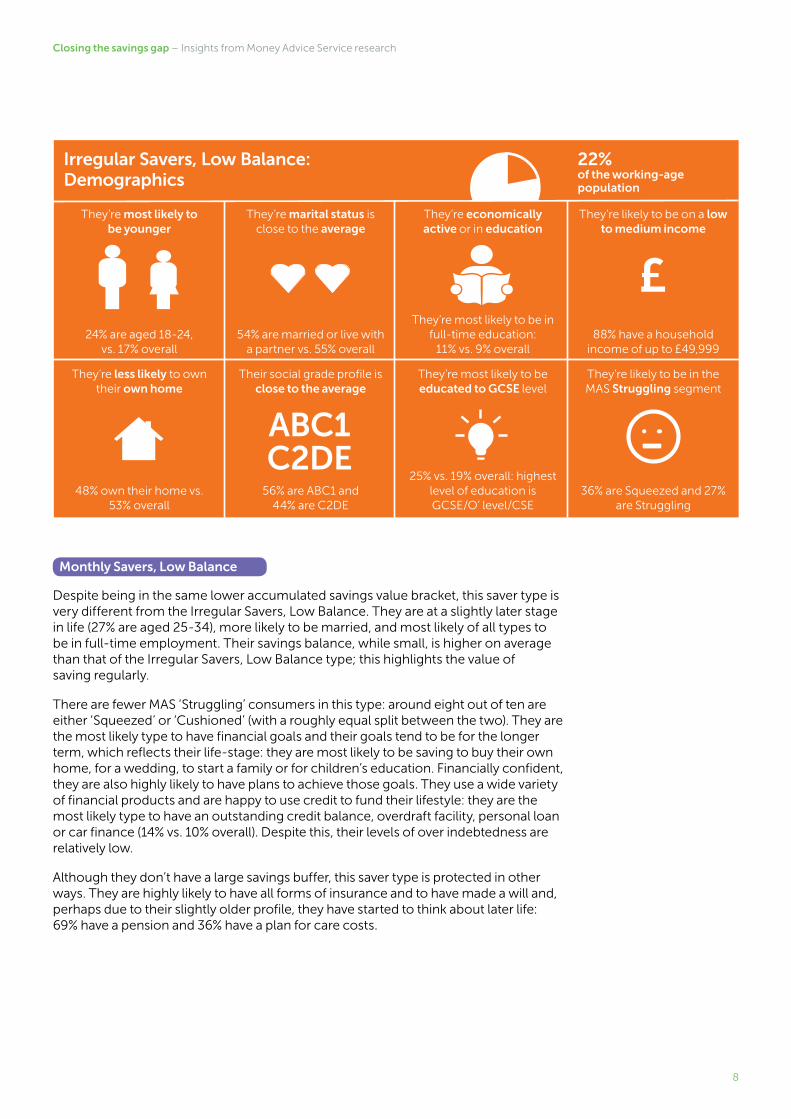
Monthly Savers, Low Balance Monthly Savers, Low BalanceDespite being in the same lower accumulated savings value bracket, this saver type is very different from the Irregular Savers, Low Balance. They are at a slightly later stage in life (27% are aged 25-34), more likely to be married, and most likely of all types to be in full-time employment. Their savings balance, while small, is higher on average than that of the Irregular Savers, Low Balance type; this highlights the value of saving regularly.
There are fewer MAS ‘Struggling’ consumers in this type: around eight out of ten are either ‘Squeezed’ or ‘Cushioned’ (with a roughly equal split between the two). They are the most likely type to have financial goals and their goals tend to be for the longer term, which reflects their life-stage: they are most likely to be saving to buy their own home, for a wedding, to start a family or for children’s education. Financially confident, they are also highly likely to have plans to achieve those goals. They use a wide variety of financial products and are happy to use credit to fund their lifestyle: they are the most likely type to have an outstanding credit balance, overdraft facility, personal loan or car finance (14% vs. 10% overall). Despite this, their levels of over indebtedness are relatively low.
Although they don’t have a large savings buffer, this saver type is protected in other ways. They are highly likely to have all forms of insurance and to have made a will and, perhaps due to their slightly older profile, they have started to think about later life: 69% have a pension and 36% have a plan for care costs.
£
Irregular Savers, Low Balance: Demographics
22%of the working-age population
They’re most likely to be younger
24% are aged 18-24, vs. 17% overall
48% own their home vs. 53% overall
54% are married or live with a partner vs. 55% overall
56% are ABC1 and 44% are C2DE
They’re most likely to be in full-time education:
11% vs. 9% overall
25% vs. 19% overall: highest level of education is GCSE/O’ level/CSE
88% have a household income of up to £49,999
36% are Squeezed and 27% are Struggling
They’re less likely to own their own home
They’re marital status is close to the average
Their social grade profile is close to the average
They’re economically active or in education
They’re most likely to be educated to GCSE level
They’re likely to be on a low to medium income
They’re likely to be in the MAS Struggling segment
ABC1 C2DE
9
Closing the savings gap – Insights from Money Advice Service research
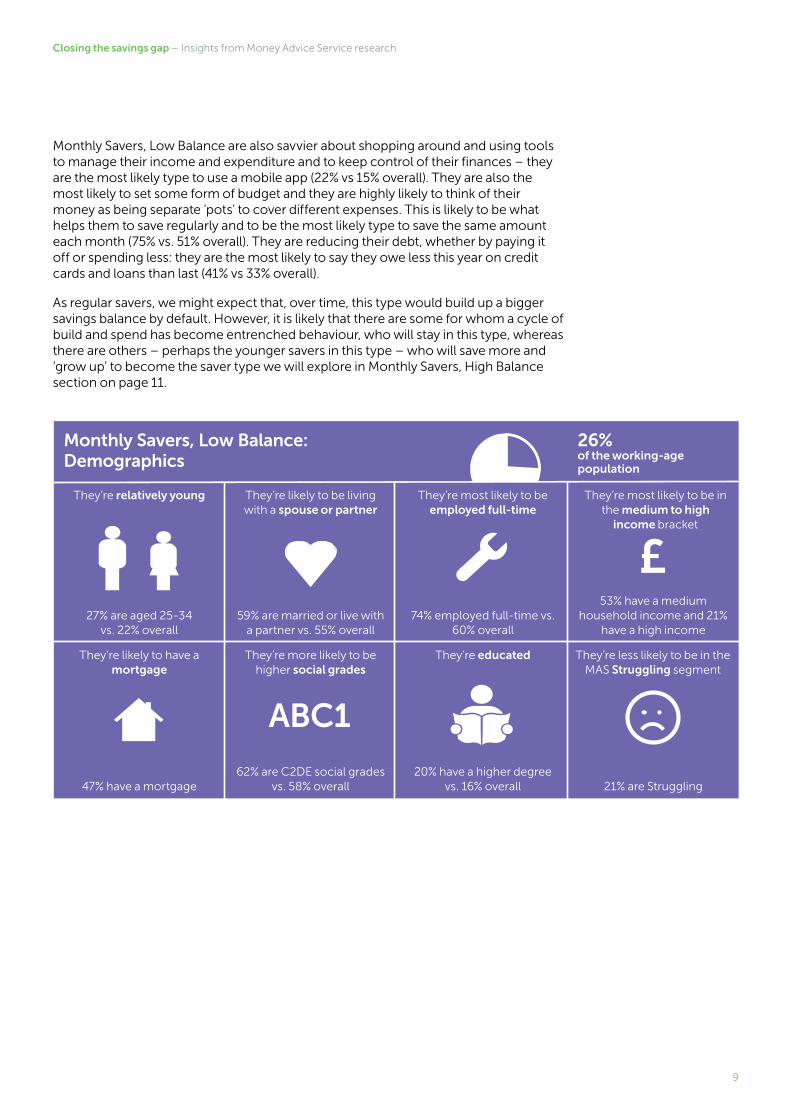
Monthly Savers, Low Balance are also savvier about shopping around and using tools to manage their income and expenditure and to keep control of their finances – they are the most likely type to use a mobile app (22% vs 15% overall). They are also the most likely to set some form of budget and they are highly likely to think of their money as being separate ‘pots’ to cover different expenses. This is likely to be what helps them to save regularly and to be the most likely type to save the same amount each month (75% vs. 51% overall). They are reducing their debt, whether by paying it off or spending less: they are the most likely to say they owe less this year on credit cards and loans than last (41% vs 33% overall).
As regular savers, we might expect that, over time, this type would build up a bigger savings balance by default. However, it is likely that there are some for whom a cycle of build and spend has become entrenched behaviour, who will stay in this type, whereas there are others – perhaps the younger savers in this type – who will save more and ‘grow up’ to become the saver type we will explore in Monthly Savers, High Balance section on page 11.
£
Monthly Savers, Low Balance: Demographics
26%of the working-age population
They’re relatively young
27% are aged 25-34 vs. 22% overall
47% have a mortgage
59% are married or live with a partner vs. 55% overall
62% are C2DE social grades vs. 58% overall
74% employed full-time vs. 60% overall
20% have a higher degree vs. 16% overall
53% have a medium household income and 21%
have a high income
21% are Struggling
They’re likely to have a mortgage
They’re likely to be living with a spouse or partner
They’re more likely to be higher social grades
They’re most likely to be employed full-time
They’re educated
They’re most likely to be in the medium to high
income bracket
They’re less likely to be in the MAS Struggling segment
ABC1
10
Closing the savings gap – Insights from Money Advice Service research
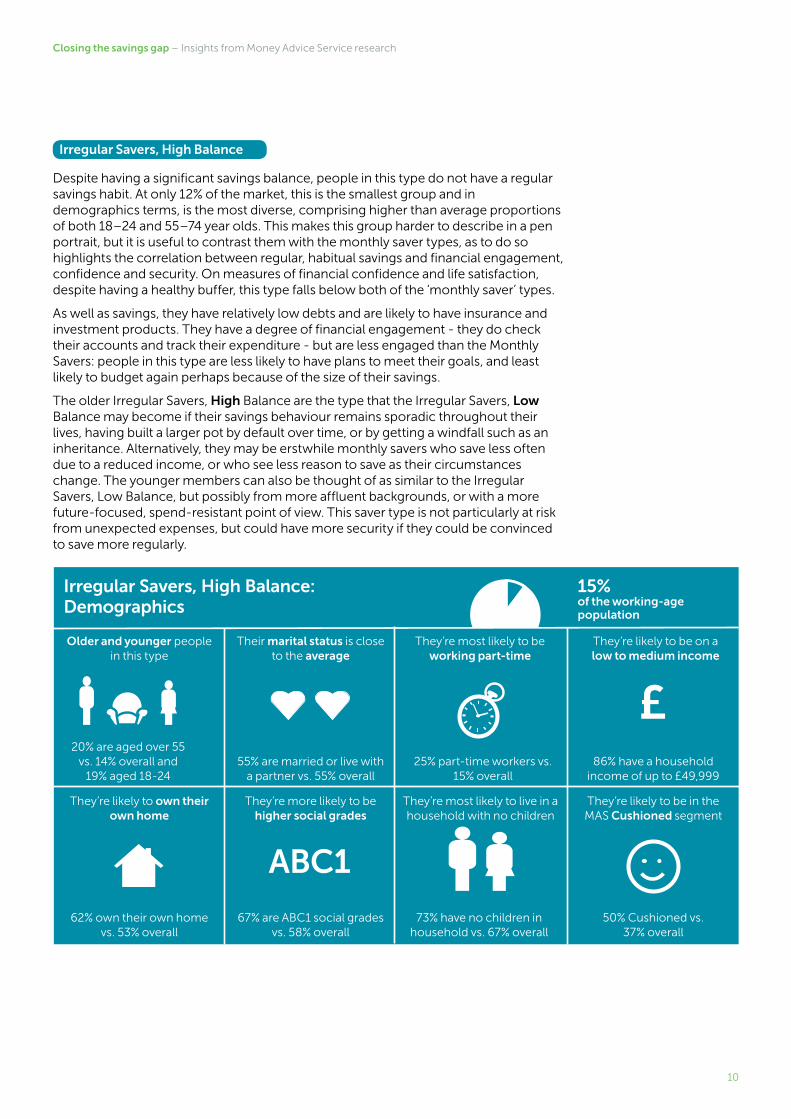
Irregular Savers, High Balance Irregular Savers, High BalanceDespite having a significant savings balance, people in this type do not have a regular savings habit. At only 12% of the market, this is the smallest group and in demographics terms, is the most diverse, comprising higher than average proportions of both 18–24 and 55–74 year olds. This makes this group harder to describe in a pen portrait, but it is useful to contrast them with the monthly saver types, as to do so highlights the correlation between regular, habitual savings and financial engagement, confidence and security. On measures of financial confidence and life satisfaction, despite having a healthy buffer, this type falls below both of the ‘monthly saver’ types.
As well as savings, they have relatively low debts and are likely to have insurance and investment products. They have a degree of financial engagement - they do check their accounts and track their expenditure - but are less engaged than the Monthly Savers: people in this type are less likely to have plans to meet their goals, and least likely to budget again perhaps because of the size of their savings.
The older Irregular Savers, High Balance are the type that the Irregular Savers, Low Balance may become if their savings behaviour remains sporadic throughout their lives, having built a larger pot by default over time, or by getting a windfall such as an inheritance. Alternatively, they may be erstwhile monthly savers who save less often due to a reduced income, or who see less reason to save as their circumstances change. The younger members can also be thought of as similar to the Irregular Savers, Low Balance, but possibly from more affluent backgrounds, or with a more future-focused, spend-resistant point of view. This saver type is not particularly at risk from unexpected expenses, but could have more security if they could be convinced to save more regularly.
£
Irregular Savers, High Balance: Demographics
15%of the working-age population
Older and younger people in this type
20% are aged over 55 vs. 14% overall and
19% aged 18-24
62% own their own home vs. 53% overall
55% are married or live with a partner vs. 55% overall
67% are ABC1 social grades vs. 58% overall
25% part-time workers vs. 15% overall
73% have no children in household vs. 67% overall
86% have a household income of up to £49,999
50% Cushioned vs. 37% overall
They’re likely to own their own home
Their marital status is close to the average
They’re more likely to be higher social grades
They’re most likely to be working part-time
They’re most likely to live in a household with no children
They’re likely to be on a low to medium income
They’re likely to be in the MAS Cushioned segment
ABC1
11
Closing the savings gap – Insights from Money Advice Service research
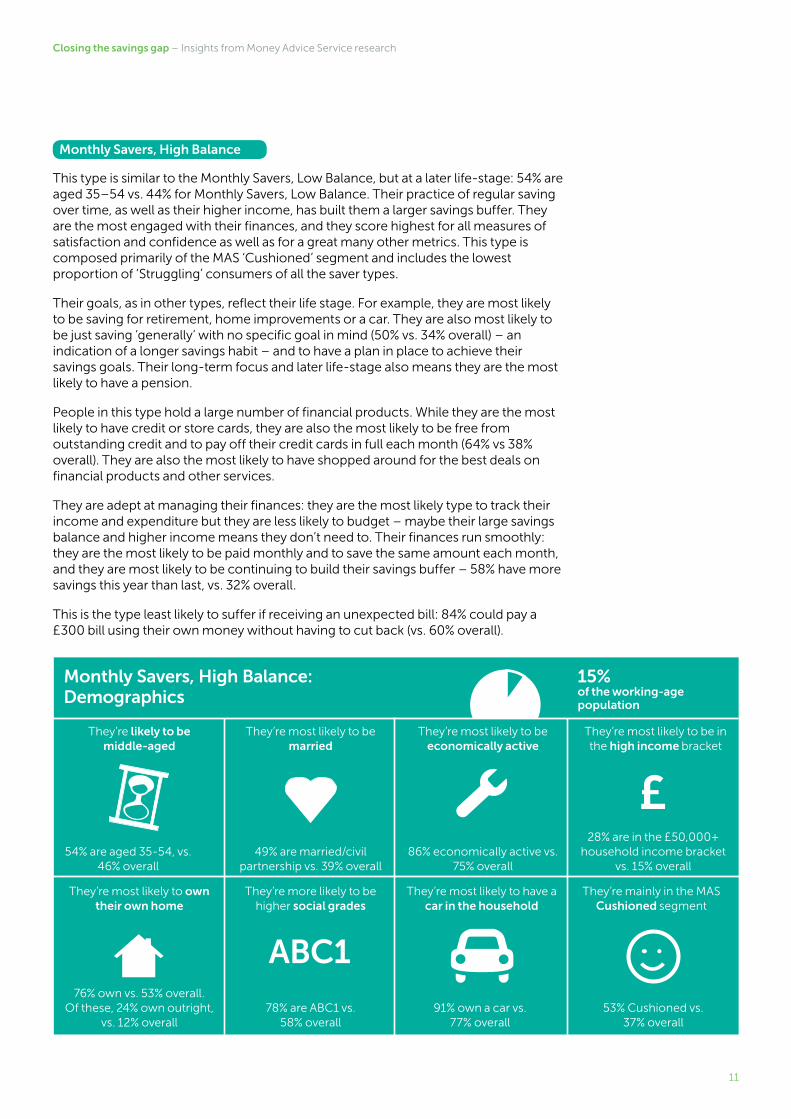
Monthly Savers, High Balance Monthly Savers, High BalanceThis type is similar to the Monthly Savers, Low Balance, but at a later life-stage: 54% are aged 35–54 vs. 44% for Monthly Savers, Low Balance. Their practice of regular saving over time, as well as their higher income, has built them a larger savings buffer. They are the most engaged with their finances, and they score highest for all measures of satisfaction and confidence as well as for a great many other metrics. This type is composed primarily of the MAS ‘Cushioned’ segment and includes the lowest proportion of ‘Struggling’ consumers of all the saver types.
Their goals, as in other types, reflect their life stage. For example, they are most likely to be saving for retirement, home improvements or a car. They are also most likely to be just saving ‘generally’ with no specific goal in mind (50% vs. 34% overall) – an indication of a longer savings habit – and to have a plan in place to achieve their savings goals. Their long-term focus and later life-stage also means they are the most likely to have a pension.
People in this type hold a large number of financial products. While they are the most likely to have credit or store cards, they are also the most likely to be free from outstanding credit and to pay off their credit cards in full each month (64% vs 38% overall). They are also the most likely to have shopped around for the best deals on financial products and other services.
They are adept at managing their finances: they are the most likely type to track their income and expenditure but they are less likely to budget – maybe their large savings balance and higher income means they don’t need to. Their finances run smoothly: they are the most likely to be paid monthly and to save the same amount each month, and they are most likely to be continuing to build their savings buffer – 58% have more savings this year than last, vs. 32% overall.
This is the type least likely to suffer if receiving an unexpected bill: 84% could pay a £300 bill using their own money without having to cut back (vs. 60% overall).
£
Monthly Savers, High Balance: Demographics
15%of the working-age population
They’re likely to be middle-aged
54% are aged 35-54, vs. 46% overall
76% own vs. 53% overall. Of these, 24% own outright,
vs. 12% overall
49% are married/civil partnership vs. 39% overall
78% are ABC1 vs. 58% overall
86% economically active vs. 75% overall
91% own a car vs. 77% overall
28% are in the £50,000+ household income bracket
vs. 15% overall
53% Cushioned vs. 37% overall
They’re most likely to own their own home
They’re most likely to be married
They’re more likely to be higher social grades
They’re most likely to be economically active
They’re most likely to have a car in the household
They’re most likely to be in the high income bracket
They’re mainly in the MAS Cushioned segment
ABC1
12
Closing the savings gap – Insights from Money Advice Service research
The three ‘S’s of saving: Situation, Skills and StanceA key driver of savings behaviour is the situation that people find themselves in: their income, age or life-stage. Broadly speaking, higher savings are associated with a higher income and an older demographic. However there are younger people on low incomes who do save and older people on high incomes who don’t, so it follows that there are other factors involved.
From our analysis of the saver types we suggest that saver behaviour is a function of not just situation, but also skills (how engaged people are with their finances, and how well they are equipped to manage them) and stance (attitudes, feelings and beliefs). These are the three ‘S’s of saving.
The charts in this section show all five saver types so they can be easily compared.
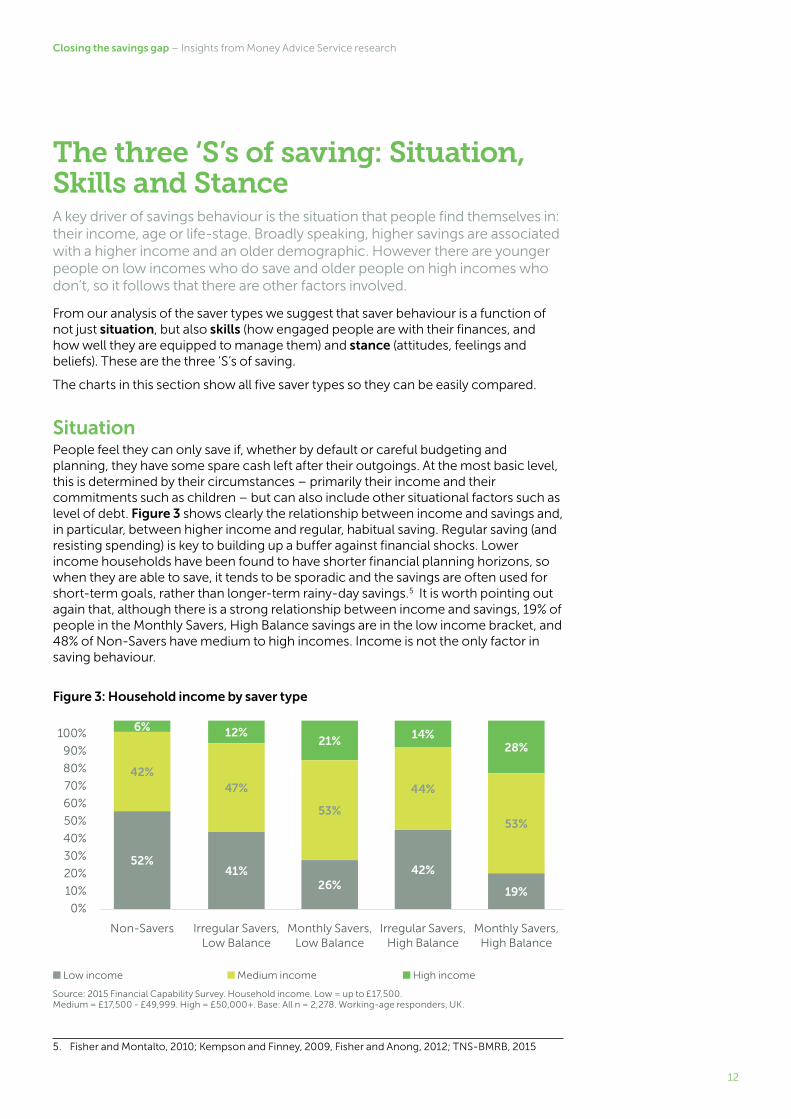
SituationPeople feel they can only save if, whether by default or careful budgeting and planning, they have some spare cash left after their outgoings. At the most basic level, this is determined by their circumstances – primarily their income and their commitments such as children – but can also include other situational factors such as level of debt. Figure 3 shows clearly the relationship between income and savings and, in particular, between higher income and regular, habitual saving. Regular saving (and resisting spending) is key to building up a buffer against financial shocks. Lower income households have been found to have shorter financial planning horizons, so when they are able to save, it tends to be sporadic and the savings are often used for short-term goals, rather than longer-term rainy-day savings.5 It is worth pointing out again that, although there is a strong relationship between income and savings, 19% of people in the Monthly Savers, High Balance savings are in the low income bracket, and 48% of Non-Savers have medium to high incomes. Income is not the only factor in saving behaviour.
Figure 3: Household income by saver type
5. Fisher and Montalto, 2010; Kempson and Finney, 2009, Fisher and Anong, 2012; TNS-BMRB, 2015
52%
42%
6% 12%
47%
41%
21%
53%
26%
14%
44%
42%
28%
53%
19%
100%
90%
80%
70%
60%
50%
40%
30%
20%
10%
0%
Non-Savers Irregular Savers, Low Balance
Monthly Savers, Low Balance
Irregular Savers, High Balance
Monthly Savers, High Balance
■ Low income ■ Medium income ■ High income
Source: 2015 Financial Capability Survey. Household income. Low = up to £17,500. Medium = £17,500 - £49,999. High = £50,000+. Base: All n = 2,278. Working-age responders, UK.
13
Closing the savings gap – Insights from Money Advice Service research
While the proportion of households actively saving does not vary much by age, the amount saved does. The amount actively saved by households is lowest among younger and retired households and is highest among households aged 45 to 65.6 Life-stage also has an impact: events such as getting married or having a child can change how people feel about savings, turning non-savers into savers or irregular savers into frequent savers.7
However, while life-stage can have a positive impact on ‘stance’ it can also have a negative impact on ‘situation’: the expense associated with such life events – in particular with having a child – can make it harder to save, in particular for those in the ‘Struggling’ or ‘Squeezed’ segments. All savings types are equally likely (33% overall) to have children in the household, apart from the Irregular Savers, High Balance (27%).
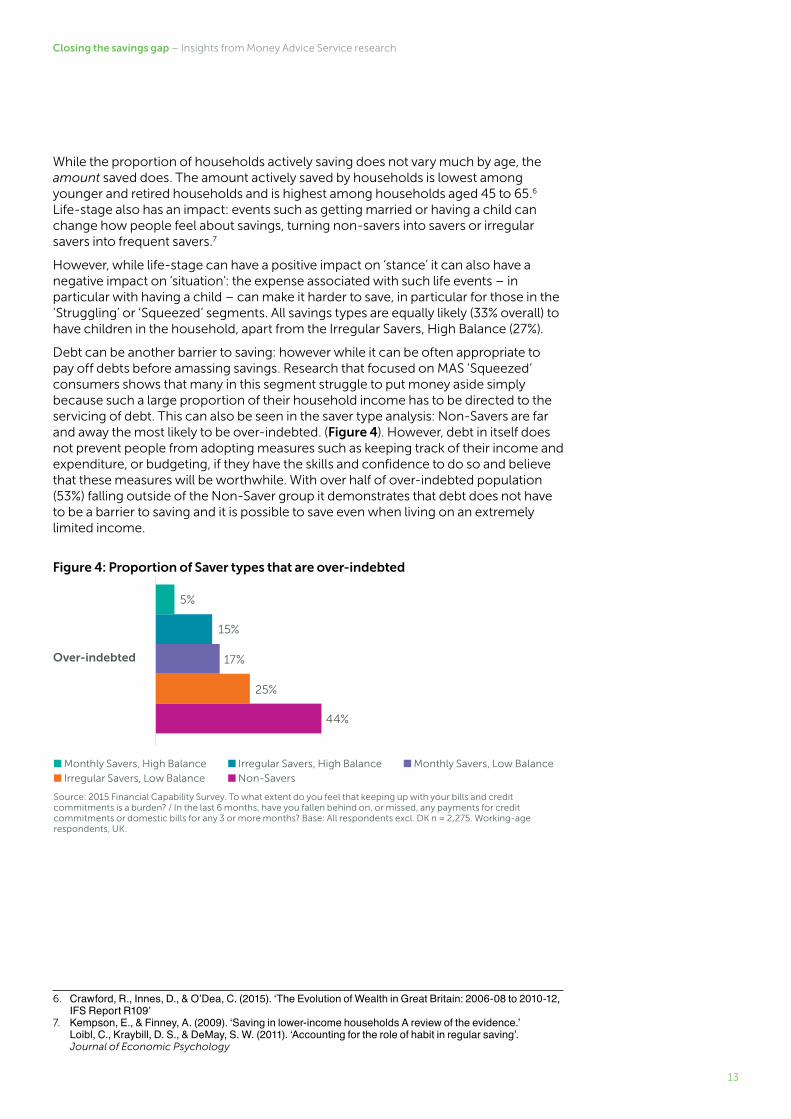
Debt can be another barrier to saving: however while it can be often appropriate to pay off debts before amassing savings. Research that focused on MAS ‘Squeezed’ consumers shows that many in this segment struggle to put money aside simply because such a large proportion of their household income has to be directed to the servicing of debt. This can also be seen in the saver type analysis: Non-Savers are far and away the most likely to be over-indebted. (Figure 4). However, debt in itself does not prevent people from adopting measures such as keeping track of their income and expenditure, or budgeting, if they have the skills and confidence to do so and believe that these measures will be worthwhile. With over half of over-indebted population (53%) falling outside of the Non-Saver group it demonstrates that debt does not have to be a barrier to saving and it is possible to save even when living on an extremely limited income.
Figure 4: Proportion of Saver types that are over-indebted
6. Crawford, R., Innes, D., & O’Dea, C. (2015). ‘The Evolution of Wealth in Great Britain: 2006-08 to 2010-12, IFS Report R109’
7. Kempson, E., & Finney, A. (2009). ‘Saving in lower-income households A review of the evidence.’ Loibl, C., Kraybill, D. S., & DeMay, S. W. (2011). ‘Accounting for the role of habit in regular saving’.
Journal of Economic Psychology
■ Monthly Savers, High Balance ■ Irregular Savers, High Balance ■ Monthly Savers, Low Balance
■ Irregular Savers, Low Balance ■ Non-Savers
Source: 2015 Financial Capability Survey. To what extent do you feel that keeping up with your bills and credit commitments is a burden? / In the last 6 months, have you fallen behind on, or missed, any payments for credit commitments or domestic bills for any 3 or more months? Base: All respondents excl. DK n = 2,275. Working-age respondents, UK.
Over-indebted
5%
15%
17%
25%
44%
14
Closing the savings gap – Insights from Money Advice Service research
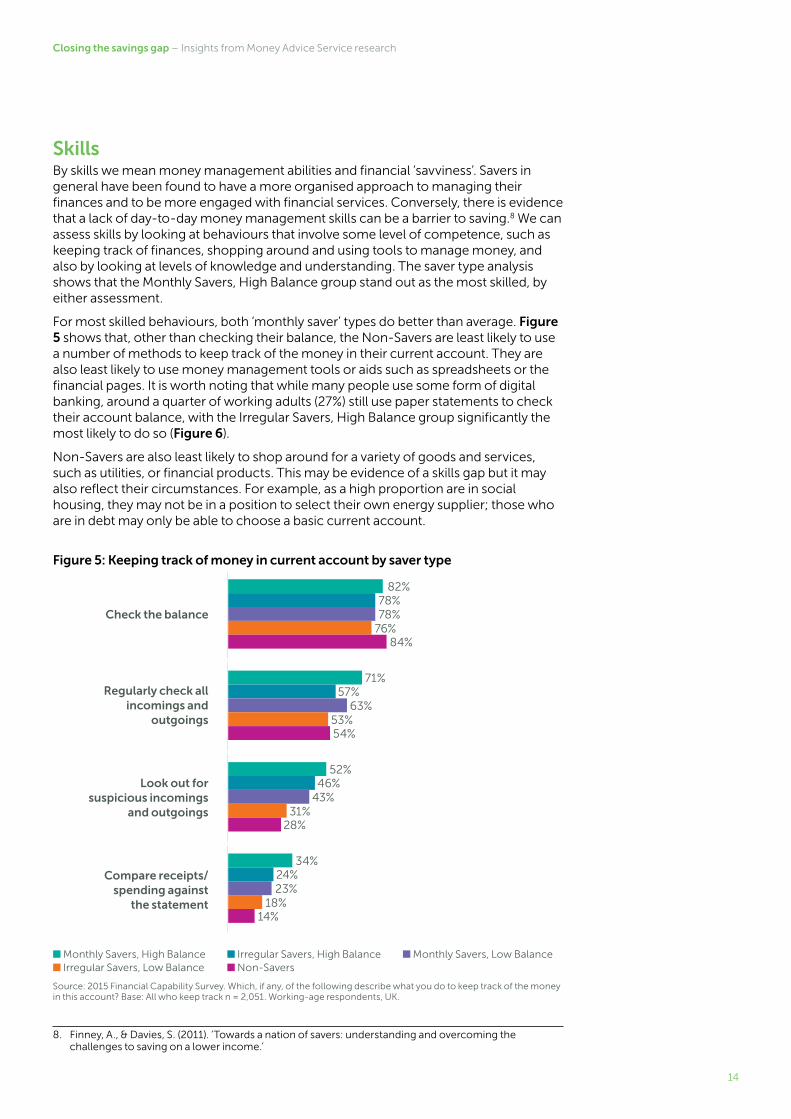
SkillsBy skills we mean money management abilities and financial ‘savviness’. Savers in general have been found to have a more organised approach to managing their finances and to be more engaged with financial services. Conversely, there is evidence that a lack of day-to-day money management skills can be a barrier to saving.8 We can assess skills by looking at behaviours that involve some level of competence, such as keeping track of finances, shopping around and using tools to manage money, and also by looking at levels of knowledge and understanding. The saver type analysis shows that the Monthly Savers, High Balance group stand out as the most skilled, by either assessment.
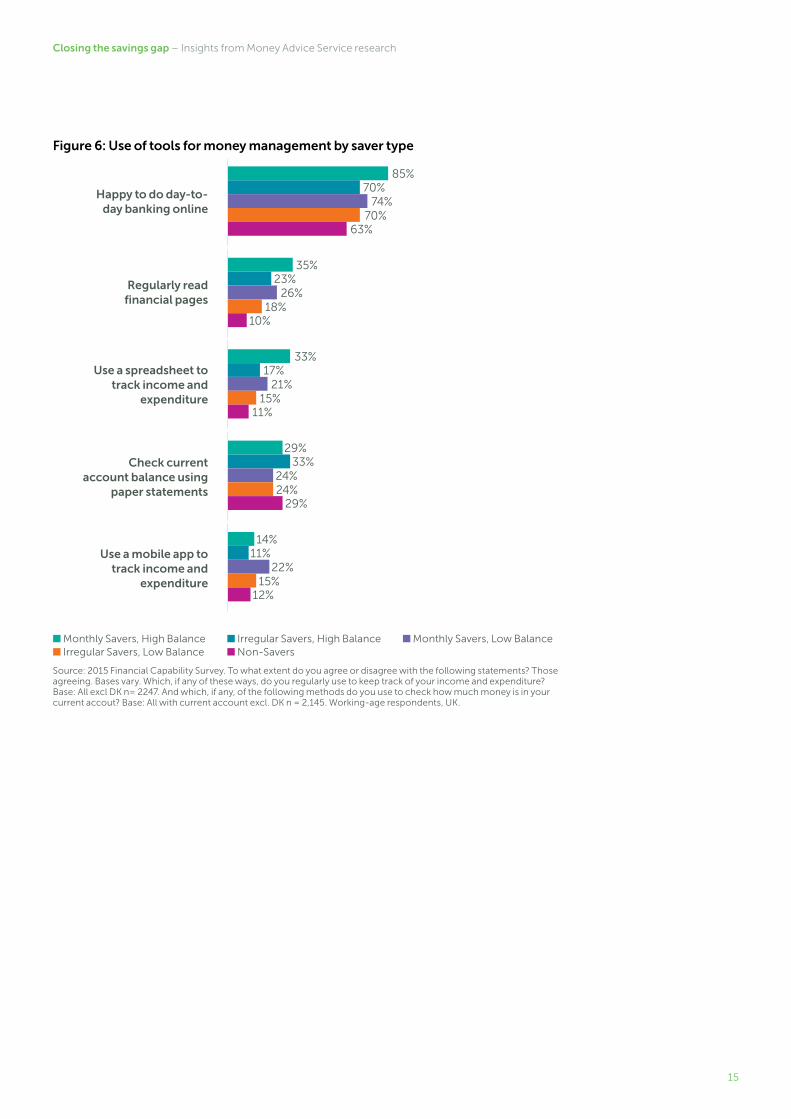
For most skilled behaviours, both ‘monthly saver’ types do better than average. Figure 5 shows that, other than checking their balance, the Non-Savers are least likely to use a number of methods to keep track of the money in their current account. They are also least likely to use money management tools or aids such as spreadsheets or the financial pages. It is worth noting that while many people use some form of digital banking, around a quarter of working adults (27%) still use paper statements to check their account balance, with the Irregular Savers, High Balance group significantly the most likely to do so (Figure 6).
Non-Savers are also least likely to shop around for a variety of goods and services, such as utilities, or financial products. This may be evidence of a skills gap but it may also reflect their circumstances. For example, as a high proportion are in social housing, they may not be in a position to select their own energy supplier; those who are in debt may only be able to choose a basic current account.
Figure 5: Keeping track of money in current account by saver type
■ Monthly Savers, High Balance ■ Irregular Savers, High Balance ■ Monthly Savers, Low Balance ■ Irregular Savers, Low Balance ■ Non-Savers
Source: 2015 Financial Capability Survey. Which, if any, of the following describe what you do to keep track of the money in this account? Base: All who keep track n = 2,051. Working-age respondents, UK.
8. Finney, A., & Davies, S. (2011). ‘Towards a nation of savers: understanding and overcoming the challenges to saving on a lower income.’
Check the balance
82%78%78%
76%84%
Regularly check all incomings and
outgoings
71%57%
63%53%54%
52%46%
43%31%
28%
Look out for suspicious incomings
and outgoings
34%24%23%
18%14%
Compare receipts/ spending against
the statement
15
Closing the savings gap – Insights from Money Advice Service research
Figure 6: Use of tools for money management by saver type
■ Monthly Savers, High Balance ■ Irregular Savers, High Balance ■ Monthly Savers, Low Balance ■ Irregular Savers, Low Balance ■ Non-Savers
Source: 2015 Financial Capability Survey. To what extent do you agree or disagree with the following statements? Those agreeing. Bases vary. Which, if any of these ways, do you regularly use to keep track of your income and expenditure? Base: All excl DK n= 2247. And which, if any, of the following methods do you use to check how much money is in your current accout? Base: All with current account excl. DK n = 2,145. Working-age respondents, UK.
Happy to do day-to-day banking online
85%70%
74%70%
63%
Regularly read financial pages
35%23%
26%18%
10%
33%17%
21%15%
11%
Use a spreadsheet to track income and
expenditure
29%33%
24%24%
29%
Check current account balance using
paper statements
14%11%
22%15%
12%
Use a mobile app to track income and
expenditure
16
Closing the savings gap – Insights from Money Advice Service research
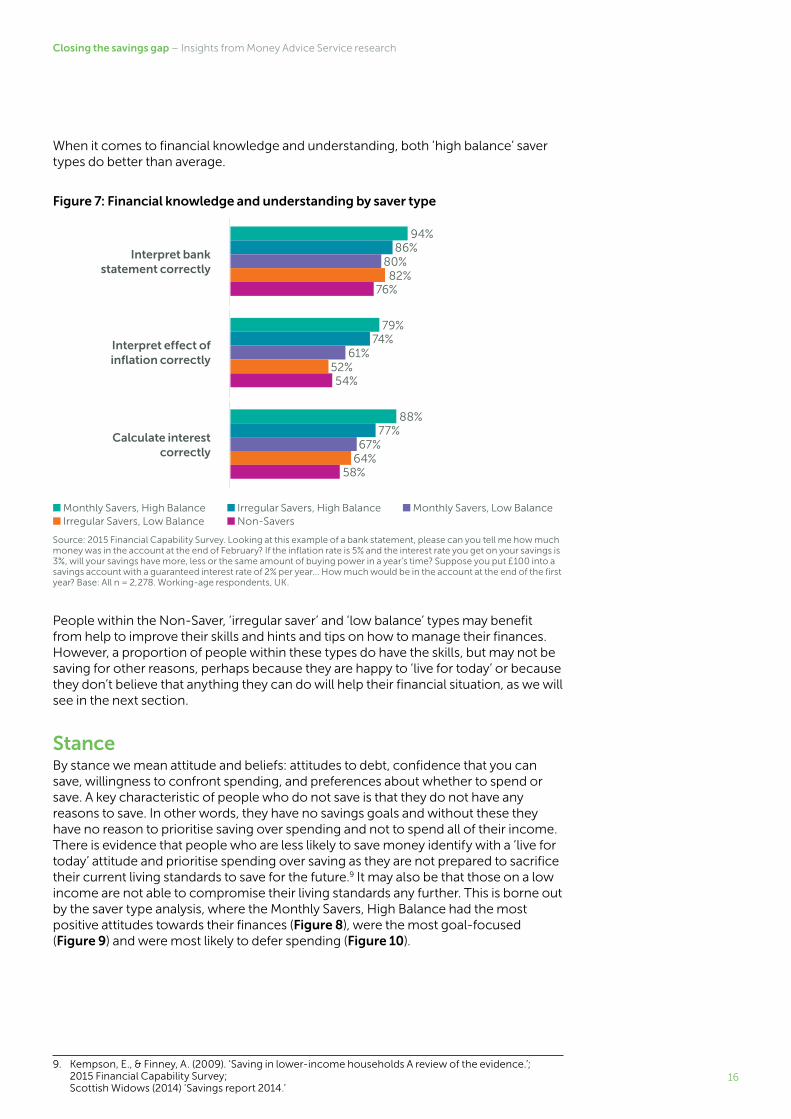
When it comes to financial knowledge and understanding, both ‘high balance’ saver types do better than average.
Figure 7: Financial knowledge and understanding by saver type
■ Monthly Savers, High Balance ■ Irregular Savers, High Balance ■ Monthly Savers, Low Balance ■ Irregular Savers, Low Balance ■ Non-Savers
Source: 2015 Financial Capability Survey. Looking at this example of a bank statement, please can you tell me how much money was in the account at the end of February? If the inflation rate is 5% and the interest rate you get on your savings is 3%, will your savings have more, less or the same amount of buying power in a year’s time? Suppose you put £100 into a savings account with a guaranteed interest rate of 2% per year... How much would be in the account at the end of the first year? Base: All n = 2,278. Working-age respondents, UK.
People within the Non-Saver, ‘irregular saver’ and ‘low balance’ types may benefit from help to improve their skills and hints and tips on how to manage their finances. However, a proportion of people within these types do have the skills, but may not be saving for other reasons, perhaps because they are happy to ‘live for today’ or because they don’t believe that anything they can do will help their financial situation, as we will see in the next section.
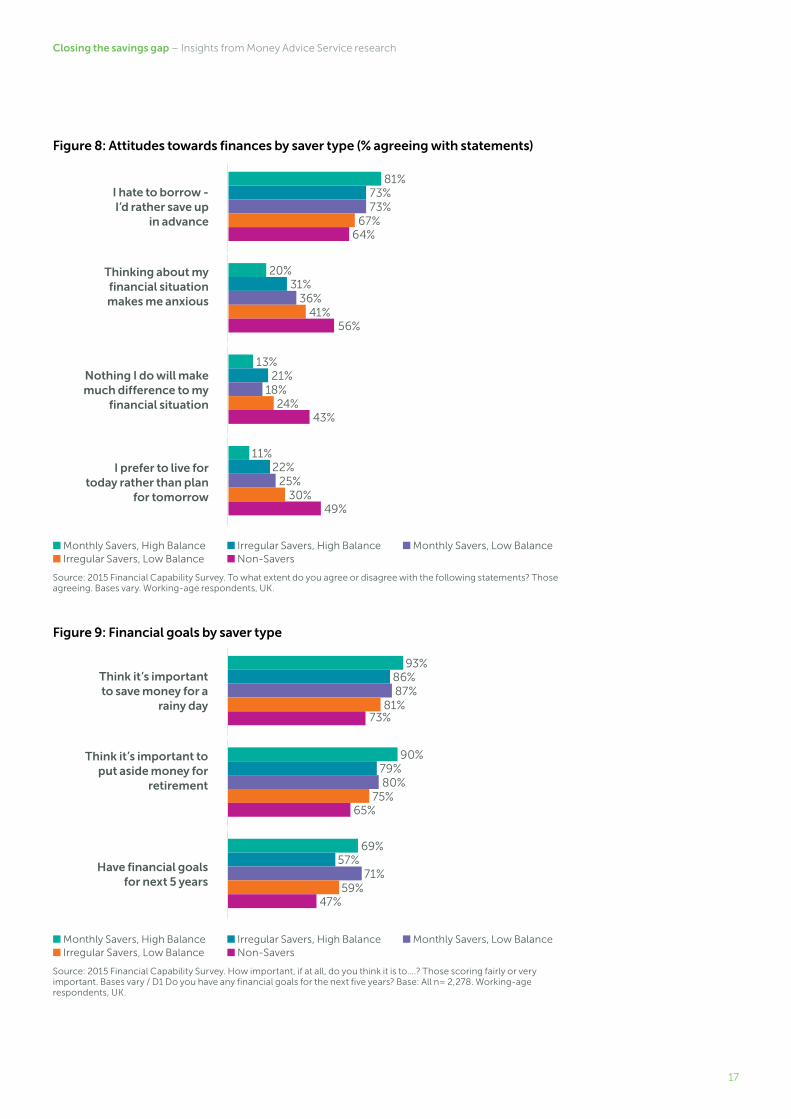
StanceBy stance we mean attitude and beliefs: attitudes to debt, confidence that you can save, willingness to confront spending, and preferences about whether to spend or save. A key characteristic of people who do not save is that they do not have any reasons to save. In other words, they have no savings goals and without these they have no reason to prioritise saving over spending and not to spend all of their income. There is evidence that people who are less likely to save money identify with a ‘live for today’ attitude and prioritise spending over saving as they are not prepared to sacrifice their current living standards to save for the future.9 It may also be that those on a low income are not able to compromise their living standards any further. This is borne out by the saver type analysis, where the Monthly Savers, High Balance had the most positive attitudes towards their finances (Figure 8), were the most goal-focused (Figure 9) and were most likely to defer spending (Figure 10).
9. Kempson, E., & Finney, A. (2009). ‘Saving in lower-income households A review of the evidence.’; 2015 Financial Capability Survey; Scottish Widows (2014) ‘Savings report 2014.’
Interpret bank statement correctly
94%86%
80%82%
76%
Interpret effect of inflation correctly
79%74%
61%52%54%
88%77%
67%64%
58%
Calculate interest correctly
17
Closing the savings gap – Insights from Money Advice Service research
Figure 8: Attitudes towards finances by saver type (% agreeing with statements)
■ Monthly Savers, High Balance ■ Irregular Savers, High Balance ■ Monthly Savers, Low Balance ■ Irregular Savers, Low Balance ■ Non-Savers
Source: 2015 Financial Capability Survey. To what extent do you agree or disagree with the following statements? Those agreeing. Bases vary. Working-age respondents, UK.
Figure 9: Financial goals by saver type
■ Monthly Savers, High Balance ■ Irregular Savers, High Balance ■ Monthly Savers, Low Balance ■ Irregular Savers, Low Balance ■ Non-Savers
Source: 2015 Financial Capability Survey. How important, if at all, do you think it is to….? Those scoring fairly or very important. Bases vary / D1 Do you have any financial goals for the next five years? Base: All n= 2,278. Working-age respondents, UK.
I hate to borrow - I’d rather save up
in advance
81%73%73%
67%64%
Thinking about my financial situation makes me anxious
20%31%
36%41%
56%
13%21%
18%24%
43%
Nothing I do will make much difference to my
financial situation
11%22%
25%30%
49%
I prefer to live for today rather than plan
for tomorrow
Think it’s important to save money for a
rainy day
93%86%87%
81%73%
Think it’s important to put aside money for
retirement
90%79%80%
75%65%
69%57%
71%59%
47%
Have financial goals for next 5 years
18
Closing the savings gap – Insights from Money Advice Service research
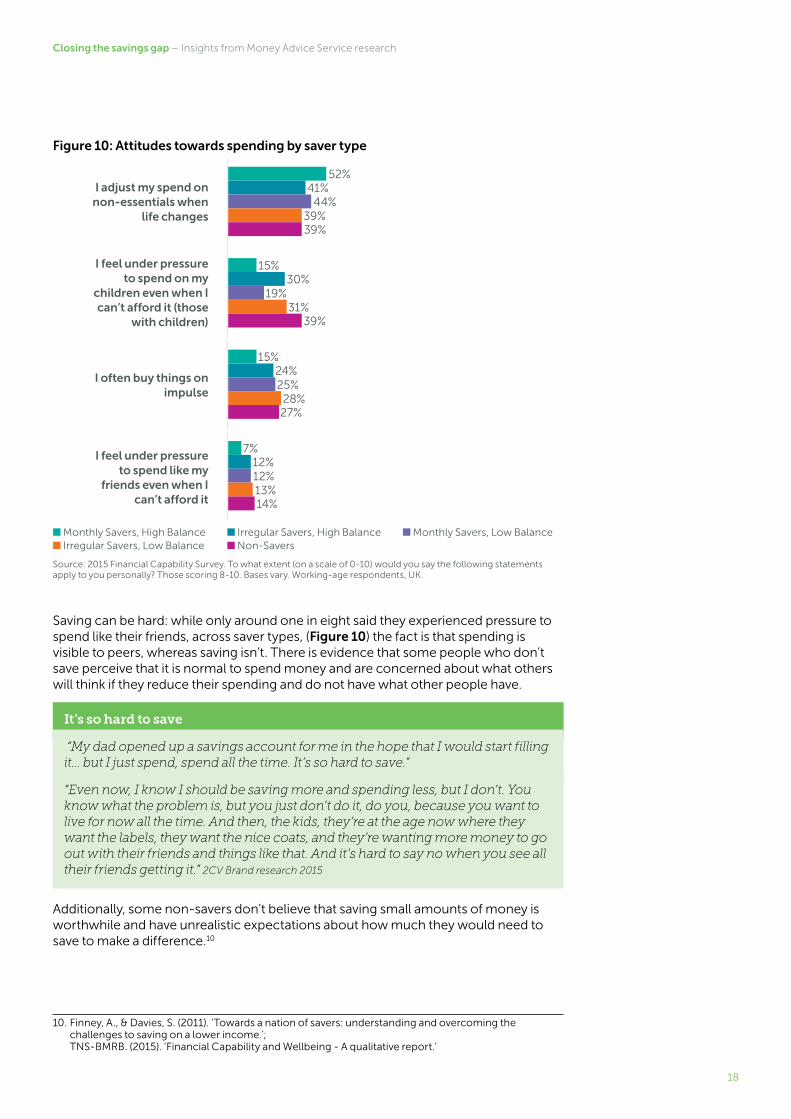
Figure 10: Attitudes towards spending by saver type
■ Monthly Savers, High Balance ■ Irregular Savers, High Balance ■ Monthly Savers, Low Balance ■ Irregular Savers, Low Balance ■ Non-Savers
Source: 2015 Financial Capability Survey. To what extent (on a scale of 0-10) would you say the following statements apply to you personally? Those scoring 8-10. Bases vary. Working-age respondents, UK.
Saving can be hard: while only around one in eight said they experienced pressure to spend like their friends, across saver types, (Figure 10) the fact is that spending is visible to peers, whereas saving isn’t. There is evidence that some people who don’t save perceive that it is normal to spend money and are concerned about what others will think if they reduce their spending and do not have what other people have.
It’s so hard to save
“My dad opened up a savings account for me in the hope that I would start filling it… but I just spend, spend all the time. It’s so hard to save.”
“Even now, I know I should be saving more and spending less, but I don’t. You know what the problem is, but you just don’t do it, do you, because you want to live for now all the time. And then, the kids, they’re at the age now where they want the labels, they want the nice coats, and they’re wanting more money to go out with their friends and things like that. And it’s hard to say no when you see all their friends getting it.” 2CV Brand research 2015
Additionally, some non-savers don’t believe that saving small amounts of money is worthwhile and have unrealistic expectations about how much they would need to save to make a difference.10
10. Finney, A., & Davies, S. (2011). ‘Towards a nation of savers: understanding and overcoming the challenges to saving on a lower income.’; TNS-BMRB. (2015). ‘Financial Capability and Wellbeing - A qualitative report.’
I adjust my spend on non-essentials when
life changes
52%41%44%
39%39%
I feel under pressure to spend on my
children even when I can’t afford it (those
with children)
15%30%
19%31%
39%
15%24%25%28%27%
I often buy things on impulse
7%12%12%13%14%
I feel under pressure to spend like my
friends even when I can’t afford it
19
Closing the savings gap – Insights from Money Advice Service research
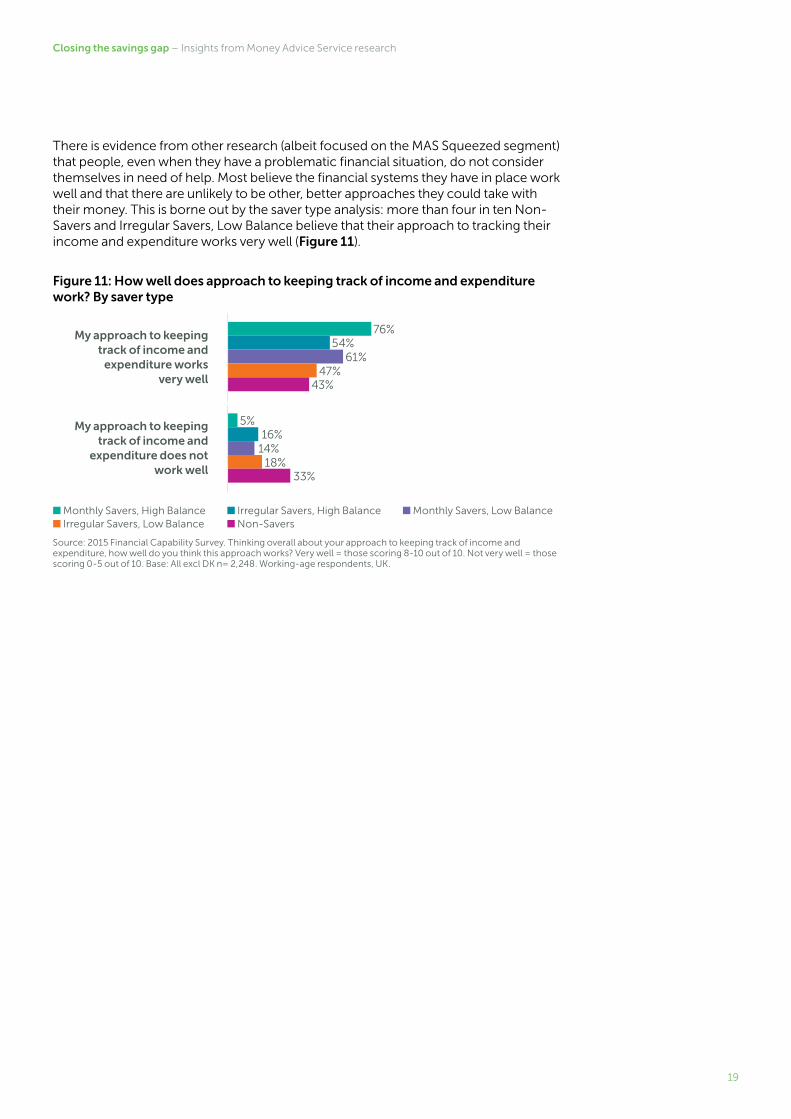
There is evidence from other research (albeit focused on the MAS Squeezed segment) that people, even when they have a problematic financial situation, do not consider themselves in need of help. Most believe the financial systems they have in place work well and that there are unlikely to be other, better approaches they could take with their money. This is borne out by the saver type analysis: more than four in ten Non-Savers and Irregular Savers, Low Balance believe that their approach to tracking their income and expenditure works very well (Figure 11).
Figure 11: How well does approach to keeping track of income and expenditure work? By saver type
■ Monthly Savers, High Balance ■ Irregular Savers, High Balance ■ Monthly Savers, Low Balance ■ Irregular Savers, Low Balance ■ Non-Savers
Source: 2015 Financial Capability Survey. Thinking overall about your approach to keeping track of income and expenditure, how well do you think this approach works? Very well = those scoring 8-10 out of 10. Not very well = those scoring 0-5 out of 10. Base: All excl DK n= 2,248. Working-age respondents, UK.
My approach to keeping track of income and
expenditure works very well
76%54%
61%47%
43%
My approach to keeping track of income and
expenditure does not work well
5%16%
14%18%
33%
20
Closing the savings gap – Insights from Money Advice Service research
Bridging the gap: Encouraging people to saveSo what changes saving behaviour? Often, people are stuck with their situation, but if you can change their skills, their stance, or both, it may be possible to encourage them to save.
We wanted to find out how people would respond if we challenged them to save so we conducted a savings experiment.
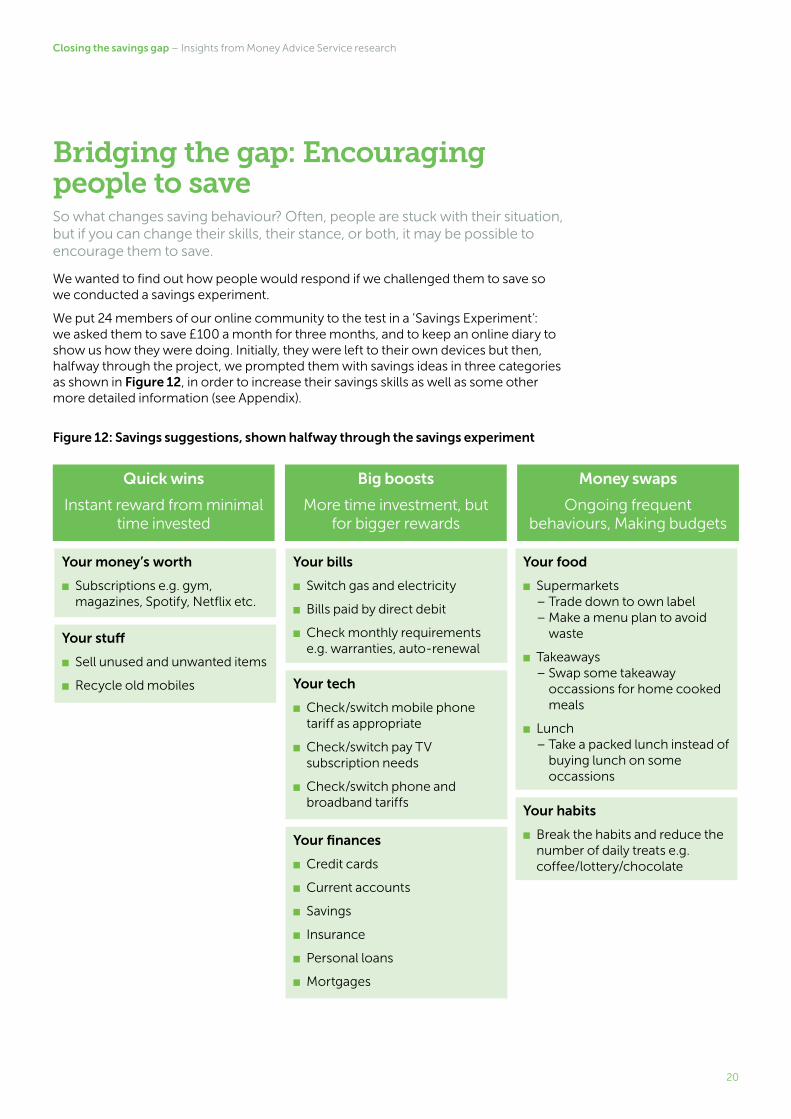
We put 24 members of our online community to the test in a ‘Savings Experiment’: we asked them to save £100 a month for three months, and to keep an online diary to show us how they were doing. Initially, they were left to their own devices but then, halfway through the project, we prompted them with savings ideas in three categories as shown in Figure 12, in order to increase their savings skills as well as some other more detailed information (see Appendix).
Figure 12: Savings suggestions, shown halfway through the savings experiment
Your bills
■ Switch gas and electricity
■ Bills paid by direct debit
■ Check monthly requirements e.g. warranties, auto-renewal
Your tech
■ Check/switch mobile phone tariff as appropriate
■ Check/switch pay TV subscription needs
■ Check/switch phone and broadband tariffs
Your finances
■ Credit cards
■ Current accounts
■ Savings
■ Insurance
■ Personal loans
■ Mortgages
Your food
■ Supermarkets – Trade down to own label – Make a menu plan to avoid
waste
■ Takeaways – Swap some takeaway
occassions for home cooked meals
■ Lunch – Take a packed lunch instead of
buying lunch on some occassions
Your habits
■ Break the habits and reduce the number of daily treats e.g. coffee/lottery/chocolate
Your money’s worth
■ Subscriptions e.g. gym, magazines, Spotify, Netflix etc.
Your stuff
■ Sell unused and unwanted items
■ Recycle old mobiles
Quick wins
Instant reward from minimal time invested
Big boosts
More time investment, but for bigger rewards
Money swaps
Ongoing frequent behaviours, Making budgets
21
Closing the savings gap – Insights from Money Advice Service research
What was remarkable about this project was not just that it was successful – everyone saved at least something and many saved more than the target – but also the positive impact that it had on participants’ financial skills and, in particular, on their stance. People who had been convinced that they would not be able to save found that they were able to after all, and that it made a substantial difference to their wellbeing and financial health. Some even described the project as life-changing.
Quotes in this section are taken from diaries (or in some cases from subsequent interviews) and are in the participants’ own words. Participants are identified only by their gender, age-group and whether they have children living in the household.
The project even worked for those paying off debts proving that over-indebtedness doesn’t always have to be a barrier to saving.
What was also remarkable was that the savings habits established over the three months of the experiment were maintained. When we revisited the participants three to four months after the end of the experiment, most had continued to save, albeit to varying degrees. The savings experiment was a qualitative project based on a small sample of people, so we commissioned a further piece of work to quantify some of the findings, and data from that project (Savings Propensity Research) is included in this section too, as is evidence from other secondary research.
“I didn’t think we could save, I thought we’d tightened our belt as much as we could and I didn’t think we could do it but its opened my eyes in a big way, me, my husband and even my children, it’s been life-changing.” (F, 35–44, Children)
“With the money I have actually booked a holiday for my daughter, I am taking her to Butlin’s next year and it has also taken care of Christmas. The reason I have done that is that I won’t get into debt - everyone will have a fantastic Christmas and I will not be stressing that I have got myself into debt. Then I know I can save that amount again within 3 months.” (F, 35–44, Children)
“We are in some debt on our credit cards and we are 2 years into a 3 year loan.. It hasn’t really affected the challenge as we have just been paying what we would normally pay - the loan payment is fixed as is the credit cards.” (F, 35–44, Children)
“I arranged an IVA (Individual Voluntary Arrangement to pay back debt) in 2003, I am currently paying £100 a month. I do think it is better to save now as I just pay the amount to the IVA and then can save anything else.” (M, 35-44, Children)
22
Closing the savings gap – Insights from Money Advice Service research
The EAST model explains four simple ways to apply behavioural insights. If we review the savings experiment with this framework in mind, we can start to see why the challenge was successful.
The EAST framework for behaviour change
Public policy frequently seeks to change behaviour. While legislation is a good way of effecting change, governments also use ‘softer’ methods such as providing incentives and information, which are intended to change behaviour by ‘changing minds’. The idea is that if we provide the carrots and sticks, alongside accurate information, people will weigh up the revised costs and benefits of their actions and respond accordingly. Unfortunately, evidence suggests that people do not always respond in this ‘perfectly rational’ way. In contrast, approaches based on ‘changing contexts’ – the environment within which we make decisions and respond to cues – have the potential to bring about significant changes in behaviour at relatively low cost.
EAST is a simple mnemonic that encapsulates four basic principles for applying behavioural insights: If you want to encourage a behaviour, make it Easy, Attractive, Social and Timely.11
1. Make it Easy – Harness the power of defaults; reduce the ‘hassle factor’ of taking up a service; simplify messages.
2. Make it Attractive – Attract attention; design rewards and sanctions for maximum effect.
3. Make it social – Show that most people perform the desired behaviour; use the power of networks; encourage people to make a commitment to others.
4. Make it timely – Prompt people when they are likely to be most receptive; consider the immediate costs and benefits; help people plan their response to events.
Success factorsBased on these sources of evidence, we suggest that there are a number of success factors that will help to change saving behaviour. Some of these worked by improving skills, by giving participants information about how to save, and encouraging them to take control. However most of these worked, according to the EAST framework, by changing the environment in which participants made their decisions, to have a positive effect on stance: increasing their self-belief, and giving them tangible evidence not only of the power of a savings habit but also of the importance of having a buffer against the vagaries of life.
A push to get started Participants in the Savings Experiment would not otherwise have been saving, and spoke about needing an incentive to get started. In some cases, participants have been avoiding thinking about their finances. For others, starting the challenge was all they needed to make a conscious effort to improve their financial capabilities.
11. http://www.behaviouralinsights.co.uk/publications/east-four-simple-ways-to-apply-behavioural-insights/
23
Closing the savings gap – Insights from Money Advice Service research
Why it works
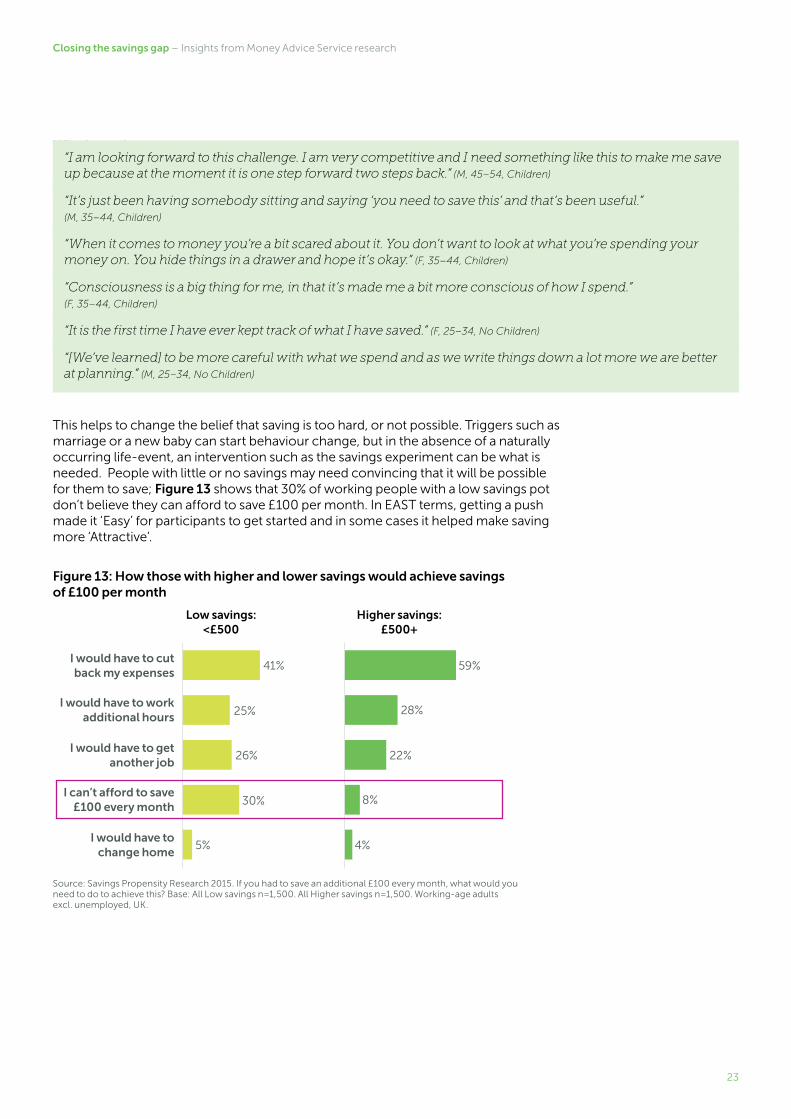
This helps to change the belief that saving is too hard, or not possible. Triggers such as marriage or a new baby can start behaviour change, but in the absence of a naturally occurring life-event, an intervention such as the savings experiment can be what is needed. People with little or no savings may need convincing that it will be possible for them to save; Figure 13 shows that 30% of working people with a low savings pot don’t believe they can afford to save £100 per month. In EAST terms, getting a push made it ‘Easy’ for participants to get started and in some cases it helped make saving more ‘Attractive’.
Figure 13: How those with higher and lower savings would achieve savings of £100 per month
Source: Savings Propensity Research 2015. If you had to save an additional £100 every month, what would you need to do to achieve this? Base: All Low savings n=1,500. All Higher savings n=1,500. Working-age adults excl. unemployed, UK.
“I am looking forward to this challenge. I am very competitive and I need something like this to make me save up because at the moment it is one step forward two steps back.” (M, 45–54, Children)
“It’s just been having somebody sitting and saying ‘you need to save this’ and that’s been useful.” (M, 35–44, Children)
“When it comes to money you’re a bit scared about it. You don’t want to look at what you’re spending your money on. You hide things in a drawer and hope it’s okay.” (F, 35–44, Children)
“Consciousness is a big thing for me, in that it’s made me a bit more conscious of how I spend.” (F, 35–44, Children)
“It is the first time I have ever kept track of what I have saved.” (F, 25–34, No Children)
“[We’ve learned] to be more careful with what we spend and as we write things down a lot more we are better at planning.” (M, 25–34, No Children)
I would have to cut back my expenses
Low savings: <£500
I would have to work additional hours
I would have to get another job
I can’t afford to save £100 every month
I would have to change home
41%
25%
26%
30%
5%
Higher savings: £500+
59%
28%
22%
8%
4%
24
Closing the savings gap – Insights from Money Advice Service research
Starting smallSavings Experiment participants were amazed to find how much difference small changes could make when applied regularly over time, without having a major impact on their lifestyle.
Why it works
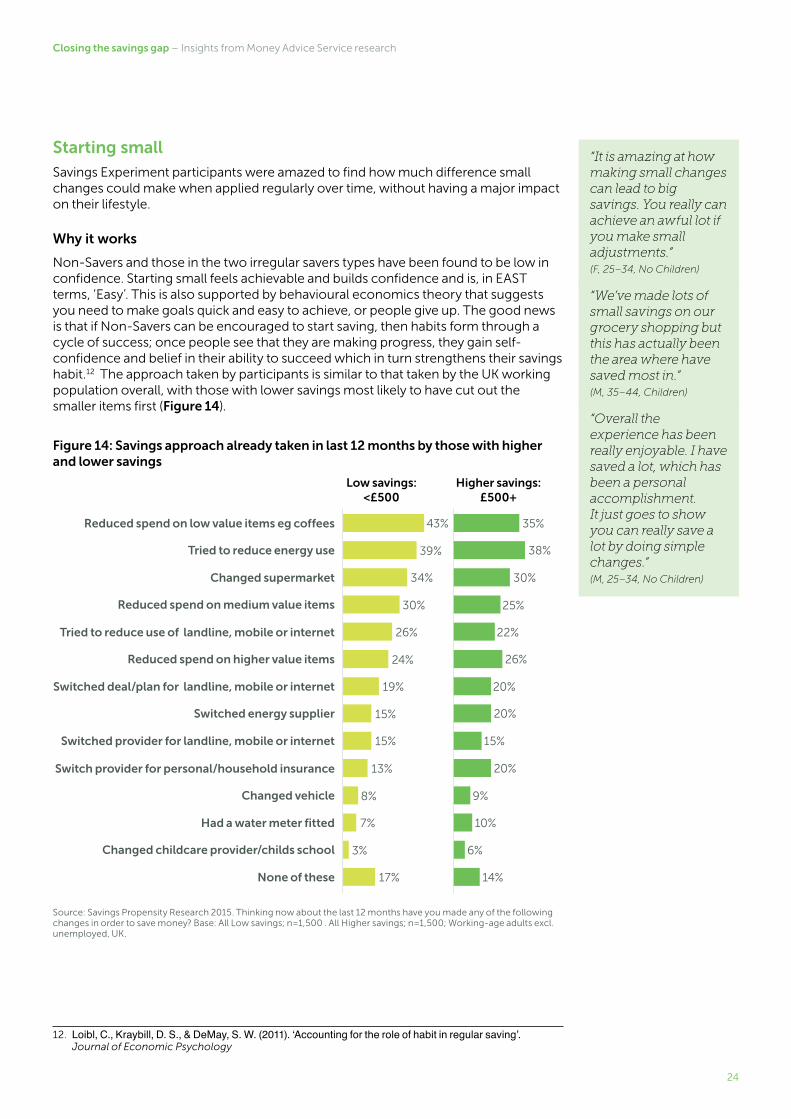
Non-Savers and those in the two irregular savers types have been found to be low in confidence. Starting small feels achievable and builds confidence and is, in EAST terms, ‘Easy’. This is also supported by behavioural economics theory that suggests you need to make goals quick and easy to achieve, or people give up. The good news is that if Non-Savers can be encouraged to start saving, then habits form through a cycle of success; once people see that they are making progress, they gain self-confidence and belief in their ability to succeed which in turn strengthens their savings habit.12 The approach taken by participants is similar to that taken by the UK working population overall, with those with lower savings most likely to have cut out the smaller items first (Figure 14).
Figure 14: Savings approach already taken in last 12 months by those with higher and lower savings
Source: Savings Propensity Research 2015. Thinking now about the last 12 months have you made any of the following changes in order to save money? Base: All Low savings; n=1,500 . All Higher savings; n=1,500; Working-age adults excl. unemployed, UK.
12. Loibl, C., Kraybill, D. S., & DeMay, S. W. (2011). ‘Accounting for the role of habit in regular saving’. Journal of Economic Psychology
“It is amazing at how making small changes can lead to big savings. You really can achieve an awful lot if you make small adjustments.” (F, 25–34, No Children)
“We’ve made lots of small savings on our grocery shopping but this has actually been the area where have saved most in.” (M, 35–44, Children)
“Overall the experience has been really enjoyable. I have saved a lot, which has been a personal accomplishment. It just goes to show you can really save a lot by doing simple changes.” (M, 25–34, No Children)
Reduced spend on low value items eg coffees
Tried to reduce use of landline, mobile or internet
Switch provider for personal/household insurance
Low savings: <£500
Tried to reduce energy use
Reduced spend on higher value items
Changed vehicle
Changed supermarket
Switched deal/plan for landline, mobile or internet
Had a water meter fitted
Reduced spend on medium value items
Switched provider for landline, mobile or internet
Switched energy supplier
Changed childcare provider/childs school
None of these
43%
26%
13%
39%
24%
8%
34%
19%
7%
30%
15%
3%
15%
17%
Higher savings: £500+
35%
22%
20%
38%
26%
9%
30%
20%
10%
25%
15%
20%
6%
14%
25
Closing the savings gap – Insights from Money Advice Service research
Showing progress against a goalHaving a goal gave the participants something to focus on and against which to measure their success.
Why it works
A number of studies have recommended that interventions to encourage saving should include a focus on helping people to set saving goals.13 Savings goals need to be meaningful and realistic. Once people have identified their savings goal they need an action plan for how they can achieve it. The savings type analysis showed that both types of monthly savers were more likely to have both goals, and plans to achieve them. The goal was set at £100 per month, which has acted as a ‘Timely’ benefit – the participants got a sense of achievement each month throughout the challenge.
Forming a habitKeeping the Savings Experiment going over three months gave the participants time to start to form new habits and to learn that savings actually worked – some described themselves as becoming obsessed with the project.
Why it works
Once savings habits are established they tend to be maintained. There is evidence that among ‘rainy-day savers’, savings habits developed in some cases during childhood, have been retained into adulthood and have become self-reinforcing.14 Again, this is ‘Easy’ in EAST terms – the savings habit has become a default behaviour. This is good news as the saver types analysis confirms that regular monthly savings, more than amount saved, is linked to financial confidence and life satisfaction.
Are you confident you are going to stay on track for the rest of the project?
“Yes, it’s not just the project. We will keep doing this … because you need to have savings. We need to have something set by for a rainy day.” (F, 35–44, Children)
“The last month was definitely the best month as I had got into a routine.” (M, 25–34, Children)
“I hated making packed lunches at first and now I am into the swing of things it has just become part of my day.” (M, 25–34, Children)
“We are still motivated and have not given up on the savings at all and I find myself constantly thinking about this project when I go out to spend money.” (M, 25–34, No Children)
13. Scottish Widows (2014) ‘Savings report 2014.’; Fisher, P., & Anong, S. (2012). ‘Relationship of saving motives to saving habits.’ Journal of Financial Counseling and Planning; Finney, A., & Davies, S. (2011). ‘Towards a nation of savers: understanding and overcoming the challenges to saving on a lower income.’
14. Kempson, E., & Finney, A. (2009). ‘Saving in lower-income households A review of the evidence.’
“You can see the progress which motivates you to achieve your end goal.” (M, 35–44, Children)
“That whole page gives me motivation to go on and save. If I can log in to that every day and I’m seeing that first thing on the morning, or before I go to bed, then I stay motivated and I achieve. Something like that is going to allow me to achieve my end goals.” (F, 35–44, Children)
26
Closing the savings gap – Insights from Money Advice Service research
A challenge not a choreThe Savings Experiment was positioned as a challenge which was motivating from the start. Participants felt it was also important to have some treats during the project, and not to compromise their lifestyle too much.
Why it works
Framing saving as a challenge works counter to the conviction that saving is too hard, or too tiresome to contemplate, and makes it ‘Attractive’ in EAST terms. It also acts against the perception, where it exists, that saving is not the social norm (EAST ‘Social’) and makes it an acceptable activity in the eyes of peers. Some research studies have recommended that the phrasing of messages to promote saving should aim to counter such negative perceptions and promote a positive image.15
Providing information – but making it personalHalfway through the challenge, we provided the participants with some information and ideas about how they might save more (Figure 12). This was aimed at improving their skills and although some participants felt that the information wasn’t new, or relevant, others benefited from it and used the ideas to make new savings.
Why it works
For this to work, the information must be at the right level so it is not seen as patronising, particularly as we have seen that people can overestimate their competence and feel that they don’t need help. In particular, the most appealing types of help are those that offer new ways to save and economise, without cutting back too much or affecting savers’ lifestyles. People want to see tips that are ‘Easy’, relevant and the sort of thing that ‘people like me’ would do (Figure 15). The EAST framework shows that people are strongly influenced by social norms, so framing tips as what potential savers’ peers are doing is a powerful way to get new information across.
15. Kempson, E., & Finney, A. (2009). ‘Saving in lower-income households A review of the evidence.’; TNS-BMRB. (2015). ‘Financial Capability and Wellbeing - A qualitative report.’ Illuminas. (2015). ‘Saving Propensity Research.’
“I am really looking forward to trying to save some money. I think £100 a month is going to be quite a challenge. I think it is going to be really interesting and I can’t wait to get started.” (F, 35–44, Children)
“I think everybody loves a challenge and to be able to save money is brilliant so I am really looking forward to that.” (M, 25–34, Children)
“Once you have a go it’s fun.” (M, 35–44, Children)
“I think it should be described as a challenge, something to aim for, targets to beat and complete, this sounds exciting and fun as well as having the end benefits. A task sounds like something someone is telling you to do, boring like housework!” (F, 35–44, Children)
“It is important to treat yourself as you go along a bit. If you are starting to save money, it can be quite hard to do, but a little treat now and again doesn’t hurt.” (F, 35–44, Children)
“The saving suggestions were more relevant for someone who is just starting out. We’ve been cutting back on everything and anything for the past 2 years. A lot of the things we have already done.” (F, 35–44, Children)
“Selling used and unwanted items, recycle old mobiles. I’d probably do that one next. I didn’t think about that before as a saving, but I would definitely go ahead and do that, and see if there is anything I can sell.” (M, 25–34, No Children)
27
Closing the savings gap – Insights from Money Advice Service research
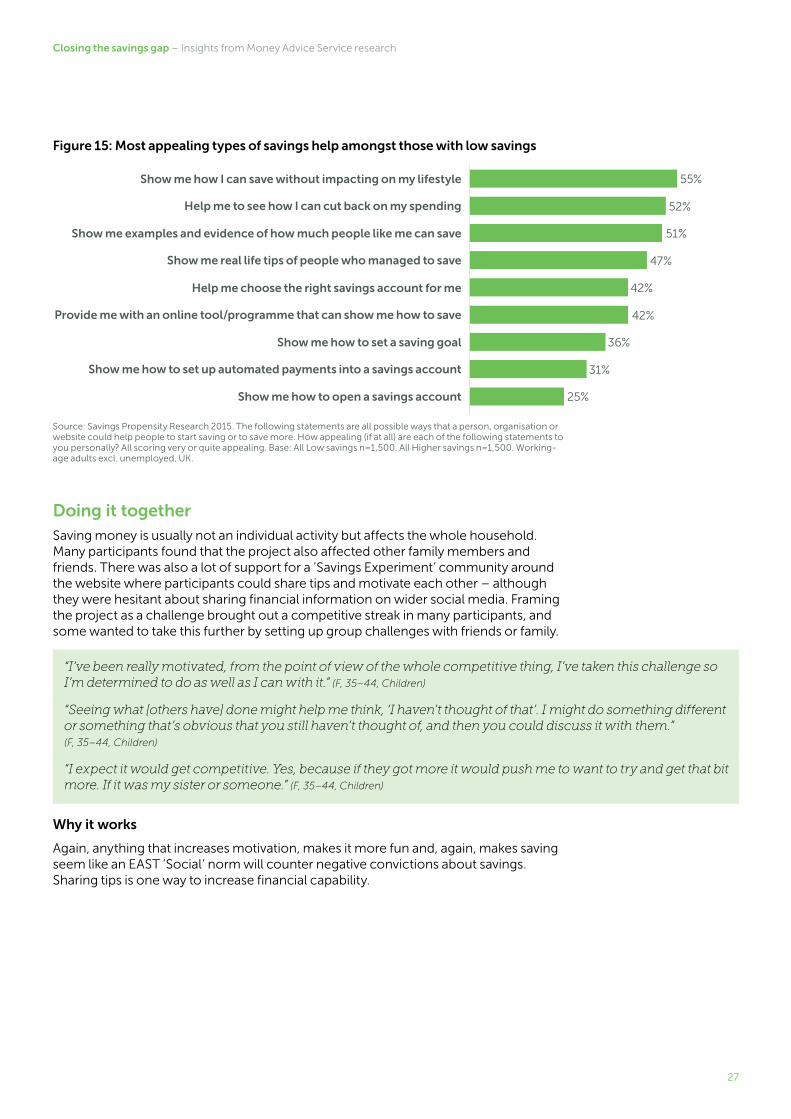
Figure 15: Most appealing types of savings help amongst those with low savings
Source: Savings Propensity Research 2015. The following statements are all possible ways that a person, organisation or website could help people to start saving or to save more. How appealing (if at all) are each of the following statements to you personally? All scoring very or quite appealing. Base: All Low savings n=1,500. All Higher savings n=1,500. Working-age adults excl. unemployed, UK.
Doing it togetherSaving money is usually not an individual activity but affects the whole household. Many participants found that the project also affected other family members and friends. There was also a lot of support for a ‘Savings Experiment’ community around the website where participants could share tips and motivate each other – although they were hesitant about sharing financial information on wider social media. Framing the project as a challenge brought out a competitive streak in many participants, and some wanted to take this further by setting up group challenges with friends or family.
Why it works
Again, anything that increases motivation, makes it more fun and, again, makes saving seem like an EAST ‘Social’ norm will counter negative convictions about savings. Sharing tips is one way to increase financial capability.
Show me how I can save without impacting on my lifestyle
Help me choose the right savings account for me
Help me to see how I can cut back on my spending
Provide me with an online tool/programme that can show me how to save
Show me examples and evidence of how much people like me can save
Show me how to set a saving goal
Show me real life tips of people who managed to save
Show me how to open a savings account
Show me how to set up automated payments into a savings account
55%
42%
52%
42%
51%
36%
47%
31%
25%
“I’ve been really motivated, from the point of view of the whole competitive thing, I’ve taken this challenge so I’m determined to do as well as I can with it.” (F, 35–44, Children)
“Seeing what [others have] done might help me think, ‘I haven’t thought of that’. I might do something different or something that’s obvious that you still haven’t thought of, and then you could discuss it with them.” (F, 35–44, Children)
“I expect it would get competitive. Yes, because if they got more it would push me to want to try and get that bit more. If it was my sister or someone.” (F, 35–44, Children)
28
Closing the savings gap – Insights from Money Advice Service research
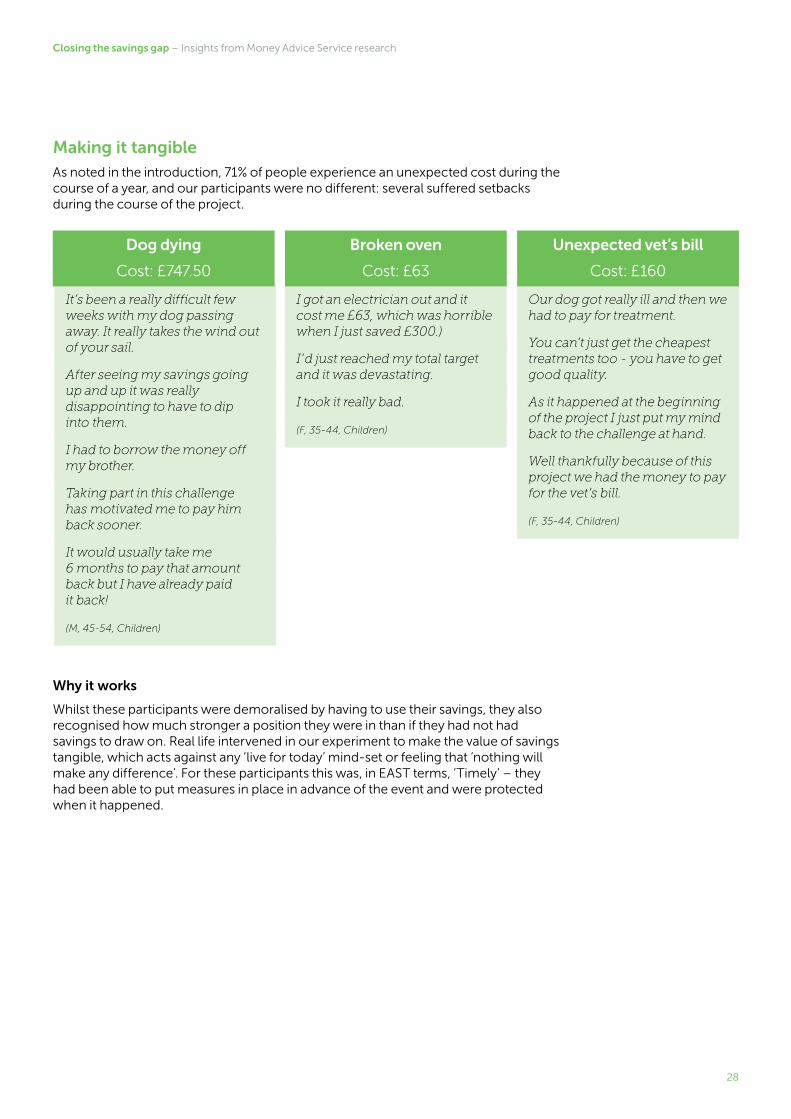
Making it tangible As noted in the introduction, 71% of people experience an unexpected cost during the course of a year, and our participants were no different: several suffered setbacks during the course of the project.
Why it works
Whilst these participants were demoralised by having to use their savings, they also recognised how much stronger a position they were in than if they had not had savings to draw on. Real life intervened in our experiment to make the value of savings tangible, which acts against any ‘live for today’ mind-set or feeling that ‘nothing will make any difference’. For these participants this was, in EAST terms, ‘Timely’ – they had been able to put measures in place in advance of the event and were protected when it happened.
It’s been a really difficult few weeks with my dog passing away. It really takes the wind out of your sail.
After seeing my savings going up and up it was really disappointing to have to dip into them.
I had to borrow the money off my brother.
Taking part in this challenge has motivated me to pay him back sooner.
It would usually take me 6 months to pay that amount back but I have already paid it back!
(M, 45-54, Children)
Dog dying
Cost: £747.50
I got an electrician out and it cost me £63, which was horrible when I just saved £300.)
I’d just reached my total target and it was devastating.
I took it really bad.
(F, 35-44, Children)
Broken oven
Cost: £63
Our dog got really ill and then we had to pay for treatment.
You can’t just get the cheapest treatments too - you have to get good quality.
As it happened at the beginning of the project I just put my mind back to the challenge at hand.
Well thankfully because of this project we had the money to pay for the vet’s bill.
(F, 35-44, Children)
Unexpected vet’s bill
Cost: £160
29
Closing the savings gap – Insights from Money Advice Service research
Closing the gap: Conclusions and next steps16
“I spend everything I earn. There is no way I could save anything at all. It all goes on bills, food and children. Even my last £5 goes on treats for the children…well I suppose I don’t have to give the children treats every week; they don’t do so badly now. I could save £5 a week… That’s £250 a year, that’s a holiday.”16
The ‘Financial Capability Strategy for the UK’, published in October 2015,17 identified the need for a shared approach to bridging the savings gap in the UK by identifying effective approaches to support working-age adults to build a savings buffer to cover unexpected costs, avoid unnecessary use of credit and achieve their financial goals.
The evidence shows that, broadly, savings is associated with an older, higher-income demographic and that debt is a barrier to saving. However, we should not conclude from this that the only significant drivers of saving behaviours are income, demographics and debt. The analysis here has shown a considerable diversity in attitudes and approaches to saving across different groups within the working-age population, and has highlighted the importance of considering attitudes and motivations to save alongside demographics and income.
The variety of savings behaviours illustrated in this report indicate that we should test, and learn from, a variety of different interventions and routes to supporting working-age adults to save. For example, one of the key findings of the analysis of Non-Savers is that they feel under pressure to spend on their children. The success of an intervention for Non-Savers may hinge on whether the approach is sensitive to this finding.
A nuanced approach to promoting savings includes considering managing and paying down debt. Households struggling to ‘make ends meet’ may need to prioritise, to focus on stabilising their finances, maximising income or paying down debts rather than saving. Even for these households, there may be value in starting a regular practice of saving something, no matter how little, as the findings suggest that the habit is more important than the balance, and a small buffer may prevent the household going further into debt should emergencies arise.
Beyond this, there is considerable scope to learn more about how to tailor and target interventions to help more adults improve their financial resilience through saving. This could include addressing confidence and self-efficacy for non-savers; focusing on budgeting to take control and manage spending as a first step towards saving and/or paying down debt; challenging those with some limited savings to set and pursue meaningful savings goals; and making it easier for intermittent savers to save more regularly to increase their buffer against financial shocks.
Such an approach focuses on supporting working-age adults to save in ways that work for them, rather than assuming one model or approach will represent a universal goal of financial capability. MAS’s own analysis of the ‘Struggling’ and ‘Squeezed’ consumer segments shows the dynamic nature of households’ finances. The reality for many households, as the Savings Experiment demonstrated, is that saving buffers will be accumulated and spent down through life events. Focusing on the confidence, attitudes, mindsets and motivations to save will help more consumers to return to and build on previous savings behaviours when their circumstances allow.
16. TNS-BMRB. (2015). ‘Financial Capability and Wellbeing - A qualitative report.’17. fincap.org.uk/uk_strategy.
30
Closing the savings gap – Insights from Money Advice Service research
This analysis has deliberately focused on saving in the short to medium term and on the extent to which the working-age population of the UK have the savings to help them cope with an unexpected life event or income shock. As our shared understanding of savings attitudes and behaviours deepens, we will need to learn more about the impacts and trade-offs for consumers between short-term savings for specific goals and long-term saving for later life.
As we develop a more nuanced shared understanding of saving attitudes and mindsets we can use these insights to maximise the impact of a wide range of interventions focused on savings for working-age adults. For example:
■ The implementation of ‘Help to Save’ accounts creates opportunities to use insights from behavioural science and financial capability to promote savings behaviours. This could include developing norms and using the government match for Help to Save as an anchor to help harness savers’ goal-setting behaviour without penalising consumers who need to make partial withdrawals to manage unexpected costs or income shocks.
■ The Money Advice Service ‘What Works Fund’ for financial capability will generate new evidence on approaches to improve financial capability through a mix of pilots, testing and learning-focused evaluations of interventions. This programme includes a focus on projects to support working-age adults to develop budgeting and tracking habits to build up a savings buffer through interventions in the workplace and in the community.
■ The Financial Conduct Authority (FCA) ‘Cash savings market study’18 remedies could help improve outcomes for existing savers through better information driving increased engagement with products and more timely reminders about changes in interest rates, and an easier switching process prompting actions from savers.
■ The Standard Financial Statement. MAS has been working with the debt advice sector to develop the Standard Financial Statement (SFS). This is a landmark development for debt advice in the UK which delivers, for the first time, a universal income and expenditure statement for clients receiving debt advice, together with a single set of spending guidelines. Debt advice agencies and creditors have agreed that a savings element will form part of the SFS. This will be important in building resilience against income shocks for clients receiving debt advice and helping clients of debt advice to build savings behaviours in the longer term. If, over time, the client is able to maximise their income, or minimise their expenditure, there is a mechanism which enables people receiving debt advice to save a small surplus as part of a debt management plan.
■ The potential for new learning from innovations in fintech that could make saving more accessible and compelling. Mobile applications could help embed and spread a number of different elements of financially capable behaviours, from supporting simple ‘ jam jar’ functionality in mobile banking apps to aid budgeting and control spending, to making it easier for consumers to save on impulse via their phone. Currently though, there has been very limited evaluation of the impact of such apps and services on the savings behaviour of the ‘Struggling’ and ‘Squeezed’ segments.
The report has captured some of the complexity and variety of savings attitudes and behaviours of working-age adults in the UK. Improving the savings culture of the UK cannot be achieved by any one sector acting in isolation let alone a single intervention. The Financial Capability Strategy for the UK provides us with the framework for collaboration between industry, third sector, government and other organisations with a role to play in understanding what works and driving change.
18. fca.org.uk/publications/market-studies/cash-savings-market-study.
31
Closing the savings gap – Insights from Money Advice Service research
Appendix: The researchMore detail of the research, commissioned by Money Advice Service, used to inform this report can be found below
2016 Savings Literature Review
An evidence review of secondary data sources intended to help the Money Advice implement the Financial Capability Strategy by examining the existing savings evidence base in terms of what works in encouraging saving among working-age adults. It also identifies gaps in the evidence.
The review focuses on:
■ people of working-age – although much of the evidence reviewed covered adults of all ages;
■ people on low to middle incomes;
■ adult cash savings (rather than investments or saving for children); and Community based interventions.
Report to be published on the Money Advice Service website in Q4 2016.
2015 Financial Capability Survey
The UK Financial Capability Survey is a key part of the evidence base underpinning the development of the Financial Capability Strategy for the UK as a whole and the Devolved Nations. The research measures the extent of financially capable behaviour among the public, and highlights particular groups in the population that score lower in terms of behaviours or financial capability factors. It also examines the extent to which skills, knowledge, mindset (attitudes and motivations), connection (ease and accessibility), and other influences may act as barriers or enablers to financially capable behaviour.
The Financial Capability Survey is a nationally representative survey of adults aged 18+ living in the UK. The survey was conducted mainly (74%) online with some face-to-face interviews (26%) to represent lighter users and non-users of the internet.
Interviews were conducted with a UK nationally representative sample of 3,461 adults. Additional interviews were conducted in each of the Devolved Nations (Scotland, Wales and Northern Ireland) in order to ensure a robust base for analysis. The same is true of 18-24 year-olds, where again boost interviewing was undertaken. In total, 5,603 respondents took part in this research between April and July 2015.
The research employed a mixed mode approach with a balance of online and offline (face to face) interviews, as informed by substantial development work undertaken on the Financial Research Survey (FRS). This work has shown that online interviews are the best method for including heavier internet users, who are in themselves more financially capable, but that a wholly online approach would exclude lighter internet users who are also likely to have lower levels of financial capability. Therefore we interviewed those who are online for fewer than 6 hours a week (who comprise around half of the population) offline, with a representative sample of internet users interviewed online.
32
Closing the savings gap – Insights from Money Advice Service research
In order to ensure that the findings accurately reflect the UK population, the data were weighted to known population estimates. The variables used for weighting were age, gender, region, working status, internet usage and housing tenure. Housing tenure was substituted for social grade after interrogation of the initial data and comparison with ONS and other data sources.
Some respondents did not supply details of household or personal incomes or savings. Missing values for these respondents were imputed based on answers provided at other questions. The imputation model used for this was based on a model used by the survey provider GfK on the GfK Financial Research Survey.
The survey also modelled an estimate of housing equity based on a detailed section of questions about owner occupiers’ mortgages (if any) and property characteristics.
The questionnaire for the survey was developed from previous waves of financial capability research, comparison with international surveys such as those run by OECD
and ASIC, specific qualitative research conducted for this survey3, cognitive testing of the questions, and quantitative piloting of some questions.
More details on the 2015 Financial Capability Survey can be found on the Money Advice Service website:
https://masassets.blob.core.windows.net/cms/files/000/000/265/original/MAS_FinCap_UK_Survey_2015_AW.pdf
The ‘Squeezed’ Segment – Ethnographic Research Report – December 2015
The report focuses on the ‘Squeezed’ consumer segment and is based on ethnographic research carried out by Jigsaw Research at the end of 2015. The purpose of the research was to gain a richer and more human picture of ‘Squeezed’ consumers to build on existing quantitative segmentation analysis.
A qualitative ethnographic study consisting of 15 x 2 ½-hour depth interviews with men and women in the ‘Squeezed’ segment. The sample was split more or less equally between the Squeezed Younger Adults, Squeezed Younger Families & Couples and Older Squeezed segments.
The main objective of the project was to gain a detailed understanding of their financial situation and approach to money management, and how both these are reflected in their everyday lives and overall lifestyles. In addition, the research set out to understand better two key characteristics of ‘Squeezed’ financial situations: significant debt and a lack of savings.
The research took place in all four UK nations, with respondents recruited in London, Cardiff, Birmingham, Belfast and Glasgow. The fieldwork was conducted in December 2015.
The full report can be found on the Money Advice Service website: https://masassets.blob.core.windows.net/cms/files/000/000/468/original/ The_Squeezed_Segment_MAS.pdf
33
Closing the savings gap – Insights from Money Advice Service research
Savings Propensity Research – July/August 2015
A quantitative survey commissioned by the Money Advice Service to understand the barriers and enablers to saving money more regularly and quantifying the relative importance of barriers following previous qualitative research that identified some of the potential blockers. Objectives included understanding what, if anything would motivate people to save, understand what people are willing to cut back on in order to save, identify the most engaging messages that would encourage saving and understand to what extent saving money is important to people.
The survey was conducted online with 3,000 UK adults aged 18-64 in full- or part-time employment. Retired and unemployed people were excluded and people with a spread of household incomes were included in the sample. Of the 3,000 respondents, 1,500 held less than £500 in savings and 1,500 who held more than £500 in savings.
The ‘Grand Plan’ – 2014
A longitudinal assessment of the impact of setting a challenge to members of an online community through qualitative online discussion. The context of this challenge was to inform the potential for the roll out of a ‘Grand Plan’ campaign. The overall aim of the ‘Grand Plan’ concept is to encourage and support members of the public to save £1,000 over a twelve-month period.
24 out of 700 online community members were selected to take part in the study who stated that they were living in a household that struggles financially sometime or often/always and expect it to be fairly or very difficult to save £100 a month.
Participants uploaded video diary entries every two weeks for the duration of the three-month study to report on their progress in saving £100 a month to reach a £300 goal. Discussion topics, encouragement and support was carried out throughout the process. Mid-point video interviews were conducted with a selected group of participants and final interviews were conducted with another selected group of participants.
Unexpected Cost Report – December 2013
The overall objective of this piece of quantitative research was to understand the impact of ‘unplanned for’ costs on households in the UK. More specifically the research aimed to evaluate; the types, frequencies and size of unexpected household costs, how households pay for these unexpected costs, how well prepared households are for the unexpected and the financial and emotional impact of unexpected costs.
2,024 interviews were conducted on the Populus Online Omnibus. The interviews were conducted with a nationally representative online sample of GB adults aged 18+. Quotas were set on age, gender and region, with the data weighted to the profile of age, gender, region, social grade and working status.
The full report can be found on the Money Advice Service website: https://masassets.blob.core.windows.net/cms/files/000/000/241/original/Unexpected_costs_report.pdf
Money Advice Service Holborn Centre 120 Holborn London EC1N 2TD © Money Advice Service September 2016 moneyadviceservice.org.uk