close brothers group plc annual report 2016 · close brothers group plc annual report 2016...
TRANSCRIPT

Close B
rothers Group p
lc Annual R
eport 2016
Modern Merchant Banking
Close Brothers Group plcAnnual Report 2016

Close Brothers Group plc Annual Report 2016
Strategic Report 4 Chairman’s and Chief Executive’s
Statement 8 Business Model12 Strategy and Key Performance
Indicators14 Financial Overview20 Banking24 Securities26 Asset Management28 Principal Risks and Uncertainties32 Sustainability Report
Governance42 Board of Directors44 Executive Committee45 Report of the Directors47 Corporate Governance60 Report of the Board on
Directors’ Remuneration
Financial Statements84 Independent Auditor’s Report to
the Members of Close Brothers Group plc
87 Consolidated Income Statement88 Consolidated Statement of
Comprehensive Income89 Consolidated Balance Sheet90 Consolidated Statement of
Changes in Equity91 Consolidated Cash Flow
Statement92 Company Balance Sheet93 Company Statement of Changes
in Equity94 The Notes135 Glossary136 Investor Relations136 Cautionary Statement
Close Brothers is a leading UKmerchant banking group providinglending, deposit taking, wealthmanagement services andsecurities trading.

Close Brothers Group plc Annual Report 2016S
trategicR
eport
Governance
FinancialS
tatements
1
Adjusted1 operating profit from continuing operations
£233.6m(2015: £224.9m)2016 £233.6m
2015 £224.9m
2014 £193.7m
2013 £167.2m
2012 £134.2m
Ordinary dividend per share4
57.0p(2015: 53.5p)2016 57.0p
2015 53.5p
2014 49.0p
2013 44.5p
2012 41.5p
Return on opening equity3 from continuing operations
18.9%(2015: 19.5%)2016 18.9%
2015 19.5%
2014 17.9%
2013 15.8%
2012 12.5%
Adjusted2 basic earnings per share from continuing operations
128.4p(2015: 120.5p)2016 128.4p
2015 120.5p
2014 101.0p
2013 83.5p
2012 67.3p
Operating profit before tax from continuing operations
£228.5m(2015: £219.9m)
Profit attributable to shareholders from continuing and discontinued operations
£186.5m(2015: £185.7m)
Basic earnings per share from continuing operations
125.7p(2015: 117.8p)
Financial Highlightsfor the year ended 31 July 2016
Welcome to Modern Merchant Banking
Modern Merchant Banking is about meeting the financial needs of our clients today while applying the traditional values of our past.
At Close Brothers we provide financial support and advice to small businesses and individuals in the UK. Our clients are the makers of things, the wealth creators, the investors and the savers. They are playing an important role driving growth in the British economy and we are supporting them as they grow.
Throughout our distinguished history, we have remained focused on upholding our traditional values, based on service and integrity. At the same time, we encourage innovation and support enterprise, reflecting how our clients do business.
At Close Brothers we call it Modern Merchant Banking. We believe our traditional values and modern thinking are the reason behind our success and why our clients continue to turn to us.
The photography within this Annual Report was photographed on location at our clients’ businesses.We would like to thank them for their generous support and cooperation.
Front cover: Photographed on location at BCW Engineering Ltd.
Opposite: Photographed on location at Alicat Workboats Ltd.
1 Stated before amortisation of intangible assets on acquisition. A reconciliation to operating profit before tax is shown on page 15.
2 Stated before amortisation of intangible assets on acquisition and the tax effect of such adjustment.
3 Return on opening equity calculated as adjusted operating profit after tax and non-controlling interests on opening equity less non-controlling interests.
4 Represents the final dividend proposed for the respective years together with the interim dividend declared and paid in those years.
Note: Relevant figures and ratios for 2015 are re-presented for changes in treatment of operating lease assets and Treasury income, as announced on 13 September 2016. See page 135 for details.

Photographed on location at G&H Sheet Fed Ltd.
Close Brothers Group plc Annual Report 20162
Strategic Report 4 Chairman’s and Chief Executive’s Statement 8 Business Model 12 Strategy and Key Performance Indicators 14 Financial Overview 20 Banking 24 Securities 26 Asset Management 28 Principal Risks and Uncertainties 32 Sustainability Report

Close Brothers Group plc Annual Report 2016S
trategicR
eport
Governance
FinancialS
tatements
3

Close Brothers Group plc Annual Report 20164
Chairman’s and Chief Executive’s Statement
The group has achieved a good performance, with adjusted operating profit of £234 million (2015: £225 million) and strong return on opening equity of 18.9% (2015: 19.5%). We are confident that our clear and consistent strategy and the disciplined implementation of our business model will ensure we continue to support our clients and generate good returns for shareholders in a wide range of market conditions.
Strone Macpherson, Chairman
Preben Prebensen, Chief Executive
Close Brothers Group plc Annual Report 2016S
trategicR
eport
Governance
FinancialS
tatements
5
Good Performance in More Challenging ConditionsIn the UK, the political environment and financial markets have been dominated by the EU referendum vote in June. The eventual timing and nature of the UK’s exit from the EU is still uncertain, and the longer-term impact on consumer confidence, SMEs and their appetite to invest, and on the wider financial markets is also still uncertain.
However, our own strategy is clear and unchanged. We continue to focus on providing a differentiated and relationship driven service in specialist markets, where we have long-standing expertise, and on maintaining our prudent and consistent underwriting, founded in a deep knowledge of the sectors and asset classes we lend in. This in turn allows us to generate consistent profitability through the cycle, allowing us to support our clients, invest in our business and generate returns for our shareholders in all market conditions.
Our business is deliberately built for resilience against changes in the external environment. The diversity and maturity of our funding reduce refinancing risk, and we match assets and liabilities which minimises our exposure to interest rate and currency movements. Our consistent profitability supports our strong and prudent capital position, ensuring that we continue to comfortably meet all regulatory requirements while maintaining flexibility for future growth.
The strength of our business model has been validated by the group’s performance this year, with all our businesses responding well to their particular market conditions. Adjusted operating profit continued to increase in the Banking division, as we generated good loan book growth across all our lending businesses, while maintaining the discipline of our lending model. Winterflood has traded successfully through difficult market conditions in the first half, and performance improved significantly in the second, notwithstanding the EU referendum which actually stimulated more trading activity at the end of the financial year. Although adjusted operating profit in Asset Management was impacted by the lower market levels in the period, we continued to achieve positive net inflows.
Overall, this has resulted in continued profit growth and strong returns to our shareholders, with a return on opening equity of 18.9% (2015: 19.5%) and supporting our sixth consecutive year of dividend increase.
Good Loan Book Growth While Maintaining DisciplineThe current benign environment, with low interest rates and low impairments, is inevitably attracting more credit into some of our markets from both larger banks and newer competitors. Despite this, the loan book grew 12% (2015: 8%), benefiting from good underlying demand across our businesses, as well as an increasing contribution from new growth initiatives, particularly in Ireland and green energy.
Most importantly, we continue to lend at criteria which are consistent with our objective of delivering strong and consistent returns through the cycle. Although competition has impacted the net interest margin in some parts of our business, the return on net loan book remains strong at 3.6% (2015: 3.7%).
Our business is deliberately built for resilience against changes in external market conditions.
These strong returns are supported by the differentiation of our offering, which focuses on providing a high level of service and building personal relationships with borrowers and intermediaries, and the quality and consistency of our underwriting across all the lending businesses. This customer focus is strongly endorsed by our borrowers and evidenced by our high levels of repeat business and strong net promoter scores.
In Retail Finance, our lending is intermediated through a network of motor dealers, insurance brokers and retailers, who value the personalised service and flexibility of our offering, which supports their ability to provide an attractive and accessible finance package for their customers. Although the market is competitive, the motor finance business has continued to grow, benefiting from strong underlying demand for second hand cars, and particularly from further expansion of our operations in Ireland. We have also made significant progress in the premium finance business, with increased new business levels, and a number of significant new account wins.
In Commercial Finance, we have lending relationships with over 20,000 small businesses across the UK. Competition in the broker distributed part of the business has increased significantly, however we are differentiated through our experienced direct sales force, who offer a personalised service, and are empowered to make speedy underwriting decisions. As a result, we continue to see good new business levels particularly in our more specialist lending areas.

Close Brothers Group plc Annual Report 20166
Chairman’s and Chief Executive’s Statement continued
Photographed on location at Mark Priestley SDT Ltd.
Our specialist Property Finance business, which focuses on residential development lending to a small number of experienced, professional developers, continues to perform very well with good growth and bad debts at an all time low. The consistent application of strict underwriting criteria over many years supports our long track record of profitability in this business and gives us confidence that we can continue lending profitably and support our customers in all market conditions.
Navigating Market HeadwindsFinancial markets have been challenging throughout the year, with headwinds caused by commodity prices and concerns about global growth in the first half, and dominated by the EU referendum in the second.
Winterflood’s performance in the year has demonstrated its ability to trade successfully in a range of market conditions. Although performance in the first half was weaker, reflecting volatile markets and low risk appetite, trading remained consistently profitable. The second half saw a marked increase in profits as Winterflood benefited from an improvement in retail trading activity, further accelerated by the EU referendum vote. Overall, Winterflood achieved a good result in these conditions, demonstrating the strength of its business model and the long-standing expertise of its traders.

Close Brothers Group plc Annual Report 2016S
trategicR
eport
Governance
FinancialS
tatements
7
Although lower market levels have affected the progression of income in Asset Management, we have continued to see good demand for our products and services, with positive net flows despite the increased market uncertainty leading up to and post the EU referendum. We remain confident in our business model and are focused on driving further growth by expanding our adviser force and distribution capacity, and where appropriate through the selective acquisition of teams or small businesses that fit our strategy and approach.
Protecting and Sustaining the BusinessWe continue to invest in protecting, sustaining and developing our proven business model and brand to protect our returns and maximise growth opportunities in the long term. The strong profitability inherent in our business means we can invest through the cycle, and in the past year we have progressed a number of key initiatives. At the same time we have tightened our focus on cost to ensure cost growth has remained in line with revenue for the year overall.
We are continuously exploring new ways to extend our business model into new market segments, while maintaining the same specialist focus, prudent approach and discipline as in our existing businesses. This year we launched our new technology leasing business, which provides IT financing solutions for corporates, and we are continuing to expand our point of sale finance offering to retailers. In Asset Management, we have launched Intelligent Retirement®, an integrated solution focused on managing the changing needs of individuals leading up to and following retirement. We are also continuing to develop Winterflood Business Services, which provides outsourced trading and custody services to institutions.
This year, there has been a significant focus on talent management and succession planning. This includes the development of detailed succession plans for key positions in the Banking division and across the group.
We have a number of programmes in place to attract, develop and retain talent at all levels across the organisation. The sales training programme in asset finance, which launched in September 2015, has been a success with the candidates now an active part of the sales force. We continue to run a number of successful training programmes across the group, including leadership programmes and tailored training for our financial advisers.
Although we are principally a people driven business, technology plays an important role in supporting and sustaining our customer proposition. We continue to put significant investment into upgrading and enhancing our IT systems, to ensure they are scalable, efficient and secure. Current projects include our ongoing investment in the premium finance infrastructure, a new deposit system in Treasury, and continuing to simplify and optimise our infrastructure in Asset Management.
Our established business model, long track record and strong balance sheet leave us well placed to continue to perform well in a range of market conditions.
Board ChangesStephen Hodges has informed us of his decision to retire and will step down from his position as chief executive of the Banking division and a director of the group. Accordingly, he will not seek re-election at the forthcoming Annual General Meeting (“AGM”) on 17 November. Stephen has been with the group for 31 years and a director since 1995. The board would like to thank Stephen for his outstanding contribution to the group and his leadership of the Banking division over many years.
Following the AGM, Preben Prebensen will assume the role of chief executive of the Banking division, in addition to his current role as group chief executive. Preben’s leadership, supported by the strength and depth of the senior team within the Banking division, will ensure continued implementation of our well-established strategy and business performance.
OutlookLooking ahead, our established business model, long track record and strong balance sheet leave us well placed to continue to perform well in a range of market conditions.
To date, we have seen little direct impact on our businesses from the EU referendum result but we continue to monitor developments closely.
Our priority remains to maintain the discipline of our banking model. We remain confident in our market position and expect continued growth at strong returns, and will continue to actively invest in our business while maintaining a strong focus on cost control. Winterflood has continued to benefit from increased retail investor trading activity since the financial year end, but remains sensitive to changes in market conditions. In Asset Management, we are focused on driving continued growth.
We have had a good start to the year and are confident that our business remains well positioned longer term.

Close Brothers Group plc Annual Report 2016
ExpertiseOur people are
experts in their fields
RelationshipsBuilding long-term
relationships with clients and intermediaries
ServiceAllowing us to provide
excellent service
1 2
4 3
Build leading positions in our specialist markets
Reinvest in the business to enhance our customer proposition
Generate strongand sustainablereturns
Maintain a sound financial position and support our clients through the cycle
8
Business Model
We call our approach “Modern Merchant Banking”, which reflects how we apply our focus on service, expertise and strong relationships to meet the evolving needs of our clients. We build leading positions within the specialist markets we operate in, which in turn generates strong profitability, allowing us to reinvest in our business.

Close Brothers Group plc Annual Report 2016S
trategicR
eport
Governance
FinancialS
tatements
9
We are focused on supporting and developing this business model over the long term and ensuring the group is underpinned by prudent levels of capital, funding and liquidity.
Maintain a sound financial position
Our strong financial resources include a simple balance sheet and prudent capital position, which alongside strong returns allow us to pay a progressive dividend while continuing to invest in the businesses.
• Our prudent capital position means we have the strategic flexibility to continue to grow through the cycle and meet evolving regulatory requirements.
• Our “borrow long, lend short” principle gives confidence to creditors and rating agencies.
• Our diverse funding profile provides resilience and flexibility in difficult market conditions, so we can continue to support our customers when they need us.
We continue to use our expertise to maintain leading positions in our markets. Each division is a specialist in their own niche markets and we apply the same conservative approach and disciplined focus on returns across all of them.
• Each of our divisions has a long track record of financial performance while supporting our clients through the cycle, based on long-term relationships driven by our customer led proposition.
• We operate consistently through the cycle and do not manage our businesses to a growth target; our priority is always to maintain our strong returns.
• Our embedded and strict underwriting criteria, supported by a robust governance and control framework, ensure we maintain a high quality loan book.
• Lending is predominantly secured, with conservative loan to value ratios.
We continuously invest in our products, technology and people, to deliver a high quality service and build on the long-term relationships we have with our clients.
• Our history of extending the business model into new areas has helped support continued growth over the long term and through previous credit cycles.
• We invest in recruitment and training for all levels of employees, to deepen and broaden our expertise and focus on client service.
• We proactively invest in technology to ensure our infrastructure remains robust and to improve our client offering.
• Our strong client focus is evidenced by high levels of repeat business and net promoter scores.
Generate strong and sustainable returns
Reinvest in our business to enhance client experience

Close Brothers Group plc Annual Report 201610
Banking Securities Asset Management
Our ServicesWe focus on straightforward products and services in markets we know and understand.
The expertise of our people allows us to provide flexible solutions to meet individual client needs.
The Banking division provides specialist finance to UK SMEs and individuals, serving over two million customers. We have diversified funding including customer deposits, from businesses and individuals, along with wholesale facilities.
Within Commercial Finance, our asset finance business provides secured specialist finance solutions to SMEs, reaching customers both directly, through our local expert
teams, and via brokers. Invoice finance offers both invoice financing and discount factoring. Retail Finance partners with over 9,000 intermediaries including motor dealers and insurance brokers to provide lending services to SMEs and individuals. In Property Finance, we provide specialist residential development finance through our long-term relationships with professional property developers.
Winterflood’s core business is market-making in the UK to retail stockbrokers and institutions, providing continuous liquidity in all market conditions. It trades in around 15,000 instruments in the UK and overseas and we also have a specialist team focused on investment trusts.
Asset Management provides an integrated offering directly to private clients, combining financial planning advice and investment management. In addition, we provide our investment management offering to third party advisers and directly to clients through our bespoke portfolio managers.
Our Market PositionWe are a trusted brand with a strong reputation in the financial services market.
We have built leading market positions in a number of specialist areas.
We have a long track record of supporting clients in all market conditions underpinned by our strong financial performance.
We have an established market position in each of our niche areas: asset, invoice, motor, premium and property finance. Our approach generates high levels of repeat business through our long-term relationships and customer focused values.
We typically operate in markets which are underserved by larger banks, where our expertise and superior customer service are critical. In asset finance we work with smaller, family run businesses, in motor finance we have
relationships with the independent dealers and in Property Finance we generally focus on smaller independent developers.
Winterflood is the leading market-maker to the UK private client sector, serving around 400 clients. Its strong market position is driven by its ability to provide continuous liquidity through our market leading execution services supported by our own leading electronic trading platform.
We have specialised in advising and managing investments for many years, tailoring portfolios for a range of clients. We continue to win awards for our high quality integrated proposition, focusing on the needs of our clients while continuing to build scale organically but also through small acquisitions and the hiring of advisers and portfolio managers.
Our ExpertiseWe understand our specialist markets and our clients’ needs, ranging from small businesses to private investors and retail brokers.
Our decentralised model enables personal service, with extensive local presence across the UK.
We have a local presence across the UK, with both a direct sales force and intermediated distribution network of dealers, brokers and retailers. Our highly specialist lenders understand their sectors and asset classes and have authority to underwrite loans, enabling them to provide fast and flexible solutions. We consistently apply strict lending criteria when assessing the credit quality of a borrower and maintain conservative loan to value ratios across our portfolio.
Our people are core to our business and we are committed to providing opportunities to maximise their potential and develop their career within the group. We promote employee engagement and provide opportunities for talent development and also run a number of initiatives including graduate and school leaver programmes, as well as a specialist sales training academy in asset finance.
Our traders have extensive experience of executing orders in a range of market conditions enabling us to trade successfully over many years. In addition, Winterflood has the largest dedicated investment trusts team in the sector offering trading, sales, research and corporate services.
Our financial advisers provide award winning financial planning and investment advice tailored to the evolving needs of our clients. We offer a wide range of investment solutions delivered through an experienced team covering asset allocation, research and portfolio management.
Sustainable IncomeWe focus on recurring income streams and manage our financial resources carefully.
We apply our strategy consistently to support sustainable earnings growth.
Our lending income relies on our customer led, differentiated local service to attract and retain customers. We have high levels of repeat business which helps support our consistently strong margins.
We continuously explore new initiatives to drive future growth. Most recently these have included expansion into Ireland, consumer point of sale finance and hiring specialist teams
in renewable energy and technology leasing. In each new or adjacent market we explore, it must adhere to our strict lending criteria, contributing to our high quality loan book and strong returns.
Read more about Banking on pages 20 to 23.
Winterflood’s income is predominantly trading income from its market-making activities. Its diversified offering, alongside embedded risk limits, has enabled Winterflood to trade profitably in a wide range of market conditions.
Read more about Securities on pages 24 and 25.
Our range of propositions and distribution channels provide a diverse source of client assets and recurring revenues.
Read more about Asset Management on pages 26 and 27.
How we are different
Business Model continued

Close Brothers Group plc Annual Report 2016S
trategicR
eport
Governance
FinancialS
tatements
11
Banking Securities Asset Management
Our ServicesWe focus on straightforward products and services in markets we know and understand.
The expertise of our people allows us to provide flexible solutions to meet individual client needs.
The Banking division provides specialist finance to UK SMEs and individuals, serving over two million customers. We have diversified funding including customer deposits, from businesses and individuals, along with wholesale facilities.
Within Commercial Finance, our asset finance business provides secured specialist finance solutions to SMEs, reaching customers both directly, through our local expert
teams, and via brokers. Invoice finance offers both invoice financing and discount factoring. Retail Finance partners with over 9,000 intermediaries including motor dealers and insurance brokers to provide lending services to SMEs and individuals. In Property Finance, we provide specialist residential development finance through our long-term relationships with professional property developers.
Winterflood’s core business is market-making in the UK to retail stockbrokers and institutions, providing continuous liquidity in all market conditions. It trades in around 15,000 instruments in the UK and overseas and we also have a specialist team focused on investment trusts.
Asset Management provides an integrated offering directly to private clients, combining financial planning advice and investment management. In addition, we provide our investment management offering to third party advisers and directly to clients through our bespoke portfolio managers.
Our Market PositionWe are a trusted brand with a strong reputation in the financial services market.
We have built leading market positions in a number of specialist areas.
We have a long track record of supporting clients in all market conditions underpinned by our strong financial performance.
We have an established market position in each of our niche areas: asset, invoice, motor, premium and property finance. Our approach generates high levels of repeat business through our long-term relationships and customer focused values.
We typically operate in markets which are underserved by larger banks, where our expertise and superior customer service are critical. In asset finance we work with smaller, family run businesses, in motor finance we have
relationships with the independent dealers and in Property Finance we generally focus on smaller independent developers.
Winterflood is the leading market-maker to the UK private client sector, serving around 400 clients. Its strong market position is driven by its ability to provide continuous liquidity through our market leading execution services supported by our own leading electronic trading platform.
We have specialised in advising and managing investments for many years, tailoring portfolios for a range of clients. We continue to win awards for our high quality integrated proposition, focusing on the needs of our clients while continuing to build scale organically but also through small acquisitions and the hiring of advisers and portfolio managers.
Our ExpertiseWe understand our specialist markets and our clients’ needs, ranging from small businesses to private investors and retail brokers.
Our decentralised model enables personal service, with extensive local presence across the UK.
We have a local presence across the UK, with both a direct sales force and intermediated distribution network of dealers, brokers and retailers. Our highly specialist lenders understand their sectors and asset classes and have authority to underwrite loans, enabling them to provide fast and flexible solutions. We consistently apply strict lending criteria when assessing the credit quality of a borrower and maintain conservative loan to value ratios across our portfolio.
Our people are core to our business and we are committed to providing opportunities to maximise their potential and develop their career within the group. We promote employee engagement and provide opportunities for talent development and also run a number of initiatives including graduate and school leaver programmes, as well as a specialist sales training academy in asset finance.
Our traders have extensive experience of executing orders in a range of market conditions enabling us to trade successfully over many years. In addition, Winterflood has the largest dedicated investment trusts team in the sector offering trading, sales, research and corporate services.
Our financial advisers provide award winning financial planning and investment advice tailored to the evolving needs of our clients. We offer a wide range of investment solutions delivered through an experienced team covering asset allocation, research and portfolio management.
Sustainable IncomeWe focus on recurring income streams and manage our financial resources carefully.
We apply our strategy consistently to support sustainable earnings growth.
Our lending income relies on our customer led, differentiated local service to attract and retain customers. We have high levels of repeat business which helps support our consistently strong margins.
We continuously explore new initiatives to drive future growth. Most recently these have included expansion into Ireland, consumer point of sale finance and hiring specialist teams
in renewable energy and technology leasing. In each new or adjacent market we explore, it must adhere to our strict lending criteria, contributing to our high quality loan book and strong returns.
Read more about Banking on pages 20 to 23.
Winterflood’s income is predominantly trading income from its market-making activities. Its diversified offering, alongside embedded risk limits, has enabled Winterflood to trade profitably in a wide range of market conditions.
Read more about Securities on pages 24 and 25.
Our range of propositions and distribution channels provide a diverse source of client assets and recurring revenues.
Read more about Asset Management on pages 26 and 27.

Close Brothers Group plc Annual Report 201612
The effective and consistent application of our strategy, to build and sustain strong market positions in specialist markets, while providing superior client service, has resulted in good financial performance against a backdrop of more challenging market conditions.
Strategy and Key Performance Indicators
Strategic objectives 2016 progress Future objectives Key risks1 Key performance indicators
Build Market Leading PositionsBuild strong market positions, using our expertise to provide excellent client service and develop long-term client relationships.
• Grew the loan book to £6.4 billion, while maintaining our strict lending criteria and strong returns.
• Continued to leverage our core capabilities in new markets, including our technology leasing business within asset finance.
• Winterflood demonstrated the strength of its business model despite the turbulent market conditions, delivering £19 million operating profit.
• Focus on delivering excellent service and maintaining strong client relationships.
• Continue to develop our brand and differentiators.
• Explore new opportunities to enter niche markets, while maintaining our model.
• Increase scale of client assets through organic growth, adviser hiring and small acquisitions.
• Lower demand for our products and services, impacted by economic and political conditions.
• Competitive pressures, particularly in parts of the Banking division.
• Loss of staff who are key to delivering on our strategy.
Loan book £ billion
Winterflood’s income £ million
Total client assets £ billion
Remain Prudent and EfficientHold an appropriate level of capital, funding and liquidity in all market conditions.
• Broadly unchanged CET1 ratio at 13.5%, remains ahead of regulatory requirements and provides strategic flexibility.
• Maintained strong credit ratings.• Successfully completed our first public
securitisation, providing further diversity while maintaining our prudent funding position, now at £8.2 billion.
• Regular stress testing of capital position to maintain flexibility.
• Maintain diverse funding sources and a prudent maturity profile.
• Maintain a conservative approach to liquidity with a prudent risk appetite.
• Changes to regulatory requirements.• Changes in market conditions
resulting in lower availability or higher cost of funding.
Common equity tier 1 capital per cent
Leverage ratio per cent
Funding % loan book per cent
Develop our Client PropositionInvest in people, technology and products and services to enhance our client proposition.
• Built on the strength of our people, including key adviser hires in Asset Management and the ongoing training of our direct sales force in Commercial Finance.
• Continued investment in technology in premium finance and Treasury, ensuring our infrastructure remains robust and serves our customers effectively.
• Continue investment in our infrastructure to improve resilience and operating capabilities.
• Continued training and support for our expert people, who are core to our model and delivering on our strategy.
• Develop delivery channels and services to meet evolving client needs.
• Technology and systems becoming obsolete.
• Inability to attract or retain high calibre people.
• Changes to consumer habits or market structure.
Total headcount Front office headcount
Employees satisfied/ very satisfied2 per cent
Maintain the Strength of our Business ModelConsistently apply our high quality business model throughout the economic cycle.
• Returns remained strong benefiting from the consistent application of our business model across the lending businesses.
• Winterflood continued to trade profitably in difficult markets, benefiting from the experience of its traders and resilient infrastructure.
• Positive net flows in Asset Management despite tough conditions.
• Maintain the disciplined lending criteria and customer led approach, to preserve the quality of the loan book and continue to lend through the cycle.
• Maximise Winterflood’s profitability in all market conditions.
• Build scale in Asset Management.
• Competition, leading to pricing pressure or narrowing expansion opportunities.
• Higher bad debts due to customer inability to service debt.
Return on net loan book per cent
Adjusted basic earnings per share pence
Net inflows per cent
Deliver Attractive Shareholder ReturnsGenerate sustainable shareholder returns through earnings growth and prudent management of our financial resources.
• Dividend up 7% to 57.0p, in line with our progressive dividend policy, with dividend cover maintained at 2.3 times.
• Continued strong return on opening equity of 18.9%, building on our long track record.
• Total shareholder return while negative outperformed vast majority of UK banking sector.
• Build scale across the business while maintaining our robust business model.
• Maintain appropriate dividend cover to sustain dividend growth.
• Continue to engage regularly with shareholders and external stakeholders.
• Political and economic uncertainty in the UK affecting investor and customer confidence.
• Changes to regulation or tax.
Group return on opening equity per cent
Dividend per share pence
Total shareholder return per cent
2016
2015
2014
6.4
5.7
5.3
2016
2015
2014
82.3
94.6
96.1
2016
2015
2014
9.9
10.8
9.7
2016
2015
2014
13.5
13.7
13.1
2016
2015
2014
10.2
10.2
9.2
2016
2015
2014
127
131
135
2016
2015
2014
3,032
2,860
2,669
2016
2015
2014
1,057
1,016
1,008
2015
2013
2011
88
90
86
2016
20153
2014
3.6
3.7
3.7
2016
2015
2014
128.4
120.5
101.0
2016
2015
2014
6
10
9
2016
2015
2014
18.9
19.5
17.9
2016
2015
2014
57.0
53.5
49.0
2016
2015
2014
(10)
18
26
Close Brothers Group plc Annual Report 2016S
trategicR
eport
Governance
FinancialS
tatements
13
Strategic objectives 2016 progress Future objectives Key risks1 Key performance indicators
Build Market Leading PositionsBuild strong market positions, using our expertise to provide excellent client service and develop long-term client relationships.
• Grew the loan book to £6.4 billion, while maintaining our strict lending criteria and strong returns.
• Continued to leverage our core capabilities in new markets, including our technology leasing business within asset finance.
• Winterflood demonstrated the strength of its business model despite the turbulent market conditions, delivering £19 million operating profit.
• Focus on delivering excellent service and maintaining strong client relationships.
• Continue to develop our brand and differentiators.
• Explore new opportunities to enter niche markets, while maintaining our model.
• Increase scale of client assets through organic growth, adviser hiring and small acquisitions.
• Lower demand for our products and services, impacted by economic and political conditions.
• Competitive pressures, particularly in parts of the Banking division.
• Loss of staff who are key to delivering on our strategy.
Loan book £ billion
Winterflood’s income £ million
Total client assets £ billion
Remain Prudent and EfficientHold an appropriate level of capital, funding and liquidity in all market conditions.
• Broadly unchanged CET1 ratio at 13.5%, remains ahead of regulatory requirements and provides strategic flexibility.
• Maintained strong credit ratings.• Successfully completed our first public
securitisation, providing further diversity while maintaining our prudent funding position, now at £8.2 billion.
• Regular stress testing of capital position to maintain flexibility.
• Maintain diverse funding sources and a prudent maturity profile.
• Maintain a conservative approach to liquidity with a prudent risk appetite.
• Changes to regulatory requirements.• Changes in market conditions
resulting in lower availability or higher cost of funding.
Common equity tier 1 capital per cent
Leverage ratio per cent
Funding % loan book per cent
Develop our Client PropositionInvest in people, technology and products and services to enhance our client proposition.
• Built on the strength of our people, including key adviser hires in Asset Management and the ongoing training of our direct sales force in Commercial Finance.
• Continued investment in technology in premium finance and Treasury, ensuring our infrastructure remains robust and serves our customers effectively.
• Continue investment in our infrastructure to improve resilience and operating capabilities.
• Continued training and support for our expert people, who are core to our model and delivering on our strategy.
• Develop delivery channels and services to meet evolving client needs.
• Technology and systems becoming obsolete.
• Inability to attract or retain high calibre people.
• Changes to consumer habits or market structure.
Total headcount Front office headcount
Employees satisfied/ very satisfied2 per cent
Maintain the Strength of our Business ModelConsistently apply our high quality business model throughout the economic cycle.
• Returns remained strong benefiting from the consistent application of our business model across the lending businesses.
• Winterflood continued to trade profitably in difficult markets, benefiting from the experience of its traders and resilient infrastructure.
• Positive net flows in Asset Management despite tough conditions.
• Maintain the disciplined lending criteria and customer led approach, to preserve the quality of the loan book and continue to lend through the cycle.
• Maximise Winterflood’s profitability in all market conditions.
• Build scale in Asset Management.
• Competition, leading to pricing pressure or narrowing expansion opportunities.
• Higher bad debts due to customer inability to service debt.
Return on net loan book per cent
Adjusted basic earnings per share pence
Net inflows per cent
Deliver Attractive Shareholder ReturnsGenerate sustainable shareholder returns through earnings growth and prudent management of our financial resources.
• Dividend up 7% to 57.0p, in line with our progressive dividend policy, with dividend cover maintained at 2.3 times.
• Continued strong return on opening equity of 18.9%, building on our long track record.
• Total shareholder return while negative outperformed vast majority of UK banking sector.
• Build scale across the business while maintaining our robust business model.
• Maintain appropriate dividend cover to sustain dividend growth.
• Continue to engage regularly with shareholders and external stakeholders.
• Political and economic uncertainty in the UK affecting investor and customer confidence.
• Changes to regulation or tax.
Group return on opening equity per cent
Dividend per share pence
Total shareholder return per cent
2016
2015
2014
6.4
5.7
5.3
2016
2015
2014
82.3
94.6
96.1
2016
2015
2014
9.9
10.8
9.7
2016
2015
2014
13.5
13.7
13.1
2016
2015
2014
10.2
10.2
9.2
2016
2015
2014
127
131
135
2016
2015
2014
3,032
2,860
2,669
2016
2015
2014
1,057
1,016
1,008
2015
2013
2011
88
90
86
2016
20153
2014
3.6
3.7
3.7
2016
2015
2014
128.4
120.5
101.0
2016
2015
2014
6
10
9
2016
2015
2014
18.9
19.5
17.9
2016
2015
2014
57.0
53.5
49.0
2016
2015
2014
(10)
18
26
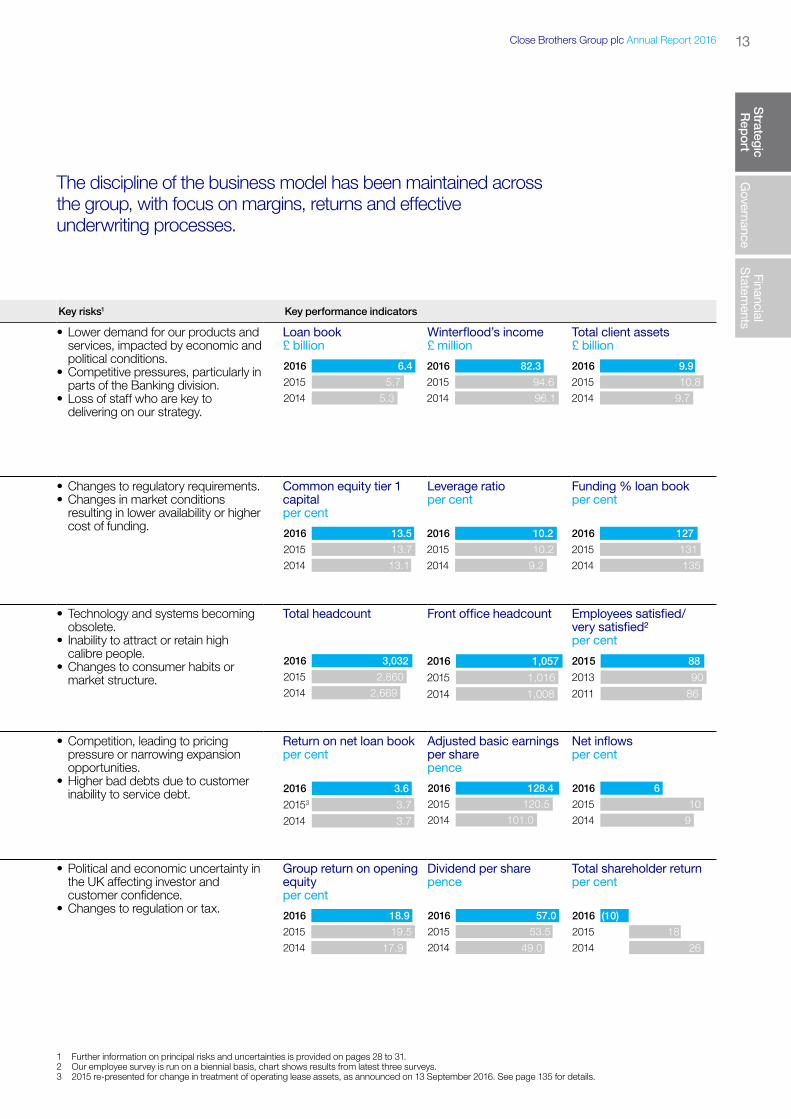
The discipline of the business model has been maintained across the group, with focus on margins, returns and effective underwriting processes.
1 Further information on principal risks and uncertainties is provided on pages 28 to 31.2 Our employee survey is run on a biennial basis, chart shows results from latest three surveys.3 2015 re-presented for change in treatment of operating lease assets, as announced on 13 September 2016. See page 135 for details.

Close Brothers Group plc Annual Report 201614
Financial Overview
We have a long track record of achieving strong financial performance through the cycle, underpinned by our simple balance sheet, diverse funding position and strong and prudent capital position.
Photographed on location at G&H Sheet Fed Ltd.

Close Brothers Group plc Annual Report 2016S
trategicR
eport
Governance
FinancialS
tatements
15
A Good Financial PerformanceIn 2016 operating income increased 2% to £687.4 million (2015: £672.8 million), driven by higher income from the Banking division, with good demand across all our lending businesses. This was partially offset by lower income in both Securities and Asset Management, reflecting the impact of more difficult market conditions and one-off items in the prior year.
Adjusted operating expenses increased 2% to £415.9 million (2015: £406.0 million) as we continue to actively invest to support long-term growth. At the same time, we maintain a tight focus on cost control across our businesses to balance investment and short-term earnings. As a result, the expense/income and compensation ratios remained broadly stable at 61% (2015: 60%) and 37% (2015: 37%) respectively.
Overall, this resulted in adjusted operating profit growth of 4% to £233.6 million (2015: £224.9 million), with the operating margin broadly unchanged at 34% (2015: 33%). The Banking division accounted for 95% of profits in the period, with adjusted operating profit up 7% to £223.0 million (2015: £208.7 million) supported by a further reduction in impairments. Winterflood achieved £19.0 million (2015: £24.6 million) operating profit, while Asset Management continued to make progress in client assets and delivered adjusted operating profit of £14.4 million (2015: £17.8 million). Group net expenses, which include the central functions such as finance, legal, compliance, risk and HR, reduced to £22.8 million (2015: £26.2 million).
The effective tax rate declined from 20.6% to 18.5% reflecting the one-off write up of deferred tax assets due to the bank corporation tax surcharge which came into effect in January 2016. In the 2017 financial year, we expect the effective tax rate to increase to around 26% reflecting the full year impact of the surcharge.
Adjusted basic earnings per share (“EPS”) increased 7% to 128.4p (2015: 120.5p), generating a return on opening equity of 18.9% (2015: 19.5%). Basic EPS, which includes £5.1 million amortisation of intangible assets on acquisition, also increased 7% to 125.7p (2015: 117.8p) on a continuing basis.
Results from continuing operations in the comparative year exclude the £0.9 million profit after tax and £10.3 million profit on disposal in relation to Close Brothers Seydler, our German securities business, the sale of which completed in 2015. There were no discontinued operations in 2016.
The board has proposed a 7% increase in the final dividend to 38.0p (2015: 35.5p), resulting in full year dividend growth of 7%. This reflects our progressive dividend policy, while ensuring we maintain appropriate cover to deliver sustainable dividend growth. Subject to shareholder approval at the Annual General Meeting, the dividend will be paid on 22 November 2016 to shareholders on the register at 14 October 2016.
Group Income Statement2016
£ million20151
£ millionChange
%
Operating income 687.4 672.8 2Adjusted operating expenses (415.9) (406.0) 2Impairment losses on loans and advances (37.9) (41.9) (10)
Adjusted operating profit 233.6 224.9 4 Banking 223.0 208.7 7 Securities 19.0 24.6 (23) Asset Management 14.4 17.8 (19) Group (22.8) (26.2) (13)
Amortisation of intangible assets on acquisition (5.1) (5.0) 2
Operating profit before tax 228.5 219.9 4
Tax (42.2) (45.4) (7)Non-controlling interests 0.2 –
Profit attributable to shareholders from continuing operations 186.5 174.5 7
Profit from discontinued operations, net of tax – 11.2
Profit attributable to shareholders from continuing and discontinued operations 186.5 185.7 –
Adjusted basic earnings per share 128.4p 120.5p 7Basic earnings per share 125.7p 117.8p 7Basic earnings per share (including discontinued operations) 125.7p 125.4p –Dividend per share 57.0p 53.5p 7Return on opening equity 18.9% 19.5%
1 Relevant figures and ratios for 2015 are re-presented for changes in treatment of operating lease assets and Treasury income, as announced on 13 September 2016. See page 135 for details.

Close Brothers Group plc Annual Report 201616
Financial Overview continued
Photographed on location at Castle Air Ltd.
Summary Balance SheetThe overall structure of our high quality and transparent balance sheet remains unchanged, and we have maintained our prudent capital, funding and liquidity positions. Our balance sheet is predominantly made up of loans and advances to customers which are short-term in nature (with an average maturity of 14 months (31 July 2015: 14 months) and around 90% secured); treasury assets held for liquidity purposes and settlement balances held within our Securities division. Other assets principally comprise intangibles, property, plant and equipment and prepayments.
In the year total assets increased to £8.7 billion (31 July 2015: £8.0 billion), with 12% growth in the loan book predominantly funded by increased customer deposits and borrowings. Settlement balances also increased, reflecting higher trading activity at Winterflood before the balance sheet date. The group’s return on assets was 2.1% (31 July 2015: 2.3%).
CapitalThe prudent management of capital is a core element of our business model and underpins our ability to grow our business while maintaining the confidence of shareholders, lenders, regulators and rating agencies. Our strong capital position and consistent profitability have allowed us to grow the loan book, invest in the business and pay a dividend to shareholders over many years.
In the 2016 financial year the common equity tier 1 (“CET1”) capital ratio remained broadly unchanged at 13.5% (31 July 2015: 13.7%), as continued profit generation largely offset an increase in risk weighted assets due to loan book growth and other balance sheet movements. Overall, CET1 capital increased around £90 million to just over £900 million, reflecting the increase in retained earnings in the period, while risk weighted assets grew to £6.7 billion (31 July 2015: £5.9 billion) principally due to higher credit and counterparty risk.
The leverage ratio, which is an unweighted measure of capital adequacy, remains strong and well ahead of regulatory requirements at 10.2% (31 July 2015: 10.2%).
This strong and prudent capital position ensures we continue to comfortably meet all regulatory requirements while maintaining flexibility for future growth.

Close Brothers Group plc Annual Report 2016S
trategicR
eport
Governance
FinancialS
tatements
17
Group Balance Sheet31 July
2016£ million
31 July 2015
£ million
AssetsLoans and advances to customers 6,431.6 5,737.8Treasury assets1 1,048.4 1,173.4Market-making assets2 576.9 481.9Other assets 691.3 564.2
Total assets 8,748.2 7,957.3
LiabilitiesDeposits by customers 4,894.6 4,481.4Borrowings 1,938.3 1,792.6Market-making liabilities2 505.6 404.3Other liabilities 312.8 269.1
Total liabilities 7,651.3 6,947.4
Equity 1,096.9 1,009.9
Total liabilities and equity 8,748.2 7,957.3
1 Treasury assets comprise cash and balances at central banks and debt securities held to support lending in the Banking division.2 Market-making assets and liabilities comprise settlement balances, long and short trading positions and loans to or from money brokers.
Group Capital Position31 July
2016 £ million
31 July 2015
£ million
Common equity tier 1 capital 901.4 813.2Total capital 925.4 848.0Risk weighted assets 6,682.5 5,932.1Common equity tier 1 capital ratio 13.5% 13.7%Total capital ratio 13.8% 14.3%Leverage ratio 10.2% 10.2%

Close Brothers Group plc Annual Report 201618
FundingOur Treasury function acts as a cost centre, managing funding and liquidity to support the lending businesses. In the year we continued to have good access to a wide range of funding markets, allowing us to maintain our diverse funding position, which includes retail and corporate deposits, unsecured bonds, secured funding and other wholesale facilities.
Total funding reached £8.2 billion (31 July 2015: £7.5 billion) and accounted for 127% (31 July 2015: 131%) of the loan book. This primarily reflects an increase in customer deposits to £4.9 billion (31 July 2015: £4.5 billion) as well as an increase in both secured and unsecured funding to support loan book growth. This includes an increase in our participation in the Funding for Lending Scheme to £451.0 million (31 July 2015: £375.0 million).
In June we raised £200 million of funds in a public securitisation of our motor finance receivables, further diversifying our funding sources.
Financial Overview continued
Term funding, with an average maturity of 31 months (31 July 2015: 31 months), covered two thirds of the loan book as we continue to apply our prudent “borrow long, lend short” principle.
During the year, both Moody’s Investors Services (“Moody’s”) and Fitch Ratings (“Fitch”) reaffirmed our credit ratings. Moody’s rates Close Brothers Group (“CBG”) A3/P2 and Close Brothers Limited (“CBL”) Aa3/P1, with stable outlooks. Fitch rates both CBG and CBL at A/F1 with stable outlooks.
LiquidityAs a group we hold a prudent level of liquidity that is in excess of internal and regulatory requirements, and we comfortably exceed the minimum level for the Liquidity Coverage Ratio requirements under Capital Requirement Directive IV which came into force on 1 October 2015.
At 31 July 2016 treasury assets were £1.0 billion (31 July 2015: £1.2 billion), with the majority held as high quality liquid assets, on deposit with the Bank of England. We also place surplus funding in certificates of deposit or other liquid securities.
Photographed on location at Wastewise Ltd.

Close Brothers Group plc Annual Report 2016S
trategicR
eport
Governance
FinancialS
tatements
19
Group Funding31 July
2016£ million
31 July 2015
£ million
Deposits 4,894.6 4,481.4Secured funding 1,296.3 1,220.8Unsecured funding1 866.0 808.2Equity 1,096.9 1,009.9
Total available funding 8,153.8 7,520.3
Of which term funding (>1 year) 4,315.7 4,018.7Total funding % loan book 127% 131%Term funding % of loan book 67% 70%Average maturity of term funding (excluding equity) 31 months 31 months
1 Unsecured funding excludes £21.0 million (2015: £8.6 million) of non-facility overdrafts included in borrowings and includes £245.0 million (2015: £245.0 million) of undrawn facilities.
Group Liquidity 31 July
2016£ million
31 July 2015
£ million
Bank of England deposits 847.4 1,038.0Certificates of deposit 201.0 115.3Gilts – 20.1
Total treasury assets 1,048.4 1,173.4
Close Brothers Group plc Annual Report 201620
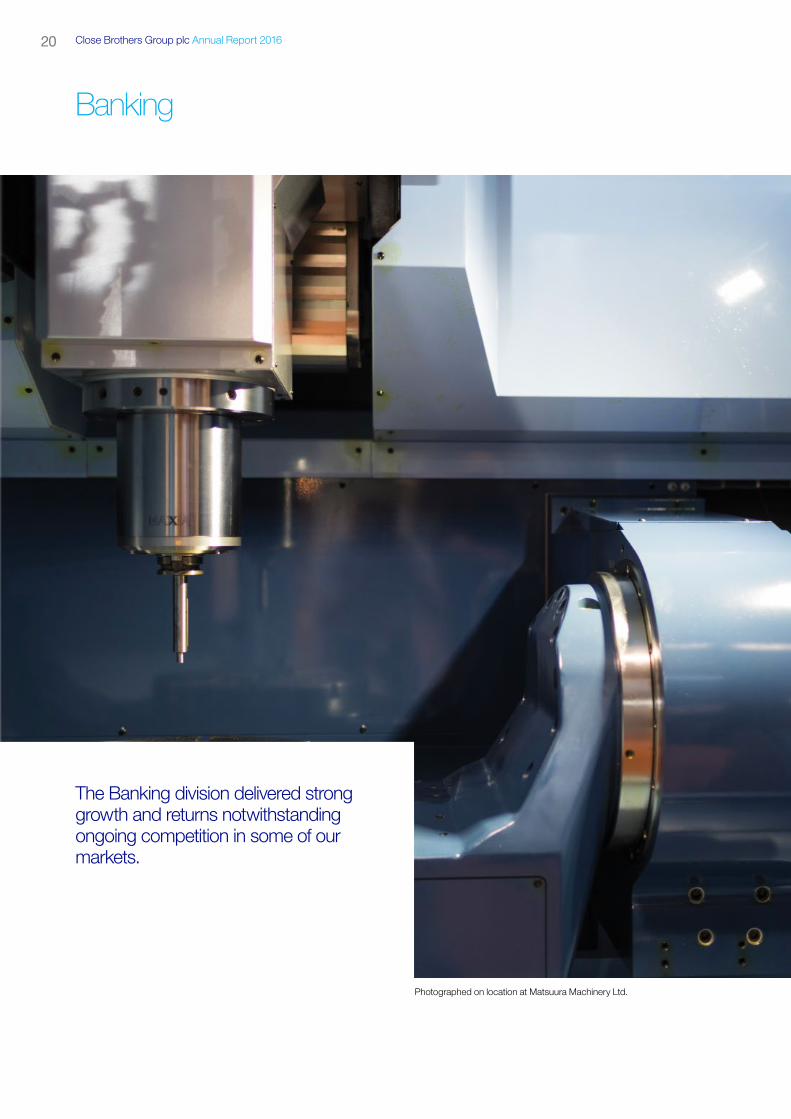
Banking
The Banking division delivered strong growth and returns notwithstanding ongoing competition in some of our markets.
Photographed on location at Matsuura Machinery Ltd.

Close Brothers Group plc Annual Report 2016S
trategicR
eport
Governance
FinancialS
tatements
21
Strategy and Market OverviewOur objective of sustainable growth and strong returns is supported by our approach to lending, the types of markets we choose to operate in and the way we conduct our business. We continue to invest in our business and our people, expanding our product offering and market reach in order to maintain the resilience of the business and support long-term growth. The markets we operate in continue to benefit from the benign credit environment, resulting in high levels of competition in some areas. However, our consistent and personal approach helps us maintain our strong customer relationships, lend profitably and grow through the cycle. Strong Financial Performance The loan book growth of 12% (2015: 8%) was driven by robust demand and an increasing contribution from new initiatives, while maintaining our strict risk and return criteria. As a result, the return on net loan book at 3.6% (2015: 3.7%) remains ahead of the long-term average of 3.4%.
Operating income grew 6% to £511.2 million (2015: £481.9 million), with good performance across all lending areas. Adjusted operating profit increased 7% to £223.0 million (2015: £208.7 million).
The net interest margin reduced to 8.2% (2015: 8.6%) principally due to ongoing price competition, especially in Commercial Finance, and lower fee income. While it is below the prior year, our approach remains consistent with strict lending criteria across our businesses and we have maintained a strong return on opening equity of 26% (2015: 27%).
Adjusted operating expenses increased 8% to £250.3 million (2015: £231.3 million) in the Banking division as we continue to invest in our IT systems as well as new strategic initiatives to support future growth, including our Training Academy in asset finance and continued expansion into adjacent markets. In the first half expenses increased 11% compared to income at 5%, partly reflecting the phasing of investment spend. In the second half, cost growth reduced to 5%, while income grew at 7% as we tightened cost control without impacting spend on key initiatives. This tight focus on cost is continuing, while ensuring that we maintain investment to maximise opportunities in the long term.
Overall, the expense/income ratio increased to 49% (2015: 48%), which remains consistent with previous cycles. The compensation ratio was broadly stable at 29% (2015: 28%).
The bad debt ratio continued to reduce to 0.6% (2015: 0.7%), with all businesses now at or near historical lows, benefiting from the benign credit environment and consistent application of our prudent underwriting criteria.
Diversified Business Model Driving Loan Book Growth During the year, the loan book increased 12% to £6.4 billion (31 July 2015: £5.7 billion) with strong demand across all our businesses and an increased contribution from new initiatives.
Retail FinanceRetail Finance provides intermediated finance, principally to individuals, through motor dealers, insurance brokers and retailers. The Retail Finance loan book increased 11% to £2.5 billion (31 July 2015: £2.3 billion) with good growth in both motor and premium finance. The motor finance loan book grew despite a competitive market environment, supported by strong underlying demand for second hand cars and associated finance. Growth was particularly strong in the Irish loan book, which now exceeds £290 million.
The premium finance book increased 16% to £770.5 million (31 July 2015: £665.7 million) driven by robust new business levels and greater penetration of existing brokers. We are investing to upgrade the IT systems within premium finance, which will modernise and simplify the customer experience, improve broker interaction and facilitate the future development of our business.
Although still small, our new consumer point of sale initiative has experienced good growth during the year and we are increasing the number of retailers we work with.
Overall, operating income in Retail Finance increased 10%, reflecting loan book growth and the pricing discipline embedded in our business model.
Commercial FinanceCommercial Finance, which focuses on specialist, secured lending to the SME market, achieved good growth in the period. The loan book increased 13% to £2.5 billion (31 July 2015: £2.2 billion) as a result of robust new business volumes, notwithstanding the competitive environment. Growth was particularly strong in more specialist lending areas, for example green energy where the loan book now exceeds £200 million.
Overall, the asset finance loan book grew at 13%, with the smaller invoice finance book increasing 14% in the period.
Our ongoing investment in growth initiatives includes the Training Academy in asset finance, set up to develop the next generation of specialist sales representatives. We also launched a new technology finance business, specialising in leasing IT and other technology equipment to corporate clients, which has started operating in the period.
Operating income in Commercial Finance rose 3%, with a higher loan book partly offset by pricing pressure, particularly in the broker distributed part of the business. However, we have seen good new business from our direct sales force, which accounts for over 50% of asset finance business, at continued strong margins.

Close Brothers Group plc Annual Report 201622
Banking continued
Photographed on location at Haynes Ford LTD.
Property FinanceProperty Finance is primarily focused on providing specialist residential development finance to well established professional developers in the UK. We do not lend to the buy-to-let sector, or provide any form of residential or commercial mortgages. At this point in the cycle, the business is performing very well, with historically low impairments and strong growth in profitability as we continue to see good demand for core residential development finance as well as for shorter-term bridging and refurbishment finance.
We have a successful track record of lending profitably and continue to apply the same prudent underwriting criteria with conservative loan to value ratios of 50% to 60% over a short-term period of six to 18 months. We know our borrowers well and have long established relationships with around 75% repeat business and a deep knowledge of the markets we operate in.

Close Brothers Group plc Annual Report 2016S
trategicR
eport
Governance
FinancialS
tatements
23
Key Performance Indicators
Net interest margin per cent2016
20151
2014
8.2
8.6
8.6
Bad debt ratio per cent2016
20151
2014
0.6
0.7
0.9
Return on opening equity per cent2016
2015
2014
26
27
25
Return on net loan book per cent2016
20151
2014
3.6
3.7
3.7
Key Financials2016
£ million20151
£ millionChange
%
Operating income 511.2 481.9 6Retail Finance 204.6 186.3 10Commercial Finance 202.3 195.9 3Property Finance 104.3 99.7 5
Adjusted operating expenses (250.3) (231.3) 8Impairment losses on loans and advances (37.9) (41.9) (10)
Adjusted operating profit 223.0 208.7 7
Average loan book and operating lease assets 6,226.4 5,629.2
1 Relevant figures and ratios for 2015 are re-presented for changes in treatment of operating lease assets and Treasury income, as announced on 13 September 2016. See page 135 for details.
Loan Book Analysis31 July
2016 £ million
31 July 2015
£ millionChange
%
Retail Finance 2,511.0 2,266.0 11Motor finance 1,740.5 1,600.3 9Premium finance 770.5 665.7 16Commercial Finance 2,463.4 2,172.8 13Asset finance 2,035.1 1,796.2 13Invoice finance 428.3 376.6 14Property Finance 1,457.2 1,299.0 12
Closing loan book 6,431.6 5,737.8 12
In recent years we have expanded our reach into other high quality regional locations, where we see attractive growth opportunities, while maintaining a strong presence in London, the South East and Scotland. Overall, the loan book increased 12% in the year to £1.5 billion (31 July 2015: £1.3 billion), with healthy new business volumes.
Operating income increased 5% and despite the ongoing competitive pressure on fees, we are confident in the quality of our loan book and our ability to continue to lend to our customers in all market conditions.
Opportunities for Future Growth at Consistently High MarginsLooking ahead we continue to see opportunities for growth while maintaining returns and are investing to expand our business and distribution capacity into new and existing markets. So far we have seen little direct impact on our business, and no significant change in customer behaviour, following the result of the EU referendum, but we continue to monitor developments closely.

Close Brothers Group plc Annual Report 201624
Securities
Winterflood has demonstrated the strength of its business model by continuing to trade successfully despite the turbulent market conditions experienced during the year.
Photographed on location at Winterflood Securities Limited.

Close Brothers Group plc Annual Report 2016S
trategicR
eport
Governance
FinancialS
tatements
25
Key Financials2016
£ million2015
£ millionChange
%
Operating income1 82.3 94.6 (13)Operating expenses (63.3) (70.0) (10)
Operating profit1 19.0 24.6 (23)
1 Operating income and operating profit include £3.8 million (2015: £6.8 million) and £1.9 million (2015: £3.5 million) respectively relating to the disposal of Euroclear shares.
Key Performance Indicators
Income £ million2016
2015
2014
82.3
94.6
96.1
Bargains per day ’0002016
2015
2014
52
60
56
Operating margin per cent2016
2015
2014
23
26
28
Return on opening equity per cent2016
2015
2014
21
26
28
Strong and Diverse Business Model Continues to DeliverWinterflood provides trading services to retail brokers and institutions. By applying our disciplined approach to risk and the experience of our traders and our proprietary technology, we have a long track record of trading profitably. This allows us to provide continuous liquidity in all market conditions and maintain our position as the leading UK market-maker.
Winterflood has traded successfully throughout the year maintaining its market leading position and delivering £19.0 million (2015: £24.6 million) operating profit. This includes £1.9 million (2015: £3.5 million) from the disposal of the remaining holding in Euroclear.
Operating income reduced 13% to £82.3 million (2015: £94.6 million) reflecting lower trading income across most trading sectors but particularly in AIM, which was impacted by the significant falls in commodity prices in the first half. Performance improved across all sectors in the second half with Winterflood successfully navigating the build up and the subsequent reaction to the EU referendum vote.
Average daily bargains decreased 14% to 51,864 (2015: 60,494), resulting from lower retail investor activity, primarily in the first half. However, activity increased in the second half and following the EU referendum in late June. There were four loss days in the second half, although volatility in the first half meant the total number for the full year increased to 17 (2015: 14) loss days.
Operating expenses decreased 10% as a result of Winterflood’s variable cost model. The expense/income and compensation ratios increased slightly to 77% (2015: 74%) and 48% (2015: 47%) respectively.
Remain ConfidentMarkets have remained active since the referendum vote, although the longer-term outlook remains uncertain. We are confident that our diversified and robust business model will enable us to remain profitable and provide continuous liquidity in a wide range of market conditions.

Close Brothers Group plc Annual Report 201626
Asset Management
Photographed on location at Alicat Workboats Ltd.
Although lower market levels have impacted the results for the year, we remain confident in our long-term strategy, and underlying demand for our products and services remains solid.
Challenging Conditions Affecting PerformanceAsset Management provides an integrated offering directly to private clients, combining financial planning advice and investment management, through our own advisers. In addition, we provide our investment management offering to third party advisers and directly to clients through our bespoke portfolio managers.
Asset Management delivered £14.4 million (2015: £17.8 million) adjusted operating profit with positive net flows of £508 million (31 July 2015: £700 million), or 6% (2015: 10%) of opening managed assets.
In the year we disposed of our corporate advice and investment management business. These activities included £682 million advised assets and £653 million managed assets at the time of disposal and contributed £3.1 million (2015: £5.8 million) income and £2.1 million (2015: £0.7 million) operating profit for the year, including a £1.7 million profit on disposal.
Excluding the corporate business and a one-off gain from our former private equity business in the prior year of £4.4 million, adjusted operating profit was broadly flat at £12.3 million (2015: £12.7 million).
Total income reduced 3% to £92.3 million (2015: £95.6 million), reflecting lower markets through much of the year and reduced inflows, which impacted recurring income and fees. The revenue margin decreased slightly to 86bps (2015: 88bps). Excluding the corporate business, the underlying revenue margin was 91bps (2015: 95bps).
Adjusted operating expenses remained flat at £77.9 million (2015: £77.8 million), while the expense/income ratio increased slightly to 84% (2015: 81%), as an increase in staff costs was offset by the sale of the corporate business. The compensation ratio remained broadly stable at 54% (2015: 53%).
Continued Positive InflowsTotal managed assets remained stable at £8.0 billion (31 July 2015: £8.0 billion) as net inflows and market movements were offset by the disposal of our corporate business. Although below the prior year, net inflows remained positive at 6%, and market movements benefited from the rise in markets at the period end.
Total client assets, which include advised assets under third party management, reduced to £9.9 billion (31 July 2015: £10.8 billion), principally reflecting the disposal of the corporate business.
Our investment strategy is intended to deliver long-term returns with a prudent investment approach, tailored to individual clients’ risk profiles. Although short-term performance has been affected by recent volatile markets, at the financial year end the majority of our funds and bespoke strategies were ranked first or second quartile over three years.

Close Brothers Group plc Annual Report 2016S
trategicR
eport
Governance
FinancialS
tatements
27
Key Financials2016
£ million2015
£ millionChange
%
Investment management 57.4 54.1 6Advice and other services 32.1 36.1 (11)Other income 2.8 5.4 (48)Operating income 92.3 95.6 (3)Adjusted operating expenses (77.9) (77.8) –
Adjusted operating profit 14.4 17.8 (19)
Movement in Client Assets31 July
2016 £ million
31 July 2015
£ million
Opening managed assets 7,996 6,922Inflows 1,238 1,477Outflows (730) (777)Net inflows 508 700Market movements 196 374Disposals (653) –Total managed assets 8,047 7,996Advised only assets 1,854 2,797
Total client assets1 9,901 10,793
Net flows as % of opening managed assets 6% 10%
1 Total client assets include £3.0 billion (31 July 2015: £2.7 billion) of assets that are both advised and managed.
Key Performance Indicators
Total client assets £ billion2016
2015
2014
9.9
10.8
9.7
Revenue margin bps2016
2015
2014
86
88
89
Operating margin per cent2016
2015
2014
16
19
12
Return on opening equity per cent2016
2015
2014
25
39
25
Continue Our Growth StrategyWe continue to execute our growth strategy to progress our core business through organic inflows, hiring of key advisers and small acquisitions.
During the year we agreed the acquisition of a high net worth independent financial advisory business based in London which will add around £350 million of advised assets and 600 clients, and is expected to complete in the first half of 2017. This is consistent with our strategy to support organic growth with small acquisitions, where we see a good cultural fit and low integration risk.
Following the year end we have entered into an agreement regarding the sale of OLIM Investment Managers, which will further increase our focus on our core integrated wealth management offering. The disposal represented around £490 million of managed assets at 31 July 2016, and contributed income of £2.5 million and adjusted operating profit of £0.9 million in the 2016 financial year.

Close Brothers Group plc Annual Report 201628
Principal Risks and Uncertainties
The group faces a number of risks in the normal course of business providing a range of financial services to small businesses and individuals. The group seeks to manage these risks by:• Adhering to our established and proven business model
outlined on pages 8 to 11;• Implementing an integrated risk management approach
based on the concept of “three lines of defence” which is outlined in detail on pages 51 and 52; and
• Setting clearly defined risk appetites monitored with clearly defined metrics within set limits.
A summary of the principal risks and uncertainties which may impact the group’s ability to deliver its strategy, how we seek to mitigate these risks and the change in the perceived level of risk over the year is set out below. The list of risks and uncertainties is unchanged from the prior year reflecting the group’s consistent strategy and approach.
This summary should not be regarded as a complete and comprehensive statement of all potential risks and uncertainties faced by the group but rather those risks which the group currently believes may have a significant impact on its performance and future prospects.
UK Referendum on EU MembershipFollowing the outcome of the UK referendum there is likely to be an extended period of uncertainty as the UK negotiates its exit from the EU.
As a predominantly UK lender we expect the direct impact on the group to be relatively limited. However the overall impact on the group and its customers of the expected prolonged period of uncertainty is difficult to predict. Therefore while the outcome of the referendum vote is not considered a principal risk for the group in itself, we believe a number of the principal risks and uncertainties have increased relative to the prior year as outlined below.
Risk Mitigation Change
Credit lossesAt 31 July 2016 the group hadloans and advances to customers totalling £6.4 billion. The group is exposed to credit losses if customers are unable to repay loans and outstanding interest and fees.
In addition the group has exposure to counterparties with which it places deposits or trades, and also has a small number of derivative contracts to hedge interest rate and foreign exchange exposures.
We seek to minimise our exposure to credit losses from our lending by:• Applying strict lending criteria when
testing the credit quality and covenant of the borrower;
• Maintaining consistent and conservative loan to value ratios with low average loan size and short-term tenor;
• Lending on a predominantly secured basis against identifiable and accessible assets;
• Maintaining rigorous and timely collections and arrears management processes; and
• Operating strong control and governance both within our lending businesses and with oversight by a central credit risk team.
Our exposures to counterparties are mitigated by:• Conservative management of our
liquidity requirements and surplus funding with £0.8 billion placed with the Bank of England;
• Continuous monitoring of credit quality of our counterparties within approved set limits; and
• Winterflood’s trading relating to exchange traded cash securities and being settled on a delivery against payment basis. Counterparty exposure and settlement failure monitoring controls are also in place.
The loan impairment rate has remained low reflecting our lending discipline as well as favourable market conditions.
The group’s other counterparty exposures are broadly unchanged with the majority of our liquidity requirements and surplus funding placed with the Bank of England.
However, we believe the heightened uncertainty for the UK economy following the referendum vote has increased the potential risk of higher credit losses.
Further commentary on the credit quality of our loan book is outlined on pages 21 to 23. Further details on loans and advances to customers and debt securities held are in notes 11 and 12 on pages 106 and 107 of the Financial Statements.
Our approach to credit risk management and monitoring is outlined in more detail in note 28 on page 128.
Key: No change Risk decreased Risk increased
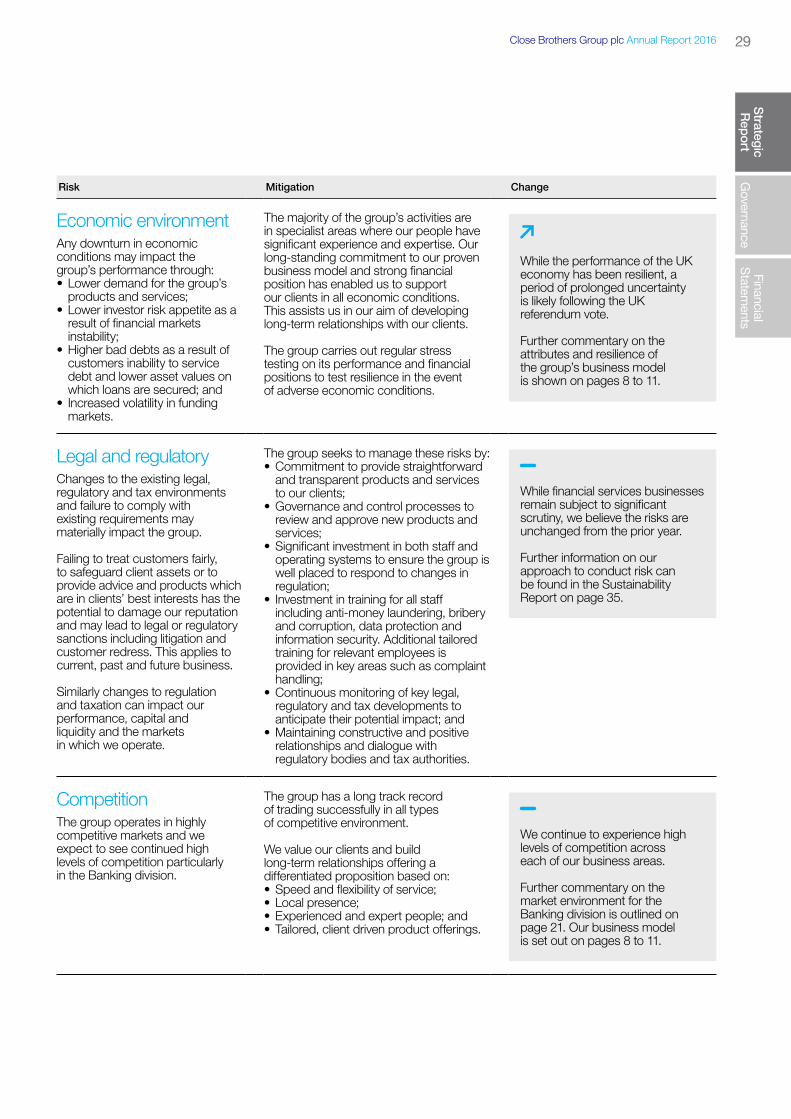
Close Brothers Group plc Annual Report 2016S
trategicR
eport
Governance
FinancialS
tatements
29
Risk Mitigation Change
Economic environmentAny downturn in economic conditions may impact the group’s performance through:• Lower demand for the group’s
products and services;• Lower investor risk appetite as a
result of financial markets instability;
• Higher bad debts as a result of customers inability to service debt and lower asset values on which loans are secured; and
• Increased volatility in funding markets.
The majority of the group’s activities are in specialist areas where our people have significant experience and expertise. Our long-standing commitment to our proven business model and strong financial position has enabled us to support our clients in all economic conditions. This assists us in our aim of developing long-term relationships with our clients.
The group carries out regular stress testing on its performance and financial positions to test resilience in the event of adverse economic conditions.
While the performance of the UK economy has been resilient, a period of prolonged uncertainty is likely following the UK referendum vote.
Further commentary on the attributes and resilience of the group’s business model is shown on pages 8 to 11.
Legal and regulatoryChanges to the existing legal, regulatory and tax environments and failure to comply with existing requirements may materially impact the group.
Failing to treat customers fairly, to safeguard client assets or to provide advice and products which are in clients’ best interests has the potential to damage our reputation and may lead to legal or regulatory sanctions including litigation and customer redress. This applies to current, past and future business.
Similarly changes to regulation and taxation can impact our performance, capital and liquidity and the markets in which we operate.
The group seeks to manage these risks by:• Commitment to provide straightforward
and transparent products and services to our clients;
• Governance and control processes to review and approve new products and services;
• Significant investment in both staff and operating systems to ensure the group is well placed to respond to changes in regulation;
• Investment in training for all staff including anti-money laundering, bribery and corruption, data protection and information security. Additional tailored training for relevant employees is provided in key areas such as complaint handling;
• Continuous monitoring of key legal, regulatory and tax developments to anticipate their potential impact; and
• Maintaining constructive and positive relationships and dialogue with regulatory bodies and tax authorities.
While financial services businesses remain subject to significant scrutiny, we believe the risks are unchanged from the prior year.
Further information on our approach to conduct risk can be found in the Sustainability Report on page 35.
CompetitionThe group operates in highly competitive markets and we expect to see continued high levels of competition particularly in the Banking division.
The group has a long track record of trading successfully in all types of competitive environment.
We value our clients and build long-term relationships offering a differentiated proposition based on:• Speed and flexibility of service;• Local presence;• Experienced and expert people; and• Tailored, client driven product offerings.
We continue to experience high levels of competition across each of our business areas.
Further commentary on the market environment for the Banking division is outlined on page 21. Our business model is set out on pages 8 to 11.

Close Brothers Group plc Annual Report 201630
Principal Risks and Uncertainties continued
Risk Mitigation Change
TechnologyMaintaining robust and secure IT infrastructure, systems and software is fundamental to allow the group to operate effectively, respond to new technology, protect client and company data and counter the evolving cyber threat.
Failure to keep up with changing customer expectations or manage upgrades to existing technology has the potential to impact group performance.
The group continues to invest in its IT infrastructure, information security and software as well as our technology teams to ensure we maximise the benefits of our investment across the group. We also continue to invest strategically in cyber defence processes and tools, customer experience improvements and further strengthening of core systems.
The group has strong governance in place to oversee its major projects.
We have in place business continuity, crisis management and disaster recovery plans which are regularly tested.
The group continues to invest and upgrade its IT infrastructure to simplify our technology architecture and reduce exposure to cyber attack. However, the risk of cyber threats or new technology impacting our business model remains.
For further information on our response to cyber threats see page 54 of the Corporate Governance report.
EmployeesThe calibre, quality and expertise of employees is critical to the success of the group. The loss of key individuals or teams may have an adverse impact on the group’s operations and ability to deliver its strategy.
The group seeks to attract, retain and develop staff by:• Operating remuneration structures
which are competitive and recognise and reward performance;
• Implementing succession planning for key roles;
• Improving our talent pipeline via our graduate and school leavers programmes, and training academy in asset finance;
• Investing in training and development for all staff; and
• Delivering leadership development programmes to develop current and future leaders for the group.
Our highly skilled people are likely to be targeted but we are confident we are able to retain key employees.
Further detail on the employee survey and our investment in our people is outlined in the Sustainability Report on pages 33 to 35.
FundingThe Banking division’s access to stable funding remains key to support its lending activities and the liquidity requirements of the group.
At 31 July 2016 the group’s funding position was strong with total available funding equal to 127% of the loan book. This provides a prudent level of liquidity to support our lending activities. The group’s funding and liquidity positions were prudently positioned ahead of the UK referendum vote.
Our funding is well diversified both by source, type and tenor. Liquidity in our Banking division is assessed on a daily basis to ensure adequate liquidity is held and readily accessible in stressed conditions.
Our funding approach is conservative based on the principle of “borrow long, lend short”. Over half of our total funding is repayable after more than one year with an average duration of 31 months. This compares to our weighted average loan maturity of 14 months.
We have further diversified our funding during the year with our first public securitisation. The diversity of funding combined with relatively long tenor when compared to the average duration of our lending means we are well placed.
While economic uncertainty has the potential to impact funding markets, overall the group remains well funded and continues to have good access to a wider range of funding sources.
Further commentary on funding and liquidity is provided on pages 18 and 19. Further financial analysis of our funding is shown in note 19 on page 113 of the Financial Statements.
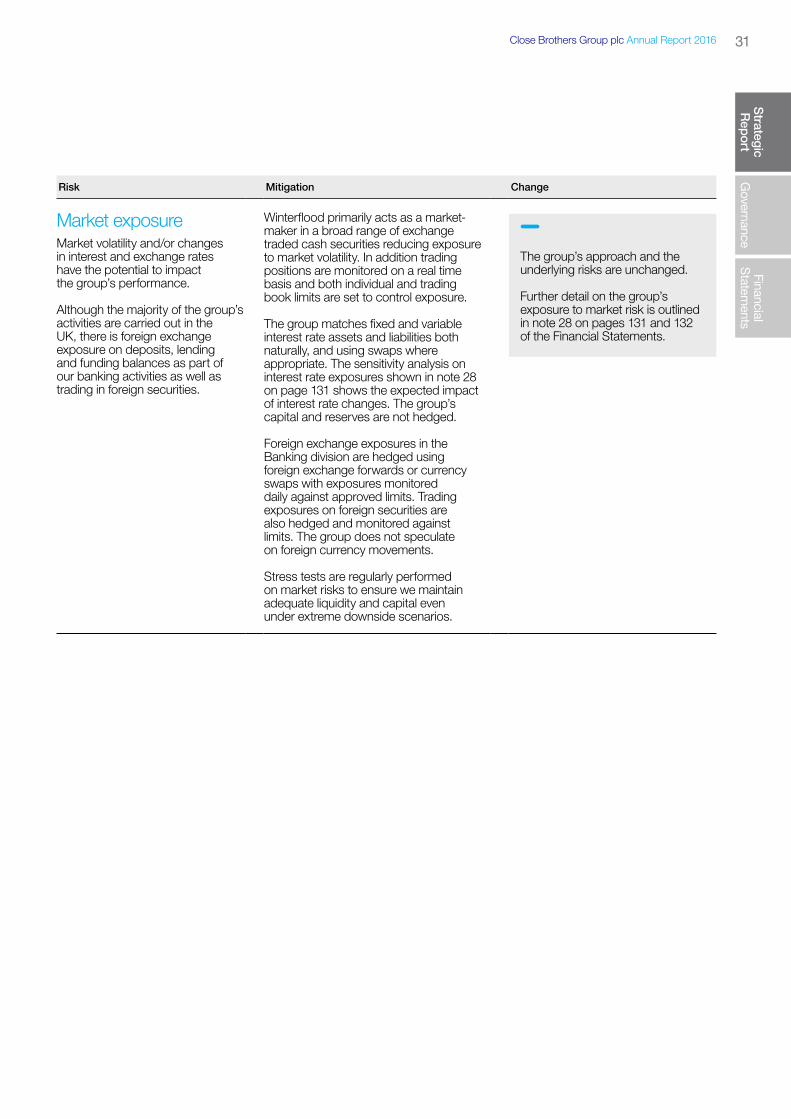
Close Brothers Group plc Annual Report 2016S
trategicR
eport
Governance
FinancialS
tatements
31
Risk Mitigation Change
Market exposureMarket volatility and/or changes in interest and exchange rates have the potential to impact the group’s performance.
Although the majority of the group’s activities are carried out in the UK, there is foreign exchange exposure on deposits, lending and funding balances as part of our banking activities as well as trading in foreign securities.
Winterflood primarily acts as a market-maker in a broad range of exchange traded cash securities reducing exposure to market volatility. In addition trading positions are monitored on a real time basis and both individual and trading book limits are set to control exposure.
The group matches fixed and variable interest rate assets and liabilities both naturally, and using swaps where appropriate. The sensitivity analysis on interest rate exposures shown in note 28 on page 131 shows the expected impact of interest rate changes. The group’s capital and reserves are not hedged.
Foreign exchange exposures in the Banking division are hedged using foreign exchange forwards or currency swaps with exposures monitored daily against approved limits. Trading exposures on foreign securities are also hedged and monitored against limits. The group does not speculate on foreign currency movements.
Stress tests are regularly performed on market risks to ensure we maintain adequate liquidity and capital even under extreme downside scenarios.
The group’s approach and the underlying risks are unchanged.
Further detail on the group’s exposure to market risk is outlined in note 28 on pages 131 and 132 of the Financial Statements.

Close Brothers Group plc Annual Report 2016
Photographed on location at Barfoots of Botley Ltd.
At Close Brothers, we are proud of our long-standing reputation built on our conservative business model, prudent underwriting, continuous support of our clients and our dedicated and motivated workforce. We want to continue to make a positive impact on all our stakeholders by concentrating on areas which matter to them and where we can make the most difference.
32
Sustainability Report

Close Brothers Group plc Annual Report 2016S
trategicR
eport
Governance
FinancialS
tatements
33
Strong Commitment to our StakeholdersThe group remains committed to acting responsibly, ethically and with integrity in our interaction with clients and staff, our role in the community and our environmental footprint.The management of sustainability issues is embedded in our business and supported by relevant risk policies and management oversight, with updates on employee and responsible finance matters regularly appearing on group and divisional risk committee agendas.
Over the year, we introduced a number of new initiatives aimed at improving customer experience and staff development, while continuing to reduce our environmental impact and supporting wider communities.
Our EmployeesWe believe that our staff are fundamental to our business and we are committed to building a culture where people strive to perform, where they feel inspired to make a difference and are well rewarded for their contribution.
We listen and value the feedback we get from employees and use it to work together to create a better workplace with continued improvements and increased performance across the whole business. We have implemented a number of initiatives to support the ongoing engagement and development of our staff, as well as making us attractive in the external market.
Engaging our peopleWe track the engagement of our staff through our group-wide employee engagement survey, which is run every two years, and due to be run again at the end of the calendar year. Our last set of survey results, which were released in early 2015, were particularly strong, with 88% of employees surveyed indicating that they were satisfied working for Close Brothers, and we also had a high overall response rate of 87%.
Despite being proud of these results, we are not complacent, with all our executive teams having set and committed to action plans for their divisions. These action plans focused not only on what we could improve, but on maintaining the areas where we scored highly, to ensure that we maintain those standards and continue to build on our strengths. The action plans are supported by local plans and activities, and their progress has been tracked with local pulse surveys and focus groups over the past 18 months.
Developing our peopleWe are committed to providing opportunities for our people to fully realise their potential and develop their career within Close Brothers. Earlier this year we implemented a new recruitment system which has facilitated the promotion of internal vacancies across the group.
We have a wide selection of internal courses to support personal skills development. All employees are encouraged to undertake formal training and on average have completed over seven continuing professional development hours over the past year. However, our learning ethos looks beyond just providing courses and places value on experiential and on-the-job learning, ensuring continuous learning opportunities through experience and through others. All our Banking division staff will soon have access to a new online learning portal, which will provide access to a library of online courses covering a wide range of technical and personal skills.
Individual development is further supported through both group-wide and local mentoring schemes, which provide individuals with an opportunity to build relationships outside of their immediate remit, and obtain support in navigating their development journey.
We have introduced a number of programmes to develop our pipeline of up and coming talent. Our ASPIRE school leavers programme is a two year rotational scheme that has been running successfully since 2013, giving school leavers the opportunity to kick-start their career in a professional, challenging and fast-paced environment. We also provide full sponsorship for the Professional Certificate in Banking through the Institute of Financial Services alongside developing on-the-job experience. Our graduate programme provides an opportunity for new graduates to join functional business teams and obtain practical, on-the-job training as well as additional mentoring support and an opportunity to study towards a relevant professional qualification to support their career development.
To develop our next generation of professionals within asset finance, the Training Academy was launched in September 2015. The first intake is focused on sales and provides the 30 candidates with two years of classroom and field based training, along with mentoring from some of our experienced sales managers. In addition, Close Brothers Asset Management launched their Adviser Academy this year, to develop skills and provide career advancement opportunities for our financial advisers. Following the success of the first cohort, the programme will now be rolled out to all existing advisers.
We have a robust process in place for monitoring our key internal talent and identifying succession plans for key and critical roles. Talent conversations are held within functions and businesses to ensure we have a clear picture of our upcoming talent pipeline, and succession plans for key roles are reported to the board annually.

Close Brothers Group plc Annual Report 201634
Sustainability Report continued
Photographed on location at G&H Sheet Fed Ltd.
Our Emerging Leaders Programme is an opportunity for our pool of future leaders to build a network, receive constructive feedback and focus on their development in a safe and supportive environment. This successful programme has just completed its fourth cohort in July 2016.
Remuneration and benefitsAs part of our commitment to continuously improve our employee proposition, last year we conducted a comprehensive review of our benefits package across the group and have introduced some new and enhanced benefits to further support our people in the areas that are most important to them. These include their wellbeing, work-life balance as well as options around saving for the future.
The new offering includes the opportunity to purchase additional holiday, a further enhancement of our maternity and adoption leave, introduction of shared parental leave, and a back up care scheme for child and elderly care, as well as the introduction of a low-emission car salary sacrifice scheme. This is in addition to the benefits that were already in place, which included a group-wide company pension scheme, life insurance and private medical insurance, childcare vouchers, a staff discount scheme, a cycle to work scheme and interest free season ticket loans.
To support our staff with saving for the future, we offer a Save As You Earn scheme, intended to encourage saving and build long-term share ownership, as well as a Buy As You Earn share incentive plan allowing employees to acquire shares on a monthly basis out of pre-tax earnings.
Currently around 40% of our employees are participating in at least one of these schemes.
Diversity and equalityDiversity is a key focus of the board and executive committees, and we continuously endeavour to make Close Brothers appealing to a diverse population. Our Equal Opportunity and Dignity at Work policy is in place to ensure equal, respectful and dignified treatment throughout our recruitment process and through all stages of the employee lifecycle. We are committed to supporting all individuals in realising their full potential and contributing to our company’s success irrespective of gender, race, age, disability, sexual orientation or religion, and will not tolerate harassment or discrimination of employees in any form.
Our last employee survey reported that 88% of staff across the group who took part in the survey believe that Close Brothers treats their employees fairly regardless of gender, ethnicity or for any other diversity reasons.
We regularly monitor and report on our diversity metrics, and share this with our senior leadership teams. Our workforce is made up of 44% females, 23% of our employees are under 30 years old, and 15% are over 50. Our board and executive committee each have three female members, meaning we already meet the new recommended voluntary target for FTSE 350 companies, set out in the “Women on Boards Davies Review” to have a minimum of 33% female directors by 2020. In this five year summary of progress into improving gender balance on British boards, published in October 2015, our board was ranked equal 17th in the FTSE 250 in terms of gender diversity, with a female representation of 33% compared to the average female representation on FTSE 250 boards of 20%.

Close Brothers Group plc Annual Report 2016S
trategicR
eport
Governance
FinancialS
tatements
35
Responsible financeWe have a wide range of policies in place across all our divisions to ensure that our staff and management are aware of their responsibilities towards our customers and comply with all regulatory requirements. We promote best practice and strict compliance with relevant rules and regulations supported by a range of compulsory training programmes for all employees. The relevant policies include:
Conduct risk and treating customers fairlyThe conduct risk framework has been enhanced, and a greater range of risk indicators are being used in the production of monthly management information. This gives senior management a broader view of conduct related behaviours and demonstrates that conduct risk is well embedded within the culture of Close Brothers.
Anti-money laundering regulationsWe have implemented policies and procedures in accordance with anti-money laundering regulations and have dedicated money laundering reporting officers where required.
Whistle-blowing policyOur whistle-blowing procedure has been enhanced ahead of the new rules which came into effect in September 2016, with the appointment of a Whistle-blowers’ champion. We have also introduced a confidential telephone whistle-blowing service, operated by a third party provider. Additional training has been rolled out across the group ensuring that staff are aware of the new enhanced process.
Anti-bribery and corruption policyOur anti-bribery and corruption policy sets out the group standards and best practice for business conduct under the Bribery Act 2010.
Privacy policyOur privacy policy ensures the protection and correct treatment of client data in accordance with the Data Protection Act 1998.
Health and safety policyOur health and safety policy ensures the provision of a safe and healthy working environment for our employees and visitors in accordance with The Management of Health and Safety at Work Regulations 1999.
Our strategy to promote a diverse workforce is focused on building a genuinely meritocratic culture. We examine all areas and build our diversity focus into all our people related activities, including compensation review, talent and succession planning, leadership programmes, the development of our benefits package, recruitment, training and development.
Some of the initiatives that we have introduced to support diversity include:• Working with our leadership teams to raise awareness
about unconscious bias and about the benefits of supporting female talent and making our organisation appealing to a more diverse population.
• Further enhancing maternity and adoption leave, and introducing enhanced shared parental leave to the same level to allow more flexibility in caring for young children.
• Introducing an emergency back up care benefit for staff, allowing access to a network of childcare and eldercare providers when normal care arrangements fail.
• Promoting flexible working where possible.• Ensuring a consistent and clear tone from the top on our
approach to diversity. Our chief executive is a member of the 30% Club, an organisation focused on promoting good gender balance at all levels in organisations.
• Introducing a new recruitment system which allows us to monitor the diversity of job applicants, so that we can ensure we are attracting potential candidates from a variety of backgrounds.
Our CustomersOur reputation as a leading merchant banking group is built on our strong culture and persistent focus on our customers and their needs. We continuously strive to improve the customer experience across all our businesses and maintain the highest standards in all our dealings with clients. Over the year we have made particular improvements around data protection and cyber security and introduced “Customer Experience” and “Operational Excellence” programmes within our Banking division. These are focused on delivery of the right technologies and services for our customers, supported by streamlined and simplified operational processes.
Gender DiversityMale Female
Number of board directors1 6 3Number of directors of subsidiaries2 60 8Number of senior employees, other than board directors3 17 8Number of employees, other than board directors and senior employees 1,614 1,329
1 Includes non-executive directors, excluded from group headcount calculations.2 Includes subsidiary directors who are excluded from group headcount calculations.3 Senior employees indentified as Material Risk Takers who are not directors or subsidiary directors.

Close Brothers Group plc Annual Report 201636
Sustainability Report continued
Photographed on location at JAH Plant Hire Ltd.
During the year we implemented a new risk assessment process that gives us full oversight of health and safety risk management across the business, ensuring compliance with appropriate legislation.
Additional firm wide policies are in place to ensure the highest standards in all our dealings with clients and other stakeholders:
Complaints handlingWe take all complaints seriously, with each division monitoring customer complaints to ensure they are dealt with efficiently and promptly, with action taken to prevent future recurrence.
Customer data and privacyDuring the year we have conducted the first group-wide audit of data protection, which will be conducted on a biennial basis.
We constantly monitor and enhance our systems and controls to ensure that our clients are safeguarded against system failure or cyber attack. We are now an active member of GCHQ’s Cyber Information Sharing Partnership. The partnership provides early warning and allows intelligence sharing across the industry.
Human rights and Modern Slavery ActThe board gives due regard to human rights considerations, as defined under the European Convention on Human Rights and the UK Human Rights Act 1998.
We are aware of our responsibilities and obligations under the Modern Slavery Act and are in the process of implementing the systems and controls ensuring compliance on a group level.
Customer experienceOur customers are fundamental to our business and we constantly monitor ways to improve their experience of doing business with us. This strong focus on our customers is evidenced by high levels of repeat business and net promoter scores (“NPS”). We use the industry standard NPS measure to assess the customer satisfaction and loyalty across most of our businesses. The NPS ranges from -100 to +100, depending on how likely customers are to recommend our company. Our scores continue to remain at strong levels relative to the wider banking sector, with asset, motor and Treasury all achieving a score of +50 or above.
During the year, we have set up “Customer Experience” and “Operational Excellence” programmes within the Banking division, as tools that will allow us to anticipate the rapidly changing needs of our customers and to develop new services to meet those needs. These new initiatives have been designed to create and embed a culture of continuous improvement, which encourages collaborative working across businesses. This approach will help us to better understand our customers, and to identify opportunities to improve the way we operate across all business processes which will enhance the overall customer experience.

Close Brothers Group plc Annual Report 2016S
trategicR
eport
Governance
FinancialS
tatements
37
We continue to run customer forums at both a divisional and business unit level, which are designed to ensure that we continue to offer our customers consistently high quality experiences and outcomes. Within our Banking division, the seven separate forums focus on five key customer principles, which define their scope and objectives:• We seek to ensure the right outcomes for our customers.• We endeavour to ensure our pricing is fair and appropriate.• We are clear and consistent in the way we communicate
with customers.• We expect our standards to be upheld by our partners.• We are responsible lenders and deposit takers.
Alongside the customer forums, direct feedback is regularly collected via customer and staff surveys, targeted research, complaints analysis and mystery shopping exercises.
We want to ensure that the complaint handling process is as fair as possible providing a single point of contact whenever possible and we continuously review and improve our processes to deliver fast and satisfactory outcomes for customers. We have policies and training in place to ensure our staff can identify vulnerable customers and that they are treated fairly in our interaction with them.
The strong focus on our customers is further reflected in the following awards won during the year: The 2016 Best Business Award for our asset finance business; Best Factoring & Invoice Discounting Provider for invoice finance; and Best Business Motor Finance Provider for our motor finance business.
Our CommunitiesAt Close Brothers, we strive to make a positive contribution to the communities we operate in. We have invested in a number of community based initiatives across the group and encourage our employees to get involved with a range of initiatives that matter to them.
The Close Brothers SME Apprentice Programme continued the success of its first year by launching phase two in 2016. Last year, we piloted this unique scheme, by contributing to the funding of 20 new apprentices in the Sheffield area. We are proud to support a further 20 this year, in the Birmingham area. With the skills gap weighing heavily on the UK manufacturing sector, the scheme helps SMEs to tackle the issues of cost and red tape so they can take on an apprentice and invest in a new generation of skilled workers. The programme runs in partnership with the Manufacturing Technologies Association and manufacturing training centres AMRC and EEF.
Our Trustee Leadership Programme, launched in 2014 by our Asset Management division in partnership with social enterprise Cause 4, was developed to give young professionals the skills and confidence to take on a board level role within a charity. This is a fulfilling and career enriching opportunity for the individuals, while also providing
the charities themselves with a fresh and diverse pool of potential board members. The programme is open to Close Brothers employees as well as to external professionals. To date, 297 delegates have completed the programme, and 91 of those have since been matched with board positions within charitable organisations. Following the success of the London-based programme, a second programme is being launched in Manchester later this year.
In addition to group-wide community activities, many of our local businesses are involved in their regional communities. From supporting a local primary school in helping children learn to read, to running a beer festival to support a local hospital, we encourage our people to use their strengths to support their local communities and get involved in initiatives that matter to them.
The group Corporate Social Responsibility (“CSR”) Committee is chaired by our group head of human resources and supported by employees across the group; we also have a number of local CSR committees which run initiatives to raise funds for charity.
Charitable ActivitiesThe group’s charitable donations have continued to increase and we contributed a total of £278,392 during the 2016 financial year, which is a 6% increase on 2015.
For the past four years, we have partnered with Cancer Research UK, which remains the staff’s chosen charity. Every year, we run a group-wide charity week, and in 2016, we are very proud to say that we held our most successful charity week ever, donating over £74,000 to Cancer Research UK, more than double the amount raised in the prior year. The week consisted of a number of locally organised events for staff, as well as some group-wide initiatives, and resulted in Close Brothers receiving a Flame of Hope Special Commendation Award from Cancer Research UK in their corporate fundraising category.
Our Close Brothers Matched Giving Scheme encourages staff to fundraise and volunteer for the charities they support by matching 50% of funds raised, or donating £8 per hour of voluntary time given by employees. We also match funds raised by other local, organised fundraising activities, encouraging employees to work together to raise money for causes that are close to their hearts. This financial year we matched over £69,000.
In addition, we match contributions under our Payroll Giving scheme, which allows employee donations to be made directly from pre-tax salary. Over 14% of employees across the group are signed up to Payroll Giving, allowing us to maintain our Payroll Giving Quality Mark Gold Award for the sixth consecutive year. Each of our divisions individually hold either Platinum or Gold awards, with participation ranging from 14% to over 20% across the divisions.

Close Brothers Group plc Annual Report 201638
Sustainability Report continued
Photographed on location at Matsuura Machinery Ltd.
Our EnvironmentHere at Close Brothers we care about the environment we operate in and are aware of our responsibility to protect natural resources and to behave sustainably. We believe, that as a financial services company, our environmental impact is limited and mostly driven by staff travel, our supply chain and our office network.
While relatively small, we continue to monitor ways to reduce this impact by lowering our energy consumption, reducing emissions and waste and increasing recycling. Each of our businesses manages its resources and recycling locally and all Banking division sites are now supplied from renewable sources.
In addition to this, we are a significant provider of finance to the green energy sector. Launched in 2014, our green energy lending business provides finance for wind, solar and hydro power developments, focusing on projects which are typically too small for standard project finance providers.
Energy consumptionWe have completed an energy audit under the Energy Savings Opportunity Scheme regulations for the first time in December 2015. This new scheme requires large UK businesses to undertake an energy audit every four years which will aim to identify energy efficiency opportunities, leading to significant savings on future energy bills.
Close Brothers also participated in the CDP (formerly the “Carbon Disclosure Project”) this year, which involves disclosure of our greenhouse gas emissions on a voluntary basis.
Waste reduction and recyclingWe continue to reduce water and paper usage across all our offices by encouraging secure and duplex printing, and monitor waste reduction via a third party provider. Waste recycling is encouraged in all our offices, and in 2016 at our head office, we avoided 238 cubic metres of landfill and saved 314 trees.
We also encourage our employees to reduce their individual environmental impact by offering a cycle to work scheme and by providing leasing of low emission cars as part of our travel policy.
Greenhouse gas (“GHG”) emissionsIn line with the GHG Protocol framework, we have calculated the GHG emissions associated with our Scope 1 and 2 operations. Scope 1 includes fuel emissions from buildings and company vehicles, and Scope 2 includes our emissions from electricity.
In 2016, our total GHG emissions were 6,730 tonnes of carbon dioxide equivalent (“tCO2e”), equating to 2.28 tCO2e per employee, down 2.8% overall and 8.8% per employee since 2015. The largest source of GHG emissions was our Scope 2 electricity consumption. The relocation of our staff from the Tolworth office to a more energy efficient building in Wimbledon at the beginning of the year was the primary driver behind the reduction in our electricity and overall tCO2e emissions in 2016. Given its relative size our Banking division continues to account for the majority of our GHG emissions. The majority of the increased fuel (owned vehicles) consumption in 2016 was driven by the growth in the Banking division front office staff during the year.
A full breakdown of our 2016 GHG emissions, together with corresponding data for 2015, is shown on page 39.

Close Brothers Group plc Annual Report 2016S
trategicR
eport
Governance
FinancialS
tatements
39
CalculationWe have continued to gather data, working with an independent third party GHG emissions reporting company. This verifies the accuracy of our data and enables us to monitor our performance.
Our total GHG emissions are reported as tCO2e and are calculated in line with the GHG Protocol framework. In addition to reporting our total emissions, we have also disclosed the emissions per employee as an intensity metric to enable a comparable analysis.
OutlookWe will continue to monitor and report our GHG emissions, working to improve our energy efficiency across our businesses.
We encourage our offices to report their Scope 3 emissions for water and waste each quarter, where this information is available, to facilitate continued performance monitoring.
The Strategic Report was approved by the board and signed on its behalf by:
Preben PrebensenChief Executive
27 September 2016
GHG Emissions Summary (tCO2e)Scope GHG emissions source 2016 20151
Scope 1 Fuel (Buildings) 160 165 Fuel (Owned vehicles) 3,229 2,677Scope 2 Electricity 3,341 4,079
Total GHG emissions 6,730 6,921
Average number of employees 2,946 2,767Total per employee 2.28 2.50
1 The prior year figures exclude the impact of discontinued activities, following the disposal of Close Brothers Seydler on 5 January 2015.
GHG Emissions by Division (tCO2e)
Banking AssetManagement
Group Securities
2016 2015
878
4,088 3,787
1,153 787 977898 1,083
Note: “Group” reflects the group headquarters which includes some Banking division businesses.

Governance42 Board of Directors44 Executive Committee45 Report of the Directors47 Corporate Governance60 Report of the Board on Directors’ Remuneration
Photographed on location at G&H Sheet Fed Ltd.
Close Brothers Group plc Annual Report 201640

Close Brothers Group plc Annual Report 2016S
trategicR
eportG
overnanceFinancial
Statem
ents41

Close Brothers Group plc Annual Report 2016
Board of Directors
42
Board of Directors
Strone MacphersonChairman
Strone was appointed a director in March 2003, senior independent director in 2004, deputy chairman in 2006 and chairman in June 2008. He is chairman of the Nomination and Governance Committee.
Strone is also chairman of British Empire Securities and General Trust plc and a trustee of the King’s Fund. He was previously a director of Flemings, chairman of Tribal Group plc and of JP Morgan Smaller Companies Investment Trust plc, executive deputy chairman of Misys plc and a non-executive director of AXA UK plc and of Kleinwort Benson Private Bank Limited.
Elizabeth LeeGroup Head of Legal and Regulatory Affairs
Elizabeth was appointed a director in August 2012 with responsibility for legal and regulatory affairs.
Elizabeth joined Close Brothers as general counsel in September 2009. She was previously with Lehman Brothers and General Electric’s financial services businesses and prior to that she was a partner at the law firm Richards Butler (now Reed Smith).
Jonathan HowellGroup Finance Director
Jonathan was appointed to the board as group finance director in February 2008 when he joined Close Brothers.
Jonathan was previously group finance director of London Stock Exchange Group plc from 1999 to 2008. Prior to that he was at Price Waterhouse where he qualified as a chartered accountant. He is also a non-executive director of The Sage Group plc where he is chairman of the audit committee.
Preben PrebensenChief Executive
Preben was appointed to the board as chief executive in April 2009 when he joined Close Brothers.
Preben previously spent his career in a number of senior positions at JP Morgan over 23 years, as well as being chief executive of Wellington Underwriting plc from 2004 to 2006, and then chief investment officer and a member of the group executive committee at Catlin Group Limited.
Stephen HodgesManaging Director and Banking Chief Executive
Stephen was appointed a director in August 1995 with responsibility for the Banking division and became managing director in November 2002.
Stephen spent eight years at Hambros before joining the Banking division of Close Brothers in 1985.
zz_198390 Close Bros.indb 42 28/09/2016 14:20:09

Close Brothers Group plc Annual Report 2016S
trategicR
eportG
overnanceFinancial
Statem
ents43
Geoffrey HoweSenior Independent Director
Geoffrey was appointed a director in January 2011 and is senior independent director.
Geoffrey is chairman of Jardine Lloyd Thompson Group plc. He was previously chairman of Railtrack plc and of Nationwide Building Society, a non-executive director of Investec plc and of JP Morgan Overseas Investment Trust plc, a director of Robert Fleming Holdings Limited and managing partner of Clifford Chance.
Lesley JonesIndependent Non- executive Director
Lesley was appointed a director in December 2013 and is chairman of the Risk Committee.
Lesley has extensive banking experience, having previously held several line management positions within Citigroup and was group chief credit officer of Royal Bank of Scotland plc from 2008 to 2014. Lesley is also a non-executive director of Northern Bank Limited and of N Brown Group plc.
Bridget MacaskillIndependent Non-executive Director
Bridget was appointed a director in November 2013 and is chairman of the Remuneration Committee.
Bridget is chairman of First Eagle Holdings LLC and senior adviser to First Eagle Investment Management LLC in New York City, of which she was president and chief executive officer until March 2016, a trustee of the TIAA-CREF funds and a non-executive director of Jupiter Fund Management plc and of Jones Lang LaSalle Incorporated. She was previously a non-executive director of Prudential plc, Scottish & Newcastle plc, J Sainsbury plc, Hillsdown Holdings plc and of the Federal National Mortgage Association in the US.
Oliver CorbettIndependent Non-executive Director
Oliver was appointed a director in June 2014 and is chairman of the Audit Committee.
Oliver is chief financial officer of Hyperion Insurance Group Limited and was formerly finance director of LCH. Clearnet Group Limited and of Novae Group plc. He is a chartered accountant and previously worked for KPMG, SG Warburg, Phoenix Securities (later Donaldson Lufkin Jenrette) and Dresdner Kleinwort Wasserstein, where he was managing director of investment banking. He was also a non-executive director of Rathbone Brothers plc.
zz_198390 Close Bros.indb 43 28/09/2016 14:20:18

Close Brothers Group plc Annual Report 201644
Executive Committee
Preben PrebensenChief Executive
Jonathan HowellGroup Finance Director
Martin AndrewAsset ManagementChief Executive
Elizabeth LeeGroup Head of Legal andRegulatory Affairs
Philip YarrowWinterfloodChief Executive
Tazim EssaniGroup Head of CorporateDevelopment
Stephen HodgesManaging Director andBanking Chief Executive
Rebekah EtheringtonGroup Head ofHuman Resources
Robert SackGroup Chief Risk Officer
zz_198390 Close Bros.indb 44 28/09/2016 14:20:48

Close Brothers Group plc Annual Report 2016S
trategicR
eportG
overnanceFinancial
Statem
ents45
Report of the Directors
Results and DividendsThe consolidated results for the year are shown on page 87 of the Financial Statements. The directors recommend a final dividend for the year of 38.0p (2015: 35.5p) on each ordinary share which, together with the interim dividend of 19.0p (2015: 18.0p), makes an ordinary distribution for the year of 57.0p (2015: 53.5p) per share. The final dividend, if approved by shareholders at the 2016 Annual General Meeting (“AGM”), will be paid on 22 November 2016 to shareholders on the register at 14 October 2016.
DirectorsThe names of the directors of the company at the date of this report, together with biographical details, are given on pages 42 and 43 of this Annual Report. All the directors held office throughout the year.
In accordance with the UK Corporate Governance Code, all directors offer themselves for reappointment at the 2016 AGM, with the exception of Stephen Hodges who is retiring.
Directors’ interestsThe directors’ interests in the share capital of the company at 31 July 2016 are set out on pages 78 and 80 of the Report of the Board on Directors’ Remuneration.
Powers and appointment of directors Details on the powers and appointment of directors are set out on page 50 of the Corporate Governance report.
Directors’ indemnityThe company has granted indemnities to all of its directors on terms consistent with the applicable statutory provisions. Qualifying third party indemnity provisions for the purposes of section 234 of the Companies Act 2006 were accordingly in force during the course of the year, and remain in force at the date of this report.
Share CapitalThe company’s share capital comprises one class of ordinary share with a nominal value of 25p each. At 31 July 2016, 150,643,728 ordinary shares were in issue. During the year the company’s issued share capital increased by 9,992 ordinary shares of 25p each through the issue of shares to satisfy option exercises. Full details of options exercised, the weighted average option exercise price and the weighted average market price at the date of exercise can be found in note 26 on page 120 of the Financial Statements.
Rights attaching to sharesOn a show of hands, each member has the right to one vote at general meetings of the company. On a poll, each member would be entitled to one vote for every share held. The shares carry no rights to fixed income. No person has any special rights of control over the company’s share capitaland all shares are fully paid.
Restrictions on the transfer of sharesThere are no specific restrictions on the transfer of the company’s shares which are governed by the general provisions of the articles of association and prevailing legislation.
The company is unaware of any arrangements between its shareholders that may result in restrictions on the transfer of shares and/or voting rights.
New issues of share capitalUnder section 551 of the Companies Act 2006, the directors may allot equity securities only with the express authorisation of shareholders which may be given in general meeting, but which cannot last more than five years. Under section 561 of the Companies Act, the board may not allot shares for cash (otherwise than pursuant to an employee share scheme) without first making an offer to existing shareholders to allot such shares to them on the same or more favourable terms in proportion to their respective shareholdings, unless this requirement is waived by a special resolution of the shareholders.
The existing authorities given to the company at the last AGM to allot shares will expire at the conclusion of the forthcoming AGM. Details of the resolutions renewing these authorities are included in the Notice of AGM.
Purchase of Own SharesUnder section 724 of the Companies Act 2006 a company may purchase its own shares to be held in treasury (“Treasury Shares”).
The existing authority given to the company at the last AGM to purchase Treasury Shares of up to 10% of its issued share capital will expire at the conclusion of the next AGM.
The board considers it would be appropriate to renew this authority and intends to seek shareholder approval to purchase Treasury Shares of up to 10% of its issued share capital at the forthcoming AGM in line with current investor sentiment.
Details of the resolution renewing the authority are included in the Notice of AGM.
Awards under the company’s employee share plans are met from a combination of shares purchased in the market and held either in treasury or in the employee share trust as well as by newly issued shares.
During the year the company made market purchases of 670,000 Treasury Shares, representing 0.44% of its issued share capital for an aggregate consideration of £10.1 million. It transferred 1,158,454 shares out of treasury, to satisfy share option awards, for a total consideration of £1.4 million. The maximum number of Treasury Shares held at any time during the year was 1,310,190 with a nominal value of £0.3 million.
Employee Share TrustBedell Trustees Limited is the trustee of the Close Brothers Group Employee Share Trust, an independent trust, which holds shares for the benefit of employees and former employees of the group. The trustee has agreed to satisfy a number of awards under the employee share plans. As part of these arrangements the company funds the trust, from time to time, to enable the trustee to acquire shares to satisfy these awards, details of which are set out in note 26 on pages 120 and 121 of the Financial Statements.
During the year, the employee share trust made market purchases of 944,481 ordinary shares.
Substantial ShareholdingsDetails on substantial shareholdings in the company are set out on page 58 of the Corporate Governance report.

Close Brothers Group plc Annual Report 201646
Significant ContractsA change of control of the company, following a takeover bid, may cause a number of agreements to which the company is party to take effect, alter or terminate. These include the company bond due 2017, certain insurance policies, bank facility agreements and employee share plans.
The group had committed facilities totalling £1.4 billion at 31 July 2016 which contain clauses which require lender consent for any change of control. Should consent not be given, a change of control would trigger mandatory repayment of £1.4 billion of the facilities.
All of the company’s employee share plans contain provisions relating to a change of control. Outstanding awards and options may vest and become exercisable on a change of control, subject where appropriate to the satisfaction of any performance conditions at that time and pro-rating of awards.
Business ActivitiesThe group’s business activities, together with the factors likely to affect its future development and performance and its summarised financial position are set out in the Strategic Report.
Financial Risk ManagementThe group has procedures in place to identify, monitor and evaluate the significant risks it faces. The group’s risk management objectives and policies are described on pages 51 and 52 and the risks associated with the group’s financial instruments are analysed in note 28 on pages 123 to 133 of the Financial Statements.
Going ConcernThe group has a strong, proven and conservative business model and has traded profitably during the year. It is well positioned in each of its core businesses, well capitalised, soundly funded and has adequate access to liquidity.
After making enquiries, the directors have a reasonable expectation that the company and the group have adequate resources to continue in operational existence for the foreseeable future. Accordingly, they continue to adopt the going concern basis in preparing the Annual Report.
Viability StatementIn accordance with provision C.2.2 of the 2014 revision of the UK Corporate Governance Code, the board confirms that it has a reasonable expectation that the group will continue to operate and meet its liabilities, as they fall due, for the period up to 31 July 2019. A period of three years has been chosen for the following reasons: • It is the period covered by the group’s strategic planning
cycle; • It is the period covered by the Internal Capital Adequacy
Assessment Process (“ICAAP”) which forecasts key capital requirements; and
• It is the period covered by group-wide internal stress testing.
The Directors’ assessment has been made with reference to: • The group’s current position and prospects – Financial
Overview on pages 14 to 19;• The group’s business model and strategy – Business
Model and Strategy on pages 8 to 13; and
• The board’s risk appetite, and the robust assessment of the group’s principal risks and how these are managed including the results of the ICAAP – Risk and Control Framework on pages 51 and 52.
The strategy and associated principal risks, which the directors evaluate and approve annually, are a foundation of the group’s strategic plan and scenario testing. The plan considers the group’s future projections of profitability, cash flows, capital requirements and resources, liquidity ratios and other key financial and regulatory ratios over the period.
These metrics are stress tested using sensitivity analysis including the ICAAP which involve flexing a number of the main assumptions underlying the plan.
SustainabilityInformation on the company’s employment practices and greenhouse gas emissions is set out on pages 32 to 39 of the Strategic Report.
Post Balance Sheet EventsDetails of post balance sheet events are given in note 30 on page 133 of the Financial Statements.
Political DonationsNo political donations were made during the year (2015: £nil).
Resolutions at the AGMThe company’s AGM will be held on 17 November 2016. Resolutions to be proposed at the AGM include the renewal of the directors’ authority to allot shares, the disapplication of pre-emption rights, authority for the company to purchase its own shares and the re-election of all the directors standing for reappointment.
The full text of the resolutions is set out in the Notice of AGM sent to the company’s shareholders. A letter from the chairman, which explains the purpose of the resolutions, accompanies the Notice of AGM.
AuditorResolutions to reappoint Deloitte LLP as the company’s auditor and to give the directors the authority to determine the auditor’s remuneration will be proposed at the forthcoming AGM.
Disclosure of Information to AuditorEach of the persons who are directors at the date of approval of this Annual Report confirms that:• So far as the director is aware, there is no relevant audit
information of which the company’s auditor is unaware; and
• They have taken all the steps that they ought to have taken as a director in order to make themselves aware of any relevant audit information and to establish that the company’s auditor is aware of that information.
This confirmation is given and should be interpreted in accordance with the provisions of section 418 of the Companies Act 2006.
By order of the board
Nicholas JenningsCompany Secretary
27 September 2016
Report of the Directors continued

Close Brothers Group plc Annual Report 2016S
trategicR
eportG
overnanceFinancial
Statem
ents47
Corporate Governance
As chairman of Close Brothers, I view the governance and oversight of its distinctive and prudent business model and straightforward, consistent strategy as key to the continuing creation and delivery of high quality growth and returns throughout the economic cycle. This model ensures the provision of value to the company’s stakeholders in a range of market conditions.
Strone Macpherson, Chairman
To provide this oversight, the board met seven times this year. Prior to each meeting the board receives reports on the results of each of the divisions and key performance indicators, together with detailed updates on the progress and implementation of the agreed strategies for each division. The board has the opportunity to discuss the reports and challenge each of the divisional chief executives, who attend all or part of the board meetings, directly on the progress and implementation of their divisional strategy. In addition, in May 2016 the board attended two strategy days dedicated to discussing and reviewing the group’s long-term strategy with executive management.
The group’s strategy was set several years ago and continues to produce good growth and strong returns. This year the board’s focus has again been on reviewing its delivery by the divisions. Within the Banking division, there has been a monitoring of its major businesses, a review of the strengthening of its IT infrastructure and a continued focus on the further development of its risk management function. For the Securities division, the board has spent time reviewing the measures taken by Winterflood to manage volatile market conditions by reducing risk in order to maintain profitability.
For Asset Management, the focus has been on continuing to monitor progress in meeting strategic objectives and on reviewing IT strategy and ability to develop a high quality integrated proposition.
The board has also spent time considering challenges facing the businesses from political, regulatory and tax developments, reviewing the balance between controlling costs and continuing to invest in the business for the long term and examining trends in customer and competitor behaviour.
We are committed to the principles established in the UK Corporate Governance Code (“the Code”) issued by the Financial Reporting Council (“FRC”) in September 2014. This report will explain and demonstrate how the group has applied the principles set out in the Code and complied with its provisions of best practice.
Strone MacphersonChairman
27 September 2016

Close Brothers Group plc Annual Report 201648
Corporate Governance continued
ComplianceThe Code has been applied by the company throughout the financial year. In April 2016, the FRC updated the Code, publishing a revised UK Corporate Governance Code(“the Revised Code”). The Revised Code is not applicable to the company in the year under review, but the company will report under it in the financial year ending 31 July 2017.
The Code sets out guidance on best practice in the form of principles and provisions on how companies should be directed and controlled to follow good governance practice. The Financial Conduct Authority (“FCA”) requires companies with a premium listing in the UK to disclose, in relation to the Code, how they have applied its principles and whether they have complied with its provisions throughout the financial year. Where the provisions have not been complied with, companies must provide an explanation for this.
It is the board’s view that the company’s governance regime has been fully compliant with the best practice set out in the Code for the financial year.
A copy of the Code can be found on the FRC’s website: www.frc.org.uk.
The BoardLeadership of the boardThe board’s primary role is to provide leadership, ensure that the company is appropriately managed and delivers long-term shareholder value. It sets the group’s strategic objectives and provides direction for the group as a whole. A number of key decisions are reserved for and may only be made by the board, which enables the board and executive management to operate within a clear governance framework. These specific responsibilities are set out in aschedule of matters reserved to the board, which is published on the company’s website, and they are summarised opposite.
Governance FrameworkBoard governance structure
The Board
Executive CommitteeResponsible for developing strategy, setting business objectives and assisting the chief executive with management of the group.
Audit Committee
Remuneration Committee
Risk Committee
Nomination and Governance Committee
Board and committee meeting attendance 2015/2016The attendance of directors at board and committee meetings of which they were members during the financial year is shown in the table below. Some directors also attended committee meetings as invitees during the year. This is not reflected in the table.
Board Audit CommitteeRemuneration
Committee Risk Committee1Nomination and
Governance Committee
Attended Total Attended Total Attended Total Attended Total Attended Total
Executive directorPreben Prebensen 7 7Stephen Hodges 7 7Jonathan Howell 7 7Elizabeth Lee 7 7Non-executive directorStrone Macpherson 7 7 5 5Oliver Corbett 7 7 5 5 5 5 6 6 5 5Geoffrey Howe 7 7 5 5 5 5 6 6 5 5Lesley Jones 7 7 5 5 5 5 6 6 5 5Bridget Macaskill 7 7 5 5 5 5 6 6 5 5
1 The Risk Committee held five regular meetings during the year, together with one meeting specifically to consider the Internal Capital Adequacy Assessment Process.

Close Brothers Group plc Annual Report 2016S
trategicR
eportG
overnanceFinancial
Statem
ents49
Specific responsibilities• Approval of strategy and monitoring its delivery.• Oversight of risk management, regulatory compliance
and internal control.• Ensuring adequate financial resources.• Acquisitions, disposals and expenditure over certain
thresholds.• Approval of communications to shareholders.• Board membership and other appointments.• Corporate governance matters.
The board has delegated specific powers for some matters to its committees, as set out in each committee’s terms of reference. These terms of reference, which are reviewed annually, detail a full list of each committee’s responsibilities and are available on our website at www.closebrothers.com/investor-relations/investor-information/corporate-governance. The chairman of each committee reports regularly to the board on matters discussed at committee meetings.
At each scheduled meeting the board receives reports from the chief executive and finance director on the performance and results of the group. In addition, the heads of the Banking, Securities and Asset Management divisions update the board on performance, strategic developments and initiatives in their respective areas and the head of legal and regulatory affairs provides updates on legal matters. In addition the board receives updates from the group operating functions on human resources and corporate development matters, risk, compliance and internal audit.
There is an annual schedule of rolling agenda items to ensure that all matters are given due consideration and are reviewed at the appropriate point in the financial and regulatory cycle. Meetings are structured to ensure that there is sufficient time for consideration and debate of all matters.
During the year, the board has spent time particularly on:• Presentations from businesses within the Banking division;• Review of IT strategy and information systems;• Review of the competitive landscape;• Engagement with regulators and HM Treasury;• Discussions over prioritisation of investment expenditure;• Review of the group Recovery and Resolution Plan;• Approval of the ICAAP;• Careful monitoring of market conditions prior to and
following the UK referendum and consideration of the implications of its result;
• Review of implementation of recommendations of 2015 Board Effectiveness Review;
• Understanding the EU Market Abuse Regulation; and• A discussion of the format and content of the board
papers and of its use of time.
All directors also attended a dedicated two day strategy session in May 2016 on strategy development and execution.
Board size, composition and independenceThe board comprises nine members: the chairman, four executive directors and four independent non-executive directors.
The structure of the board ensures that no individual or group of individuals is able to dominate the decision making process and no undue reliance is placed on any individual. The board comprises six male and three female members. This means that a third of the directors are women. The company is committed to ensuring that any vacancies
that may arise are filled by the most qualified candidates and recognises the value of diversity in the composition of the board. When board positions become available as a result of retirement, resignation or otherwise, it is focused on ensuring that a diverse pool of candidates is considered. Recent appointments have required specialist qualifications and extensive financial services experience, whilst also widening the range of insights and perspectives brought to the board’s deliberations.
Details of the individual directors and their biographies are set out on pages 42 and 43.
The board has assessed the independence of each of the non-executive directors and is of the opinion that each acts in an independent and objective manner and therefore, under the Code, is independent and free from any relationship that could affect their judgement. The board’s opinion was determined by considering for each non-executive director:• Whether they are independent in character and
judgement;• How they conduct themselves in board and committee
meetings;• Whether they have any interests which may give rise to an
actual or perceived conflict of interest; and• Whether they act in the best interests of the company and
of all its shareholders at all times.
The company has therefore complied with the Code provision that at least half the board, excluding the chairman, should comprise independent non-executive directors. Each non-executive director is required to confirm at least annually, whether any circumstances exist which could impair their independence.
Meetings and attendanceThe board held seven scheduled meetings in addition to the two day strategy session. Details of attendance at board meetings can be found on page 48.
The directors receive detailed papers in advance of each board meeting. The board agenda is carefully structured by the chairman in consultation with the chief executive and the company secretary. Each director may review the agenda and propose items for discussion with the chairman’s agreement. Additional information is also circulated to directors between meetings including relevant updates on the business and regulatory announcements.
The annual schedule of board meetings is decided a substantial time in advance in order to ensure the availability of each of the directors. In the event that directors are unable to attend meetings due to conflicts in their schedule, they receive papers in the normal manner and have the opportunity to relay their comments in advance of the meeting, as well as follow up with the chairman if necessary. The same process applies in respect of the various board committees.
Chairman and chief executiveThe roles of the chairman and chief executive are separate and there is a clear division of responsibilities between the two roles. The chairman is Strone Macpherson. His other significant commitments are set out in his biography on page 42. The board is satisfied that his other commitments do not restrict him from carrying out his duties effectively.

Close Brothers Group plc Annual Report 201650
Corporate Governance continued
As chairman, Strone Macpherson is primarily responsible for leading the board and ensuring the effective engagement and contribution of all the directors. His other responsibilities include setting the agenda for board meetings, providing the directors with information in an accurate, clear and timely manner and the promotion of effective decision making. The chairman is also charged with ensuring that the directors continually update their skills and knowledge and that the performance of the board, its committees and the individual directors is evaluated on an annual basis.
The group chief executive is Preben Prebensen who is primarily responsible for the day-to-day management of the group’s business. His other responsibilities include proposing and developing strategic objectives for the group, managing the group’s risk exposures in line with board policies, implementing the decisions of the board and facilitating appropriate and effective communication with shareholders and regulatory bodies.
Senior independent directorThe senior independent director is Geoffrey Howe. In addition to the existing channels for shareholder communications, shareholders may discuss any issues or concerns they may have with the senior independent director.
Powers of directorsThe directors are responsible for the management of the company. They may exercise all powers of the company, subject to any directions given by special resolution and the articles of association. The directors have been authorised to allot and issue ordinary shares and to make market purchases of the company’s ordinary shares by virtue of resolutions passed at the company’s 2015 AGM.
Board evaluationIn 2015, the evaluation of the board and its committees was carried out by an external consultant. The report contained a number of observations and recommendations, designed to encourage the board to optimise its contribution to the success of the company and to add value beyond the legal requirements, by building on existing strengths, agreeing the challenges ahead and preparing for the future. Overall, the conclusions from the evaluation were positive and identified a number of board strengths.
In April 2016, the Nomination and Governance Committee recommended that the 2016 board evaluation be undertaken internally, as permitted by the Code. The evaluation took the form of confidential questionnaires which assessed the performance of the board and its committees.
The questions were set to develop the themes explored in previous years’ evaluations in order to assess the progress of the board over the year, particularly in its implementation of the recommendations made in 2015. The 2016 evaluation therefore focused on the following areas:• Review of implementation of 2015 recommendations;• Use of time at meetings;• Strategic direction;• Further development of the board as a team;• Succession planning; and• Exposure to the senior management cadre.
The feedback from the evaluations was collated by the company secretary, reviewed with the chairman and presented to the board by the chairman in June 2016.
The verbal feedback was insightful and the responses were positive. They were concentrated on engagement in strategic planning, use of time, quality of board materials and board composition.
The 2016 evaluation also assessed the effectiveness of each of the board’s committees. The committee members were asked questions regarding governance arrangements, the quality of advice and input from external advisers, the quality of contribution of relevant internal functions, the timeliness, relevance and quality of presentations and disclosure by the executive and the overall effectiveness of the committees. The feedback was positive with improved scores given, compared to two years ago.
The evaluation confirmed the directors’ opinion that the board and its committees continue to be highly effective.
In addition to the board evaluation process, the senior independent director led a separate performance review in respect of the chairman which involved a review with the non-executive directors, excluding the chairman, and separate consultation with the chief executive. The senior independent director subsequently provided feedback to the chairman on his appraisal which confirmed his effectiveness.
EU Market Abuse RegulationIn June 2016, the board received a report on the impact of the EU Market Abuse Regulation (“MAR”) which on 3 July 2016 replaced the Model Code, contained within the FCA Listing Rules, and many of the FCA Disclosure Rules. The directors were informed of the restrictions on personal share account dealing applicable to them as persons discharging managerial responsibility, set out in MAR and in the company’s revised share dealing policy for them.
Given the expansion of the scope of the regime and the introduction of more stringent regulation and significant new procedural requirements in a number of areas, it was decided to establish a Disclosure Committee. The purpose of this new committee is to assist with ensuring timely and accurate disclosure of all information that the company is required to disclose to meet the legal and regulatory obligations and requirements arising from its listing on the London Stock Exchange.
Appointment of directorsThe appointment of directors is governed by the company’s articles of association, the Companies Act 2006 and other applicable regulations and policies. Directors may be elected by shareholders in general meeting or appointed by the board of directors in accordance with the provisions of the articles of association. The articles of association may be amended by special resolution of the shareholders and were last amended in November 2009.
In accordance with the Code all directors are subject to re-election at the AGM. The board will only recommend to shareholders that executive and non-executive directors be proposed for re-election at an AGM after evaluating the performance of the individual directors. Following the performance evaluations, the board will be recommending that all directors standing for re-election be re-elected by shareholders and confirms that each director continues to be effective and demonstrates commitment to their role.

Close Brothers Group plc Annual Report 2016S
trategicR
eportG
overnanceFinancial
Statem
ents51
Letters of appointment are available for inspection by shareholders at each AGM and during normal business hours at the company’s registered office.
Induction and professional developmentOn appointment all new directors receive a comprehensive and personalised induction programme to familiarise them with the company and to meet their specific requirements. The company also provides bespoke inductions for directors when they are appointed as a committee chairman. Induction programmes are tailored to a director’s particular requirements, but would typically include site visits, one-to-one meetings with executive directors, the company secretary, senior management for the business areas and support functions and a confidential meeting with the external auditor. Directors also receive guidance on directors’ liabilities and responsibilities.
There is a central training programme in place for the directors which is reviewed and considered by the board. In addition, the chairman discusses and agrees any specific requirements as part of each non-executive director’s half year and year end reviews. During the year, training took the form of informal meetings with senior management within the businesses and control functions, lunches with emerging leaders and with members of the graduate programme, in-depth business reviews, attendance at external seminars and briefings from the regulators and from internal and external advisers covering topics such as:• Senior Managers Regime;• Cyber security;• Digital marketing and social media;• Corporate governance update;• Regulatory developments;• Accounting changes;• Audit tendering and rotation; and• Whistle-blowing.
Training and development records are maintained by the company secretary and reviewed annually by the chairman and each individual director.
The company secretary is responsible for ensuring that the board procedures and applicable rules and regulations are observed. All directors have direct access to the services and advice of the company secretary who also acts as secretary to each of the board committees. Directors are able to take independent external professional advice to assist with the performance of their duties at the company’s expense.
Risk and Control FrameworkThe board has overall responsibility for maintaining a system of internal control to ensure that an effective risk management and oversight process operates across the group. The risk management framework and associated governance arrangements are designed to ensure that there is a clear organisation structure with well defined, transparent and consistent lines of responsibility and effective processes to identify, manage, monitor and report the risks to which the group is, or might become, exposed. The board has a well defined risk appetite with risk appetite measures which are integrated into decision making, monitoring and reporting
processes, with early warning trigger levels set to drive the required corrective action before overall tolerance levels are reached. The risk framework, through key committees, including the Risk Committee and Audit Committee, is the mechanism that ensures the board receives comprehensive risk information in a timely manner.
Identification, measurement and management of risk are fundamental to the success of the group. Over the past 12 months the group has continued to strengthen its risk management framework and further develop the group’s risk committees, at both board and divisional level, and these continue to work efficiently and effectively.
The group’s risk and control framework is designed to allow the capture of business opportunities while maintaining an appropriate balance of risk and reward within the group’s agreed risk appetite. It further ensures that the risks to which the group is, or may become, exposed are appropriately identified, and that those which the group chooses to take, are managed, controlled and where necessary, mitigated, so that the group is not subject to material unexpected loss.
The group reviews and adjusts its risk appetite annually as part of the strategy setting process. This aligns risk taking with the achievement of strategic objectives. Adherence to appetite is monitored by the group’s risk committees.
The Risk Committee throughout the year undertakes a robust assessment of the principal risks facing the group and has reviewed reports from the risk function on the processes for the management and mitigation of those risks. The Committee confirms through annual review, the adequacy and effectiveness of the group’s risk management and internal control arrangements in relation to the group’s strategy and risk profile for the financial year. On the basis of its own review, the board considers that it has in place adequate systems and controls with regard to the company’s profile and strategy.
The risk management framework is based on the concept of “three lines of defence”, as set out in the table on page 52, and the key principles underlying risk management in the group are:• Business management own all the risks assumed
throughout the group and are responsible for their management on a day-to-day basis to ensure that risk and return are balanced;
• The board and business management promote a culture in which risks are identified, assessed and reported in an open, transparent and objective manner;
• The overriding priority is to protect the group’s long-term viability and produce sustainable medium to long-term revenue streams;
• Risk functions are independent of the businesses and provide oversight of and advice on the management of risk across the group;
• Risk management activities across the group are proportionate to the scale and complexity of the group’s individual businesses;
• Risk mitigation and control activities are commensurate with the degree of risk; and
• Risk management and control supports decision making.

Close Brothers Group plc Annual Report 201652
Corporate Governance continued
Risk Management FrameworkFirst line of defence Second line of defence Third line of defence
The businesses
Group Risk and Compliance Committee(Reports to the Risk Committee)
Chief executive delegates to divisional and operating business heads day-to- day responsibility for risk management, regulatory compliance, internal control and conduct in running their divisions or businesses.
Business management has day-to-day ownership, responsibility and accountability for risks:• Identifying and assessing risks;• Managing and controlling risks;• Measuring risk (key risk indicators/
early warning indicators);• Mitigating risks; and• Reporting risks.
Key features• Promotes a strong risk culture and
focus on sustainable risk-adjusted returns;
• Implements the risk framework;• Promotes a culture of adhering to
limits and managing risk exposures;• Promotes a culture of customer focus
and appropriate behaviours;• Ongoing monitoring of positions and
management of risks;• Portfolio optimisation; and• Self-assessment.
Risk and Compliance
Risk Committee(Reports to the board)
Risk Committee delegates to the group chief risk officer day-to-day responsibility for oversight and challenge on risk related issues.
Risk functions (including compliance) provide support and independent challenge on:• The design and operation of the risk
framework;• Risk assessment;• Risk appetite and strategy;• Performance management;• Risk reporting;• Adequacy of mitigation plans; and• Group risk profile.
Key features• Overarching “risk oversight unit” takes
an integrated view of risk (qualitative and quantitative);
• Supports through developing and advising on risk strategies;
• Facilitates constructive check and challenge – “critical friend”/“trusted adviser”; and
• Oversight of business conduct.
Internal Audit
Audit Committee(Reports to the board)
Audit Committee mandates the head of group internal audit with day-to-day responsibility for independent assurance.
Internal audit provides independent assurance on:• First and second line of defence;• Appropriateness/effectiveness of
internal controls; and• Effectiveness of policy
implementation.
Key features• Draws on deep knowledge of the
group and its businesses;• Independent assurance on the
activities of the firm including the risk management framework;
• Assesses the appropriateness and effectiveness of internal controls; and
• Incorporates review of culture and conduct.

Close Brothers Group plc Annual Report 2016S
trategicR
eportG
overnanceFinancial
Statem
ents53
Lesley Jones, Chairman of the Risk Committee
Risk CommitteeChairman’s overviewThe UK’s decision to leave the EU will pose challenges for consumers and companies alike until the economic impact of the vote becomes clearer. While the economy remains fundamentally strong, increased vigilance will be required to assess the full extent of potential UK exit on key macroeconomic factors. Given the uneven recovery of the global economy in recent years, global markets remain sensitive to geopolitical shifts, and in addition to the uncertainties stemming from the recent referendum, the UK remains susceptible to further dislocation within the Eurozone.
Economic challenges, and a heavy regulatory agenda targeted at bolstering the strength of the banking industry and the conduct of those working within it, have kept the Risk Committee fully occupied throughout the year. I am pleased to report that Close Brothers’ prudent and consistent risk appetite has allowed us to maintain a robust capital position and low risk profile. Significant enhancements to our risk management and risk appetite frameworks have been made throughout the year, and we are satisfied that we have the skills and talent across the group to meet the challenges and opportunities that lie ahead.
As in previous years the Committee apportions its time between the planned periodic review of key portfolio risks and the close scrutiny of new business risks as they develop. This approach allows us to ensure that emerging risks can be identified and debated and that management’s plans for risk mitigation are well understood and appropriately resourced. During the year the Committee saw further improvement in the quality of the management information that it receives.
Committee roles and responsibilitiesThe Committee’s key roles and responsibilities are to:• Oversee the maintenance and development of a
supportive culture in relation to the management of risk;• Review and set risk appetite, which is the level of risk the
group is willing to take in pursuit of its strategic objectives;• Monitor the group’s risk profile against the prescribed
appetite;• Review the effectiveness of the risk framework to ensure
that key risks are identified and appropriately managed; and
• Provide input from a risk perspective into the alignment of remuneration with performance against risk appetite (through the Remuneration Committee).
The Risk Committee’s principal roles and responsibilities are to support the board in its oversight of risk management across the group. The following sections set out the Committee’s membership, its key responsibilities and the principal areas of risk upon which we have focused during the year. The identification, management and mitigation of risk is fundamental to the success of the group. The Committee plays an important role in setting the tone and culture that promotes effective risk management across the group.
Close Brothers Group plc Annual Report 201654
Corporate Governance continued
Membership and meetingsThe Committee comprises each of the independent non-executive directors, with me as chairman. Five scheduled meetings were held during the year and these were supplemented by an additional meeting for early review of the annual ICAAP and its stress assumptions.
Full details of attendance by the non-executive directors at these meetings during the year are set out on page 48.
In addition to the members of the Committee, standing invitations are extended to the company chairman, the executive directors, the chief risk officer, the head of compliance and the head of internal audit. All attend our Committee meetings as a matter of course and have supported and informed the Committee’s discussions.
Other executives, subject matter experts, risk team members and external advisers are invited to attend the Committee from time to time as required to present and advise on reports commissioned.
I meet regularly with the chief risk officer and his risk team in a combination of formal and informal sessions, and with senior management across all divisions of the group to discuss the business environment and to gather their views of emerging risks.
Activity in the 2016 financial yearFurther enhancements were made to the group’s risk management framework in 2016, including the continued evolution of the three lines of defence model to ensure that it remains aligned to industry and regulatory standards. The risk organisational design was revised with the amalgamation of all risk teams under common leadership. New enterprise-wide risk roles were also created covering operational risk, risk assurance, model risk and risk appetite. These changes have proved invaluable in providing the Committee with improved governance, oversight and quantitative metrics. Changes to the risk governance framework also resulted in improved visibility and consistency across the group’s risk and compliance committees, as well as enhanced reporting capability across the group and at board level.
The identification and management of conduct risk was strengthened with the development of a new conduct risk framework. The greater detail now available as a result of these enhancements will improve the board’s top-down visibility on behaviours across the group, and provide further comfort that the group’s sound risk culture is well embedded.
Cyber crime is becoming ever more sophisticated and the increasing frequency of cyber attacks across the sector has highlighted the importance of having strong cyber defences to protect the group’s systems and the customer data that the group may hold. During the year the board and the Committee have regularly reviewed the strength of the group’s cyber defences including the results of a group-wide cyber exercise undertaken to ensure that our systems and people are well prepared to respond to any attack.
Emerging risk assessment has been an increasing focus of the risk management team and a standing agenda item for the Committee’s discussion. In the run-up to the UK’s EU referendum, the Committee considered and discussed the group’s preparedness for a potential UK exit from the EU, and oversaw the development of the group’s strategy to ensure any immediate impact would be appropriately mitigated. This work stood us in good stead as the result of the referendum became clear.
A number of areas of operational risk were stressed as part of the annual ICAAP process. Following robust debate and challenge, the Committee and board were satisfied that the group’s business model and allocated risk appetite remained appropriate. This is an important outcome given the number of change management programmes underway across the group, and in our regular meetings there is specific focus on the progress of key projects and initiatives.
Ensuring that we remain fully compliant with the numerous new banking rules is increasingly challenging and we continue to actively engage with the PRA, FCA and industry bodies to ensure that our risk framework remains appropriate and relevant for all our businesses.
RemunerationThe linkage between culture, risk and compensation is an important one and the Risk Committee and the chief risk officer have provided input to the Remuneration Committee again this year to ensure that risk behaviours and the management of operational risk incidents over the course of the financial year were appropriately reflected in decisions taken about performance and reward.
Looking ahead to 2017Key priorities for the coming year include:• Refining our early warning indicators, to further develop
our ability to identify and respond effectively to changes in the economic environment, particularly following the UK’s decision to leave the EU.
• Embedding the enhanced group risk appetite framework, including the continued development of quantitative risk appetite methodologies.
• Continuously improving our management information, risk systems and risk reporting capabilities, to underpin the effectiveness and efficiency of the Committee.
• Implementing the fourth Money Laundering Directive and preparing for MIFID II.
Lesley JonesChairman of the Risk Committee
27 September 2016

Close Brothers Group plc Annual Report 2016S
trategicR
eportG
overnanceFinancial
Statem
ents55
Oliver Corbett, Chairman of the Audit Committee
Audit CommitteeChairman’s overviewThe Committee has considered a wide range of topics this year with key areas of focus on the following:• Review and challenge of the group’s external financial
reporting and in particular the key accounting judgements taken in preparing the financial statements.
• Oversight of the effectiveness of both internal and external audit including preparation for the external audit tender process to be carried out during the 2017 financial year.
• Review and challenge of key group financial policies including a revised whistle-blowing policy.
• Monitoring the group’s response to current and future accounting and regulatory change. In particular we have considered the adequacy and reasonableness of the group’s disclosures around the new viability statement and received a further update on management’s preparation for the revised impairment approach required by IFRS 9 “Financial Instruments”.
Looking forward, the Committee’s agenda will continue to be focused on these key areas, with particular focus in the year ahead on the oversight of the audit tender process.
Membership and meetingsThe Committee comprises each of the independent non-executive directors and acts independently of the executive to protect the interests of shareholders.
Five meetings of the Committee were held during the year scheduled to coincide with the financial reporting cycle of the group. Attendance details of each of the Committee members is shown in the table on page 48. The qualifications of each of the members are outlined in the biographies on page 43. The board considers that I have the appropriate recent and relevant experience.
As well as the non-executive members of the Committee, standing invitations are extended to the chairman of the board and the executive directors, all of whom attend meetings as a matter of practice. The heads of internal audit, risk and compliance as well as the group financial controller also attend meetings by invitation and I meet with this group along with the group finance director in advance of each meeting to agree the agenda and receive full briefing on all relevant issues. Finally, the lead audit partner also attends each of the meetings and I have regular contact with him throughout the year. The Committee met with both internal and external audit privately at each meeting held during the year.
The Audit Committee’s key roles and responsibilities are to assess the integrity of the group’s external financial reporting and in particular to review management’s significant financial reporting judgements to ensure they are appropriate, review the effectiveness of the group’s internal controls, and monitor and review the activities and performance of both internal and external audit.

Close Brothers Group plc Annual Report 201656
Corporate Governance continued
Activity in the 2016 Financial YearKey accounting judgementsCredit provisioningThe Committee received presentations from management explaining the provisioning methodology across the group’s lending operations ahead of both the interim and full year results. Management and the external auditors were challenged over the level of provisioning and, noting the consistency of approach taken, the Committee concluded that the provisioning approach and judgements made were reasonable.
The Committee was also updated on progress with management’s work in preparation for the introduction of IFRS 9 which will require provisioning methodology to take into account future expected losses. The Committee will continue to monitor progress in preparation for this material accounting change which will apply to the group from the 2019 financial year.
Revenue recognitionThe Committee reviewed a paper outlining the group’s approach to revenue recognition, highlighting the key areas where management judgement is required particularly around interest, fee and commission income. The Committee was reassured over the consistency of approach and ultimately was satisfied that the approach taken continued to be appropriate.
GoodwillThe annual assessment of the carrying value of goodwill was reviewed as well as a paper during the year considering the goodwill carried in relation to Winterflood following the lower reported profits for that business in the first half of the financial year. Following review and challenge of the group’s value in use calculations and key assumptions, the Committee agreed with management’s conclusion that the carrying value of goodwill across the group was reasonably stated.
Other financial reportingViability statementIn order to support the board’s approval of the statement on page 46 as to the longer-term viability of the group, the Committee reviewed papers from management setting out the intended approach to the new disclosure and providing details in support of the statement based in particular on the group’s three year plan and the results of stress testing.
Fair, balanced and understandableThe Committee continues to consider on behalf of the board whether the group’s reporting is fair, balanced and understandable. This included discussing the disclosures as a whole with the executive directors.
Policy oversight and reviewWhistle-blowingThe Committee oversaw and agreed a revised whistle-blowing policy. The policy was re-launched to all staff with an email from me as the group’s whistle-blowers’ champion. This reiterated the importance the group places on all staff understanding the process to enable to speak out when appropriate.
Other policiesThe Committee also completed annual reviews of the group’s recovery and resolution plan, tax position and policy, approach to hedging for share awards and approved a revised policy for non-audit services to the external auditor to reflect updated rules and guidance.
Internal AuditThe Committee receives a report from the head of internal audit at each meeting summarising audits completed as well as monitoring progress on agreed actions from previous audits. The report also details key themes, audits planned and in progress, as well as commentary on internal audit related business culture. During the year 26 audits were completed. In addition the Committee reviewed and agreed the internal audit plan as well as pre-approving any changes to the plan throughout the year.
Following the prior year independent effectiveness review of internal audit, an internal effectiveness survey was completed in the year. This review further confirmed the Committee’s view that the internal audit function is effective.
The Committee continues to keep the level of resources of the internal audit team under review. Since 2009, the group has operated a co-source arrangement with PwC to ensure the function has sufficient access to expertise across the whole group. The group intends to carry out a tender for this arrangement in the 2017 financial year.
External AuditThe Committee assesses the independence and objectivity, qualifications and effectiveness of the external auditor on an annual basis as well as making a recommendation on the reappointment of the auditor to the board.
Our evaluation which was consistent with prior years focused on the following key areas:• The quality of audit expertise, judgement and dialogue
with the Committee and senior management;• The independence and objectivity demonstrated by the
audit team; and• The quality of service including consistency of approach
and responsiveness.
This process was facilitated by a group-wide survey of finance teams, a survey of the Deloitte LLP senior audit team’s view on the group and a review of audit and non-audit fees.
Overall the Committee has concluded that Deloitte LLP remain independent and that their audit is effective.

Close Brothers Group plc Annual Report 2016S
trategicR
eportG
overnanceFinancial
Statem
ents57
Nomination and Governance CommitteeThis report sets out the role and responsibilities of the Nomination and Governance Committee.
Committee roles and responsibilitiesThe Committee’s key roles and responsibilities are:• Regularly reviewing the structure, size and composition
of the board;• Considering the leadership needs of the group and
considering succession planning for directors and other senior executives;
• Considering the appointment or retirement of directors;• Evaluating the skills, knowledge and experience required
for a particular appointment, normally with the assistance of external advisers used to facilitate the search for suitable candidates; and
• Assessing the contribution of the non-executive directors.
Membership and meetingsThe Committee comprises Geoffrey Howe, the senior independent director, Oliver Corbett, Lesley Jones and Bridget Macaskill who chair the Audit, Risk and Remuneration Committees respectively and me as chairman. Each of the Committee members is independent.
Five meetings were held during the year which were attended by all members. In addition, the chief executive attends meetings by invitation, as does the group head of human resources when presenting a review of talent and executive management succession planning.
Non-executive directors’ skill setsDuring the year, the Committee reaffirmed its members’ skill sets including each of its members’ extensive experience within a financial services organisation. Geoffrey Howe is senior independent director with extensive experience within the industry including as a chairman. Oliver Corbett has strong financial skills and a track record of audit committee experience including as a finance director. Lesley Jones has familiarity with FCA/PRA and EU risk regulations and Bridget Macaskill has significant remuneration committee credentials and familiarity with FCA/PRA and EU remuneration regulations.
Activity in the 2016 financial yearDuring the year the Committee focused on:• Board succession;• Talent review and executive management succession
planning;• Board evaluation including a review of implementation of
the recommendations from the 2015 review; and• Review of the non-executive directors’ skill sets to ensure
that an appropriate balance of skills has been maintained.
Strone MacphersonChairman of the Nomination and Governance Committee
27 September 2016
The Committee oversees the group’s policy on the provision of non-audit services by the external auditor. The policy was revised during the year to reflect revised ethical guidance on auditor independence issued by the FRC. The main impact of the new guidance for the group is that tax compliance services will no longer be provided by the external auditor and the group appointed new advisers during the year. However, while the key principle of our policy remains that permission to engage the external auditor will always be refused when a threat to independence and/or objectivity is perceived, the Committee continues to see benefits for the group in engaging Deloitte LLP where:• Work is closely related to the audit;• A detailed understanding of the group is required; and• Deloitte LLP is able to provide a higher quality and/or
better value service.
During the year non-audit fees amounted to £0.7 million and were 59% of the overall audit fee (2015: 56%). Non-audit fees in the year were:
£ million
Assurance work on:Systems and controls 0.3Funding 0.2
Tax compliance 0.2
0.7
The Committee concluded that all of these fees fell within its criteria for engaging Deloitte LLP and does not believe they pose a threat to the auditor’s independence or objectivity.
Audit tenderAs previously reported every year since the 2013 Annual Report, the Committee intends that an audit tender will take place to coincide with the completion of the current lead partner’s five year term in 2017. The Committee will oversee the tender process and is committed to ensure a fair, transparent and proportionate process is put in place including a clearly articulated set of selection criteria agreed by the Committee in advance.
Deloitte LLP or its predecessor firm has audited the group since it was first listed in 1984, but has only acted as the group’s sole auditor since 2008. Although a full audit tender was not carried out, a detailed proposal was reviewed at that time prior to Deloitte LLP’s appointment as sole auditor to the group. Given the length of its tenure and the revised code, Deloitte LLP will not participate in the tender process.
Oliver CorbettChairman of the Audit Committee
27 September 2016

Close Brothers Group plc Annual Report 201658
Corporate Governance continued
Remuneration CommitteeThe Report of the Board on Directors’ Remuneration is set out on pages 60 to 81.
Conflicts of InterestThe articles of association include provisions giving the directors authority to approve conflicts of interest and potential conflicts of interest as permitted under the Companies Act 2006.
A procedure has been established whereby actual and potential conflicts of interest are regularly reviewed and appropriate authorisation sought, prior to the appointment of any new director or if a new conflict arises. The decision to authorise a conflict of interest can only be made by non-conflicted directors and in making such a decision the directors must act in a way they consider, in good faith, will be most likely to promote the success of the company. The board believes this procedure operated effectivelythroughout the year.
Investor RelationsThe group has a comprehensive investor relations (“IR”) programme to ensure that current and potential shareholders, as well as financial analysts, are kept well informed of the group’s performance and have appropriate access to management to understand the company’s business and strategy.
The board believes it is important to maintain open and constructive relationships with all shareholders. The IR team, reporting to the group finance director, are responsible for managing a structured programme of meetings, calls and presentations around the financial reporting calendar as well as throughout the year. The chief executive and group finance director meet with the group’s major institutional shareholders on a regular basis. In addition, the chairman arranges to meet with them once a year to discuss challenges facing the board, particularly in relation to strategy, corporate governance and succession planning. Separately the senior independent director is available, should shareholders wish to discuss any concerns theymay have.
All shareholders also have the opportunity to raise questions with the board at the AGM, either in person or by submitting written questions in advance. The chairman of each of the board committees attends the AGM and all other directors are expected to attend the meeting.
The board is regularly updated on the IR programme. An IR report, summarising share price performance, share register composition and feedback from any investor meetings, is produced for each board meeting.
In November 2015, we ran a successful Banking division seminar, providing greater detail to investors and analysts on our largest division. This presentation, together with all results announcements, annual reports, regulatory news announcements and other relevant documents, is available on the IR section of the group website (www.closebrothers.com/investor-relations).
Substantial ShareholdingsThe company has been notified to 16 September 2016 under the provisions of the Disclosure Guidance and Transparency Rules of the following significant interests in the voting rights of the company.
Ordinaryshares
millions
Votingrights
%
Standard Life Investments 19.5 13.02M&G Investment Management 10.0 6.81Aberdeen Asset Managers 9.5 6.42Royal London Asset Management 7.4 4.96
Substantial shareholders do not have different voting rights from those of other shareholders.
Statement of Directors’ ResponsibilitiesThe directors are responsible for preparing the Annual Report and the financial statements in accordance with applicable law and regulations.
Company law requires the directors to prepare financial statements for each financial year. Under that law the directors are required to prepare the group financial statements in accordance with International Financial Reporting Standards (“IFRSs”) as adopted by the European Union and Article 4 of the IAS Regulation. The directors have elected to prepare the parent company financial statements in accordance with United Kingdom Generally Accepted Accounting Practice (United Kingdom Accounting Standards and applicable law), including FRS 102 “The Financial Reporting Standard applicable in the UK and Republic of Ireland”. Under company law the directors must not approve the accounts unless they are satisfied that they give a true and fair view of the state of affairs of the company and of the profit or loss of the company for that period.
In preparing the parent company financial statements, the directors are required to:• Select suitable accounting policies and then apply them
consistently;• Make judgements and accounting estimates that are
reasonable and prudent;• State whether applicable UK Accounting Standards have
been followed, subject to any material departures disclosed and explained in the financial statements; and
• Prepare the financial statements on the going concern basis unless it is inappropriate to presume that the company will continue in business.
In preparing the group financial statements, International Accounting Standard 1 requires that directors:• Properly select and apply accounting policies;• Present information, including accounting policies, in a
manner that provides relevant, reliable, comparable and understandable information;
• Provide additional disclosures when compliance with the specific requirements in IFRSs are insufficient to enable users to understand the impact of particular transactions, other events and conditions on the entity’s financial position and financial performance; and
• Make an assessment of the company’s ability to continue as a going concern.
Close Brothers Group plc Annual Report 2016S
trategicR
eportG
overnanceFinancial
Statem
ents59
The directors are responsible for keeping adequate accounting records that are sufficient to show and explain the company’s transactions and disclose with reasonable accuracy at any time the financial position of the company and enable them to ensure that the financial statements comply with the Companies Act 2006. They are also responsible for safeguarding the assets of the company and hence for taking reasonable steps for the prevention and detection of fraud and other irregularities.
The directors are responsible for the maintenance and integrity of the corporate and financial information included on the company’s website. Legislation in the UK governing the preparation and dissemination of financial statements may differ from legislation in other jurisdictions.
Responsibility statementWe confirm that to the best of our knowledge:• The financial statements, prepared in accordance with the
relevant financial reporting framework, give a true and fair view of the assets, liabilities, financial position and profit or loss of the company and the undertakings included in the consolidation taken as a whole;
• The Strategic Report includes a fair review of the development and performance of the business and the position of the company and the undertakings included in the consolidation taken as a whole, together with a description of the principal risks and uncertainties that they face; and
• The Annual Report and financial statements, taken as a whole, are fair, balanced and understandable and provide the information necessary for shareholders to assess the group’s performance, business model and strategy.
By order of the board
Nicholas JenningsCompany Secretary
27 September 2016

Close Brothers Group plc Annual Report 201660
Report of the Board on Directors’ Remuneration
This report sets out our approach to remuneration for the group’s employees and directors for the 2016 financial year.
Bridget Macaskill, Chairman of the Remuneration Committee
This report has been prepared in compliance with Schedule 8 of the Large and Medium-sized Companies and Groups (Accounts and Reports) (Amendment) Regulations 2013 and the listing rules. It has been approved by the board. Certain parts of this report are audited by the company’s auditor Deloitte LLP and are marked as “audited” for clarity.
Annual Statement from the Remuneration Committee ChairOn behalf of the Remuneration Committee, I am pleased to present the report on directors’ remuneration for the 2016 financial year. The report which follows is split into three sections:
Governance (page 62)This section of the report covers the objectives, responsibilities, membership and activities of the Committee during the 2016 financial year.
The Directors’ Remuneration Policy (pages 63 to 71)The group’s policy on directors’ remuneration and the key factors taken into account in setting the policy are covered in this section. This policy was approved by shareholders for the following three years at the AGM on 20 November 2014.
The Annual Report on Remuneration (pages 71 to 81)This section reports on the payments and awards made to the directors and details the link between company performance and remuneration for the 2016 financial year. The Annual Report on Remuneration together with this annual statement is subject to an advisory shareholder vote at the AGM on 17 November 2016.
At a GlanceHow we performedAs reported in the Financial Overview section on pages 14 to 19 of the Strategic Report, the group has achieved a good performance in more challenging market conditions, driven by the consistent and disciplined implementation of our strategy and business model. The group delivered continued profit growth and strong returns for shareholders, with £233.6 million adjusted operating profit and a return on equity (“RoE”) of 18.9%. The key performance indicators with regard to remuneration are shown in the table below. While profits increased, the financial performance element of the bonuses for the executive directors (“EDs”) have decreased slightly this year, mainly driven by the marginal reduction in RoE. The single total figures of remuneration have all decreased, primarily due to the impact of share price movement.
Key performance indicator 2016 2015
Return on equity 18.9% 19.5%Adjusted operating profit £233.6 million £224.9 millionAdjusted earnings per
share growth1 53.8% 79.0%Total shareholder return
per annum2 10.0% 33.9%Distributions to shareholders £84.1 million £79.0 million
1 For the three year periods ended 31 July 2016 and 31 July 2015.2 For the three year periods ended 31 July 2016 and 31 July 2015 based on the
average three month share price prior to that date.

Close Brothers Group plc Annual Report 2016S
trategicR
eportG
overnanceFinancial
Statem
ents61
Key developmentsCompensation structures need to evolve to meet legal and regulatory requirements, the commercial challenges as well as the interests of our shareholders.
It was anticipated that during the 2016 financial year, clarification of how to apply the amendments made to the Capital Requirements Directive by the European Banking Authority would impact, and possibly require a redesign of, the Remuneration Policy. However, the uncertainty surrounding the UK’s implementation of the Capital Requirements Directive has meant we have deferred the redesign of the Remuneration Policy until the 2017 financial year. Please refer to the “Looking Forward to 2017” section on page 62 for further information.
During the year we have continued to develop the governance within our remuneration framework, and have provided greater disclosure on achievements against both financial targets and personal goals increasing the transparency of how these link to EDs’ individual annual bonuses. This is presented on pages 72 to 75.
Senior management succession planning is a key focus of the directors and links into the group’s remuneration policy, which sets out the parameters for EDs’ compensation should they leave the business. In light of Stephen Hodges’ decision to retire, the compensation paid to him during his notice period and upon leaving the business will be in line with the remuneration policy and current views on good governance. Whilst Stephen’s compensation for 2017 has yet to be determined, it has been agreed that Stephen will not receive a 2016 LTIP award recognising that he will not be in the business for the majority of the long-term performance period.
Major Decisions on Remuneration for the Financial Year
Chief executive Managing director and
Banking chief executive Group finance director Group head of legal
and regulatory affairs
Preben Prebensen Stephen Hodges1 Jonathan Howell Elizabeth Lee2
Previous salary £540,000 £485,000 £408,000 £367,500Salary with effect from 1 August 2016 £540,000 £485,000 £408,000 £330,750Percentage salary increase 0.0% 0.0% 0.0% 0.0%2016 bonus £1,545,480 £1,396,800 £1,126,080 £335,650Percentage change in bonus from 2015 (0.4)% (0.6)% (0.8)% 0.2%2016 bonus as a per cent of 2016 salary 286% 288% 276% 91%2016 LTIP award £1,080,000 – £750,000 £400,000Percentage change in LTIP award from
2015 8.0% 0.0% 0.0% 0.0%2016 LTIP award as a per cent of 2016
salary 200% 0.0% 184% 109%
1 Following Stephen Hodges’ decision to retire it has been agreed that no LTIP will be awarded for 2016.2 Elizabeth Lee’s full time equivalent salary remains at £367,500. Her working pattern changed on 1 August 2016 to 90% of the full time equivalent.
EDs’ Remuneration and ShareholdingsSingle total figure of remuneration1
Fixed remuneration Annual bonus Performance awards
Preben Prebensen£’000
Stephen Hodges£’000
Jonathan Howell£’000
Elizabeth Lee£’000
0
1,000
2,000
3,000
4,000
5,000
6,000
0
2015 2016
11%
26%
63%
18%
41%
41%
£5,962
£3,771
0
1,000
2,000
3,000
4,000
5,000
6,000
2015 2016
14%
33%
53%
18%
42%
40%
£4,257
£3,328
0
1,000
2,000
3,000
4,000
5,000
6,000
2015 2016
15%
33%
52%
18%
40%
42%
£3,443
£2,827
0
500
1,000
1,500
2,000
2,500
3,000
2015 2016
29%
21%
50%
37%
27%
36%
£1,561
£1,221
Fixed remuneration Annual bonus Performance awards
Preben Prebensen£’000
Stephen Hodges£’000
Jonathan Howell£’000
Elizabeth Lee£’000
0
1,000
2,000
3,000
4,000
5,000
6,000
7,000
8,000
FY15 FY16
11%
26%
63%
18%
41%
41%
£5,962
£3,768
0
1,000
2,000
3,000
4,000
5,000
6,000
FY15 FY16
14%
33%
53%
18%
42%
40%
£4,257
£3,326
0
1,000
2,000
3,000
4,000
5,000
6,000
FY15 FY16
15%
33%
52%
18%
40%
42%
£3,443
£2,826
0
5,00
1,000
1,500
2,000
2,500
3,000
FY15 FY16
29%
21%
50%
37%
27%
36%
£1,561
£1,220
1 See page 71 for details.

Close Brothers Group plc Annual Report 201662
Report of the Board on Directors’ Remuneration continued
Preben Prebensenper cent
Stephen Hodgesper cent
Jonathan Howellper cent
Elizabeth Leeper cent
0
300
600
900
1,200
1,500
1,800
2,100
2,400
Policy Actual
200
1,729
0
300
600
900
1,200
1,500
1,800
2,100
2,400
200
2,122
0
300
600
900
1,200
1,500
1,800
2,100
2,400
200619
0
200
400
600
800
1,000
100224
Policy Actual Policy Actual Policy Actual
1 See EDs’ Shareholding and Share Interests table on page 78 for details.
Looking Forward to 20172017 is going to be a busy year for the Committee. The focus of the year will be to review our remuneration policy, which will be presented to shareholders for approval at the AGM in November 2017. We are committed to ensuring that the EDs’ pay arrangements reflect relevant regulatory requirements while supporting and driving business strategy; are balanced between motivating and challenging our senior leaders to grow the business; and deliver strong sustainable shareholder returns. We plan to engage with our major shareholders, as appropriate, about any proposed amendments to the remuneration structure in the spring of 2017.
I hope that you will find this report on the directors’ remuneration useful, understandable and clear.
Bridget MacaskillChairman of the Remuneration Committee
27 September 2016
GovernanceRemuneration CommitteeCommittee roles and responsibilitiesThe Committee’s key objectives are to:• Determine the overarching principles and parameters of
the remuneration policy on a group-wide basis;• Establish and maintain a competitive remuneration
package to attract, motivate and retain high calibre EDs and senior management across the group;
• Promote the achievement of the group’s annual plans and its strategic objectives by providing a remuneration package that contains appropriately motivating targets that are consistent with the group’s risk appetite; and
• Align senior executives’ remuneration with the interests of shareholders.
The Committee’s main responsibilities are to:• Review and determine the total remuneration packages of
EDs and other senior executives in consultation with the chairman and chief executive and within the terms of the agreed policy;
• Approve the design and targets of any performance related pay schemes operated by the group;
• Review the design of all employee share incentive plans;
• Ensure that contractual terms on termination and any payments made are fair to the individual and the group, that failure is not rewarded and that a duty to mitigate risk is fully recognised;
• Review any major changes in employee benefits structures throughout the group;
• Select, appoint and determine terms of reference for independent remuneration consultants to advise the Committee on remuneration policy and levels of remuneration;
• Ensure that the remuneration structures in the group are compliant with the rules and requirements of regulators, and all relevant legislation;
• Ensure that provisions regarding disclosure of remuneration are fulfilled; and
• Seek advice from group control functions to ensure remuneration structures and annual bonuses are appropriately aligned to the group’s risk appetite.
MembershipThe Committee comprises Bridget Macaskill as chairman, together with each of the other independent non-executive directors. Five meetings were held during the year and a record of attendance at meetings is set out on page 48.
The chairman of the board, chief executive, group head of human resources and the head of reward and HR operations also attend meetings by invitation.
Activity in the 2016 financial yearThe Committee has a standing calendar of items within its remit. In addition to these standing items, it discusses matters relating to the operation of the remuneration policy and emerging regulatory and market practices. The key issues that the Committee focused on during the year were as follows:• The review of the annual bonus targets and objectives for
EDs;• Assessment of the vesting of Long Term Incentive Plan
(“LTIP”) and Share Matched Plan (“SMP”) awards;• Regular reviews of regulatory and legislative changes and
developments;• Review of the design for all share incentive plans;• Review of the monitoring and management information for
employee sales incentive schemes in the group;• Initial review of gender pay gap disclosures taking effect in
2017; and• The annual performance, salary and variable remuneration
review.
Value of shareholding versus shareholding policy1 as a percentage of salary

Close Brothers Group plc Annual Report 2016S
trategicR
eportG
overnanceFinancial
Statem
ents63
Directors’ Remuneration PolicyThis section sets out the company’s remuneration policy for directors and explains each element and how it operates.
The reward structure aims to:• Attract, motivate and retain high calibre employees across the group;• Reward good performance;• Promote the achievement of the group’s annual plans and its long-term strategic objectives;• Align the interests of employees with those of all key stakeholders, in particular our shareholders, clients and regulators; and• Support effective risk management and promote a positive client conduct culture.
Remuneration Policy for EDsElement and how it supports the company’s short-term and long-term strategic objectives Operation and maximum payable Performance framework, recovery and withholding
Base salaryAttracts and retains high calibre employees.
Reflects the employee’s role and experience.
Set annually based on the individual’s role and experience, pay for the broader employee population and external factors, where applicable.
Increases normally take effect from 1 August.
Paid monthly in cash.
Increases will generally not exceed increases for the broader employee population unless there is a change in role or responsibility.
None.
BenefitsEnables the EDs to perform their role effectively by contributing to their wellbeing and security.
Provides competitive benefits consistent with the role.
Private medical cover.
Health screening.
Life assurance cover.
Income protection cover.
Allowance in lieu of a company car.
The maximum allowance in lieu of a company car is £18,000 for the chief executive and £12,000 for the other EDs.
Other benefits provided from time to time.
None.
PensionProvides an appropriate and competitive level of personal and dependant retirement benefits.
Cash allowance in lieu of employer pension contributions equal to 22.5% of base salary.
The maximum is 22.5% of base salary and the absolute values will only increase in line with any base salary increases.
None.

Close Brothers Group plc Annual Report 201664
Report of the Board on Directors’ Remuneration continuedElement and how it supports the company’s short-term and long-term strategic objectives Operation and maximum payable Performance framework, recovery and withholding
Annual bonusRewards good performance.
Motivates employees to support the group’s goals, strategies and values over both the medium and long term.
Aligns the interests of senior employees and executives with those of key stakeholders, including shareholders, and increases retention for senior employees, through the use of deferrals.
Set annually based on the achievement of pre-determined objectives.
Annual bonus up to 100% of base salary is delivered in cash.
Annual bonus above 100% of base salary is deferred into group shares vesting one third per year over three years.
Shares may be called for at any time up to 12 months from the date of vesting. When the shares are called for, the ED is entitled to the gross value of accumulated dividends in respect of the shares held under the deferred awards prior to calling.
The annual bonus for EDs is capped at 300% of base salary.
The annual bonus for the group head of legal and regulatory affairs is capped at 100% of base salary given that this is a control function, and so a lower proportion of the remuneration should be variable.
Individual bonuses are determined based on both financial and non-financial performance, including adherence to relevant risk and control frameworks.
The financial measure used to determine the bonus is RoE. The non-financial metric is individual performance. This includes risk, compliance and control measures, and others applicable to each role. The actual performance targets will be set at the beginning of each financial year, but will not be disclosed in advance for commercial sensitivity reasons.
The actual targets set for each year will be designed to align the interests of EDs with the key stakeholders over the medium term, be challenging but also provide an effective incentive for the EDs.
60% of the annual bonus for the chief executive, the Banking chief executive and the group finance director will be determined based on RoE. 40% of the annual bonus for the group head of legal and regulatory affairs will be determined based on RoE. The remainder will be determined based on individual performance.
Threshold performance would result in a bonus of no more than one third of the maximum being paid for the chief executive, the Banking chief executive and the group finance director, and no more than 60% of the maximum being paid for the group head of legal and regulatory affairs.
The deferred awards would be forfeited if the ED leaves employment in certain circumstances or is dismissed for cause before the relevant vesting date.
The cash element is subject to clawback and the deferred element is subject to malus and clawback conditions, as outlined on page 68.

Close Brothers Group plc Annual Report 2016S
trategicR
eportG
overnanceFinancial
Statem
ents65
Element and how it supports the company’s short-term and long-term strategic objectives Operation and maximum payable Performance framework, recovery and withholding
Long Term Incentive PlanMotivates executives to achieve the group’s longer-term strategic objectives.
Aids the attraction and retention of key staff.
Aligns executive interests with those of shareholders.
Awards are made in the form of nil cost options or conditional shares.
Awards vest after three years subject to achieving absolute total shareholder returns (“TSR”), adjusted earnings per share (“EPS”) growth and Risk Management objectives.
On vesting, EDs receive an amount (in cash or shares) equal to the dividends which would have been paid on vested shares during the period from the beginning of the performance period to the time that the ED calls for the award.
EDs are eligible to receive an annual award of shares with a face value of up to 200% of base salary, excluding dividend equivalents.
The group head of legal and regulatory affairs is eligible to receive an annual award of shares with a face value of up to 125% of base salary, excluding dividend equivalents, given that this is a control function, and so a lower proportion of remuneration should be variable.
Awards vest after three years subject to achieving TSR, adjusted EPS growth and Risk Management objectives.
The weighting of the performance measures is 40% TSR, 40% adjusted EPS and 20% Risk Management objectives.
The TSR and adjusted EPS performance targets are determined at the time of each grant, are set to support the objectives of the LTIP and be challenging but achievable.
The Risk Management objectives are: capital and balance sheet management; and risk, compliance and controls. These two elements have equal weighting.
For each element of the award, vesting starts at 25% for threshold performance, rising on a straight line basis to 100% for maximum performance.
The actual target ranges set for each grant and performance against the targets at vesting will be reported in the Annual Report on Remuneration for the relevant financial years.
The LTIP awards will be forfeited if the ED leaves employment in certain circumstances or is dismissed for cause before the relevant vesting date.
The LTIP awards are subject to malus and clawback conditions, as outlined on page 68.
Share Matching PlanAligns the interests of executives with those of shareholders.
EDs can choose to invest up to a maximum value of 100% of base salary from their bonus into Close Brothers Group plc shares (“Invested SMP Shares”) for three years.
Invested Shares are matched with free matching shares (“Matched SMP Shares”) for every Invested Share.
The Invested SMP Shares are released in full at the end of the three year deferral.
The Matched SMP Shares are subject to performance conditions over the three year deferral period.
On vesting, EDs receive an amount (in cash or shares) equal to the dividends which would have been paid on vested shares during the period from the beginning of the performance period to the time that the ED calls for the award.
The maximum matching ratio will be two Matched SMP Shares for each Invested Share.
The performance conditions for the Matched SMP Shares are the same as the performance conditions in respect of the LTIP awards, outlined above.
For each performance element of the Matched SMP Share award, vesting starts at 25% for threshold performance, rising on a straight line basis to 100% for maximum performance.
The actual target ranges set for each grant and performance against the targets at vesting will be reported in the Annual Report on Remuneration for the relevant financial years.
The Invested SMP Shares and Matched SMP Shares are forfeited if the ED leaves employment in certain circumstances or is dismissed for cause before the relevant vesting date.
The Invested SMP Shares and Matched SMP Shares are subject to malus and clawback conditions, as outlined on page 68.

Close Brothers Group plc Annual Report 201666
Report of the Board on Directors’ Remuneration continuedElement and how it supports the company’s short-term and long-term strategic objectives Operation and maximum payable Performance framework, recovery and withholding
Save As You Earn (“SAYE”)Aligns the interests of executives with those of shareholders through building a shareholding.
Employees save a fixed amount per month over a three or five year timeframe.
At the end of the period employees can withdraw all of their savings, or use some or all of their savings to buy shares at the guaranteed option price.
The option price is set at the beginning of the participation period and is usually set at a 20% discount to the share price at invitation.
Employees can make total maximum contributions of £6,000 per annum, in line with HMRC rules.
The Committee reserves the discretion to increase the maximum contributions in line with any HMRC rule changes during the period of the policy.
None, as this is a voluntary scheme where employees have invested their own earnings.
Share Incentive Plan (“SIP”)Aligns the interests of executives with those of shareholders through building a shareholding.
Employees are able to contribute up to a maximum of £1,800 per year from pre-income tax and national insurance earnings to buy Partnership Shares.
At present the Committee has determined that employees have the ability to buy Partnership Shares; however it retains the discretion to offer Matching Shares of up to twice the number of Partnership Shares. This will be on the same basis for all employees should the Committee exercise this discretion.
Dividends paid on shares held in the SIP are to be reinvested to acquire further Dividend Shares.
The Committee reserves the discretion to increase the maximum contributions in line with any HMRC rule changes during the period of the policy.
None, as this is a voluntary scheme where employees have invested their own earnings.
Shareholding requirementAligns the interests of executives with those of shareholders.
The chief executive, the Banking chief executive and the group finance director are required to build and maintain a shareholding of 200% of base salary over a reasonable timeframe. The group head of legal and regulatory affairs is required to build a shareholding of 100% of base salary, given that this is a control function. Short-term share price fluctuations are disregarded for these calculations.
None.
Other The company will pay legal, training and other reasonable and appropriate fees incurred by the EDs as a result of doing their job.
None.
Legacy arrangements The company has the ability to honour any commitments entered into with current or former directors that were disclosed to shareholders in remuneration reports prior to the 2014 remuneration report.
The Committee reserves the right to allow awards to vest or make payments subject to arrangements that were granted or agreed before the individual became a director and not in contemplation of becoming a director.
None.

Close Brothers Group plc Annual Report 2016S
trategicR
eportG
overnanceFinancial
Statem
ents67
Additional Details on the Remuneration PolicyAnnual bonus: Performance measures and targets
Role
Per cent determined
by RoE
Per cent determined by
achievement against
personal goals Examples of personal goals
Group chief executive
60% 40% Strategic: Maintain discipline of the Banking division model particularly as competition increases and maintain momentum in Asset Management.
People: Develop senior succession and support pipeline talent programmes.
Business delivery: Deliver versus key group metrics.
Banking chief executive
60% 40% Strategic: Maintain discipline of funding and lending models and progress strategic and tactical initiatives.
People: Develop senior succession and support pipeline talent programmes.
Business delivery: Deliver against key metrics, principally in the Banking division and maintain cost discipline and prioritise spending.
Group finance director
60% 40% Strategic: Manage the positioning of our strategy and results with investors and analysts.
Business delivery: Manage the level of group capital, including both regulatory and economic.
Group head of legal and regulatory affairs
40% 60% Strategic: Play a leadership role in all regulatory issues, including advice on key decisions as we address PRA/FCA requirements and standards.
Risk and compliance: Ensure operation within the agreed risk appetite and continue to enhance the control environment and supporting infrastructure.
The above are high level examples of personal goals. Individual personal goals change each year in line with the evolving business strategy. Detailed disclosures for the 2016 financial year are provided on pages 73 and 74.
The Committee chose RoE as a performance measure as it aligns the interests of the shareholders and the executives and it captures both profit and capital management metrics. Individual performance was selected to ensure that the EDs are implementing and executing the group’s strategies and objectives over the short and medium term. Risk, compliance and controls are included as part of the personal objectives to ensure that the EDs set the right tone from the top and ensure the company maintains the appropriate risk and compliance discipline.
The actual performance targets for each financial year will be set at the beginning of the financial year based on prior year performance, the budget for the following year and other internal and external factors as appropriate.
LTIP and SMP: Performance measuresAdjusted EPS was chosen as a performance measure as the Committee believes it is the best measure of long-term performance for the group. Absolute TSR was selected as it is the key objective for most of our shareholders and it supports both the delivery of a good RoE for shareholders and strong alignment of interests between executives and shareholders. Capital and balance sheet management was included to ensure capital is used efficiently and in a disciplined way to support the long-term health of the group. Risk, compliance and controls was selected to ensure that the long-term interests of the group are protected and to support key requirements for our business such as good customer outcomes.
Additional details on performance measures for the annual bonus, LTIP and SMPThe Committee has the discretion to change the overall weighting of each category over the duration of the policy where it is deemed appropriate and reasonable to do so.
The Committee can also make adjustments to performance targets to reflect significant one-off items which occur during the measurement period (for example a major transaction), where it is deemed appropriate and reasonable to do so. The Committee will make full and clear disclosure of any such adjustments within the Annual Report on Remuneration for the relevant financial year.

Close Brothers Group plc Annual Report 201668
Report of the Board on Directors’ Remuneration continuedMalus and clawbackThe cash element of the annual bonus is subject to clawback for a period of three years from award. The deferred element vests in equal tranches over three years, and is subject to malus prior to vesting and clawback for three years from the date of grant.
The LTIP and the Matched SMP shares are subject to malus for the three year period to the point of vesting, and are subject to clawback for four years from the date of grant. The Invested SMP shares are subject to malus until vesting and to clawback for three years from the date of grant.
The events which may trigger malus are as follows:• The ED’s employment is terminated for misconduct or the ED is issued with a formal disciplinary warning for misconduct
under the firm’s disciplinary policy; or • The firm suffers a material loss where the ED has operated outside the risk parameters or risk profile applicable to their
position and as such the Committee considers a material failure in risk management has occurred; or • The level of the award is not sustainable when assessing the overall financial viability of the firm.
In the event that one of these is triggered, the Committee may, at its discretion, defer and/or reduce, in whole or in part any unvested award.
The events which may trigger clawback are as follows:• Discovery of a material mis-statement resulting in an adjustment in the audited consolidated accounts of the company, or
the audited accounts of any material subsidiary; or• The assessment of any performance target or condition in respect of an award was based on material error, or materially
inaccurate or misleading information; or• The discovery that any information used to determine the bonus and number of shares subject to an award was based on
material error, or materially inaccurate or misleading information; or• Action or conduct of a participant which, in the reasonable opinion of the board, amounts to fraud or gross misconduct.
In the event that one of these is triggered, the Committee may require the ED to repay all or part of a relevant award, and any associated dividend equivalents.
Consistency of executive remuneration across the groupThe pay and employment conditions of employees within the group were taken into consideration when setting the policy and pay of the EDs. The Committee does not formally consult with employees when setting the policy, although the employee opinion survey conducted every two years includes remuneration as one of the topics surveyed.
The principles of remuneration are applied throughout the group and are designed to support the group’s key attributes across our businesses, which are expertise, service and relationships. Remuneration structures and arrangements for employees below the EDs are based on the individual’s role, experience, performance and relevant market practice.
Annual bonuses for those below ED level are based on role, business performance, market conditions and individual performance. These bonuses are not capped; however highly remunerated employees have a portion of their bonus deferred. For the majority of employees the bonus deferral policy is in line with the EDs, although there are differing approaches in some parts of the group.
A limited group of senior employees receive LTIP awards, generally on the same basis as the EDs, but the maximum face value of these awards is generally at or below the level of the employee’s base salary.
Members of the group Executive Committee who are not EDs are required to build and maintain shareholdings of at least one times base salary and as such are also eligible to participate in the SMP.
All UK employees are eligible to participate in the SAYE and SIP plans.

Close Brothers Group plc Annual Report 2016S
trategicR
eportG
overnanceFinancial
Statem
ents69
Illustrations of Application of Remuneration Policy for EDs
Fixed remuneration Annual bonus Performance awards
0
1,000
2,000
3,000
4,000
5,000
Minimum On target Maximum
Stephen Hodges£’000
100% 25%
39%
36%
48%
36%
15%
£613
£2,464
£4,008
0
1,000
2,000
3,000
4,000
5,000
Minimum On target Maximum
Elizabeth Lee1
£’000
100% 36%
41%23% 18%
59%
23%£424
£1,171
£1,830
0
1,000
2,000
3,000
4,000
5,000
Minimum On target Maximum
Preben Prebensen£’000
100% 24%
38%
38%
49%
36%
15%
£686
£2,835
£4,466
0
1,000
2,000
3,000
4,000
5,000
Minimum On target Maximum
Jonathan Howell£’000
100% 25%
39%
36%
49%
36%
15%
£518
£2,099
£3,374
1 Elizabeth Lee’s working pattern changed on 1 August 2016 to 90% of the full time equivalent.
The following assumptions were made in developing the scenarios:
Element Assumptions used
Fixed remuneration Consists of 2017 base salary, 2017 benefits and 2017 pension allowance.
Minimum No variable elements are awarded.
On target Annual bonus: Awarded at 200% of base salary for all EDs, with the exception of Elizabeth Lee, where the award is 80% of base salary.
LTIP: Awards with a face value of £1,080,000 for Preben Prebensen, £850,000 for Stephen Hodges, £750,000 for Jonathan Howell and £400,000 for Elizabeth Lee (the level of the 2016 financial year awards) and vesting at 66% (average level of vesting for the five years up to and including 2015).
SMP: The ED invests 50% of the policy maximum in the SMP, the investment is matched at two times the Invested Shares and vests at 66% (average level of vesting for the five years up to and including 2015).
Maximum Annual bonus: Awarded at policy maximum (300% of base salary for all EDs, with the exception of Elizabeth Lee, where the policy maximum is 100% of base salary).
LTIP: Maximum award with a face value equal to 200% of base salary for all EDs with the exception of Elizabeth Lee where the award is 125% of salary. Assumes 100% vesting.
SMP: The executive invests 100% of the maximum in the SMP (that is equal to 100% of base salary), the investment is matched at two times the Invested Shares and vests at 100%.
Other No adjustment for share price growth or dividends paid.
At maximum performance, the ratio of financial to non-financial measures for the EDs across the annual bonus, LTIP and SMP is approximately 70% to 30%. The Committee believes this combination provides a good balance of financial and non-financial measures, supports the medium and long-term strategic objectives of the group, and alignment of EDs’ and shareholders’ interests.
Approach to Recruitment RemunerationThe remuneration package for new EDs will comply with the Remuneration Policy for EDs outlined on pages 63 to 66. The Committee will seek to pay no more than is necessary to secure the right candidate. The Committee may seek to “buy out” remuneration that the director forfeits as a result of joining the company. In such cases, the Committee will seek to replace this with awards that match the quantum and terms of the forfeited awards as closely as possible. There may be situations where a new director has to relocate in order to take up the post with the company. In such situations reasonable financial and/or practical support will be provided to enable the relocation. This may include the cost of any tax that is incurred as a result of the move.

Close Brothers Group plc Annual Report 201670
Report of the Board on Directors’ Remuneration continuedService Contracts and Policy for Payment on Loss of OfficeStandard provision Policy Details
Notice period 12 months’ notice from the company.12 months’ notice from the ED.
EDs may be required to work during the notice period or may be provided with pay in lieu of notice if not required to work the full period.All EDs are subject to annual re-election by shareholders.
Compensation for loss of office in service contracts
No more than 12 months’ salary, pension allowance and benefits.
Payment will be commensurate with the company’s legal obligations and we will seek appropriate mitigation of loss by the ED.
Treatment of annual bonus on termination
The standard approach is no payment unless employed on date of payment.
The Committee may award a pro-rated bonus to “good leavers” (as determined by the Committee) in certain circumstances, although there is no automatic entitlement. “Good leaver” status may be granted in cases such as death, disability or retirement. The Committee has discretion to reduce the entitlement of a “good leaver” in line with performance, the circumstances of the termination, and the malus conditions outlined in the policy table. The Committee also has the ability to recover annual bonuses in line with the clawback conditions outlined in the policy table.
Treatment of unvested deferred awards under the annual bonus plan and the Invested SMP Shares
The Committee has the discretion under the relevant plan rules to determine whether “good leaver” status should be applied on termination.The current approach provides that discretion may be afforded in cases such as death, disability, retirement, redundancy or mutual separation.
Where the director is designated a “good leaver”, awards vest in full over the original schedule and remain subject to the malus conditions.The deferred shares are released in full in the event of a change in control.Awards lapse in the event the employee is declared bankrupt, joins another financial services company within 12 months of termination (unless this condition is waived under “good leaver” status), or leaves and is not designated a “good leaver”. These are also subject to the clawback conditions.
Treatment of the LTIP and the Matched SMP Shares
All awards lapse except for “good leavers”.The Committee has the discretion under the relevant plan rules to determine how “good leaver” status should be applied on termination.The current approach provides that discretion may be afforded in cases such as death, disability, retirement, redundancy or mutual separation.
For “good leavers”, vesting is pro-rated for the period of employment during the performance period.Vesting is subject to the achievement over the original performance period against the performance targets and is on the original schedule.Awards remain subject to the malus and clawback conditions.In the event of a change in control, the awards will vest subject to the service factor and the achievement against the performance targets at that point. However, the Committee retains the discretion to increase the amount vesting depending on the circumstances of the change in control.
Outside appointments EDs may accept external appointments. Board approval must be sought before accepting the appointment.The fees may be retained by the director.
Chairman and non-executive directors
Engaged under letters of appointment for terms not exceeding three years.Renewable by mutual agreement and can be terminated on one month’s notice.
All non-executive directors are subject to annual re-election.No compensation is payable if required to stand down.
Other The company may pay settlement payments, legal, training and outplacement fees incurred on exit, if appropriate.
Other notable provisions in service contracts
There are no other notable provisions in the service contracts.
Copies of the directors’ service contracts and letters of appointment are available for inspection at the company’s registered office.

Close Brothers Group plc Annual Report 2016S
trategicR
eportG
overnanceFinancial
Statem
ents71
Dates of EDs’ Service ContractsName Date of service contract
Preben Prebensen 9 February 2009Stephen Hodges 22 January 2001Jonathan Howell 8 October 2007Elizabeth Lee 1 August 2012
Remuneration Policy for the Chairman and Independent Non-executive DirectorsElement and how it supports the company’s short-term and long-term strategic objectives Operation and maximum payable
FeesAttract and retain a chairman and independent non-executive directors who have the requisite skills and experience to determine the strategy of the group and oversee its implementation.
Fees are paid in cash and are reviewed periodically.Fees for the chairman and non-executive directors are set by the board based on a recommendation from the Nomination and Governance Committee. The non-executive directors do not participate in that decision.The chairman of the board receives a fee as chairman but receives no other fees for chairmanship or membership of any committees.Non-executive directors receive a base fee.The senior independent director receives an additional fee for this role.Additional fees are paid for chairmanship of each of the Audit, Remuneration and Risk Committees.Additional fees are paid for membership of committees, with the exception of the Nomination and Governance Committee, for which no additional fees are payable.The chairman and non-executive directors are entitled to claim reimbursement for reasonable expenses incurred performing their duties for the company, including travel expenses.Overall aggregate fees will remain within the £1 million authorised by our articles of association.There is no performance framework, recovery or withholding.
Non-executive Directors’ Appointment LettersName Date of appointment Current letter of appointment start date
Oliver Corbett 3 June 2014 20 November 2014Geoffrey Howe 4 January 2011 20 November 2014Lesley Jones 23 December 2013 20 November 2014Bridget Macaskill 21 November 2013 20 November 2014Strone Macpherson 3 March 2003 20 November 2014
Consideration of Shareholders’ ViewsThe chairman of the board consults our major shareholders on a regular basis on key issues, including remuneration. The Committee took issues of concern raised by shareholders in prior years into account when determining the policy.
Annual Report on RemunerationThis section explains how our Directors’ Remuneration Policy was implemented during 2016.
Single Total Figure of Remuneration for EDs (Audited)Salary Benefits Annual bonus1 Performance awards2 Pension Total
Name2016
£’0002015
£’0002016
£’0002015
£’0002016
£’0002015
£’0002016
£’0002015
£’0002016
£’0002015
£’0002016
£’0002015
£’000
Preben Prebensen 540 528 20 20 1,545 1,552 1,545 3,743 121 119 3,771 5,962Stephen Hodges 485 475 13 13 1,397 1,405 1,324 2,257 109 107 3,328 4,257Jonathan Howell 408 400 13 14 1,126 1,135 1,188 1,804 92 90 2,827 3,443Elizabeth Lee3 353 360 14 13 336 335 436 772 82 81 1,221 1,561
1 Any amount of annual bonus above 100% of base salary is deferred into group shares. 2 The figures for the performance awards for 2015 have been re-calculated using the actual share price on the dates of vesting for the LTIP and Matched SMP shares.
These were £15.17 for LTIP and Matched SMP Shares. The three month average to 31 July 2015 was used for the 2015 report given that the awards were vesting after publication of the report.
3 Elizabeth Lee’s salary was £367,500 with effect from 1 August 2015, however a reduced amount was paid due to a short period of unpaid leave.

Close Brothers Group plc Annual Report 201672
Report of the Board on Directors’ Remuneration continuedLink between reward and performanceThe group’s financial results have been good this year, and over the past three years. Adjusted operating profit has increased 4% in the year to £233.6 million, and it has grown 40% or 12% per annum compounded over the last three financial years. RoE has remained strong at 18.9% this year, and is up from 15.8% in 2013. Dividend growth was 7% this year with dividend cover remaining at 2.3 times up from 1.9 times in 2013.
The strong RoE has been reflected in the EDs’ bonuses, with the element of the bonus determined based on RoE being 93.3% of the potential maximum. The compounded adjusted EPS growth of 15.4% over the last three years has resulted in the EPS element of the LTIP vesting at 100%. The compounded TSR of 10.0% per annum has met the threshold target under the LTIP and vested at 25.1%. The very strong approach to capital management combined with a good performance in risk, compliance and controls mean that the Risk Management objectives element vested at 89.2%. As a result, the LTIP will vest at 67.9% this year.
Additional Disclosures on the Single Total Figure of Remuneration for EDs Table (Audited)SalaryThe per annum salaries paid during the year are as shown in the single total figure of remuneration table shown on page 71. The increase between 2015 and 2016 was with effect from 1 August 2015. When reviewing salary levels, the Committee takes into account the individual’s role and experience, pay for the broader employee population and external factors, where applicable. There were no salary increases awarded for the 2017 financial year.
BenefitsThe EDs each received an allowance in lieu of a company car. Preben Prebensen received £18,000 while the others received £12,000. These allowances have not been increased since 2012. They also received private health cover. The discount to the share price on grant of SAYE options is included in the year of grant.
PensionThe EDs all received a monthly cash pension allowance equivalent to 22.5% of base salary. They do not receive any additional pension provision.
Annual bonus: Achievement against targets The bonuses for EDs were determined with reference to RoE targets and stretching personal goals relevant to each ED’s role and business accountabilities. The RoE for the 2016 financial year was 18.9% against a maximum target of 20%, warranting an award of 93.3% of the potential maximum bonus for this element. Any annual bonus above the level of the 2016 base salary was deferred into group shares vesting one third per year over three years in line with the approach outlined in the Remuneration Policy on page 64.
Achievement Against Annual Bonus TargetsFinancial target (RoE) Personal goals
Name Weighting
Threshold (33.33% of
potential maximum)
Target (66.67% of
potential maximum)
Potential maximum (100% of potential
maximum)
Actual RoE(93.3% of potential
maximum)
Actual amount
awarded (’000s) Weighting
Potential maximum
(’000s)
Actual per cent awarded
Actual amount
awarded (’000s)
Total bonus
awarded (’000s)
Preben Prebensen 60% 12% 15% 20% 19% £907 40% £648 98.5% £638 £1,545Stephen Hodges 60% 12% 15% 20% 19% £815 40% £582 100.0% £582 £1,397Jonathan Howell 60% 12% 15% 20% 19% £685 40% £490 90.0% £441 £1,126Elizabeth Lee 40% 12% 15% 20% 19% £137 60% £221 90.0% £199 £336
Annual bonus: Personal goals for the 2016 financial year Performance for each individual is assessed against a balanced scorecard of strategic, people, business delivery and risk and control objectives. These objectives are agreed with the Committee at the start of each financial year, and are designed to be stretching for the individual and the business while maintaining consistency and stability in the group’s strategy, business model and performance.
Performance against each individual’s objectives is assessed by the Committee taking into account a combination of qualitative and quantitative measures, as well as feedback from key stakeholders.
In the last year, all four EDs achieved strong performance against their individual objectives – as evidenced by the consistent execution of our strategy, continued strong financial performance and outperformance of our TSR against the majority of the domestic UK banking sector during the financial year.
A summary of the EDs’ personal objectives and achievements which were considered by the Committee for the 2016 financial year is set out on pages 73 and 74. For reasons of commercial sensitivity, not all performance criteria can be disclosed.

Close Brothers Group plc Annual Report 2016S
trategicR
eportG
overnanceFinancial
Statem
ents73
Examples of Personal Goals for the 2016 Financial YearObjective Achievement
Preben Prebensen, Group Chief ExecutiveExecute group strategy • Preben Prebensen has continued to provide strong leadership over the course of the year,
promoting and supporting the effective and consistent application of the group’s strategy and business model across all its businesses. This has resulted in good financial performance with adjusted operating profit growth of 4% to £233.6 million against a backdrop of more challenging market conditions.
• Comprehensive review of the group’s business model concluded that the group’s long-term strategy, focused on building sustainable positions in specialist market segments, remains appropriate and is fully supported by the board and embedded in the business.
• Maintained the discipline around implementation of the business model across the business, with focus on margins, returns and effective underwriting processes and controls supported by a prudent risk culture. As a result loan book growth of 12% was achieved while maintaining credit metrics well within limits and stable key performance indicators.
• Ongoing progress in new business initiatives and investment in premium finance lead to improved growth and business performance.
• Increased the strength of our brand through targeted advertising campaigns and sponsorship, which have significantly enhanced brand visibility with key client audiences.
Ensure robust succession plans across key functions
• Developed comprehensive succession plans for the Banking division senior team, ensuring stability and continuity in leadership.
• Successful transition of leadership at Winterflood to Philip Yarrow.• Developed a new leadership competency framework to support the development of key senior
talent and to support the long-term performance of the business both now and in the future.
Ensure group maintains regulatory compliance, with appropriate governance
• The group continued to operate within its risk appetite and remained compliant with regulatory obligations throughout the year.
Stephen Hodges, Banking Chief ExecutiveDrive strategic and tactical initiatives in the Banking division while maintaining the discipline of our funding and lending models
• Stephen Hodges has continued to deliver effective and consistent leadership of the Banking division, with a strong focus on driving strategic initiatives while maintaining the discipline of our differentiated lending model as the Banking division delivered its seventh successive year of operating profit growth, up 7% to £223.0 million.
• Maintained discipline of the lending model in a period of enhanced competition; core metrics have remained strong and consistent with our disciplined model with net interest margin at 8.2%, bad debt at 0.6% and return on net loan book of 3.6%.
• Identified and actioned a significant number of key strategic initiatives in the year, maintaining strong momentum in existing initiatives.
• Commitment to differentiated and service led proposition emphasised in a range of internal and external communications and evidenced by strong customer feedback and net promoter scores.
• Maintained distinctive approach to funding and liquidity, upholding “borrow long, lend short” principle while improving diversity of funding with a new public securitisation, private placements and growth in corporate deposits.
Maintaining cost discipline while protecting key investment initiatives
• Progressed all key investment initiatives while maintaining a strong focus on cost. This included the introduction of additional measures to manage the rate of cost progression through the year, such as phasing of key investment decisions and restrictions on new hires.
Succession planning and talent development
• Established comprehensive talent and succession plan for senior roles to support the development and retention of key talent within the business. This includes the restructuring of credit roles to enhance succession and the establishment of a new Training Academy to develop the next generation of specialist sales talent.

Close Brothers Group plc Annual Report 201674
Report of the Board on Directors’ Remuneration continuedObjective Achievement
Jonathan Howell, Group Finance DirectorSet and execute the group’s financial strategy
• Jonathan Howell has outlined a clear financial strategy, including three year projections for business and group performance and balance sheet metrics. Supported by robust forecasting and scenario analysis he continues to effectively implement that strategy ensuring prudent management of the group’s financial resources.
• Maintained strong capital ratios for the group, comfortably ahead of minimum regulatory requirements, with CET1 ratio of 13.5% and leverage ratio at 10.2%.
• Performed accurate and effective modelling of capital including stress tests and scenario analysis, which underpins confidence in the group’s capital position from shareholders, regulators and rating agencies.
• Established and implemented consistent and long-term dividend policy with strong support from board, shareholders and sell-side analysts, supporting sixth consecutive year of dividend growth with prudent cover of 2.3 times in the 2016 financial year.
Manage the positioning of our strategy with investors and analysts
• Ongoing dialogue and engagement with shareholders, strengthening support for the company and its implementation of strategy.
• Maintained straightforward and consistent shareholder communications, with consistency in financial reporting and key performance measures.
• Differentiation of Close Brothers’ specialist, high margin model understood and valued by investors and analysts as evidenced in strong price to book and price earnings ratios compared to the domestic UK banking sector.
Lead high quality group finance functions
• High quality, consistent and timely management reporting to board, chief executive, Executive Committee and control functions, used as basis for planning, measurement, forecasting and decision making.
• Accurate and reliable budgeting and forecasting supporting “no surprises” culture and performance.
• Implemented succession plans developed for all key finance roles, to ensure development and retention of key talent.
Elizabeth Lee, Group Head of Legal and Regulatory AffairsPlay a leadership role in all legal and regulatory issues
• Elizabeth Lee has continued to provide effective leadership and support to the business on all legal and regulatory issues.
• Overseen the successful implementation of Senior Managers Regime, effective preparation for the introduction of the Market Abuse Regulation and changes in data protection regulations.
• Delivered legal support for new business initiatives including premium finance investment programme, development of the retail finance business and M&A activity.
Review the group’s insurance provision
• Led full assessment of group insurance cover requirements alongside scope and cost of group financial lines insurances resulting in both reduced cost and wider cover, including additional cover for cyber risks.
Manage and monitor legal and regulatory risk
• Legal and regulatory risks have remained well managed and clearly communicated to the executive team and board.
• Completed overhaul of management information in relation to Conduct Risk, in partnership with the group risk function.
Performance awardsThe performance awards in the single total figure of remuneration include the 2013 LTIP grant and the 2013 Matched SMP Shares. Both of these will vest on 1 October 2016.
The performance targets for the 2013 awards vesting in 2016 were weighted 40% adjusted EPS, 40% absolute TSR and 20% Risk Management objectives. The adjusted EPS targets were RPI +3% per annum to RPI +10% per annum and the absolute TSR targets were +10% per annum to +20% per annum. Compounded adjusted EPS growth over the three year period to 2016 was a very good 15.4% per annum, while the TSR was 10.0% per annum, meaning the EPS element will vest at 100% and the TSR element will vest at 25.1%. The Risk Management objectives of the 2013 LTIP and Matched SMP Shares were assessed at 89.2% by the Committee. More details on the rationale for the assessment are provided in the table on page 75. Accordingly, the 2013 LTIP and Matched SMP Shares will vest at 67.9%. The LTIP and SMP awards vested at 97.3% in 2015.
The share price for the LTIP and Matched SMP Shares increased by 4% over the three year period from the date of grant to the end of the performance period. The average share price used to value the awards due to vest in October 2016 was 1,211.4p (from 1 May 2016 to 31 July 2016, which was the performance measurement period). The 2013 LTIP and SMP awards were originally granted at 1,168.2p. While the increase in share price remains positive over the performance period, the single total figure of remuneration for the EDs are down from the previous year, primarily due to the slowdown in share price growth.
The performance awards also include the amount (in cash or shares) equal to the dividends which would have been paid during the period from the beginning of the performance period to the time that the awards vest. The good, progressive dividend payout also contributed to the single total figures of remuneration.

Close Brothers Group plc Annual Report 2016S
trategicR
eportG
overnanceFinancial
Statem
ents75
The Committee assessed performance against the Risk Management objectives after each of the three years of the LTIP performance period. The results of each assessment are shown in the table below.
Details of the Assessment of the Risk Management Objectives for the LTIP and SMP
Performance measureYear one
assessment Year two
assessment Year three
assessment Overall vesting Comments
Capital and balance sheet management
100% 100% 100% 100% Capital, balance sheet management, funding and liquidity were very strong in the 2016 financial year.The group continues to maintain a strong, straightforward and transparent balance sheet. This was demonstrated in the 2016 financial year when Moody’s Investor Services confirmed our credit ratings were unchanged following an upgrade in the 2015 financial year. Funding position remains strong with significant and widening diversity within the sources of our funding.
Risk, compliance and controls
70% 80% 85% 78.3% Regulatory relationships remain good with both the PRA and FCA.Resource and capabilities across risk have been upgraded and enhanced.The Committee noted good progress has been made across all areas of risk, compliance and controls.
Overall vesting 89.2%
Details of the Overall Vesting for the LTIP and SMPPerformance measure Threshold target Maximum target Actual achieved Overall vesting
Adjusted EPS growth RPI +3% p.a. RPI +10% p.a. 15.4% p.a. 100%TSR +10% p.a. +20% p.a. 10.01% p.a. 25.05%
Risk Management objectives n/a n/aAs per the
table above 89.2%Overall vesting 67.9%
Historical Vesting of LTIP Awards Compared to Adjusted EPS and Absolute TSRThe following graph and table show the level of LTIP vesting following performance testing for the last five years.
LTIP vesting %
2009 awardvested 2012
2010 awardvested 2013
2011 awardvested 2014
2012 awardvested 2015
Adjusted EPS and TSR
2013 awardvested 2016
0 0
20
40
60
80
100
50
100
150
200
300
250
25%
79%
95%
97%
68%
LTIP vestingAdjusted EPSTSR
1 2 2 2 2
1 Vesting was subject to one third adjusted EPS, one third absolute TSR and one third Strategic Goals for all awards granted between 2009 and 2011, inclusive.2 Vesting was subject to 40% adjusted EPS, 40% absolute TSR and 20% Risk Management objectives for the 2012 and 2013 awards.
Note: This graph shows the vesting percentage of the LTIP compared with the adjusted EPS rebased to 100 at 31 July 2011, and the TSR based on £100 invested in Close Brothers Group plc on 31 July 2011.

Close Brothers Group plc Annual Report 201676
Report of the Board on Directors’ Remuneration continuedLTIP Vesting for the Last Five Years
Vesting percentage
Year awarded Year vested Adjusted EPS TSR Goals Total
20091 2012 – – 76% 25% 20101 2013 66% 92% 80% 79% 20111 2014 100% 100% 85% 95% 20122 2015 100% 100% 87% 97%20132 2016 100% 25% 89% 68%
1 Vesting was subject to one third adjusted EPS, one third absolute TSR and one third Strategic Goals for all awards granted between 2009 and 2011, inclusive.2 Vesting was subject to 40% adjusted EPS, 40% absolute TSR and 20% Risk Management objectives for the 2012 and 2013 awards.
Performance GraphThe graph below shows a comparison of TSR for the company’s shares for the seven years ended 31 July 2016 against the TSR for the companies comprising the FTSE 250 Index. TSR has been calculated assuming that all dividends are reinvested on their ex-dividend date. The index has been selected because the company has been a constituent of the index throughout the period. The closing mid-market price of the company’s shares on 29 July 2016 was 1,260p and the range during the year was 990p to 1,547p.
July 2009 July 2010 July 2011 July 2012 July 2013 July 2015 July 2016
0
50
100
150
200
250
300
FTSE 250 TSR
July 2014
Close Brothers TSR
Source: Thomson Reuters Datastream.
Note: This graph shows the value, by 31 July 2016, of £100 invested in Close Brothers Group plc on 31 July 2009 compared with the value of £100 invested in the FTSE 250 Index. The other points plotted are the intervening financial year ends.
Chief Executive: Historical Information (Audited)2010 2011 2012 2013 2014 20151 2016
Preben PrebensenSingle figure of total remuneration
(’000)2 £1,890 £2,187 £2,496 £5,748 £7,411 £5,962 £3,771Annual bonus against maximum
opportunity 90% 95% 90% 100% 100% 98% 95%LTIP, SMP and Matching Share
Award vesting 33% 33% 25% 79% 95% 97% 68%
1 The figures for the performance awards for 2015 have been re-calculated using the actual share price on the dates of vesting for the LTIP and Matched SMP shares. These were £15.17 for LTIP and Matched SMP Shares. As highlighted in the 2015 report, the three month average to 31 July 2015 was used for the 2014 report given that the awards were vesting after publication of the report.
2 The figures for 2011 to 2014 include the Matching Share Awards that were granted in 2009 at the time of Preben Prebensen’s appointment as chief executive.

Close Brothers Group plc Annual Report 2016S
trategicR
eportG
overnanceFinancial
Statem
ents77
Change in Remuneration of the Chief ExecutiveThe following table shows how the remuneration of the chief executive increased compared to the general employee population for the 2016 financial year. The Committee deemed it appropriate for Preben Prebensen to receive a salary increase below that received by the general employee population. The change in bonus for Preben Prebensen reflects the achievement against the RoE and personal goals targets, outlined on page 72. The reduction in average bonus for the general employee population primarily reflects increasing headcount as shown on pages 100 and 101 and the reduction in trading income in Winterflood, leading to a reduction in bonuses in that division. The average decrease in bonus for the general employee population excluding Winterflood was 2%.
Average change in salary for 2016
(from 1 August 2015)1
Average change in benefits for 2016
(from 1 August 2015)2
Average change in annual bonus
for 20163
Preben Prebensen 2% 2% (0.4)%All employee population 4% 4% (9)%
1 Calculated as the average percentage increase in salary for those eligible for an increase at 1 August 2015.2 Calculated as the average percentage increase in benefits for those eligible for a salary increase at 1 August 2015.3 The percentage increase in the average bonus calculated as the total bonus spend divided by the average headcount for financial years 2015 and 2016.
Relative Importance of Spend on PayThe following table shows the total remuneration paid compared to the total distributions to shareholders.
2016 £ million
2015 £ million
Remuneration paid 257.1 248.4Distributions to shareholders1 84.1 79.0
1 Interim dividend paid and final dividend proposed for the financial year.
Scheme Interests Awarded During the Year (Audited)The face value and key details of the share awards granted in the 2016 financial year are shown in the table below. These were all delivered as nil cost options. The Deferred Share Award (“DSA”) is a mandatory deferral of a portion of the annual bonus. The share price used to calculate the number of shares awarded was £14.934, the average mid-market closing price for the five days prior to grant.
Name Award type Vesting periodPerformance
conditionsFace value
‘000
Percentage vesting at threshold
Number ofshares
Vesting/performance
period end date
Preben Prebensen DSA1 1–3 years No £496 n/a 33,213 29 Sep 18LTIP 3 years Yes £1,000 25% 66,962 29 Sep 18SMP – Invested 3 years No £528 n/a 35,356 29 Sep 18SMP – Matching 3 years Yes £1,056 25% 70,712 29 Sep 18
Stephen Hodges DSA1 1–3 years No £468 n/a 31,338 29 Sep 18LTIP 3 years Yes £850 25% 56,918 29 Sep 18SMP – Invested 3 years No £462 n/a 30,937 29 Sep 18SMP – Matching 3 years Yes £924 25% 61,874 29 Sep 18
Jonathan Howell DSA1 1–3 years No £335 n/a 22,433 29 Sep 18LTIP 3 years Yes £750 25% 50,221 29 Sep 18SMP – Invested 3 years No £400 n/a 26,785 29 Sep 18SMP – Matching 3 years Yes £800 25% 53,570 29 Sep 18
Elizabeth Lee DSA1 1–3 years No — n/a — 29 Sep 18LTIP 3 years Yes £400 25% 26,785 29 Sep 18SMP – Invested 3 years No £200 n/a 13,393 29 Sep 18SMP – Matching 3 years Yes £400 25% 26,786 29 Sep 18
1 The DSA vests one third per year over three years.

Close Brothers Group plc Annual Report 201678
Report of the Board on Directors’ Remuneration continuedPerformance conditionsDuring the year, the Committee undertook an extensive review of the adjusted EPS and absolute TSR growth targets and determined that the targets for the LTIP and Matched SMP Share award grants this year should be unchanged from the 2015 grants, as outlined in the table below. The Committee believes these are appropriately stretching and effectively align the executives’ interests with those of shareholders.
Element Threshold vesting
(25% vests)Maximum vesting
(100% vests)
Absolute TSR1 +10% p.a. +20% p.a. or greaterAdjusted EPS1 RPI +3% p.a. RPI +10% p.a. or greater
1 There is straight-line vesting between the threshold and maximum targets.
External AppointmentsJonathan Howell received £77,000 in fees (2015: £77,000) from The Sage Group plc during the Close Brothers 2016 financial year. None of the other EDs held any external directorships during the year.
Payments to Past Directors (Audited)There were no payments to past directors after they had left office during the year.
Payments for Loss of Office (Audited)There were no payments made to directors for loss of office during the year.
Statement of Voting on the Remuneration Report at the 2014 AGM
For AgainstNumber of
abstentions
Directors' Remuneration Policy 92.5% 7.5% 5,247,011
Statement of Voting on the Remuneration Report at the 2015 AGM
For AgainstNumber of
abstentions
Annual Report on Remuneration 93.2% 6.8% 8,414,009
The primary reasons cited for the votes against and actions taken in response are as follows:
Reason Action taken by the Committee
Adjusted EPS targets in the LTIP not challenging enough against analyst forecasts
The EPS targets were reviewed this year and not adjusted, as outlined above. The Committee believes these targets are challenging and align with the company’s long-term strategic objectives.Analyst forecasts frequently assume a continuation of the current strong performance, and while they are used as a point of reference, they are not an appropriate measure to be used in isolation.
Level of disclosure on annual bonus determination
We have improved the level of disclosure about the determination of annual bonuses. Please see pages 71 to 75.
EDs’ Shareholding and Share Interests (Audited)The interests of the directors in the ordinary shares of the company at 31 July 2016 are set out below:
Name
Shareholding
requirement at 31 July
20161
Number of shares
owned outright2
2016
Outstanding share
awards not subject to performance conditions3
Outstanding share awards subject to
performance conditions4 Outstanding options5
2016 2015 2016 2015 2016 2015
Preben Prebensen 85,715 740,947 173,521 202,683 446,337 540,919 1,745 1,745Stephen Hodges 76,985 816,747 168,769 176,909 386,028 407,323 — —Jonathan Howell 64,762 200,577 125,752 115,276 339,234 347,403 — —Elizabeth Lee 29,167 65,292 35,946 33,273 156,622 150,992 1,745 1,745
1 Based on the closing mid-market share price of 1,260p on 31 July 2016.2 This includes shares owned outright by closely associated persons.3 This includes DSA and SMP Invested Shares.4 This includes LTIP awards and Matched SMP Shares.5 This comprises SAYE options.

Close Brothers Group plc Annual Report 2016S
trategicR
eportG
overnanceFinancial
Statem
ents79
No EDs held shares that were vested but unexercised at 31 July 2016. There were no changes in notifiable interests between 31 July 2016 and 16 September 2016, other than the purchases by Preben Prebensen and Elizabeth Lee within the SIP which increased their shareholdings to 740,969 shares and 65,422 shares respectively.
Details of EDs’ Share Exercises During the Year (Audited)
Name Award typeHeld at
1 August Called1 Lapsed
Market price on award
p
Market price on calling
p
Total value on calling1
£
Dividends paid on
vested shares£
Preben Prebensen 2013 DSA 28,549 14,252 — 1,168.2 1,546.7 220,433 15,2812014 DSA 35,890 23,926 — 1,429.4 1,546.7 370,058 13,4252012 LTIP 113,150 110,129 3,021 839.6 1,546.7 1,703,342 170,0882012 SMP – Invested 59,553 59,553 — 839.6 1,546.7 921,094 91,9762012 SMP – Matched 119,106 115,926 3,180 839.6 1,546.7 1,793,003 179,041
Stephen Hodges 2013 DSA 49,675 24,799 — 1,168.2 1,546.7 383,561 26,5902014 DSA 32,322 21,547 — 1,429.4 1,546.7 333,263 12,0902012 LTIP 91,949 89,494 2,455 839.6 1,546.7 1,384,185 138,2192012 SMP – Invested 24,069 24,069 — 839.6 1,546.7 372,270 37,1732012 SMP – Matched 48,138 46,853 1,285 839.6 1,546.7 724,666 72,362
Jonathan Howell 2013 DSA 19,414 9,691 — 1,168.2 1,531.5 148,418 10,3912014 DSA 24,137 17,140 — 1,429.4 1,531.5 262,499 9,6172012 LTIP 88,138 85,785 2,353 839.6 1,479.5 1,269,146 166,3282012 SMP – Invested 11,911 11,911 — 839.6 1,479.5 176,217 23,0942012 SMP – Matched 23,822 23,186 636 839.6 1,479.5 343,025 44,955
Elizabeth Lee 2012 LTIP 37,221 36,228 993 839.6 1,546.7 560,331 55,9522012 SMP – Invested 10,720 10,720 — 839.6 1,546.7 165,804 16,5562012 SMP – Matched 10,720 10,434 286 839.6 1,546.7 161,380 16,115
1 These are the actual number of shares and values realised on calling and may not sum due to rounding.
Notes to the details of EDs’ share exercises during the yearThe DSA is a mandatory deferral of a portion of the annual bonus.
The DSA, LTIP and SMP consist of the right for EDs to call for shares in the company from the employee benefit trust or Treasury Shares, at nil cost, together with a cash amount representing accrued notional dividends thereon. The DSA, LTIP and SMP awards may be forfeited if the ED leaves employment in certain circumstances preceding the vesting date. They may be called for at any time up to 12 months from the date of vesting. The value of the awards is charged to the group’s income statement in the year to which the award relates for the DSA and Invested SMP Shares, and spread over the vesting period for the LTIP and Matched SMP Share awards.
The LTIP awards are held under the 2009 LTIP and are subject to the performance criteria described in the remuneration policy on page 65. The Matched SMP Shares are subject to the same performance criteria.
Details of EDs’ Option Exercises During the Year (Audited)No EDs exercised options during the 2016 financial year.
Single Total Figure of Remuneration for Non-executive Directors (Audited)Fees1 and benefits2 total
Name2016
£’00020153
£’000
Oliver Corbett 100 95Geoffrey Howe4 95 83Lesley Jones 103 96Bridget Macaskill5 107 99Strone Macpherson 220 210
1 Non-executive director fees were increased with effect from 1 August 2015.2 Benefits include taxable travel related expenses in respect of attendance at board meetings. Amounts disclosed have been grossed up using the appropriate
tax rate. 3 Prior year fees have been restated to include taxable travel related expenses which are grossed up using the appropriate rate. 4 Geoffrey Howe was appointed senior independent director on 20 November 2014.5 Bridget Macaskill was appointed chairman of the Remuneration Committee in November 2014.

Close Brothers Group plc Annual Report 201680
Report of the Board on Directors’ Remuneration continuedNotes to the single total figure of remuneration for non-executive directorsThe fees payable to non-executive directors for the 2016 and 2017 financial years are as follows:
Role 2017 2016
Chairman1 £220,000 £220,000Non-executive director £65,000 £65,000Supplements Senior independent director £15,000 £15,000Chairman of Audit Committee £25,000 £25,000Chairman of Remuneration Committee £25,000 £25,000Chairman of Risk Committee £25,000 £25,000Committee membership2 £5,000 £5,000
1 The chairman receives no other fees for chairmanship or membership of board committees.2 No fees are payable to the chairman, or for membership, of the Nomination and Governance Committee.
Non-executive Directors’ Share Interests (Audited)The interests of the directors in the ordinary shares of the company are set out below:
Name
Shares held beneficially at
31 July 2016
Shares held beneficially at
31 July 2015
Oliver Corbett — —Geoffrey Howe 5,000 5,000Lesley Jones — —Bridget Macaskill 2,500 2,500Strone Macpherson 13,300 13,300
There were no changes in notifiable interests between 31 July 2016 and 12 September 2016.
AdviceDuring the year under review and up to the date of this report, the Committee consulted and took advice from the following advisers and executives:• PwC;• Chairman of the board;• Chief executive;• Group head of human resources;• Head of reward and HR operations; • Group chief risk officer; and• Company secretary.
Where the Committee seeks advice from employees this never relates to their own remuneration.
PwC also provided consultancy services to the group during the financial year and were originally engaged to advise on remuneration in 2008. PwC are a member of, and adhere to, the Remuneration Consultants Group Voluntary Code of Conduct. PwC were paid £69,420 in fees for remuneration services related to the 2016 financial year. The Committee has satisfied themselves that the advice received from all parties named above was objective and independent.

Close Brothers Group plc Annual Report 2016S
trategicR
eportG
overnanceFinancial
Statem
ents81
Statement of Implementation of Remuneration Policy in the Following Financial YearSalaryThe Committee determines the appropriate level of salary with reference to the EDs' role and experience, increases for the broader population and external factors. However, due to cost discipline measures within the group during the year, the Committee determined that it was appropriate not to award salary increases to the EDs for the following financial year. The average salary increase awarded to employees across the group was 2.6%.
BenefitsThe EDs will receive benefits in line with those outlined in the Remuneration Policy table on page 63. There will be no increases to the allowances or benefits, other than any potential increase in the cost of providing them.
Annual bonusThe annual bonuses will be subject to the caps and determined based on assessment against the performance measures outlined in the Remuneration Policy table on page 64. Because of commercial sensitivity, the details of the performance targets and achievement against those will be outlined in the 2017 Annual Report on Remuneration.
Performance awardsThe LTIP awards will be subject to the caps and determined in line with the objectives outlined in the Remuneration Policy table. The performance measures will be in line with those outlined in the Remuneration Policy table on page 65. Because of commercial sensitivity, the details of the achievement against performance targets will be outlined in the 2017 Annual Report on Remuneration.
PensionThe EDs will continue to receive a cash allowance in lieu of a pension equivalent to 22.5% of base salary.
This report was approved by the board of directors on 27 September 2016 and signed on its behalf by:
Bridget MacaskillChairman of the Remuneration Committee

Close Brothers Group plc Annual Report 201682
Financial Statements84 Independent Auditor’s Report to the
Members of Close Brothers Group plc87 Consolidated Income Statement88 Consolidated Statement of Comprehensive Income89 Consolidated Balance Sheet90 Consolidated Statement of Changes in Equity91 Consolidated Cash Flow Statement92 Company Balance Sheet93 Company Statement of Changes in Equity94 The Notes135 Glossary136 Investor Relations136 Cautionary Statement
Photographed on location at Cosworth Ltd.

Close Brothers Group plc Annual Report 2016S
trategicR
eportG
overnanceFinancial
Statem
ents83

Close Brothers Group plc Annual Report 201684
Opinion on Financial Statements of Close Brothers Group plcIn our opinion:• The financial statements give a true and fair view of the
state of the group’s and of the parent company’s affairs as at 31 July 2016 and of the group’s profit for the year then ended;
• The group financial statements have been properly prepared in accordance with International Financial Reporting Standards (“IFRSs”) as adopted by the European Union;
• The parent company financial statements have been properly prepared in accordance with United Kingdom Generally Accepted Accounting Practice, including FRS 102 “The Financial Reporting Standard applicable in the UK and Republic of Ireland”; and
• The financial statements have been prepared in accordance with the requirements of the Companies Act 2006 and, as regards the group financial statements, Article 4 of the International Accounting Standards (“IAS”) Regulation.
The financial statements comprise the Consolidated Income Statement, the Consolidated Statement of Comprehensive Income, the Consolidated Balance Sheet, the Consolidated Statement of Changes in Equity, the Consolidated Cash Flow Statement, the Company Balance Sheet, the Company Statement of Changes in Equity and the related notes 1 to 31. The financial reporting framework that has been applied in the preparation of the group financial statements is applicable law and IFRSs as adopted by the European Union. The financial reporting framework that has been applied in the preparation of the parent company financial statements is applicable law and United Kingdom Accounting Standards (United Kingdom Generally Accepted Accounting Practice), including FRS 102 “The Financial Reporting Standard applicable in the UK and Republic of Ireland”.
Going concern and the directors’ assessment of the principal risks that would threaten the solvency or liquidity of the groupAs required by the Listing Rules we have reviewed the directors’ statement regarding the appropriateness of the going concern basis of accounting contained within note 1(c) to the financial statements and the directors’ statement on the longer-term viability of the group contained within the Directors’ Report.
Independent Auditor’s Report to the Members of Close Brothers Group plc
We have nothing material to add or draw attention to in relation to:• The directors’ confirmation on page 51 that they have
carried out a robust assessment of the principal risks facing the group, including those that would threaten its business model, future performance, solvency or liquidity;
• The disclosures on pages 28 to 31 that describe those risks and explain how they are being managed or mitigated;
• The directors’ statement in note 1(c) to the financial statements about whether they considered it appropriate to adopt the going concern basis of accounting in preparing them and their identification of any material uncertainties to the group’s ability to continue to do so over a period of at least 12 months from the date of approval of the financial statements;
• The directors’ explanation on page 46 as to how they have assessed the prospects of the group, over what period they have done so and why they consider that period to be appropriate, and their statement as to whether they have a reasonable expectation that the group will be able to continue in operation and meet its liabilities as they fall due over the period of their assessment, including any related disclosures drawing attention to any necessary qualifications or assumptions.
We agreed with the directors’ adoption of the going concern basis of accounting and we did not identify any such material uncertainties. However, because not all future events or conditions can be predicted, this statement is not a guarantee as to the group’s ability to continue as a going concern.
IndependenceWe are required to comply with the Financial Reporting Council’s Ethical Standards for Auditors and we confirm that we are independent of the group and we have fulfilled our other ethical responsibilities in accordance with those standards. We also confirm we have not provided any of the prohibited non-audit services referred to in those standards.
Our assessment of risks of material misstatementThe assessed risks of material misstatement described below are those that had the greatest effect on our audit strategy, the allocation of resources in the audit and directing the efforts of the engagement team:
Risk How the scope of our audit responded to the risk
Loan impairment provisionsAs detailed in note 2, critical accounting estimates and judgements on page 99, loan impairment provisions in the Banking division reflect estimates of the amount and timing of future recoveries which require an assessment of matters such as future economic conditions and the value of collateral. Loan impairment provisions of £59.7 million represented approximately 1% of loans and advances to customers. The income statement charge for the year was £37.9 million.
Our procedures included understanding and testing the controls in respect of the group’s loan impairment process such as the timely recognition of impairment provisions, the completeness and accuracy of reports used in the loan impairment process and management review processes over the calculation of collective and specific provisions. We tested the inputs used in collective impairment models and considered whether those inputs reflected default and recovery experience across each of the Banking division’s portfolios appropriately adjusted to reflect current experience and economic conditions where relevant.
We audited a sample of specific provisions against individually significant impaired loans including challenging collateral values and discount rates assumed in the provisions and, where relevant, with the assistance of our property valuation specialists.
Close Brothers Group plc Annual Report 2016S
trategicR
eportG
overnanceFinancial
Statem
ents85
Last year our report included a risk relating to gains less losses arising from dealing in securities. This risk has not been included this year as the revenue recognition does not involve significant management judgement and is dependent on control processes where there is a history of few errors being identified.
Management’s consideration of these risks is set out in note 2, critical accounting estimates and judgements, on page 99. The Audit Committee’s consideration of these risks is set out on page 56.
These matters were addressed in the context of our audit of the financial statements as a whole, and in forming our opinion thereon, and we do not provide a separate opinion on these matters.
Our application of materialityWe define materiality as the magnitude of misstatement in the financial statements that makes it probable that the economic decisions of a reasonably knowledgeable person would be changed or influenced. We use materiality both in planning the scope of our audit work and in evaluating the results of our work.
We determined materiality for the group financial statements as a whole to be £11.0 million (2015: £11.0 million) based on 5% (2015: 5%) of operating profit before tax.
Operating profit before tax was used as the basis for determining materiality as we believe this is the key metric used by members of the company in assessing financial performance.
We agreed with the Audit Committee that we would report all audit differences in excess of £220,000 (2015: £200,000), as well as differences below that threshold that, in our view, warranted reporting on qualitative grounds. We also report to the Audit Committee on disclosure matters that we identified when assessing the overall presentation of the financial statements.
Risk How the scope of our audit responded to the risk
Revenue recognition Interest income and fee and commission income is detailed in note 4 on page 102 and note 2 critical accounting estimates and judgements on page 99. The group’s revenue recognition policy is detailed in note 1(h), significant accounting policies on page 95.• Interest income
Interest income on loans and advances made by the group is recognised using the effective interest rate method and any fees and direct transaction costs that form an integral part of the yield are included in the effective interest rate. The identification of applicable fees and direct costs to be included in the effective interest rate can be judgemental. The group’s net interest income was £422.6 million.
• Fee and commission incomeThis primarily arises in the Banking and Asset Management divisions. The group’s fee and commission income was £189.2 million.
The timing of recognition of fees can be judgemental as fees may be recognised immediately or over a period depending on the nature of the service provided and determining accrued fees can involve the use of estimates.
We audited the effective interest rate models by testing controls, challenging the assumptions used to estimate the effective interest rates used in determining interest income and re-performing a sample of effective interest rate calculations. This included involving our computer audit specialists to test the extraction of data used in the calculations. We audited a sample of lending arrangements by agreeing them to loan agreements and cash receipts to assess whether the appropriate fees and costs had been reflected in the effective interest rate.
We tested controls over revenue recognition in the Banking division. We audited a sample of lending fees receivable by agreeing them to loan agreements and cash receipts and we assessed the accounting treatment and timing of recognition of the fee.
We obtained a sample of Asset Management client agreements and checked that the fees had been calculated in accordance with the agreements and recognised appropriately. We tested a sample of accrued fees by reference to final assets under management determined post year end and challenged related estimates.
Goodwill As detailed in note 2, critical accounting estimates and judgements on page 99, the directors assess the carrying value of goodwill for impairment on an annual basis and when there are indicators of impairment. The carrying value of goodwill was £85.9 million.
Determining whether goodwill is impaired requires estimation of the recoverable amount of the group’s cash generating units (“CGUs”). The recoverable amount is determined using forecast future cash flows and growth rates discounted at a rate appropriate to the relevant business and hence involve a number of assumptions and estimates.
We challenged management’s assumptions used in the impairment model for goodwill. This included challenging cash flow forecasts by considering the accuracy of past cash flow projections. Using our internal valuations specialists to independently derive discount rates, we assessed the appropriateness of those used by management. We also benchmarked discount and growth rates to available external peer group data.
We performed sensitivity analysis and considered the impact of changes to each of the key assumptions used in management’s impairment model.

Close Brothers Group plc Annual Report 201686
Independent Auditor’s Report to the Members of Close Brothers Group plc continuedAn overview of the scope of our auditOur group audit scope focused on each of the divisions of the group, all of which comprise subsidiaries which are subject to full scope audits for the year ended 31 July 2016. Our audits of each subsidiary were planned using levels of materiality appropriate for each subsidiary on a standalone basis, up to a maximum of £9.9 million (2015: £8.3 million). Together with the group’s and the Banking central functions, which were also subject to a full scope audit, our audit scope covered the entire group.
The group audit team works closely with the divisional and subsidiary audit teams throughout the audit and the senior statutory auditor met with divisional senior management during the year.
Opinion on other matters prescribed by the Companies Act 2006In our opinion:• The part of the Report of the Board on Directors’
Remuneration to be audited has been properly prepared in accordance with the Companies Act 2006; and
• The information given in the Strategic Report and the Directors’ Report for the financial year for which the financial statements are prepared is consistent with the financial statements.
Matters on which we are required to report by exceptionAdequacy of explanations received and accounting recordsUnder the Companies Act 2006 we are required to report to you if, in our opinion:• We have not received all the information and explanations
we require for our audit; or• Adequate accounting records have not been kept by the
parent company, or returns adequate for our audit have not been received from branches not visited by us; or
• The parent company financial statements are not in agreement with the accounting records and returns.
We have nothing to report in respect of these matters.
Directors’ remunerationUnder the Companies Act 2006 we are also required to report if in our opinion certain disclosures of directors’ remuneration have not been made or the part of the Report of the Board on Directors’ Remuneration to be audited is not in agreement with the accounting records and returns. We have nothing to report arising from these matters.
Corporate Governance StatementUnder the Listing Rules we are also required to review the part of the Corporate Governance Statement relating to the company’s compliance with 10 provisions of the UK Corporate Governance Code. We have nothing to report arising from our review.
Our duty to read other information in the Annual ReportUnder International Standards on Auditing (UK and Ireland), we are required to report to you if, in our opinion, information in the Annual Report is:• Materially inconsistent with the information in the audited
financial statements; or• Apparently materially incorrect based on, or materially
inconsistent with, our knowledge of the group acquired in the course of performing our audit; or
• Otherwise misleading.
In particular, we are required to consider whether we have identified any inconsistencies between our knowledge acquired during the audit and the directors’ statement that they consider the Annual Report is fair, balanced and understandable and whether the Annual Report appropriately discloses those matters that we communicated to the Audit Committee which we consider should have been disclosed. We confirm that we have not identified any such inconsistencies or misleading statements.
Respective responsibilities of directors and auditorAs explained more fully in the Statement of Directors’ Responsibilities, the directors are responsible for the preparation of the financial statements and for being satisfied that they give a true and fair view. Our responsibility is to audit and express an opinion on the financial statements in accordance with applicable law and International Standards on Auditing (UK and Ireland). We also comply with International Standard on Quality Control 1 (UK and Ireland). Our audit methodology and tools aim to ensure that our quality control procedures are effective, understood and applied. Our quality controls and systems include our dedicated professional standards review team and independent partner reviews.
This report is made solely to the company’s members, as a body, in accordance with Chapter 3 of Part 16 of the Companies Act 2006. Our audit work has been undertaken so that we might state to the company’s members those matters we are required to state to them in an auditor’s report and for no other purpose. To the fullest extent permitted by law, we do not accept or assume responsibility to anyone other than the company and the company’s members as a body, for our audit work, for this report, or for the opinions we have formed.
Scope of the audit of the financial statementsAn audit involves obtaining evidence about the amounts and disclosures in the financial statements sufficient to give reasonable assurance that the financial statements are free from material misstatement, whether caused by fraud or error. This includes an assessment of: whether the accounting policies are appropriate to the group and the parent company’s circumstances and have been consistently applied and adequately disclosed; the reasonableness of significant accounting estimates made by the directors; and the overall presentation of the financial statements. In addition, we read all the financial and non-financial information in the Annual Report to identify material inconsistencies with the audited financial statements and to identify any information that is apparently materially incorrect based on, or materially inconsistent with, the knowledge acquired by us in the course of performing the audit. If we become aware of any apparent material misstatements or inconsistencies we consider the implications for our report.
Robert Topley (Senior statutory auditor)For and on behalf of Deloitte LLPChartered Accountants and Statutory AuditorLondon, United Kingdom
27 September 2016
An audit does not provide assurance on the maintenance and integrity of the website, including controls used to achieve this, and in particular on whether any changes
may have occurred to the financial statements since first published. These matters are the responsibility of the directors but no control procedures can provide absolute
assurance in this area. Legislation in the United Kingdom governing the preparation and dissemination of financial statements differs from legislation in other jurisdictions.

Close Brothers Group plc Annual Report 2016S
trategicR
eportG
overnanceFinancial
Statem
ents87
Consolidated Income Statementfor the year ended 31 July 2016
Note2016
£ million20151
£ million
Interest income 4 550.1 528.8Interest expense 4 (127.5) (132.3)
Net interest income 422.6 396.5
Fee and commission income 4 189.2 195.7Fee and commission expense 4 (28.5) (30.2)Gains less losses arising from dealing in securities 67.9 72.0Other income 55.8 55.5Depreciation of operating lease assets (19.6) (16.7)
Non-interest income 264.8 276.3
Operating income 687.4 672.8
Administrative expenses 4 (415.9) (406.0)Impairment losses on loans and advances 11 (37.9) (41.9)Total operating expenses before amortisation of intangible assets on acquisition (453.8) (447.9)Operating profit before amortisation of intangible assets on acquisition 233.6 224.9Amortisation of intangible assets on acquisition 15 (5.1) (5.0)
Operating profit before tax 228.5 219.9Tax 6 (42.2) (45.4)
Profit after tax from continuing operations 186.3 174.5Profit from discontinued operations, net of tax 7 – 11.2Profit after tax 186.3 185.7Profit attributable to non-controlling interests from continuing operations (0.2) –
Profit attributable to shareholders 186.5 185.7
From continuing operationsBasic earnings per share 8 125.7p 117.8pDiluted earnings per share 8 124.3p 116.5p
From continuing and discontinued operationsBasic earnings per share 8 125.7p 125.4pDiluted earnings per share 8 124.3p 124.0p
Interim dividend per share paid 9 19.0p 18.0pFinal dividend per share 9 38.0p 35.5p
1 Re-presented – see note 1(d).

Close Brothers Group plc Annual Report 201688
Consolidated Statement of Comprehensive Incomefor the year ended 31 July 2016
2016 £ million
2015£ million
Profit after tax 186.3 185.7
Other comprehensive income/(expense) that may be reclassified to income statement from continuing operations
Currency translation gains/(losses) 3.2 (3.0)Losses on cash flow hedging (6.1) (5.5)Gains/(losses) on equity shares classified as available for sale 0.2 (0.5)Available for sale investment gains transferred to income statement on disposal (4.2) (6.8)Tax relating to items that may be reclassified 0.9 2.5
(6.0) (13.3)
Other comprehensive (expense)/income that will not be reclassified to income statement from continuing operations
Defined benefit pension scheme losses (1.9) (2.0)Tax relating to items that will not be reclassified 0.3 0.4
(1.6) (1.6)
Other comprehensive expense, net of tax from continuing operations (7.6) (14.9)Other comprehensive expense, net of tax from discontinued operations – (1.2)
Total comprehensive income 178.7 169.6
Attributable toNon-controlling interests (0.2) –Shareholders 178.9 169.6
178.7 169.6

Close Brothers Group plc Annual Report 2016S
trategicR
eportG
overnanceFinancial
Statem
ents89
Note2016
£ million2015
£ million
AssetsCash and balances at central banks 847.4 1,038.0Settlement balances 478.1 398.3Loans and advances to banks 10 121.5 84.6Loans and advances to customers 11 6,431.6 5,737.8Debt securities 12 221.3 149.5Equity shares 13 28.2 41.2Loans to money brokers against stock advanced 52.4 38.4Derivative financial instruments 14 44.7 19.7Intangible assets 15 147.9 144.2Property, plant and equipment 16 185.8 148.4Deferred tax assets 6 55.2 39.4Prepayments, accrued income and other assets 17 134.1 117.8
Total assets 8,748.2 7,957.3
LiabilitiesSettlement balances and short positions 18 475.6 404.3Deposits by banks 19 71.1 35.1Deposits by customers 19 4,894.6 4,481.4Loans and overdrafts from banks 19 469.1 381.2Debt securities in issue 19 1,422.8 1,365.0Loans from money brokers against stock advanced 30.0 –Derivative financial instruments 14 16.3 7.1Current tax liabilities 20.0 17.9Accruals, deferred income and other liabilities 17 205.4 209.0Subordinated loan capital 20 46.4 46.4
Total liabilities 7,651.3 6,947.4
EquityCalled up share capital 21 37.7 37.7Share premium account 284.0 284.0Retained earnings 797.5 694.4Other reserves (22.1) (6.3)
Total shareholders’ equity 1,097.1 1,009.8
Non-controlling interests (0.2) 0.1
Total equity 1,096.9 1,009.9
Total liabilities and equity 8,748.2 7,957.3
Approved and authorised for issue by the Board of Directors on 27 September 2016 and signed on its behalf by:
P.S.S. Macpherson P. PrebensenChairman Chief Executive
Registered number: 520241
Consolidated Balance Sheetat 31 July 2016

Close Brothers Group plc Annual Report 201690
Other reserves
Called up share capital
£ million
Share premium account £ million
Retained earnings £ million
Available for sale
movements reserve
£ million
Share- based
payments reserve
£ million
Exchange movements
reserve £ million
Cash flow hedging reserve
£ million
Total attributable
to equity holders £ million
Non- controlling
interests £ million
Total equity
£ million
At 1 August 2014 37.7 283.8 589.8 9.6 (7.5) 1.0 2.1 916.5 1.1 917.6
Profit for the year – – 185.7 – – – – 185.7 – 185.7Other comprehensive
(expense)/income – – (1.6) (6.3) – (3.8) (4.4) (16.1) – (16.1)Total comprehensive
income/(expense) for the year – – 184.1 (6.3) – (3.8) (4.4) 169.6 – 169.6
Exercise of options – 0.1 – – – – – 0.1 – 0.1Dividends paid – – (74.3) – – – – (74.3) (0.1) (74.4)Shares purchased – – – – (18.2) – – (18.2) – (18.2)Shares issued – 0.1 – – – – – 0.1 – 0.1Shares released – – – – 20.5 – – 20.5 – 20.5Other movements – – (8.3) – 0.7 – – (7.6) (0.9) (8.5)Income tax – – 3.1 – – – – 3.1 – 3.1
At 31 July 2015 37.7 284.0 694.4 3.3 (4.5) (2.8) (2.3) 1,009.8 0.1 1,009.9
Profit for the year – – 186.5 – – – – 186.5 (0.2) 186.3Other comprehensive
(expense)/income – – (1.6) (3.3) – 1.7 (4.4) (7.6) – (7.6)Total comprehensive
income/(expense) for the year – – 184.9 (3.3) – 1.7 (4.4) 178.9 (0.2) 178.7
Exercise of options – – – – – – – – – –Dividends paid – – (80.3) – – – – (80.3) – (80.3)Shares purchased – – – – (24.4) – – (24.4) – (24.4)Shares issued – – – – – – – – – –Shares released – – – – 12.8 – – 12.8 – 12.8Other movements – – (2.5) – 1.8 – – (0.7) (0.1) (0.8)Income tax – – 1.0 – – – – 1.0 – 1.0
At 31 July 2016 37.7 284.0 797.5 – (14.3) (1.1) (6.7) 1,097.1 (0.2) 1,096.9
Consolidated Statement of Changes in Equityfor the year ended 31 July 2016

Close Brothers Group plc Annual Report 2016S
trategicR
eportG
overnanceFinancial
Statem
ents91
Note2016
£ million2015
£ million
Net cash outflow from operating activities 27(a) (18.8) (18.0)
Net cash (outflow)/inflow from investing activitiesPurchase of:Property, plant and equipment (13.6) (14.8)Intangible assets – software (21.7) (19.1)Subsidiaries and non-controlling interest 27(b) (3.6) (1.0)Sale of:Property, plant and equipment 0.1 0.1Equity shares held for investment 7.6 5.6Subsidiary 27(c) 2.3 23.2
(28.9) (6.0)
Net cash outflow before financing activities (47.7) (24.0)
Financing activitiesIssue of ordinary share capital, net of transaction costs 27(d) – 0.1Purchase of own shares for employee share award schemes (24.4) (18.2)Equity dividends paid (80.3) (74.2)Dividends paid to non-controlling interests – (0.1)Interest paid on subordinated loan capital and debt financing (28.0) (18.6)
Net decrease in cash (180.4) (135.0)Cash and cash equivalents at beginning of year 1,103.7 1,238.7
Cash and cash equivalents at end of year 27(e) 923.3 1,103.7
Consolidated Cash Flow Statementfor the year ended 31 July 2016

Close Brothers Group plc Annual Report 201692
Company Balance Sheetat 31 July 2016
Note2016
£ million2015
£ million
Fixed assetsIntangible assets 15 – 0.1Property, plant and equipment 16 – 0.5Investments in subsidiaries 31 287.0 287.0
287.0 287.6
Current assetsCash at bank 0.2 0.3Amounts owed by subsidiaries 559.8 551.4Other investments 1.7 2.2Corporation tax receivable 6.3 5.1Deferred tax assets 6 3.5 3.3Other debtors 2.6 5.0
574.1 567.3Creditors: Amounts falling due within one yearDebt securities in issue 19 205.9 –Accruals 8.3 8.4Provisions 17 7.0 9.7Other creditors 1.0 1.1
222.2 19.2
Net current assets 351.9 548.1
Total assets less current liabilities 638.9 835.7Creditors: Amounts falling due after more than one year:Debt securities in issue 19 – 205.6
Net assets 638.9 630.1
Capital and reservesShare capital 21 37.7 37.7Share premium account 284.0 284.0Profit and loss account 331.4 309.8Other reserves (14.2) (1.4)
Shareholders’ funds 638.9 630.1
Approved and authorised for issue by the Board of Directors on 27 September 2016 and signed on its behalf by:
P.S.S. Macpherson P. PrebensenChairman Chief Executive

Close Brothers Group plc Annual Report 2016S
trategicR
eportG
overnanceFinancial
Statem
ents93
Other reserves
Share capital
£ million
Share premium account £ million
Profit and loss account £ million
Available for sale
movements reserve
£ million
Share- based
payments reserve
£ million
Exchange movements
reserve £ million
Shareholders’ funds
£ million
At 1 August 2014 37.7 283.8 313.3 0.4 (7.5) – 627.7
Profit for the year – – 79.9 – – – 79.9Other comprehensive (expense)/income – – (1.6) (0.4) – 3.1 1.1Total comprehensive income/(expense) for the year – – 78.3 (0.4) – 3.1 81.0Exercise of options – 0.1 – – – – 0.1Dividends paid – – (74.3) – – – (74.3)Shares purchased – – – – (18.2) – (18.2)Shares issued – 0.1 – – – – 0.1Shares released – – – – 20.5 – 20.5Other movements – – (7.5) – 0.7 – (6.8)
At 31 July 2015 37.7 284.0 309.8 – (4.5) 3.1 630.1
Profit for the year – – 106.2 – – – 106.2Other comprehensive expense – – (1.6) – – (3.0) (4.6)Total comprehensive income/(expense) for the year – – 104.6 – – (3.0) 101.6Exercise of options – – – – – – –Dividends paid – – (80.3) – – – (80.3)Shares purchased – – – – (24.4) – (24.4)Shares issued – – – – – – –Shares released – – – – 12.8 – 12.8Other movements – – (2.7) – 1.8 – (0.9)
At 31 July 2016 37.7 284.0 331.4 – (14.3) 0.1 638.9
Company Statement of Changes in Equityfor the year ended 31 July 2016

Close Brothers Group plc Annual Report 201694
The Notes continuedThe Notes
1. Significant accounting policies(a) Reporting entityClose Brothers Group plc (“the company”), a public limited company incorporated and domiciled in the UK, together with its subsidiaries (collectively, “the group”), operates through three divisions: Banking, Securities and Asset Management, and is primarily located within the UK.
The company financial statements (“the company accounts”) have been prepared in compliance with United Kingdom Accounting Standards, including Financial Reporting Standard 102 ‘‘The Financial Reporting Standard applicable in the United Kingdom and the Republic of Ireland’’ (‘‘FRS 102’’) and the Companies Act 2006, under the provision of the Large and Medium-sized Companies and Groups (Accounts and Reports) Regulations 2008 (SI 2008/410). This is the first year the company has presented its results under FRS 102. The date of transition to FRS 102 was 1 August 2014. Details of the transition to FRS 102 are disclosed in note 29. The company has taken advantage of the exemption in Section 408 of the Companies Act 2006 not to present its company income statement and related notes.
(b) Compliance with International Financial Reporting StandardsThe consolidated financial statements (“the consolidated accounts”) have been prepared and approved by the directors in accordance with all relevant IFRSs as issued by the International Accounting Standards Board, and interpretations issued by the IFRS Interpretations Committee, endorsed by the EU.
Standards adopted during the yearThere were no new standards adopted during the year ended 31 July 2016. The accounting policies adopted are consistent with those of the previous financial year.
Standards issued with effective dates, subject to EU endorsement, which do not impact on these financial statements.IFRS 9 “Financial instruments”IFRS 9 will replace IAS 39 and is effective for the group on 1 August 2018. IFRS 9, in particular the impairment requirements, will lead to significant changes in the accounting for financial instruments and work is ongoing within the group to quantify the financial impact.
Impairment IFRS 9 introduces a revised three-stage impairment model which will recognise expected credit losses based on unbiased forward-looking information, replacing the existing incurred loss models. The standard requires the recognition of lifetime expected credit losses when the credit risk of a financial instrument has increased significantly since initial recognition. Where a significant increase in credit risk has not occurred, 12 month expected credit losses are recognised.
Classification and measurementIFRS 9 will require financial assets to be classified on the basis of the business model for managing financial assets and the objectives of the contractual cash flow characteristics of the instruments. This assessment determines how the financial asset should then be measured.
Hedge accountingIFRS 9 contains revised requirements which aim to simplify hedge accounting. The standard does not address macro hedge accounting strategies, which are being considered in a separate project. Until such time as that project is complete, IFRS 9 includes an accounting policy choice to remain with IAS 39 hedge accounting. The group expects to exercise the accounting policy choice to continue IAS 39 hedge accounting.
IFRS 15 “Revenue from contracts with customers”Effective for the group from 1 August 2018, this standard replaces IAS 18 and IAS 11 and does not apply to financial instruments, lease contracts or insurance contracts which fall under the scope of other IFRSs. The standard introduces a new revenue recognition model which features a contract-based five-step analysis of transactions to determine whether, how much, and when revenue is recognised. The standard is not anticipated to have a material impact on the group.
IFRS 16 “Leases”Effective for the group from 1 August 2019, the standard replaces IAS 17 and introduces a new recognition model that recognises all leases on a lessee’s balance sheet (subject to certain exemptions). Lessor accounting is largely unchanged. The standard is not anticipated to have a material impact on the group.
(c) Basis of preparationThe consolidated and company accounts have been prepared under the historical cost convention, except for the revaluation of financial assets and liabilities held at fair value through profit or loss, available for sale financial assets and all derivative financial instruments (“derivatives”).
The financial statements are prepared on a going concern basis as disclosed in the Report of the Directors.
(d) Re-presentation of consolidated income statementAs announced on 13 September 2016, following a review of our financial reporting, we have implemented minor changes to the calculation of key metrics in the Banking division to better represent the contribution of operating lease assets and the role of Treasury. This has resulted in depreciation of operating lease assets, previously included in administrative expenses, to be reported as a cost of sales and included in operating income in the consolidated income statement.
To enable comparisons and in line with the treatment adopted for the 2016 consolidated income statement, the 2015 comparative information has also been re-presented. This has resulted in non-interest income and operating income to decrease by £16.7 million with a corresponding decrease in administrative expenses and total operating expenses before amortisation of intangible assets on acquisition.
There has been no impact on profit attributable to shareholders or equity.

Close Brothers Group plc Annual Report 2016S
trategicR
eportG
overnanceFinancial
Statem
ents95
The effective interest rate method applies a rate that discounts estimated future cash payments or receipts relating to a financial instrument to its net carrying amount. The cash flows take into account all contractual terms of the financial instrument including transaction costs and all other premiums or discounts but not future credit losses.
Fees and commissionsWhere fees that have not been included within the effective interest rate method are earned on the execution of a significant act, such as fees arising from negotiating or arranging a transaction for a third party, they are recognised as revenue when that act has been completed. Fees and corresponding expenses in respect of other services are recognised in the consolidated income statement as the right to consideration or payment accrues through performance of services. In particular, upfront commissions paid in respect of managing, as opposed to originating, fund products are initially included within “accruals and deferred income” and then recognised as revenue as the services are provided. To the extent that fees and commissions are recognised in advance of billing they are included as accrued income or expense.
DividendsDividend income is recognised when the right to receive payment is established.
Gains less losses arising from dealing in securitiesNet gains arising from both buying and selling securities and from positions held in securities, including related interest income and dividends.
(i) Exceptional itemsItems of income and expense that are material by size and/or nature and are non-recurring are classified as exceptional items on the face of the consolidated income statement. The separate reporting of these items helps give an indication of the group’s underlying performance.
(j) Financial assets and liabilities (excluding derivatives)ClassificationThe group classifies its financial assets into the following measurement categories: (i) financial assets held at fair value through profit or loss; (ii) loans and receivables; and (iii) available for sale. Financial liabilities are classified as either held at fair value through profit or loss, or at amortised cost using the effective interest method.
Management determines the classification of its financial assets and liabilities at initial recognition.
Financial assets and liabilities held at fair value through profit or lossThis category has two sub-categories: Financial assets and liabilities held for trading, and those designated at fair value through profit or loss at inception.
A financial asset or liability is classified as trading if acquired principally for the purpose of selling in the short term, which for the group relates to Winterflood, or are derivatives (not in qualifying hedge relationships).
(e) ConsolidationSubsidiariesSubsidiaries are all entities over which the group has control. The group controls an entity when it is exposed to, or has rights to variable returns from its involvement with the entity and has the ability to affect those returns through its power over the entity. Such power generally accompanies a shareholding of more than one half of the voting rights. Subsidiaries are fully consolidated from the date on which the group effectively obtains control. They are de-consolidated from the date that control ceases.
The acquisition method of accounting is used to account for the acquisition of subsidiaries. Under the acquisition method of accounting, with some limited exceptions, the assets, liabilities and contingent liabilities of a subsidiary are measured at their fair values at the date of acquisition. Any non-controlling interest is measured either at fair value or at the non-controlling interest’s proportion of the net assets acquired. Acquisition related costs are accounted for as expenses when incurred, unless directly related to the issue of debt or equity securities. Any excess of the cost of acquisition over net assets is capitalised as goodwill. All intra group balances, transactions, income and expenses are eliminated.
(f) Discontinued operationsThe results of discontinued operations are shown as a single amount on the face of the consolidated income statement comprising the post-tax profit or loss of discontinued operations and the post-tax gain or loss recognised either on measurement to fair value less costs to sell or on the disposal of the discontinued operation. A discontinued operation is a CGU or a group of CGUs that either has been disposed of, or is classified as held for sale, and represents a separate major line of business or geographical area of operations, is part of a single coordinated plan to dispose of a separate major line of business or geographical area of operations or is a subsidiary acquired exclusively with a view to resale.
(g) Foreign currency translationFor the company and those subsidiaries whose balance sheets are denominated in sterling, which is the company’s functional and presentation currency, monetary assets and liabilities denominated in foreign currencies are translated into sterling at the closing rates of exchange at the balance sheet date. Foreign currency transactions are translated into sterling at the average rates of exchange over the year and exchange differences arising are taken to the consolidated income statement.
The balance sheets of subsidiaries denominated in foreign currencies are translated into sterling at the closing rates. The income statements for these subsidiaries are translated at the average rates and exchange differences arising are taken to equity. Such exchange differences are reclassified to the consolidated income statement in the period in which the subsidiary is disposed of.
(h) Revenue recognitionInterest incomeInterest on loans and advances made by the group, and feeincome and expense and other direct costs relating to loan origination, restructuring or commitments are recognised in the consolidated income statement using the effective interest rate method.

Close Brothers Group plc Annual Report 201696
The Notes continued
Financial assets and liabilities may be designated at fair value through profit or loss when:• The designation eliminates or significantly reduces a
measurement or recognition inconsistency that would otherwise arise from measuring assets or liabilities on a different basis;
• A group of financial assets and/or liabilities is managed and its performance evaluated on a fair value basis; or
• The assets or liabilities include embedded derivatives and such derivatives are required to be recognised separately.
Financial assets and liabilities held at fair value through profit or loss are subsequently carried at fair value, with gains and losses arising from changes in fair value taken directly to the consolidated income statement.
Loans and receivablesLoans and receivables are non-derivative financial assets with fixed or determinable payments that are not quoted in an active market and it is expected that substantially all of the initial investment will be recovered, other than because of credit deterioration. Loans and receivables are subsequently carried at amortised cost using the effective interest method and recorded net of provisions for impairment losses.
Available for saleAvailable for sale assets are those non-derivative financial assets intended to be held for an indefinite period of time, which may be sold in response to liquidity requirements or changes in interest rates, exchange rates or equity prices. Available for sale financial assets are subsequently carried at fair value, with gains and losses arising from changes in fair value taken to a separate component of equity until the asset is sold, or is impaired, when the cumulative gain or loss is transferred to the consolidated income statement.
The fair values of quoted financial assets or financial liabilities in active markets are based on current prices. If the market for a financial asset or financial liability is not active, or they relate to unlisted securities, the group establishes fair value by using valuation techniques. These include the use of recent arm’s length transactions, discounted cash flow analysis, and other valuation techniques commonly used by market participants.
DerecognitionFinancial assets are derecognised when the rights to receive cash flows from the financial assets have expired or where the group has transferred substantially all risks and rewards of ownership. If substantially all the risks and rewards have been neither retained nor transferred and the group has retained control, the assets continue to be recognised to the extent of the group’s continuing involvement. Financial liabilities are derecognised when they are extinguished.
(k) Impairment of financial assetsThe group assesses at each balance sheet date whether there is any objective evidence that a financial asset or group of financial assets classified as available for sale or loans and receivables is impaired. A financial asset or group of financial assets is impaired and an impairment loss incurred if there is objective evidence that an event or events since initial recognition of the asset have adversely affected the amount or timing of future cash flows from the asset.
Financial assets at amortised costIf there is objective evidence that an impairment loss on a financial asset or group of financial assets classified as loans and receivables has been incurred, the group measures the amount of the loss as the difference between the carrying amount of the asset or group of assets and the present value of estimated future cash flows from the asset or group of assets discounted at the effective interest rate of the instrument at initial recognition. Impairment losses are assessed individually for financial assets that are individually significant and individually or collectively for assets that are not individually significant. In making collective assessment of impairment, financial assets are grouped into portfolios on the basis of similar risk characteristics.
For loans and receivables, the amount of the loss is measured as the difference between the loan’s carrying amount and the present value of estimated future cash flows, excluding future credit losses that have not been incurred, discounted at the original effective interest rate. As the loan amortises over its life, the impairment loss may amortise. All impairment losses are reviewed at least at each reporting date. If subsequently the amount of the loss decreases as a result of a new event, the relevant element of the outstanding impairment loss is reversed. Interest on impaired financial assets is recognised at the original effective interest rate applied to the carrying amount as reduced by an allowance for impairment.
For loans that are not considered individually significant, the group adopts a formulaic approach which allocates a loss rate dependent on the overdue period. Loss rates are based on the discounted expected future cash flows and are regularly benchmarked against actual outcomes to ensure they remain appropriate.
Financial assets carried at fair valueWhen a decline in the fair value of a financial asset classified as available for sale has been recognised directly in equity and there is objective evidence that the asset is impaired, the cumulative loss is removed from equity and recognised in the consolidated income statement. The loss is measured as the difference between the amortised cost of the financial asset and its current fair value. Impairment losses on available for sale equity instruments are not reversed through the consolidated income statement, but those on available for sale debt instruments are reversed, if there is an increase in fair value that is objectively related to a subsequent event.
(l) Settlement accountsSettlement balance debtors and creditors are the amounts due to and from counterparties in respect of the group’s market-making activities, and are carried at amortised cost. The balances are short term in nature, do not earn interest and are recorded at the amount receivable or payable.
(m) Loans to and from money brokers against stock advancedLoans to money brokers against stock advanced is the cash collateral provided to these institutions for stock borrowing by the group’s market-making activities, and is carried at amortised cost. Interest is paid on the stock borrowed and earned on the cash deposits advanced. The stock borrowing to which the cash deposits relate is short term in nature and is recorded at the amount receivable. Loans from money brokers against stock collateral provided is recorded at the amount payable. Interest is paid on the loans payable.
1. Significant accounting policies continued

Close Brothers Group plc Annual Report 2016S
trategicR
eportG
overnanceFinancial
Statem
ents97
(n) Finance leases, operating leases and hire purchase contractsA finance lease is a lease or hire purchase contract that transfers substantially all the risks and rewards incidental to ownership of an asset to the lessee. Finance leases are recognised as loans at an amount equal to the gross investment in the lease discounted at its implicit interest rate. Finance charges on finance leases are taken to income in proportion to the net funds invested.
Rental costs under operating leases and hire purchase contracts are charged to the consolidated income statement in equal instalments over the period of the leases. Rental income from operating leases is recognised in equal instalments over the period of the leases and included in other income in the consolidated income statement.
(o) Sale and repurchase agreements and other secured lending and borrowingsSecurities may be sold subject to a commitment to repurchase them. Such securities are retained on the consolidated balance sheet when substantially all the risks and rewards of ownership remain with the group. The transactions are treated as collateralised borrowing and the counterparty liability is included within loans and overdrafts from banks. Similar secured borrowing transactions including securities lending transactions and collateralised short-term notes are treated and presented in the same way. These secured financing transactions are initially recognised at fair value, and subsequently valued at amortised cost, using the effective interest rate method.
(p) Securitisation transactionsWhere the group securitises its own financial assets, this is achieved via the sale of these assets to special purpose entities, which in turn issues securities to investors. All financial assets continue to be held on the group’s consolidated balance sheet together with debt securities in issue recognised for the funding – see derecognition policy (j).
(q) Offsetting financial instrumentsFinancial assets and financial liabilities are offset and the net amount presented on the consolidated balance sheet if, and only if, there is a legally enforceable right to set off the recognised amounts and there is an intention to settle on a net basis, or to realise an asset and settle the liability simultaneously.
(r) Derivatives and hedge accountingIn general, derivatives are used to minimise the impact of interest, currency rate and equity price changes to the group’s financial instruments. They are carried on the consolidated balance sheet at fair value which is obtained from quoted market prices in active markets, including recent market transactions and discounted cash flow models.
On acquisition, certain derivatives are designated as a hedge and the group formally documents the relationship between these derivatives and the hedged item. The group also documents its assessment, both at hedge inception and on an ongoing basis, of whether the derivative is highly effective in offsetting changes in fair values or cash flows of hedged items. If a hedge was deemed partially ineffective but
continues to qualify for hedge accounting, the amount of the ineffectiveness, taking into account the timing of the expected cash flows where relevant, would be recorded in the consolidated income statement. If the hedge is not, or has ceased to be, highly effective the group discontinues hedge accounting.
For fair value hedges, changes in the fair value are recognised in the consolidated income statement, together with changes in the fair value of the hedged item. For cash flow hedges, the fair value gain or loss associated with the effective proportion of the cash flow hedge is recognised initially directly in equity and recycled to the consolidated income statement in the period when the hedged item affects income.
(s) Intangible assetsComputer software (acquired and costs associated with development) and intangible assets on acquisition (excluding goodwill) are stated at cost less accumulated amortisation and provisions for impairment. Amortisation is calculated to write off their cost on a straight-line basis over the estimated useful lives as follows:
Computer software 3 to 5 yearsIntangible assets on acquisition 8 to 20 years
Goodwill on acquisitions of subsidiaries is included in intangible assets. Goodwill is assessed annually for impairment and carried at cost less any accumulated impairment.
(t) Property, plant and equipmentProperty, plant and equipment is stated at cost less accumulated depreciation and provisions for impairment. Depreciation is calculated to write off their cost on a straight-line basis over their estimated useful lives as follows:
Long leasehold property 40 yearsShort leasehold property Over the length of the leaseFixtures, fittings and equipment 3 to 5 yearsAssets held under operating leases 1 to 15 yearsMotor vehicles 5 years
(u) Share capitalShare issue costsIncremental costs directly attributable to the issue of new shares or options including those issued on the acquisition of a business are shown in equity as a deduction, net of tax, from the proceeds.
Dividends on ordinary sharesDividends on ordinary shares are recognised in equity in the period in which they are paid or, if earlier, approved by shareholders.
Treasury sharesWhere the company or any member of the group purchases the company’s share capital, the consideration paid is deducted from shareholders’ equity as treasury shares until they are cancelled. Where such shares are subsequently sold or reissued, any consideration received is included in shareholders’ equity.

Close Brothers Group plc Annual Report 201698
The Notes continued
(v) Employee benefitsThe group operates defined contribution pension schemes for eligible employees as well as a defined benefit pension scheme which is closed to new members and further accrual.
Under the defined contribution scheme the group pays fixed contributions into a fund separate from the group’s assets. Contributions are charged in the consolidated income statement when they become payable.
The expected cost of providing pensions within the funded defined benefit scheme, determined on the basis of annual valuations using the projected unit method, is charged to the consolidated income statement. Actuarial gains and losses are recognised in full in the period in which they occur and recognised in other comprehensive income.
The retirement benefit obligation recognised in the balance sheet represents the present value of the defined benefit obligation, as adjusted for unrecognised past service cost, and as reduced by the fair value of scheme assets at the balance sheet date. Both the return on investment expected in the period and the expected financing cost of the liability, as estimated at the beginning of the period, are recognised in the results for the period. Any variances against these estimates in the year form part of the actuarial gain or loss.
The assets of the scheme are held separately from those of the group in an independently managed fund.
(w) Share-based payments to employeesAt 31 July 2016, the group operates four share-based award schemes, an annual bonus plan and three long-term incentive schemes (“Incentive Schemes”); the Share Matching Plan (“SMP”), the 2009 Long Term Incentive Plan (“LTIP”), and the Inland Revenue approved Save As You Earn scheme.
The costs of the awards granted under the annual bonus plan are based on the salary of the individual at the time the award is made. The value of the share award at the grant date is charged to the group’s consolidated income statement in the year to which the award relates.
The cost of the Incentive Schemes is based on the fair value of awards on the date of grant. Fair values for market based performance conditions are determined using a stochastic (Monte Carlo simulation) pricing model for the SMP and LTIP and the Black-Scholes pricing model for the other schemes. Both models take into account the exercise price of the option, the current share price, the risk free interest rate, the expected volatility of the company’s share price over the life of the option award and other relevant factors. For non-market based performance conditions, vesting conditions are not taken into account when measuring fair value, but are reflected by adjusting the number of shares in each award such that the amount recognised reflects the number that
are expected to, and then actually do, vest. The fair value is expensed in the consolidated income statement on a straight-line basis over the vesting period, with a corresponding credit to the share-based payments reserve. At the end of the vesting period, or upon exercise, lapse or forfeit if earlier, this credit is transferred to retained earnings. Further information on the group’s schemes is provided in note 26 and in the Report of the Board on Directors’ Remuneration. (x) Provisions and contingent liabilitiesProvisions are recognised in respect of present obligations arising from past events where it is probable that outflows of resources will be required to settle the obligations and they can be reliably estimated.
Contingent liabilities are possible obligations whose existence depends on the outcome of uncertain future events or those present obligations where the outflows of resources are uncertain or cannot be measured reliably. Contingent liabilities are not recognised in the financial statements but are disclosed unless they are deemed remote.
(y) Taxes, including deferred taxesCurrent tax is the expected tax payable on the taxable profit for the year. Taxable profit differs from net profit as reported in the consolidated income statement because it excludes items of income and expense that are taxable or deductible in other years and items that are never taxable or deductible. The group’s liability for current tax is calculated using tax rates that have been enacted or substantively enacted by the balance sheet date.
To enable the tax charge to be based on the profit for the year, deferred tax is provided in full on temporary timing differences, at the rates of tax expected to apply when these differences crystallise. Deferred tax assets are recognised only to the extent that it is probable that sufficient taxable profits will be available against which temporary differences can be set. All deferred tax liabilities are offset against deferred tax assets in accordance with the provisions of IAS 12 “Income taxes”.
(z) Cash and cash equivalentsFor the purposes of the cash flow statement, cash and cash equivalents comprises cash and demand deposits with banks together with short-term highly liquid investments that are readily convertible to known amounts of cash.
(aa) Segment reportingOperating segments are reported in a manner consistent with the internal reporting provided to the Executive Committee, which is considered the group’s chief operating decision maker. All transactions between business segments are conducted on an arm’s length basis, with intra-segment revenue and costs being eliminated on consolidation. Income and expenses directly associated with each segment are included in determining business segment performance.
1. Significant accounting policies continued

Close Brothers Group plc Annual Report 2016S
trategicR
eportG
overnanceFinancial
Statem
ents99
2. Critical accounting estimates and judgementsThe reported results of the group are sensitive to the accounting policies, assumptions and estimates that underlie the preparation of its financial statements. UK company law and IFRS require the directors, in preparing the group’s financial statements, to select suitable accounting policies, apply them consistently and make judgements and estimates that are reasonable and prudent. The group’s estimates and assumptions are based on historical experience and expectation of future events and are reviewed periodically. The actual outcome may be materially different from that anticipated. The judgements and assumptions involved in the group’s accounting policies that are considered by the board to be the most important to the portrayal of its financial condition are as follows:
(a) Loan impairment provisionsAllowances for loan impairment represent management’s estimate of the losses incurred in the loan portfolios at the balance sheet date. Changes to the allowances for loan impairment are reported in the consolidated income statement as impairment losses on loans and advances. Impairment provisions are made if there is objective evidence of impairment as a result of one or more subsequent events regarding a significant loan or a portfolio of loans.
Individual impairment losses are determined as the difference between the carrying value and the present value of estimated future cash flows, discounted at the loans’ original effective interest rate. Impairment losses determined on a portfolio basis are calculated using a formulaic approach which allocates a loss rate dependent on the overdue period. Loss rates are based on the discounted expected future cash flows and are regularly benchmarked against actual outcomes to ensure they remain appropriate.
Estimating the amount and timing of future recoveries involves significant judgement, and considers the level of arrears as well as the assessment of matters such as future economic conditions and the value of collateral. All impairment losses are reviewed at least annually.
(b) RevenueInterest incomeThe effective interest rate method applies a rate that discounts estimated future cash payments or receipts relating to a financial instrument to its net carrying amount. The estimated future cash flows take into account all contractual terms of the financial instrument including transaction costs and all other premiums or discounts but not future credit losses. Models are reviewed at least annually to assess expected lives of groups of assets based upon actual repayment profiles.
Fee and commission incomeFee and commission income is recognised depending on the nature of service provided:• Income which forms an integral part of the effective
interest rate is recognised as an adjustment to the effective interest rate and recorded in interest income;
• Income earned from provision of services is recognised as the services are provided; and
• Income earned on the execution of a significant act is recognised when the act is completed.
(c) Goodwill impairmentThe directors review goodwill for impairment at least annually or when events or changes in economic circumstances indicate that impairment may have taken place. The recoverable amounts of relevant CGUs are based on value in use calculations using management’s best estimate of future cash flows and performance, discounted at a rate which the directors estimate to be the return appropriate to the business.

Close Brothers Group plc Annual Report 2016100
The Notes continued
3. Segmental analysisThe Executive Committee, which is considered to be the group’s chief operating decision maker, manages the group by class of business as determined by the products and services offered and presents the segmental analysis on that basis. The group’s activities are organised in three primary operating divisions: Banking, Securities and Asset Management. A description of the activities, including products and services offered by these divisions, is given in the Strategic Report. The Group segment includes the group’s central functions which comprise Group Executive, Finance, Marketing, Communications, Investor Relations, Legal, Human Resources, Internal Audit, Compliance, Corporate Development, Company Secretariat and Risk. Group administrative expenses include staff costs, legal and professional fees and property costs attributable to the central functions which support and assist the development
of the divisions. Income within Group is typically immaterial and will include interest on cash balances at Group. In the segmental reporting information which follows, Group consists of the central functions described above as well as various non-trading head office companies and consolidation adjustments, in order that the information presented reconciles to the consolidated income statement and balance sheet.
Divisions charge market prices for services rendered to other parts of the group. Funding charges between Banking businesses are determined by the Banking division’s Treasury operation taking into account commercial demands. Funding arrangements between other segments is limited. More than 90% of all the group’s activities, revenue and assets are located in the UK.
Banking£ million
Securities£ million
AssetManagement
£ millionGroup
£ million
Continuingoperations
£ million
Summary Income Statement for the year ended 31 July 2016Net interest income/(expense) 422.2 (0.6) 0.4 0.6 422.6Non-interest income 89.0 82.9 91.9 1.0 264.8
Operating income 511.2 82.3 92.3 1.6 687.4
Administrative expenses (229.7) (61.7) (75.9) (24.2) (391.5)Depreciation and amortisation (20.6) (1.6) (2.0) (0.2) (24.4)Impairment losses on loans and advances (37.9) – – – (37.9)
Total operating expenses (288.2) (63.3) (77.9) (24.4) (453.8)
Adjusted operating profit/(loss)1 223.0 19.0 14.4 (22.8) 233.6Amortisation of intangible assets on acquisition (0.5) – (4.6) – (5.1)
Operating profit/(loss) before tax 222.5 19.0 9.8 (22.8) 228.5
External operating income/(expense) 524.6 82.3 92.9 (12.4) 687.4Inter segment operating (expense)/income (13.4) – (0.6) 14.0 –
Segment operating income 511.2 82.3 92.3 1.6 687.4
1 Adjusted operating profit/(loss) is stated before amortisation of intangible assets on acquisition, profit on disposal of discontinued operations and tax.
Banking£ million
Securities£ million
AssetManagement
£ millionGroup
£ millionTotal
£ million
Balance Sheet Information at 31 July 2016Total assets 7,988.7 647.5 104.8 7.2 8,748.2Total liabilities 7,195.5 577.8 49.1 (171.1) 7,651.3Equity 793.2 69.7 55.7 178.3 1,096.9
Other segmental information for the year ended 31 July 2016Property, plant, equipment and intangible asset expenditure 95.0 3.4 3.0 – 101.4Employees (average number) 2,077 238 570 61 2,946

Close Brothers Group plc Annual Report 2016S
trategicR
eportG
overnanceFinancial
Statem
ents101
The following table provides further detail on operating income:
2016£ million
20151
£ million
BankingRetail Finance 204.6 186.3Commercial Finance 202.3 195.9Property Finance 104.3 99.7SecuritiesMarket-making and related activities 82.3 94.6Asset ManagementInvestment management 57.4 54.1Advice and other services 32.1 36.1Other income 2.8 5.4Group 1.6 0.7
Operating income from continuing operations 687.4 672.8
1 Re-presented – see note 1(d).
Banking£ million
Securities£ million
AssetManagement
£ millionGroup
£ million
Continuingoperations
£ million
Summary Income Statement for the year ended 31 July 20151
Net interest income/(expense) 396.5 (0.9) 0.2 0.7 396.5Non-interest income 85.4 95.5 95.4 – 276.3
Operating income 481.9 94.6 95.6 0.7 672.8
Administrative expenses (214.6) (69.0) (76.4) (26.3) (386.3)Depreciation and amortisation (16.7) (1.0) (1.4) (0.6) (19.7)Impairment losses on loans and advances (41.9) – – – (41.9)
Total operating expenses (273.2) (70.0) (77.8) (26.9) (447.9)
Adjusted operating profit/(loss)2 208.7 24.6 17.8 (26.2) 224.9Amortisation of intangible assets on acquisition (0.5) – (4.5) – (5.0)
Operating profit/(loss) before tax 208.2 24.6 13.3 (26.2) 219.9
External operating income/(expense) 511.8 94.6 96.5 (13.4) 689.5Inter segment operating (expense)/income (13.2) – (0.9) 14.1 –
Segment operating income 498.6 94.6 95.6 0.7 689.5
1 Re-presented – see note 1(d).2 Adjusted operating profit/(loss) is stated before amortisation of intangible assets on acquisition, profit on disposal of discontinued operations and tax.
Banking£ million
Securities£ million
AssetManagement
£ millionGroup
£ millionTotal
£ million
Balance Sheet Information at 31 July 2015Total assets 7,303.1 538.7 101.1 14.4 7,957.3Total liabilities 6,592.0 466.8 53.5 (164.9) 6,947.4Equity 711.1 71.9 47.6 179.3 1,009.9
Other segmental information for the year ended 31 July 2015Property, plant, equipment and intangible asset expenditure 74.7 3.5 2.6 0.1 80.9Employees (average number) 1,910 232 562 63 2,767

Close Brothers Group plc Annual Report 2016102
The Notes continued
4. Operating profit before tax2016
£ million2015
£ million
Interest incomeCash and balances at central banks 4.1 4.9Loans and advances to banks 0.5 0.5Loans and advances to customers 542.9 521.4Other interest income 2.6 2.0
550.1 528.8
Interest expenseDeposits by banks 0.4 0.3Deposits by customers 79.1 83.5Borrowings 37.4 39.3Other interest expense 10.6 9.2
127.5 132.3
Net interest income 422.6 396.5
2016£ million
2015£ million
Fee and commission incomeBanking 85.4 83.3Asset Management 92.4 95.7Securities 11.4 16.7
189.2 195.7
Fee and commission expense (28.5) (30.2)
Net fee and commission income 160.7 165.5
Fee income and expense (other than amounts calculated using the effective interest rate method) on financial instruments that are not at fair value through profit or loss were £85.4 million (2015: £83.3 million) and £24.8 million (2015: £23.8 million) respectively.
Fee income and expense arising from trust and other fiduciary activities amounted to £92.4 million (2015: £95.7 million) and £3.3 million (2015: £6.0 million) respectively.
2016£ million
20151
£ million
Administrative expensesStaff costs:Wages and salaries 211.8 201.0Social security costs 29.0 30.5Share-based awards 6.2 7.8Pension costs 10.1 9.1
257.1 248.4Depreciation and amortisation 24.4 19.7Other administrative expenses 134.4 137.9
415.9 406.0
1 Re-presented – see note 1(d).

Close Brothers Group plc Annual Report 2016S
trategicR
eportG
overnanceFinancial
Statem
ents103
5. Information regarding the auditor2016
£ million2015
£ million
Fees payableAudit of the company’s annual accounts 0.3 0.2Audit of the company’s subsidiaries pursuant to legislation 0.9 0.9Other services pursuant to legislation 0.3 0.3Tax services 0.2 0.2Other services 0.2 0.1
1.9 1.7
The auditor of the group is Deloitte LLP.
6. Taxation2016
£ million2015
£ million
Tax charged/(credited) to the income statementCurrent tax:UK corporation tax 56.5 49.1Foreign tax 2.5 2.6Adjustments in respect of previous years (1.1) (0.2)
57.9 51.5Deferred tax:Deferred tax credit for the current year (16.5) (6.5)Adjustments in respect of previous years 0.8 0.4
42.2 45.4
Tax on items not (credited)/charged to the income statementCurrent tax relating to:Share-based transactions tax allowance in excess of expense recognised (2.1) (4.1)Deferred tax relating to:Cash flow hedging (1.7) (1.1)Defined benefit pension scheme (0.3) (0.4)Financial instruments classified as available for sale (0.7) (1.0)Share-based transactions tax allowance in excess of expense recognised 1.1 1.0Currency translation gains/(losses) 1.5 (0.4)
(2.2) (6.0)
Reconciliation to tax expenseUK corporation tax for the year at 20.0% (2015: 20.7%) on operating profit 45.7 45.5Gain on sale of subsidiaries and available for sale investment (0.5) –Effect of different tax rates in other jurisdictions (0.6) (0.8)Disallowable items and other permanent differences 1.5 0.3Banking surcharge 8.2 –Deferred tax impact of (increased)/decreased UK corporation tax rate (11.8) 0.2Prior year tax provision (0.3) 0.2
42.2 45.4
The standard UK corporation tax rate for the financial year is 20.0% (2015: 20.7%). From 1 January 2016 an additional 8% surcharge applies to banking company profits as defined in legislation. The effective tax rate is 18.5% (2015: 20.6%) which is below the UK corporation tax rate. This reflects a write up of deferred tax assets due to the introduction of the bank corporation tax surcharge, more than offsetting the surcharge payable on profits for the period since 1 January 2016.

Close Brothers Group plc Annual Report 2016104
The Notes continued
Movements in deferred tax assets and liabilities were as follows:
Capital allowances
Pension scheme
Share-based payments
and deferred compensation
Available forsale assets
Cash flow hedging
Intangible assets Other Total
£ million £ million £ million £ million £ million £ million £ million £ million
GroupAt 1 August 2014 27.8 (1.0) 10.9 (1.7) (0.5) (4.2) 0.4 31.7Credit to the income statement 4.9 – 0.3 – – 0.9 – 6.1Credit to other comprehensive income 0.4 0.4 – 1.0 1.1 – – 2.9Charge to equity – – (1.0) – – – – (1.0)Acquisition – – – – – (0.3) – (0.3)At 31 July 2015 33.1 (0.6) 10.2 (0.7) 0.6 (3.6) 0.4 39.4Credit to the income statement 13.3 – 1.1 – – 1.0 0.3 15.7(Charge)/credit to other comprehensive
income (1.5) 0.3 – 0.7 1.7 – – 1.2Charge to equity – – (1.1) – – – – (1.1)Acquisition – – – – – – – –
At 31 July 2016 44.9 (0.3) 10.2 – 2.3 (2.6) 0.7 55.2
Capital allowances
Pension scheme
Share-based payments
and deferred compensation Total
£ million £ million £ million £ million
CompanyAt 1 August 2014 0.3 (1.0) 3.9 3.2Charge to the income statement – – (0.3) (0.3)Credit to statement of recognised gains and losses – 0.4 – 0.4At 31 July 2015 0.3 (0.6) 3.6 3.3Charge to the income statement – – (0.1) (0.1)Credit to statement of recognised gains and losses – 0.3 – 0.3
At 31 July 2016 0.3 (0.3) 3.5 3.5
As the group has been and is expected to continue to be consistently profitable, it is appropriate to recognise the full deferred tax assets.
7. Discontinued operationsOn 5 January 2015, the group completed the sale of Close Brothers Seydler (“Seydler”) to Oddo & Cie for a gross cash consideration of €46.5 million (£36.4 million), which includes a post year end adjustment of £0.5 million following finalisation of completion accounts. The profit on disposal was £10.3 million.
Based in Frankfurt, Seydler provided equity and debt capital markets services, securities trading and research primarily in German small and mid-sized companies and was part of the Securities division.
The transaction fulfilled the requirements of IFRS 5 to be classified as “Discontinued operations” in the consolidated income statement, the results of which are set out below:
Results of discontinued operations
2016£ million
20151
£ million
Operating income – 11.7Operating expenses – (10.4)Operating profit before tax – 1.3Tax – (0.4)
Profit after tax – 0.9
Profit on disposal of discontinued operations, net of tax – 10.3Profit from discontinued operations – 11.2
1 Profit after tax is up until the point of disposal.
6. Taxation continued

Close Brothers Group plc Annual Report 2016S
trategicR
eportG
overnanceFinancial
Statem
ents105
Cash flow from discontinued operations
2016£ million
20151
£ million
Net cash flow from operating activities – 6.6Net cash flow from investing activities – (0.1)Net cash flow from financing activities – –
1 Up until the point of disposal.
8. Earnings per shareThe calculation of basic earnings per share is based on the profit attributable to shareholders and the number of basic weighted average shares. When calculating the diluted earnings per share, the weighted average number of shares in issue is adjusted for the effects of all dilutive share options and awards.
2016 2015
Continuing operationsBasic 125.7p 117.8pDiluted 124.3p 116.5pAdjusted basic1 128.4p 120.5pAdjusted diluted1 127.0p 119.2p
Continuing and discontinued operationsBasic 125.7p 125.4pDiluted 124.3p 124.0p
Discontinued operationsBasic – 7.6pDiluted – 7.5p
1 Excludes amortisation of intangible assets on acquisition discontinued operations and their tax effects.
2016£ million
2015£ million
Profit attributable to shareholders 186.5 185.7Less profit from discontinued operations, net of tax – 11.2Profit attributable to shareholders on continuing operations 186.5 174.5Adjustments:Amortisation of intangible assets on acquisition 5.1 5.0Tax effect of adjustments (1.0) (1.0)
Adjusted profit attributable to shareholders on continuing operations 190.6 178.5
2016million
2015million
Average number of sharesBasic weighted 148.4 148.1Effect of dilutive share options and awards 1.7 1.7
Diluted weighted 150.1 149.8
9. Dividends2016
£ million2015
£ million
For each ordinary shareFinal dividend for previous financial year paid in November 2015: 35.5p (2014: 32.5p) 52.3 47.6Interim dividend for current financial year paid in April 2016: 19.0p (2015: 18.0p) 28.0 26.7
80.3 74.3
A final dividend relating to the year ended 31 July 2016 of 38.0p, amounting to an estimated £56.1 million, is proposed. This final dividend, which is due to be paid on 22 November 2016 to shareholders on the register at 14 October 2016, is not reflected in these financial statements.

Close Brothers Group plc Annual Report 2016106
The Notes continued
10. Loans and advances to banks
On demand£ million
Within three months£ million
Between three months and one year
£ million
Between one and
two years£ million
Between two and
five years £ million
Total£ million
At 31 July 2016 97.5 7.2 4.0 9.6 3.2 121.5At 31 July 2015 65.9 7.4 – 3.8 7.5 84.6
11. Loans and advances to customers
On demand£ million
Within three months£ million
Between three months and one year
£ million
Between one and
two years£ million
Between two and
five years£ million
After more than five years£ million
Impairment provisions
£ millionTotal
£ million
At 31 July 2016 58.1 1,746.0 2,014.4 1,279.3 1,328.2 65.3 (59.7) 6,431.6At 31 July 2015 45.4 1,543.5 1,797.8 1,108.2 1,254.1 44.9 (56.1) 5,737.8
2016£ million
2015£ million
Impairment provisions on loans and advances to customersAt 1 August 56.1 48.3Charge for the year 37.9 41.9Amounts written off net of recoveries (34.3) (34.1)
At 31 July 59.7 56.1
Loans and advances to customers compriseHire purchase agreement receivables 2,782.4 2,552.9Finance lease receivables 440.1 473.0Other loans and advances 3,209.1 2,711.9
At 31 July 6,431.6 5,737.8
At 31 July 2016, gross impaired loans were £158.5 million (31 July 2015: £162.3 million) and equate to 2% (31 July 2015: 3%) of the gross loan book before impairment provisions. The majority of the group’s lending is secured and therefore the gross impaired loans quoted do not reflect the expected loss.
The following table shows a reconciliation between gross investment in finance lease and hire purchase agreement receivables to present value of minimum lease and hire purchase payments:
2016£ million
2015£ million
Gross investment in finance leases and hire purchase agreement receivables due:Within one year 1,377.5 1,318.8Between one and five years 2,354.6 2,193.5After more than five years 26.8 26.0
3,758.9 3,538.3Unearned finance income (512.4) (494.1)
Present value of minimum lease and hire purchase agreement payments 3,246.5 3,044.2
Of which due:Within one year 1,190.3 1,134.6Between one and five years 2,033.3 1,887.4After more than five years 22.9 22.2
3,246.5 3,044.2
The aggregate cost of assets acquired for the purpose of letting under finance leases and hire purchase agreements was £5,602.9 million (2015: £5,182.8 million). The average effective interest rate on finance leases approximates to 10.3% (2015: 10.6%). The present value of minimum lease and hire purchase agreement payments reflects the fair value of finance lease and hire purchase agreement receivables before deduction of impairment provisions.

Close Brothers Group plc Annual Report 2016S
trategicR
eportG
overnanceFinancial
Statem
ents107
12. Debt securitiesHeld for trading
£ million
Available for sale
£ million
Loans and receivables
£ millionTotal
£ million
Long trading positions 20.3 – – 20.3Certificates of deposit – – 201.0 201.0Gilts – – – –
At 31 July 2016 20.3 – 201.0 221.3
Held for trading
£ million
Available for sale
£ million
Loans and receivables
£ millionTotal
£ million
Long trading positions 14.1 – – 14.1Certificates of deposit – – 115.3 115.3Gilts – 20.1 – 20.1
At 31 July 2015 14.1 20.1 115.3 149.5
Movements on the book value of gilts comprise:
£ million
At 1 August 2014 45.6Redemptions at maturity (25.0)Movement in value (0.5)
At 31 July 2015 20.1
Redemptions at maturity (20.0)Movement in value (0.1)
At 31 July 2016 –
13. Equity shares31 July
2016£ million
31 July2015
£ million
Long trading positions 26.1 31.1Other equity shares 2.1 10.1
28.2 41.2
Movements on the book value of other equity shares comprise:
Available for sale
£ million
Fair value through
profit or loss£ million
Total£ million
At 1 August 2014 19.5 0.1 19.6Disposals (8.1) – (8.1)Currency translation differences (0.4) – (0.4)Movement in value of:Equity shares classified as available for sale (1.0) – (1.0)
At 31 July 2015 10.0 0.1 10.1
Disposals (7.7) – (7.7)Currency translation differences 0.4 – 0.4Movement in value of:Equity shares classified as available for sale (0.7) – (0.7)
At 31 July 2016 2.0 0.1 2.1
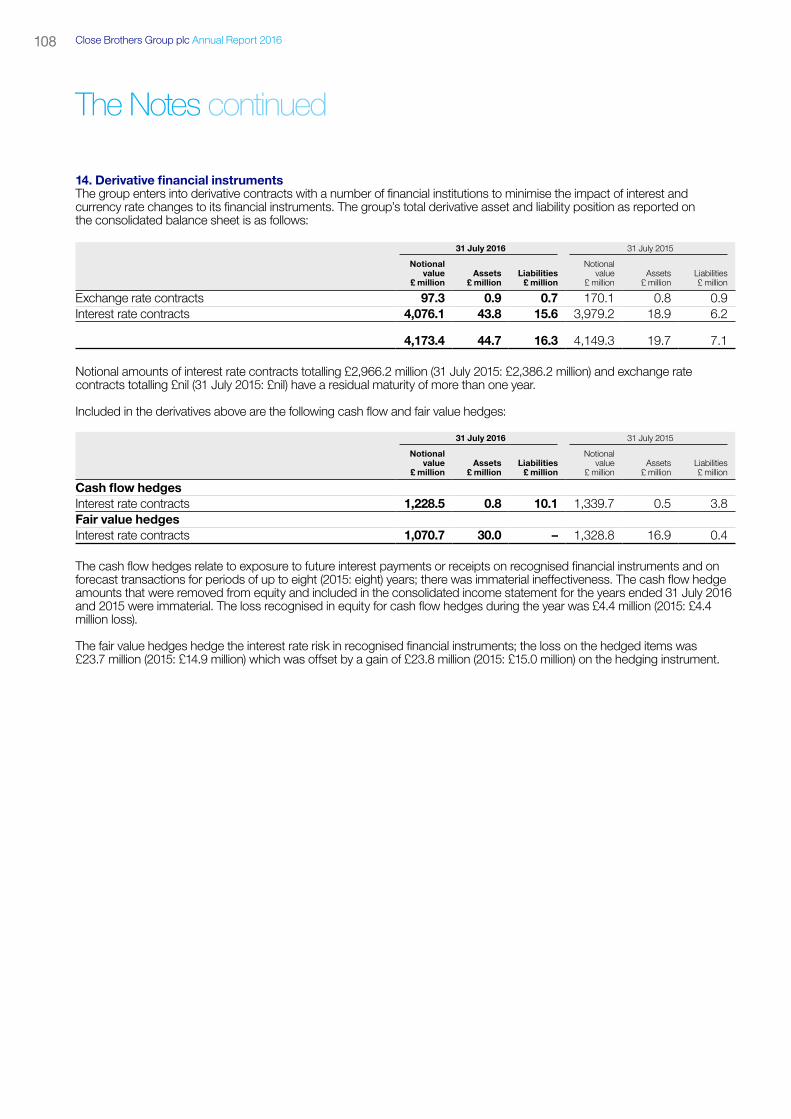
Close Brothers Group plc Annual Report 2016108
The Notes continued
14. Derivative financial instrumentsThe group enters into derivative contracts with a number of financial institutions to minimise the impact of interest and currency rate changes to its financial instruments. The group’s total derivative asset and liability position as reported on the consolidated balance sheet is as follows:
31 July 2016 31 July 2015
Notionalvalue
£ millionAssets
£ millionLiabilities
£ million
Notionalvalue
£ millionAssets
£ millionLiabilities£ million
Exchange rate contracts 97.3 0.9 0.7 170.1 0.8 0.9Interest rate contracts 4,076.1 43.8 15.6 3,979.2 18.9 6.2
4,173.4 44.7 16.3 4,149.3 19.7 7.1
Notional amounts of interest rate contracts totalling £2,966.2 million (31 July 2015: £2,386.2 million) and exchange rate contracts totalling £nil (31 July 2015: £nil) have a residual maturity of more than one year.
Included in the derivatives above are the following cash flow and fair value hedges:
31 July 2016 31 July 2015
Notionalvalue
£ millionAssets
£ millionLiabilities
£ million
Notionalvalue
£ millionAssets
£ millionLiabilities£ million
Cash flow hedgesInterest rate contracts 1,228.5 0.8 10.1 1,339.7 0.5 3.8Fair value hedgesInterest rate contracts 1,070.7 30.0 – 1,328.8 16.9 0.4
The cash flow hedges relate to exposure to future interest payments or receipts on recognised financial instruments and on forecast transactions for periods of up to eight (2015: eight) years; there was immaterial ineffectiveness. The cash flow hedge amounts that were removed from equity and included in the consolidated income statement for the years ended 31 July 2016 and 2015 were immaterial. The loss recognised in equity for cash flow hedges during the year was £4.4 million (2015: £4.4 million loss).
The fair value hedges hedge the interest rate risk in recognised financial instruments; the loss on the hedged items was £23.7 million (2015: £14.9 million) which was offset by a gain of £23.8 million (2015: £15.0 million) on the hedging instrument.

Close Brothers Group plc Annual Report 2016S
trategicR
eportG
overnanceFinancial
Statem
ents109
15. Intangible assets
Goodwill£ million
Software£ million
Intangibleassets on
acquisition£ million
Group total£ million
Companysoftware£ million
CostAt 1 August 2014 156.1 68.8 42.4 267.3 0.4Additions 0.3 20.3 1.5 22.1 –Disposals (10.4) (8.1) – (18.5) –Foreign exchange – – – – –
At 31 July 2015 146.0 81.0 43.9 270.9 0.4Additions 1.7 24.1 0.4 26.2 –Disposals (6.9) (0.5) – (7.4) –Foreign exchange – – – – –
At 31 July 2016 140.8 104.6 44.3 289.7 0.4
Amortisation and impairmentAt 1 August 2014 68.0 35.2 17.8 121.0 0.3Amortisation charge for the year – 13.5 5.0 18.5 –Disposals (6.2) (6.5) (0.1) (12.8) –
At 31 July 2015 61.8 42.2 22.7 126.7 0.3Amortisation charge for the year – 17.2 5.1 22.3 0.1Disposals (6.9) (0.3) – (7.2) –
At 31 July 2016 54.9 59.1 27.8 141.8 0.4
Net book value at 31 July 2016 85.9 45.5 16.5 147.9 –
Net book value at 31 July 2015 84.2 38.8 21.2 144.2 0.1
Net book value at 1 August 2014 88.1 33.6 24.6 146.3 0.1
Additions in goodwill of £1.7 million and intangible assets on acquisition of £0.4 million in 2016 relates to the 100% acquisition of Finance for Industry Group (“FFI”). The principal activities of FFI are those of provision of instalment credit (mainly asset backed finance) to business customers to assist in their acquisition of business equipment and financial brokering to third party lenders. Cash consideration of £3.6 million was paid and a contingent consideration of £1.3 million is expected to be paid in the future for the equity of the business. Additions in goodwill of £0.3 million and intangible assets on acquisition of £1.5 million in 2015 relates to the 100% acquisition of Mackay Stewart and Brown Limited, a Scottish Independent Financial Adviser with £72.0 million of client assets, for cash consideration of £1.8 million for the equity of the business. These acquisitions are not regarded as material in the context of the group’s financial statements and therefore information required for material acquisitions by IFRS 3 has not been disclosed.
Disposal of £6.9 million goodwill in 2016 relates to the sale of Asset Management’s corporate advice and investment management activities. Disposal of £10.4 million goodwill in 2015 relates to the Seydler disposal of £4.2 million and the write off of fully impaired goodwill of £6.2 million relating to the wind up of Fortune Asset Management Limited. Intangible assets on acquisition relates to broker and customer relationships and are amortised over a period of eight to 20 years.
In the 2016 financial year, £5.1 million (2015: £5.0 million) of the amortisation charge is included in amortisation of intangible assets on acquisition and £17.2 million (2015: £13.5 million) of the amortisation charge is included in administrative expenses shown in the consolidated income statement.
Impairment tests for goodwillAt 31 July 2016, goodwill has been allocated to nine individual CGUs of which seven are within the Banking division, one is the Securities division and the remaining one is the Asset Management division. Goodwill impairment reviews are carried out annually by assessing the recoverable amount of the group’s CGUs, which is the higher of fair value less costs to sell and value in use. The recoverable amounts for all CGUs were measured based on value in use.
A value in use calculation uses discounted cash flow projections based on the most recent board approved budgets and three year plans to determine the recoverable amount of each CGU. The key assumptions underlying management’s three year plans, which are based on past experience and forecast market conditions, are expected market-making conditions in the Securities CGU, expected total client asset growth rate and revenue margin in the Asset Management CGU and expected loan book growth rates and net return on loan book in the Banking CGUs.

Close Brothers Group plc Annual Report 2016110
The Notes continued
For cash flows beyond the group’s three year planning horizon, a terminal value was calculated using a prudent annual growth rate of 0% (2015: Banking division and Securities division 0%, Asset Management division 2%).
These cash flows are discounted using a pre-tax estimated weighted average cost of capital that reflects current market rates appropriate to the CGU as set out in the table below. For the 2016 calculation, the pre-tax discount rates have been adjusted in each year to reflect the expected future change in corporation tax rate in each CGU. As such, the pre-tax discount rates in the table are an average of the rate used in that CGU.
At 31 July 2016, the results of the review indicate there is no goodwill impairment. The inputs used in the value in use calculations are sensitive, primarily to the impact of changes in the assumptions for future cash flows, discount rates and long-term growth rates. Having performed stress tested value in use calculations, the group believes that any reasonably possible change in the key assumptions which have been used would not lead the carrying value of any CGU to exceed its recoverable amount.
Details of the CGUs in which the goodwill carrying amount is significant in comparison with total goodwill, together with the pre-tax discount rate used in determining value in use, are disclosed separately in the table below:
31 July 2016 31 July 2015
Cash generating unitGoodwill £ million
Pre-tax discount rate
%Goodwill £ million
Pre-tax discount rate
%
Winterflood Securities 23.3 15.3 23.3 12.5Close Brothers Asset Management 33.7 11.0 33.7 11.0Close Brothers Asset Finance 9.0 13.0 7.4 12.3Other 19.9 11.7–13.0 19.8 11.0–12.5
85.9 84.2
16. Property, plant and equipment
Leasehold property£ million
Fixtures,fittings andequipment
£ million
Assetsheld underoperating
leases£ million
Motorvehicles£ million
Total£ million
GroupCostAt 1 August 2014 10.1 34.9 132.7 1.2 178.9Additions 7.4 7.7 43.7 – 58.8Disposals (0.1) (8.0) (11.3) (0.4) (19.8)
At 31 July 2015 17.4 34.6 165.1 0.8 217.9Additions 4.3 9.2 61.6 0.1 75.2Disposals (0.2) (3.6) (25.3) (0.5) (29.6)
At 31 July 2016 21.5 40.2 201.4 0.4 263.5
DepreciationAt 1 August 2014 5.7 26.7 28.9 0.6 61.9Charge for the year 1.6 4.5 16.7 0.1 22.9Disposals (0.1) (7.5) (7.5) (0.2) (15.3)
At 31 July 2015 7.2 23.7 38.1 0.5 69.5Charge for the year 2.5 4.6 19.6 0.1 26.8Disposals – (2.2) (16.1) (0.3) (18.6)
At 31 July 2016 9.7 26.1 41.6 0.3 77.7
Net book value at 31 July 2016 11.8 14.1 159.8 0.1 185.8
Net book value at 31 July 2015 10.2 10.9 127.0 0.3 148.4
Net book value at 1 August 2014 4.4 8.2 103.8 0.6 117.0
The gain from the sale of assets held under operating leases for the year ended 31 July 2016 was £0.1 million (2015: £nil).
15. Intangible assets continued

Close Brothers Group plc Annual Report 2016S
trategicR
eportG
overnanceFinancial
Statem
ents111
31 July2016
£ million
31 July2015
£ million
Future minimum lease rentals receivable under non-cancellable operating leasesWithin one year 28.6 24.0Between one and five years 59.5 48.4After more than five years 0.3 0.2
88.4 72.6
Leasehold property£ million
Fixtures,fittings andequipment
£ millionTotal
£ million
CompanyCostAt 1 August 2014 3.1 1.4 4.5Additions 0.1 – 0.1
At 31 July 2015 3.2 1.4 4.6Additions – – –Disposals (0.5) (0.1) (0.6)
At 31 July 2016 2.7 1.3 4.0
DepreciationAt 1 August 2014 2.1 1.3 3.4Charge for the year 0.7 – 0.7
At 31 July 2015 2.8 1.3 4.1Charge for the year 0.1 – 0.1Disposals (0.2) – (0.2)
At 31 July 2016 2.7 1.3 4.0
Net book value at 31 July 2016 – – –
Net book value at 31 July 2015 0.4 0.1 0.5
Net book value at 1 August 2014 1.0 0.1 1.1
The net book value of leasehold property comprises:
Group Company
31 July2016
£ million
31 July2015
£ million
31 July2016
£ million
31 July2015
£ million
Long leasehold property 1.1 0.7 – –Short leasehold property 10.7 9.5 – 0.4
11.8 10.2 – 0.4

Close Brothers Group plc Annual Report 2016112
The Notes continued
17. Other assets and other liabilities31 July
2016£ million
31 July2015
£ million
Prepayments, accrued income and other assetsPrepayments and accrued income 99.5 83.5Trade and other receivables 34.6 34.3
134.1 117.8
Accruals, deferred income and other liabilitiesAccruals and deferred income 119.5 116.3Trade and other payables 70.2 71.3Provisions 15.7 21.4
205.4 209.0
Provisions movement in the year:
Claims £ million
Property £ million
Other £ million
Total £ million
GroupAt 1 August 2014 0.7 10.9 10.4 22.0Additions 0.6 3.7 4.2 8.5Utilised (0.3) (2.4) (4.7) (7.4)Released (0.6) (1.0) (0.1) (1.7)
At 31 July 2015 0.4 11.2 9.8 21.4Additions 0.2 1.4 3.5 5.1Utilised (0.2) (1.7) (5.5) (7.4)Released (0.3) (2.6) (0.5) (3.4)
At 31 July 2016 0.1 8.3 7.3 15.7
Property £ million
Other £ million
Total £ million
CompanyAt 1 August 2014 2.2 8.6 10.8Additions – 2.9 2.9Utilised – (4.0) (4.0)Released – – –
At 31 July 2015 2.2 7.5 9.7Additions – 2.4 2.4Utilised – (4.5) (4.5)Released (0.3) (0.3) (0.6)
At 31 July 2016 1.9 5.1 7.0
Claims and other items for which provisions are made arise in the normal course of business and include those related to employee benefits. The timing and outcome of these claims and other items are uncertain. Property provisions are in respect of leaseholds where rents payable exceed the value to the group, in respect of potential dilapidations and onerous leases. These property provisions will be utilised and released over the remaining lives of the leases which range from one to nine years.

Close Brothers Group plc Annual Report 2016S
trategicR
eportG
overnanceFinancial
Statem
ents113
18. Settlement balances and short positions31 July
2016 £ million
31 July2015
£ million
Settlement balances 456.3 376.5Short positions held for trading:Debt securities 5.8 13.7Equity shares 13.5 14.1
19.3 27.8
475.6 404.3
19. Financial liabilities
On demand£ million
Within three
months£ million
Betweenthree
months andone year£ million
Betweenone and
two years£ million
Betweentwo and
five years£ million
Aftermore thanfive years
£ millionTotal
£ million
Deposits by banks 31.9 1.9 26.5 10.1 0.7 – 71.1Deposits by customers 130.8 918.0 2,117.3 1,233.4 495.1 – 4,894.6Loans and overdrafts from banks 11.0 207.8 160.1 90.2 – – 469.1Debt securities in issue 30.2 7.1 557.1 201.5 589.1 37.8 1,422.8
At 31 July 2016 203.9 1,134.8 2,861.0 1,535.2 1,084.9 37.8 6,857.6
On demand£ million
Within threemonths£ million
Betweenthree monthsand one year
£ million
Betweenone and
two years£ million
Betweentwo and
five years£ million
Aftermore thanfive years£ million
Total£ million
Deposits by banks 11.5 0.3 22.8 0.5 – – 35.1Deposits by customers 154.8 828.4 2,347.7 851.2 299.3 – 4,481.4Loans and overdrafts from banks 8.6 99.1 123.7 59.9 89.9 – 381.2Debt securities in issue 11.2 6.7 1.1 747.8 299.3 298.9 1,365.0
At 31 July 2015 186.1 934.5 2,495.3 1,659.4 688.5 298.9 6,262.7
At 31 July 2016, the company held £205.9 million (31 July 2015: £205.6 million) debt securities in issue.
As discussed in note 28(c) the group has repurchase agreements at 31 July 2016 whereby £451.0 million (31 July 2015: £375.0 million) Treasury Bills have been drawn and lent in exchange for cash which is included within loans and overdrafts from banks above. Residual maturities of the repurchase agreements are as follows:
On demand£ million
Within threemonths£ million
Betweenthree monthsand one year
£ million
Betweenone and
two years£ million
Betweentwo and
five years£ million
Aftermore thanfive years£ million
Total£ million
At 31 July 2016 – 197.8 160.1 90.2 – – 448.1At 31 July 2015 – 99.1 123.7 59.9 89.9 – 372.6
20. Subordinated loan capital
Prepaymentdate
Initial interest
rate
31 July2016
£ million
31 July2015
£ million
Final maturity date2026 2021 7.42% 15.5 15.52026 2021 7.62% 30.9 30.9
46.4 46.4
All the subordinated loan capital has been issued by Close Brothers Limited (“CBL”) and is denominated in sterling. If CBL opts not to prepay at the prepayment date, the interest rate is reset to a margin over the yield on five year UK Treasury securities. In March 2015 CBL exercised its option to prepay £30.0 million of its subordinated loan capital.

Close Brothers Group plc Annual Report 2016114
The Notes continued
21. Share capital31 July 2016 31 July 2015
million £ million million £ million
Group and companyAllotted, issued and fully paidOrdinary shares of 25p each 150.6 37.7 150.6 37.7
22. Capital
The group’s policy is to be well capitalised and its approach to capital management is driven by strategic and organisational requirements, while also taking into account the regulatory and commercial environments in which it operates.
The Prudential Regulation Authority (“PRA”) supervises the group on a consolidated basis and receives information on the capital adequacy of, and sets capital requirements for, the group as a whole. In addition, a number of subsidiaries are regulated for prudential purposes by either the PRA or the Financial Conduct Authority (“FCA”). The aim of the capital adequacy regime is to promote safety and soundness in the financial system. It is structured around three “pillars”: Pillar 1 on minimum capital requirements; Pillar 2 on the supervisory review process; and Pillar 3 on market discipline. The group’s Pillar 1 information is presented on page 115. Under Pillar 2, the group completes an annual self assessment of risks known as the “Internal Capital Adequacy Assessment Process” (“ICAAP”). The ICAAP is reviewed by the PRA which culminates in the PRA setting “Individual Capital Guidance” (“ICG”) on the level of capital the group and its regulated subsidiaries are required to hold. Pillar 3 requires firms to publish a set of disclosures which allow market participants to assess information on that firm’s capital, risk exposures and risk assessment process. The group’s Pillar 3 disclosures can be found on the group’s website www.closebrothers.com/investor-relations/investor-information/results-reports-and-presentations.
The group maintains a strong capital base to support the development of the business and to ensure the group meets the Pillar 1 capital requirements and ICG at all times. As a result, the group maintains capital adequacy ratios above minimum regulatory requirements. The group’s individual regulated entities complied with all of the externally imposed capital requirements to which they are subject for the years ended 31 July 2016 and 2015.
A full analysis of the composition of regulatory capital and Pillar 1 risk weighted assets, a reconciliation between equity and common equity tier 1 capital after deductions and a table showing the movement in common equity tier 1 during the year are shown on the following pages.
At 31 July 2016, the group’s common equity tier 1 capital ratio was 13.5% (31 July 2015: 13.7%).
Common equity tier 1 capital increased to £901.4 million (31 July 2015: £813.2 million) primarily due to growth in profit attributable to shareholders.
Risk weighted assets increased to £6,682.5 million (31 July 2015: £5,932.1 million) as a result of growth in credit and counterparty risk associated with the loan book. Notional risk weighted assets for operational risk also increased reflecting increased performance over recent years.
The composition of capital remained broadly stable with 97.4% (31 July 2015: 95.9%) of the total capital consisting of common equity tier 1 capital.

Close Brothers Group plc Annual Report 2016S
trategicR
eportG
overnanceFinancial
Statem
ents115
31 July2016
£ million
31 July2015
£ million
Common equity tier 1 capitalCalled up share capital 37.7 37.7Share premium account 284.0 284.0Retained earnings 797.5 694.4Other reserves recognised for common equity tier 1 capital 21.8 18.3Deductions from common equity tier 1 capitalIntangible assets, net of associated deferred tax liabilities (145.3) (140.6)Foreseeable dividend1 (56.1) (52.4)Investment in own shares (37.2) (25.6)Pension asset, net of associated deferred tax liabilities (0.9) (2.5)Prudent valuation adjustment (0.1) (0.1)
Common equity tier 1 capital 901.4 813.2
Tier 2 capitalSubordinated debt2 24.0 31.5Unrealised gains on available for sale equity shares – 3.3
Tier 2 capital 24.0 34.8
Total regulatory capital 925.4 848.0
Risk weighted assets (notional) – unauditedCredit and counterparty credit risk 5,824.9 5,103.2Operational risk3 784.9 753.5Market risk3 72.7 75.4
6,682.5 5,932.1
Common equity tier 1 capital ratio 13.5% 13.7%Total capital ratio 13.8% 14.3%
1 Under the Regulatory Technical Standard on own funds, a deduction has been recognised at 31 July 2016 and 31 July 2015 for a foreseeable dividend being the proposed final dividend as set out in note 9.
2 Shown after applying the Capital Requirements Regulation’s transitional and qualifying own funds arrangements.3 Operational and market risk include a notional adjustment at 8% in order to determine notional risk weighted assets.
The following table shows a reconciliation between equity and common equity tier 1 capital after deductions:
31 July2016
£ million
31 July2015
£ million
Equity 1,096.9 1,009.9Regulatory deductions from equity:Intangible assets, net of associated deferred tax liabilities (145.3) (140.6)Foreseeable dividend1 (56.1) (52.4)Pension asset, net of associated deferred tax liabilities (0.9) (2.5)Prudent valuation adjustment (0.1) (0.1)Other reserves not recognised for common equity tier 1 capital:Available for sale movements reserve – (3.3)Cash flow hedging reserve 6.7 2.3Non-controlling interests 0.2 (0.1)
Common equity tier 1 capital 901.4 813.2
1 Under the Regulatory Technical Standard on own funds, a deduction has been recognised at 31 July 2016 and 31 July 2015 for a foreseeable dividend being the proposed final dividend as set out in note 9.

Close Brothers Group plc Annual Report 2016116
The Notes continued
22. Capital continued
The following table shows the movement in common equity tier 1 capital during the year:
£ million
Common equity tier 1 capital at 31 July 2015 813.2Profit in the period attributable to shareholders 186.5Dividends paid and foreseen (84.0)Other movements in retained reserves (3.1)Decrease in share-based payments reserve (9.8)Increase in exchange movements reserve 1.7Increase in intangible assets, net of associated deferred tax liabilities (4.7)Decrease in pension assets, net of associated deferred tax liabilities 1.6
Common equity tier 1 capital at 31 July 2016 901.4
23. Contingent liabilities, guarantees and commitmentsContingent liabilitiesFinancial Services Compensation Scheme (“FSCS”)A principal subsidiary of the group, CBL, by virtue of being a regulated deposit-taker, contributes to the FSCS which provides compensation to customers of financial institutions in the event that an institution is unable, or is likely to be unable, to pay claims against it. The FSCS raises levies on UK licensed deposit-taking institutions to meet such claims based on their share of UK deposits on 31 December of the year preceding the scheme year (which runs from 1 April to 31 March). At 31 July 2016, the group has accrued £1.0 million (2015: £1.9 million) for its share of levies that will be raised by the FSCS.
Compensation has previously been paid out by the FSCS funded by loan facilities provided by HM Treasury to FSCS in support of the FSCS’s obligations to the depositors of banks declared in default. The facilities are expected to be repaid wholly from recoveries from the failed deposit-takers, except for an estimated shortfall of £1.0 billion which the FSCS is recovering by levying the industry in three equal annual instalments beginning in 2013/2014, in addition to the ongoing interest charges on the outstanding loans.
The amount of future levies payable by the group depends on a number of factors including the potential recoveries of assets by the FSCS, the group’s participation in the deposit-taking market at 31 December, the level of protected deposits and the population of FSCS members.
Guarantees
Group Company
31 July2016
£ million
31 July2015
£ million
31 July2016
£ million
31 July2015
£ million
Guarantees and irrevocable letters of credit 143.2 136.7 156.2 159.0
Where the group undertakes to make a payment on behalf of its subsidiaries for guarantees issued, such as bank facilities or property leases or as irrevocable letters of credit for which an obligation to make a payment to a third party has not arisen at the reporting date, they are included in these consolidated financial statements as contingent liabilities.
CommitmentsUndrawn facilities, credit lines and other commitments to lend
31 July2016
£ million
31 July20151
£ million
Within one year 934.2 766.6After more than one year 28.5 95.8
962.7 862.4
1 Following review of the application of our policy prior year numbers have been re-presented for comparability.

Close Brothers Group plc Annual Report 2016S
trategicR
eportG
overnanceFinancial
Statem
ents117
Operating lease commitmentsMinimum operating lease payments recognised in the consolidated income statement amounted to £8.6 million (2015: £10.8 million).
The group had outstanding commitments for future minimum lease rentals payable under non-cancellable operating leases, which fall due as follows:
31 July 2016 31 July 2015
Premises£ million
Other£ million
Premises£ million
Other£ million
Within one year 10.8 2.8 10.4 2.7Between one and five years 39.1 3.9 39.3 3.8After more than five years 12.2 – 15.8 –
62.1 6.7 65.5 6.5
Other commitmentsSubsidiaries had contracted capital commitments relating to capital expenditure of £12.1 million (2015: £15.1 million).
24. Related party transactionsTransactions with key managementDetails of directors’ remuneration and interests in shares are disclosed in the Report of the Board on Directors’ Remuneration on pages 60 to 81.
Key management personnel are those persons having authority and responsibility for planning, directing and controlling the activities of an entity; the group’s key management are the members of the group’s Executive Committee, which includes all executive directors, together with its non-executive directors.
The table below details, on an aggregated basis, key management personnel emoluments:
2016£ million
2015£ million
EmolumentsSalaries and fees 3.9 3.6Benefits and allowances 0.7 0.7Performance related awards in respect of the current year:Cash 3.4 3.4Deferred 2.9 3.0
10.9 10.7Share-based awards 4.5 5.7
15.4 16.4
Gains upon exercise of options by key management personnel, expensed to the income statement in previous years, totalled £14.8 million (2015: £20.3 million).
Key management have banking relationships with group entities which are entered into in the normal course of business. Amounts included in deposits by customers at 31 July 2016 attributable, in aggregate, to key management were £1.8 million (31 July 2015: £2.3 million).

Close Brothers Group plc Annual Report 2016118
The Notes continued
25. PensionsThe group operates defined contribution pension schemes for eligible employees as well as a defined benefit pension scheme which is closed to new members and further accrual. Assets of all schemes are held separately from those of the group.
Defined contribution schemesDuring the year the charge to the consolidated income statement for the group’s defined contribution pension schemes was £10.0 million (2015: £9.3 million) representing contributions payable by the group and is included in administrative expenses.
Defined benefit pension schemeThe group’s only defined benefit pension scheme (“the scheme”) is a final salary scheme which operates under trust law. The scheme is managed and administered in accordance with the scheme’s Trust Deed and Rules and all relevant legislation by a trustee board made up of trustees nominated by both the company and the members.
The scheme was closed to new entrants in August 1996 and closed to further accrual during 2012. At 31 July 2016 this scheme had 50 (2015: 61) deferred members and 44 (2015: 35) pensioners and dependants.
Funding positionThe scheme’s most recent triennial actuarial valuation at 31 July 2015 showed that the scheme was fully funded. As such, no further contributions are scheduled.
IAS 19 (Revised) valuationThe following disclosures are reported in accordance with IAS 19 (Revised). Significant actuarial assumptions are as follows:
2016%
2015%
Inflation rate (RPI) 2.9 3.3Inflation rate (CPI) 1.9 2.3Discount rate for scheme liabilities1 2.4 3.6Expected interest/expected long-term return on plan assets 2.4 3.6Mortality assumptions2:Existing pensioners from age 65, life expectancy (years):Men 24.3 24.6Women 25.8 26.0Non-retired members currently aged 50, life expectancy from age 65 (years):Men 25.0 25.3Women 27.8 28.1
1 Based on market yields at 31 July 2016 and 2015 on high quality sterling-denominated corporate bonds, adjusted to be consistent with the estimated term of the post employment benefit obligation, using the Willis Towers Watson model “Global RATE:Link”.
2 Based on standard tables SAPS S1 Light produced by the CMI Bureau of the Institute and Faculty of Actuaries with adjusted mortality multipliers for pensioners and non-pensioners, together with projected future improvements in line with the CMI 2014 (2015: CMI 2011) core projection model with a long-term trend of 1.5% per annum.
The surplus of the scheme disclosed below has been accounted for as an asset of the group within note 17 Other assets and other liabilities.
The group has the unconditional right to any surpluses that arise within the scheme once all benefits have been secured in full. As such no asset ceiling has been applied, and accordingly the scheme surplus is recognised on the consolidated balance sheet.
2016£ million
2015£ million
2014£ million
2013£ million
2012£ million
Fair value of scheme assets:Equities 35.9 33.0 31.8 30.7 28.1Bonds 8.7 8.5 7.9 7.4 7.0Cash 0.2 0.2 0.2 – –Total fair value of scheme assets 44.8 41.7 39.9 38.1 35.1Present value of scheme liabilities (43.6) (38.6) (35.0) (31.9) (34.7)
Surplus 1.2 3.1 4.9 6.2 0.4

Close Brothers Group plc Annual Report 2016S
trategicR
eportG
overnanceFinancial
Statem
ents119
Movement in the present value of scheme liabilities during the year:
2016£ million
2015£ million
Carrying amount at 1 August (38.6) (35.0)Interest expense (1.4) (1.4)Benefits paid 1.9 2.7Actuarial losses (5.5) (4.9)
Carrying amount at 31 July (43.6) (38.6)
Movement in the fair value of scheme assets during the year:
2016£ million
2015£ million
Carrying amount at 1 August 41.7 39.9Interest income 1.5 1.6Benefits paid (1.9) (2.7)Administrative costs paid (0.2) –Return on scheme assets, excluding interest income 3.6 2.9
Carrying amount at 31 July 44.7 41.7
Historical experience of actuarial gains/(losses) are shown below:
2016£ million
2015£ million
2014£ million
2013£ million
2012£ million
Experience gains/(losses) on scheme assets 3.6 2.9 1.7 4.6 (0.8)Experience gains/(losses) on scheme liabilities 1.3 – (0.1) 0.5 0.6Impact of changes in assumptions on scheme liabilities (6.8) (4.9) (3.2) (2.7) 2.0Total actuarial (losses)/gains on scheme liabilities (5.5) (4.9) (3.3) (2.2) 2.6
Total actuarial (losses)/gains (1.9) (2.0) (1.6) 2.4 1.8
Total actuarial losses have been recognised in other comprehensive income. Income of £0.1 million (2015: £0.2 million) from the interest on the scheme surplus has been recognised within administrative expenses in the consolidated income statement.
The valuation of the scheme’s liabilities is sensitive to the key assumptions used in the valuation. The effect of a change in those assumptions in 2016 and 2015 is set out below. The analysis reflects the variation of the individual assumptions. The variation in price inflation includes all inflation-linked pension increases in deferment and in payment.
Impact on defined benefit obligation increase/(decrease)
2016 2015
Key assumption Sensitivity % £ million % £ million
Discount rate 0.25% increase (5.0) (2.2) (5.0) (1.9)Price inflation (RPI and CPI) 0.25% increase 2.0 0.9 2.5 1.0Mortality Increase in life expectancy at age 65 by one year 3.0 1.3 3.0 1.2
Changes in the assumptions used in the valuation due to external factors would affect the carrying value of the scheme. The most significant risks are:• Market factors (movements in equity and bond markets): 80% of the scheme’s assets are invested in global equities and the
scheme’s liabilities are measured with reference to corporate bond yields. The performance of both of these asset classes can be volatile. Underperformance of either of these markets would have an adverse impact on the carrying value of the scheme.
• Inflation: Deferred pensions and pensions in payment increase at specified periods in line with inflation subject to certain caps and floors in place. Changes in inflation may impact scheme liabilities.
• Life expectancy: Change in the life expectancy of the scheme’s members may impact scheme liabilities.
The weighted average duration of the benefit payments reflected in the scheme liabilities is 18 years.

Close Brothers Group plc Annual Report 2016120
The Notes continued
26. Share-based awardsThe 1995 Executive Share Option Scheme (“ESOS”), Save As You Earn (“SAYE”) scheme, 2009 Long Term Incentive Plan (“LTIP”), Deferred Share Awards (“DSA”) and Share Matching Plan (“SMP”) share-based awards have been granted under the group’s share schemes. The general terms and conditions for these share-based awards are described in the Report of the Board on Directors’ Remuneration on pages 60 to 81.
In order to satisfy a number of the awards below the company has purchased company shares into Treasury and the Close Brothers Group Employee Share Trust has purchased company shares. At 31 July 2016, 0.7 million (2015: 1.2 million) and 2.4 million (2015: 1.7 million) of these shares were held respectively and in total £37.2 million (2015: £25.6 million) was recognised within the share-based payments reserve. During the year £12.9 million (2015: £20.5 million) of these shares were released to satisfy share-based awards to employees. The share-based payments reserve as shown in the consolidated statement of changes in equity also includes the cumulative position in relation to unvested share-based awards charged to the consolidated income statement of £22.9 million (2015: £21.1 million). The share-based awards charge of £6.2 million (2015: £7.8 million) is included in administrative expenses shown in the consolidated income statement.
Movements in the number of share-based awards outstanding and their weighted average share prices are as follows:
ESOS SAYE LTIP DSA1 SMP
Number
Weightedaverageexercise
price Number
Weightedaverageexercise
price Number
Weightedaverageexercise
price Number
Weightedaverageexercise
price Number
Weightedaverageexercise
price
At 1 August 2014 133,656 655.6p 1,300,340 825.4p 2,047,693 – 730,860 – 1,295,613 –Granted – – 272,172 1,143.0p 510,680 – 276,675 – 373,938 –Exercised (13,147) 656.0p (389,471) 559.0p (796,622) – (435,116) – (541,517) –Forfeited – – (37,614) 1,049.2p – – (18,539) – – –Lapsed (120,509) 655.5p (66,703) 940.5p (52,932) – – – (18,001) –
At 31 July 2015 – – 1,078,724 – 1,708,819 – 553,880 – 1,110,033 –
Granted – – 282,824 1,197.0p 458,171 – 288,188 – 368,967 –Exercised – – (170,580) 683.0p (664,198) – (294,066) – (337,322) –Forfeited – – (152,374) 1,103.0p (908) – (9,367) – – –Lapsed – – (5,124) 1,064.8p (38,429) – – – (5,855) –
At 31 July 2016 – – 1,033,470 – 1,463,455 – 538,635 – 1,135,823 –
Exercisable at:31 July 2016 – – – – – – 11,461 – – –31 July 2015 – – 658 547.0p 13,878 – 38,471 – – –
1 Includes all awards made under the group’s DSA and Matching and Restricted awards granted to new employees on commencement of employment with the group.
The table below shows the weighted average market price at the date of exercise:
2016 2015
ESOS – 1,430.0pSAYE 1,356.9p 1,513.4pLTIP 1,453.6p 1,480.9pDSA 1,481.2p 1,463.2pSMP 1,539.7p 1,470.5p

Close Brothers Group plc Annual Report 2016S
trategicR
eportG
overnanceFinancial
Statem
ents121
The range of exercise prices and weighted average remaining contractual life of awards and options outstanding are as follows:
2016 Options outstanding
2015 Options outstanding
Numberoutstanding
Weightedaverage
remainingcontractual
lifeYears
Numberoutstanding
Weightedaverage
remainingcontractual
lifeYears
SAYEBetween £5 and £6 31,635 0.8 71,327 1.4Between £6 and £7 18,919 1.8 141,035 1.1Between £9 and £10 266,807 1.5 304,139 2.5Between £11 and £12 716,109 2.4 562,223 3.0LTIPNil 1,463,455 2.2 1,708,819 2.1DSANil 538,635 1.6 553,880 1.4SMPNil 1,135,823 2.1 1,110,033 2.2
Total 4,171,383 2.1 4,451,456 2.1
For the share-based awards granted during the year, the weighted average fair value of those options at 31 July 2016 was 937.1p (2015: 945.2p). The main assumptions for the valuation of these share-based awards comprised:
Exercise periodShare price
at issueExercise
priceExpected
volatility
Expectedoption life in years
Dividendyield
Risk freeinterest rate
SAYE1 December 2018 to 31 May 2019 1,495.0p 1,197.0p 20.0% 3 3.6% 0.7%1 December 2020 to 31 May 2021 1,495.0p 1,197.0p 21.0% 5 3.6% 1.2%LTIP29 September 2018 to 28 September 2019 1,470.0p – 20.0% 3 3.6% 0.8%29 September 2020 to 28 September 2021 1,470.0p – 20.0% 5 3.6% 1.3%DSA29 September 2016 to 28 September 2019 1,493.4p – – – – –21 November 2016 to 20 November 2018 1,580.3p – – – – –15 March 2016 to 14 March 2019 1,497.0p – – – – –SMP29 September 2018 to 29 September 2019 1,470.0p – 20.0% 3 3.6% 0.8%
Expected volatility was determined mainly by reviewing share price volatility for the expected life of each option up to the date of grant.

Close Brothers Group plc Annual Report 2016122
The Notes continued
27. Consolidated cash flow statement reconciliation31 July
2016 £ million
31 July2015
£ million
(a) Reconciliation of operating profit before tax to net cash inflow from operating activities Operating profit before tax from continuing operations 228.5 219.9Profit before tax on discontinued operations – 11.6Tax paid (53.7) (53.4)Depreciation and amortisation 49.1 41.4(Increase)/decrease in:Interest receivable and prepaid expenses (16.0) (4.2)Net settlement balances and trading positions (9.7) 22.8Net loans to/from money broker against stock advanced 16.0 (2.9)Interest payable and accrued expenses 3.2 8.2
Net cash inflow from trading activities 217.4 243.4(Increase)/decrease in:Loans and advances to banks not repayable on demand (26.7) 1.6Loans and advances to customers (693.8) (448.1)Assets let under operating leases (51.9) (39.8)Certificates of deposit (85.7) (115.3)Gilts 20.0 25.0Other assets less other liabilities 28.9 (19.1)Increase/(decrease) in:Deposits by banks 36.0 (14.5)Deposits by customers 413.2 (23.0)Loans and overdrafts from banks 87.9 371.8Debt securities in issue, net of transaction costs 35.9 –
Net cash inflow from operating activities (18.8) (18.0)
(b) Analysis of net cash outflow in respect of the purchase of subsidiaries and non-controlling interests
Cash consideration paid (3.6) (1.0)
(c) Analysis of net cash inflow in respect of the sale of a subsidiaryCash consideration received 2.4 36.9Cash and cash equivalents disposed of (0.1) (13.7)
2.3 23.2
(d) Analysis of changes in financing activitiesShare capital (including premium), group bond and subordinated loan capital1:Opening balance 566.6 596.5Prepayment of subordinated loan capital – (30.0)Shares issued for cash – 0.1
566.6 566.6
(e) Analysis of cash and cash equivalents2
Cash and balances at central banks 840.6 1,031.2Loans and advances to banks repayable on demand 82.7 72.5
923.3 1,103.7
1 Excludes accrued interest.2 Excludes Bank of England cash reserve account and amounts held as collateral.

Close Brothers Group plc Annual Report 2016S
trategicR
eportG
overnanceFinancial
Statem
ents123
28. Financial risk managementAs a financial services group, financial instruments are central to the group’s activities. The risk associated with financial instruments represents a significant component of those faced by the group and is analysed in more detail below.
The group’s financial risk management objectives are summarised within the Risk and Control Framework in Corporate Governance on pages 51 and 52. Details of the significant accounting policies and methods adopted, including the criteria for recognition, the basis of measurement and the basis on which income and expenses are recognised, in respect of each class of financial asset, financial liability and equity instrument are disclosed in note 1.
(a) ClassificationThe following tables analyse the group’s assets and liabilities in accordance with the categories of financial instruments in IAS 39.
Held for trading
£ million
Designated at fair value
through profit or
loss £ million
Available for sale
£ million
Loans and receivables
£ million
Held at amortised
cost £ million
Derivatives held for hedging £ million
Total £ million
At 31 July 2016AssetsCash and balances at central banks – – – 847.4 – – 847.4Settlement balances – – – 478.1 – – 478.1Loans and advances to banks – – – 121.5 – – 121.5Loans and advances to customers – – – 6,431.6 – – 6,431.6Debt securities 20.3 – – 201.0 – – 221.3Equity shares 26.1 0.1 2.0 – – – 28.2Loans to money brokers against stock advanced – – – 52.4 – – 52.4Derivative financial instruments 4.8 – – – – 39.9 44.7Other financial assets – – – 42.3 – – 42.3
51.2 0.1 2.0 8,174.3 – 39.9 8,267.5
LiabilitiesSettlement balances and short positions 19.3 – – – 456.3 – 475.6Deposits by banks – – – – 71.1 – 71.1Deposits by customers – – – – 4,894.6 – 4,894.6Loans and overdrafts from banks – – – – 469.1 – 469.1Debt securities in issue – – – – 1,422.8 – 1,422.8Loans from money brokers against stock
advanced – – – – 30.0 – 30.0Subordinated loan capital – – – – 46.4 – 46.4Derivative financial instruments 6.1 0.1 – – – 10.1 16.3Other financial liabilities – – – – 124.8 – 124.8
25.4 0.1 – – 7,515.1 10.1 7,550.7

Close Brothers Group plc Annual Report 2016124
The Notes continued
28. Financial risk management continued
Held for trading
£ million
Designated at fair value
through profit or loss
£ million
Available for sale
£ million
Loans and receivables
£ million
Held at amortised
cost £ million
Derivatives held for
hedging £ million
Total £ million
At 31 July 2015AssetsCash and balances at central banks – – – 1,038.0 – – 1,038.0Settlement balances – – – 398.3 – – 398.3Loans and advances to banks – – – 84.6 – – 84.6Loans and advances to customers – – – 5,737.8 – – 5,737.8Debt securities 14.1 – 20.1 115.3 – – 149.5Equity shares 31.1 0.1 10.0 – – – 41.2Loans to money brokers against stock advanced – – – 38.4 – – 38.4Derivative financial instruments 2.3 – – – – 17.4 19.7Other financial assets – – – 36.5 – – 36.5
47.5 0.1 30.1 7,448.9 – 17.4 7,544.0
LiabilitiesSettlement balances and short positions 27.8 – – – 376.5 – 404.3Deposits by banks – – – – 35.1 – 35.1Deposits by customers – – – – 4,481.4 – 4,481.4Loans and overdrafts from banks – – – – 381.2 – 381.2Debt securities in issue – – – – 1,365.0 – 1,365.0Loans from money brokers against stock
advanced – – – – – – –Subordinated loan capital – – – – 46.4 – 46.4Derivative financial instruments 2.9 – – – – 4.2 7.1Other financial liabilities – – – – 105.0 – 105.0
30.7 – – – 6,790.6 4.2 6,825.5
(b) ValuationThe fair values of the group’s financial assets and liabilities are not materially different from their carrying values, with the exception of the following:
31 July 2016 31 July 2015
Fair value
Carrying value
Fair value
Carrying value
Subordinated loan capital 52.4 46.4 56.9 46.4Debt securities in issue 1,432.2 1,422.8 1,383.3 1,365.0
Valuation hierarchyThe group holds financial instruments that are measured at fair value subsequent to initial recognition. Each instrument has been categorised within one of three levels using a fair value hierarchy that reflects the significance of the inputs used in making the measurements. These levels are based on the degree to which the fair value is observable and are defined as follows:• Level 1 fair value measurements are those derived from quoted prices (unadjusted) in active markets for identical assets or
liabilities where prices are readily available and represent actual and regularly occurring market transactions on an arm’s length basis. An active market is one in which transactions occur with sufficient frequency to provide ongoing pricing information;
• Level 2 fair value measurements are those derived from quoted prices in less active markets for identical assets or liabilities or those derived from inputs other than quoted prices that are observable for the asset or liability, either directly as prices or indirectly derived from prices; and
• Level 3 fair value measurements are those derived from valuation techniques that include inputs for the asset or liability that are not based on observable market data (“unobservable inputs”).
Investments classified as Level 1 predominantly comprise UK government securities and liquid listed equity shares.
Investments classified as Level 2 predominantly comprise less liquid listed equity shares, investment grade corporate bonds and over the counter derivatives.

Close Brothers Group plc Annual Report 2016S
trategicR
eportG
overnanceFinancial
Statem
ents125
At 31 July 2016, investments classified as Level 3 predominantly comprise a legacy investment property fund. The valuation of this investment is determined using its net asset value which is updated quarterly. The group believes that there is no reasonably possible change to the inputs used in the valuation of this position which would have a material effect on the group’s consolidated income statement.
In 2016 a number of listed equity shares have been classified as Level 2 (classified as Level 1 in 2015) following an assessment of the frequency of transactions in these shares. The prior year has been re-presented for comparability. Aside from this there were no significant transfers between Level 1, 2 and 3 in 2016 and 2015.
The tables below show the classification of financial instruments held at fair value into the valuation hierarchy.
Level 1 £ million
Level 2 £ million
Level 3 £ million
Total £ million
At 31 July 2016AssetsDebt securities:Long positions in debt securities held for trading 16.1 4.2 – 20.3Gilts classified as available for sale – – – –Equity shares:Held for trading 3.4 22.7 – 26.1Fair value through profit or loss – 0.1 – 0.1Available for sale – – 2.0 2.0Derivative financial instruments – 44.7 – 44.7
19.5 71.7 2.0 93.2
LiabilitiesShort positions held for trading:Debt securities 3.0 2.8 – 5.8Equity shares 3.7 9.8 – 13.5Derivative financial instruments – 16.3 – 16.3
6.7 28.9 – 35.6
Level 1 £ million
Level 2 £ million
Level 3 £ million
Total £ million
At 31 July 2015AssetsDebt securities:Long positions in debt securities held for trading 12.6 1.5 – 14.1Gilts classified as available for sale 20.1 – – 20.1Equity shares:Held for trading 6.1 25.0 – 31.1Fair value through profit or loss – 0.1 – 0.1Available for sale – – 10.0 10.0Derivative financial instruments – 19.7 – 19.7
38.8 46.3 10.0 95.1
LiabilitiesShort positions held for trading:Debt securities 11.3 2.4 – 13.7Equity shares 3.9 10.2 – 14.1Derivative financial instruments – 7.1 – 7.1
15.2 19.7 – 34.9

Close Brothers Group plc Annual Report 2016126
The Notes continued
28. Financial risk management continuedMovements in financial assets categorised as Level 3 were:
Equity shares
Availablefor sale
£ million
Fair valuethrough
profit/(loss)£ million
At 1 August 2014 19.5 0.1Total gains recognised in the consolidated income statement (0.9) –Total gains recognised in other comprehensive income (0.5) –Sales and settlements (8.1) –Transfers out – (0.1)
At 31 July 2015 10.0 –Total losses recognised in the consolidated income statement (0.3) –Total losses recognised in other comprehensive income – –Sales and settlements (7.7) –Transfers out – –
At 31 July 2016 2.0 –
The losses recognised in the consolidated income statement relating to instruments held at the year end amounted to £0.3 million (2015: £0.9 million).
(c) Credit riskCredit risk is the risk of a reduction in earnings and/or value, as a result of the failure of a counterparty or associated party with whom the group has contracted to meet its obligations as they fall due. Credit risk across the group mainly arises through the lending and treasury activities of the Banking division.
The Banking division applies consistent and prudent lending criteria to mitigate credit risk. Its lending activities are predominantly secured across a diverse range of asset classes and are generally short term in nature with low average loan size. This ensures concentration risk is controlled in both the loan book and associated collateral.
The group has established limits for all counterparties with whom it places deposits, enters into derivative contracts or whose debt securities are held and the credit quality of the counterparties is monitored. While these amounts may be material, the counterparties are all regulated institutions with high credit ratings assigned by international credit rating agencies and fall within the large exposure limits set by regulatory requirements.
Credit risk in the Securities division is limited as Winterflood trade in the cash markets with regulated counterparties on a delivery versus payment basis such that any counterparty risk is limited to price movements in the underlying securities. Counterparty exposure and settlement failure monitoring controls are in place.

Close Brothers Group plc Annual Report 2016S
trategicR
eportG
overnanceFinancial
Statem
ents127
Maximum exposure to credit riskThe table below presents the group’s maximum exposure to credit risk, before taking account of any collateral and credit risk mitigation, arising from its on balance sheet and off balance sheet financial instruments. For off balance sheet instruments, the maximum exposure to credit risk represents the contractual nominal amounts.
31 July2016
£ million
31 July2015
£ million
On balance sheetCash and balances at central banks 847.4 1,038.0Settlement balances 478.1 398.3Loans and advances to banks 121.5 84.6Loans and advances to customers 6,431.6 5,737.8Debt securities 221.3 149.5Loans to money brokers against stock advanced 52.4 38.4Derivative financial instruments 44.7 19.7Other financial assets 42.3 36.5
8,239.3 7,502.8Off balance sheetUndrawn commitments 962.7 862.4
Total maximum exposure to credit risk 9,202.0 8,365.2
Assets pledged and received as collateralThe group pledges assets for repurchase agreements and securities borrowing agreements which are generally conducted under terms that are customary to standard securitised borrowing contracts.
The group has securitised without recourse £1,443.9 million (31 July 2015: £1,164.8 million) of its insurance premium and motor loan receivables in return for debt securities in issue of £1,015.9 million (31 July 2015: £847.7 million), which includes £168.1 million (31 July 2015: £nil) debt securities in issue retained for liquidity purposes. As the group has retained exposure to substantially all the credit risk and rewards of the residual benefit of the underlying assets it continues to recognise these assets in loans and advances to customers in its consolidated balance sheet.
The group accesses the Funding for Lending Scheme which enables it to borrow highly liquid UK Treasury Bills from the Bank of England in exchange for eligible collateral. At 31 July 2016, asset finance loan receivables of £737.4 million (31 July 2015: £705.6 million) and some of the £168.1 million (31 July 2015: £nil) debt securities in issue retained for liquidity purposes were positioned in exchange for £451.0 million (31 July 2015: £375.0 million) Treasury Bills drawn. The term of these transactions is four years from the date of drawdown. The group also had repurchase agreements whereby the Treasury Bills were lent in exchange for cash included within loans and overdrafts from banks. The Treasury Bills are not recorded on the group’s consolidated balance sheet as ownership remains with the Bank of England. The risk and rewards of the loans and advances to customers remain with the group and continue to be recognised in the consolidated balance sheet.
Loans to money brokers against stock advanced of £52.4 million (31 July 2015: £38.4 million) is the cash collateral provided to these institutions for stock borrowing by Winterflood. The stock borrowing to which the cash deposits relate is short-term in nature and is recorded at the amount payable.
The majority of loans and advances to customers are secured against specific assets. The security will correspond to the type of lending as detailed in the segmental loan book analysis on page 23 of the Strategic Report. Consistent and prudent lending criteria are applied across the whole loan book with emphasis on the quality of the security provided.

Close Brothers Group plc Annual Report 2016128
The Notes continued
28. Financial risk management continuedFinancial assets: Loans and advances to customersCredit risk management and monitoringThe overall credit risk appetite is set by the group board. The monitoring of credit policy is the responsibility of the Banking division’s risk and compliance committees. All large loans are subject to approval by the Banking division’s credit committees. Retail, Commercial and Property Finance each use credit underwriting and monitoring measures appropriate to the diverse and specialised nature of their lending.
The Banking division has a dual approach to mitigating credit risk by:• Lending on a secured basis with emphasis on both the customer’s ability to repay and the quality of the underlying security
to minimise any loss should the customer not be able to repay; and• Where the security collateralising a loan is less tangible, or in cases of higher loan to valuation (“LTV”), greater scrutiny is
applied both analytically and in terms of escalation of sanctioning authority.
The Banking division’s collections and recoveries processes are designed to provide a fair, consistent and effective operation for arrears management. The Banking division seeks to engage in early communication with borrowers experiencing difficulty in meeting their repayments, to obtain their commitment to maintaining or re-establishing a regular payment plan.
The Banking division maintains a forbearance policy to support customers in financial difficulty and ensures the necessary processes and policies are in place to enable consistently fair treatment of each customer. At the same time, the Banking division ensures these processes and policies do not restrict the ability to manage customers based on their individual circumstances. This includes considering whether it is appropriate to change the terms and conditions of a loan, e.g. by extending its term, changing the type of loan, deferring interest or by capitalising arrears to assist a customer in financial difficulties. The Banking Division seeks to ensure that any forbearance results in a fair outcome for the customer and will not repossess an asset unless all other reasonable attempts to resolve the position have failed. The loan loss provision takes account of the credit risk that arises from forbearance. At 31 July 2016, and following a review of the forbearance policy during the year, the gross carrying amount of exposures with forbearance measures was £123.5 million (31 July 2015: £109.2 million).
Retail Finance is predominantly high volume secured lending with a small average loan size. Credit issues are identified early via largely automated tracking processes. Remedial actions are implemented promptly to restore customers to a performing status or recovery methods are applied to minimise potential loss.
Commercial Finance is a combination of several niche lending businesses with a diverse mix of loans in terms of assets financed, and average loan size and LTV percentage. Credit quality is predominately assessed on an individual loan by loan basis. Recovery activity is executed promptly by experts in the specialised assets. This approach allows remedial action to be implemented at the appropriate time to minimise potential loss.
Property Finance is a portfolio of higher value, low volume lending with credit quality assessed on an individual loan by loan basis. Loans are continually monitored to determine whether they are performing satisfactorily.
In Property and Commercial Finance performing loans with elevated levels of credit risk may be placed on watch lists depending on the perceived severity of the credit risk.
Much of the Banking division’s lending is short term and the average loan size is small with the result that individual loans have little capacity to materially impact the group’s earnings.
Credit risk reportingLoans and advances to customers, as disclosed in note 11, are analysed between the following categories for credit risk reporting:
(i) Neither past due nor impairedThese loans and advances to customers reflect the application of consistent and conservative lending criteria on inception and the quality and level of security held. The contractual repayments are monitored to ensure that classification as neither past due nor impaired remains appropriate and also demonstrates the short-term nature of the lending, with £3.5 billion (2015: £3.1 billion) having a contractual maturity of less than 12 months.

Close Brothers Group plc Annual Report 2016S
trategicR
eportG
overnanceFinancial
Statem
ents129
The following table shows the ageing of loans and advances to customers split by credit assessment method which are neither past due nor impaired.
31 July 2016 Loans and advances to customers
31 July 2015 Loans and advances to customers
Individuallyassessed
£ million
Collectivelyassessed
£ millionTotal
£ million
Individuallyassessed
£ million
Collectivelyassessed
£ millionTotal
£ million
Within one month 454.7 279.6 734.3 512.0 269.4 781.4Between one and three months 441.1 422.0 863.1 250.6 385.3 635.9Between three months and one year 894.9 1,054.9 1,949.8 729.6 960.2 1,689.8Over one year 813.0 1,776.8 2,589.8 642.4 1,660.4 2,302.8
2,603.7 3,533.3 6,137.0 2,134.6 3,275.3 5,409.9
(ii) Past due but not impairedLoans and advances to customers are classified as past due but not impaired when the customer has failed to make a payment when contractually due but there is no evidence of impairment. This includes loans which are individually assessed for impairment but where the value of security is sufficient to meet the required repayments. This also includes loans to customers which are past due for technical reasons such as delays in payment processing or rescheduling of payment terms.
The following table shows the ageing of loans and advances to customers split by credit assessment method which are past due but for which no impairment provision has been raised.
31 July 2016 Loans and advances to customers
31 July 2015 Loans and advances to customers
Individuallyassessed
£ million
Collectivelyassessed
£ millionTotal
£ million
Individuallyassessed
£ million
Collectivelyassessed
£ millionTotal
£ million
Within one month 19.4 7.6 27.0 31.1 14.7 45.8Between one and three months 62.4 9.1 71.5 61.9 4.9 66.8Between three months and one year 42.2 17.4 59.6 41.9 24.7 66.6Over one year 22.2 15.5 37.7 13.9 28.6 42.5
146.2 49.6 195.8 148.8 72.9 221.7
(iii) ImpairedThe factors considered in determining whether assets are impaired are outlined in the accounting policies in note 1(k). Impaired loans and advances to customers are analysed according to whether the impairment provisions are individually or collectively assessed.
Individually assessed provisions are determined on a case by case basis, taking into account the financial condition of the customer and an estimate of potential recovery from the realisation of security. Typically this methodology is applied by the Property Finance business and by the invoice finance business within Commercial Finance.
Collectively assessed provisions are considered on a portfolio basis, to reflect the homogeneous nature of the assets. A percentage of the portfolio is impaired by evaluating the ageing of missed payments combined with the historical recovery rates for that particular portfolio as discussed in note 2(a). Typically this methodology is applied by the Retail Finance businesses and the asset finance business within Commercial Finance.
The gross impaired loans are quoted without taking account of any collateral or security held, which could reduce the potential loss. The application of conservative LTV ratios on inception and the emphasis on the quality of the security provided are reflected in the low provision to gross impaired balance ratio (“coverage ratio”) of 38% (2015: 35%).
The following table shows gross impaired loans and advances to customers and the provision thereon split by assessment method.
31 July 2016 Loans and advances to customers
31 July 2015 Loans and advances to customers
Individuallyassessed
£ million
Collectivelyassessed
£ millionTotal
£ million
Individuallyassessed
£ million
Collectivelyassessed
£ millionTotal
£ million
Gross impaired loans 75.4 83.1 158.5 69.7 92.6 162.3Provisions (37.4) (22.3) (59.7) (34.7) (21.4) (56.1)
Net impaired loans 38.0 60.8 98.8 35.0 71.2 106.2

Close Brothers Group plc Annual Report 2016130
The Notes continued
28. Financial risk management continuedThe amount of interest income accrued on impaired loans and advances to customers was £16.2 million (31 July 2015: £14.6 million).
The group holds collateral against loans and advances to customers in the form of residential and commercial property and charges over business assets such as equipment, inventory and accounts receivable. Analysis by LTV ratio is provided below based on the group’s lending facilities to customers where the exposure at origination exceeded £1.0 million, excluding Property Finance facilities written pre 2009. Lending below this threshold has greater homogeneity predominately in the motor and premium finance businesses with typical LTV ratio between 80% to 90%. The value of collateral used in determining the LTV ratio is based upon data captured at loan origination, or where available, a more recent updated valuation.
Gross loans and advances to customers where exposure at origination exceeded £1.0 million:
Assetfinance
£ million
Invoicefinance
£ millionProperty£ million
Total£ million
LTVLess than 70% 68.9 134.2 1,228.1 1,431.270% to 90% 115.7 182.5 25.1 323.3Greater than 90% 139.3 4.0 – 143.3
At 31 July 2016 323.9 320.7 1,253.2 1,897.8
Assetfinance
£ million
Invoicefinance
£ millionProperty£ million
Total£ million
LTVLess than 70% 59.3 149.8 1,002.6 1,211.770% to 90% 75.5 126.9 20.3 222.7Greater than 90% 88.2 2.3 – 90.5
At 31 July 2015 223.0 279.0 1,022.9 1,524.9
Financial assets: Settlement balancesCredit risk management and monitoringThe credit risk presented by settlement balances in the Securities division is limited as such balances represent delivery versus payment transactions where delivery of securities occurs simultaneously with payment. The credit risk is therefore limited to the change in market price of a security between trade date and settlement date and not the absolute value of the trade. Winterflood is a market-maker and trades on a principal only basis with regulated counterparties including stockbrokers, wealth managers, institutions and hedge funds who are either authorised and regulated by the PRA and/or FCA or equivalent regulator in the respective country.
Credit risk reportingSettlement balances are classified as neither past due nor impaired when the respective trades have not yet reached their settlement date. Settlement balances are classified as past due but not impaired when trades fail to be settled on their contractual settlement date. The credit risk presented by settlement balances which are past due is mitigated by the delivery versus payment mechanism, as well as by Winterflood trading only with regulated counterparties. Counterparty exposure and settlement failure monitoring controls are in place as part of an overall risk management framework and settlement balances past due are actively managed.
The following table shows the ageing of settlement balances:
31 July 2016 31 July 2015
Neither pastdue nor
impaired£ million
Past duebut not
impaired£ million
Total£ million
Neither pastdue nor
impaired£ million
Past duebut not
impaired£ million
Total£ million
Within one month 449.9 25.8 475.7 378.9 16.2 395.1Between one and three months – 1.0 1.0 – 1.0 1.0Between three months and one year – 0.6 0.6 – 0.9 0.9Over one year – 0.8 0.8 – 1.3 1.3
449.9 28.2 478.1 378.9 19.4 398.3

Close Brothers Group plc Annual Report 2016S
trategicR
eportG
overnanceFinancial
Statem
ents131
(d) Market riskMarket risk is the risk that a change in the value of an underlying market variable, such as interest or foreign exchange rates, will give rise to an adverse movement in the value of the group’s assets and arises primarily in the Securities division.
Interest rate riskThe group’s exposure to interest rate fluctuations relates primarily to the returns from its capital and reserves. The group’s policy is to match repricing characteristics of assets and liabilities naturally where possible or by using interest rate swaps where necessary to secure the margin on its loans and advances to customers. These interest rate swaps are disclosed in note 14.
The sensitivities below are based upon reasonably possible changes in interest rate scenarios, including parallel shifts in the yield curve. Changes in interest rates compared to actual rates would increase/(decrease) the group’s annual net interest income by the following amounts:
2016£ million
2015£ million
1.0% increase 4.7 4.30.5% decrease (2.4) (2.2)
Changes in interest rates compared to actual rates would increase/(decrease) the group’s equity by the following amounts:
2016£ million
2015£ million
1.0% increase 8.7 11.30.5% decrease (4.3) (5.7)
Foreign currency riskThe group has a limited number of currency investments and has chosen not to hedge these exposures. These investments are predominantly in euros. Foreign exchange differences which arise from the translation of these operations are recognised directly in equity.
A change in the euro exchange rate would decrease the group’s equity by the following amounts:
2016£ million
2015£ million
20% strengthening of sterling against the euro (2.6) (5.6)
The group has additional material currency assets and liabilities primarily as a result of treasury operations in the Banking division. These assets and liabilities are matched by currency, using exchange rate derivative contracts where necessary. Details of these contracts are disclosed in note 14. Other potential group exposures arise from share trading settled in foreign currency in the Securities division, and foreign currency equity investments. The group has policies and processes in place to manage foreign currency risk, and as such the impact of any reasonably expected exchange rate fluctuations would not be material.
Market price risksTrading financial instruments: Equity shares and debt securitiesThe group’s trading activities relate to Winterflood. The following table shows the group’s trading book exposure to market price risk.
Highestexposure£ million
Lowestexposure£ million
Averageexposure£ million
Exposureat 31 July£ million
For the year ended 31 July 2016Equity sharesLong 55.6 25.2 35.0 26.1Short 25.3 7.1 12.6 13.5
22.4 12.6
Debt securitiesLong 27.3 10.6 15.0 20.3Short 14.1 7.0 10.3 5.8
4.7 14.5

Close Brothers Group plc Annual Report 2016132
The Notes continued
28. Financial risk management continuedHighest
exposure£ million
Lowestexposure£ million
Averageexposure£ million
Exposureat 31 July
£ million
For the year ended 31 July 20151
Equity sharesLong 53.7 27.7 37.1 31.1Short 44.0 9.5 16.2 14.1
20.9 17.0
Debt securitiesLong 50.2 14.0 25.4 14.1Short 56.2 2.9 27.5 13.7
(2.1) 0.4
1 2015 exposures exclude Seydler which was disposed of in January 2015.
With respect to the long and short positions on debt securities £1.7 million and £0.1 million (2015: £2.7 million and £0.6 million) were due to mature within one year respectively.
The average exposure has been calculated on a daily basis. The highest and lowest exposures occurred on different dates and therefore a net position of these exposures does not reflect a spread of the trading book.
Based upon the trading book exposure given above, a hypothetical fall of 10% in market prices would result in a £1.3 million decrease (2015: £1.7 million decrease) in the group’s income and net assets on the equity trading book and a £nil impact (2015: £nil) on the debt securities trading book. However, the group’s trading activity is mainly market-making where positions are managed throughout the day on a continuous basis. Accordingly, the sensitivity referred to above is purely hypothetical.
Non-trading financial instrumentsNet gains and losses on non-trading financial instruments are disclosed in notes 12 and 13.
(e) Liquidity riskLiquidity risk is the risk that liabilities cannot be met when they fall due or can only be met at an uneconomic price and arises mainly in the Banking division.
The group has a prudent liquidity position with total available funding at 31 July 2016 of £8.2 billion (31 July 2015: £7.5 billion). This funding is significantly in excess of its loans and advances to customers at 31 July 2016 of £6.4 billion (31 July 2015: £5.7 billion). The group has a large portfolio of high quality liquid assets principally including cash placed on deposit with the Bank of England. The group measures liquidity risk with a variety of measures including regular stress testing and cash flow monitoring, and reporting to both the group and divisional boards.
The following table analyses the contractual maturities of the group’s on balance sheet financial liabilities on an undiscounted cash flow basis.
Ondemand£ million
In lessthan three
months£ million
In more than three
months but not more
than six months
£ million
In more than six
months but not more than one
year£ million
In more than
one year but not
more than five years
£ million
In morethan five
years£ million
Total£ million
At 31 July 2016Settlement balances – 456.3 – – – – 456.3Deposits by banks 31.8 1.9 15.8 11.0 10.9 – 71.4Deposits by customers 124.7 925.6 741.3 1,419.8 1,765.1 – 4,976.5Loans and overdrafts from banks 11.0 208.0 75.2 86.1 90.9 – 471.2Debt securities in issue – 10.1 9.0 572.5 851.7 42.2 1,485.5Loans from money brokers against stock
advanced 30.0 – – – – – 30.0Subordinated loan capital – 1.7 – 1.7 13.6 62.0 79.0Derivative financial instruments 0.2 4.3 2.1 4.3 20.8 1.9 33.6Other financial liabilities 37.2 82.9 2.6 1.0 1.1 – 124.8
Total 234.9 1,690.8 846.0 2,096.4 2,754.1 106.1 7,728.3

Close Brothers Group plc Annual Report 2016S
trategicR
eportG
overnanceFinancial
Statem
ents133
Ondemand£ million
In lessthan three
months£ million
In more than three months but not more
than six months£ million
In more than six months
but not more than one
year£ million
In more than one year but
not more than five
years£ million
In morethan five
years£ million
Total£ million
At 31 July 2015Settlement balances – 376.5 – – – – 376.5Deposits by banks 11.5 1.0 17.6 4.5 0.5 – 35.1Deposits by customers 149.9 832.8 954.8 1,431.1 1,191.8 – 4,560.4Loans and overdrafts from banks 8.6 99.4 124.1 0.3 152.6 – 385.0Debt securities in issue – 10.1 9.3 19.3 1,124.2 311.6 1,474.5Loans from money brokers against stock
advanced – – – – – – –Subordinated loan capital – 1.7 – 1.7 13.6 65.4 82.4Derivative financial instruments – 7.7 1.8 4.0 25.4 5.9 44.8Other financial liabilities 32.9 64.9 2.7 1.3 1.8 0.2 103.8
Total 202.9 1,394.1 1,110.3 1,462.2 2,509.9 383.1 7,062.5
Derivative financial instruments in the table above includes net currency swaps. The following table shows the currency swaps on a gross basis:
On demand £ million
In less than three
months £ million
In more than three months but not more
than six months £ million
In more than six months
but not more than one
year £ million
In more than one year but
not more than five
years £ million
In more than five
years £ million
Total £ million
At 31 July 2016 19.5 62.2 2.1 4.3 20.8 1.9 110.8At 31 July 2015 – 174.3 1.8 4.0 25.4 5.9 211.4
29. Company transition to FRS 102For all periods up to and including the year ended 31 July 2015 the company prepared its financial statements in accordance with previously extant United Kingdom Generally Accepted Accounting Practice (“UK GAAP”). This is the first year that the company has presented its results under FRS 102. The date of transition was 1 August 2014. The company has taken advantage of FRS 102 transitional provision to account for its investment in subsidiaries at deemed cost, which is the carrying amount at the date of transition as determined under UK GAAP.
The company has applied the accounting policies disclosed in note 1 where applicable, as they are consistent with FRS 102 with the exception of tax on share-based payments which is similar to UK GAAP. There are no changes in accounting policies which require reconciliation of profit after tax for the year ended 31 July 2015, and shareholders’ funds at 1 August 2014 and 31 July 2015, between UK GAAP as previously reported and FRS 102.
Reclassification of interest free loan to subsidiaryFollowing the adoption of FRS 102, the interest free loan to subsidiary that was previously presented as fixed assets has been reclassified in the company balance sheet as a current asset. This reclassification has no impact on shareholders’ funds or the profit after tax of the company accounts.
30. Post balance sheet eventOn 16 September 2016, the group agreed the sale of its subsidiary, OLIM Limited (“OLIM”), an investment management company which operates within the Asset Management division, to Albion Ventures LLP. The consideration is subject to the future revenues generated by OLIM. At 31 July 2016 the activities disposed of represented net assets of £0.4 million and operating profit before tax of £0.9 million for the year. The timing for completion is subject to the satisfaction of customary conditions.

Close Brothers Group plc Annual Report 2016134
The Notes continued
GroupClose Brothers Holdings Limited1
Close Derivatives Limited1
Close Securities (Germany) Limited1
Close Securities Holdings Limited1
BankingArrow Audit Services Limited15, 16
Air & General Finance Limited2
Armed Services Finance Limited5
Brook Funding (No.1) Limited13, 16
CBM Holdings Limited1
CLL I Limited1
Close Asset Finance Limited2
Close Brewery Rentals Limited6
Close Brothers Asset Finance GmbH (Germany)1
Close Brothers Factoring GmbH (Germany)1
Close Brothers Finance plc1
Close Brothers Limited1
Close Brothers Military Services Limited5
Close Brothers Technology Services Limited1
Close Business Finance Limited2
Close Credit Management (Holdings) Limited1
Close Finance (CI) Limited (Jersey)1
Close International Bank Holdings Limited (Guernsey)4
Close Invoice Finance Limited1
Close Leasing Limited1
Close Motor Finance Limited5
Close PF Funding I Limited14, 16
Close Trust Nominees Limited1
Commercial Acceptances Limited7
Commercial Finance Credit Limited2
Commercial Vehicle Hire Limited1
Ecasks Limited6
Finance for Industry Limited1
Banking continuedFinance for Industry Services Limited1
Kingston Asset Finance Limited2
Kingston Asset Leasing Limited2
Metropolitan Factors Limited1
Micgate Holdings (UK) Limited1
Orbita Funding 2016-1 plc13, 16
Surrey Asset Finance Limited2
SecuritiesW.S. (Nominees) Limited3
Winterflood Client Nominees Limited3
Winterflood Gilts Limited3
Winterflood Securities Holdings Limited3
Winterflood Securities Limited3
Asset ManagementCavanagh Financial Management Limited8
CBF Wealth Management Limited1
CFSL Management Limited1
Chartwell Private Client Limited1
Close Asset Management Holdings Limited1
Close Asset Management Limited1
Close Asset Management (UK) Limited1
Close Brothers Properties Guernsey Limited (Guernsey)4
Close International Asset Management Holdings Limited (Guernsey)4
Close Investments Limited1
Close Portfolio Management Limited1
Close Properties Jersey Limited (Jersey)9
Lion Nominees Limited1
Mackay Stewart and Brown Limited10
OLIM Limited11
Place Campbell Close Brothers Limited (50% joint venture)12
Registered office: 1 10 Crown Place, London EC2A 4FT, United Kingdom. 2 Wimbledon Bridge House, Hartfield Road, Wimbledon, London SW19 3RU, United Kingdom. 3 The Atrium Building Cannon Bridge, 25 Dowgate Hill, London EC4R 2GA, United Kingdom. 4 1st and 2nd Floors, Elizabeth House, Les Ruettes Brayes, St Peter Port, GY1 1EW, Guernsey. 5 Roman House, Roman Road, Doncaster, South Yorkshire DN4 5EZ, United Kingdom. 6 Unit 1, Kingfisher Park, Headlands Business Park, Ringwood, Hampshire BH24 3NX, United Kingdom. 7 100 George Street, London W1U 8NU, United Kingdom. 8 1st Floor, Lomond House, 9 George Square, Glasgow, Scotland G2 1DY, United Kingdom. 9 47 Esplanade, St Helier JE1 0BD, Jersey.10 Saltire Court, 3rd Floor, West Wing, 20 Castle Terrace, Edinburgh, Scotland EH1 2EN, United Kingdom.11 15 Berkeley Street, London W1J 8DY, United Kingdom.12 Wilmington House, High Street, East Grinstead, West Sussex RH19 3AU, United Kingdom.13 35 Great St. Helen’s, London EC3A 6AP, United Kingdom.14 Wilmington Trust Sp Services (London) Limited, Third Floor, 1 King’s Arms Yard, London EC2R 7AF, United Kingdom.15 145-157 St John Street, London EC1V 4PW, United Kingdom.
Subsidiaries by virtue of control:16 The related undertakings are not considered subsidiaries of the group but are included in the consolidated financial statements as they are controlled by the group.
31. Investments in subsidiariesIn accordance with section 409 of the Companies Act 2006 the following is a list of the group’s subsidiaries at 31 July 2016 which are all wholly-owned and incorporated in the UK unless otherwise stated.

Close Brothers Group plc Annual Report 2016S
trategicR
eportG
overnanceFinancial
Statem
ents135
Glossary
For the Financial Overview, Banking, Securities and Asset Management Adjusted: Adjusted measures are used to increase comparability between periods and exclude amortisation of intangible assets on acquisition, and any goodwill impairments and exceptional items.
Bad debt ratio: Impairment losses on average net loans and advances to customers and operating lease assets.
Compensation ratio: Total staff costs on operating income.
Earnings per share: Profit after tax plus non-controlling interests on number of basic shares.
Exceptional items: Income or costs which are material in size and non-recurring in nature.
Expense/income ratio: Total adjusted operating expenses on operating income.
High quality liquid assets: Assets which qualify as high quality liquid assets for FCA liquidity purposes, including deposits with the Bank of England, gilts and Treasury Bills drawn under the Funding for Lending Scheme.
Leverage ratio: Tier 1 capital as a percentage of total balance sheet assets, adjusting for certain capital deductions, including intangible assets, and off balance sheet exposures.
Net interest margin: Net income generated by lending activities, including net interest income, net fees and commissions and net operating lease income (deducting depreciation), on average net loans and advances to customers and operating lease assets.
Return on net loan book: Adjusted operating profit from lending activities on average net loans and advances to customers and operating lease assets.
Return on opening equity: Adjusted operating profit after tax and non-controlling interests on opening equity, excluding non-controlling interests.
Revenue margin: Income from advice, investment management and related services on total client assets.
Term funding: Funding with a remaining maturity greater than 12 months.
Re-presentation of Treasury Income and Operating Lease AssetsAs announced on 13 September 2016, we have implemented minor changes to the calculation of our key metrics in the Banking division to better represent the contribution of operating lease assets and the role of Treasury. The net interest margin now includes the full amount of Treasury income (2015: £13.4 million), which is allocated to individual lending businesses, reflecting its role as a cost centre. Furthermore, operating lease income has been adjusted to deduct depreciation of operating lease assets (2015: £16.7 million), which is now reported as a cost of sales and included in operating income in the group’s consolidated income statement. The calculation of key ratios has also been adjusted to take into account the value of operating lease assets (2015: average of £115.4 million) on the balance sheet.
These adjustments do not reflect any changes in the underlying business and have no effect on the adjusted operating profit or operating profit before tax, earnings per share, balance sheet or regulatory capital measures.

Close Brothers Group plc Annual Report 2016136
Investor Relations
Financial calendar (provisional)Event Date
First quarter trading update November 2016Annual General Meeting 17 November 2016Final dividend payment 22 November 2016Pre-close trading update January 2017Half year end 31 January 2017Interim results March 2017Third quarter trading update May 2017Pre-close trading update July 2017Financial year end 31 July 2017Preliminary results September 2017
The financial calendar is updated on a regular basis throughout the year. Please refer to our website www.closebrothers.com for up-to-date details.
Cautionary StatementCertain statements included or incorporated by reference within this report may constitute “forward-looking statements” in respect of the group’s operations, performance, prospects and/or financial condition. Forward-looking statements are sometimes, but not always, identified by their use of a date in the future or such words as “anticipates”, “aims”, “due”, “could”, “may”, “will”, “should”, “expects”, “believes”, “intends”, “plans”, “potential”, “targets”, “goal” or “estimates”. By their nature, forward-looking statements involve a number of risks, uncertainties and assumptions and actual results or events may differ materially from those expressed or implied by those statements. Accordingly, no assurance can be given that any particular expectation will be met and reliance should not be placed on any forward-looking statement. Additionally, forward-looking statements regarding past trends or activities should not be taken as a representation that such trends or activities will continue in the future. No responsibility or obligation is accepted to update or revise any forward-looking statement resulting from new information, future events or otherwise. Nothing in this report should be construed as a profit forecast. This report does not constitute or form part of any offer or invitation to sell, or any solicitation of any offer to purchase any shares or other securities in the company, nor shall it or any part of it or the fact of its distribution form the basis of, or be relied on in connection with, any contract or commitment or investment decisions relating thereto, nor does it constitute a recommendation regarding the shares or other securities of the company. Past performance cannot be relied upon as a guide to future performance and persons needing advice should consult an independent financial adviser. Statements in this report reflect the knowledge and information available at the time of its preparation. Liability arising from anything in this report shall be governed by English law. Nothing in this report shall exclude any liability under applicable laws that cannot be excluded in accordance with such laws.

AuditorDeloitte LLP
SolicitorSlaughter and May
Corporate BrokersJ.P. Morgan CazenoveUBS Investment Bank
RegistrarCapita Asset ServicesThe Registry34 Beckenham RoadBeckenhamKent BR3 4TU
Shareholder helpline: 0871 664 0300 (Calls cost 12p per minute plus your phone company’s access charge) From overseas: +44 (0)20 8639 3399Lines are open from 9.00 am to 5.30 pm Monday to Friday, excluding UK public holidaysEmail: [email protected]: www.capitashareportal.com
Registered OfficeClose Brothers Group plc10 Crown PlaceLondon EC2A 4FT
Telephone: +44 (0)20 7655 3100Email: [email protected]: www.closebrothers.com
Company No. 520241
Printed by Park Communications on FSC® certified paper.
Park is EMAS certified; its Environmental Management System is certified to ISO14001.
100% of the inks used are vegetable oil based, 95% of press chemicals are recycled for further use and, on average 99% of any waste associated with this production will be recycled.
This document is printed on Carbon Balanced Regency Satin; a paper made from 10% recycled fibre and 90% virgin fibre sourced from responsibly managed forests, certified in accordance with the Forest Stewardship Council®.
The unavoidable carbon emissions generated during the manufacture and delivery of this document, have been reduced to net zero through a verified carbon offsetting project.
Designed by Emperor Design Consultants Limited.
Typeset by RR Donnelley.
Photography by Richard Davies.

Close B
rothers Group p
lc Annual R
eport 2016
Close Brothers Group plc10 Crown PlaceLondon EC2A 4FTTel: +44 (0)20 7655 3100
www.closebrothers.com
LENDING | DEPOSITS | WEALTH MANAGEMENT | SECURITIES