clipper fund · clipper fund was managed from inception, february 29, 1984, until december 31, 2005...
TRANSCRIPT
Update from Portfolio Managers
Christopher Davis and Danton Goei
Clipper Fund
FALL REVIEW 2018CF
CF | FALL REVIEW 1
This report includes candid statements and observations regarding investment strategies, individual securities, and economic and market conditions; however, there is no guarantee that these statements, opinions or forecasts will prove to be correct. These comments may also include the expression of opinions that are speculative in nature and should not be relied on as statements of fact. 1. Past performance is not a guarantee of future results. Investments cannot be made directly in an index. 2. Returns for periods less than one year are not annualized. Past performance is not a guarantee of future results.
Clipper FundFall Review 2018
Summary• Clipper Fund returned 6.1% in the first seven months of 2018.¹
• Over the last three years, Clipper Fund slightly outperformed the S&P 500 Index with a cumulative return of 43% versus 42% for the index.¹
• Over the most recent one, three and five year periods, a $10,000 investment in the Fund grew to $11,457, $14,295, and $18,227, respectively.¹
• At a time when active management investment strategies are out of favor, historical data indicates actively managed funds may be poised for a rebound.
• Our Portfolio is positioned to take advantage of select opportunities we have identified in today’s market, allowing us to build a concentrated portfolio of extraordinary and durable businesses purchased at discounts to intrinsic value.
Average Annual Total Returns as of July 31, 2018YTD² 1 Year 5 Years 10 Years
Clipper Fund 6.09% 14.57% 12.76% 10.50%S&P 500 Index 6.47% 16.24% 13.12% 10.67%
Average Annual Total Returns as of June 30, 20181 Year 5 Years 10 Years
Clipper Fund 12.85% 12.97% 9.60%The performance presented represents past performance and is not a guarantee of future results. Total return assumes reinvestment of dividends and capital gain distributions. Investment return and principal value will vary so that, when redeemed, an investor’s shares may be worth more or less than their original cost. The total annual operating expense ratio as of the most recent prospectus was 0.71%. The total annual operating expense ratio may vary in future years. Current performance may be higher or lower than the performance quoted. For most recent month-end performance, visit clipperfund.com or call 800-432-2504. The Fund received favorable class action settle-ments from companies that it no longer owns. These settlements had a material impact on the investment performance of the Fund in 2009. This was a one-time event that is unlikely to be repeated. Clipper Fund was managed from inception, February 29, 1984, until December 31, 2005 by another Adviser. Davis Selected Advisers, L.P. took over management of the Fund on January 1, 2006.
2 CF | FALL REVIEW
3. As of July 31, 2018. Clipper Fund was managed from inception, February 29, 1984, until December 31, 2005 by another Adviser. Davis Selected Advisers, L.P. took over management of the Fund on January 1, 2006. Past performance is not a guarantee of future results. 4. Source: Lipper. 5. Includes Davis Advisors, Davis family and Foundation, our employees, and Fund directors who have more than $150 million invested in Clipper Fund. As of June 30, 2018.
Results of Our Investment Discipline
Our investment discipline has built wealth for shareholders over the long term.3
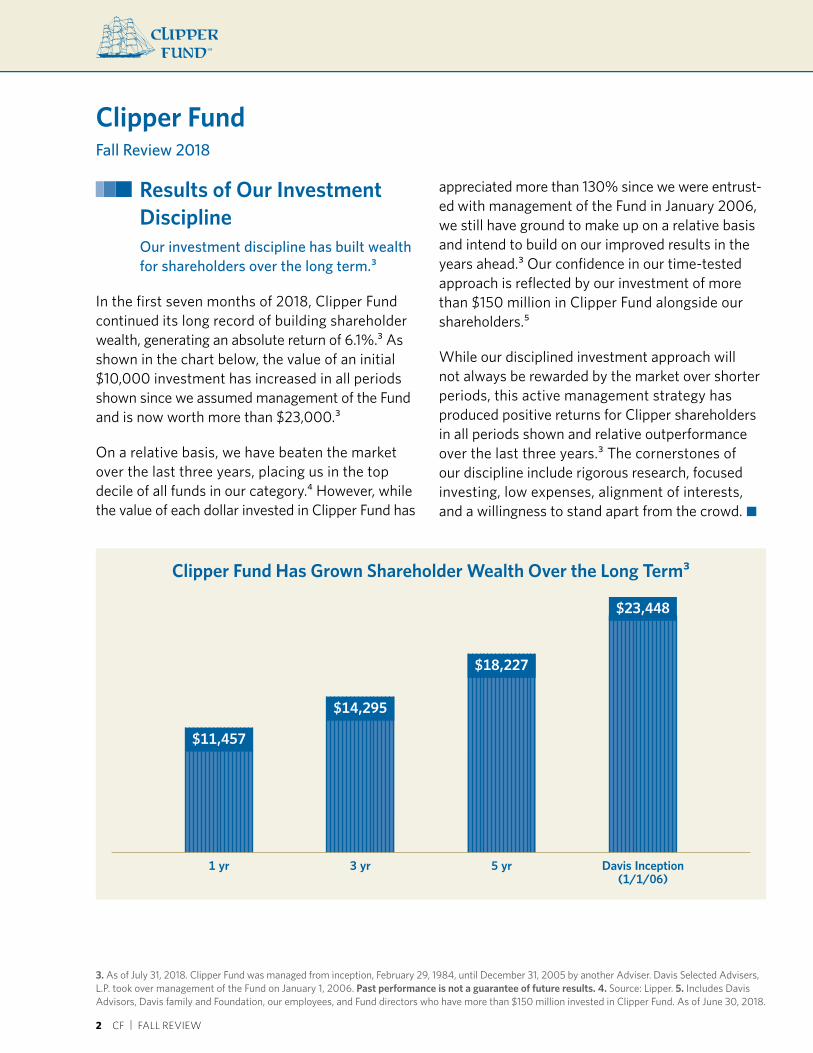
In the first seven months of 2018, Clipper Fund continued its long record of building shareholder wealth, generating an absolute return of 6.1%.3 As shown in the chart below, the value of an initial $10,000 investment has increased in all periods shown since we assumed management of the Fund and is now worth more than $23,000.3
On a relative basis, we have beaten the market over the last three years, placing us in the top decile of all funds in our category.4 However, while the value of each dollar invested in Clipper Fund has
appreciated more than 130% since we were entrusted with management of the Fund in January 2006, we still have ground to make up on a relative basis and intend to build on our improved results in the years ahead.3 Our confidence in our timetested approach is reflected by our investment of more than $150 million in Clipper Fund alongside our shareholders.⁵
While our disciplined investment approach will not always be rewarded by the market over shorter periods, this active management strategy has produced positive returns for Clipper shareholders in all periods shown and relative outperformance over the last three years.3 The cornerstones of our discipline include rigorous research, focused investing, low expenses, alignment of interests, and a willingness to stand apart from the crowd. •
Clipper FundFall Review 2018
1 yr
$11,457
3 yr
$14,295
5 yr
$18,227
Davis Inception(1/1/06)
$23,448
Clipper Fund Has Grown Shareholder Wealth Over the Long Term3
CF | FALL REVIEW 3
Why Now May Be a Good Time to Invest in an Actively Managed Fund like Clipper Fund
Successful longterm investing requires a willingness to look beyond conventional thinking. Today, conventional wisdom argues passive investing is superior to active management. As a result, money has drained out of actively managed funds and poured into passive index funds and exchangetraded funds (ETFs).
While the data showing the S&P 500 Index has outperformed the average active manager over the long term is true, we believe the results are misleading in three important ways.
First, active and passive strategies have historically moved in a cycle. During parts of this cycle such as in the last decade or so, passive strategies tend to outperform. However, during other parts of the cycle, even the average active manager has outperformed the index over long periods of time. In general, the data shows a clear cyclical pattern in which periods of strong passive returns were followed by relatively stronger periods for active management. With the outperformance of passive strategies near an alltime high, the pattern of past cycles indicates the potential wisdom of moving toward active management now.
Second, while active managers tend to under perform when the S&P 500 Index gallops ahead, they tend to outperform when market returns moderate. While the direction of the market is unknowable in the short term, the fact the index has almost doubled in the last five years and the market has gone more than eight years without a 20% correction versus a historical average of twoandahalf years leads us to expect more moderate returns in the years ahead.
Finally, certain active managers have outperformed in the vast majority of rolling 10 year periods. As a result, while the data shows the average active manager has underperformed, investors need not choose an average manager. In fact, increasing evidence suggests active managers with certain identifiable characteristics such as low fees, low turnover, proper incentives, an experienced team, and a differentiated portfolio are far more likely to outperform both the index and the average active manager. One recent study indicates that managers with low fees and a high investment in their own funds have outperformed in 89% of all rolling 10 year periods.⁶
Putting these thoughts together, we believe the headwinds active managers have faced in recent years could well become tailwinds in the years ahead. Howard Marks, the widely admired Chairman of Oaktree Capital Management, recently asked, “…what happens when the majority of equity investment comes to be managed passively? Then prices will be freer to diverge from “fair,” and bargains…should become more commonplace….Can you picture a world in which nobody’s studying companies or assessing their stocks’ fair value? I’d gladly be the only active investor working in that world.”
While we cannot predict when this transition will occur, we would note over the last three years, the results of Clipper Fund have exceeded the S&P 500 Index.⁷ While the investor herd continues to stampede into passive funds and ETFs, we are encouraged not just by these recent results but also by the data illustrating that identifiable factors such as relatively low expenses and alignment of interests, both of which are central to our firm’s investment culture, have proven to be durable hallmarks of longterm outperformance.⁶ •
6. Source: Capital Group, based on Morningstar data. Based on monthly rolling periods from July 1996 to June 2016. Funds in the “Average Fund” group are those U.S. domestic equity funds in the Morningstar Large Value, Large Blend and Large Growth categories. “Funds with Low Fees and High Ownership” are those U.S. domestic equity funds in the Morningstar Large Value, Large Blend and Large Growth categories filtered for the quartile with the lowest net expense ratios (NER) and the quartile with the highest manager ownership. U.S. index is S&P 500 Index. The index is unmanaged and, therefore, has no expenses. Investors cannot invest directly in an index. For live funds, only the oldest share class was used. For dead funds with multiple share classes, the median monthly returns were used. Past performance is not a guarantee of future results. 7. Past performance is not a guarantee of future results. Investments cannot be made directly in an index.
4 CF | FALL REVIEW
How is Clipper Fund Positioned to Take Advantage of Select Opportunities in Today’s Market?
In order to outperform the market, successful active managers must purchase securities that are mispriced by the market. Given that the market represents the collective efforts of thousands of investors (and computers), such mispricing is rare. However, we have identified a number of market dynamics that in our judgment create pockets of mispricing or what academics call market inefficiencies. At a time when conventional wisdom argues such inefficiencies cannot exist, we will examine the other side of the argument in this report by presenting the types of inefficiencies we have identified in today’s market and, more important, the investment opportunities these inefficiencies have created. After all, these investment opportunities will drive share holder returns in the years and decades to come.
Time Arbitrage—According to Morningstar, the average mutual fund has a turnover rate of 89%, meaning on average each investment is held for less than 18 months. As a result, most investment research is oriented toward shortterm developments and predictions. This shortterm orientation creates a disconnect between the perspective and desires of the majority of investors who are focused on shortterm results and the goals and strategies of the best corporate executives who are trying to build longterm value. This disconnect in turn creates inefficiency and investment opportunity when the market punishes companies for making wise longterm investments, such as opening up new markets, building customer loyalty, creating new products, or funding research and development at the expense of shortterm earnings.
We call this inefficiency time arbitrage and consider it a significant contributor to our longterm investment success. When Wall Street analysts bemoan that a company cares more about customers than investors or is more focused on growth than quarterly earnings, our ears perk up as such criticism often signals opportunity. Two recent investments illustrate just such opportunities. First, our investment in United Technologies was made when Wall Street was criticizing the company for spending more than $10 billion in its Pratt & Whitney subsidiary to develop the revolutionary new geared turbo fan (GTF) jet engine.⁸ Our analysis indicates that, despite some shortterm teething pains as the engine is being rolled out, the GTF engine is likely to be a huge revenue and profit generator for decades to come. Second, our investment in Capital One came as the company is making huge and costly investments in electronic banking and, more recently, in the upfront costs of aggressively growing its consumer loan portfolio. Because we expect both United Technologies and Capital One to earn a good return on the investments they have made in recent years, we were delighted Wall Street’s shortterm focus allowed us to purchase the shares at a discount.
Geographic Inefficiency—Most analysts date the beginning of globalization to the 1980s with the end of the cold war and the fall of what were called the Iron and Bamboo Curtains. Huge new markets opened up to U.S. companies while international companies gained access to our markets. The resulting acceleration in trade flows led to enormous progress by almost all measures. For example, U.S. gross domestic product (GDP) per capita rose from around $29,000 to more than $50,000 in constant currency,⁹ Global GDP per capita more than doubled from around $4,000 to more than $9,000¹⁰ and the percentage of the world living in extreme poverty fell from more than 40% to less than 10%.¹¹
8. Individual securities are discussed in this piece. While we believe we have a reasonable basis for our appraisals and we have confidence in our opinions, actual results may differ materially from those we anticipate. The return of a security to the Fund will vary based on weighting and timing of purchase. This is not a recommendation to buy, sell or hold any specific security. Past performance is not a guarantee of future results. 9. https://www.theglobaleconomy.com/USA/GDP_per_capita_constant_dollars/ 10. https://seekingalpha.com/article/108399growthinworld percapitarealgdptocontinue 11. https://ourworldindata.org/wpcontent/uploads/2013/05/WorldPovertySince1820.png
CF | FALL REVIEW 5
12. http://www.proactiveinvestors.co.uk/columns/fatprophets/22814/heinekenremainsrefreshing22814.html
As a result of globalization, the competitive landscape and growth opportunities for almost all businesses have changed dramatically. In this connected world, once entrenched U.S. companies face new competition from China, Latin America, India, and Eastern Europe. But competitive and nimble U.S. companies now also have the opp ortunity to sell their products and services in these huge and fastgrowing emerging markets. Some of these companies have been significant beneficiaries. For example, we are amazed General Motors sells more cars and Boeing more planes in China than in the United States. On the other hand, companies that were not able to keep up faced a different fate. For example, two iconic U.S. beer companies, AnheuserBusch and Miller, were taken over by foreign companies that trace their roots back to the emerging markets of Brazil and South Africa (Inbev and SAB) while Heineken, once considered a stodgy European company, went on the offensive and now earns almost twothirds of its profits in emerging markets.¹²
These examples demonstrate how far globalization has come. Yet, even as businesses have globalized, Wall Street remains stubbornly and irrationally segmented by geography with domestic analysts and funds valuing and investing in U.S. companies, European analysts and funds in European companies, and emerging markets analysts and funds covering the rest. The problem is no company competes this way anymore. As a result, analysts studying an industry in a particular part of the world get an incomplete picture as they overlook competitors and opportunities presented in different geographies.
This incomplete picture creates an investment opportunity we refer to as geographic inefficiency. For example, if asked to name the world’s largest manufacturers of jet engines, most U.S. investors would name General Electric (GE), Pratt & Whitney (discussed above) and, perhaps, a few might add Rolls Royce. But almost none would mention
Safran, whose multidecade partnership with GE makes the company the second largest jet engine manufacturer in the world. Because Safran is not so well known to U.S. investors (let alone included in any of the popular indexes such as the S&P 500), the company’s shares trade at a discount to their intrinsic value, creating the opportunity to buy a world leader at a bargain price. A similar rationale applies to our investment in Ferguson PLC, which we believe is a wonderfully profitable and dominant distributor of plumbing fixtures whose shares trade in the United Kingdom even though the company earns more than 95% of its profits in the United States. As a result, U.S. analysts who historically assign high valuations to such wellpositioned distributors overlook this jewel and do not include the company in any of the huge domestic indexes, allowing us to acquire the shares at a discounted price.
Accounting Distortions—Federal regulations require all public companies present their financial statements to investors in accordance with generally accepted accounting principles (GAAP). While these principles can lead to a fairly realistic representation of a company’s financial condition, they can also create significant distortions that can lead to inefficiencies. In some cases, these distortions make a company appear more profitable simply because GAAP accounting allows for a certain amount of interpretation or discretion. CEOs, being only human, tend to choose interpretations that boost current profitability. Such areas of accounting discretion include revenue recognition, expense accruals, depreciation schedules, bad debt provisions, reserving practices, tax rates, lease treatments, and so on. As investors, we generally try to avoid companies that overstate current profitability as their stock shares are more expensive than they appear. Such overvaluation creates longterm risk as economic reality eventually trumps accounting distortions.
6 CF | FALL REVIEW
In contrast, we look for companies where our accounting analysis leads us to conclude the shares are cheaper than they appear on a reported GAAP basis. For decades, Berkshire Hathaway has been the best example as the company’s unusual structure and history result in GAAP financial metrics significantly understating the company’s intrinsic value. While we could write a tome on all the reasons this is so, we will instead commend Berkshire’s annual reports to your attention as each one clearly (and entertainingly) spells out and quantifies the most important accounting distortions each year. Similarly, from its earliest days, Amazon has been managed to optimize the creation of true value rather than GAAP financial metrics. In fact, Amazon’s outstanding CEO Jeff Bezos laid out this very principle in the company’s 1997 annual report when he promised that “forced to choose between optimizing the appearance of our GAAP accounting and maximizing the present value of future cash flows, we’ll take the cash flows.” We couldn’t agree more.
In the same way the unfavorable accounting distortions described above can create investment risks by making companies more expensive than they appear, the favorable accounting distortions we identify in companies like Berkshire Hathaway and Amazon create investment opportunities because the companies are cheaper than they appear.
Intangible Assets—Despite the success of computers in beating humans at games of skill such as chess and GO, judgment and character remain important but unquantifiable determinants of investment value. At a micro level, understanding why is easy. Simply imagine you inherit two businesses with identical histories and economics. Now imagine one of the businesses has a new CEO whose judgment, integrity and capability you admire greatly. The second business is run by a relative you cannot replace and consider deeply untrustworthy. While the past records of both
businesses would be the same, your own judgment and knowledge would lead you to correctly value one above the other.
Similarly, in addition to our analysis of a company’s competitive position, financial statements and current valuation, we use our judgment, experience and network to evaluate critical but intangible characteristics such as management quality, corporate culture and character. We consider it obvious what would be an important consideration in a private company will also be relevant for a public company.
Such “soft” considerations can help identify investment opportunities and avoid catastrophic risk. For example, in the years leading up to the financial crisis, there was little quantifiable difference between JPMorgan and Citigroup. Both were large money center banks with storied histories operating in roughly the same businesses. However, one was run by Jamie Dimon who is quoted as saying, “Don’t do anything stupid. And don’t waste money. Let everybody else waste money and do stupid things. Then we’ll buy them.” The other was run by a CEO who famously said, “As long as the music is playing, you’ve got to get up and dance.” From the beginning of 2007 to today, shares of JPMorgan are up 185% while shares of Citigroup are down more than 85%. This insight into culture is the reason we have long invested in one and not the other. A more recent example is our investment in Didi Chuxing often referred to as the Uber of China. While many of the financial metrics of these two ridesharing companies were similar, our research indicated the management, culture and market position of Didi were far superior to Uber. As a result, when given the opportunity to invest in Didi at a steep discount to Uber, we jumped at the chance. Since then, we believe Didi has gone from strength to strength while Uber’s dysfunctional and misogynistic culture led to a management change and valuation mark down.
CF | FALL REVIEW 7
In sum, using our judgment and experience to evaluate the intangible assets of corporate culture and management quality has helped us identify wonderful investment opportunities such as JPMorgan and Didi while avoiding potentially catastrophic risks. As more and more money is invested passively or by computer, we expect our emphasis on such intangible assets to become even more valuable.
Sector Inefficiencies—Certain sectors of the market require deep industryspecific expertise to evaluate accurately. In a world when a significant amount of capital is passively invested based on index weightings, sector rotation and/or shortterm research, fewer and fewer participants are willing or able to perform the indepth research required to understand certain complicated industries. Having developed deep expertise in such sectors, we are often able to identify mispricings that occur at both a micro or companyspecific level and at a macro or industrywide level.
At the micro level, we have learned certain industries are characterized by what is often called domain knowledge, which means business practices, terminology and occasionally even accounting treatments are specific to that industry. Insurance, for example, is characterized by an unusual business model in which the companies are paid upfront for a service they may never have to deliver (i.e. a company is paid an insurance premium but the customer may never file a claim). In addition, the industry has a bizarre regulatory structure with each state having its own insurance commissioner and regulations, unique filing requirements, industry specific accounting and tax treatments, unusual measures of profitability (such as the combined ratio) and a host of mysterious acronyms such as DAC, IBNR and LAE, which stand for deferred acquisition cost, incurred but not reported, and loss adjustment expenses.
As a result, analysts and portfolio managers who approach this industry as generalists can overlook important clues that might distinguish one company from another. By developing a deep knowledge of this complex industry over the last five decades, we are occasionally able to identify competitive advantages that would not be apparent to a generalist. For example, while many investors considered Markel a simple insurance company, we have identified four enormous and durable competitive advantages that have allowed Markel to outperform for decades. First, the company had a proven ability to identify insurance niches in which Markel’s underwriting expertise and price discipline allow the company to earn excess profits. Second, Markel has an outstanding, lowcost investment culture that has enabled the company to achieve superior investment returns for decades. Third, Markel has built a portfolio of wholly owned noninsurance subsidiaries that are worth substantially more than they are reported on the company’s books. Finally, using everything from incentive systems and accounting choices to management tone and shareholder/employee communication, the company has built an extraordinarily distinctive corporate culture that fosters stewardship, accountability, and entrepreneurship. Putting these advantages together, our knowledge of the industry leads us to conclude Markel is a diamond in an otherwise dull industry or what my grandfather Shelby Cullom Davis called “a growth stock in disguise.” Considering that our first research on this company dates back to 1991 when the stock traded around $20 a share and that shares now trade at more than $1,000 each, my grandfather’s description is right on the mark.
At the macro level, certain volatile but durable sectors or industries commonly swing in and out of favor based on recent experiences. In banking, for example, memories of the financial crisis of 2008–2009 combined with subsequent antibanking rhetoric and media coverage have blinded
8 CF | FALL REVIEW
investors to the fact carefully selected banks are in our judgement both cheap and safe. Contrary to popular perception, many top tier banks are not only reporting record earnings but are also far better capitalized than at any time in the last 50 years. While unloved now, we believe the leading financial companies we own will be big contributors to Clipper Fund’s future returns as the reality of their strong economic fundamentals and rising dividends eclipse current investor perceptions.
Similarly, although oil prices have risen more than 50% in the past year, the shares of many energy companies remain depressed as investors still recall the dramatic and unsustainable collapse in oil prices that occurred from 2014 through 2016. Taking advantage of this opportunity, we own shares in innovative, wellpositioned companies such as Apache Corporation that should benefit as investor perceptions catch up with reality.
At a time when more money is flowing into passive investment strategies and fewer firms possess cumulative knowledge and industry expertise, we have built deep knowledge and understanding in a range of complicated and idiosyncratic but durable sectors such as insurance, banking and energy. This knowledge allows us to capitalize on the inefficiencies that appear from time to time at both the company specific as well as industrywide level.
Index Distortions—Given the enormous size of the largest index funds and ETFs, companies that are not included in the most popular indexes can easily become relatively mispriced. Just imagine two companies with identical prospects but only one is included in the S&P 500. Although both would have the same intrinsic value, one would have
fewer buyers as no index funds would hold it. As a result, that company would likely trade at a lower valuation. Last year we took advantage of just such a situation when Johnson Controls, a diversified industrial company we have long held, spun out its car seat manufacturing subsidiary Adient. Although Johnson Controls is included in the S&P 500, Adient was not. In fact, Adient was not added to any indexes. As a result, all of the index funds that received the shares of Adient in the spin off became forced sellers allowing us to acquire the shares at what we believe will prove to be a very attractive valuation.
Such index distortions also created an investment opportunity in the shares of Naspers, a holding company whose largest asset is a 30% ownership of Tencent, a Chinese media and internet company that is one of the best managed companies we know. Adding the market value of the company’s stake in Tencent ($149 billion) to a conservative estimate of the value of the company’s nonTencent assets, which include an African pay TV service and a group of emerging market internet businesses worth approximately $17 billion, yields a total gross asset value of $163 billion. At current prices, Naspers’ total enterprise value is just $91 billion, a 44% discount to total gross asset value. Although some discount is reasonable given issues related to liquidity, taxation and corporate structure, we believe this discount reflects a significant distortion that can be traced back to the wave of index investing. In particular, we believe although money has poured into Chinese, Asian and technologyrelated index funds and ETFs, not many investors are interested in investing in a South African index or holding company. As a result of this inefficiency, investors can purchase shares
CF | FALL REVIEW 9
in what we believe to be one of the best companies in China at a steep discount simply by owning them through this South African vehicle.
Should the huge flows of funds out of active managers into passive investment alternatives continue, we would expect the valuation differences to widen creating more mispricing and investment opportunities.
Headline Risk¹³—Finally, mispricings can be created because the structure and incentives of many money management firms make them reluctant to invest in companies that their clients might consider controversial. After all, when clients read in the newspaper about a company plagued by scandal, the last thing they want to see when they open their investment report is their expert money manager has purchased the scandalplagued company they just read about. As a result, many investment managers either will not look at companies that are under a cloud or, if they had previously purchased them, will sell the entire position at discounted prices. The problem with this approach is their decision has nothing to do with the economics or prospects of the company in question, but instead is focused on shortterm client perception.
As a result, shares in durable companies tainted by scandal can often represent buying opportunities that we refer to as headline risk investments. In evaluating these investments, our research focuses not on the past but on the future, asking
whether the problems that have come to light can be fixed and if so whether the decline in share price represents a buying opportunity. Buying shares when a company is in the headlines for unfavorable reasons is never easy and in no way reflects a minimizing of a company’s past mistakes. But organizations like people can learn from their mistakes and often emerge stronger. We believe our willingness to look beyond the headlines can lead to fantastic opportunities. Although there are no certainties, our analysis indicates that both Facebook and Wells Fargo will emerge from their recent scandals as better companies and that recent selling has been overdone. As a result, we established a position in Facebook this year and added to our position in Wells Fargo when the headlines were unfavorable.
With more than $150 million of our own money invested in Clipper Fund, our primary concern is making smart investment decisions rather than reacting to shortterm investor perceptions.¹4 Because our firm’s incentives drive an investment culture rather than a sales culture, our willingness to invest in controversial companies should come as no surprise. While investing in companies with headline risk can unsettle clients in the short term, such a discipline reflects our alignment of interest with our shareholders over the long term. This alignment is an uncommon advantage given that 88% of all funds are overseen by managers who have less than $1 million invested alongside their clients. •
13. While Davis Advisors researches companies subject to such contingencies, it cannot be correct every time, and the company’s stock may never recover or may become worthless. 14. Includes Davis Advisors, Davis family and Foundation, our employees, and Fund directors who have more than $150 million invested in Clipper Fund. As of June 30, 2018.
10 CF | FALL REVIEW
Conclusion So far in 2018 and indeed since we were entrusted with Clipper Fund’s management on January 1, 2006, Clipper Fund has built wealth for investors.¹⁵ In addition, over the last three years when conventional wisdom has pro claimed the death of active investing, Clipper Fund has outperformed the S&P 500 after all expenses and ranks in the top decile of all managers in our category.¹⁶ While we have more than doubled the value of an investment made when we were entrusted with management of Clipper Fund in January 2006, we still have ground to make up on a relative basis and will do our best to build on our recent outperformance in the years ahead.
While the consensus wisdom currently favors passive investing, significant data shows active and passive strategies move in cycles. A review of these cycles indicates active investing strategies may be poised for a period of relatively stronger returns particularly if market returns moderate in the years ahead. Furthermore, contrary to consensus thinking, a select group of active managers with characteristics such as low costs, an alignment of interests with their shareholders and differentiation have outperformed in the vast majority of all rolling 10 year periods.
Our basis for believing select active managers like us can outperform the index rests on our conviction certain market dynamics create pockets of mispricing or inefficiency. These mispricings in turn create investment opportunities. In order to capitalize on these opportunities, we focus our investment discipline on the long term, analyze companies and industries from a global perspective, look beyond GAAP accounting, use judgment and experience to assess important intangibles such as management quality and corporate culture, cultivate the domain knowledge required to understand durable but complex industries, and are prepared to invest when companies are depressed by shortterm scandals and unfavorable headlines. Above all, our significant coinvestment creates a deep and rare alignment of interests with our shareholders that fosters a culture of stewardship and performance.
Finally, contrary to conventional wisdom, our confidence in our ability to outperform is consistent with the efficient market hypothesis that underpins passive investing for the simple reason that in order for the market to be efficient, excess returns must be available for select active investors. This somewhat counterintuitive notion is best explained by one of the greatest proponents of passive
15. As of July 31, 2018. Clipper Fund was managed from inception, February 29, 1984, until December 31, 2005 by another Adviser. Davis Selected Advisers, L.P. took over management of the Fund on January 1, 2006. Past performance is not a guarantee of future results. 16. Source: Lipper.

CF | FALL REVIEW 11
investing, Burt Malkiel, author of numerous articles as well as the bestselling book, A Random Walk Down Wall Street. As Mr. Malkiel notes, the “basic paradox in the theory of efficient markets (is that)…markets need some professionals to ensure that information is…incorporated into market prices, and those professionals have to earn above-market returns to compensate them for the time and effort involved in doing fundamental research.” (Emphasis added.) We are determined to be among those select firms with the resources, skills, culture, structure, and incentives necessary to outperform over the long term.
As always, we recognize and expect the years ahead will include times of market corrections and disruptions. While unpleasant, such periods are inevitable and generally create opportunities for investors with the judgment and experience to take advantage of them. In short, at a time when
pundits and commentators are making the case experience and judgment do not matter and the best investors can hope for is an average result, we strongly disagree. We believe a carefully selected Portfolio of durable, wellmanaged businesses with competitive advantages, selling at a discount to true value and overseen by a seasoned team with a long track record of generating proven results will produce a betterthanaverage outcome. In investing, as in any other profession, skill matters. With more than $150 million invested alongside our shareholders, we have every incentive and intention to build on this record in the years and decades ahead.¹⁷
We value the trust you have placed in us and look forward to continuing our investment journey together. •
17. Includes Davis Advisors, Davis family and Foundation, our employees, and Fund directors who have more than $150 million invested in Clipper Fund. As of June 30, 2018.
This report is authorized for use by existing shareholders. A current Clipper Fund prospectus must accompany or precede this material if it is distributed to prospective shareholders. You should carefully consider the Fund’s investment objective, risks, fees, and expenses before investing. Read the prospectus carefully before you invest or send money.
This report includes candid statements and observations regarding investment strategies, individual securities, and economic and market conditions; however, there is no guarantee that these statements, opinions or forecasts will prove to be correct. These comments may also include the expression of opinions that are speculative in nature and should not be relied on as statements of fact.
Objective and Risks. Clipper Fund’s investment objective is longterm capital growth and capital preservation. There can be no assurance that the Fund will achieve its objective. The Fund invests primarily in equity securities issued by large companies with market capitalizations of at least $10 billion. Some important risks of an investment in the Fund are: common stock risk: an adverse event may have a negative impact on a company and could result in a decline in the price of its common stock; depositary receipts risk: depositary receipts may trade at a discount (or premium) to the underlying security and may be less liquid than the underlying securities listed on an exchange; fees and expenses risk: the Fund may not earn enough through income and capital appreciation to offset the operating expenses of the Fund; financial services risk: investing a significant portion of assets in the financial services sector may cause the Fund to be more sensitive to systemic risk, regulatory actions, changes in interest rates, nondiversified loan portfolios, credit, and competition; focused portfolio risk: investing in a limited number of companies causes changes in the value of a single security to have a more significant effect on the value of the Fund’s total portfolio; foreign country risk: foreign companies may be subject to greater risk as foreign economies may not be as strong or diversified; As of July 31, 2018, the Fund had approximately 11.2% of assets invested in foreign companies; foreign currency risk: the change in value of a foreign currency against the U.S. dollar will result in a change in the U.S. dollar value of securities denominated in that foreign currency; headline risk: the Fund may invest in a company when the company becomes the center of controversy. The company’s stock may never recover or may become worthless; large-capitalization companies risk: companies with $10 billion or more in market capitalization generally experience slower rates of growth in earnings per share than do mid and smallcapitalization companies; manager risk: poor security selection may cause the Fund to underperform relevant benchmarks; mid- and small-capitalization companies risk: companies with less than $10 billion in market capitalization typically have more limited product lines, markets and financial resources than larger companies, and may trade less frequently and in more limited volume; and stock market risk: stock markets have periods of rising prices and periods of falling prices, including sharp declines. See the prospectus for a complete description of the principal risks.
Davis Advisors is committed to communicating with our investment partners as candidly as possible because we believe our investors benefit from understanding our investment philosophy and approach. Our views and opinions include “forwardlooking statements” which may or may not be accurate over the long term. Forwardlooking statements can be identified by words like “believe,” “expect,” “anticipate,” or similar expressions. You should not place undue reliance on forwardlooking statements, which are current as of the date of this report. We disclaim any obligation to update or alter any forwardlooking statements, whether as a result of new information, future events, or otherwise. While we believe we have a reasonable basis for our appraisals and we have confidence in our opinions, actual results may differ materially from those we anticipate.
The information provided in this material should not be considered a recommendation to buy, sell or hold any particular security. As of July 31, 2018, the top ten holdings Clipper Fund were: Alphabet, 9.51%; Berkshire Hathaway, Class A, 7.87%; United Technologies, 6.40%; Amazon.com, 6.06%; Capital One Financial, 5.84%; Bank of New York Mellon, 5.76%; Wells Fargo, 5.61%; Apache, 5.04%; Markel, 4.93%; Johnson Controls International, 4.60%.
Clipper Fund has adopted a Portfolio Holdings Disclosure policy that governs the release of nonpublic portfolio holding information. This policy is described in the prospectus. Holding percentages are subject to change. Visit clipperfund.com or call 8004322504 for the most current public portfolio holdings information.
Clipper Fund was managed from inception, February 29, 1984, until December 31, 2005 by another Adviser. Davis Selected Advisers, L.P. took over management of the Fund on January 1, 2006.
Over the last five years, the high and low turnover rate for Clipper Fund was 38% and 8%, respectively.
We gather our index data from a combination of reputable sources, including, but not limited to, Thomson Financial, Lipper and index websites.
The S&P 500 index is an unmanaged index of 500 selected common stocks, most of which are listed on the New York Stock Exchange. The index is adjusted for dividends, weighted towards stocks with large market capitalizations and represents approximately twothirds of the total market value of all domestic common stocks. Investments cannot be made directly in an index.
After October 31, 2018, this material must be accompanied by a supplement containing performance and rating (ranking) data for the most recent quarter end.
Shares of the Clipper Fund are not deposits or obligations of any bank, are not guaranteed by any bank, are not insured by the FDIC or any other agency, and involve investment risks, including possible loss of the principal amount invested.

Davis Distributors, LLC 2949 East Elvira Road, Suite 101, Tucson, AZ 85756 800-432-2504, clipperfund.com
Item #4756 7/18