“clinically complex” refers to illnesses and medical … · web viewthis question of model...
TRANSCRIPT

Washington StateResidential Care
Time Study
Report prepared byJeanette Semke, MSW, PhDWith Input From ADSA Staff
Research sponsored byHome and Community Services
Washington State Aging and Disability Services AdministrationDepartment of Social and Health Services
This report contains information related to the time study data. The labels and field names may not match the CARE tool exactly.

December 2002
1

EXECUTIVE SUMMARY
The goal of the time study was to determine relative resource use when specific care needs were identified.
The study included 20 Boarding Homes (contracted as Assisted Living, AL facilities and Adult Residential Care, ARC facilities) and 83 Adult Family Homes, AFH.
Data were collected for 557 Boarding Home residents and 351 Adult Family Home residents.
Project staff trained facility staff in the use of a hand held computer that was used to record care time expenditure for a continuous 72-hour period.
Home and Community Services (HCS) staff completed a comprehensive assessment (CA) of resident health and care needs.
The amount of care time residents received varied dramatically. In boarding homes 10% of the residents received less than 9 minutes of direct care each day and another 10% received over 2 hours of direct care time. Among the Adult Family Home residents, 10% received less than 24 minutes while another 10% received over 3 hours of direct care time.
Residents’ activities of daily living (ADLS), Cognitive Performance Score, and whether they were classified as clinically complex or having a behavior/mood problem accounted for 47% of the variation in direct care time for boarding home residents and 30% of direct care time for adult family home residents.
The categorization system presented in this report will form the basis for payment to home and community residential care providers.
2
TABLE OF CONTENTS
I. INTRODUCTION...........................................................................................................................3
II. DATA COLLECTION.................................................................................................................3
III. BACKGROUND AND RATIONALE FOR THE WASHINGTON APPROACH...............7
IV. STEPS IN MODEL DEVELOPMENT...................................................................................10
V. DECISION MAKING BY HOME AND COMMUNITY SERVICES STAFF AND CLINICAL RESOURCE GROUP (CRG).....................................................................................13
VI. RESULTS...................................................................................................................................15
VII. ISSUES IN EVALUATING THE VALIDITY AND UTILITY OF THE MODEL...........17
References.........................................................................................................................................24
3

I. INTRODUCTIONThe State of Washington Aging and Disability Services Administration (ADSA) is in the process of improving its payment system for home and community residential care services. The goal is to develop a resident classification system that assesses resident care needs and resource use and bases payments on the degree of use.
This report describes how ADSA staff arrived at a system that assigns Home and Community Service residents to one of 12 categories based upon assessment of care needs and projected relative resource use (i.e. the time study). The rate system development process and its results are not reviewed in this report.
During 2001 and 2002, ADSA conducted a time study in boarding homes, adult family homes, and residents’ own homes in several communities across the state. The purpose of the time study was to determine resource use when specific care needs were identified.
Trained social and health service professionals visited several hundred residents in their places of residence and collected data on clinical characteristics and need for assistance in performing activities of daily living (ADLs). The data collection tool was a subset of the department’s new assessment tool, Comprehensive Assessment Report and Evaluation (CARE), to be implemented in July 2003. CARE includes data elements that measure resident characteristics thought to be indicative of need for caregiver intervention. Meanwhile, ADSA staff assisted care providers in tracking the time they spend in caring for the residents. Care time was tracked for a period of three consecutive days.
Clinical data for each resident in the study were matched to data on the amount of time providers spent caring for that resident. Results of analyses of time study data for boarding homes and adult family homes were used to develop a resident categorization system.
II. DATA COLLECTIONSampleTwenty Boarding Homes and 83 Adult Family Homes participated in the study. The sample of residences was not randomly selected. Rather, the sample came from facilities willing to participate. Staff made efforts to assure that regional diversity (i.e. rural versus metropolitan) and the range of resident acuity were represented in the sample. The following DSHS sub-agencies participated in facility selection: the Residential Care Services Division and the Division of Developmental Disabilities of the ASDA and the Mental Health Division of the Health and Rehabilitative Administration. Input also was received from boarding home and adult family home associations and dementia care pilot facilities.
Boarding Homes. Table One identifies the participating boarding home facilities some of which serve residents with special needs. It includes the number of beds per facility and the number of residents in the facility for which time data was obtained.
4

Table OneLicensed # Time
StudyF A C I L I T Y Beds Residents
ASSISTED LIVING (AL)Cypress Gardens - Bremerton 65 59Englewood Heights - Yakima 85 83Northaven II - Seattle 40 41Westhaven Villa - Aberdeen 53 40Charlton Place – Tacoma (Test Facility)* 105 37
DEVELOPMENTAL DISABILITIES (DD)Amber Light I and II - Everett/Edmonds 26 23 Edmonds Group Home - Edmonds 15 15
DEMENTIA PILOT (DP)Alterra Clare Bridge of Spokane - Spokane 56 50Beehive Retirement Center - McCleary 51 46Callaway Gardens - Kennewick 56 50Olympic Alzheimer's Residence - Gig Harbor 60 40Pioneer Place Summit - Tacoma 40 35The Hampton Special Care - Tumwater 56 55
ENHANCED ADULT RESIDENTIAL CARE (EARC)
Valley Community Inn - Puyallup 50 49
MENTAL HEALTH (MH)Court C Residential Center - Tacoma 58 55Hope Home - Tacoma 16 16
SPECIALTY CARE (SC)Garden Courte Alzheimer Community - Olympia 88 68Homeplace Special Care Center - Burlington 46 39Orchard Pointe Specialty Care - Port Orchard 41 36Parkside Alzheimer Community - Sedro Woolley 50 51
TRAUMATIC BRAIN INJURY (TBI)Terry Home - Pacific 10 10
Total Residents 962 861 *Charlton Place Data not included in analysis
ADSA gathered care time information on 861 residents; however, 557 of those residents agreed to participate in the clinical assessment interview. Therefore, combined care time and clinical characteristics for 557 boarding home residents were available for the analyses.
5

Adult family homes. Table Two identifies the counties of participating adult family homes and the number of adult family homes participating in the study. In addition, for each participating county, the table shows the median number of residents per adult family home for which clinical data were obtained by assessors using the assessment tool and the range in the number of participating residents per home.
Table Two
County# Adult Family
Homes participating in the study
Median # participants
per home
Range of participants per
homeBenton 4 6 4-6Grant 2 6 6-6King 14 5 3-6
Kitsap 1 6Mason 4 5 3-6Pierce 23 4 2-6
Snohomish 12 4 3-6Spokane 4 6 6-6Thurston 13 3 2-5Yakima 6 5 3-6
Time data collection methods. Hand-held computers were used to track time. Every staff member and resident was identified in the hand-held computer. Each staff member used the hand-held computer to indicate the amount of time they provided care for each individual they cared for during a work shift. This data collection procedure produced a record of how staff persons divided their time in order to meet resident care needs and support activities, e.g. housekeeping, maintenance, etc. Both direct and indirect care time data were collected from all facility staff. The time data was collected on a resident specific basis rather than on a task specific basis. Staff was asked to divide their time into three categories:
Resident One-To-One Time – resident identified Small Group Activity Time – resident identified Support Activity Time – resident not identified
Facility staff training included how to record time and time definitions. Staff members were assured that this was not an efficiency study. Manual forms were available for individuals who were either uncomfortable with the hand-held computers or the majority of their duties were considered support time. Definitions of the three categories of time are as follows:
One-to-One Time - Time spent interacting with or providing a service to an individual resident. Examples are bathing, transferring, toileting, etc. Also included was time planning or coordinating the care of a specific resident whether in or outside of his/her presence. Examples are talking to other staff about a particular resident’s needs, making medical appointments, or conferring with family members
Small Group Activity Time - Time spent with a small group of residents during an activity or when staff’s primary responsibility is to monitor the health and safety of a small group of residents. An activity was considered small group when the activity involved between 2 and 15 individuals in boarding homes and 2-6 in adult family homes.
6

Examples of small group activity time would include supervising residents watching television or conducting music time for a small group of residents.
Support Activity Time - Support time is time spent on all other staff activities that cannot be categorized as one-to-one or small group activity time. Examples of support activity time would include administrative duties, housekeeping, laundry, meal preparation, or staff meetings and breaks.
To insure the accuracy of the data, a team of four DSHS staff members were assigned to each boarding home. Teams of two DSHS staff members were assigned to a group of 3-5 adult family homes. At least one team member was in the facility throughout the day and swing shifts and at every shift change for boarding homes. The facility staff had the ability to contact someone 24 hours a day to answer questions if necessary. Adult family homes had a team member in the facility on average two times a day and also had the ability to contact someone 24 hours a day.
The first day was a trial run to test hand-held computers, answer questions and to determine if staff needed assistance to record time. The data collection started on the following day and continued for 72 hours. DSHS staff downloaded the information from the hand held computers at the end of each shift. Each staff member's care time was printed and reviewed for accuracy. Staff members would be asked to explain any discrepancies. A note was made and a file was created for corrected data. A final download of the handheld computers was done at the end of the facility’s 72-hour data collection process.
It was important that all care time a resident received was recorded; therefore, when volunteers or family members met a resident’s care need that time was tracked. Also, time was documented when residents were out of the facility.
Methods for collecting clinical data. Approximately two weeks before or two weeks after data collection, each resident wishing to participate had an assessment completed. The assessment tool used was a large subset of the CARE tool that will be implemented in July 2003. Home and Community Services (HCS) staff visited the facility and completed the assessments. Staff used the assessment to gather information regarding the resident’s health and care needs. To minimize the risk of a resident’s care needs changing between time data collection and completion of the assessment, the two-week window was established. HCS staff completing the assessments received two days of instruction as well as receiving a training manual developed specifically for this study. This training insured that the assessments were consistently completed. The assessment information was and will be kept confidential and will be used only for the purpose of the time study. The clinical data gathered were related to impairment in cognition, complexity of clinical conditions, behavioral health, and performance in activities of daily living.
7

The following steps were taken to clean the data and prepare it for analysis:
1. Removed practice data2. Input manual entry data3. Determined start and stop time for 72-hour period4. Sorted time by worker to insure that entire shift was recorded5. Sorted time by start time to insure that entire 72-hour period was
captured6. Reviewed data to insure that times did not overlap, e.g. for adult family
homes only one person should have reported support time for the night shift.
7. Calculated start and stop times for each entry 8. Removed facilities that did not meet parameters mentioned in 1.
through 6.9. Corrected data for errors or irregularities
III. BACKGROUND AND RATIONALE FOR THE WASHINGTON APPROACH Typically, need for care is determined on the basis of resident clinical and functional characteristics. Some work has been done nationally and by various individual states to develop standardized methods for using measures of resident characteristics to determine the level of payment a provider will receive to meet those needs (e.g. RUGIII, Maine, North Carolina, Texas). The technology is in its adolescence and there is some debate about the soundness of these methodologies and whether methods from one region or population are applicable to another region or population. Therefore, ADSA staff made the decision to conduct their own Washington State-specific study of the relationship of resident characteristics and staff time devoted to their care needs. Their rationale were the:
1. array of providers and the types of services provided in Washington State differ from other states;
2. characteristics of residents in Washington State community-based care settings differ from those of residents in other states; and
3. methods for matching resident characteristics to resources are not yet well developed.
Based on a review of the “state of the art” in resident categorization systems and the availability and expertise of staff to conduct analyses, ADSA decided to build on the approach taken by the State of Maine in the development of what has come to be called the “Maine Grouper”. The Maine approach was adapted from the RUGIII development process and tested in North Carolina and Texas. All of these approaches were not strictly empirically based, but rather combined results of data analyses with recommendations from clinical experts with policy considerations.
Background-original Resource Utilization Group version-III (RUG-III) A system already used to group residents in Washington State nursing facilities is the RUG-III Case Mix Classification System. This approach is based upon clinical judgment and empirical modeling. It evaluates a resident’s MDS (Minimum Data Set) items and, based upon that assessment, assigns a resident to 1 of 44 categories. After reviewing the criteria for all 44 RUG classifications, the resident is assigned the RUG classification that has the highest
8

weight reflective of the resources required to care for that resident. The RUG-III classification system defines the clinical criteria that are used to group residents into one of seven major clinically relevant categories (e.g. rehabilitation, cognitively impaired, clinically complex, etc.). Once an individual is grouped according to one of the major categories, a further classification into a subgroup is made based on the individuals’ total ADL score.
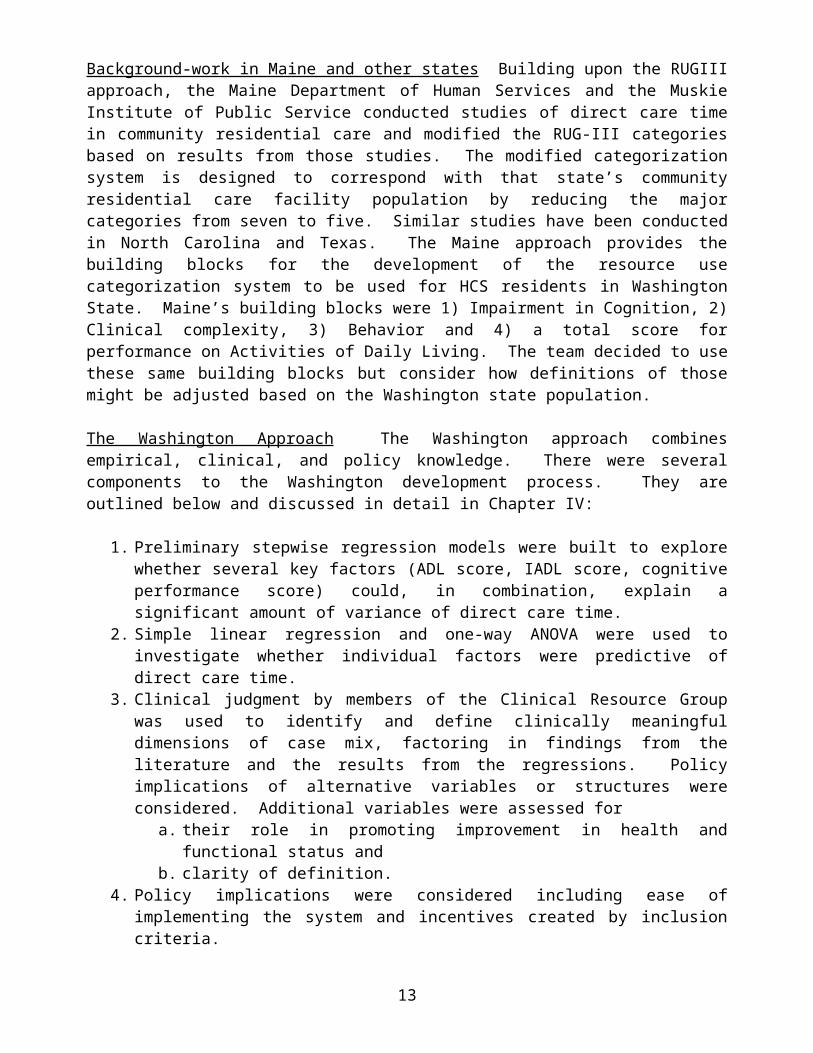
Background-work in Maine and other states Building upon the RUGIII approach, the Maine Department of Human Services and the Muskie Institute of Public Service conducted studies of direct care time in community residential care and modified the RUG-III categories based on results from those studies. The modified categorization system is designed to correspond with that state’s community residential care facility population by reducing the major categories from seven to five. Similar studies have been conducted in North Carolina and Texas. The Maine approach provides the building blocks for the development of the resource use categorization system to be used for HCS residents in Washington State. Maine’s building blocks were 1) Impairment in Cognition, 2) Clinical complexity, 3) Behavior and 4) a total score for performance on Activities of Daily Living. The team decided to use these same building blocks but consider how definitions of those might be adjusted based on the Washington state population.
The Washington Approach The Washington approach combines empirical, clinical, and policy knowledge. There were several components to the Washington development process. They are outlined below and discussed in detail in Chapter IV:
1. Preliminary stepwise regression models were built to explore whether several key factors (ADL score, IADL score, cognitive performance score) could, in combination, explain a significant amount of variance of direct care time.
2. Simple linear regression and one-way ANOVA were used to investigate whether individual factors were predictive of direct care time.
3. Clinical judgment by members of the Clinical Resource Group was used to identify and define clinically meaningful dimensions of case mix, factoring in findings from the literature and the results from the regressions. Policy implications of alternative variables or structures were considered. Additional variables were assessed for
a. their role in promoting improvement in health and functional status and b. clarity of definition.
4. Policy implications were considered including ease of implementing the system and incentives created by inclusion criteria.
A model that favors any one of these components to the exclusion of the others was thought to be inappropriate for the following reasons: 1) sound research is generally based on multiple sources of information since there is no one perfectly valid information source; 2) the triangulation of information sources (i.e. comparing data from different information sources) forms a kind of check and balance of information sources; 3) since methods must take into consideration the purposes for which they are to be used, policy considerations must be part and parcel of establishing the categorization system.
9

Several criteria were used to assess whether a “candidate” variable will be included in the final model. They were:
1. appropriateness of each variable;2. statistical performance of each variable;3. clinical utility or meaningfulness of each variable;4. potential incentive effects (e.g. variables that reward providers for certain types of
practice patterns);5. administrative burden particular variables may impose (it is tempting to include
many variables that have a statistical relationship with direct care time; the desire for precision must be balanced with the burden to training staff and case managers when the number of variables that they must be trained to are numerous);
6. reliability;7. subjectivity (i.e. the lack of clear definitions of terms or guidelines for choosing
among the response categories allows varying interpretations by clinicians and, in turn, affords the opportunity for manipulation by providers or residents; e.g. a subjective severity of diagnosis item which may vary depending on what diagnosis item you’re talking about, prognosis and life expectancy, and psychosocial status); and
8. transience (i.e. health status measures which may be brief in their occurrence or recurrence).
The Time Study work team undertook an iterative process in which they explored alternative ways of constructing the four clinical dimensions and of relating them to one another. This was done in consultation with stakeholder experts.
Rationale for not relying completely on a regression-based case-mix model In support of the decision to combine empirical analyses and clinical judgment in the process of the resident categorization model, Daley and Schwartz state,
“Experience has convinced most researchers that combining clinical judgment and empirical modeling is better than either approach alone. Therefore, to maximize both the statistical performance of the model as well as its acceptance by the clinical community, one should meld the knowledge and expertise of clinicians and the powerful techniques of empirical model building in deriving risk adjustors (Iezzoni, page 302)”
A resident classification system based solely on a multiple regression analyses of data from a time study may offer substantial “explained variance” as reflected by R2. However, it will probably fail to group patients according to recognized clinical categories. Also, such a model will probably mesh poorly with the clinical diagnostic process (P. 30, Abt. and Associates). Used as the sole determinant of a resident categorization system, a multiple regression-based model would not address concerns of ADSA staff and community stake holders that the categorization system reflect the special care requirements of residents with co-occurring significant cognitive impairment, complex medical conditions, and/or behavior/mood problems. For example, though ADL score is the main driver of care time, providers know that one ADL score is not equal to another in terms of time required to provide care. For example, a person who has a high ADL score due to disabling arthritis is very different from a person who has a high ADL score because they are cognitively impaired and resistive to care. In our model, the first person in this example would end up in a lower payment group than the second person. The “resistive to care” variable is
10

predictive of care time by itself, while the “arthritis” variable is not. (See detailed discussion Chapter IV)
A standard rule for determining multiple regression models is to settle on a small group of predictor variables that explain the most variance and eliminate any that add very little to that explanation. Once most of the possible explainable variance is accounted for, the likelihood that additional variables in the model will increase explained variance decreases. As expected, ADL score is the variable that explains the most variance in regression analyses of the Washington State data. Additional individual variables indicating behavior problems or clinical complexity add little to the explanatory power and in a standard regression analysis would be eliminated from the model in the interest of parsimony. A system resulting from a strictly multiple regression analysis would, indeed be simple, but might miss some important dimensions of the clinical profile that, indeed, add to the care time of any one group of individuals above and beyond the ADL score. Rationale for “clinically-oriented” approach As is the case with an empirically based approach, a clinically oriented approach involves identification of factors that determine relative resource use. This approach, however, relies on the expert knowledge of home and community-based care providers and clinical experts. Their knowledge about clinical factors that are significant predictors of care time specific to Washington State was considered important to building a valid classification system. Though care needs of Washington State home and community residents may be very similar to those in other states, rules and regulations governing the types of care that care providers are licensed to offer and the milieu in which services are provided may impact actual care differentially.
Rationale for a “policy-oriented” approach The categorization system will be the basis for a rate system for state reimbursement to providers of home and community-based services. The categories have policy impact because they will lead to a relative rates system that potentially create incentives and disincentives for providers to admit residents and for the types of care they provide. For example, a provider will be more willing to accept a resident requiring higher levels of care if the reimbursement rate reflects that resident’s higher care needs. Also, some care procedures that are associated with higher levels of care time in the time study may not fit with currently accepted practice standards. If so, they would not be included in a higher level in the categorization system. For example, the use of a urinary catheter was predictive of increased care time in the study. If it were included in the system such that it would result in a higher resource use category, it potentially would create an incentive to use urinary catheters absent clinical need. For that reason use of urinary catheters was excluded from the categorization system.
Several medical conditions that were included in the final version of the categorization system were “stand alone” predictors of care time. Wishing to create an incentive to treat the conditions, these items were combined with a corresponding appropriate treatment. For example, if a person had skin ulcers or lesions in the absence of treatment he would not be included in a higher resource use group. He would only be included if he had the condition in combination with receiving care for that condition. Thus, the policy outcome of the categorization system would be to encourage treatment of such skin problems.
IV. STEPS IN MODEL DEVELOPMENTThe statistical analysis of the relationship between care time and multiple clinical variables forms the basis for the Washington categorization system.
11

Phase One: Multiple regressions. A series of forward and backward stepwise multiple regression models1 of direct care time regressed on a combination of clinical variables were explored. Decisions about variables to be tested in these models were based upon results of prior studies of the relationship between clinical measures and use of community-based residential care resources. In prior studies a combination of Activities of Daily Living (ADL), Cognition as measured by the Cognitive Performance Score (CPS) 2, Clinical Complexity, and Behavior have been shown to explain variation in resource use.3
Using boarding home time study data, the time study team found that a model that included all ADLs, IADLs and CPS explained almost 50% of the variance in direct care time. This result lead to the conclusion that clinical measures in the CA do, indeed, differentiate resource use among residents with different care needs and that it will be possible to develop a categorization system that will be predictive of direct care time for different categories of residents.
Since there were over 400 clinical variables measured in the time study, the time study team embarked upon a data reduction process to make the data analysis task manageable and systematic. Therefore, the data analysis process is divided into several phases.
Phase Two: Establishing the building blocks. The team started with the same four clinical dimensions that were used in the Maine time study analyses: Impairment in Cognition, Clinical Complexity, Behavior and total score for performance on Activities of Daily Living. The goal was to define and combine these four dimensions so as to create three, four or five, major clinically and resource use relevant categories.
Impairment in Cognition The Cognitive Performance Scale developed by Morris et. al. (1994) uses five selected items from the clinical assessment instrument to produce a functionally meaningful seven-category hierarchical Cognitive Performance Scale score. The items are 1) short term memory; 2) ability to make decisions regarding tasks of daily living; 3) ability to make self understood; 4) comatose; 5) ability to feed self. The CPS measures a resident’s level of cognitive impairment from intact (level 0) to very severe impairment (level 6). The CPS scale corresponds closely with scores generated by the Mini-Mental State Examination.
Clinical Complexity refers to medical conditions that directly relate to the amount of care time(e.g. diabetes mellitus, multiple sclerosis, incontinence).
Behavior refers to resident behaviors that directly relate to the amount of care time(e.g. assaultive, wandering, frequent crying), including a score on a depression scale.
1 Regression analysis examines the ability of a number of variables, in combination, to predict the value of a dependent variable (direct care time, in the case of the time study). Stepwise methods are used as a systematic method for selecting variables that are the most “potent” predictors and eliminating those that are not. The predictive power of each variable is assessed mathematically while taking the effect of all other variables into consideration.2 The CPS score was developed by Morris, Fries et al using MDS data. It can be applied to the CA because items to be used for the CPS score in the CA are identical to those in the MDS. The scale runs from 0 to 6 and has been modeled after 2 standard cognitive assessment tools: the Mini Mental Status Examination and the Test for Severe Impairment. The scale ranges as follows: 0-intact, 1-borderline, 2-mild impairment, 3-moderate impairment, 4-moderately severe impairment, 5-severe impairment, 6-very severe impairment.3 Similar studies have reported explained variance (or percentage of variance explained) as measured by R2 between .10 and .50.
12
Activities of Daily living refer to the individual’s physical function in routine personal activities of daily living such as dressing, eating, and toileting. Ability to perform ADLs is the major determinant of the amount and type of caregiver support that is provided.
An important part of the team effort was to make decisions about criteria for inclusion in the clinically complex and behavior groups.The following modifications to the Maine definitions were considered:
1. Modify the list of clinical conditions and factors that defines a resident as “clinically complex” or as having a “behavior problem” based on the Washington data. While the Washington CA has many of the same variables as the Maine assessment instrument, it has additional variables. These variables may be important in resource use. Also, clinical variables that were not included in the Maine categorization system may be predictive of direct care time in the Washington State study and be a “candidate” for the Washington categorization system. For example, Parkinson’s Disease was not included in the Maine algorithm, yet was predictive of direct care time in the Washington study.
2. Reconsider the cutoff point of 5 used by Maine to assign a person to the “cognitively impaired” group.
3. Consider changing the break off points for the low, medium and high ADL categories within each of the major groups.
4. Consider reconfiguring major categories (e.g. form a separate category for those with co-occurring clinically complex conditions and cognitive impairment).
Statistics for Candidate Variables Tables I-VI provide information that helped the work teams make decisions about the Washington resource use categorization system. Statistics in Tables I-III are from Boarding Homes. Statistics from Tables IV-VI are from Adult Family Homes. These tables were useful when deciding which assessment items would be included in the Clinically Complex Category and the Behavior Category. Tables I and IV provide statistics for individual ADLs, total ADL score, and CPS score. They include:
1. Frequencies for each value of individual ADLs,2. Mean and Standard Deviation4 (S.D.)for the average minutes per day in direct care
time5 (referred hereafter as care time) for each ADL value; 3. Mean care time and S.D. for each item that comprises the CPS score4. Correlation coefficients for the relationship between total ADL score and care time and
total CPS score and care time.5. P-values for the correlation coefficients for clinical variables and care time, indicating
whether they were statistically significant 6.
4 R2, the coefficient of determination, is a standard summary measure of model performance when the dependent variable is continuous. R2 is often described as the fraction of total variability in the dependent variable (time) explained by or attributable to differences in risk among cases included in the model. Sometimes R2 is multiplied by 100 and described as the percentage of variation explained. Mean refers to the sum of the values for a group divided by the number in the group; Standard Deviation (SD) tells you how tightly all the values of a variable are clustered around the mean in a set of data. If the SD is large relative to the mean, that means the scores are widely spread. 5 Two steps go into arriving at mean care time in the Variable Tables: 1) direct care time per resident recorded over the three days of the study is summed, then divided by 3; 2) the number arrived at in step one for each person counted in a group (e.g. those with a BATHINGSELF score of 4) is summed and then divided by the number of persons in that group.6 In normal English, "significant" means important, while in Statistics "significant" means probably true (not due to chance). A research finding may be true without being important. When statisticians say a result is "highly significant" they mean it is very probably true. They do not (necessarily) mean it is highly important.
13

For each variable in the Clinically Complex and Behavior major categories we present the following statistics:
1. Value: for variables with other than a 0,1 answer, each value for a range of values is listed.
2. Freq: the frequency or number of participants in the study that had the condition listed in the left hand column of the table (for multiple category variables, frequencies correspond to each of several values in a range; for 0,1 variables, the frequency refers to the number of participants with a value of 1 indicating that they had the condition).
3. Mean: the mean care time for all participants with a given condition observed during the study (e.g. the mean care time for all 122 boarding home participants with a value of 4 for BATHINGSELF was 101).
4. S.D.: standard deviation from the mean in 3 above was 54 minutes.5. P: p-values indicate whether the difference in mean direct time among groups with and
without a medical condition are statistically significant and whether the correlation coefficients are statistically significant.
Factors that were considered in choosing final variables for clinically complex and behavior groups:1) p-value < .10 (statistical significance)2) If p-value > .10, n is very small, and there is reason to think it is still a predictor, then
consider it for inclusion.3) If p-value < .10 but the item is redundant with another item included in the grouper
(e.g. Alzheimer’s) then consider excluding it.4) Combinations of variables (e.g. cerebral palsy and ADL > 20)
V. DECISION MAKING BY HOME AND COMMUNITY SERVICES (HCS) STAFF AND CLINICAL RESOURCE GROUP (CRG)A major guiding principle in the Washington development process was that the groups or categories make clinical sense. To ensure that end, a group of clinical experts was convened to work with the time study team. The CRG included boarding home and adult family home representatives, nurse practitioners, social workers and other industry professionals. The members of the CRG were chosen for their knowledge about the:
levels of complexity, severity, and instability characterizing HCS residents’ clinical conditions;
special therapies or high-tech services that are provided; and cognitive impairments, behavioral characteristics, and environmental conditions
that affect the amount and type of care HCS residents require.The CRG met for three full-day sessions.
The CRG group was to provide feedback about:
1. Whether the groups derived from the statistical analysis makeclinical sense;
2. What other data elements could be combined with them so that they did make clinical sense; and
3. What incentives can be built into the system to ensure that certain types of specialized care are provided (e.g. should we pay more for certain services such as restorative nursing)?
14

The CRG group reviewed the work of the data analysis team. Then, the CRG and the time study team conducted a thorough examination of the most prominent candidate variables for clinically complex and behavioral symptoms (See Tables I - VI) based on the statistical analyses and also additional candidate variables that CRG members thought were important, but that weren’t supported by the statistics. Each variable was discussed. The CRG considered whether to: 1. add other variables or combinations of variables to Clinically Complex list;2. add other variables or combinations of variables to the Behavior list;3. eliminate variables from Clinically Complex list;4. eliminate variables from Behavior list;5. create a different break off point for the Cognitive Impaired group;6. reorder or reconfigure the hierarchy of the major categories.
The final set of candidate variables for “clinically complex” and the final set of variables for the “behavior” group were determined in two ways: 1. If the care time for a group of individuals who had a specific condition was shown to be
statistically significantly greater than the group without the condition, the specific condition became a “candidate” variable.
2. If the CRG identified a clinical factor that wasn’t believed to be a stand-alone predictor
of time statistically, but, based on clinical experience, it was a predictor of care time, a CRG/time study team group discussion occurred. A discussion of the circumstances of that condition often revealed that the factor was a predictor in combination with another factor. For example, individuals with cerebral palsy and high need for assistance with ADLs were thought to use time above and beyond what it would take for someone with high need for assistance in ADLs due to arthritis. In some cases in which there were not sufficient numbers of residents with a condition to test statistically (e.g. needs management of an IV), the group consensus was that the factor was important and should be included in the clinically complex category to address those future residents who had that clinical condition.
The very final list was arrived at by consensus. Some candidate variables fitting into the clinically complex dimension that were statistically significant stand alone candidates were challenged by the CRG team because the range of severity in the condition could be great. In many cases, it was clear that those with high ADL scores drove the statistics. As a result, many medical conditions that were clinically complex group candidates qualified only if the ADL score was over 20. Other decisions were more policy oriented. In several cases a condition would not qualify the resident for the clinically complex grouping unless the problem was being treated. For example, if a person had pressure ulcers, he would only qualify if he were receiving ulcer care.
Almost all behavioral variables that were statistically significant predictors of care time met the final cut. In some cases current behavior, regardless of whether it was easily alterable or not, was found to be predictive of time; in other cases, a behavior was predictive only if it was current and difficult to alter; and in other cases, behaviors that occurred in the past but were currently managed by the provider were predictive of care time.
15

The grouper, thus modified, was retested by the analysis staff. Most of the modification work by the Washington time study team involved changing the algorithm that goes into determining Clinically Complex and Behavioral Health. They added combinations of diagnoses and treatments that predicted time in our study but weren’t included in the Maine Grouper. In doing so, people who formerly would have been assigned to the physical and behavioral health major categories were added to the Clinically Complex category. Also, by adding behaviors that predict direct care in their study, but weren’t included in the Maine grouper, some residents were removed from the physical category, and added to the behavioral health category.
There is no easy rule of thumb for statistically evaluating the performance of a model using R2. For some studies of resource use, an R2 .05 was seen as indicative of a useful model. In other cases, like RUGII, an R2 of.50 was produced. The literature on risk adjustment is equivocal. Criteria for evaluating the performance of a model “depends on the circumstances” (Iezzoni, 1997). Although R2 is a valuable summary measure of model performance, it provides little intuitive feel for the ability of a model to discriminate among cases with high and low values for the dependent variable.
Therefore, we opted to not use R2 as the only arbiter of the utility and validity of the categorization system. It seemed more important to establish categories in which the means and medians differed significantly and in which the sequence of values made sense.
VI. RESULTSThe median amount of one-on-one care time received was 44 minutes per day for Boarding Home residents and 85 minutes per day for Adult Family Home residents. Data on residents’ activities of daily living, Cognitive Performance Score, and whether they were classified as clinically complex or having a behavior problem accounted for 47% of the variation in direct care time for boarding home residents and 30% of direct care time for adult family home residents. Since the distribution of direct care time was not normal, a statistical adjustment was made to the direct care time variable to assess whether the violation of the normality assumption in the Ordinary Least Squares Regression made much difference in R2. The regression models were rerun using the logarithm of direct care time. The percentage of direct care time explained by the model decreased slightly for Boarding Homes and increased slightly for Adult Family Homes. The explained variance for the log of direct care time was 44% for Boarding Home residents and 34% for Adult Family Homes. The slight change leads us to conclude that the adjustment and the complications it creates in communicating results are not warranted.
Figure 1 presents a diagram of the classification system for boarding home residents and Figure 2 presents a diagram of the classification system for adult family homes. The end product is a model that reflects the impact of activities of daily living, cognitive impairment, clinical complexity, and behavior problems on resource use. The model consists of four major groups of residents distinguished in terms of how cognitive impairment, clinical complexity, and behavioral problems combine. The table below illustrates the different combinations. Resource use for the four groups is on average hierarchical. Major Group A has the highest average direct care time of the four groups; Major Group D has the lowest average direct care time. (Mean = 94, Median = 83 for Major Group A for Boarding Homes as compared to Mean = 30, Median = 20 for Major Group D for Boarding Homes). (Mean = 133, Median = 121 for Major Group A for Adult Family Homes as compared to
16

Mean = 54, Median = 42 for Major Group D for Adult Family Homes). When the Analysis of Variance procedure was run, the four major groups accounted for 30% of the variance in direct care time for Boarding Home Residents and16% of the variance in direct care time for Adult Family Home residents.
Table 3.Severely
Impaired CognitionClinically Complex
Behavior
Major group A YES YESMajor group B NO YESMajor group C YES OR NO YESMajor group D YES OR NO
In addition to running an Analysis of Variance procedure where residents were assigned to the four major groups in Table, 3, the procedure was also run for each major group separately. Within each of the four major groups, a resident was further classified according to whether the need for assistance in performing activities of daily living was high, medium or low. The explained variance within each major group for High, Medium, and Low ADL levels is shown in Table 4. For example, for boarding home residents in Major Group A, 24% of the variance was explained by ADL level.
Table 4.Major group R2 for
Boarding Home ResidentsR2 for Adult
Family Home ResidentsA .23 .12B .30 .15C .38 .04D .22 .20
Thus, the classification system has 12 groups representing relatively homogeneous resident characteristics. When average time is calculated for the individuals who fall into those groups, some groups from different major categories have similar averages, suggesting that their resource use is similar. For example, among the Boarding Home Residents, the mean and median direct care time values for the 40 residents in Group 7 were similar to those for the 14 residents in group 2.
Our conclusion is that even though the explained variance (R2) for direct care time for residents in each of the four major groups was lower than that for the simple multiple regression model described earlier in this section, the fact that the differences in average direct care time differed significantly across the four major categories for both boarding homes and adult family homes supports the integrity of the model. Also the fact that averages decreased from the top category to the bottom category made sense substantively.
An expectation was that among all residents within a particular setting type, 1) residents would be found in most of the 12 clinical/resource use categories and 2) the distribution across the 12 categories would differ between boarding homes and adult family homes, with a greater proportion of adult family home residents fitting into higher resource group
17

major categories and higher levels of need for assistance with ADLs. The hope was that residents will group into the same clinical group regardless of the setting in which they are receiving services. Examination of the data shows that the above expectations were met.
VII. ISSUES IN EVALUATING THE VALIDITY AND UTILITY OF THE MODELAs noted earlier, the Washington categorization system is a hybrid in that it resulted from a combination of 1) exploratory regression analyses of the relationships between direct care time and clinical factors, 2) methods that have been tested and used elsewhere in the country (Maine and North Carolina), 3) clinical judgment, and 4) policy considerations. The Washington approach overcomes the limitations of a standard regression approach by acknowledging that many factors that wouldn’t be significant predictors in a multiple regression model are still important to consider in light of the fact that they are predictors in their own right. Though the explained variance of direct care time by the distinct categories of the Washington grouper does not equal that of the simpler model, the research team is satisfied that some of the more clinically driven decisions about what conditions would place a resident into the clinically complex or behavior category reflected what is happening in the real world of residential care. Those decisions will result in a more valid system for paying providers commensurate with the care time required for different levels of care need. Even with the compromises, the model that included ADL score, CPS score, Clinically Complex, and Behavior categories performed well, explaining 47% of variance for Boarding Home residents and 30% for Adult Family Home residents.
Two major concerns will be 1) the degree to which various groupings explain “variation” in care time for future residents. In other words, do the groupings developed on the basis of one dataset work as well statistically as they do on another dataset. This question of model performance is usually addressed by comparing risk-adjusted predictions of patients’ outcomes to actual outcomes. In the language of statisticians, this is referred to as predictive validity. Thus, a separate dataset from the one used to develop the model must be used to truly test the validity of this model. Often one half of the cases in a large dataset are used to develop a model and then the model is tested on the remaining cases. This was not possible in the case of this study, because the datasets are too small. (Other methods, such as boot strapping, can be used if half of your dataset does not provide sufficient cases for model development). Boot strapping involves repeated sampling with replacement from that database (Iezzoni, 1997). If statistics such as R2 for the test are similar to those produced with the development dataset, then predictive validity is said to be demonstrated. Therefore, it is recommended that plans be put in place to test the predictive validity of the current version of the Washington classification system.
18

Figure 1. Washington’s Resource Use Classification System: Boarding Home ResidentsN = 557
ASeverely Impaired Cognition
(CPS 4, 5, OR 6)
Clinically Complex
N= 118
Mean time = 94 SD = 51Median time = 83Mean ADL score = 15.4 SD = 6.7
________YES_______ ADLscore High 21-28 Medium 13-20 Low 2-12
High ADL n = 29Mean = 134SD = 48Median = 120
12
Medium ADL n = 38Mean = 91SD = 47Median = 68
11
Low ADL n = 51Mean = 74SD = 41Median = 67
10
BCognition: Intact-Moderately
Impaired(CPS <=3)
Clinically Complex
N= 91
Mean time = 75 SD = 53Median time = 66Mean ADL score = 10.0 SD = 6.2
________YES_______ ADLscore High 18-28 Medium 9-17 Low 2- 8
High ADL n = 11Mean = 130SD = 52Median = 115
9
Medium ADL n = 40Mean = 90SD = 51Median = 90
8
Low ADL n = 40Mean = 46SD = 35Median = 37
7
CCPS = 0-6
Not Clinically Complex
Behavior yes
N= 232
Mean time = 45 SD = 37Median time = 36Mean ADL score = 4.0 SD = 5.0
________YES_______ ADLscore High 15-28 Medium 6-14 Low 0- 5
High ADL n = 11Mean = 111SD = 39Median = 115
6
Medium ADL n = 53Mean = 74SD = 36Median = 70
5
Low ADL n = 168Mean = 32SD = 27Median = 26
4
DCPS = 0-6
Not Clinically Complex
Behavior no
N= 116
Mean time = 30 SD = 32Median time = 20Mean ADL score = 2.3 SD = 3.3
________YES_______ ADLscore High 10-28 Medium 5- 9 Low 0- 4
High ADL n = 5Mean = 89SD = 77Median = 51
3
Medium ADL n = 14Mean = 50SD = 45Median = 38
2
Low ADL n = 97Mean = 25SD = 21Median = 17
1
19

Figure 2. Washington’s Resource Use Classification System: Adult Family Home ResidentsN = 351
ASeverely Impaired Cognition
(CPS 4, 5, OR 6)
Clinically Complex
N = 130
Mean time = 133 SD = 69Median time = 121Mean ADL score = 20.6 SD = 6.2
________YES_______ ADLscore High 21-28 Medium 13-20 Low 2-12
High ADL n= 72Mean = 152SD = 68Median = 155
12
11
10
Medium ADL n= 42Mean = 116SD = 64Median = 100
Low ADL n= 16Mean = 88SD = 55Median = 72
BCognition: Intact-Moderately
Impaired(CPS <=3)
Clinically Complex
N = 104
Mean time = 110 SD = 79Median time = 94Mean ADL score = 14.4 SD = 7.1
_________YES______ ADLscore High 18-28 Medium 9-17 Low 2- 8
High ADL n= 38Mean = 149SD = 102Median = 115
9
8
7
Medium ADL n= 39Mean = 96SD = 50Median = 88
Low ADL n= 27Mean = 75SD = 50Median = 65
CCPS= 0-6
Not Clinically Complex
Behavior yes
N = 63
Mean time = 66 SD = 54Median time = 48Mean ADL score = 5.3 SD = 4.7
________YES_______ ADLscore High 15-28 Medium 6-14 Low 0- 5
High ADL n= 2Mean = 88SD = 66Median = 88
6
5
4
Medium ADL n= 22Mean = 78SD = 69Median = 57
Low ADL n= 39Mean = 57SD = 43Median = 44
DCPS=0-6
Not Clinically Complex
Behavior no
N = 54
Mean time = 54 SD = 44Median time = 42Mean ADL score = 5.5 SD = 5.8
________YES_______ ADLscore High 10-28 Medium 5- 9 Low 0- 4
High ADL n=11Mean = 76SD = 40Median = 66
3
2
1
Medium ADL n= 14Mean = 74SD = 60Median = 52
Low ADL n= 29Mean = 36SD = 27Median = 35
19

CRITERIA FOR CLINICALLY COMPLEX MAJOR CATEGORYFOR WASHINGTON GROUPER - BASIC MODEL3
Note: ADL score range is 2 – 28; bathing item not included. Items with asterisks are supported by the data (i.e. people with the condition used statistically significantly more direct care time than those without the condition). Items without asterisks were recommended by the Clinical Resource Group. We were not able to evaluate the statistical significance of those items because of the low numbers of clients with the conditions.
ANY ONE OF THE FOLLOWING:
ALS & ADL SCORE > 20 (Lou Gehrig’s disease)
*APHASIA & ADL SCORE > = 2 CEREBRAL PALSY & ADL SCORE > 20 *DIABETES MELLITUS & ADL SCORE >20 EMPHYSEMA COPD & (SOB or DIZZINESS VERTIGO) & ADL SCORE > = 2
EXPLICIT TERMINAL PROGNOSIS & ADL SCORE > 20 HEMIPLEGIA HEMIPARESIS & ADL SCORE > 20
MULTIPLESCLEROSIS & ADL SCORE > 20
*PARKINSON DISEASE & ADL SCORE > 20
*PATHOLOGICAL BONE FRACTURE & ADL SCORE > 20
(*PRESSURE ULCERS, ANY AREA OF PESISTENT SKIN REDNESS OR *PRESSURE ULCERS, PARTIAL LOSS OF SKIN LAYERS OR*PRESSURE ULCERS, A FULL THICKNESS OF SKIN IS LOST OR*SKIN PROBLEM, DESENSITIZED OR *SKIN PROBLEM, LESIONS OR SKIN PROBLEM, STASIS ULCERS ) & (RECEIVES ULCER CARE OR *RECEIVES PRESSURE RELIEVING DEVICES OR *RECEIVES TURNING PROGRAM OR RECEIVES APPLICATION OF DRESSINGS OR *RECEIVES WOUND/SKIN CARE) & ADL SCORE > = 2
*QUADRIPLEGIA QUADRIPARESIS & ADL SCORE > 20
*RHEUMATOID ARTHRITIS & ADL SCORE > 20
SKIN PROBLEM, BURNS & (RECEIVES APPLICATION OF DRESSINGS OR *RECEIVES WOUND/SKIN CARE OR *RECEIVES SURGICAL WOUND CARE) & ADL SCORE > = 2
20

((*INCONTINENT FREQUENTLY OR MORE OFTEN, BLADDER) OR (INCONTINENT FREQUENTLY OR MORE OFTEN, BOWEL)) & ((INDIVIDUAL USES SUPPLIES OR APPLIANCES, HAS LEAKAGE ONTO SKIN WITH SUCH, NECESSITATING CLEANSING/ASSISTANCE) OR (INDIVIDUAL DOES NOT USE SUPPLIES OR APPLIANCES AND HAS LEAKAGE ONTO SKIN) OR (INDIVIDUAL HAS SCHEDULED TOILET PLAN)) & ADL SCORE > = 2
*CURRENT SWALLOWING PROBLEM & NOT INDEPENDENT IN EATING & ADL SCORE > = 2
*EDEMA & ADL SCORE > 20
*PAIN, DAILY & ADL SCORE > 20
*BLOOD GLUCOSE, NEEDS & ADL SCORE > = 2
*BOWEL PROGRAM RECEIVES & NEEDS & AD LSCORE >10
DIALYSIS, NEEDS & ADL SCORE > = 2
(ENTERAL FEEDING TUBE OR PARENTERAL IV OR *TUBE FEEDINGS, NEEDS) & ((TOTAL CALORIES RECEIVED PER IV OR TUBE WAS GREATER THAN 50%) OR (TOTAL CALORIES PER IV OR TUBE WAS 25-50% & FLUID INTAKE GREATER THAN 2 CUPS)) & ADL SCORE > = 2
*HOSPICE, NEEDS & ADL SCORE > 20
INJECTIONS, NEEDS & ADL SCORE > = 2
INTRAVENOUS, NEEDS & ADL SCORE > = 2
MANAGEMENT OF IV, NEEDS & ADL SCORE > = 2
*OSTOMY CARE, NEEDS & ADL SCORE > = 2
*OXYGEN THERAPY, NEEDS & ADL SCORE > = 2
RADIATION, NEEDS & ADL SCORE > = 2
*RANGE OF MOTION RESTORATIVE CARE, PASSIVE, RECEIVES & NEEDS & ADL SCORE >10
*WALKING RESTORATIVE CARE, RECEIVES & NEEDS & ADL SCORE >10
*SUCTIONING, NEEDS & ADL SCORE > = 2
TRACHEOSTOMY CARE, NEEDS & ADL SCORE > = 2
VENTILATOR CARE, NEEDS & ADL SCORE > = 2
21

CRITERIA FOR BEHAVIOR MAJOR CATEGORY
FOR WASHINGTON GROUPER – BASIC MODEL 3
Note: Items with asterisks are supported by the data (i.e. people with the condition used statistically significantly more direct care time than those without the condition). Items without asterisks were recommended by the Clinical Resource Group. We were not able to evaluate the statistical significance of those items because of the low numbers of clients with the conditions
ANY ONE OF THE FOLLOWING:*ASSAULTIVE, CURRENT
*COMBATIVE, CURRENT
*COMBATIVE, IN PAST BUT CURRENTLY MANAGED
*CRYING, CURRENT FREQUENCY 4 OR MORE DAYS PER WEEK
DELUSIONS, IN PAST BUT CURRENTLY MANAGED *DEPRESSION SCORE >= 6
*DISROBES, NOT EASILY ALTERED *EASILY IRRITATED, NOT EASILY ALTERED
*EATS NONEDIBLE, CURRENT
**EATS NONEDIBLE, IN PAST BUT CURRENTLY MANAGED
*HALLUCINATIONS, CURRENT
*HIDING ITEMS, IN PAST BUT CURRENTLY MANAGED
*HOARDING, IN PAST BUT CURRENTLY MANAGED
*MENTAL HEALTH NEED
*REPETITIVE ANXIOUS COMPLAINTS AND QUESTIONS, CURRENT DAILY *REPETITIVE ANXIOUS COMPLAINTS AND QUESTIONS, IN PAST BUT CURRENTLY MANAGED
*REPETITIVE PHYSICAL MOVEMENT, CURRENT DAILY
*RESISTIVE TO CARE, CURRENT
*RESISTIVE TO CARE, IN PAST BUT CURRENTLY MANAGED
*SEXUAL ACTING OUT, CURRENT
*SEXUAL ACTING OUT, IN PAST BUT CURRENTLY MANAGED
*SPITTING, NOT EASILY ALTERED *SPITTING, IN PAST BUT CURRENTLY MANAGED
*THROWS ITEMS, CURRENT **UNSAFE SMOKING, NOT EASILY ALTERED
22

CRITERIA FOR BEHAVIOR MAJOR CATEGORY
*UP AT NIGHT, CURRENT
*WANDERS EXIT SEEKING, CURRENT *WANDERS EXIT SEEKING, IN PAST BUT CURRENTLY MANAGED *WANDERS IN RESIDENCE, CURRENT
WANDERS IN RESIDENCE, IN PAST BUT CURRENTLY MANAGED
*YELLING, CURRENT FREQUENCY 4 OR MORE DAYS PER WEEK
23

References
Abt Associates (1999) Case-Mix Adjustment for a National Home Health Prospective Payment System: Second Interim Report.
Daley, J. & Shwartz, M. (1999). Developing risk-adjustment methods. In Risk Adjustment for Measuring Healthcare Outcomes. (Ed. Lisa I. Iezzoni). Chicago: Health Administration Press.
24