clinically appropriate and cost - effective placement … · dobson davanzo & associates, llc...
TRANSCRIPT

Dobson DaVanzo & Associates, LLC Vienna, VA 703.260.1760 www.dobsondavanzo.com
Clinically Appropriate and Cost-Effective Placement (CACEP) Study Final Report Summary
PREPARED FOR: The Alliance for Home Health Quality & Innovation (AHHQI) PRESENTED BY: Al Dobson, Ph.D. PREPARED BY: Al Dobson, Ph.D., Joan DaVanzo, Ph.D., M.S.W., Audrey El-Gamil, Steven Health, M.P.A., Matthew Shimer, Ph.D., Greg Berger, Anne Pick, M.P.H., Nikolay Manolov, Ph.D. & Jean M. Freeman, M.A. October 10, 2012

2 © 2012 Dobson DaVanzo & Associates, LLC. All Rights Reserved.
• The Medicare Trust Fund is under considerable strain • The Trust Fund is projected to become insolvent by 2024
• There is significant opportunity for efficiencies and savings • Index hospital plus post-acute episodes represent >50% of Medicare FFS spending • Hospital readmissions double Medicare episode expenditures and patient pathways • There is considerable overlap in the distribution and characteristics of patients
treated across post-acute care settings
• Shifting patients into more cost-effective, clinically appropriate settings could achieve substantial Medicare savings • The Trust Fund could be extended by about 2.5 years through clinically appropriate
and cost-effective patient placement and restructuring of care delivery
Study Highlights

3 © 2012 Dobson DaVanzo & Associates, LLC. All Rights Reserved.
$34.7(2.6%*)
$70.0 (5.3%*)
$100.0 (7.5%*)
$0
$20
$40
$60
$80
$100
$120
Med
icar
e Po
st-D
isch
arge
Sav
ings
(in
billi
ons)
• CACEP-modeled reform could produce $34.7 billion in Medicare savings (2014-2023) without payment adjustment. With a 5.3% payment adjustment, projected savings reach $70 billion. With a 7.5% adjustment, projected savings reach $100 billion.
Projected Medicare 10-Year Savings (2014-2023) as a Percent of Medicare Post-Discharge Spending
CACEP w/o payment adjustment
CACEP w/payment adjustment
Study Highlights: Savings Projections
Source: Dobson | DaVanzo analysis of research-identifiable 5% SAF for all sites of service, 2008, wage index adjusted by setting and geographic region, and standardized to 2009 dollars. * Percent of post-acute care spending after discharge from the Index hospital.

4 © 2012 Dobson DaVanzo & Associates, LLC. All Rights Reserved.
Study Highlights: Trust Fund Projections
Source: Dobson | DaVanzo analysis of research-identifiable 5% SAF for all sites of service, 2008, wage index adjusted by setting and geographic region, and standardized to 2009 dollars. 2012 Annual Report of the Boards of Trustees of the Federal Hospital Insurance and Federal Supplementary Medical Insurance Trust Funds.
-$100
-$50
$0
$50
$100
$150
$200
2013 2014 2015 2016 2017 2018 2019 2020 2021 2022 2023 2024 2025 2026 2027 2028
Med
icar
e HI
Trus
t Fun
d Ba
lanc
e (in
Bill
ions
)
CACEP with Reengineering ($100 Billion) CACEP with Reengineering ($70 Billion) CACEP ($34 Billion) Current Law
Note: CACEP with Reengineering reflects an explicit policy that saves $100 Billion or $70 Billion across Medicare Part A and Part B. Part A savings represents $92 billion or $66 billion respectively. Differences in trust fund balance are offset by an interest income of 4%.
5 © 2012 Dobson DaVanzo & Associates, LLC. All Rights Reserved.
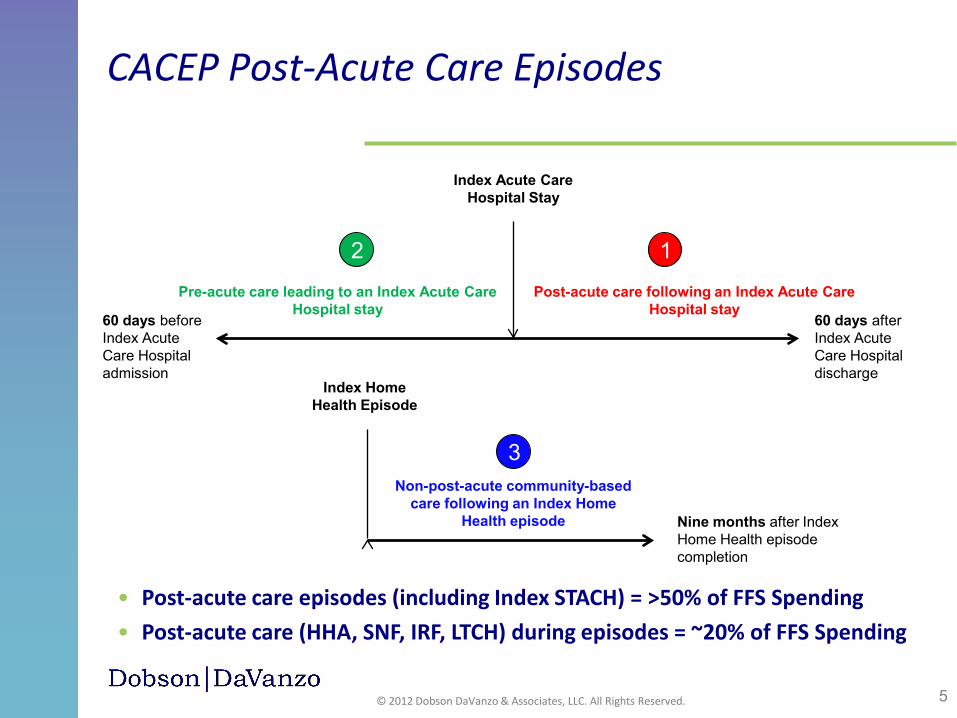
CACEP Post-Acute Care Episodes
• Post-acute care episodes (including Index STACH) = >50% of FFS Spending • Post-acute care (HHA, SNF, IRF, LTCH) during episodes = ~20% of FFS Spending
Index Acute Care Hospital Stay
60 days after Index Acute Care Hospital discharge
60 days before Index Acute Care Hospital admission
Post-acute care following an Index Acute Care
Hospital stay
Pre-acute care leading to an Index Acute Care
Hospital stay
Index Home Health Episode
Nine months after Index Home Health episode completion
Non-post-acute community-based
care following an Index Home Health episode
1 2
3

6 © 2012 Dobson DaVanzo & Associates, LLC. All Rights Reserved.
• Episode frequency is highly concentrated in a relatively few MS-DRGs • Patient overlap across first settings may be considerable
• The top MS-DRGs and primary chronic conditions by episode payment and frequency are highly comparable across first settings; therefore, MS-DRGs and chronic conditions may not meaningfully risk-adjust episode payments
• The variation in the episode payments is driven by differences in post-acute care payments, first setting, and complexity of the bundle (i.e., number of “stops” in patient pathway)
• Formal first settings (after index STACH stay) have very different expenditure levels, ordered from HHA as the lowest to SNF, IRF, and then LTCH as the highest
Key Findings from CACEP Working Paper Series:
Episode Frequency & Expenditures

7 © 2012 Dobson DaVanzo & Associates, LLC. All Rights Reserved.
• Patient pathways comprise the number of sequence “stops” a patient makes across various providers over time once a patient leaves the index STACH • Providers are not accustomed to thinking in terms of pathways, as patients leave the
hospital and visit numerous different providers; siloed PPSs encourage this behavior
• There are many patient pathways within each MS-DRG • More complex pathways are associated with higher Medicare payments • Differences in patient pathways drive the expenditure variability by first setting and
within and across MS-DRGs
• Presence of a readmission doubles Medicare expenditures and pathway complexity (i.e., number of sequence stops)
• Patient pathways and presence of a readmission is correlated with: • Patient demographics (including functional status) • Severity of patient chronic conditions • Number of patient comorbidities • Medical/surgical distinctions • First setting (e.g., HHA vs. SNF vs. IRF vs. LTCH) • Region
Key Findings from CACEP Working Paper Series:
Patient Pathways & Readmissions

8 © 2012 Dobson DaVanzo & Associates, LLC. All Rights Reserved.
MS-DRGs Ranked by Medicare Episode Payment Show Considerable Overlap by First Setting
MS-DRG Med/Surg Overall HHA SNF IRF LTCH 470: Major joint replacement or reattachment of lower extremity w/o MCC Surgical 1 1 1 1 34 871: Septicemia or severe sepsis w/o MV 96+ hours w MCC Medical 2 6 3 20 3 291: Heart failure & shock w MCC Medical 3 2 7 29 9 003: ECMO or trach w MV 96+ hrs or PDX exc face, mouth & neck w maj O.R. Surgical 4 91 31 10 1 194: Simple pneumonia & pleurisy w CC Medical 5 9 5 65 22 481: Hip & femur procedures except major joint w CC Surgical 6 73 2 3 53 292: Heart failure & shock w CC Medical 7 3 14 63 37 065: Intracranial hemorrhage or cerebral infarction w CC Medical 8 29 6 2 30 392: Esophagitis, gastroent & misc digest disorders w/o MCC Medical 9 20 35 125 80
Overall Top 9 MS-DRGs Ranked by Medicare Episode Payment for Post-Acute Care Episodes by Select First Setting (2007-2009)
Source: Dobson | DaVanzo analysis of research-identifiable 5% SAF for all sites of service, 2007-2009, wage index adjusted by setting and geographic region, and standardized to 2009 dollars. Medicare Episode Payment includes care from all facility-based and ambulatory care settings and excludes beneficiary co-payments, DME, and Part D payments.

9 © 2012 Dobson DaVanzo & Associates, LLC. All Rights Reserved.
* Primary Chronic Condition not present in this setting Source: Dobson | DaVanzo analysis of research-identifiable 5% SAF for all sites of service, 2007-2009, wage index adjusted by setting and geographic region, and standardized to 2009 dollars. Medicare Episode Paid includes care from all facility-based and ambulatory care settings and excludes beneficiary co-payments and Part D payments.
Primary Chronic Condition HHA Overall SNF IRF LTCH STACH Community Rheumatoid Arthritis/Osteoarthritis 1 1 1 2 3 1 1 Osteoporosis 2 2 2 1 1 3 2 Chronic Obstructive Pulmonary Disease 3 5 5 5 7 4 4 CHF*COPD 4 3 3 3 2 2 3 DIABETES*CHF 5 4 4 4 4 5 5 CHF*RENAL 6 6 7 6 5 6 6 None 7 8 9 9 * 10 7 Lung Cancer 8 9 8 8 * 8 9 Hip/Pelvic Fracture 9 7 6 7 6 7 8 Ischemic Heart Disease 10 10 10 10 * 9 10 Depression 11 11 11 12 * * 12 Cataract 12 12 17 * * 11 11 Diabetes 13 13 13 13 * * 15 Chronic Kidney Disease 14 15 16 14 * * 14 Heart Failure 15 14 12 11 * * 13
Frequencies of Primary Chronic Conditions Also Show Considerable Overlap by First Setting Example: MS-DRG 470
Primary Chronic Condition for MS-DRG 470 (major joint replacement w/o MCC) for Post-Acute Care Episodes (Ranked by Medicare Episode Paid) by Select First Setting (2007-2009)
10 © 2012 Dobson DaVanzo & Associates, LLC. All Rights Reserved.
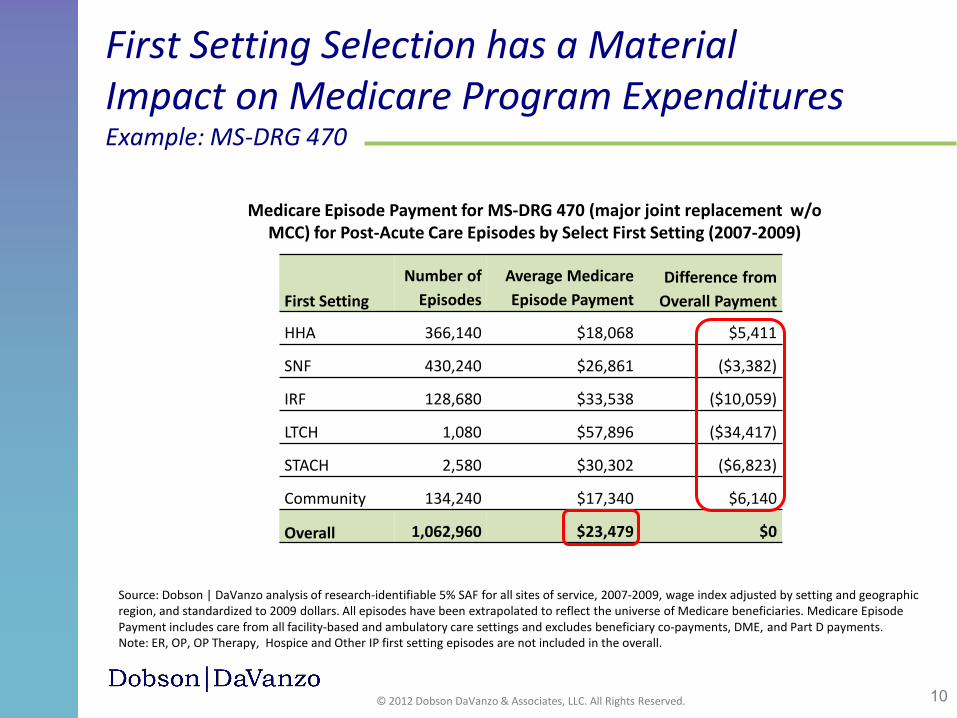
First Setting Number of
Episodes Average Medicare Episode Payment
Difference from Overall Payment
HHA 366,140 $18,068 $5,411
SNF 430,240 $26,861 ($3,382)
IRF 128,680 $33,538 ($10,059)
LTCH 1,080 $57,896 ($34,417)
STACH 2,580 $30,302 ($6,823)
Community 134,240 $17,340 $6,140
Overall 1,062,960 $23,479 $0
Medicare Episode Payment for MS-DRG 470 (major joint replacement w/o MCC) for Post-Acute Care Episodes by Select First Setting (2007-2009)
Source: Dobson | DaVanzo analysis of research-identifiable 5% SAF for all sites of service, 2007-2009, wage index adjusted by setting and geographic region, and standardized to 2009 dollars. All episodes have been extrapolated to reflect the universe of Medicare beneficiaries. Medicare Episode Payment includes care from all facility-based and ambulatory care settings and excludes beneficiary co-payments, DME, and Part D payments. Note: ER, OP, OP Therapy, Hospice and Other IP first setting episodes are not included in the overall.
First Setting Selection has a Material Impact on Medicare Program Expenditures Example: MS-DRG 470

11 © 2012 Dobson DaVanzo & Associates, LLC. All Rights Reserved.
Pathway Pattern
Percent of Episodes
Average Medicare Payment
A-H-C 19.6% $17,172 A-S-H-C 12.4% $25,073 A-C 7.4% $14,003 A-S-C 5.0% $22,517 A-I-H-C 4.0% $31,839 Subtotal 48.4% $20,483 Other 51.6% $25,333 Total 100.0% $22,986
Patient Pathways for Medical Conditions Show More Variation than for Surgical Conditions Example: MS-DRGs 470 & 291
MS-DRG 470: major joint replacement w/o MCC
Source: Dobson | DaVanzo analysis of research-identifiable 5% SAF for all sites of service, 2007-2009, wage index adjusted by setting and geographic region and standardized to 2009 dollars. Average Medicare Episode Payment includes care from all facility-based and ambulatory care settings and excludes beneficiary co-payments, DME, and Part D payments.
Facility-Based (and Home Health) Sequence Stops: A=STACH (Index or Readmission) H=HHA I=IRF L=LTCH S=SNF
Ambulatory-Based Sequence Stops: C=Community (Physician and Outpatient) E=ER P=OP Therapy T=Hospice Z=Other IP
MS-DRG 291: heart failure & shock w MCC
Pathway Pattern
Percent of Episodes
Average Medicare Payment
A-C 23.8% $11,240 A-H-C 7.4% $13,111 A 6.6% $12,024 A-C-A-C 4.0% $24,774 A-S 3.2% $21,717 Subtotal 45.0% $13,612 Other 55.0% $28,078 Total 100.0% $21,572
Overall 5 Most Frequent Patient Pathways for Post-Acute Care Episodes (2007-2009)

12 © 2012 Dobson DaVanzo & Associates, LLC. All Rights Reserved.
1.47
3.501.32
2.18
0.00
1.00
2.00
3.00
4.00
5.00
6.00
Episode Does Not Contain Readmission
Episode Contains Readmission
Aver
age
Num
ber o
f Seq
uenc
e St
ops
Average Facility-based Sequence StopsAverage Ambulatory-based Sequence Stops
Average Facility- and Ambulatory-Based Sequence Stops by Readmission Status
Patient Pathways with Readmissions Double Medicare Episode Payments
Source: Dobson | DaVanzo analysis of research-identifiable 5% SAF for all sites of service, 2007-2009, wage index adjusted by setting and geographic region and standardized to 2009 dollars. Average Medicare Episode Payment includes care from all facility-based and ambulatory care settings and excludes beneficiary co-payments, DME, and Part D payments.
2.79
5.68
$0
$5,000
$10,000
$15,000
$20,000
$25,000
$30,000
$35,000
$40,000
Episode Does Not Contain Readmission
Episode Contains Readmission
Aver
age
Med
icare
Epi
sode
Pay
men
t
$15,335
$33,926
Average Medicare Episode Payment by Readmission Status
13 © 2012 Dobson DaVanzo & Associates, LLC. All Rights Reserved.
• Consistent with our assumptions, Cutler notes: (Cutler DM, Davis K, Stremikis K, 2010)
• The “effect of multiple large policy changes may differ substantially from the effects of small trials of single interventions. In such a situation, it is imperative to cast a wider net than traditional standards do.”
• Thorpe and colleagues also note: (Thorpe KE, Ogden LL, 2010)
• “Reform-based initiatives could produce major gains in a relatively short period of time.” Reform, “…demands bold initiatives that are based on the best evidence available and swiftly implemented.”
• Although full scale programs to test the scalability of local programs do not exist, literature suggests that providers are able to adapt the way care is provided to achieve the required results both for patients and for the Medicare program
Literature-based Assumptions Guided our Modeling
There are various factors that the models do not (and cannot) account for that will influence whether estimated results could actually be achieved. Accordingly, our results must be considered indicative of the general range of savings that could be achieved, rather than definitive predictions of what would happen if specific policies were adopted.

14 © 2012 Dobson DaVanzo & Associates, LLC. All Rights Reserved.
• The Veterans Affairs (VA) Home-Based Primary Care (HBPC) program has shown that a national program using existing clinical care tools is able to use home care to produce sizeable savings • In 2002, the VA achieved overall net savings of 24% through the HBPC program, and
later replicated these results in 2007 • Reduction in hospital admissions by 31%, nursing home admissions by 25%, hospital
days of care by 80%, and nursing home days of care by 90%
• The Medicare home health benefit may need to be reconsidered
Literature-based Assumptions Guided our Modeling (cont’d)
Differences Between VA HBPC & Medicare Home Care are Significant VA Home-Based Primary Care Targets complex chronic disease Comprehensive primary care Skilled care not required Strict homebound not required Accepts declining status Interdisciplinary team Longitudinal care Reduces hospital days Limited geography & intensity
Medicare Home Health Remediable conditions Specific problem-focused Requires skilled care Must be homebound Requires improvement One or multidisciplinary Episodic, post-acute care No definitive impact Anywhere; anytime

15 © 2012 Dobson DaVanzo & Associates, LLC. All Rights Reserved.
Summary of Analytic Model Savings
Source: Dobson | DaVanzo analysis of research-identifiable 5% SAF for all sites of service 2008, wage index adjusted by setting and geographic region, and standardized to 2009 dollars. * Post-discharge spending refers to all spending during the post-acute care episode, excluding the index acute care hospitalization. ** Represents the percent of post-acute care spending and the index acute care hospitalization.
One-Year Medicare
Savings (in billions)
(2008)
Percent of Post-Discharge
Spending* (2008)
10-Year Medicare
Savings (in billions)
(2014-2023) Restructuring through Clinically Appropriate and Cost-Effective Placement Models
Model 1A: Cascade of Care to Most Clinically Appropriate and Cost-Effective Setting Model (Hybrid Model) $2.5 2.6% $34.7 Model 1B: Moderate Restructuring (Reengineering) of Care Beyond CACEP $5.1 5.3% $70.0 Model 1C: Aggressive Restructuring (Reengineering) of Care Beyond CACEP $7.3 7.5% $100.0
Hospital Reduction Model for Ambulatory Care Sensitive Conditions Model 2: Hospital Reduction Model for Ambulatory Care Sensitive Conditions $3.0 1.7%** $37.7
Hospital Readmission Reduction Models Within HHA First Setting Episodes Model 3: Regional Readmission Reduction Model $0.5 0.5% $10.3 Model 4A: National Readmission Reduction Model (25%) $0.2 0.2% $4.2 Model 4B: National Readmission Reduction Model (50%) $0.4 0.4% $8.3 Model 4C: National Readmission Reduction Model (75%) $0.6 0.7% $12.5

16 © 2012 Dobson DaVanzo & Associates, LLC. All Rights Reserved.
Simulated Clinically Appropriate First Setting OP Therapy HHA SNF IRF LTCH
Curr
ent F
irst
Sett
ing
OP Therapy 29% 71% 0% 0% 0% HHA 14% 86% 0% 0% 0% SNF 5% 15% 80% 0% 0% IRF 3% 9% 18% 69% 0% LTCH 0% 0% 31% 11% 58%
Clinically Appropriate and Cost-Effective Placement (CACEP) Effect
Distribution of Patient Episodes by Current First Setting and Simulated Clinically Appropriate First Setting Among Select MS-DRGs
Source: Dobson | DaVanzo analysis of research-identifiable 5% SAF for all sites of service, 2008, wage index adjusted by setting and geographic region.
Caregiver Req’d
LTCH
SNF IRF
HHA OPT
Modeled Patient Shifting

17 © 2012 Dobson DaVanzo & Associates, LLC. All Rights Reserved.
Clinically Appropriate and Cost-Effective Placement (CACEP) Effect (cont’d)
First Setting Current First
Setting
Clinically Appropriate First
Setting OP Therapy 6.9% 9.5% HHA 35.8% 43.7% SNF 45.0% 38.4% IRF 10.6% 7.5% LTCH 1.6% 0.9% Total 100% 100%
Source: Dobson | DaVanzo analysis of research-identifiable 5% SAF for all sites of service, 2008, wage index adjusted by setting and geographic region.
Change in Distribution of Patient Episodes from Simulated Clinically Appropriate First Setting Among Select MS-DRGs

18 © 2012 Dobson DaVanzo & Associates, LLC. All Rights Reserved.
• There is considerable patient overlap across post-acute care settings
• Shifting patients to clinically appropriate, lower cost post-acute care
settings may optimize care and increase program efficiency
• CACEP-modeled reform with payment adjustment could produce additional Medicare savings and extend the Medicare Trust Fund by 2.5 years
• The CACEP model may be useful to policymakers as they develop Medicare reform options
Study Implications

19 © 2012 Dobson DaVanzo & Associates, LLC. All Rights Reserved.
Dobson DaVanzo & Associates, LLC (Dobson|DaVanzo) is a health care economics consulting firm based in the
Washington, D.C. metropolitan area
Contact Information:
(703) 260-1760 [email protected]
www.dobsondavanzo.com
440 Maple Avenue East, Suite 203 Vienna, VA 22180
Dobson|DaVanzo