clinical safety & effectiveness session # 7
DESCRIPTION
Clinical Safety & Effectiveness Session # 7. Venous Thromboembolism Prophylaxis. DATE. E ducating for Qu ality I mprovement & P atient S afety. What We Are Trying to Accomplish?. OUR AIM STATEMENT. - PowerPoint PPT PresentationTRANSCRIPT
1
Clinical Safety & EffectivenessSession # 7
Venous Thromboembolism Prophylaxis
DATEEducating for Quality Improvement & Patient Safety
2
What We Are Trying to Accomplish?OUR AIM STATEMENT
The aim of this project is to increase the compliance of ordering Venous
Thromboembolism Prophylaxis for at risk 9th Floor General Medicine patients at
University Hospital from 76% to 95% by June 1, 2011.
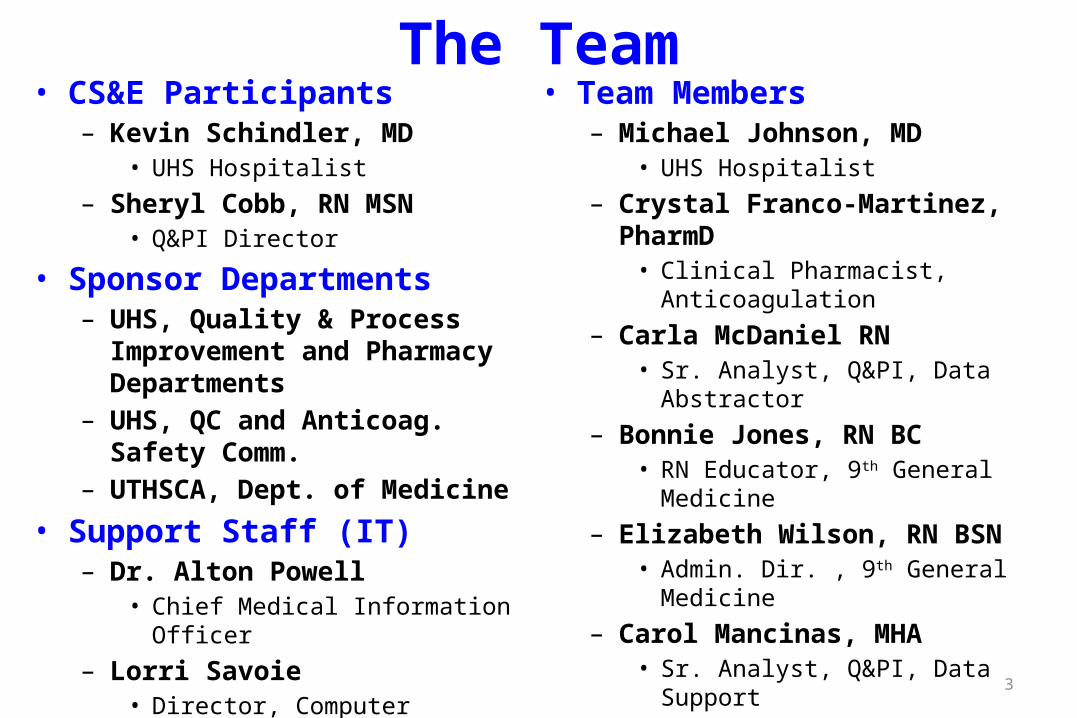
The Team• CS&E Participants
– Kevin Schindler, MD• UHS Hospitalist
– Sheryl Cobb, RN MSN• Q&PI Director
• Sponsor Departments– UHS, Quality & Process Improvement
and Pharmacy Departments – UHS, QC and Anticoag. Safety Comm.– UTHSCA, Dept. of Medicine
• Support Staff (IT)– Dr. Alton Powell
• Chief Medical Information Officer– Lorri Savoie
• Director, Computer Training Services
• Team Members– Michael Johnson, MD
• UHS Hospitalist– Crystal Franco-Martinez, PharmD
• Clinical Pharmacist, Anticoagulation– Carla McDaniel RN
• Sr. Analyst, Q&PI, Data Abstractor– Bonnie Jones, RN BC
• RN Educator, 9th General Medicine– Elizabeth Wilson, RN BSN
• Admin. Dir. , 9th General Medicine – Carol Mancinas, MHA
• Sr. Analyst, Q&PI, Data Support
• Facilitator– Amruta Parekh, MD MPH
3
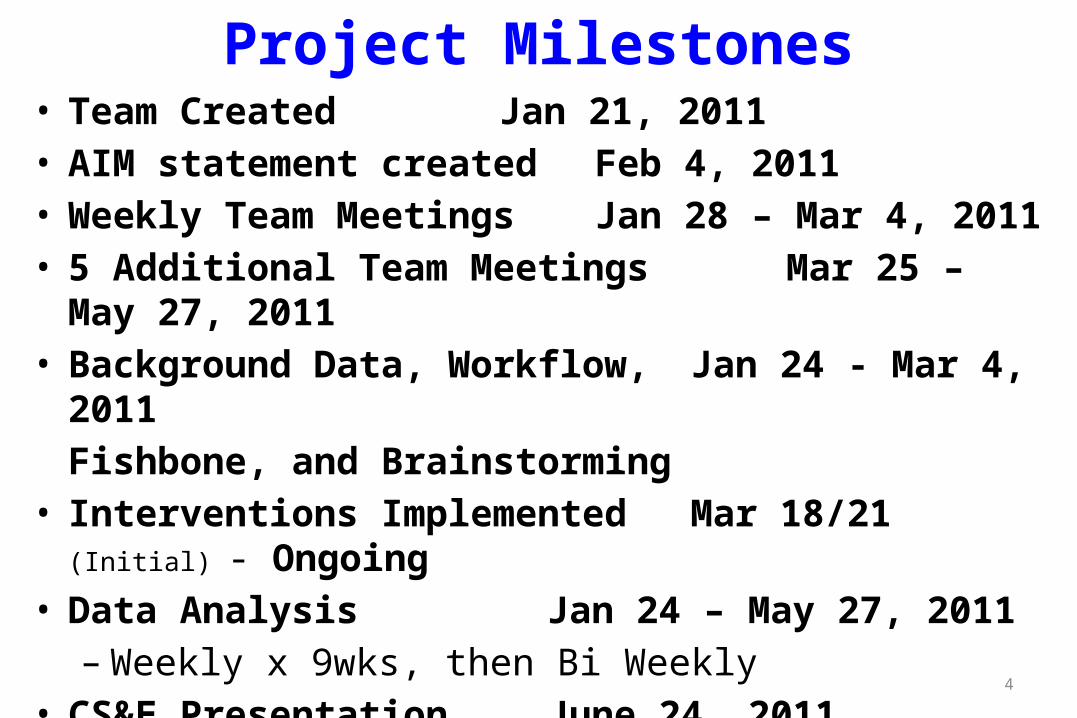
Project Milestones• Team Created Jan 21, 2011• AIM statement created Feb 4, 2011• Weekly Team Meetings Jan 28 – Mar 4, 2011 • 5 Additional Team Meetings Mar 25 – May 27, 2011• Background Data, Workflow, Jan 24 - Mar 4, 2011
Fishbone, and Brainstorming• Interventions Implemented Mar 18/21 (Initial) -
Ongoing • Data Analysis Jan 24 – May 27, 2011
– Weekly x 9wks, then Bi Weekly• CS&E Presentation June 24, 2011
4
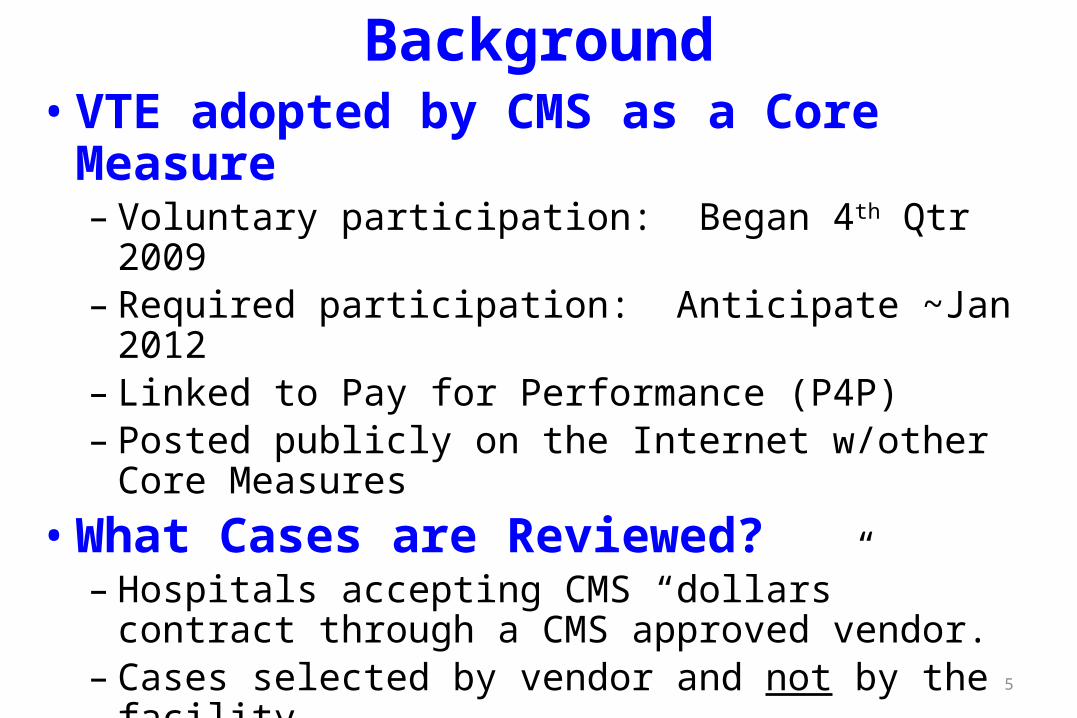
Background
5
• VTE adopted by CMS as a Core Measure– Voluntary participation: Began 4th Qtr 2009– Required participation: Anticipate ~Jan 2012– Linked to Pay for Performance (P4P)– Posted publicly on the Internet w/other Core Measures
• What Cases are Reviewed?– Hospitals accepting CMS “dollars” contract through a CMS
approved vendor. – Cases selected by vendor and not by the facility– Based on ICD-9 and CPT coding at discharge– Each case does not always meet criteria for all measures
• Meets criteria for VTE prophylaxis at admission but not at d/c
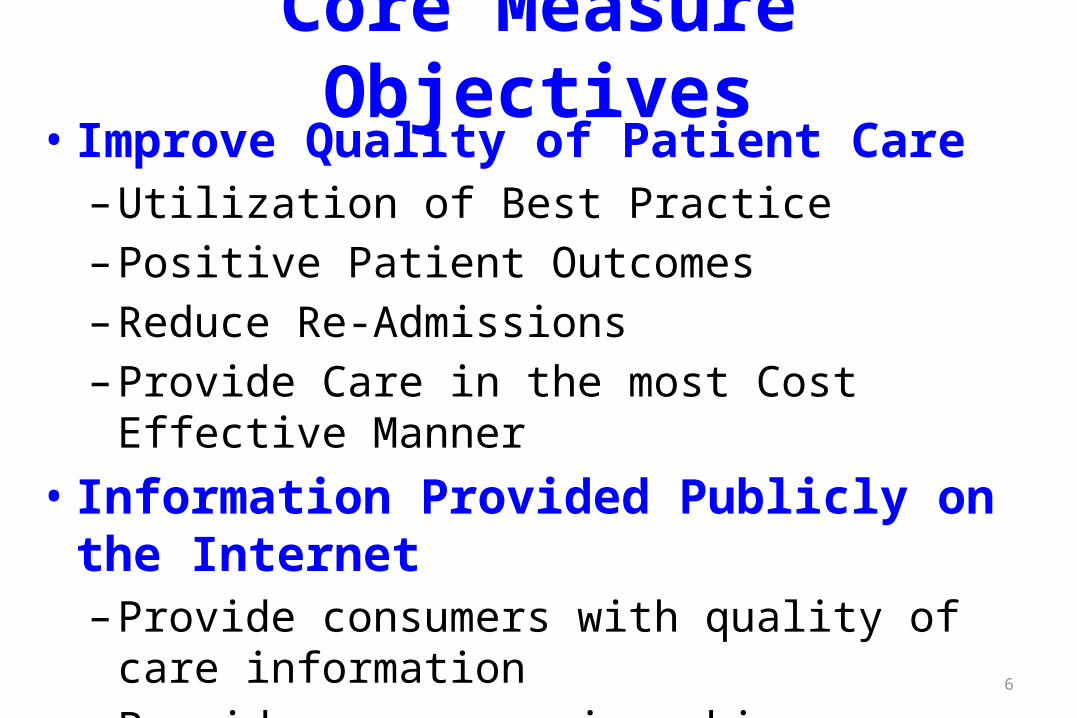
Core Measure Objectives• Improve Quality of Patient Care
– Utilization of Best Practice– Positive Patient Outcomes– Reduce Re-Admissions– Provide Care in the most Cost Effective Manner
• Information Provided Publicly on the Internet– Provide consumers with quality of care information– Provide consumers in making more informed
decisions about their healthcare6

7
VTE Core Measures
• VTE-1 VTE Prophylaxis (focus of the project)• VTE-2 Intensive Care Unit VTE Prophylaxis• VTE-3 VTE Patients with Anticoagulation Overlap Therapy• VTE-4 VTE Patients Receiving Unfractionated Heparin with
Dosages/Platelet Count Monitoring by Protocol• VTE-5 VTE Discharge Instructions• VTE-6 VTE Incidence of Potentially-Preventable VTE
Note: Additionally, there are two VTE measures included in the SCIP Core Measure (Surgical Care Improvement Project)
8
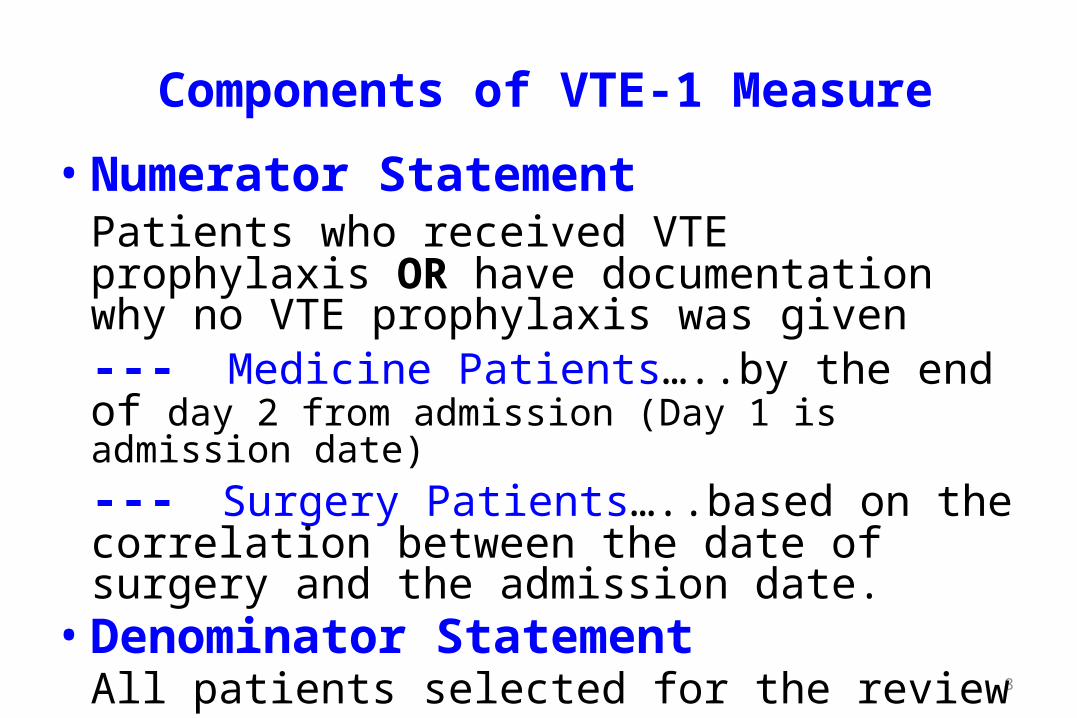
Components of VTE-1 Measure
• Numerator StatementPatients who received VTE prophylaxis OR have documentation why no VTE prophylaxis was given--- Medicine Patients…..by the end of day 2 from admission (Day 1 is admission date)--- Surgery Patients…..based on the correlation between the date of surgery and the admission date.
• Denominator Statement All patients selected for the review
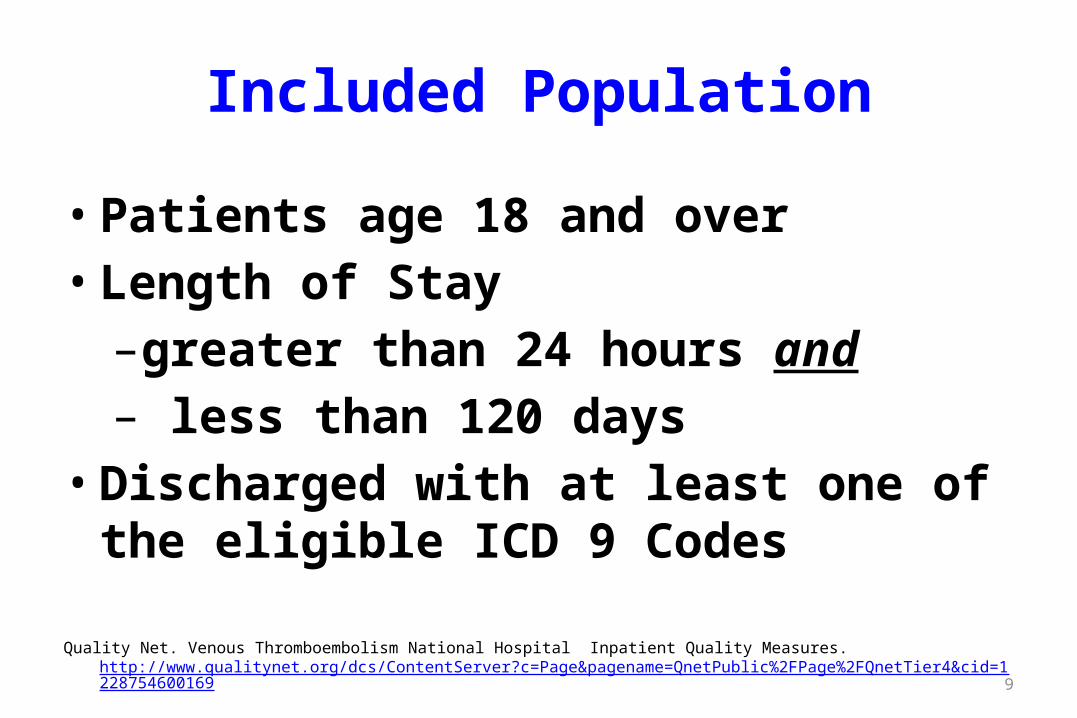
Included Population
• Patients age 18 and over• Length of Stay
–greater than 24 hours and– less than 120 days
• Discharged with at least one of the eligible ICD 9 Codes
Quality Net. Venous Thromboembolism National Hospital Inpatient Quality Measures. http://www.qualitynet.org/dcs/ContentServer?c=Page&pagename=QnetPublic%2FPage%2FQnetTier4&cid=1228754600169
9
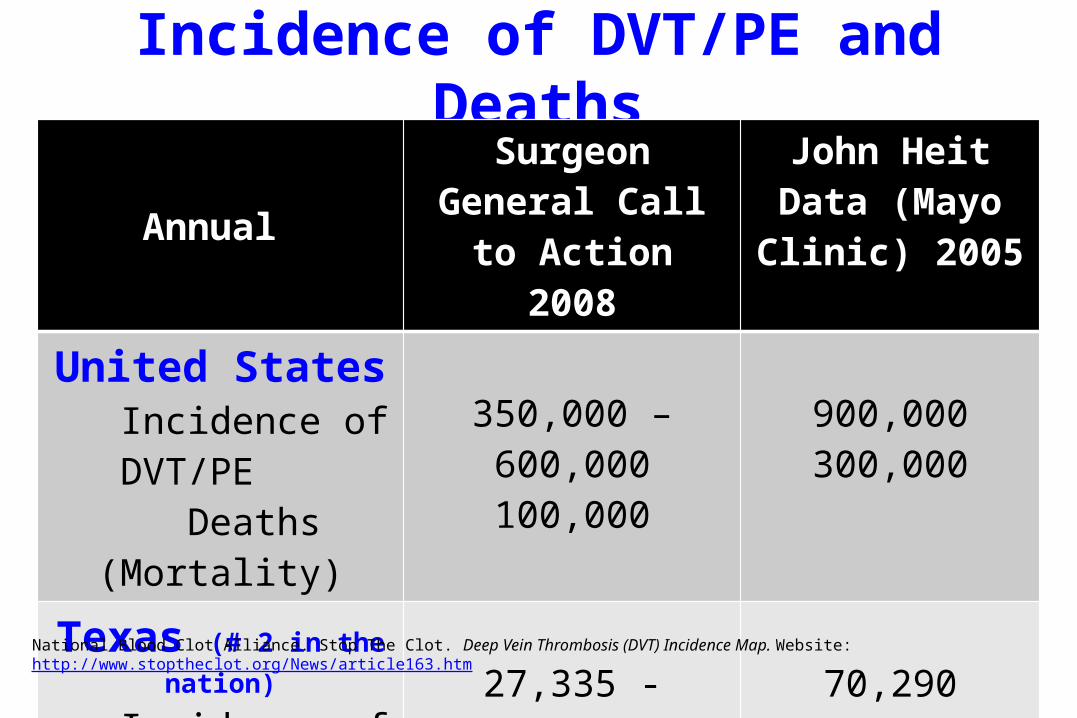
Incidence of DVT/PE and Deaths
10
Annual Surgeon General
Call to Action2008
John Heit Data (Mayo Clinic)
2005United States
Incidence of DVT/PE Deaths (Mortality)
350,000 – 600,000100,000
900,000300,000
Texas (# 2 in the nation) Incidence of DVT/PE Deaths (Mortality)
27,335 - 46,8607,810
70,29023,430
National Blood Clot Alliance. Stop The Clot. Deep Vein Thrombosis (DVT) Incidence Map. Website: http://www.stoptheclot.org/News/article163.htm
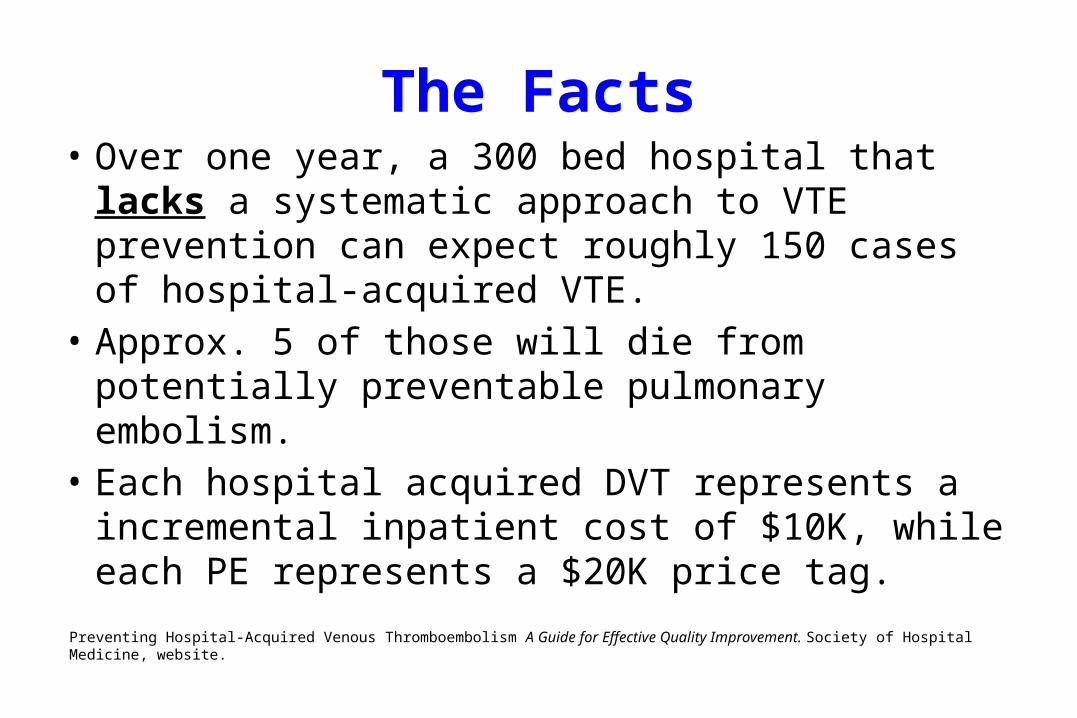
The Facts• Over one year, a 300 bed hospital that lacks a
systematic approach to VTE prevention can expect roughly 150 cases of hospital-acquired VTE.
• Approx. 5 of those will die from potentially preventable pulmonary embolism.
• Each hospital acquired DVT represents a incremental inpatient cost of $10K, while each PE represents a $20K price tag.
Preventing Hospital-Acquired Venous Thromboembolism A Guide for Effective Quality Improvement. Society of Hospital Medicine, website.
12
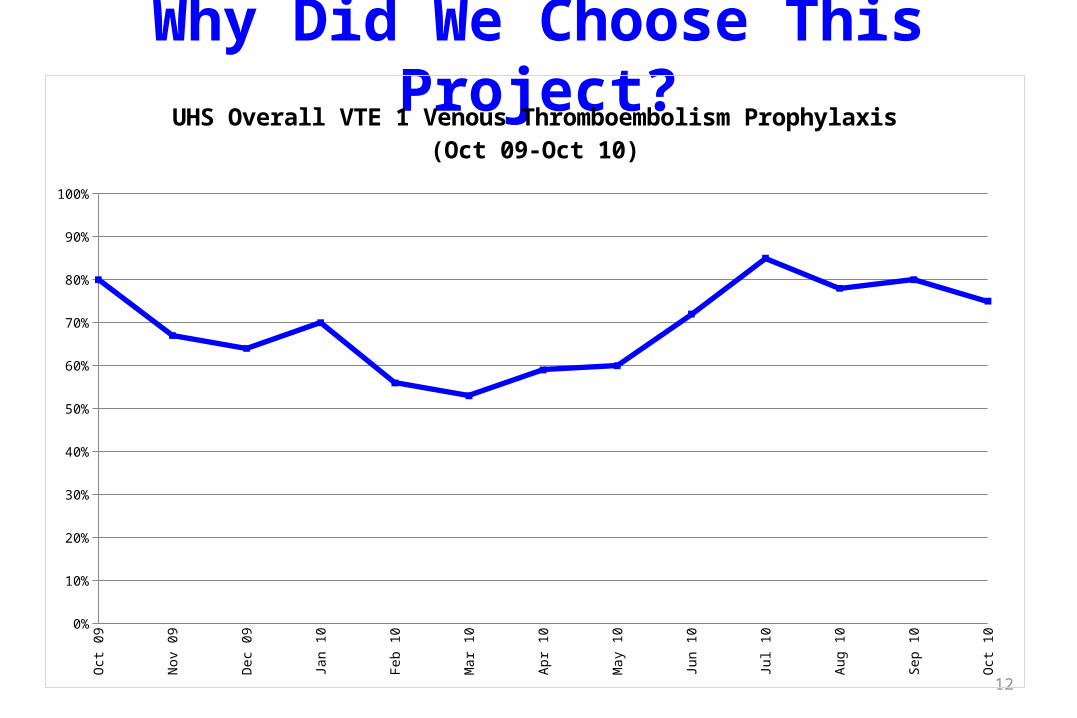
Why Did We Choose This Project?O
ct 0
9
Nov
09
Dec 0
9
Jan
10
Feb
10
Mar
10
Apr 1
0
May
10
Jun
10
Jul 1
0
Aug
10
Sep
10
Oct
100%
10%
20%
30%
40%
50%
60%
70%
80%
90%
100%
UHS Overall VTE 1 Venous Thromboembolism Prophylaxis (Oct 09-Oct 10)
13
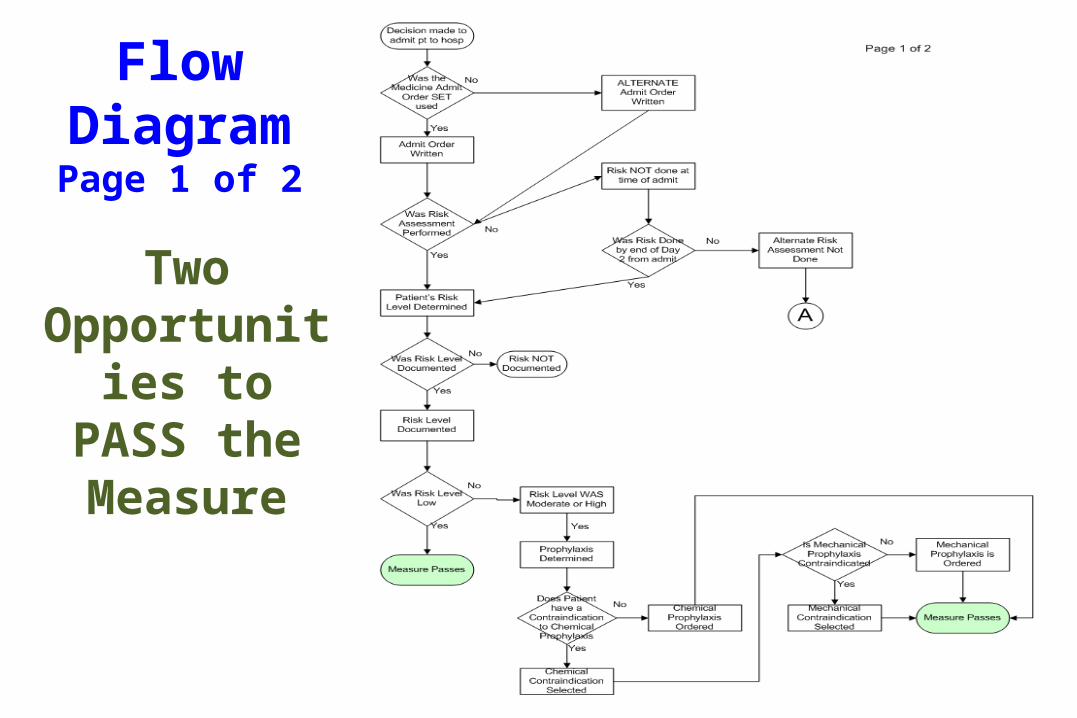
Flow DiagramPage 1 of 2
Two Opportunities
to PASS the Measure
14
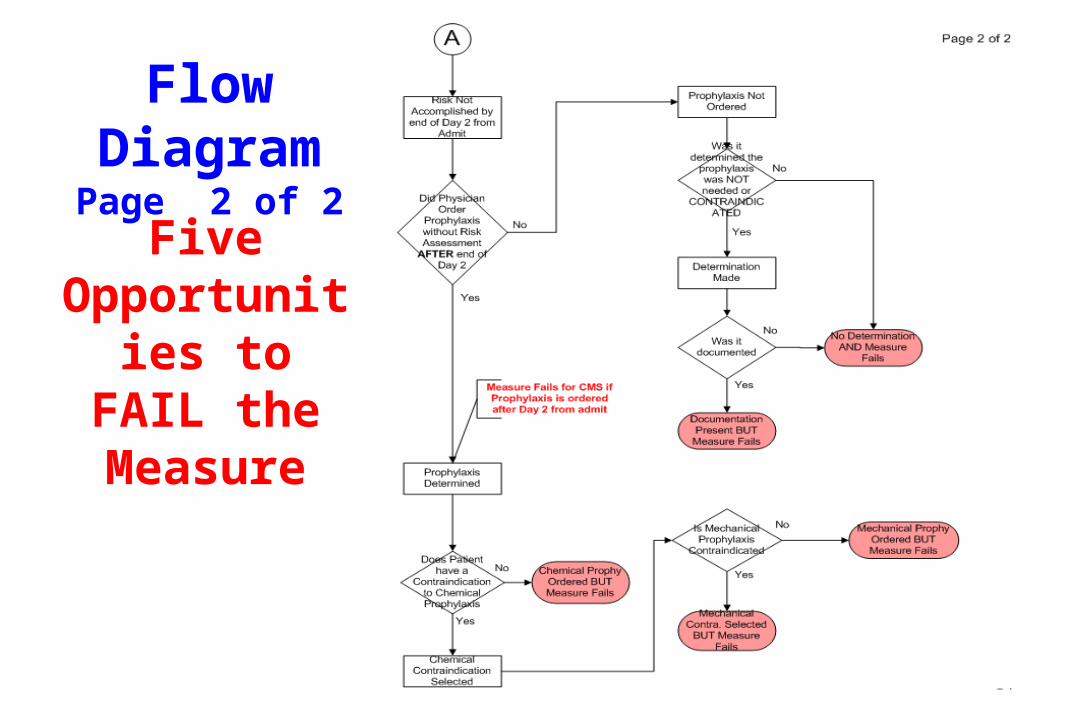
Flow DiagramPage 2 of 2
Five Opportunities
to FAIL the Measure
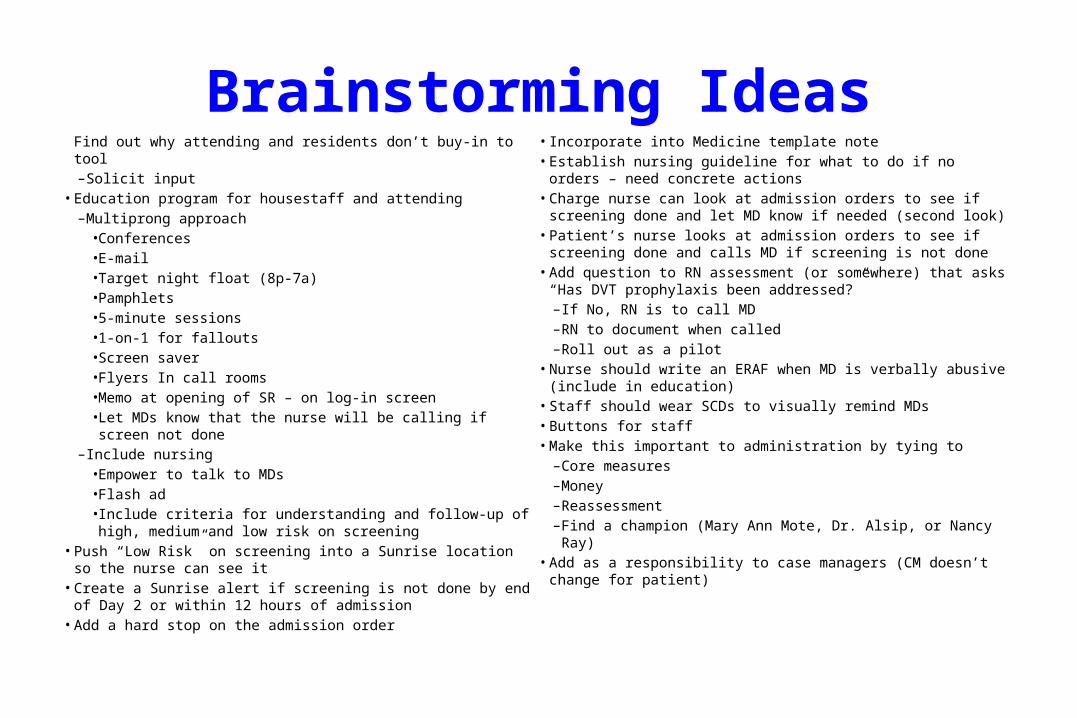
Brainstorming Ideas Find out why attending and residents don’t buy-in to tool
– Solicit input• Education program for housestaff and attending
– Multiprong approach• Conferences• E-mail• Target night float (8p-7a)• Pamphlets• 5-minute sessions• 1-on-1 for fallouts• Screen saver• Flyers In call rooms• Memo at opening of SR – on log-in screen• Let MDs know that the nurse will be calling if screen not
done– Include nursing
• Empower to talk to MDs• Flash ad• Include criteria for understanding and follow-up of high,
medium and low risk on screening• Push “Low Risk” on screening into a Sunrise location so the nurse can
see it• Create a Sunrise alert if screening is not done by end of Day 2 or
within 12 hours of admission
• Add a hard stop on the admission order• Incorporate into Medicine template note• Establish nursing guideline for what to do if no orders – need concrete
actions• Charge nurse can look at admission orders to see if screening done
and let MD know if needed (second look)• Patient’s nurse looks at admission orders to see if screening done and
calls MD if screening is not done• Add question to RN assessment (or somewhere) that asks “Has DVT
prophylaxis been addressed?”– If No, RN is to call MD– RN to document when called– Roll out as a pilot
• Nurse should write an ERAF when MD is verbally abusive (include in education)
• Staff should wear SCDs to visually remind MDs• Buttons for staff• Make this important to administration by tying to
– Core measures– Money– Reassessment– Find a champion (Mary Ann Mote, Dr. Alsip, or Nancy Ray)
• Add as a responsibility to case managers (CM doesn’t change for patient)

Most Creative Idea…..
Staff should wear SCDs to visually remind the MDs
17
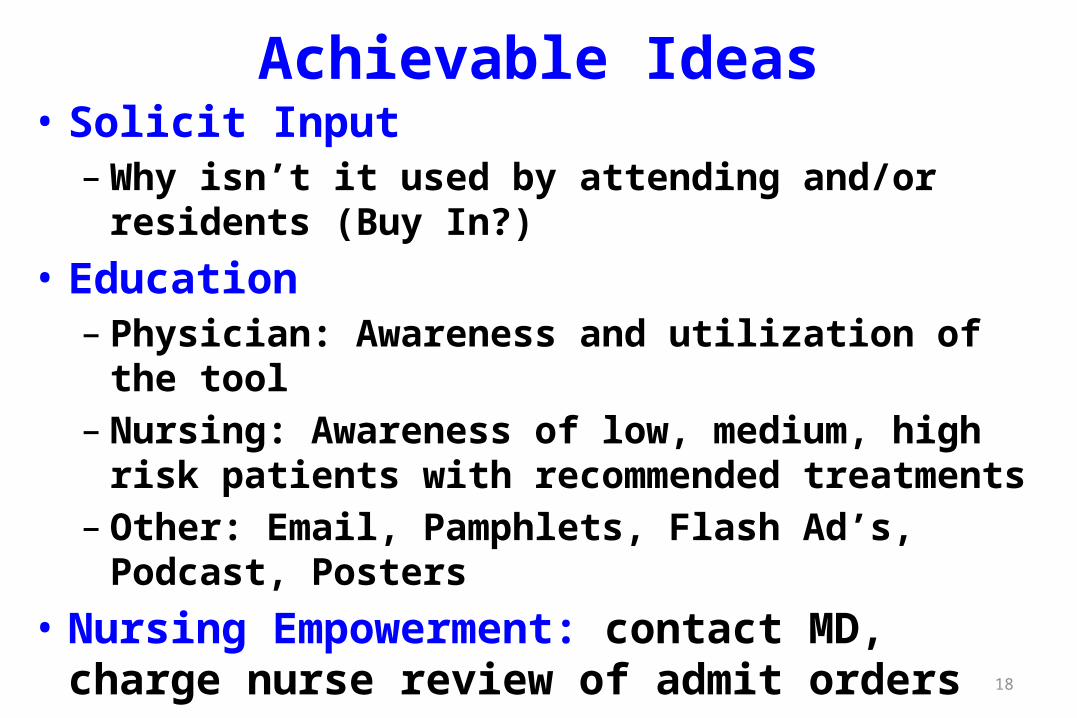
Achievable Ideas• Solicit Input
– Why isn’t it used by attending and/or residents (Buy In?)• Education
– Physician: Awareness and utilization of the tool– Nursing: Awareness of low, medium, high risk patients with
recommended treatments– Other: Email, Pamphlets, Flash Ad’s, Podcast, Posters
• Nursing Empowerment: contact MD, charge nurse review of admit orders
• Executive Buy In: Core Measures and Reimbursement
18
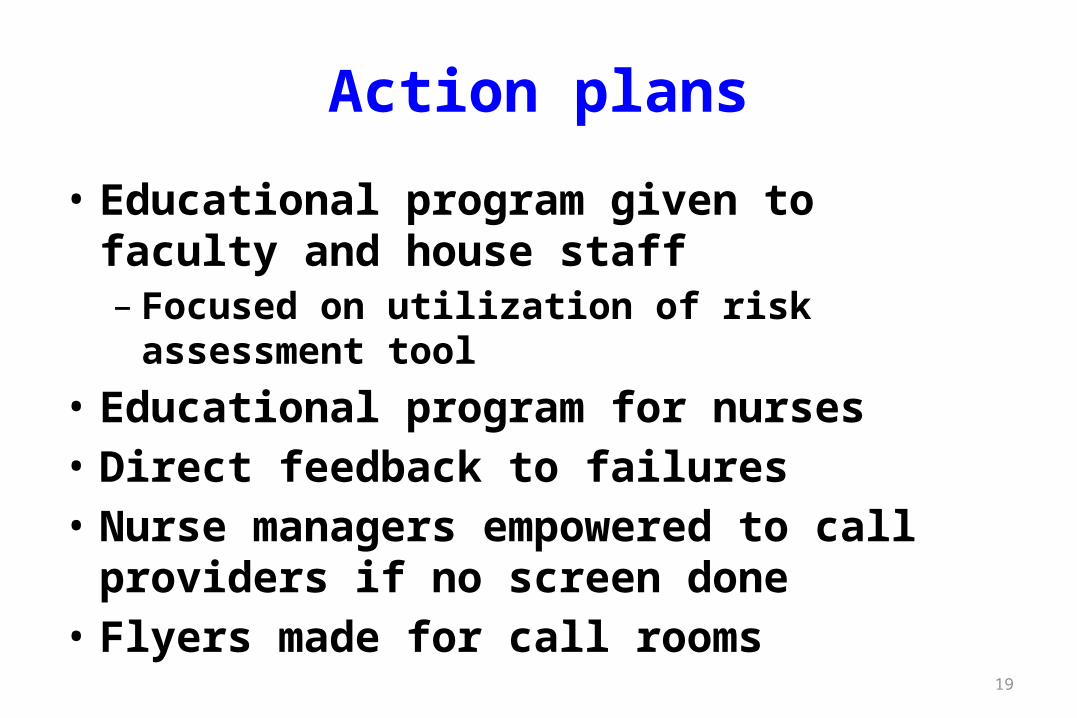
Action plans
• Educational program given to faculty and house staff– Focused on utilization of risk assessment tool
• Educational program for nurses• Direct feedback to failures• Nurse managers empowered to call providers if no
screen done• Flyers made for call rooms
19
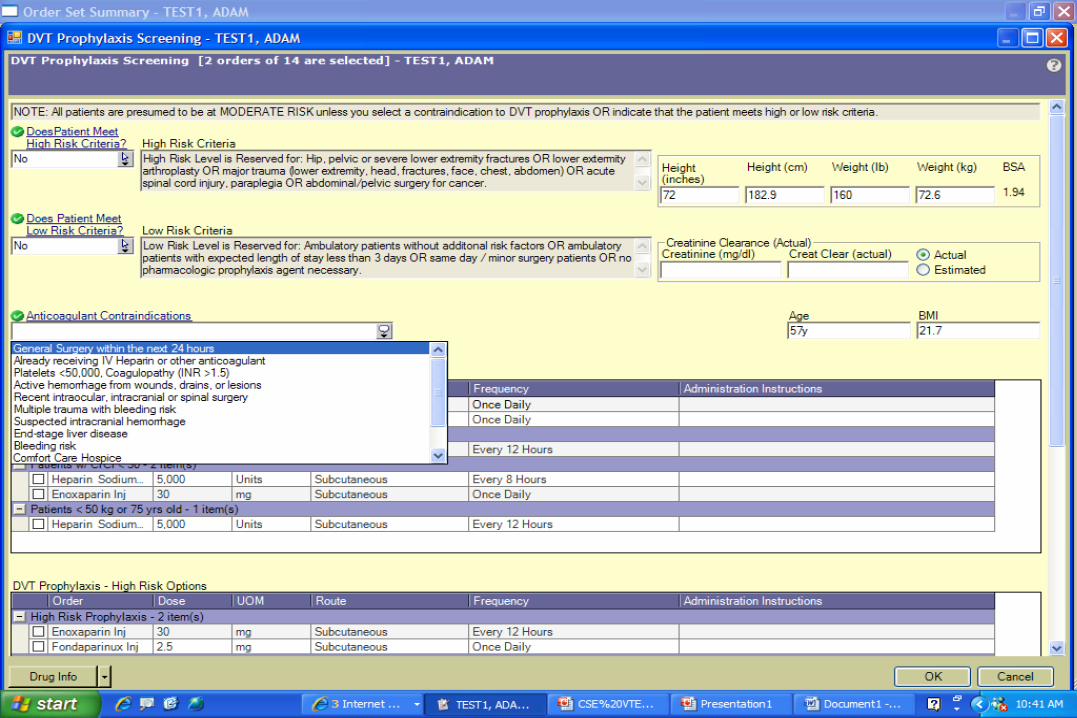
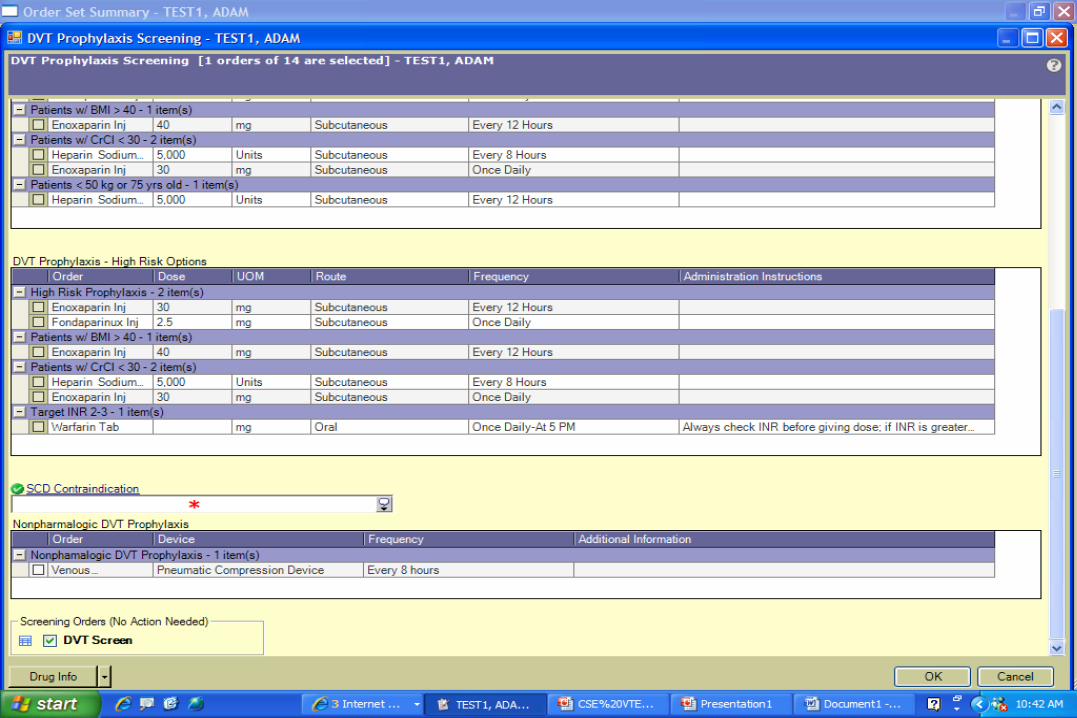
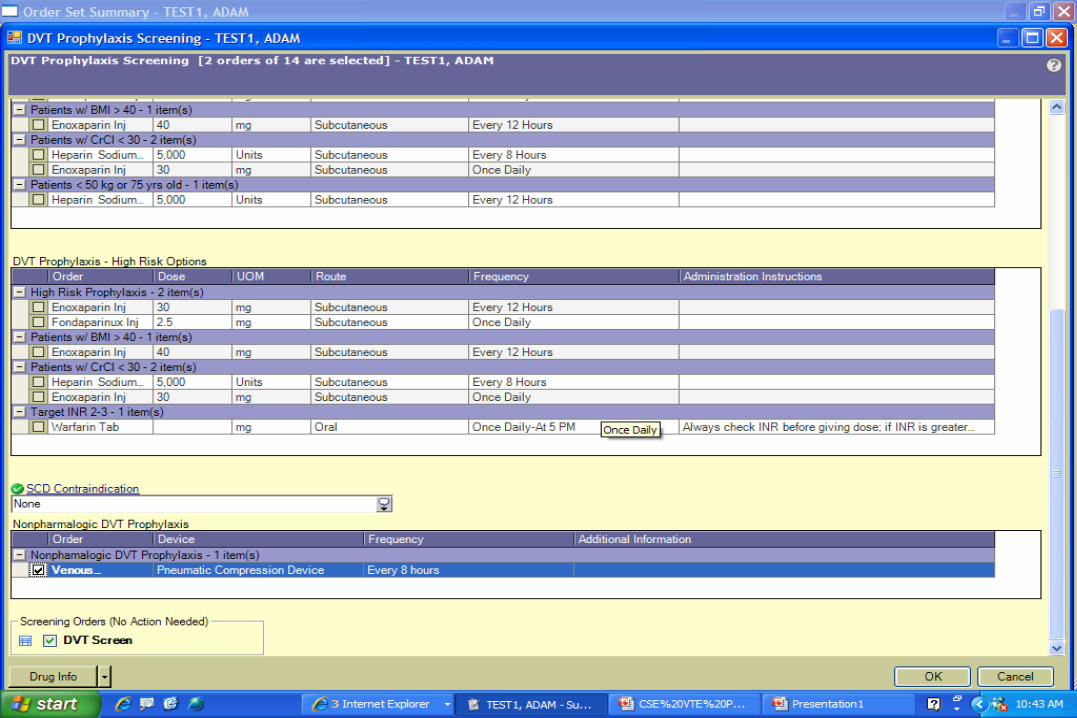
The DVT Prophylaxis Screen
Developed by Dr. Michael Johnson and Crystal Franco-Martinez
Educational program
• Presentation given to Hospitalist group• Presentation given to Internal Medicine Residents• Distribution of educational handouts• Emails sent to faculty and house staff• Feedback given directly to physicians • Nursing education given to 9th floor nurses
26

27
DON’T ADMIT WITHOUT
IT!
DVT SCREEN
DR. C.M.S. DO-WRITE
Data Collection
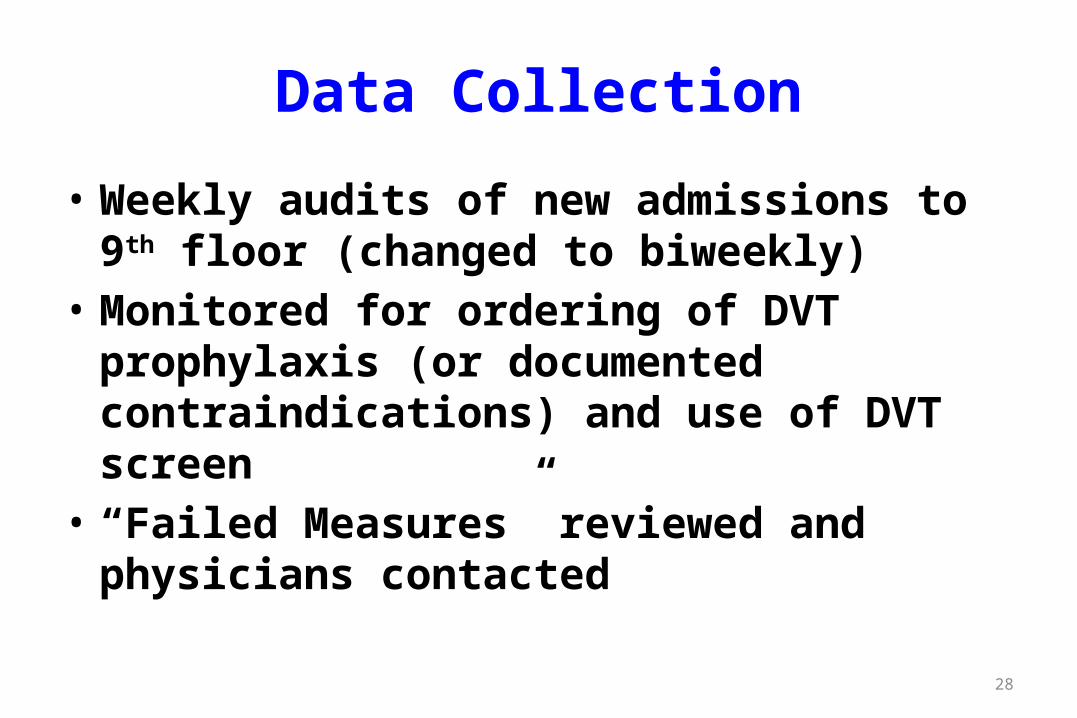
• Weekly audits of new admissions to 9th floor (changed to biweekly)
• Monitored for ordering of DVT prophylaxis (or documented contraindications) and use of DVT screen
• “Failed Measures” reviewed and physicians contacted
28
Wee
k 1
Wee
k 2
Wee
k 3
Wee
k 4
Wee
k 5
Wee
k 6
Wee
k 7
Wee
k 8
Wee
k 9
Wee
k 11
Wee
k 13
Wee
k 15
Wee
k 17
0.000
0.200
0.400
0.600
0.800
1.000
1.200
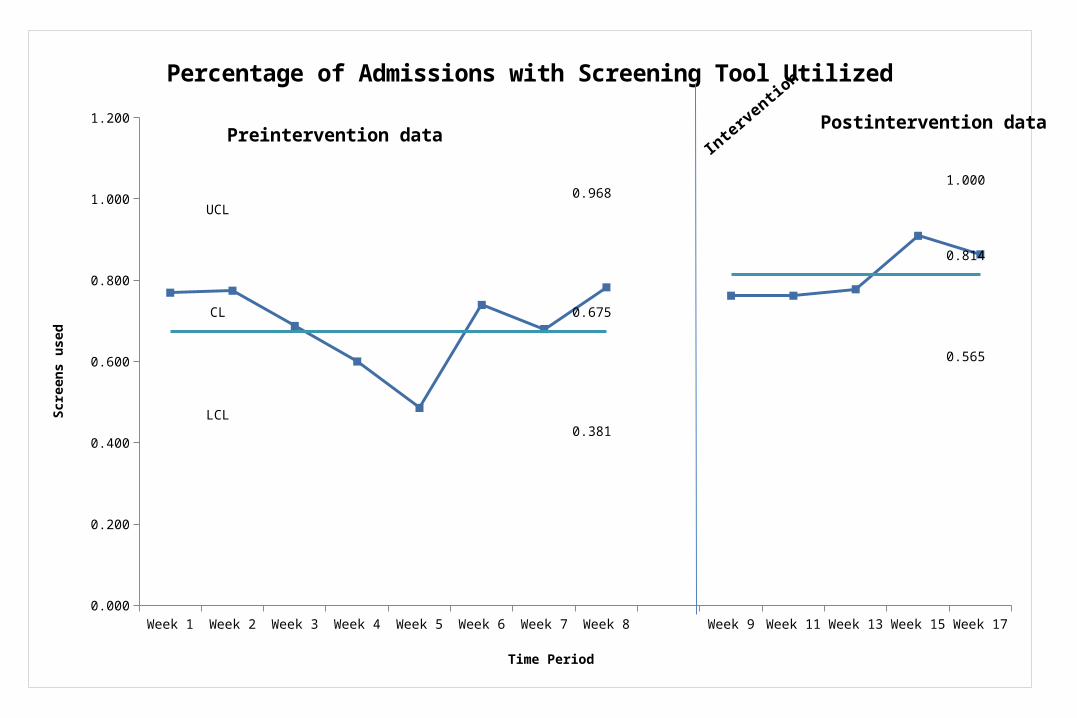
LCL0.381
0.565
Percentage of Admissions with Screening Tool Utilized
Time Period
Scre
ens u
sed
Preintervention dataPostintervention data
Inter
ventio
n
Wee
k 1
Wee
k 2
Wee
k 3
Wee
k 4
Wee
k 5
Wee
k 6
Wee
k 7
Wee
k 8
Wee
k 9
Wee
k 11
Wee
k 13
Wee
k 15
Wee
k 17
0.000
0.200
0.400
0.600
0.800
1.000
1.200
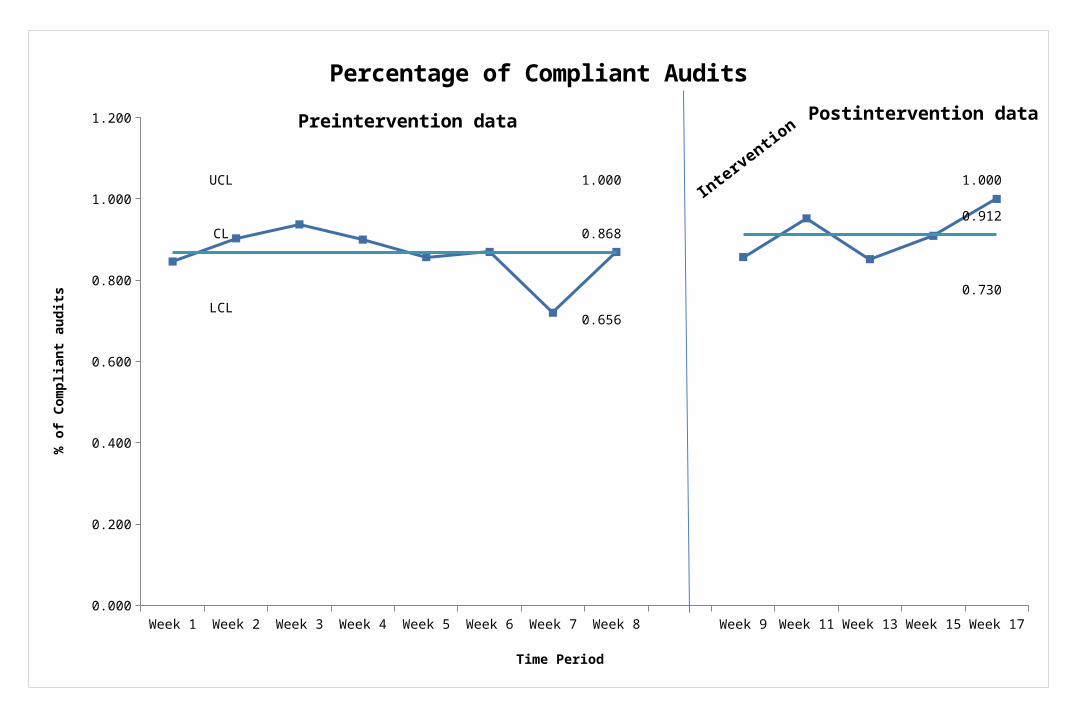
LCL0.656
0.730
Percentage of Compliant Audits
Time Period
% o
f Com
plia
nt a
udits
Preintervention data Postintervention data
Inter
ventio
n
31
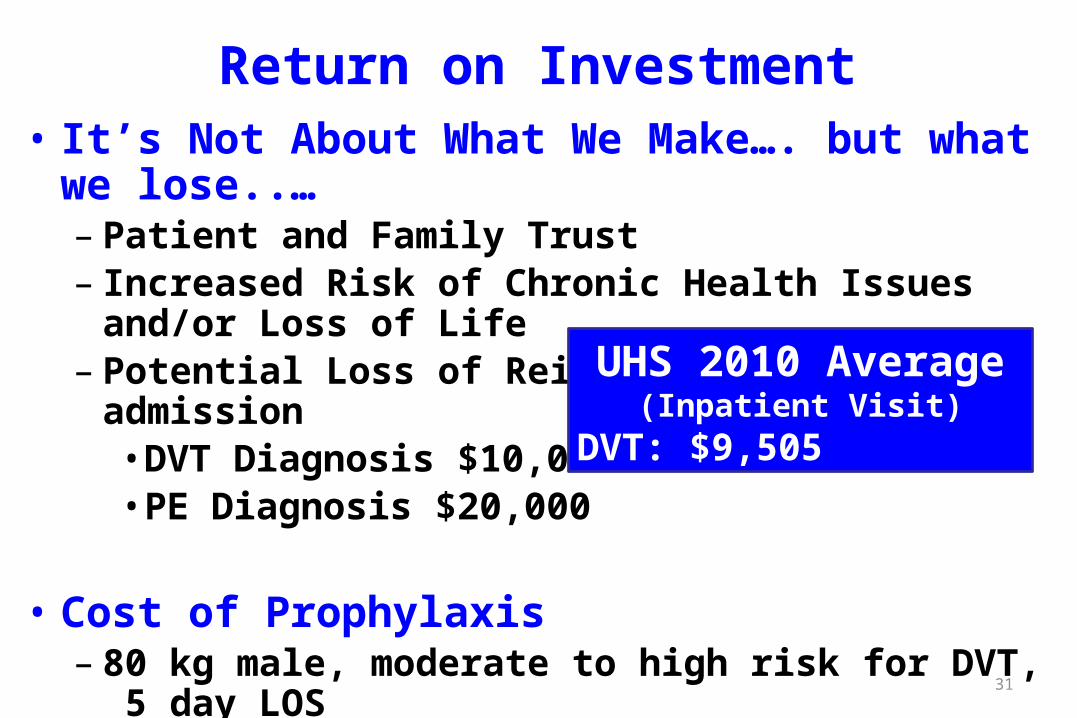
Return on Investment• It’s Not About What We Make…. but what we lose..…
– Patient and Family Trust– Increased Risk of Chronic Health Issues and/or Loss of Life– Potential Loss of Reimbursement with Re-admission
• DVT Diagnosis $10,000• PE Diagnosis $20,000
• Cost of Prophylaxis – 80 kg male, moderate to high risk for DVT, 5 day LOS– SCD’s and Lovenox at approximately $750.00
University Health System. Information provided by Carmen Sanchez.
UHS 2010 Average(Inpatient Visit)
DVT: $9,505 PE: $18,163
Future plans
• Rollout to entire hospital–Cooperation with other services –Corporate endorsement
• Podcast for usage of DVT screen• Working with IT and other services to make
DVT screen required
32
References
33
National Blood Clot Alliance. Stop The Clot. Deep Vein Thrombosis (DVT) Incidence Map. Retrieved June 7, 2011. http://www.stoptheclot.org/News/article163.htm
National Blood Clot Alliance. Stop The Clot. NBCA Creates DVT/PE Morbidity and Mortality Map. Surgeon General Call To Action Data vs. Mayo Clinic Data. Retrieved June 7, 2011. http://www.stoptheclot.org/documents/dvt_statistics.pdf
Preventing Hospital-Acquired Venous Thromboembolism A Guide for Effective Quality Improvement. Society of Hospital Medicine, website
Quality Net. Specifications Manual for National Hospital Quality Measures. Specifications Manual, Version 3.2c Discharges 10/1/10 to 3/31/11. Venous Thromboembolism National Hospital Inpatient Quality Measures. http://www.qualitynet.org/dcs/ContentServer?c=Page&pagename=QnetPublic%2FPage%2FQnetTier4&cid=1228754600169
University Health System. Patients by Patient Type for Patients with Principle Diagnosis of Pulmonary Embolism and Deep Vein Thrombosis. Patients with Revenue FSC Medicare (200). Information provided by Carmen Sanchez, Senior Financial Analyst, Budget and Financial Planning on June 22, 2011.
U.S. Department of Health and Human Services. The Surgeon General’s Call to Action to Prevent Deep Vein Thrombosis and Pulmonary Embolism. 2008. Retrieved June 6, 2011. http://www.surgeongeneral.gov/topics/deepvein/calltoaction/call-to-action-on-dvt-2008.pdf