clinical quality, value-based purchasing in wisconsin
TRANSCRIPT

MEDDIC-MS Vol. 2. 2006 HMO-Specific Performance Data
Wisconsin Department of Health and Family Services Division of Health Care Financing, Bureau of Managed Health Care Programs
September 2007
Clinical Quality
Value-based purchasing in Wisconsin Family Medicaid and BadgerCare

MEDDIC-MS Data Book 2006, Vol. 2, Wisconsin DHFS
2

MEDDIC-MS Data Book 2006, Vol. 2, Wisconsin DHFS
3
Clinical Quality
Value-based purchasing in Wisconsin Family Medicaid and BadgerCare
Quality Assessment and Performance Improvement
MEDDIC-MS Data Book Volume 2: 2006 HMO-specific Performance Data

MEDDIC-MS Data Book 2006, Vol. 2, Wisconsin DHFS
4
Table of Contents
Introduction and background 5 Wisconsin Medicaid/BadgerCare HMO Summary 6 Key to HMO abbreviations and contact for additional information 7 Results on Clinical Performance Measures Asthma care 9 Blood lead toxicity screening 11 Dental (Preventive) services 12 Diabetes care 13 EPSDT comprehensive well-child exams 14 General and Specialty care-outpatient 16 General and Specialty care-inpatient 18 Immunizations for children 21 Mammography (screening) and malignancy detection 22 Maternity/perinatal care 23 Mental health/substance abuse follow-up care within 7 and 30 days 24 Mental health/substance abuse-evaluations and outpatient care 27
Non-EPSDT well-child care 32 Obesity prevention & treatment 34
Pap tests--cervical cancer screening and malignancy detection 35 Tobacco dependence treatment 36 This publication is not copyright protected and may be reproduced, quoted and reprinted without permission. Attribution to the Wisconsin Department of Health and Family Services is requested. Suggested citation: MEDDIC-MS Data Book, Vol. 2, 2006 HMO-Specific Performance Data, Wisconsin Family Medicaid and BadgerCare, State of Wisconsin, Department of Health and Family Services, September 2007.

MEDDIC-MS Data Book 2006, Vol. 2, Wisconsin DHFS
5
Introduction and Background Quality assessment and performance improvement is a central element in Wisconsin’s value-based purchasing strategy. Automated performance measures allow performance data to be generated across a wide range of clinical care areas at very low cost and no disruption to provider clinics and hospitals. Quality data is used for quality improvement by health plans and by the Department of Health and Family Services (DHFS). Public reporting of the data supports transparency and accountability. Performance is publicly reported on a program-wide basis and on an HMO-specific, comparative basis. MEDDIC-MS (Medicaid Encounter Data Driven Improvement Core Measure Set) is Wisconsin's set of automated performance measures for Family Medicaid and BadgerCare (the State Children's Health Insurance Program or SCHIP) managed care. This report does not include data on care provided for individuals eligible for SSI (Supplemental Security Income). Use of MEDDIC-MS was approved by the Centers for Medicare and Medicaid Services (CMS) as part of its review of the state's quality improvement strategy in August 2003. CMS has recognized MEDDIC-MS, MEDDIC-MS SSI and the goal-setting system as Medicaid/SCHIP/SSI "Promising Practices. For more information, go to: http://www.cms.hhs.gov/MedicaidSCHIPQualPrac/MSPPDL/list.asp#TopOfPage The Agency for Healthcare Research and Quality (AHRQ) has approved MEDDIC-MS and MEDDIC-MS SSI for inclusion in the National Quality Measures Clearinghouse (NQMC®). View the measure summaries on the NQMC at: http://www.qualitymeasures.ahrq.gov/browse/measureindex.aspx and scroll down to "State of Wisconsin." MEDDIC-MS and MEDDIC-MS SSI performance measures are approved for health plan accreditation by URAC® (Utilization Review Accreditation Commission) and by the Accreditation Association for Ambulatory Health Care (AAAHC®) for Medicaid, SCHIP and SSI populations. Technical specifications for the performance measures and previous quality performance reports are available online at: http://www.dhfs.state.wi.us/medicaid7/reports_data/quality_reports/index.htm The data in this booklet presents HMO-specific performance rates for each HMO on the MEDDIC-MS performance measures based on calendar year 2006 data.

MEDDIC-MS Data Book 2006, Vol. 2, Wisconsin DHFS
6
HMO name Accreditation Total enrollment (July 2007)**
Type of HMO Number of full & partial counties served
Abri Health Plan None 8,368 Mixed model 4 Children’s Community Health Plan
None 8,547 Mixed model 4
Compcare None 27,170 Mixed model 26 Dean Health Plan NCQA* 11,774 Group model 4 Group Health Cooperative-Eau Claire
None 18,141 Mixed model 23
Group Health Cooperative-South Central
NCQA* 3,866 Staff model 1
Health Tradition Health Plan None 6,070 Group model 6 Managed Health Services None 86,744 IPA 28 MercyCare Insurance Corporation
NCQA* 9,416 IPA 5
Network Health Plan None 44,113 Group model 28 Security Health Plan NCQA* 24,219 Group model 23 UnitedHealthcare NCQA* 125,378 IPA 20 Unity Health Plans NCQA* 3,443 IPA 1 *This HMO is accredited by the National Committee for Quality Assurance (NCQA®) and has qualified for participation in the Department of Health and Family Services HMO Accreditation Incentive Program. ** Medicaid and BadgerCare enrollees only—excludes commercial and Medicare+Choice enrollees, if applicable.

MEDDIC-MS Data Book 2006, Vol. 2, Wisconsin DHFS
7
Key to HMOs for Individual HMO charts: AHP Abri Health Plan CCP Children’s Community Health Plan CHP CompCare Health Plan (formerly Atrium Health Plan) DHP Dean Health Plan GHE Group Health Cooperative-Eau Claire GHC Group Health Cooperative-South Central HTP Health Tradition Health Plan MHS Managed Health Services MCP MercyCare Insurance Corporation NHP Network Health Plan SHP Security Health Plan UHC UnitedHealthcare (Americhoice) UHP Unity Health Plans For additional information, contact: State of Wisconsin Department of Health and Family Services DHCF/BMHCP Gary R. Ilminen, RN Nurse Consultant 1 W. Wilson St., PO Box 309 Madison, WI 53701-0309 (608) 261-7839 Office (608) 261-7792 Fax [email protected]
MEDDIC-MS Data Book 2006, Vol. 2, Wisconsin DHFS
8
Results on Clinical Performance Measures

MEDDIC-MS Data Book 2006, Vol. 2, Wisconsin DHFS
9
Asthma care Monitoring measure
In 2006, the average period prevalence for asthma was 6.3 percent among children birth to age 20 years, 4.9 percent in the 21+ years age group. The overall inpatient care rates were 5.8 percent for the birth to age 20 group and 4.0 Percent for the 21+ years age group. The emergency care rates were 21.2 percent for the birth to age 20 group and 23.7 percent for the 21+ age group. Please refer to p. 7 for a key to the HMO abbreviations. ED refers to emergency department care. (Results continued on next page.)
Asthma care, age birth to 20 years, by HMO
5.7 7.
3
5.5
5.7 6.
7
6.8
6.4
4.6
11.4
5.5
1.7
5.3 5.8 6.4
8.5
5.5
4.8
15
19.7
11
21.1
12.4
21.4
25.7
10.3
4.6
7.6
3.56.
4
4.5
8.3
6.6
8.8
6.4
24.5
29.4
13.9
13.3
13.8
0
5
10
15
20
25
30
35
AHP CCP CHP DHP GHE GHC HTP MHS MCP NHP SHP UHC UHP
Perc
enta
ge
Prevalence Inpatient care ED care

MEDDIC-MS Data Book 2006, Vol. 2, Wisconsin DHFS
10
Asthma care (continued) Monitoring measure
Please refer to p. 7 for a key to the HMO abbreviations.
Asthma care, age 21+ years, by HMO
0
6.8
6
0 0
2.2
30
0
11.5
7.8
26.1
22.2
6.6
5.4
4.3
4.75.6
5.4
3.3
3.2
4.4
3.3
3.9
4.1 4.9 5.
9
3.6
4.4
4.2 4.5 5.3
4.5
28.4
1413.9
13.9
22.5
13.3
18.5
0
5
10
15
20
25
30
35
AHP CCP CHP DHP GHE GHC HTP MHS MCP NHP SHP UHC UHP
Perc
enta
ge
Prevalence Inpatient care ED care

MEDDIC-MS Data Book 2006, Vol. 2, Wisconsin DHFS
11
Blood lead toxicity screening Targeted performance improvement measure
The average blood lead testing rate in the one year old age group in 2006 was 69.6 percent, and was 52.6 percent for two year olds. CCP had fewer than 30 enrollees in the denominator for one and two-year-olds in this measure and so do not have values shown. Please refer to p. 7 for a key to the HMO abbreviations.
Blood lead toxicity screening, age one and two years, by HMO
0
72.8
61.7
80.6
73.1
0
48.6
68.2
77.2
73.8
67.9
54.5
74.4
67.3
36.8
54.1
61.4
52.5
63.8
5250
37.1
51.9
38.6
51.2
59.6
0
10
20
30
40
50
60
70
80
90
AHP CCP CHP DHP GHE GHC HTP MHS MCP NHP SHP UHC UHP
Perc
enta
ge
1 year old 2 year old

MEDDIC-MS Data Book 2006, Vol. 2, Wisconsin DHFS
12
Dental (Preventive) Services Targeted performance improvement measure
In 2006, the average rate of provision of preventive dental care in the 3-20 years-of-age cohort was 23.5 percent; the average was 15.8 percent in the 21+ years-of-age cohort. Note: Four HMOs provided dental care under their Medicaid/BadgerCare contract in 2006. Please refer to p. 7 for a key to the HMO abbreviations.
Dental preventive care, age 3-20 and 21+ years, by HMO
15.9
31.8
17.5
11.7 11.6
21.318.4
23.2
0
5
10
15
20
25
30
35
AHP MHS NHP UHC
Perc
enta
ge
3 to 20 21+

MEDDIC-MS Data Book 2006, Vol. 2, Wisconsin DHFS
13
Diabetes care Targeted performance improvement measure
Three HMOs (CCP, GHC and UHP) had fewer than 30 enrollees in the denominator and so do not have results included in the chart. The birth to age 17 years age cohort is not reported by individual HMO due to very small denominator numbers. The 2006 overall HMO average rate for hemoglobin A1c (HbA1c) for adults was 84.1 percent; the average rate for lipids testing was 70.4 percent. Please refer to p. 7 for a key to the HMO abbreviations.
Diabetes care, age 18-75, by HMO
60.5
0
90.5 88.5
0
92.6
83.6 85.9 83.3 85 83.3
00 0 0
98.4
70.273.668.871.769.5
77.879.981
71.9
55.8
0
20
40
60
80
100
120
AHP CCP CHP DHP GHE GHC HTP MHS MCP NHP SHP UHC UHP
Perc
enta
ge
HbA1c 18-75 Lipids 18-75

MEDDIC-MS Data Book 2006, Vol. 2, Wisconsin DHFS
14
EPSDT comprehensive well-child exams Targeted Performance Improvement Measure
In 2006, the average rate of children up to age two years with 7 or more EPSDT exams across all HMOs was 69.1 percent. The average rate for children with 6 exams was 10.4 percent and for 5 exams, it was 7.4 percent. One HMO, CCP had fewer than 30 enrollees in the denominator, so the individual HMO rate is not shown. Please refer to p. 7 for a key to the HMO abbreviations. Results are continued on next page.
Early, periodic screening, diagnosis and treatment (EPSDT) exams by HMO, birth to age two years
0 0
10.5
10.3
10.8
10.6
10.5
11.3
0
75 74
80.6
4.3
8.7
5.1
7
3.4
7.9
4.810
.9
3.1
6.3
7.810
.915
.2
9 6.3
18.2
5.1
6.5
66.1
74.7
68.6
85.2
66.6
38.2
7779.1
67.4
0
10
20
30
40
50
60
70
80
90
AHP CCP CHP DHP GHE GHC HTP MHS MCP NHP SHP UHC UHP
Perc
enta
ge
5 visits 6 visits 7 or more visits

MEDDIC-MS Data Book 2006, Vol. 2, Wisconsin DHFS
15
EPSDT comprehensive well-child exams (continued)
The average rate for children age 3-5 years with at least one EPSDT exam in the look-back period was 85.6 percent across all HMOs. For children age 6-14 years, it was 62.8 percent and for children age 15-20 years it was 54.8 percent. Please refer to p. 7 for a key to the HMO abbreviations.
Early, periodic screening, diagnosis & treatment (EPSDT) exams, by HMO, age 3-20 years
81.3 82.5
89.2
81.9 82.1
89.6
70.7
86.786.786.1
78.8
85.887.285.8
76.1
65.3
53.8
43.8
50.5
76.7
63.9
70
64
63.4
51.9
60.3
47.6
50.7
57.8
59.6
57.9
67.1
49.2
54.4
44.6
46.2
64.5
56.3
69.6
0
10
20
30
40
50
60
70
80
90
100
AHP CCP CHP DHP GHE GHC HTP MHS MCP NHP SHP UHC UHP
Perc
enta
ge
3 to 5 6 to 14 15-20

MEDDIC-MS Data Book 2006, Vol. 2, Wisconsin DHFS
16
General and Specialty care-outpatient Monitoring measure
In 2006, the average rate for emergency room/department (ER) visits not resulting in hospital admission was 36.1 percent. Average rate for primary care visits was 80.7 percent. The measure reflects unduplicated enrollees with at least one encounter of each type in the look-back period. Please refer to p. 7 for a key to the HMO abbreviations. Results continued on next page.
General & specialty outpatient care, all ages, by HMO
23
31.8
30.6 33
24
40
74.269.8
82.379.9 80 79.3
24.3
37.8
28.1
34.5
36.8
18.6
36.5
85.6 87.1 85.8
84.578.5
84.9 85.3
0
10
20
30
40
50
60
70
80
90
100
AHP CCP CHP DHP GHE GHC HTP MHS MCP NHP SHP UHC UHP
Perc
enta
ge
ER visit-no admission Primary care visit

MEDDIC-MS Data Book 2006, Vol. 2, Wisconsin DHFS
17
General and Specialty care-outpatient (continued) Monitoring measure
The 2006 HMO average for vision care was 4.8 percent, for audiology it was 1.5 percent and for general dental care, 25.8 percent. The measure reflects unduplicated enrollees with at least one encounter of each type in the look-back period. Four HMOs—AHP, MHS, NHP and UHC—provide dental services under their contract in 2006. Please refer to p. 7 for a key to the HMO abbreviations.
General & Specialty outpatient care, all ages, by HMO (continued)
1.2
6.1 6.3
3.3
8.2
11
1.6
1.2
7.3
5.3
4.2
7.2
22.3
9.8
1.6
1.2
0.4
2.6
1.43.
2
1.2
2.5
2.12.7
0.20.
7
23.4
23.2
13.8
0
5
10
15
20
25
AHP CCP CHP DHP GHE GHC HTP MHS MCP NHP SHP UHC UHP
Perc
enta
ge
Vision care Audiology General dental

MEDDIC-MS Data Book 2006, Vol. 2, Wisconsin DHFS
18
General and Specialty care-inpatient Monitoring measure
In 2006, the program-wide HMO average for maternity care was 7 percent, 1.6 percent for surgical inpatient care, and 1.7 percent for inpatient medical care. Please refer to p. 7 for a key to the HMO abbreviations. Results continued on next page.
General & specialty care-inpatient
0
7.5
8.2
3.3
7.2
6.4
8.1
6 6
0 0
1
4.3
0
6.8
7.6
6.6
3.6
1.121.82.31.7
1.80.8
2.21.92.1
1.6 1.6 2.1
0.9 1.1
1.9
1.4
1.7 1.9
1.3
2.7
0
1
2
3
4
5
6
7
8
9
AHP CCP CHP DHP GHE GHC HTP MHS MCP NHP SHP UHC UHP
Perc
enta
ge
Maternity Surgery Medical

MEDDIC-MS Data Book 2006, Vol. 2, Wisconsin DHFS
19
General and Specialty care-inpatient (continued) Monitoring measure
The 2006 program-wide HMO average for inpatient psychiatric care was 0.2 percent and was 0.12 percent for inpatient substance abuse care. Please refer to p. 7 for a key to the HMO abbreviations.
General & specialty care-inpatient (continued)
0 0 00.20.10.20.2
0.50.1
0.30.20.30.20.30.2 0.10.3 0.2
4.7
0.2 0.1 0.2 0.1 0.2 0.1 0.10
1
2
3
4
5
6
7
8
AHP CCP CHP DHP GHE GHC HTP MHS MCP NHP SHP UHC UHP
Perc
enta
ge
Psychiatric Substance abuse

MEDDIC-MS Data Book 2006, Vol. 2, Wisconsin DHFS
20
General & Specialty Care—Inpatient (continued) Monitoring measure
In 2006, the program-wide average for neonatal care was 83 percent. Please refer to p. 7 for a key to the HMO abbreviations.
General & specialty care--inpatient (continued) Neonatal care
0
93.3 92.4 93.6
62.2
90.793.8
90.4 89.6
66.4
87.187.386.1
0
10
20
30
40
50
60
70
80
90
100
AHP CCP CHP DHP GHE GHC HTP MHS MCP NHP SHP UHC UHP
Perc
enta
ge

MEDDIC-MS Data Book 2006, Vol. 2, Wisconsin DHFS
21
Immunizations for children Targeted performance improvement measure
In 2006, the overall HMO average for full immunization status was 68.9 percent. The average for substantial immunization status was 12.2 percent and the average for incomplete immunization status was 18.9 percent. The average for the pneumococcal vaccination status (4 doses) was 67.4 percent. AHP, CCP, GHC, and UHP each had fewer than 30 enrollees in the denominator, so their rate is not entered. Please refer to p. 7 for a key to the HMO abbreviations.
Childhood immunizations by HMO0 0
81.4
59.3
0
68.8
89.5
00 0 0
10
00 0 0 00 0
80.5
57.6
0
66.7
89.5
0
66.7
61.9
76.8
72.5
85.7
13.6
12.1
2.6
13.4
14.1
6.1
6.8
8.1
24.5
9.8
19.1
7.9
19.2
17.5
33.9
8.2
10.4
62.2
86.6
62.7
77.5
84.7
0
10
20
30
40
50
60
70
80
90
100
AHP CCP CHP DHP GHE GHC HTP MHS MCP NHP SHP UHC UHP
Perc
enta
ge
Full Substantial Incomplete Pneumococcal

MEDDIC-MS Data Book 2006, Vol. 2, Wisconsin DHFS
22
Mammography (screening) and Malignancy Detection Monitoring measure
In 2006, the average HMO screening mammography rate in the 40-49 years age cohort was 29 percent, with an average malignancy detection rate of 0.7 percent. The average rate in the 50+ years age cohort was 35 percent with a 0.6 percent detection rate. One HMO, CCP—had a denominator smaller than 30 enrollees in the 40-49 years age cohort and therefore have no rate reported; three HMOs—CCP, GHC and UHP—had a denominator smaller than 30 enrollees in the 50+ years age cohort and therefore have no rate reported. Please refer to p. 7 for a key to the HMO abbreviations.
Mammography (screening) and malignancy detection
0
29.8
30.1
2.6
0 0.3 1 0
1.2
1.1
0 0.7
0.7
0.3
00 0
35.9
00 0 0 0 0 0 0 0 0 0
31.9
28.1
28.1
28.6
27.8
38.1
21.5
32.1
33.6
23.3
0
37.1
31.7
34.4
32.3
28.6
41.4
36.4
39.2
43.3
0.410.8
0
5
10
15
20
25
30
35
40
45
50
AHP CCP CHP DHP GHE GHC HTP MHS MCP NHP SHP UHC UHP
Perc
enta
ge
40-49 40-49 Malignancy detected 50+ 50+ Malignancy detected

MEDDIC-MS Data Book 2006, Vol. 2, Wisconsin DHFS
23
Maternity/perinatal Care Monitoring measure
In 2006, the HMO average Cesarean section rate was 21.0 percent. The average rate for substance abuse care in the perinatal period was 1.4 percent and the average rate for voluntary HIV testing was 25.3 percent. Prenatal Care Coordination was identified for 0.4 percent. Please refer to p. 7 for a key to the HMO abbreviations.
Maternity/perinatal care15
.7
7.6
29.9
25.8
21.5
21.5
00 0 0 0 0 0
17.2
32.9
10.5
24.527
20.8
29
16.1
11
17.8
4.5
13.4
19
20.3
23.9
21.3
29.6
20.5
22.4
23
0.51.2 2.3
2.3
2.1
1.4
1.2
3.8
1.4
2.5
0.6
1.8
0.10.5
0.1
0.31.
4
0.61.
7
0
5
10
15
20
25
30
35
AHP CCP CHP DHP GHE GHC HTP MHS MCP NHP SHP UHC UHP
Perc
enta
ge
HIV screen C-sections Substance abuse care PNCC

MEDDIC-MS Data Book 2006, Vol. 2, Wisconsin DHFS
24
Mental health/substance abuse (MH/SA) follow-up care Within 7 and 30 days of inpatient discharge Targeted Performance Improvement Measure
The 2006 HMO average for mental health or substance abuse follow-up care by a specialist for all ages within 7 days of inpatient discharge was 26.4 percent; for follow-up within 30 days it was 47.3 percent. Three HMOs (CCP, GHC, and UHP) had denominators with fewer than 30 discharges and are not reported individually. Please refer to p. 7 for a key to the HMO abbreviations. Results continued on next page.
Mental health/substance abuse follow-up care by specialists within 7 and 30 days of inpatient discharge
0
50
0 0
35.3
0
52.3
65.6
0
39.4
59.461.9
0
43.8
25.7
38.1
24.223.318.2
25.722.5
23.5
46.7
43.3
47.6
41.9
0
10
20
30
40
50
60
70
AHP CCP CHP DHP GHE GHC HTP MHS MCP NHP SHP UHC UHP
Perc
enta
ge
Specialist 7 days Specialist 30 days

MEDDIC-MS Data Book 2006, Vol. 2, Wisconsin DHFS
25
Mental health/substance abuse (MH/SA) follow-up care Within 7 and 30 days of inpatient discharge (continued) Targeted Performance Improvement Measure
The 2006 HMO average for follow-up care by a primary care provider (PCP) within 7 days post-discharge from inpatient care for mental health or substance abuse diagnoses was 2.8 percent. The average for follow-up within 30 days by a PCP was 9.0 percent. Three HMOs (CCP, GHC, and UHP) had denominators with fewer than 30 discharges and are not reported individually. AHP had no encounters for this provider type. Please refer to p. 7 for a key to the HMO abbreviations. Results continued on next page.
Mental health/substance abuse follow-up care by PCPs within 7 & 30 days of inpatient discharge
0 0 0 00 0
6.3
12.4
0
6
18.8
6.3
0
1.9
4.33.1
6.3
1.8
6.1
3.83.12.8
13.7
9.2
15.2
13.5
0
2
4
6
8
10
12
14
16
18
20
AHP CCP CHP DHP GHE GHC HTP MHS MCP NHP SHP UHC UHP
Perc
enta
ge
PCP 7 days PCP 30 days

MEDDIC-MS Data Book 2006, Vol. 2, Wisconsin DHFS
26
Mental health/substance abuse (MH/SA) follow-up care Within 7 and 30 days of inpatient discharge (continued) Targeted Performance Improvement Measure
The 2006 HMO average for post-discharge follow-up care after inpatient care for mental health or substance abuse diagnoses by an "other" or "unspecified" provider within 7 days of discharge was 4.1 percent. The average for follow-up within 30 days of discharge for all ages was 8.7 percent. Three HMOs (CCP, GHC, and UHP) had fewer than 30 discharges and are not reported individually. AHP and HTP had denominators greater than 30 discharges but had no encounters for this provider type. Please refer to p. 7 for a key to the HMO abbreviations.
Mental health/substance abuse follow-up care by "other" or unspecified providers at 7 & 30 days after discharge from inpatient care
0 0 0 0 00 0
7.9
21.9
0 0
6.4
15.6
7.3
0
4.5
2.9
7
9.4
1.81.9
15.6
2.8
9.4
14.1
3.8
0
5
10
15
20
25
AHP CCP CHP DHP GHE GHC HTP MHS MCP NHP SHP UHC UHP
Perc
enta
ge
Other or unspecified provider-7 days Other or unspecified provider-30 days

MEDDIC-MS Data Book 2006, Vol. 2, Wisconsin DHFS
27
Mental health/substance abuse (MH/SA)-evaluations and outpatient care Monitoring Measure
The average rate of mental health/substance abuse outpatient evaluations for all ages across all HMOs in Medicaid and BadgerCare was 5 percent in 2006. The average rate for age 0-18 years age group was 3.6 percent; the average for the 19+ years age group was 8.0 percent. Please refer to p. 7 for a key to the HMO abbreviations. Results continued on next page.
Mental health/substance abuse outpatient care & evaluations
4
5
8.9
8
10.1
6.6
8
10.2 10.4
87.3
8.5
6.4
2
3.6
5.1
3.6
3.1
5.6
3.94.64.7
3.3
1.5
5.4
7.6
0
2
4
6
8
10
12
AHP CCP CHP DHP GHE GHC HTP MHS MCP NHP SHP UHC UHP
Perc
enta
ge
MH/SA Eval 0-18 MH/SA Eval. 19+

MEDDIC-MS Data Book 2006, Vol. 2, Wisconsin DHFS
28
Mental health/substance abuse (MH/SA)-evaluations and outpatient care (continued) Monitoring Measure
In 2006, the average rate of mental health outpatient care by a specialist for all ages across all HMOs in Medicaid and BadgerCare was 5.3 percent. The average rate of mental health outpatient care by a specialist for the 0-18 years of age group was 3.9 percent; the average rate for the 19+ year-old age group was 8.4 percent. Please refer to p. 7 for a key to the HMO abbreviations. Results continued on next page.
Mental health outpatient care by specialists
10.1
6.7
12.4
8.4
3.63.9
7.4
2.9
3.73.1
5.9
3.44.4
7.2
5.7
1.8
0.10.8
15.3
9.1
7.1
11.3
7.7
5.2
7.2
1.7
0
2
4
6
8
10
12
14
16
18
AHP CCP CHP DHP GHE GHC HTP MHS MCP NHP SHP UHC UHP
Perc
enta
ge
MH outpt. Care-Specialist, 0-18 MH outpt.care, specialist, 19+

MEDDIC-MS Data Book 2006, Vol. 2, Wisconsin DHFS
29
Mental health/substance abuse (MH/SA)-evaluations and outpatient care (continued) Monitoring Measure
In 2006, the average rate of mental health outpatient care by a primary care provider (PCP) or other (unspecified) provider for all ages across all HMOs was 4.2 percent. The average rate of mental health outpatient care by a PCP or other provider for the 0-18 years of age group was 3.0 percent; the average rate for the 19+ year-old age group was 6.8 percent. Please refer to p. 7 for a key to the HMO abbreviations. Results continued on next page.
Mental Health outpatient care by Primary care or other providers
10
6.9
8.2
6.2
10
3.6
2.5
4.9
2.9
6.4
2.5
5.7
2.7
3.84.9
3.6
0.80.5
13.7
5.7
7.97.57.77.8
0.6
1.1
0
2
4
6
8
10
12
14
16
AHP CCP CHP DHP GHE GHC HTP MHS MCP NHP SHP UHC UHP
Perc
enta
ge
MH Outpt. Care PCP/other 0-18 MH Outpt. Care PCP/other 19+

MEDDIC-MS Data Book 2006, Vol. 2, Wisconsin DHFS
30
Mental health/substance abuse (MH/SA)-evaluations and outpatient care (continued) Monitoring Measure
In 2006, the average rate of substance abuse outpatient care by a specialist for all ages across all HMOs in Medicaid and BadgerCare was 0.2 percent. The average rate of substance abuse outpatient care by a specialist for the 0-18 years of age group was 0.03 percent; the average rate for the 19+ year-old age group was 0.9 percent. Please refer to p. 7 for a key to the HMO abbreviations. Results continued on next page.
Substance abuse outpatient care by specialists
0 0 0 0 0 0 0 00.1
0
1.6
1.2
0.2 0.2
1.6
0.4
0.8
0.10.10.10.10.1
0.7
1.1
1.5
0.1
0
0.2
0.4
0.6
0.8
1
1.2
1.4
1.6
1.8
AHP CCP CHP DHP GHE GHC HTP MHS MCP NHP SHP UHC UHP
Perc
enta
ge
Substance Abuse care by specialist 0-18 Substance Abuse care by specialist 19+
MEDDIC-MS Data Book 2006, Vol. 2, Wisconsin DHFS
31
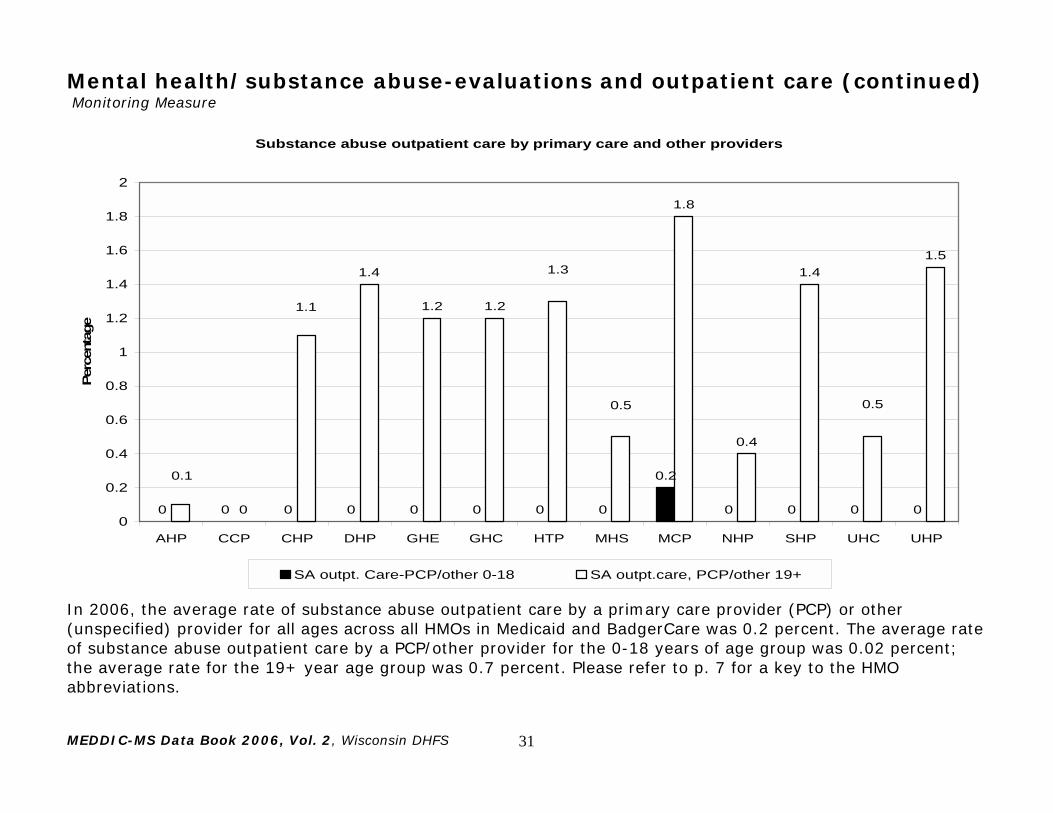
Mental health/substance abuse-evaluations and outpatient care (continued) Monitoring Measure
In 2006, the average rate of substance abuse outpatient care by a primary care provider (PCP) or other (unspecified) provider for all ages across all HMOs in Medicaid and BadgerCare was 0.2 percent. The average rate of substance abuse outpatient care by a PCP/other provider for the 0-18 years of age group was 0.02 percent; the average rate for the 19+ year age group was 0.7 percent. Please refer to p. 7 for a key to the HMO abbreviations.
Substance abuse outpatient care by primary care and other providers
0 0 0 0 0 0 0 0
0.2
0 0 0 00
1.4
1.2 1.2
1.8
0.4
1.41.5
0.50.5
1.3
1.1
0.1
0
0.2
0.4
0.6
0.8
1
1.2
1.4
1.6
1.8
2
AHP CCP CHP DHP GHE GHC HTP MHS MCP NHP SHP UHC UHP
Perc
enta
ge
SA outpt. Care-PCP/other 0-18 SA outpt.care, PCP/other 19+

MEDDIC-MS Data Book 2006, Vol. 2, Wisconsin DHFS
32
Non-EPSDT Well-child Care Monitoring measure
The average rate of provision of at least one non-EPSDT well-child visit for children under age one year across all HMOs in Medicaid and BadgerCare was 96.6 percent in 2006. The average rate of provision of at least one non-EPSDT well-child visit for children age one to two years across all HMOs in Medicaid and BadgerCare was 95 percent. CCP had fewer than 30 enrollees in the denominator for one-year-olds, so that is not reported. Please refer to p. 7 for a key to the HMO abbreviations. Results continued on next page.
Non-EPSDT well-child visits, age birth to two years
95.8
98.297.3
96
98.2
96.1
91.9
10095.6
97.11009998.696.4
94.696.5
93.896.6
95.19595.195.9 9696.1
95.8
70
75
80
85
90
95
100
AHP CCP CHP DHP GHE GHC HTP MHS MCP NHP SHP UHC UHP
Perc
enta
ge
<1 year 1 to 2 years

MEDDIC-MS Data Book 2006, Vol. 2, Wisconsin DHFS
33
Non-EPSDT Well-child Care (continued) Monitoring measure
The average rate of provision of at least one non-EPSDT well-child visit for children age 3 to 5 years across all HMOs in 2006 was 87.2 percent. The average rate for children age 6 to 14 years across all HMOs was 74.9 percent. For children age 15-20 years of age, the rate was 75.6 percent. Please refer to p. 7 for a key to the HMO abbreviations.
Non-EPSDT well-child visits, age 3-21
79.8
90.4 90.6 89.8 91.686
86.6 88.4 88.2 87 87.5 85.6 89.5
80.6
72.883
.7
82.6
84.7
82.9
70.9
7373.4
76.3
78.2
68.6
68.5
78.9
74.3
83.5
71.4
7773.7
78.4
79.4
83.3
83.2
84.5
65.2
67.4
0
10
20
30
40
50
60
70
80
90
100
AHP CCP CHP DHP GHE GHC HTP MHS MCP NHP SHP UHC UHP
Perc
enta
ge
3 to 5 years 6 to 14 years 15-20 years

MEDDIC-MS Data Book 2006, Vol. 2, Wisconsin DHFS
34
Obesity prevention & treatment Monitoring measure
In 2006, the program wide average for the period prevalence of encounters for a diagnosis of obesity was 5.5 percent. The average percentage for screening and prevention services was 74.7 percent; for non-surgical obesity treatment with medications the period prevalence rate was 3.9 percent and for intervention with bariatric surgery 0.6 percent. Please refer to p. 7 for a key to the HMO abbreviations.
Obesity prevention and treatment, all ages
72.1
83.8
74.4 74.371.8
0 0 0 00 0
2.2 3
0
2.1
6.6
6.2
6.6
4.2
6.3
5.2
3.8
5.7
5.4
5.8
5.1
3.6
5.3
66.275.775.6
79.9 76.775.9
57.1
77.6
4.9
4.4
3.55.8
3.1
6.9
4.8
2.68.8
1.6
0 0 0.2
0.3 1.3
0.4
0
10
20
30
40
50
60
70
80
90
AHP CCP CHP DHP GHE GHC HTP MHS MCP NHP SHP UHC UHP
Perc
enta
ge
diagnosed obese/overweight screening/prevention Rx counseling or medication Bariatric surgery

MEDDIC-MS Data Book 2006, Vol. 2, Wisconsin DHFS
35
Pap Tests-Cervical Cancer Screening Targeted performance improvement measure
In 2006, the average rate of provision of Pap tests across all HMOs for women age 18-65 years was 42 percent, up from 35.4 percent 2005. The rate of detection of cervical malignancies was 0.2 percent. The rate of detection of human Papillomavirus (HPV) infections was 0.3 percent. Please refer to p. 7 for a key to the HMO abbreviations.
Pap test, malignancy detected and HPV detected
43.8 43.9 43.241 42
31.7
41 40.9
0 0 0 0 00 0 0 0.4
0.5
0 0 0.5
0.1
0.3
0.2
0
47.149.3
38.7
18.8
27.3
0.1
0.2
0.20.5
0.3
0.9
0.4
0.4
2.4
0
10
20
30
40
50
60
AHP CCP CHP DHP GHE GHC HTP MHS MCP NHP SHP UHC UHP
Perc
enta
ge
Pap test Malignancy detected HPV

MEDDIC-MS Data Book 2006, Vol. 2, Wisconsin DHFS
36
Tobacco dependence treatment Monitoring measure
In 2006, the average period prevalence of encounters with diagnosed tobacco dependence was 16.5 percent. The average rate for delivery of tobacco cessation counseling without concurrent use of prescription medications was 13.7 percent; for counseling with concurrent medications ordered the rate was 4.2 percent and for use of prescription medication without concurrent counseling, the rate was 10.7 percent. Please refer to p. 7 for a key to the HMO abbreviations.
Tobacco dependence period prevalence and treatment
0
25.5
21.1
7.7
0
16.7
35.1
2.2
0
5.7 6.1
6.3
4.9
15.4
2.7
5.8
2.8
7.1
3.4
8
9.9
0
7.8
7.5
10.8
7.7
10
24
14.5
18.7
28.2
14.3
11.9
20.1
23. 7
17.1
7.4
14.4
12.5
17.6
11.6
18.4
11.3
15.8
18.5
12.6
17.4
18.5
28.8
13.6
13.7
14.1
0
5
10
15
20
25
30
35
40
AHP CCP CHP DHP GHE GHC HTP MHS MCP NHP SHP UHC UHP
Perc
enta
ge
Diagnosis Counseling only Counseling and medication Medication only