clinical performance and employee safety metrics (october...
TRANSCRIPT
CLINICAL AND SAFETY PERFORMANCE METRICSExecutive Dashboard
NIH Clinical CenterOctober 2019
Patients’ Perceptions• Overall Hospital Rating• Would you Recommend the NIH CC?
50
55
60
65
70
75
80
85
90
95
100
Q3 CY 2018 Q4 CY 2018 Q1 CY 2019 Q2 CY 2019 Q3 CY 2019
Perc
ent P
ositi
ve R
espo
nse
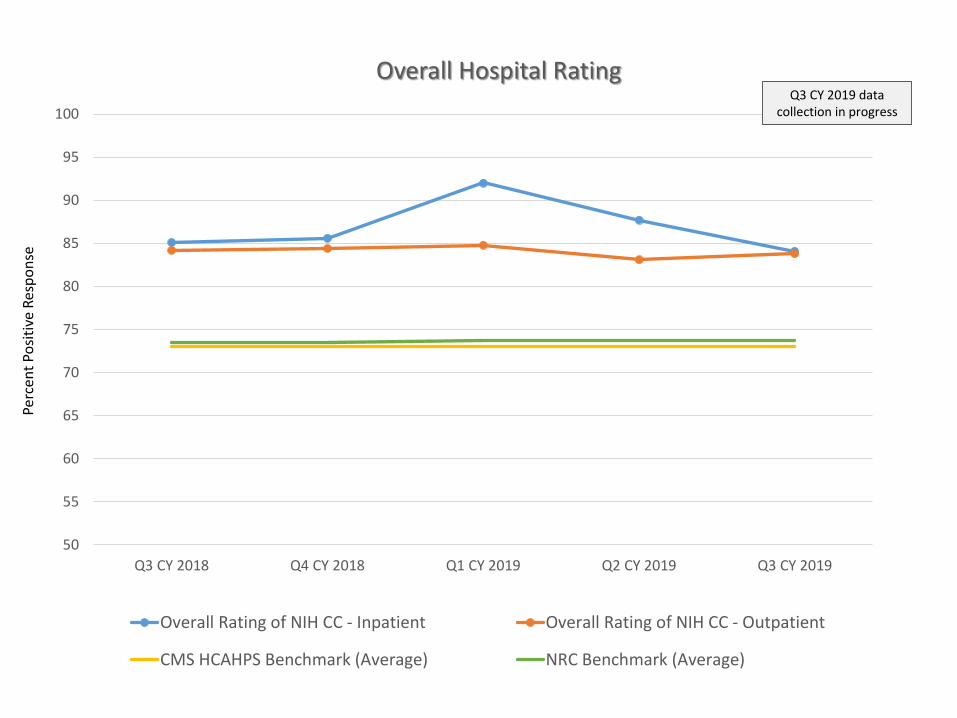
Overall Hospital Rating
Overall Rating of NIH CC - Inpatient Overall Rating of NIH CC - Outpatient
CMS HCAHPS Benchmark (Average) NRC Benchmark (Average)
Q3 CY 2019 data collection in progress
50
55
60
65
70
75
80
85
90
95
100
Q3 CY 2018 Q4 CY 2018 Q1 CY 2019 Q2 CY 2019 Q3 CY 2019
Perc
ent P
ositi
ve R
espo
nse
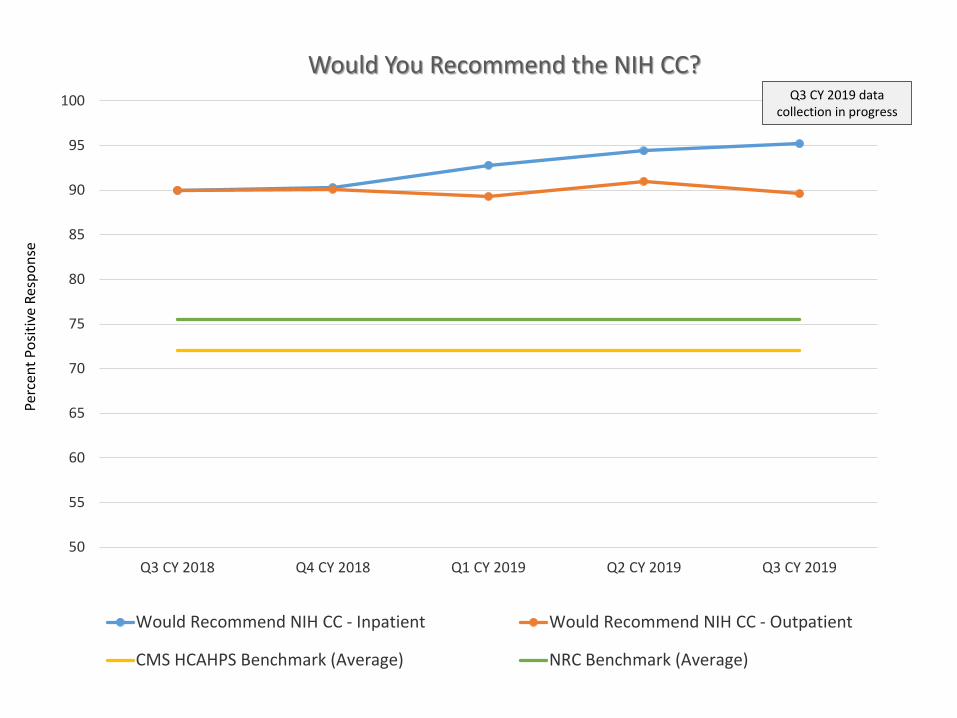
Would You Recommend the NIH CC?
Would Recommend NIH CC - Inpatient Would Recommend NIH CC - Outpatient
CMS HCAHPS Benchmark (Average) NRC Benchmark (Average)
Q3 CY 2019 data collection in progress
Infection Control Metrics • Hand Hygiene• Central-Line Associated Bloodstream Infections
• Whole-house• Intensive Care Unit
• Catheter Associated Urinary Tract Infections• Intensive Care Unit• Surgical Oncology
0%
10%
20%
30%
40%
50%
60%
70%
80%
90%
100%
2018-Q2 2018-Q3 2018-Q4 2019-Q1 2019-Q2
Perc
ent A
dher
ence
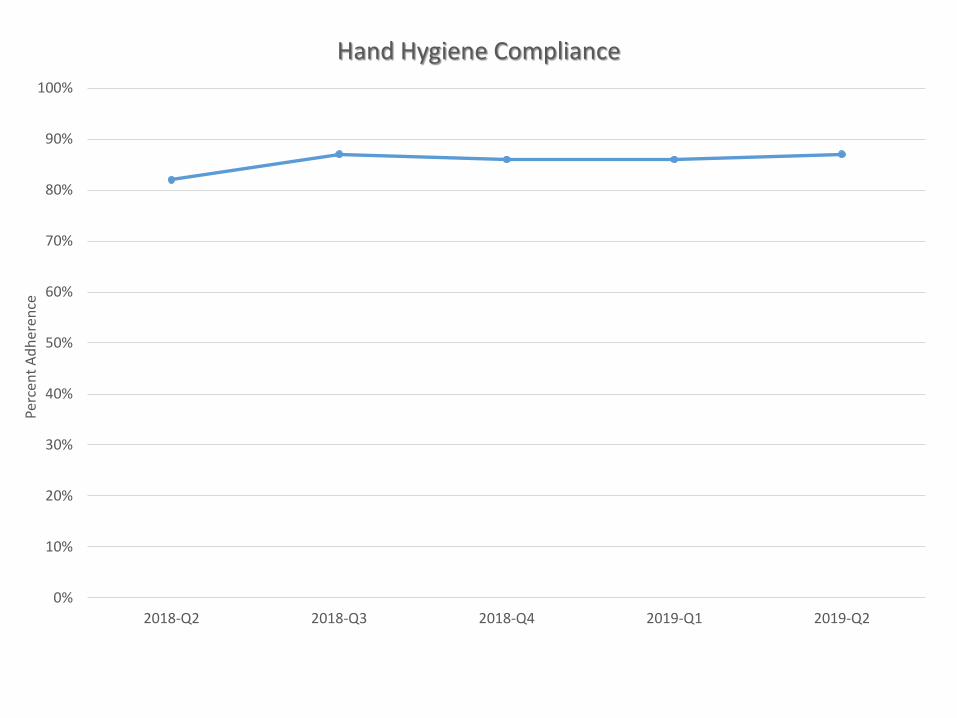
Hand Hygiene Compliance
0.00
0.20
0.40
0.60
0.80
1.00
1.20
1.40
1.60
1.80
2018-Q2 2018-Q3 2018-Q4 2019-Q1 2019-Q2
Infe
ctio
ns p
er 1
,000
cath
eter
day
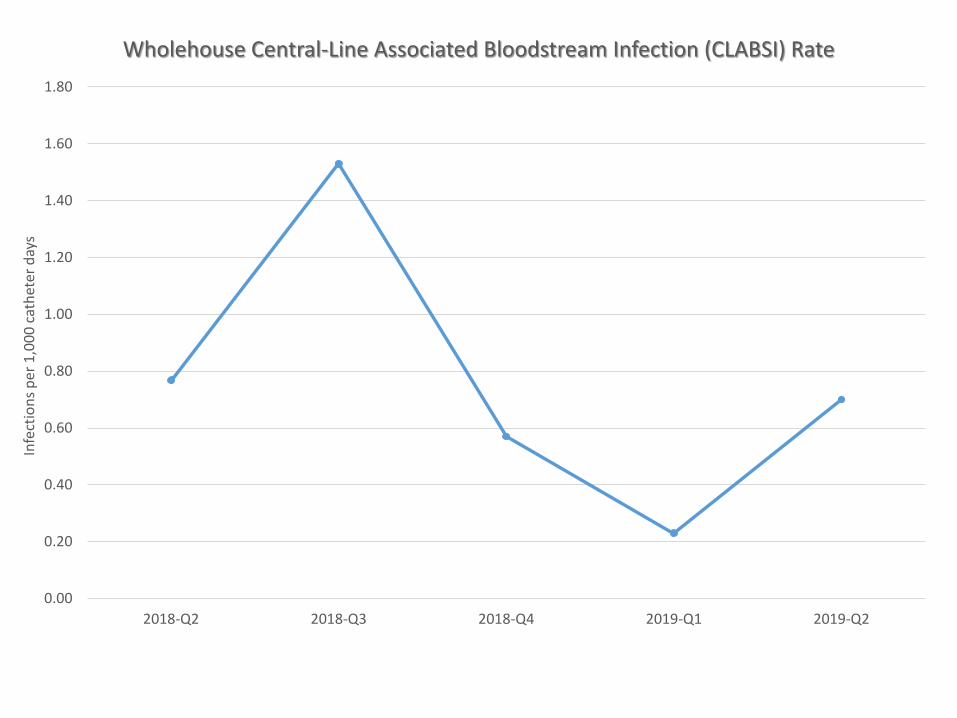
sWholehouse Central-Line Associated Bloodstream Infection (CLABSI) Rate
0.00
0.20
0.40
0.60
0.80
1.00
1.20
2018-Q2 2018-Q3 2018-Q4 2019-Q1 2019-Q2
Infe
ctio
ns p
er 1
,000
cath
eter
day
s
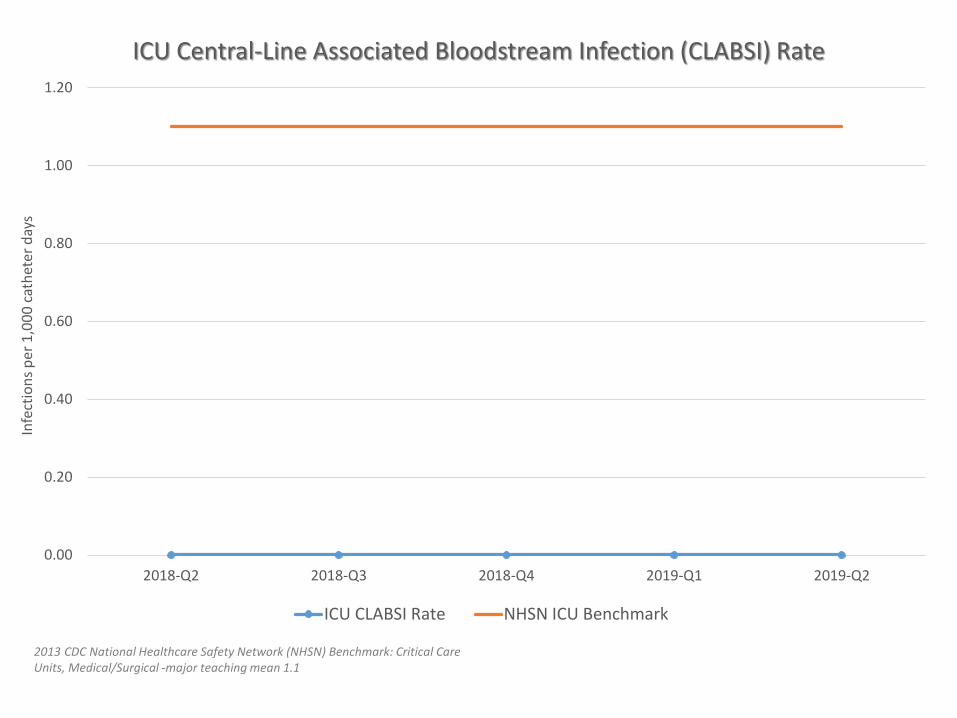
ICU Central-Line Associated Bloodstream Infection (CLABSI) Rate
ICU CLABSI Rate NHSN ICU Benchmark
2013 CDC National Healthcare Safety Network (NHSN) Benchmark: Critical Care Units, Medical/Surgical -major teaching mean 1.1
0.00
0.50
1.00
1.50
2.00
2.50
3.00
3.50
4.00
4.50
5.00
2018-Q2 2018-Q3 2018-Q4 2019-Q1 2019-Q2
Infe
ctio
ns p
er 1
,000
fole
y da
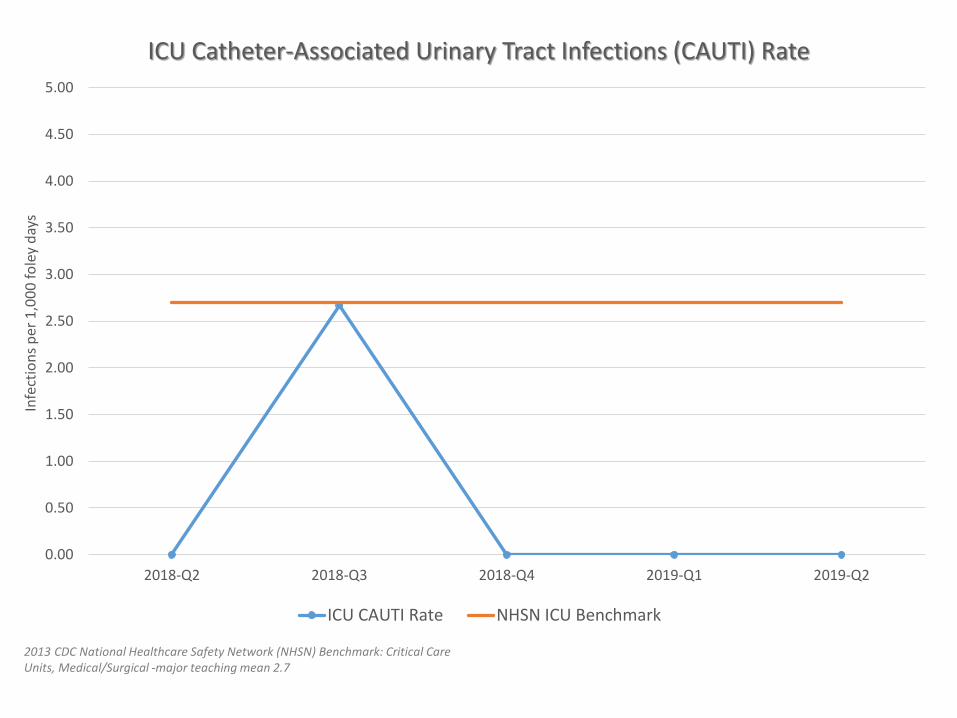
ysICU Catheter-Associated Urinary Tract Infections (CAUTI) Rate
ICU CAUTI Rate NHSN ICU Benchmark
2013 CDC National Healthcare Safety Network (NHSN) Benchmark: Critical Care Units, Medical/Surgical -major teaching mean 2.7
0.00
0.50
1.00
1.50
2.00
2.50
3.00
3.50
4.00
4.50
5.00
2018-Q2 2018-Q3 2018-Q4 2019-Q1 2019-Q2
Infe
ctio
ns p
er 1
,000
fole
y da
ys
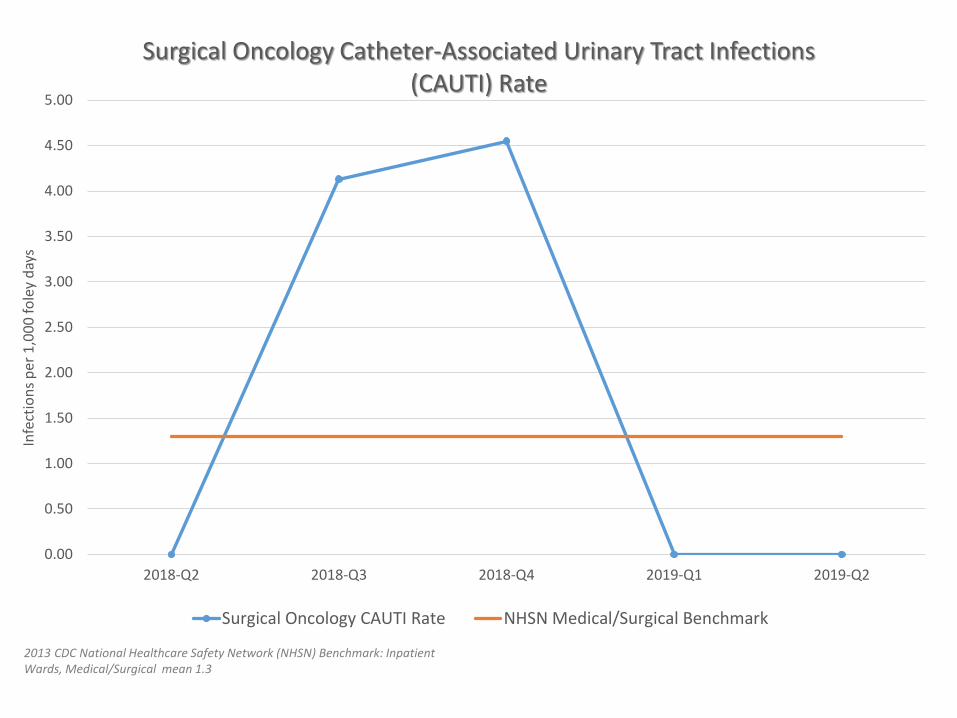
Surgical Oncology Catheter-Associated Urinary Tract Infections (CAUTI) Rate
Surgical Oncology CAUTI Rate NHSN Medical/Surgical Benchmark
2013 CDC National Healthcare Safety Network (NHSN) Benchmark: Inpatient Wards, Medical/Surgical mean 1.3
0.00
0.50
1.00
1.50
2.00
2.50
3.00
3.50
2018-Q2 2018-Q3 2018-Q4 2019-Q1 2019-Q2
Infe
ctio
ns p
er 1
00 p
roce
dure
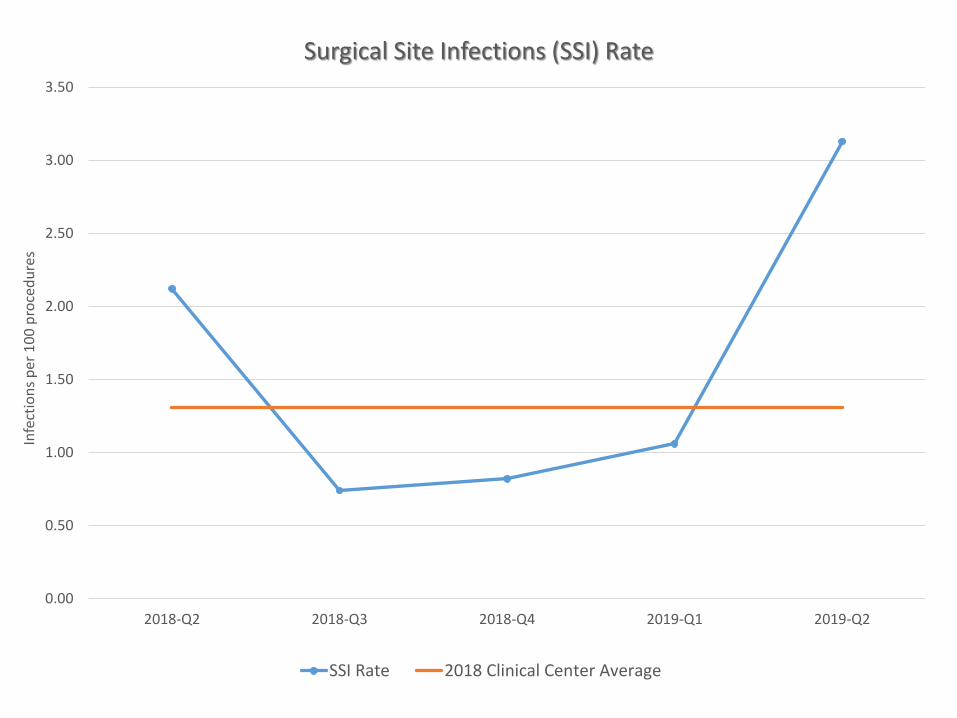
sSurgical Site Infections (SSI) Rate
SSI Rate 2018 Clinical Center Average
Nursing Quality Metrics • Falls• Pressure Injury• Medication Administration Barcoding
0
0.5
1
1.5
2
2.5
3
Q3 CY 2018 Q4 CY 2018 Q1 CY 2019 Q2 CY 2019 Q3 CY 2019
Falls
per
1,0
00 p
atie
nt d
ays
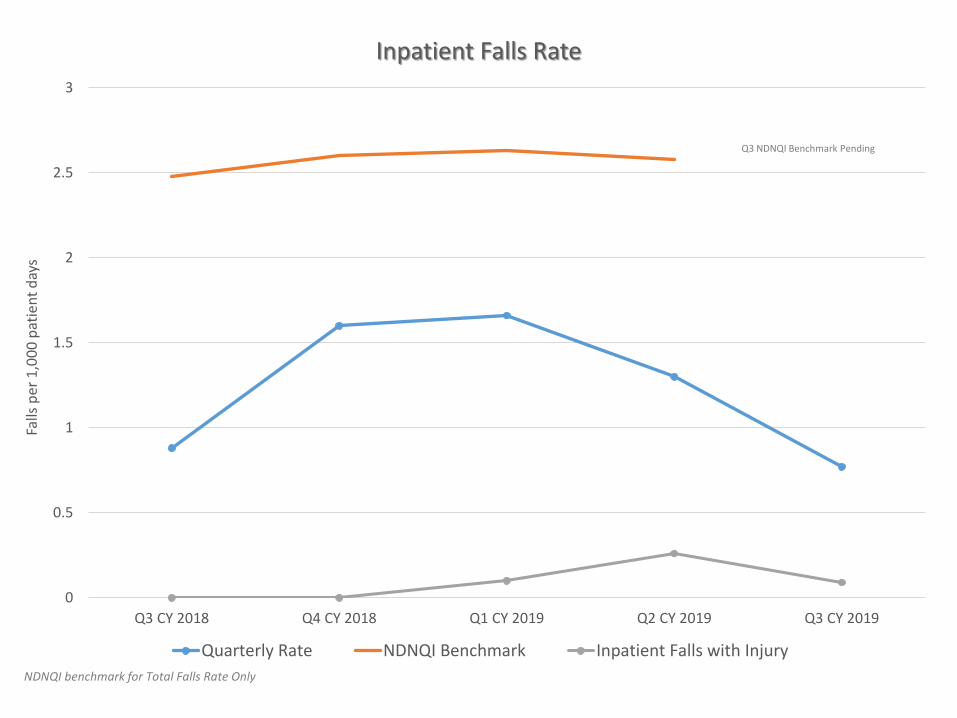
Inpatient Falls Rate
Quarterly Rate NDNQI Benchmark Inpatient Falls with Injury
Q3 NDNQI Benchmark Pending
NDNQI benchmark for Total Falls Rate Only

0
1
2
3
4
5
6
Q3 CY 2018 Q4 CY 2018 Q1 CY 2019 Q2 CY 2019 Q3 CY 2019
% o
f sur
veye
d pa
tient
s with
pre
ssur
e in
jury
Pressure Injury Prevalence
Quarterly Rate
Q3 NDNQI Benchmark
Pending
NDNQI Benchmark for Total Pressure Injury Rate only
90%
91%
92%
93%
94%
95%
96%
97%
98%
99%
100%
Q3 CY 2018 Q4 CY 2018 Q1 CY 2019 Q2 CY 2019 Q3 CY 2019
% B
arco
de U
se
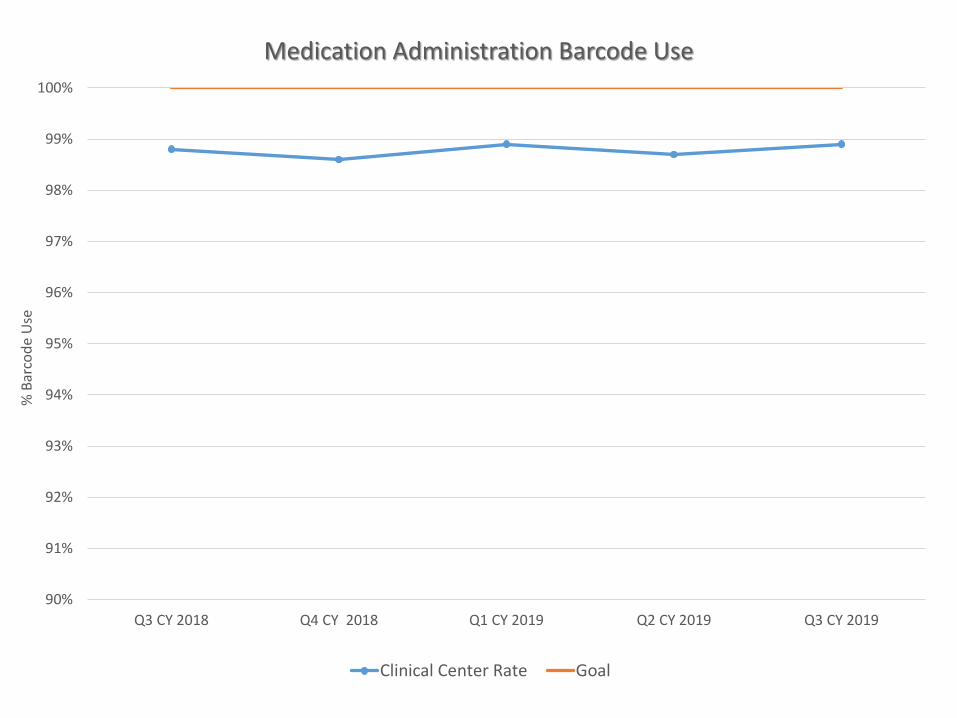
Medication Administration Barcode Use
Clinical Center Rate Goal
Emergency Response• Code Blue and Rapid Response
• Types of Patients• Type of Event• Patient Disposition
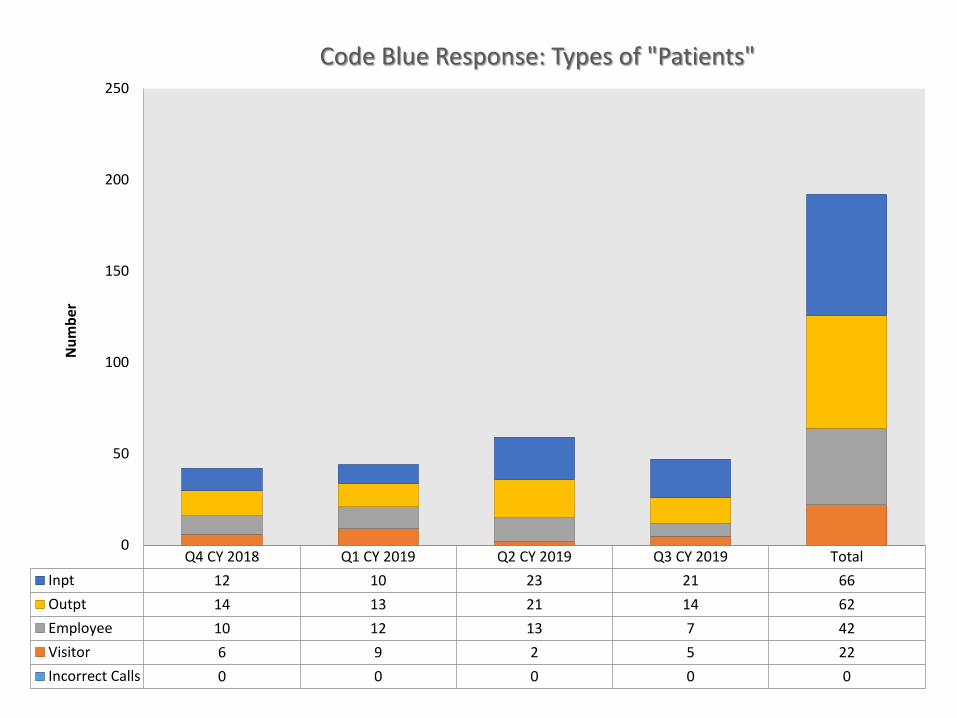
Q4 CY 2018 Q1 CY 2019 Q2 CY 2019 Q3 CY 2019 TotalInpt 12 10 23 21 66Outpt 14 13 21 14 62Employee 10 12 13 7 42Visitor 6 9 2 5 22Incorrect Calls 0 0 0 0 0
0
50
100
150
200
250N
umbe
rCode Blue Response: Types of "Patients"
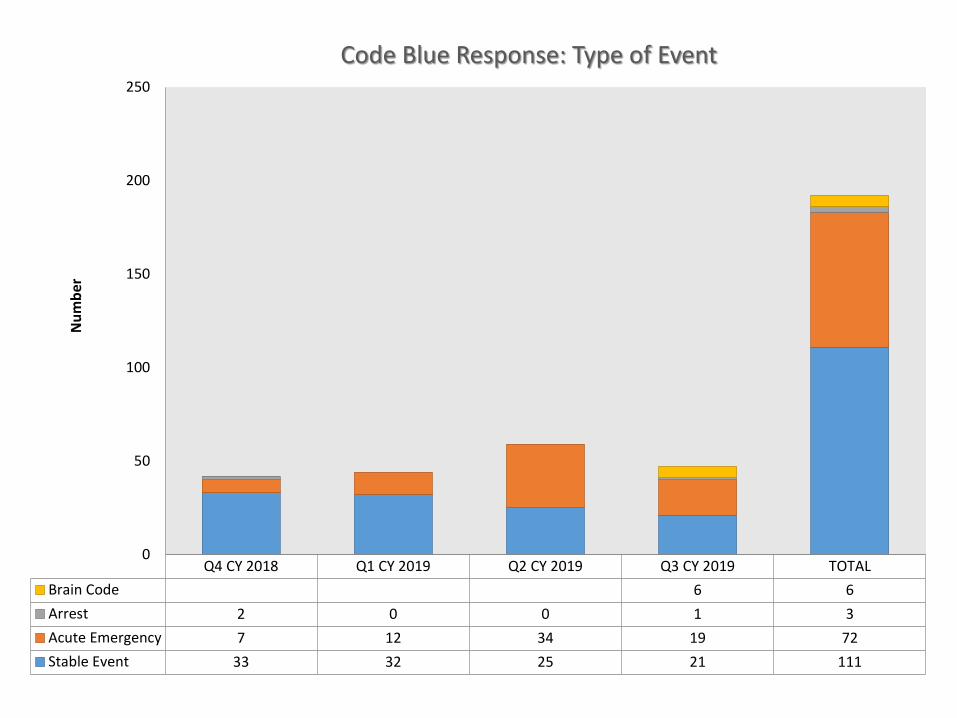
Q4 CY 2018 Q1 CY 2019 Q2 CY 2019 Q3 CY 2019 TOTALBrain Code 6 6Arrest 2 0 0 1 3Acute Emergency 7 12 34 19 72Stable Event 33 32 25 21 111
0
50
100
150
200
250N
umbe
rCode Blue Response: Type of Event
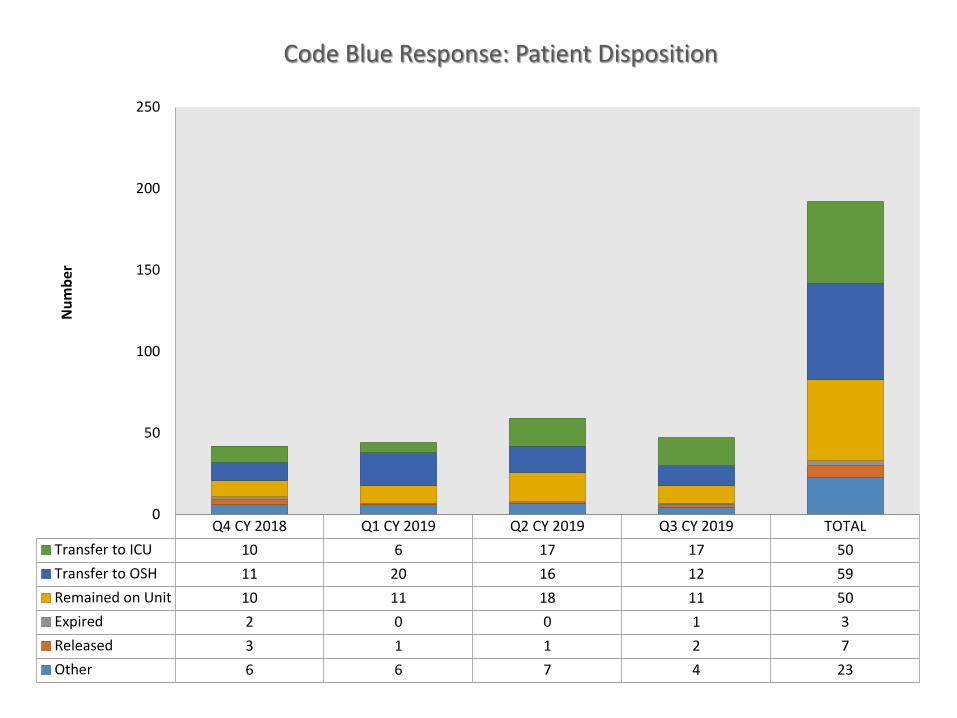
Q4 CY 2018 Q1 CY 2019 Q2 CY 2019 Q3 CY 2019 TOTALTransfer to ICU 10 6 17 17 50Transfer to OSH 11 20 16 12 59Remained on Unit 10 11 18 11 50Expired 2 0 0 1 3Released 3 1 1 2 7Other 6 6 7 4 23
0
50
100
150
200
250
Num
ber
Code Blue Response: Patient Disposition
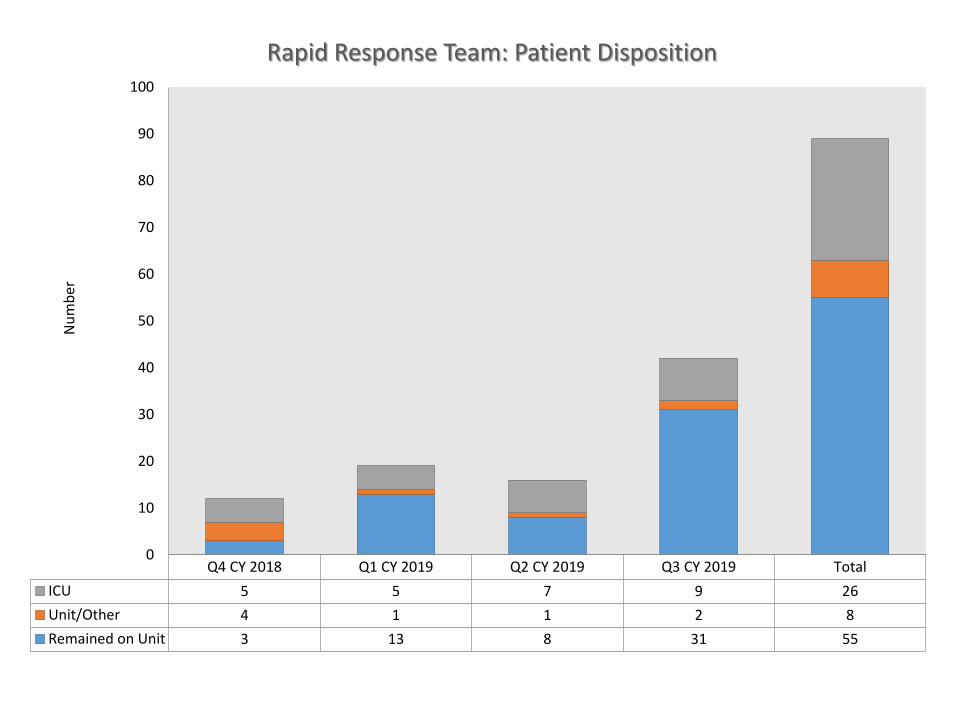
Q4 CY 2018 Q1 CY 2019 Q2 CY 2019 Q3 CY 2019 TotalICU 5 5 7 9 26Unit/Other 4 1 1 2 8Remained on Unit 3 13 8 31 55
0
10
20
30
40
50
60
70
80
90
100N
umbe
rRapid Response Team: Patient Disposition
Blood and Blood Product Use• Crossmatch to Transfusion (C:T) Ratio• Transfusion Reaction by Class• Unacceptable Blood Bank Specimens
0.00
0.50
1.00
1.50
2.00
2.50
Q3 CY 2018 Q4 CY 2018 Q1 CY 2019 Q2 CY 2019 Q3 CY 2019
Cros
smat
ch to
Tra
nsfu
sed
Uni
ts R
atio
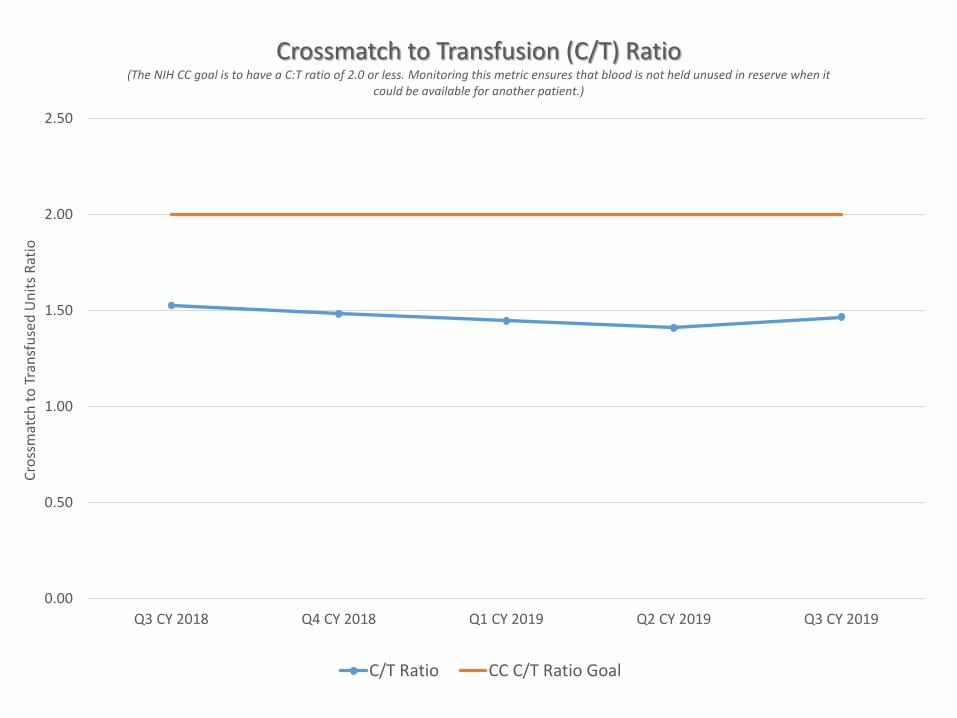
Crossmatch to Transfusion (C/T) Ratio(The NIH CC goal is to have a C:T ratio of 2.0 or less. Monitoring this metric ensures that blood is not held unused in reserve when it
could be available for another patient.)
C/T Ratio CC C/T Ratio Goal
0.0%
0.1%
0.2%
0.3%
0.4%
0.5%
0.6%
Q3 CY 2018 Q4 CY 2018 Q1 CY 2019 Q2 CY 2019 Q3 CY 2019
Perc
ent o
f Tra
nsfu
sions
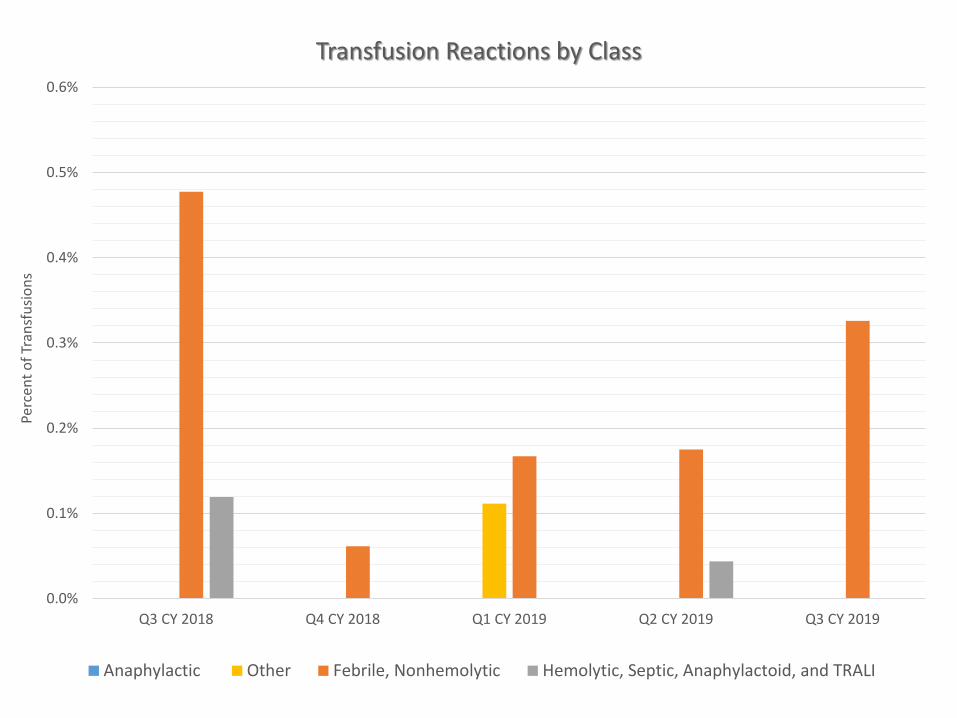
Transfusion Reactions by Class
Anaphylactic Other Febrile, Nonhemolytic Hemolytic, Septic, Anaphylactoid, and TRALI
0.0%
0.5%
1.0%
1.5%
2.0%
2.5%
3.0%
3.5%
Q3 CY 2018 Q4 CY 2018 Q1 CY 2019 Q2 CY 2019 Q3 CY 2019
Perc
ent U
nacc
epta
ble
Spec
imen
s
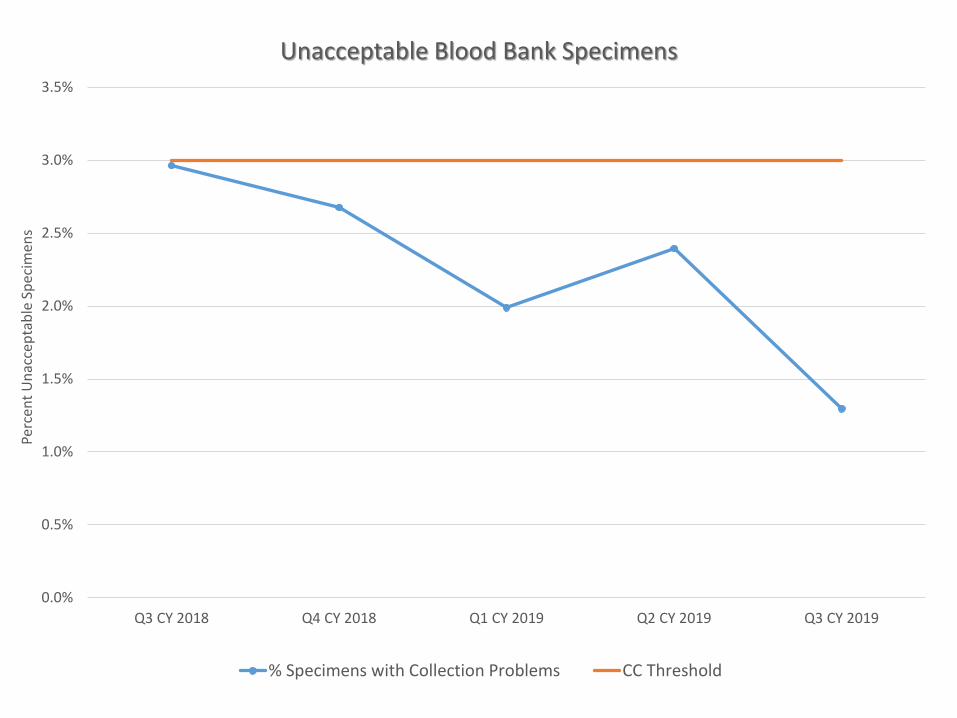
Unacceptable Blood Bank Specimens
% Specimens with Collection Problems CC Threshold
Clinical Documentation• Medical Record Completeness
• Delinquent Records• “Agent for” Countersignature Adherence• Unacceptable Abbreviation Use
• Accuracy of Coding
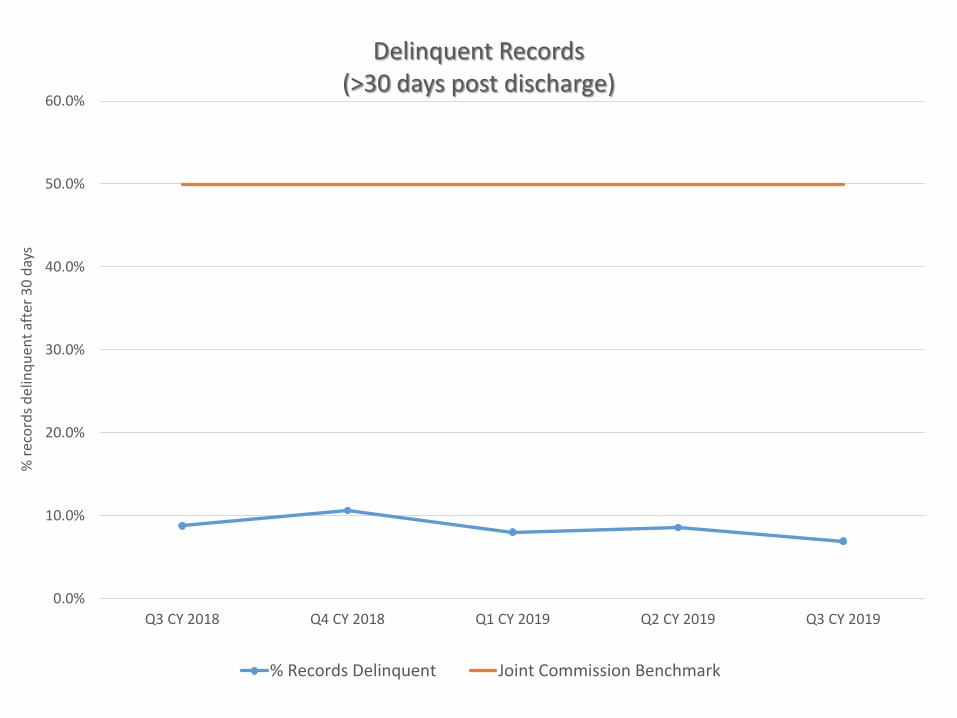
0.0%
10.0%
20.0%
30.0%
40.0%
50.0%
60.0%
Q3 CY 2018 Q4 CY 2018 Q1 CY 2019 Q2 CY 2019 Q3 CY 2019
% re
cord
s del
inqu
ent a
fter
30
days
Delinquent Records(>30 days post discharge)
% Records Delinquent Joint Commission Benchmark

50%
55%
60%
65%
70%
75%
80%
85%
90%
95%
100%
Q3 CY 2018 Q4 CY 2018 Q1 CY 2019 Q2 CY 2019 Q3 CY 2019
% v
erba
l ord
ers s
igne
d in
72
hour
s
"Agent for" Orders Countersignature Compliance
% of Compliance CC Goal
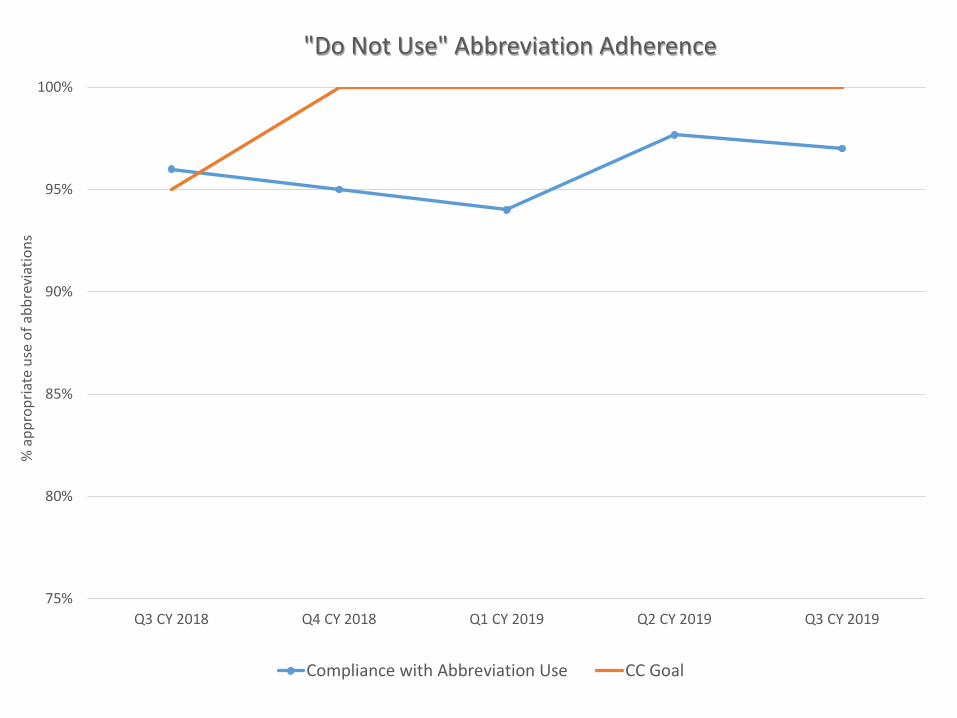
75%
80%
85%
90%
95%
100%
Q3 CY 2018 Q4 CY 2018 Q1 CY 2019 Q2 CY 2019 Q3 CY 2019
% a
ppro
pria
te u
se o
f abb
revi
atio
ns"Do Not Use" Abbreviation Adherence
Compliance with Abbreviation Use CC Goal
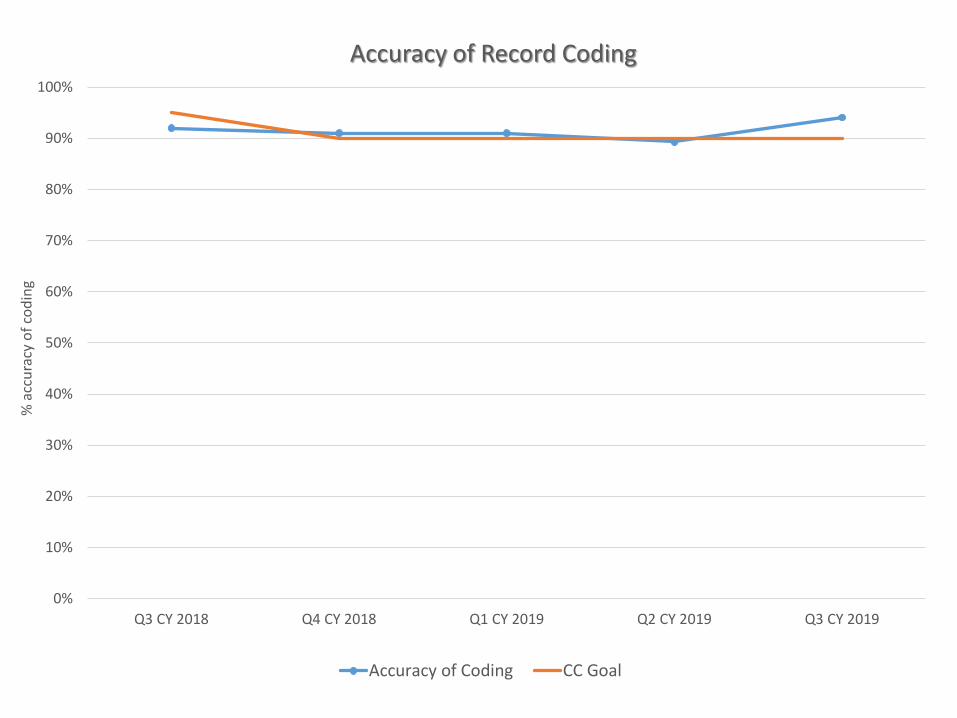
0%
10%
20%
30%
40%
50%
60%
70%
80%
90%
100%
Q3 CY 2018 Q4 CY 2018 Q1 CY 2019 Q2 CY 2019 Q3 CY 2019
% a
ccur
acy
of co
ding
Accuracy of Record Coding
Accuracy of Coding CC Goal

Employee Safety • Occupational Injury and Illness

0
5
10
15
20
25
30
35
40
Q2 CY 2018 Q3 CY 2018 Q4 CY 2018 Q1 CY 2019 Q2 CY 2019
Num
ber o
f Cas
es
Occupational Injuries and Illnesses for CC Employees
TRC ORC DAFW DJTR DART
TRC: Total Recordable Cases; ORC: Other Recordable Cases; DAFW: Days Away From Work; DJTR: Days Job Transfer, Restriction; DART: Days Away, Restricted or Transferred (DAFW + DJTR)
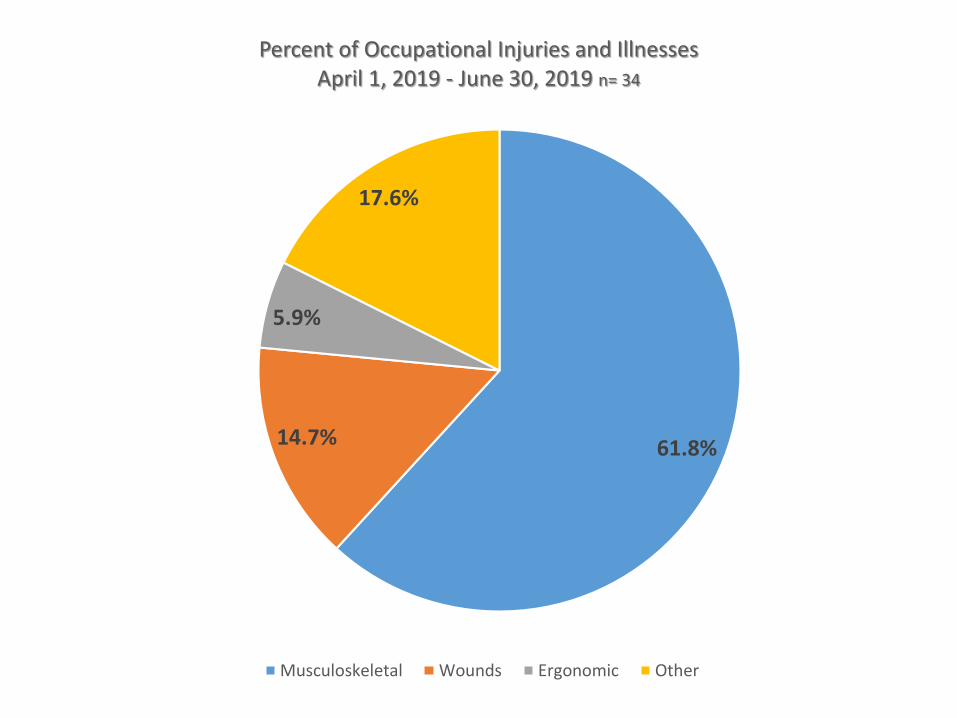
61.8%14.7%
5.9%
17.6%
Percent of Occupational Injuries and Illnesses April 1, 2019 - June 30, 2019 n= 34
Musculoskeletal Wounds Ergonomic Other