clinical, kinematic, and kinetic analysis of knee
TRANSCRIPT
Clemson UniversityTigerPrints
All Dissertations Dissertations
5-2014
Clinical, Kinematic, and Kinetic Analysis of KneeArthrodesis in Support of the Design of a NovelTreatment AlternativeEric Montgomery LucasClemson University
Follow this and additional works at: https://tigerprints.clemson.edu/all_dissertations
This Dissertation is brought to you for free and open access by the Dissertations at TigerPrints. It has been accepted for inclusion in All Dissertations byan authorized administrator of TigerPrints. For more information, please contact [email protected].
Recommended CitationLucas, Eric Montgomery, "Clinical, Kinematic, and Kinetic Analysis of Knee Arthrodesis in Support of the Design of a NovelTreatment Alternative" (2014). All Dissertations. 1773.https://tigerprints.clemson.edu/all_dissertations/1773

CLINICAL, KINEMATIC, AND KINETIC ANALYSIS OF KNEE ARTHRODESIS IN
SUPPORT OF THE DESIGN OF A NOVEL TREATMENT ALTERNATIVE
A Dissertation
Presented to
the Graduate School of
Clemson University
In Partial Fulfillment
of the Requirements for the Degree
Doctor of Philosophy
Bioengineering
by
Eric Montgomery Lucas
May 2014
Accepted by:
John D. DesJardins, Ph.D., Committee Chair
Martine Laberge, Ph.D., Committee Member
Robert Latour, Ph.D., Committee Member
Frank Voss, M.D., Committee Member

ii
ABSTRACT
The following body of work is the result of collaborative efforts between
researchers at Clemson University and a team of practicing orthopedic surgeons. It begins
with the identification of an inadequately addressed clinical need, the treatment of severe
knee dysfunction, in the practices of our clinical collaborators. A case report, reviewing
the condition of five affected patients, is presented to provide initial evidence for the
existence of this need. A thorough review of the causes and currently available treatment
options for knee dysfunction, including arthrodesis, is provided to clarify the need and
establish its widespread significance, and a novel treatment model is proposed and
discussed with respect to existing treatments.
In spite of a large number of recently published clinical case reports, the total
number of affected patients has been heretofore unreported. In order to establish this
figure in further support of the need for an alternative treatment, a large database of
hospital discharge records is analyzed. An estimate of the frequency of knee arthrodesis
is provided, and the affected patients are characterized.
Having quantified the incidence of the primary treatment method, and thus
provided an estimate of the affected patient subpopulation, the effect of this treatment on
lower body biomechanics is addressed. A gait analysis study was designed to simulate
knee arthrodesis in normal, healthy subjects, providing a comprehensive quantification of
joint kinematics and kinetics and allowing for the investigation of further hypotheses
regarding the effects of treatment.

iii
In spite of a number of reported cases of mechanical failure in knee arthrodesis
implant designs, the robustness of these designs against such failure has been a neglected
subject in literature. Data obtained from a previously conducted gait analysis study is
used to estimate the loading conditions at an immobilized knee through the construction
of a computational biomechanical model. The purpose of this model is to estimate the
resultant effects of knee immobilization on the musculoskeletal system during gait, and
estimates of muscle and joint loading patterns are provided.
Together, this knowledge is used to assist in the design and development of a
novel treatment model, in the form of a salvage total knee replacement. This patent
pending treatment is designed to subsume existing, less constrained treatment methods as
well, broadening its applicability. It has been refined over the course of several design
cycles, which were informed by the regulatory guidelines for medical device design in
the United States. Prototyping techniques have been used throughout the design process
to demonstrate proof of concept.
This work is intended to establish the significance of an unmet clinical need,
characterize the patient subset and treatment patterns affected by the need, quantify the
biomechanical conditions in the bodies of affected patients, and ultimately facilitate the
translation of a proposed medical device from concept to clinical use.

iv
DEDICATION
This work is dedicated to my parents, Stephen and Mary Lucas. You have always
emphasized the importance of education and hard work, and you instilled the
prerequisites for success in me from a young age. When you wanted me to stop watching
television or playing video games as a child, an appeal to authority wasn’t enough. I still
vividly remember all of the “studies” that you cited on the awful and addictive effects of
“TVitis,” giving me the incentive to research the matter for myself (to find the opposite
conclusion, I had hoped). I would not be where I am today without your unending
support and encouragement. But just as importantly, you have been the best role models
one could ever wish to have. You have served as a source of inspiration that I can only
hope to live up to, providing examples of love, interdependence, support, drive, hard
work, and self-discipline in every aspect of your lives, including your marriage, your
work, your dedication to health and fitness, and even your leisure. And you were right
about television.

v
ACKNOWLEDGEMENTS
I would like to thank my advisor, John DesJardins, for believing in me and giving
me the opportunity to pursue this research. I’d also like to thank all the educators in my
life, especially John Norris and Glen Livesay, who have had a particularly enduring
impact on my worldview. I am greatly appreciative of Max Sherman, who is truly
inspiring, and who encouraged me to pursue further education.

vi
TABLE OF CONTENTS
Page
ABSTRACT ...................................................................................................................... ii
DEDICATION ................................................................................................................. iv
ACKNOWLEDGEMENTS .............................................................................................. v
TABLE OF CONTENTS ................................................................................................. vi
Page .................................................................................................................................. vi
LIST OF TABLES ........................................................................................................... ix
LIST OF FIGURES ......................................................................................................... xi
CHAPTER
I. INTRODUCTION .......................................................................................... 1
II. RESEARCH OBJECTIVES ........................................................................... 6
Aim I: Establish the existence and quantify the size of the affected
clinical population ..................................................................................... 6 Aim II: Quantify the changes to gait biomechanics induced by
knee immobilization.................................................................................. 6
Aim II: Estimate the joint loading patterns of a rigidly constrained
knee ........................................................................................................... 6
Aim IV: Design an implantable device to serve as a proposed
clinical treatment ....................................................................................... 6
III. CLINICAL ETIOLOGIES IN THE LOSS OF KNEE
FUNCTION: A CASE REPORT .............................................................. 7
Abstract ..................................................................................................... 7
Introduction ............................................................................................... 7 Case Description ....................................................................................... 9 Discussion ............................................................................................... 15 Acknowledgements ................................................................................. 16
IV. BACKGROUND AND REVIEW ................................................................ 17
Abstract ................................................................................................... 17

vii
Table of Contents (Continued) Page
Rise in Primary Total Knee Replacement ............................................... 17 Rise in Revision Total Knee Replacements ............................................ 18 Poorer Outcomes after Repeated Surgery ............................................... 20
Knee Dysfunction and Weakness ........................................................... 23 Transfemoral Amputation ....................................................................... 25 Knee Arthrodesis .................................................................................... 25 Alternative Surgical Approaches to Arthrodesis .................................... 27 Discussion ............................................................................................... 28
V. QUANTIFYING THE AFFECTED PATIENT
POPULATION ....................................................................................... 30
Hypothesis............................................................................................... 30
Abstract ................................................................................................... 30 Introduction ............................................................................................. 31 Materials and Methods ............................................................................ 35
Results ..................................................................................................... 39 Discussion ............................................................................................... 52
Acknowledgements ................................................................................. 57
VI. CHANGES TO GAIT KINEMATICS AND KINETICS
INDUCED BY RIGID KNEE CONSTRAINT ...................................... 58
Hypothesis............................................................................................... 58
Abstract ................................................................................................... 58 Introduction ............................................................................................. 59 Materials and Methods ............................................................................ 62
Results ..................................................................................................... 76 Discussion ............................................................................................... 85
Acknowledgements ................................................................................. 90
VII. ESTIMATED JOINT LOADING AT A RIGIDLY
CONSTRAINED KNEE ......................................................................... 91
Hypothesis............................................................................................... 91
Abstract ................................................................................................... 91 Introduction ............................................................................................. 91 Materials and Methods ............................................................................ 98 Results ................................................................................................... 105 Discussion ............................................................................................. 122
Acknowledgements ............................................................................... 125

viii
Table of Contents (Continued) Page
VIII. DESIGN OF AN IMPLANTABLE DEVICE TO
SATISFY THE PROPOSED TREATMENT MODEL ........................ 126
Abstract ................................................................................................. 126 Present Need ......................................................................................... 127 Design Controls .................................................................................... 129 Prior Art Review ................................................................................... 132 Prototyping and Preliminary Designs ................................................... 136
Design Decision Matrix ........................................................................ 143 Final Model Development .................................................................... 145
Intellectual Property Protection ............................................................ 150 Commercial Outreach ........................................................................... 151 Acknowledgements ............................................................................... 153
IX. DISCUSSION ............................................................................................. 154
X. RECOMMENDATIONS FOR FUTURE WORK ..................................... 160
APPENDICES .............................................................................................................. 165
Appendix A – Additional Data from the Nationwide Inpatient Sample ....................... 166
Appendix B – SAS Code for Analyzing the Nationwide Inpatient Sample ................. 173
Appendix C – SAS Code for Analyzing Kinematic and Kinetic Values of interest..... 182
Appendix D – SAS Code for Analyzing Joint and Muscle Loading ............................ 193
REFERENCES ............................................................................................................. 207

ix
LIST OF TABLES
Table 1 – Estimated total number of knee arthrodesis procedures (ICD-9-
CM 81.22) and those coded as the primary procedure, by year. ............................ 41
Table 2 – Rate ratio of knee arthrodesis by age, gender ................................................. 44
Table 3 – Rate of knee arthrodesis procedures per 1,000,000 people ............................ 44
Table 4 – Regions of the US as defined by the NIS ....................................................... 51
Table 5 – Peer reviewed publications utilizing knee immobilization in gait .................. 62
Table 6 – Experimental trial names, conditions, and the day on which they
occured. ................................................................................................................... 68
Table 7 – Kinematic values of interest that were analyzed to find
statistically significant differences. Values that differed between
"Control" and "Brace" trials are indicated with a "*" in the right
column ..................................................................................................................... 74
Table 8 – Kinetic values of interest (Net Joint Reaction Force) that were
analyzed to find statistically significant differences. Values that
differed between "Control" and "Brace" trials are indicated with a "*"
in the right column .................................................................................................. 75
Table 9 – Kinetic values of interest (Net Joint Moment) that were analyzed
to find statistically significant differences. Values that differed
between "Control" and "Brace" trials are indicated with a "*" in the
right column ............................................................................................................ 76
Table 10 – The above values of interest were significantly different from
Control values during the first brace trial (B1) but were no longer
significantly different in subsequent trials .............................................................. 81
Table 11 – Optimization functions in peer reviewed publications ................................. 96
Table 12 – Design inputs for the proposed treatment model ........................................ 130
Table 13 – Existing intellectual property with a minimum of a low degree
of similarity to the proposed treatment model. ..................................................... 133
Table 14 – Decision matrix used to evaluate the proposed implant designs ................ 144

x
Table 15 – Contract Manufacturing Suppliers with appropriate Quality
Assurance Systems. (1. Medcast, Inc., Warsaw, Indiana - ISO 13485
Certification; 2. Micropulse, Inc., Columbia City, Indiana – ISO
13485 Certification; 3. Tegra Medical, Franklin, Massachusetts – ISO
13485 Certification; 4. Steris, Inc., Spartanburg, South Carolina –
ISO 13485 Certification) ....................................................................................... 149

xi
LIST OF FIGURES
Figure 1 - Neff Femorotibial Nail (Zimmer, Warsaw, Indiana) ....................................... 9
Figure 2 - Radiographs of the (A) Anteroposterior and (B) Mediolateral
view of the knee (Patient 2) .................................................................................... 11
Figure 3 - Radiographs of the (A) Anteroposterior and (B) Mediolateral
view of the knee (Patient 3) .................................................................................... 12
Figure 4 - Radiographs of the (A) Anteroposterior and (B) Mediolateral
view of the knee (Patient 4) .................................................................................... 13
Figure 5 - Radiographs of the (A) Anteroposterior and (B) Mediolateral
view of the knee (Patient 5) .................................................................................... 14
Figure 6 – Master SAS Program for running NIS Analysis. The user can
select the ICD-9-CM Code he wishes to investigate, select the cutoff
ages for six age groups, and select the years of study............................................. 37
Figure 7 – SAS code used to analyze the Nationwide Inpatient Sample.
The SURVEYMEANS procedure takes account of stratified sample
design using CLUSTER and STRATA variables. .................................................. 38
Figure 8 – Number of knee arthrodesis procedures performed in the
United States. .......................................................................................................... 42
Figure 9 – Per capita knee arthrodesis procedural rate in the United States................... 43
Figure 10 – Average length of stay for a person undergoing knee
arthrodesis. .............................................................................................................. 45
Figure 11– Average number of procedures on discharges that include a
knee arthrodesis procedure. .................................................................................... 46
Figure 12 – Average hospital charges for a discharge that includes a knee
arthrodesis procedure. ............................................................................................. 47
Figure 13 – Number of discharge records billed to the top three payors
from 1993 to 2011. .................................................................................................. 48
Figure 14 – Percentage of discharges including a knee arthrodesis
procedure, by payor ................................................................................................ 48
Figure 15 – Percentage of knee arthrodesis procedures performed in a
teaching hospital ..................................................................................................... 49

xii
Figure 16 – Average annual number of knee arthrodesis procedures, by
region of the country ............................................................................................... 50
Figure 17 – Regions of the United States (Nationwide Inpatient Sample) ..................... 51
Figure 18 – Per capita knee arthrodesis procedural rate, by region of the
country .................................................................................................................... 52
Figure 19 – Gait analysis pathway instrumented with six-axis force
platform ................................................................................................................... 63
Figure 20 – One of eight ProReflex infrared motion capture cameras used
to conduct the study ................................................................................................ 64
Figure 21 – Diagrams identifying bony anatomic landmarks used to locate
and place reflective markers ................................................................................... 65
Figure 22 – Researcher demonstrating placement of reflective tracking
markers while wearing the immobilizing brace. ..................................................... 67
Figure 23 – Model constructed in Visual3D for the purpose of associating
motion tracking markers with subject anatomy. The local coordinate
systems of each rigid segment are shown (x=red, y=green, z=blue). In
this figure, the local coordinate systems of the feet are rotated about
the x axis by 90 degrees from the orientation used in all calculations.................... 70
Figure 24 – Master program coded in SAS to analyze gait data .................................... 72
Figure 25 – SAS Program showing 24 of the 76 subfiles used to search for
areas of statistically significant differences ............................................................ 73
Figure 26 – SAS code used to identify data to search for statistically
significant differences (PelvicCGRight) ................................................................. 73
Figure 27– Mean values (shaded regions represent standard deviation) of
the pelvic center of gravity and pelvic rotation in three planes
(Columns A-C). (Gait cycle displayed from ipsilateral heel strike to
ipsilateral heel strike.) ............................................................................................. 77
Figure 28 – Joint Rotation Angle. Mean values (shaded regions represent
standard deviation) of the Hip Rotation Angle (Row 1), Knee Angle
(Row 2), and Ankle Angle (Row 3) in three planes (Columns A-C).
(Gait cycle displayed from ipsilateral heel strike to ipsilateral heel
strike.) ..................................................................................................................... 78

xiii
Figure 29 – Joint Reaction Forces. Mean values (shaded regions represent
standard deviations) of the normalized (to subject mass) net joint
reaction force of the hip (Row 1), knee (Row 2), and ankle (Row 3).
(Legend: Control Trials – Right=Red, Left=Blue; Braced Trials:
Right=Purple, Left=Cyan) (Stance phase displayed from ipsilateral
heel strike to ipsilateral toe off.) ............................................................................. 79
Figure 30 – Joint Net Moments. Mean values (shaded regions represent
standard deviations) of the normalized (to subject mass) net moment
of the hip (Row 1), knee (Row 2), and ankle (Row 3). (Stance phase
displayed from ipsilateral heel strike to ipsilateral toe off.) ................................... 80
Figure 31 – A visual comparison of the relative stance and swing times of
the left and right side during Control (C1, C2) and Experimental
Trials (B1, B2, B3, B4). .......................................................................................... 81
Figure 32 – Posterior view visualization of a braced subject model
(lighter) overlaid on the normal gait of the same model (darker)
during (A) midstance and (B) midswing of the right leg. The left hip
is more abducted and the pelvis is rotated obliquely during midswing,
resulting in a rise of the center of gravity of the pelvis and the right
hip joint center, helping the right foot to clear the ground as it is
brought forward. Subject’s right and left feet are further away from
the centerline of the body during their respective swing phases. ........................... 82
Figure 33 – Knee flexion during Brace trial, showing the significant
difference in knee flexion between the left and right sides..................................... 86
Figure 34 – Plantarflexion of the ipsilateral ankle during normal gait
(purple) and with simulated knee arthrodesis (red); Triangles denote
Right Toe Off events. .............................................................................................. 87
Figure 35 –Phases of the gait cycle where lower body joint kinematics
differed significantly from those of normal gait. Each row represents
a joint of the lower body as it progresses through a single gait cycle,
and is shaded in phases where the joint kinematics of the
Experimental condition (right knee braced) differed significantly, in
any plane, from the joint kinematics of the Control condition (normal
gait). The gait cycle begins and ends with Right Heel Strike events,
and Left Toe Off, Left Heel Strike, and Right Toe Off events are
indicated with dashed lines. Significant differences at the right knee,
which was braced, are more darkly shaded to emphasize its primacy
in causing the other changes. .................................................................................. 90
Figure 36 – A model with the addition of musculature .................................................. 94

xiv
Figure 37 – Musculoskeletal model consisting of 19 rigid segments, 18
joints, and 450+ muscles. The force platform, ground reaction force
vector, and motion tracking markers are also visualized. ..................................... 101
Figure 38 – Display of heading code used in AnyBody to drive the
musculoskeletal simulations ................................................................................. 104
Figure 39 – Mean values of the right ankle joint forces (Row 1) and right
ankle joint moments (Row 2) in three planes through the gait cycle.
Mean and standard deviation values are shown for the control and
immobilized knee trials. ........................................................................................ 106
Figure 40 – Mean values of the right knee joint forces (Row 1) and right
knee joint moments (Row 2) in three planes through the gait cycle.
Mean and standard deviation values are shown for the control and
immobilized knee trials. ........................................................................................ 108
Figure 41 – Mean values of the right hip joint forces (Row 1) and right hip
joint moments (Row 2) in three planes through the gait cycle. Mean
and standard deviation values are shown for the control and
immobilized knee trials. ........................................................................................ 111
Figure 42– Mean values of the left ankle joint forces (Row 1) and left
ankle joint moments (Row 2) in three planes through the gait cycle.
Mean and standard deviation values are shown for the control and
immobilized knee trials. ........................................................................................ 113
Figure 43– Mean values of the left knee joint forces (Row 1) and left knee
joint moments (Row 2) in three planes through the gait cycle. Mean
and standard deviation values are shown for the control and
immobilized knee trials. ........................................................................................ 114
Figure 44– Mean values of the left hip joint forces (Row 1) and left hip
joint moments (Row 2) in three planes through the gait cycle. Mean
and standard deviation values are shown for the control and
immobilized knee trials. ........................................................................................ 116
Figure 45 – Mean tensile force of the muscles spanning the right knee
during gait. Mean and standard deviation are shown for the control
and immobilized knee trials. ................................................................................. 117
Figure 46 – Mean tensile force of the muscles spanning the left knee
during gait. Mean and standard deviation are shown for the control
and immobilized knee trials. ................................................................................. 120

xv
Figure 47 – Device Prototype – Preliminary drawing of a total knee
replacement with a sliding lock pin, as proposed by Kim Chillag,
M.D. ...................................................................................................................... 128
Figure 48 - Exploded diagram of the invention described in US Patent
3,934,272 "Knee Prosthesis" 1976. ....................................................................... 134
Figure 49 - Exploded diagram of the invention described in US Patent
4,262,368 "Rotating and Hinged Knee Prosthesis" 1981. .................................... 135
Figure 50 – Design work was based in the Frank H. Stelling and C.
Dayton Riddle Orthopaedic Education and Rearch Laboratory at
CUBEInC, in Greenville, South Carolina ............................................................. 136
Figure 51 – Rapid techniques, using the on-site ProJet 3000 system,
assisted in the design process ................................................................................ 137
Figure 52 – Device Prototypes - Cam-Lock design utilizing variable
flexion radius and spring ....................................................................................... 138
Figure 53 – Device Prototypes – Rapid Prototype of the Proximal-Distal
Magnet design ....................................................................................................... 139
Figure 54 – Device Prototypes – Rapid prototype of the Medial-Lateral
Magnet design ....................................................................................................... 140
Figure 55 – Device Prototypes – Rapid prototype of the Pushbutton Latch
design .................................................................................................................... 141
Figure 56 – Device Prototypes – CAD rendering of the Magnetic Latch
design .................................................................................................................... 142
Figure 57 – Rendering of the Engage Key. Magnets are embedded within
the cylindrical endpieces ....................................................................................... 143
Figure 58 – Photo rendering of the Engage design ....................................................... 145
Figure 59 – Prototype of the Engage design as implanted in SawBones
bone analog ........................................................................................................... 146
Figure 60 – Photograph of the Engage Key in use, as it would be used to
unlock the device .................................................................................................. 146

xvi
Figure 61 – Demonstration of use: 1) Patient sits comfortably; 2) Patient
extends right knee and prepares to use key; 3) Patient passes key over
the implant, locking it in extension; 4) Patient ambulates with rigid-
knee gait; 5) Patient sits, unlocks the device with key in order to sit
comfortably again ................................................................................................. 147
Figure 62 – First two figures of Utility Patent, “Lockable Knee Implants
and Related Methods” ........................................................................................... 151
1
CHAPTER ONE
INTRODUCTION
The present body of work is introduced and its structure explained.
The central focus of this dissertation is the clinical treatment of severe knee
dysfunction; its provenance was a meeting between researchers of the Laboratory of
Orthopedic Design and Engineering at Clemson University and practicing orthopedic
surgeons from the Moore Center for Orthopedics (Kim Chillag, M.D.) and the University
of South Carolina School of Medicine (Frank Voss, M.D.). At this meeting, the clinicians
identified an unmet clinical need among their patients and expressed a desire to further
understand and address it. Thus began the series of research and design work documented
herein. This dissertation is a culmination of that work, and it is divided into ten chapters.
At the first collaborative meeting, on August 10, 2010, Dr. Frank Voss and Dr.
Kim Chillag conveyed the inadequacy of their armamentarium in addressing severe knee
dysfunction among patients in their practice. The etiological origins of patients with this
condition were diverse, but the available treatment options – high risk salvage knee
replacement, transfemoral amputation, and knee arthrodesis – were limited. The
conditions of five exemplary patients were subsequently reviewed to provide initial
evidence of the existence of this limitation, and a Case Report of the findings is reported
in Chapter 2. Limitations of existing treatment options are discussed, and development of
an alternative treatment model is broached.

2
Having provided preliminary evidence for the existence of a clinical need through
the Case Report, a thorough background analysis was conducted to document the various
etiologies and currently available treatment options. The ideal treatment for knee
dysfunction, from a patient’s and surgeon’s perspective, is salvage knee replacement. The
nature of severe knee dysfunction, however, often means that this treatment option is
inadequate or inappropriate. Alternative approaches include transfemoral amputation and
knee arthrodesis, but these are undesirable and generally used as a last resort. In Chapter
3, a review of current literature is presented to clarify the etiologies of severe knee
dysfunction, show that these etiologies often preempt salvage knee replacement, and
discuss current surgical treatment options. A novel treatment model is proposed as an
alternative to traditional knee arthrodesis. Under this model, an otherwise functional
salvage knee replacement is capable of temporarily simulating knee arthrodesis. This
model is intended to address the affected patient subpopulation by providing the benefits
of a salvage knee replacement with the required stability of a knee arthrodesis.
The widespread applicability of any alternative treatment, however, is dependent
on the overall size of the need. Despite the existence of a significant body of research on
the various etiologies and treatment methods used to address knee dysfunction and knee
arthrodesis, the number of patients who meet these criteria has been heretofore
unquantified in published literature. Having established the existence of an unmet clinical
need among a small number of patients, the next step was to quantify the overall size of
this need. A large, nationally representative database of inpatient hospital records is
analyzed in Chapter 5, and an estimate of the number of affected patients in the United

3
States is presented. In order to better understand this clinical need, the affected patients
are further characterized by demographic and other clinically meaningful attributes.
Characteristics of the hospitals where these patients received treatment are also analyzed,
providing a deeper understanding of the condition through the identification of attributes
that are common among hospitals where these patients seek treatment.
Rigid knee immobilization, such as in the existing application of knee arthrodesis
or in the proposed treatment model, necessarily alters the kinematics and kinetics of gait.
This appears to be well understood, but few publications have discussed these changes; of
those discussions, gait changes are only described in abstract terms. No publications have
quantified changes to gait kinematics or kinetics after knee arthrodesis in detail. Several
studies have investigated rigid knee gait by other means, but these have been limited, and
they have not fully quantified altered knee kinematics or kinetics. Those biomechanical
changes have important implications, however, and knowledge of them is essential to
fully understanding the consequent effects of such a treatment. One area where this is
apparent is the suggested link between knee arthrodesis and early induced arthritis in
other joints, such as the contralateral hip. While causation has been asserted, it has not
been tested; such testing would require full consideration of biomechanical changes
induced by such a treatment. A gait analysis study, simulating knee arthrodesis in normal,
healthy subjects, was conducted in order to obtain this information, and this study is
presented in Chapter 6.
Knee fusion by means of arthrodesis is generally assumed to be robust, which
may explain why there is a dearth of information on the loading conditions of a fused

4
knee. Additionally, the difficulty of obtaining in vivo data measurements may contribute
to the neglect of this subject. Regardless of this assumption of robustness, or the
difficulty in obtaining data, there are a number of published reports of arthrodesis failure
due to implant fracture or other mechanical failure modes. In order to predict and prevent
failure in any engineered system, it is imperative to have an accurate understanding of the
imposed loading conditions. In the study detailed in Chapter 7, kinematic and kinetic data
obtained from the gait analysis study of Chapter 6 is used to drive a computational
analysis consisting of dynamic simulations of a musculoskeletal model. The use of this
model allows for estimates of joint loading conditions, the accuracy of which have been
validated against instrumented joint replacements in other applications. In this chapter,
the loading conditions at a rigidly immobilized knee are reported.
In parallel with investigations of the unmet clinical need, the treatment model
proposed in Chapter 4 was explored and developed in the form of an implantable medical
device. This work is documented in Chapter 8. Alternative designs, as well as the
constraints of the treatment model itself, were investigated over the course of several
design cycles. Recent advances in rapid prototyping techniques were used extensively to
assist in design iterations and establish proof of concept. The resulting salvage total knee
replacement design enables a patient to lock the knee in full extension with the use of a
simple, handheld key, providing the passive flexibility of an existing knee replacement
design in combination with the stability if an arthrodesis. This treatment is designed to
subsume existing treatment methods, including knee arthrodesis and standard fully
constrained salvage knee designs. Intellectual property created as part of this work fences
5
out this conceptual area and protects against others doing the same. Protection of this
intellectual property has been secured with two separate patent applications through the
United States Patent and Trademark Office. This work provides support for the
translation of a proposed treatment solution to clinical use through intellectual property
license.
A holistic discussion of the research described above is presented in Chapter 9. In
Chapter 10, insight gained from this research is used to provide recommendations for
future work.

6
CHAPTER TWO
RESEARCH OBJECTIVES
The content of this dissertation supports four specific aims.
Aim I: Establish the existence and quantify the size of the affected clinical
population
Chapter 3 – Clinical Etiologies in the Loss of Knee Function: A Case Report
Chapter 4 – Background and Review
Chapter 5 – Quantifying the Affected Patient Population
Aim II: Quantify the changes to gait biomechanics induced by knee immobilization
Chapter 6 – Changes to Gait Kinematics and Kinetics Induced by Rigid Knee Constraint
Aim II: Estimate the joint loading patterns of a rigidly constrained knee
Chapter 7 – Estimated Joint Loading at a Rigidly Constrained Knee
Aim IV: Design an implantable device to serve as a proposed clinical treatment
Chapter 8 – Design of an Implantable Device to Satisfy the Proposed Treatment Model

7
CHAPTER THREE
CLINICAL ETIOLOGIES IN THE LOSS OF KNEE FUNCTION: A CASE REPORT
A local unmet clinical need is introduced and explored through the analysis of
representative patients. The intention of this report is to present preliminary evidence of
said need.
Abstract
In the course of collaborative research efforts, two practicing orthopedic surgeons
describe an unmet clinical need among patients in their local practice. The commonality
between these patients is severe knee dysfunction, defined as a loss of functional knee
motion; the knee may become stiff with extreme limitation of flexion, or the extensor
mechanism can become nonfunctional, resulting in a loss of the ability to actively flex
and extend the knee. This condition is often irreversible, treatment options are limited,
and the outcome is often poor quality of life. Five patients with lost functional knee
motion, from diverse etiologies, are presented. These examples serve to demonstrate the
limitations of existing treatment methods and the demand for a clinical solution. The
potential for an alternative treatment approach is discussed.
Introduction
A loss of functional knee motion may be attributable to a variety of etiologies,
including failed primary or revision total knee arthroplasty, osteosarcoma, virulent
8
infection, trauma, or neuromuscular disease, such as polio. Loss of knee function can be
debilitating, limiting a patient’s ability to engage in activities necessary for a satisfactory
quality of life. Compromised knee function can inhibit mobility, including walking,
standing, and stair climbing, and can hinder basic activities of daily living such as
bathing, dressing, and sitting [1]. Physical therapy is sometimes incapable of addressing
the root causes of dysfunction, even when these causes are muscular weakness or
inflexibility [2].
Total knee replacement is often contraindicated in the presence of knee
dysfunction due to related factors, including lost anatomy, instability, infection, or
muscular weakness [3]-[5]. The armamentarium available to orthopedic surgeons in these
cases is typically limited to transfemoral amputation and knee arthrodesis. While knee
arthrodesis can salvage the limb and enable a patient to walk independently, knee motion
is completely eliminated. The resulting loss of knee function significantly interferes with
activities of daily living, complicating activities as common as sitting. Reduced quality of
life is associated with depression in patients following both amputation or arthrodesis [6],
[7]. In a South Korean study, 30 patients with fused knees insisted on undergoing
desarthrodesis (reversal) to a total knee replacement design to accommodate knee
mobility; 17 of these patients had previously attempted suicide [7].
When faced with the prospects of these treatments, patients may adamantly insist
on undergoing high risk salvage total knee replacement, in spite of the low chance of
success. Treating physicians “have a responsibility to present their patients with treatment
choices that have a reasonable chance of succeeding without causing undo harm,”

9
however, and knee arthrodesis or amputation may be the most appropriate treatment
approach for these patients. This can result in an ethical dilemma for the physician, as
these cases raise considerations of “informed consent, patient education, autonomy,
decisional capacity, paternalism, and physician responsibilities” [8].
Current available treatment methods for lost knee function, regardless of cause,
are unsatisfactory to surgeons and patients alike. This dissatisfaction indicates an
opportunity for an improved treatment approach. The following case examples
demonstrate patients with severe knee dysfunction resulting from various causes.
Case Description
Patient 1 is a 69-year-old male who first underwent arthrodesis for osteoarthritis
at age 51. This surgery was conducted at the US Department of Veteran Affairs, and
fusion was performed using a Neff femorotibial nail.
Figure 1 - Neff Femorotibial Nail (Zimmer, Warsaw, Indiana)
Subsequent to knee fusion, the patient developed osteoarthritis of the right hip,
requiring a total hip replacement. The patient then developed osteoarthritis of the left hip,
requiring a total hip replacement for that joint. While the left total hip replacement was

10
principally successful, the patient exhibits painful left hip range of motion. The right total
hip replacement has failed, requiring revision.
Other medical problems include diabetes, hypothyroidism, hypertension, and
gastroesophageal reflux disease. Patient was diagnosed with prostate cancer in 2007 and
was treated with a series of 40 radiation treatments.
The patient is currently presenting with a stiff, fused knee and secondary pain.
Patient Two is a 70-year-old obese (BMI: 45, and Weight > 300 lbs.) male, and
has undergone multiple failed total knee replacement surgeries. Other medical problems
have included gastroesophageal reflux disease, hypertension, hyperlipidemia, and morbid
obesity (but not diabetes.) Patient exhibited a 25 degree extensor lag, and his left knee
was larger than his right.
Initial surgery was in 2001 for a primary total arthroplasty of the left knee. In
2003, patient underwent total knee arthroplasty for the right knee. Patient had a stroke in
2007, but did not have much residual deficit. Difficulties with the left knee began to
accelerate in June 2009 when the femoral component was revised due to generalized pain,
and the femur fractured at the end of the new femoral component’s stem in July 2009.
Left knee pain continued, and the tibial component was revised in February 2010. During
surgery, the patellar tendon was detached at the tibial tubercle and reattached with a
Stone staple.
Two months later, in April 2010, the patient presented with loose femoral and
tibial components, and was referred to a specialist. Specialist noted induration and

11
tenderness at the tibial tubercle, and aspiration revealed a purulent infection. The staple
was removed, and the patient was given two days of IV antibiotics, followed up with 7
days of Keflex oral antibiotic. Gross purulence continued along with chronic avulsion of
the patellar tendon.
Infected tibial and femoral components were removed, and ‘artificial fusion’, as
described previously in the literature [9], was performed. Complex stabilization of the
knee was achieved using a combination of an intramedullary rod and a large mass of
PMMA, which was used to bridge the gap between the femur and tibia resulting from
severe bone loss.
Figure 2 - Radiographs of the (A) Anteroposterior and (B) Mediolateral view of the knee (Patient 2)
A B

12
Patient 3 had a severe traumatic injury to the knee, requiring subsequent surgery
for fracture. Patient underwent total knee replacement after the development of severe
joint arthritis. Patient developed ankylosis at the knee, losing all mobility, and currently
walks with a stiff leg gait. Heterotropic bone has formed posterior and medial to the knee,
which can be seen in radiographs.
Figure 3 - Radiographs of the (A) Anteroposterior and (B) Mediolateral view of the knee (Patient 3)

13
Patient 4 suffers from a congenital disease, which has resulted in knee problems,
including a size differential between the left and right knees. The patient underwent total
knee replacement, but subsequently developed severe postoperative joint stiffness. The
subsequent surgical procedures were performed, but stiffness has not resolved. The knee
has spontaneously fused in full extension, and heterotopic bone formation can be
observed posteriorly.
Figure 4 - Radiographs of the (A) Anteroposterior and (B) Mediolateral view of the knee (Patient 4)

14
Patient 5 originally presented with an osteosarcoma, which was addressed with a
total knee replacement. The primary total knee replacement procedure was complicated
by the occurrence of infection, and required subsequent revision. Multiple surgeries have
scarred the quadriceps muscle, and the patient has lost function of the joint. The patient
currently has a hinged, rotating bearing total knee replacement, but has lost all flexion
due to stiffness. The patient can walk with the knee in full rigid extension.
Figure 5 - Radiographs of the (A) Anteroposterior and (B) Mediolateral view of the knee (Patient 5)

15
Discussion
Two patients, Patients 1 and 2, present with a knee arthrodesis (traditional and
“artificial” [9]). For these two patients, there is no current treatment available to improve
the condition of the leg. The joint is pain-free, and there is no method of adjusting range
of motion. Desarthrodesis to a total knee replacement, even one of constrained design, is
not a viable option, especially without an intact extensor mechanism.
Treatment options for the three patients with an intact joint replacement (but
without actual movement) are not significantly better. All three patients have formed
heterotopic bone, and total knee replacement is contraindicated. The only appropriate
treatment option available for these patients is knee arthrodesis, which would introduce
surgical risks without any substantial benefit in outcome. The course of action with the
most probable chance of success is to avoid surgical intervention.
Knee dysfunction manifests itself as immobilization of the joint in each of the
presented cases, whether the joint is physically or functionally fused. Little to no flexion
of the knee is achievable, but all patients are ambulatory with a stiff-knee gait. In this
sense, all patients have the functional equivalence of knee arthrodesis. While this
permanent extension enables these patients to be mobile, this mobility comes at the
expense of the flexion required for some activities, such as sitting in close-quarter
locations (vehicles, theaters), the ability to sit or lie comfortably, or the ability to engage
in other activities of daily living [10], [11].
Knee desarthrodesis may offer these patients the ability to passively bend the knee,
but it has a high risk of complications (upwards of 86%) and poor outcomes [12], [13].

16
Even in the presence of a functioning knee extensor mechanism, muscular weakness and
joint stiffness may limit range of motion, and the loss of passive knee stability may
prevent patients from standing or ambulating independently.
The present cases underscore the need for an alternative treatment method to
address severe joint dysfunction. Without a functional knee extensor mechanism, current
approaches force patients to choose (when they have a choice) between passive knee
flexion and rigid knee stability. In all cases, patients would conceivably benefit from the
ability to both passively bend the knee, such as while sitting or lying down, while
maintaining the stability of rigid knee extension while standing and ambulating. A
treatment that offered such an ability would be required to operate within the confines
defined by the patient subset, whose knee extensors are weakened or completely missing.
The treatment would necessarily include, at a minimum, an implantable medical device.
Such a treatment would allow locomotion while reducing or eliminating the pain
associated with the presented pathologies.
Acknowledgements
The following people are gratefully acknowledged for their assistance in this
work: Kim Chillag, M.D. and Frank Voss, M.D.

17
CHAPTER FOUR
BACKGROUND AND REVIEW
The etiologies of knee dysfunction are addressed, current treatment methods are
reviewed, and the potential for novel surgical treatments is discussed.
Abstract
A review of current literature suggests that total knee replacement surgery
contributes to knee dysfunction, and that the additive dysfunction resulting from multiple
failed total knee replacement surgeries is sometimes irreversible. The treatment options
for severe knee dysfunction are limited; when surgery is required and total knee
replacement is contraindicated, the options are typically limited to knee arthrodesis or
transfemoral amputation. Knee arthrodesis has severe functional limitations, and is the
subject of a relatively large number of published reports. Several alternative surgical
approaches to traditional knee arthrodesis have been developed, but they all share the
same functional limitations. A novel treatment model is proposed.
Rise in Primary Total Knee Replacement
Total knee replacement has proven to be a highly effective and successful means
of treating joint disease, and the number of primary knee replacement surgeries has
dramatically increased over time. According to Ong et al., 5 year survivorship of primary
total knee arthroplasty is 97.2% [14], a high success rate and contributing factor to the

18
ready adoption of the surgery. Kurtz et al. estimated the number of arthroplasty surgeries
in the United States between 1990 and 2002 using the Nationwide Inpatient Sample, and
estimated that rate of total knee arthroplasties per 100,000 persons tripled in that time
[15]. This increase can be attributed to a number of factors, including increased
implantation in younger patients, an aging population, increased prevalence of obesity,
and an “increased recognition [of need] by [both] the candidates for surgery and members
of the orthopaedic community”.
Implicit in the high degree of success of total knee arthroplasty, however, is the
fact that it is not an infallible treatment. In “Why Knees Fail,” Kelly Vince proposes nine
causes of primary knee replacements failure [16]. These causes are aseptic loosening with
or without osteolysis, tibial femoral instability due to ligament instability, patellar
complications and malrotation, no diagnosis, structural failure of the implant, sepsis,
extensor mechanism rupture, stiffness, and fracture. When a primary total knee
replacement surgery fails, revision surgery is required. According to Vince, revision knee
arthroplasty is not merely a repeat surgery, but “an opportunity to correct the
shortcomings that lead to the initial failure [16].” This addresses a potential shortcoming
of revision knee surgery: If the reason for the original prosthetic failure is not addressed,
there remains a chance that it will also affect the results of the revision procedure.
Rise in Revision Total Knee Replacements
As the number of primary TKR surgeries in the United States has continued to
rise towards a projected 3.48 million in 2030 [17], there has been a concomitant increase
in the number and rate of revision procedures [15]. According to Kurtz et al., the

19
prevalence of revision total knee replacement surgery increased “by 5.4 procedures per
100,000 persons per decade,” increasing from 12,000 in 1990 to 35,000 in 2002. Without
proper perspective, the growth of the sheer number of revision surgeries could indicate an
alarming trend toward increasing failures of primary knee replacement. The authors
account for this in the study through the calculation of “revision burden,” defined as the
ratio of revisions to the sum of revision and primary procedures, and estimate the change
in its rate over time.
While there are limitations to its use, revision burden is a measure of the quality
of the primary treatment. Revision burden would increase over time if the primary
treatment had an increased tendency to fail, including if treatment was expanded to use in
patients less suited for treatment, or if the surgical implants reduced in quality over time.
Revision burden would decrease over time with improvements of surgical technique,
improvements implantable devices, or improved identification of appropriate patients for
surgery. One shortcoming of this measurement is that revision burden also decreases if
the rate of primary intervention increases in the short term, as the number of revisions is a
lagging figure, based on historical primary intervention surgeries that occurred at the
smaller intervention rate.
The Kurtz et al. study found that the revision burden for total knee replacement
has remained constant over time for all patients except women in the 65-74 age group,
who experienced a statistically significant annual increase of 0.5%. The authors thus
attribute the increase in revision surgery to the large increase in primary procedures. This
would indicate that the success rate of primary procedures has not improved, and that the

20
corresponding rate of patients who must undergo revision surgery has not been reduced.
Kurtz et al. do not address the fact that the increases in primary surgery, which was
identified, could have pushed down the revision burden, indicating the possibility that
revision rate is actually increasing. It is noted that since revision burden is not decreasing
(by their measure), a “greater number of revisions” should be expected without
implementation of “some limiting mechanism… to reduce the future revision burden.”
[15] This appears to be an appropriate assumption, and would indicate a growing
population of patients undergoing revision.
In fact, in a subsequent 2007 study, Kurtz et al. projected a steep increase in the
number of primary and revision arthroplasty surgeries between 2005 and 2030 [17]. The
authors predict that revision knee arthroplasty will grow from 38,300 patients in 2005 to
268,299 patients in 2030. The group’s predictions were calculated by determining
surgery prevalence by sub-group, and then applying those prevalence rates to “projected
population data for each subgroup.” Subgroup covariates included age, gender, race, and
census region, and the authors used projected population data from the United States
Census Bureau. If these predictions prove accurate, there will be a sevenfold increase in
the number of patients undergoing revision knee arthroplasty by 2030.
Poorer Outcomes after Repeated Surgery
In a meta-analysis of 42 articles published between 1973 and 1994, Saleh et al.
investigated the long term outcomes of revision knee arthroplasty patients using Global
Knee Scores (GKS) [18]. GKS were defined as “an instrument that measured patient
outcomes in the domains of pain, function, and range of motion and combined these

21
domains in a summary scale,” [19] and include the Hospital for Special Surgery (HSS)
and Knee Society (KS) scores. In their analysis, they found that patients undergoing
revision surgery had a significant increase in GKS after their procedure, without a
significant correlation between pre-revision surgery and post-revision surgery scores.
This study supports the consensus that revision knee arthroplasty provides favorable
outcomes when compared to no surgery at all.
The success of revision knee arthroplasty, however, has not matched that of
primary knee arthroplasty, as outcomes after revision knee arthroplasty are typically
worse than primary knee arthroplasty by every measure. Greidanus et al. assessed the
outcomes of 159 patients undergoing primary and revision total knee arthroplasty using
standardized and validated measures: The Western Ontario and McMaster Universities
Osteoarthritis Index (WOMAC), the Oxford-12 Knee Score, the Short Form-12, and
patient reported satisfaction [20]. Deehan et al. studied the outcomes of 94 patients
undergoing revision knee arthroplasty using standardized and validated measures: the
Nottingham Health Profile (NHP) and Knee Society (KS) scores. The WOMAC, Oxford-
12, NHP, and KS scores are each designed to capture health outcomes, though they do so
in different ways. The WOMAC, Oxford-12, and KS specifically address knee
arthroplasty, while the Short Form-12 and NHP measure generic quality of life. The
conclusions of these studies show that results of revision knee arthroplasty are inferior to
those of primary knee arthroplasty, even while adjusting for confounding factors [21].
The authors conclude “most revision patients will never experience an outcome as
favorable as their primary procedure.” A number of physical and physiological factors

22
may contribute to diminished outcomes, including the compounding effects of multiple
surgeries, increased loss of natural anatomy, and the difficulty of revision surgery. Other
“factors that may contribute to this difference [may include] deconditioning, muscle
impairment or atrophy, scar tissue, instability, and joint stiffness. [20]” With outcomes of
revision knee arthroplasty measurably worse, patients whose primary surgery fails are
subject to a reduced quality of life.
In addition to poorer functional scores after revision knee arthroplasty, Patients
undergoing revision TKR are more likely to have complications such as periprosthetic
fracture (0.78% vs. 0.08%), wound infection (0.78% vs. 0.12%), deep prosthetic infection
(0.47% vs. 0.06%), major systemic complications (7.44% vs. 4.91%), and mortality
(0.62% vs 0.12%) [14]. In addition to complications, revision knee arthroplasty is
generally more likely to fail. While primary total knee arthroplasty has a 5-year
survivorship of 97.2%, the same 5-year survivorship of revision knee arthroplasty is only
87.4% [14]. Ong et al. analyzed Medicare claims data to determine the “relative risk of
revision surgery for primary and revision” total joint arthroplasty, and found that patients
with a revision knee arthroplasty were 5.71 times more likely to undergo rerevision.
Successive surgeries exacerbate damage as native anatomy is weakened, compromised,
or removed. The result is a subset of patients who undergo a number of failed procedures
and end up with severe and irreversible knee dysfunction.
With a growing population of patients undergoing revision knee arthroplasty,
combined with poorer outcomes resulting from revision and the increased likelihood of a
23
subsequent surgery being necessary, the number of patients with serious complications,
including severe knee dysfunction, is expected to rise as well.
Knee Dysfunction and Weakness
Weakness of the knee extensor mechanism is a debilitating condition that limits a
patient’s ability to actively extend the knee, and thus the ability to stand, rise from a chair,
and walk without assistance. In addition to allowing for independence, sufficient
quadriceps strength is also essential in preventing injuries due to falls [22]. Extensor
mechanism weakness can occur in patients with tumors, muscular diseases, neurological
diseases, osteoarthritis of the knee, or in patients who have undergone knee replacement
surgery. Quadriceps weakness has been closely linked to osteoarthritis of the knee, and it
has been suggested that it may be a result, a risk factor, or both [23], [24].
To make matters worse, knee replacement surgery itself results in profound
quadriceps weakness. While TKR is able to address pain associated with the disease, it
does not address deficits in quadriceps function [25]. Physical therapy following TKR is
standard care, but it is frequently unable to rehabilitate patients to full preoperative
strength [2]. Walsh et al. examined the effect of TKR on 29 patients versus an age
matched control group of 40 patients, and found that even one year after surgery patients
exhibited strength deficits, physical impairments, and functional limitations, including
reduced walking and stair climbing ability [26]. Mizner et al. subsequently demonstrated
that reduced quadriceps strength correlated with reduced functional performance, loading,
and moving patterns [1]. Loss of quadriceps strength can be significant after TKR
24
surgery; Mizner et al. studied a group of twenty patients and found an average loss of
62% of quadriceps strength after 1 month [27].
The causes of quadriceps weakness after knee surgery are multifactorial. In their
investigation, Mizner et al. examined the causes of weakness, and found that failure of
voluntary activation was the predominant cause, with muscle atrophy only a secondary
cause. Together, failure of voluntary activation and atrophy caused 85% of postoperative
weakness [27]. However, in another study, Lewek et al. examined 12 patients with
osteoarthritis who had not undergone TKR, and found no statistically significant decrease
in voluntary activation.
In cases where successive revision surgeries are required, weakness is
exacerbated as damage to native anatomy is compounded. Severe weakness is often
irreversible and prevents patients from walking without the use of assistive devices such
as braces, canes, crutches, or wheelchairs. For these patients, activities of daily living
become difficult or impossible, significantly reducing quality of life [25].
Extensor mechanism weakness is poorly addressed with reconstructive surgery, as
existing total knee replacement designs require adequate muscular strength and joint
stability to function. While some TKR systems are engineered to compensate for a loss of
joint stability, no existing TKR designs compensate for a weakened, damaged, or missing
quadriceps extensor mechanism. To date, the number of patients affected by this
condition has not been well characterized in the literature.
25
Transfemoral Amputation
There are approximately 185,000 total lower limb amputations performed each
year in the United States, and the procedure is associated with reduced function, reduced
quality of life, and depression [6], [28], [29]. Transfemoral amputation is sometimes
required after failed total knee replacement; one study of twenty-five patients showed that
approximately 37% of amputations were attributable to complications of the replacement
procedure itself [28]. If these figures are extrapolated to nationwide incidence, using
projections of total knee replacement procedures, an estimated 4,900 amputations per
year may occur as a result of complications attributable to knee replacement by 2030 [17].
Knee Arthrodesis
Arthrodesis, or complete fusion of the knee joint, is preferable to amputation but
is still a treatment of last resort in patients where total knee replacement is
contraindicated. While arthrodesis has an extensive history of use, it is currently most
often used to treat pain and instability in the knee in cases of multiple failed total knee
replacement surgeries, bone loss, infection, or loss of the quadriceps extensor mechanism
[10], [11]. Arthrodesis maintains the anatomical structure of the lower limb, enabling
patients to maintain mobility independent of assistive devices such as a braces or
wheelchairs.
While arthrodesis allows for patient mobility, it requires an altered gait as a result
of the inflexibility of the knee and subsequently increased moment of the leg. It has been
suggested that changes associated with arthrodesis include increased pelvic tilt, increased
ipsilateral hip abduction, and increased ipsilateral ankle dorsiflexion [10], though the data

26
supporting this is unpublished. Walking with an arthrodesis is more physically
demanding, with oxygen consumption shown to be 20% greater when walking with an
immobilized knee[30], and energy use demonstrated to be 25-30% higher than that of
normal walking [10]. However, arthrodesis is still preferable to amputation, however,
which requires an additional 25% energy expenditure compared to arthrodesis.
Arthrodesis is not considered an entirely positive outcome, and it is often
performed only because it is unavoidable or advisable compared with the alternatives,
including amputation. Presence of arthritis in other joints of the leg are a contraindication
for arthrodesis, as the altered gait may increase stresses in the hip and ankle [11] and may
induce secondary arthritis. The permanence of the extended knee position complicates a
number of activities of daily living. Simple tasks such as bathing, tying shoelaces, or
sitting in close quarters become difficult or impossible. Travel can be significantly
affected, as an extended leg interferes with the ability to sit in cars or planes.
Arthrodesis has been performed using a number of techniques and fixation
methods, including bony fusion assisted by means of internal or external fixation devices
[11]. Traditional arthrodesis is a technically demanding procedure, and can result in
significant blood loss and operative time [10], [31]. In some cases, such as massive loss
of bone stock, fusion with bone-to-bone contact is difficult or impossible. Traditionally,
the loss of natural bone has been compensated with the use of allografts or autografts,
which entails additional surgical time and associated difficulties [10], [11].

27
Alternative Surgical Approaches to Arthrodesis
Fusion can be performed without direct bone-to-bone contact, and several
alternative approaches have been established to achieve full fusion. Voss demonstrated an
‘artificial fusion’ performed with an implantable rod passing through the intramedullary
canal of both the femur and tibia, with polymethyl methacrylate cement used as a ‘spacer’
between the bones [9]. The rod and cement provided sufficient fixation for full weight
bearing the day after surgery, and was still successful at four years, the latest follow up
available. This technique was first shown by Campanacci and Casta [32] and has been
subsequently used by a number of surgeons. One patient who underwent fusion by means
of this technique is presented in Chapter 3. Success of this alternative to bone-to-bone
arthrodesis is promising, as it demonstrates the potential for successful fusion using
completely non-native materials to bridge the joint.
Following the development of “artificial fusion,” a number of implantable knee
prosthetics have been designed specifically for knee arthrodesis [33]. At least one such
device has taken a similar form to that of total knee replacement designs. Bartlett et al.
reviewed ten cases of patients who underwent an arthrodesis using a Stanmore Custom
Arthrodesis Prosthesis [31], consisting of cobalt chrome femoral and tibial components
with stems that are mechanically locked together by means of an axle and circlip. This
device compares favorably to traditional arthrodesis, as it allows for fusion using a less
technically demanding technique and reduced blood loss. Additional benefits of using a
device for knee fusion include allowing for the establishment of a precise limb length,
deliberate limb alignment, and avoidance of amputation in patients who would be

28
otherwise unable to undergo fusion. Considering the success of these alternative
procedures, it appears that good fusion results are possible with implanted orthopedic
devices.
Discussion
With the recent success of implantable orthopedic joint devices designed for knee
fusion, coupled with the long term success of standard total knee replacement designs,
the prospects for a more fully functioning device appear promising. Such a device could
be designed to address the previously defined patient subset, those with severe knee
dysfunction.
The limitations imposed by knee dysfunction, as discussed in Chapter 3, have
meant that some patients must choose between a treatment that offers little stability and a
treatment that fully and permanently constrains the knee. The former, a total knee
replacement of some form, enables a patient to bend the knee, but lacks the stability to
provide adequate support in the presence of knee dysfunction. The latter, knee arthrodesis,
provides the full stability needed to ambulate, but precludes any ability to bend the knee.
With consideration of the aforementioned limitations, we propose a novel
treatment model. This treatment would take the form of a total knee replacement, but
would incorporate an ability to simulate fusion by temporarily maintaining rigid
extension. In this manner, this treatment model would eliminate many of the current
limitations imposed on this patient group. Patients lacking knee stability or a knee
extensor mechanism could stand and ambulate independently without forgoing the ability
to otherwise bend the knee. The work of this dissertation, including the quantification of

29
the affected patient subset, the kinematics and kinetics of gait, and the resulting joint and
muscle forces, supports the development of such a proposed treatment model. This
proposed treatment model is explored and developed further in Chapter 8.
30
CHAPTER FIVE
QUANTIFYING THE AFFECTED PATIENT POPULATION
The number of patients undergoing knee arthrodesis in the United States is quantified
and described in clinically relevant ways. The hospitals where these procedures are
performed are further characterized.
Hypothesis
The number of patients undergoing knee arthrodesis in the United States,
heretofore unquantified, is significant (greater than 100 procedures per year).
Abstract
Treatment options for severe knee dysfunction are limited, and include knee
arthrodesis. Patient satisfaction after knee arthrodesis is generally low, making it a
treatment of last resort. There is a high level of clinical interest in this procedure,
however, as evidenced by the large number of recently published clinical case reports and
reviews in peer reviewed orthopedic focused journals. In spite of this high degree of
clinical interest, specific details about the affected patient population are largely unknown.
The number of patients undergoing knee arthrodesis has not been previously quantified,
the types of patients undergoing the procedure have not been characterized, and the
hospitals where the procedure is performed have not been characterized. Two patients
with a knee arthrodesis, from two clinical practices, were presented in Chapter 3 of this
31
dissertation. These patients provide initial evidence of an unmet clinical need, but the
prevalence of similar patients is unknown. In Chapter 5, we investigate the incidence of
knee arthrodesis procedures in the United States over the past two decades in order to
further support this need. We further characterize the patients undergoing the procedure
by demographic, and characterize the hospitals where the procedure is performed. Our
estimates are based on data obtained from the Nationwide Inpatient Sample, a database of
inpatient hospital discharge records, using the International Classification of Disease-
Revision 9 medical billing code for knee arthrodesis (ICD-9-CM 81.22). We also
estimate the per capita procedural rates for individual patient demographics using
population data from the United States Census. We found that the annual number of
patients undergoing knee arthrodesis un the United States remained relatively unchanged
from 1993 to 2011, the latest year for which data was available, at a mean of 1,014
(Standard Deviation: 113) procedures per year. Over 80% of patients were aged 45 or
above. Approximately 65% of patients utilized governmental payers for reimbursement,
including 54% using Medicare, which cannot be accounted for by age alone. Nearly all of
the procedures were performed in metropolitan area hospitals (92.5%), and a significant
majority of the procedures were performed in teaching hospitals (62%). We conclude that
the number of knee arthrodesis procedures performed in the United States is significant.
Introduction
Treatment options for patients suffering from severe knee dysfunction are limited.
Salvage total knee replacement surgery is often contraindicated, requiring patients to
choose between forgoing surgery, transfemoral amputation, or knee arthrodesis. While
32
the functional outcomes of knee arthrodesis are better than those of amputation, the
outcomes of both are low. This often leaves arthrodesis as the best of poor alternatives.
Historically, knee arthrodesis has had a wide range of clinical indications,
including advanced osteoarthritis, posttraumatic osteoarthritis, rheumatoid arthritis,
tuberculosis, poliomyelitis, and syphilis[10], [34]. With the development and success of
total knee replacement (TKR) surgery, along with advances in medicine eliminating the
later stages of some diseases, the indications for arthrodesis have narrowed [10], [34],
[35]. Current indications for this treatment include damage, weakness, or loss of the knee
extensor mechanism, inadequate ligamentous constraint, substantial bone loss or defects,
osteosarcoma, posttraumatic arthritis, arthrofibrosis, or infection [10], [11] and the
procedure is often performed after the failure of total knee replacements [5], [34], [36],
[37].
Perhaps due to a combination of the undesirability of knee arthrodesis and the
limited treatment alternatives, there is a high degree of clinical interest in the procedure,
as evidenced by the publication of more than 60 case reports and review articles on the
subject in peer reviewed, orthopedic journals in the past five years. These include review
articles [5], [10], [11], [36]-[38] and case reports, some of which have focused on
methods of achieving fusion, including external fixation [39] and internal fixation by
means of intramedullary nails [40], [41] or dynamic compression plates [42]. Alternative
methods of achieving fusion have been proposed [9], including implantable prosthetics
dedicated to knee arthrodesis [31], [33], [36], [43]. These dedicated implants can serve as
a rigid spacer in the absence of sufficient bone stock and may improve the surgical

33
success rate, but they offer patients no functional advantages over traditional knee
arthrodesis techniques. The functional limitations of knee arthrodesis have driven a
strong desire among patients for desarthrodesis, or reversal of a previous fusion, in spite
of its high complication and poor success rate [12], [44], [45].
Even with such a high level of clinical interest, there are no published estimates of
the incidence of knee arthrodesis; the figures are completely neglected in all six review
articles referenced above. Evaluating and quantifying patient subsets is critical to fully
understanding unique patient needs. In some cases, quantifying a patient subset provides
justification for the development of new and improved treatments. There have been
numerous estimates and characterizations of orthopedic patient populations published in
the literature in recent years, including the number of patients undergoing primary and
revision total knee, hip, and shoulder replacement surgery [15], [46]. That work has been
influential, and has enabled further studies, such as estimations of economic burden[47],
to build upon it. This type of study is also prevalent outside of orthopedics, such as in
estimates of heart disease in the United States [48].
These estimates are most commonly made by searching inpatient hospital
discharge records. When searching through this data, researchers may take advantage of
the ubiquitous nature of the International Classification of Disease-Revision 9 (ICD-9)
medical billing codes. Nearly all procedures and patient diagnoses have their own
specific ICD-9 code, and each patient medical record contains their diagnoses and
procedures listed by code. When patients medical records are aggregated, researchers can
search these records to determine prevalence or trends in diseases or procedures.

34
Patient records may be aggregated in a number of ways and by a number of
different entities, such as internally within a hospital system for their own records. A
number of patient discharge records have been aggregated into larger and readily
available databases, allowing for similar studies to be conducted using databases such as
the Nationwide Inpatient Sample [49], the National Hospital Discharge Survey [15], or
the Medicare claims database [50].
The Nationwide Inpatient Sample (NIS) is the “largest publically available all
payer inpatient care database in the United States,” and is a part of the Healthcare Cost
and Utilization Project (HCUP) of the Agency for Healthcare Research and Quality. The
NIS database contains approximately 8 million inpatient hospital discharge records from
approximately 1000 hospitals, and is intended to represent a 20% sample of community
hospitals in the United States [51]. The NIS uses a two-stage stratified cluster design with
five strata, consisting of hospital characteristics. These strata are hospital
ownership/control (private or public), bed size, teaching status (teaching or non-teaching),
urban/rural location, and U.S. region (Northeast, Southeast, Midwest, or West). A
random sample of hospitals is selected from each stratum. Each individual hospital is
considered a cluster, and every discharge record from selected clusters is included in the
sample. Over one hundred data elements are included with each patient discharge record
(case), including patient age, sex, payment method, diagnoses and procedures performed,
and teaching status, location, and size of the admitting hospital. The latest available NIS
dataset (2011) contains “all discharge data from 1,045 hospitals located in 46 states.”

35
Materials and Methods
Data from all available years of the Nationwide Inpatient Sample (1988-2011)
was obtained from the Agency for Healthcare Research and Quality (AHRQ), a part of
Healthcare Cost and Utilization Project (HCUP). The NIS sample design was changed in
2001, and supplementary data was provided to accommodate the investigation of trends
spanning beyond that year. Linked patient and hospital database files were merged, and
further merged with the provided supplementary files where appropriate. HCUP
recommends against using data from years 1988 to 1992 for trends analysis due to its
smaller sample size, and it was omitted from all final analyses.
The database was searched for all instances of knee arthrodesis by searching the
procedural variables of all cases (inpatient records) for the presence of the ICD-9-CM
medical billing code 81.22 – “Knee Arthrodesis,” and we distinguished cases where
arthrodesis was coded as a primary or secondary procedure. This code does not
distinguish between differing methods or types of implants used in knee fusion, such as
external fixation or internal fixation using plates or nails. Our search was assumed to
capture all instances of knee arthrodesis in the sample, as it was well established for all
years of the study and was not prone to underreporting.
Cases including a knee arthrodesis procedure were further analyzed for the
following information:
Arthrodesis as a primary (PR1) or secondary procedure
Patient demographic data:
o Gender

36
o Age – Binned into six groups
0 to 44 years
45 to 54 years
55 to 64 years
65 to 74 years
75 to 84 years
85+ years
Characteristics of hospital stay:
o Length of stay
o Total number of procedures performed
o Associated diagnoses
o Associated procedures
Payment:
o Total hospital charges
o Reimbursement method
Hospital data:
o Teaching status
o Hospital location (urban/rural)
o Region of the country
All data analysis for this work was performed using SAS software (Version 9 of
the SAS System for Windows. Copyright 2013 SAS Institute Inc. SAS and all other SAS
Institute Inc. product or service names are registered trademarks or trademarks of SAS

37
Institute Inc., Cary, NC, USA.) A complete program was coded in the SAS programming
language to simplify analysis, and to facilitate future investigations of similar nature.
Values of p<0.05 were considered statistically significant for all measures.
Figure 6 – Master SAS Program for running NIS Analysis. The user can select the ICD-9-CM Code he wishes to investigate, select the cutoff ages for six age groups, and select the years of study.
Nationwide estimates for each year of the study were determined with account for
the NIS study design. The appropriate weighting factors were used for each case, and
standard errors are reported with consideration of the stratified sample design using the
SURVEYMEANS statement (See example code).

38
Figure 7 – SAS code used to analyze the Nationwide Inpatient Sample. The SURVEYMEANS procedure takes account of stratified sample design using CLUSTER and STRATA variables.
In cases where knee arthrodesis was recorded as a secondary procedure,
frequency analysis was used to determine the most commonly performed primary
procedures.
39
A Poisson distribution [15] was assumed for the total number of arthrodesis
procedures, population based procedure rates, the total number of procedures on each
discharge record, and the total length of stay. Procedure rates for each patient
demographic were further analyzed by age and gender using publically available
population figures from the United States Census Bureau. Estimates from July of each
intercensal year were used. Poisson regression analysis allowed for the use of age and sex
as covariates in determining the rate and rate ratio of knee arthrodesis, and provided age-
gender specific procedure rates. An analysis of rate ratios across all years of study was
used to determine the presence of annual trends.
The nature of our search and our use of an inpatient record database meant that
there were no zero values for either length of stay or the total number of procedures
within each discharge record of interest; our search for records with an arthrodesis
procedure meant that no records had less than one procedure, and inpatient records, by
definition, require a minimum length of stay of one. Zero-truncated Poisson regression
was used to analyze these items to account for this.
Payment method, total hospital charges, hospital teaching status, hospital location,
and hospital region were investigated, and trends were determined using linear regression.
The diagnoses and procedures that were most commonly present in cases of knee
arthrodesis were examined using frequency analysis.
Results
There were an average of 1,014 knee arthrodesis procedures performed in the
United States each year from 1993 to 2011 (Table 1). Knee arthrodesis was recorded as
40
the primary procedure in over two-thirds of all cases (Figure 8); when recorded as a
secondary procedure, the most commonly recorded primary procedure was “Arthrotomy
for Removal of Prosthesis Without Replacement, Knee” (ICD-0-CM 80.06) and the
second most commonly recorded primary procedure was “Excisional Debridement of
Wound, Infection, or Burn” (ICD-9-CM 86.22). There was no statistically significant
increase or decrease in the total number of knee arthrodesis procedures performed in this
time.

41
Table 1 – Estimated total number of knee arthrodesis procedures (ICD-9-CM 81.22) and those coded as the primary procedure, by year.
Estimate Std. Error Estimate Std. Error
1993 1,180 97 789 75
1994 952 98 642 72
1995 1,044 93 700 72
1996 1,021 91 729 74
1997 895 95 621 75
1998 922 88 684 73
1999 952 90 659 73
2000 1,021 117 740 93
2001 928 139 687 98
2002 1,131 124 845 92
2003 1,293 162 879 97
2004 963 109 639 81
2005 1,022 133 682 87
2006 1,032 101 745 80
2007 902 107 660 79
2008 1,111 115 843 85
2009 895 89 661 76
2010 858 83 516 65
2011 1,122 163 652 77
Avg. 1,013 * 704 *
All Procedures Primary Procedure
Estimated Number of Knee Arthrodesis
Procedures in the United States from 1993
to 2011

42
Figure 8 – Number of knee arthrodesis procedures performed in the United States.
The total population of the United States grew 19.9% over this time, from 260.0M
in 1993 to 311.6M in 2011. Taking annual population data from the United States Census
Bureau into account, there was a decrease in the per capita procedure rate observed
during the years of this study (p<0.05) (Figure 9).

43
Figure 9 – Per capita knee arthrodesis procedural rate in the United States
Patient Demographics
Both age and gender significantly affected the relative rate of knee arthrodesis
procedures, with age having the largest influence. The procedure rate increased with
increasing age group, and the relative risk was 15 times greater for persons aged 75 to 84
than for persons aged 0 to 45 (the absolute number of knee arthrodesis procedures in
patients aged 85 and up was insufficient to allow for analysis.) Men are at greater risk of
knee arthrodesis – the procedure rate was significantly higher for males than females at
each age group (Table 2, Table 3).
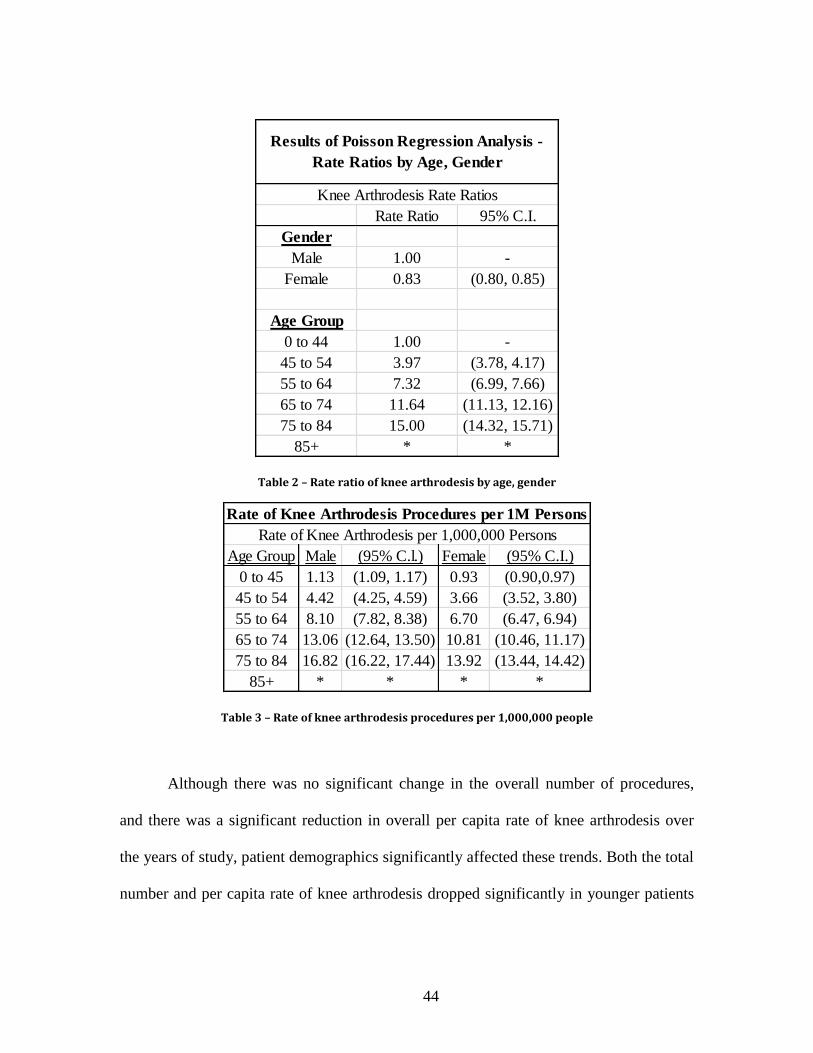
44
Table 2 – Rate ratio of knee arthrodesis by age, gender
Table 3 – Rate of knee arthrodesis procedures per 1,000,000 people
Although there was no significant change in the overall number of procedures,
and there was a significant reduction in overall per capita rate of knee arthrodesis over
the years of study, patient demographics significantly affected these trends. Both the total
number and per capita rate of knee arthrodesis dropped significantly in younger patients
Rate Ratio 95% C.I.
Gender
Male 1.00 -
Female 0.83 (0.80, 0.85)
Age Group
0 to 44 1.00 -
45 to 54 3.97 (3.78, 4.17)
55 to 64 7.32 (6.99, 7.66)
65 to 74 11.64 (11.13, 12.16)
75 to 84 15.00 (14.32, 15.71)
85+ * *
Knee Arthrodesis Rate Ratios
Results of Poisson Regression Analysis -
Rate Ratios by Age, Gender
Age Group Male (95% C.l.) Female (95% C.I.)
0 to 45 1.13 (1.09, 1.17) 0.93 (0.90,0.97)
45 to 54 4.42 (4.25, 4.59) 3.66 (3.52, 3.80)
55 to 64 8.10 (7.82, 8.38) 6.70 (6.47, 6.94)
65 to 74 13.06 (12.64, 13.50) 10.81 (10.46, 11.17)
75 to 84 16.82 (16.22, 17.44) 13.92 (13.44, 14.42)
85+ * * * *
Rate of Knee Arthrodesis per 1,000,000 Persons
Rate of Knee Arthrodesis Procedures per 1M Persons

45
(0 to 44) over the years of study (p<0.001 and p<0.001), while the total number of
procedures rose in patients aged 45 to 54 and 55 to 64 (p<0.01). There was no significant
change in the total number procedures in older patients (aged 65 to 74 and 75 to 84), but
the per capita procedure rate of this demographic dropped over the time of the study
when accounting for population growth (p=0.02).
The average hospitalization length for patients undergoing knee arthrodesis was
significantly affected by age (p<0.001), increasing by an average of 1.04 days with each
increase in age group. Length of stay was not significantly affected by gender. There was
a significant decrease in the overall average length of stay over the study period (p<0.01)
(Figure 10).
Figure 10 – Average length of stay for a person undergoing knee arthrodesis.

46
Associated Procedures and Diagoses
The total number of procedures that a patient undergoing knee arthrodesis will
undergo (including knee arthrodesis itself) during his hospital discharge is positively
correlated with age (p=0.014), but is not influenced by sex. The average number of
procedures per discharge record also rose over the years of study, at a rate of 0.067
procedures per year (p<0.01) (Figure 11).
Figure 11– Average number of procedures on discharges that include a knee arthrodesis procedure.
The diagnoses most commonly associated with knee arthrodesis in discharge
records are “unspecified hypertension” (ICD-9-CM 4019), “infection and inflammatory
reaction due to internal joint prosthetic” (ICD-9-CM 99666), and “acute posthemorrhagic
anemia” (ICD-9-CM 2851). The procedure most commonly recorded alongside knee
arthrodesis was “packed cell transfusion” (ICD-9-CM 9904), and the second most

47
commonly recorded procedure was “arthrotomy for removal of a prosthesis without
replacement” (ICD-9-CM 8006).
Reimbursement and Charges
The charges associated with each hospital stay increased dramatically over the
years of study (p<0.001), increasing from an average of $33k per stay to an average of
$111k per stay in 2011 (Figure 12).
Figure 12 – Average hospital charges for a discharge that includes a knee arthrodesis procedure.
A significant majority of reimbursements came from government sources,
including Medicare and Medicaid, while private insurance accounted for approximately
26% of payments (Figure 13).

48
Figure 13 – Number of discharge records billed to the top three payors from 1993 to 2011.
Figure 14 – Percentage of discharges including a knee arthrodesis procedure, by payor

49
Procedure Location
Knee arthrodesis was performed in a metropolitan hospital in nearly all cases
(92%), and a significant majority (62%) of the admitting hospitals were classified as
“Teaching” hospitals [“has an AMA-approved residency program, is a member of the
Council of Teaching Hospitals (COTH) or has a ratio of full-time equivalent interns and
residents to beds of .25 or higher”] (Figure 15). There were no significant trends over
time.
Figure 15 – Percentage of knee arthrodesis procedures performed in a teaching hospital

50
There were fewer procedures performed in hospitals in the Western region of the
United States (Figure 16, Figure 17, Table 4), even when accounting for population
differences, than any other region of the country (p=0.05) (Figure 18).
Figure 16 – Average annual number of knee arthrodesis procedures, by region of the country
172
419
122
219
Northeast
South
West
Midwest

51
Figure 17 – Regions of the United States (Nationwide Inpatient Sample)
Regions of the United States (Nationwide Inpatient Sample)
Northeast Connecticut, Maine, Massachusetts, New Hampshire†, New Jersey,
New York, Pennsylvania, Rhode Island, Vermont
Midwest Illinois, Indiana, Iowa, Kansas, Michigan, Minnesota, Missouri,
Nebraska, North Dakota, Ohio, South Dakota, Wisconsin
South Alabama, Arkansas, Delaware, District of Columbia, Florida, Georgia,
Kentucky, Louisiana, Maryland, Mississippi, North Carolina,
Oklahoma, South Carolina, Tennessee, Texas, Virginia, West Virginia
West Alaska, Arizona, California, Colorado, Hawaii, Idaho, Montana,
Nevada, New Mexico, Oregon, Utah, Washington, Wyoming Table 4 – Regions of the US as defined by the NIS

52
Figure 18 – Per capita knee arthrodesis procedural rate, by region of the country
Discussion
The purpose of this work, having first identified an unmet need in the local
practices of our clinical collaborators in Chaper 3, was to determine the broader
significance of said need. This need – the limited number and undesirability of options
available to patients with severe knee dysfunction – has been discussed in the literature
from a number of perspectives. In one such publication, the most appropriate course of
treatment is addressed as an ethical dilemma [8]. Knee arthrodesis is advocated as an
option that will salvage the limb and allow for independent ambulation, but it is generally
undesirable to patients. In spite of the large number of publications on knee arthrodesis in
peer-reviewed journals, there are no reports or estimates of the actual number of
0
1
2
3
4
5
6
Northeast South Midwest West
Pro
ced
ure
s p
er
1,0
00
,00
0 P
eo
ple
Knee Arthrodesis Rate

53
procedures performed. No recent review articles cite the commonness of the procedure
[10], [11], [38], in stark contrast to those of other orthopedic procedures.
This study provides a robust estimate of the number of knee arthrodesis
procedures performed in the United States, and was conducted by adopting and adapting
methods used to quantify other patient population subsets. While there are relatively few
knee arthrodesis procedures performed relative to total knee replacement procedures
(0.14%), this study establishes that the number of procedures, at approximately 1,014 per
year, is not insignificant. The results of this study further indicate, however, that the
number of arthrodesis procedures performed in the United States has not significantly
changed over the past two decades. A small reduction in the absolute number of
procedures may have been prevented by population growth, as the per capita rate of knee
arthrodesis procedures has fallen or remained unchanged for each individual age/gender
demographic group. The continued use of knee arthrodesis as treatment, in spite of its
undesirability, indicates an otherwise unmet need in the affected patients. This merits a
closer look by clinicians, researchers, and medical device manufacturers.
The success of primary and revision total knee arthroplasty has significantly
marginalized knee arthrodesis as treatment of choice in most cases[10], but has not
completely eliminated it. Arthrodesis is indicated in patients with deficient or missing
extensor mechanisms, as total knee replacement designs cannot compensate for the loss
of function and stability and the risk of graft transfer may be unacceptably high [8]. Knee
arthrodesis often follows failed knee arthroplasty, as determined by our procedure
analysis, and it could be hypothesized that the incidence of arthrodesis will increase as
54
the number of revision arthroplasty procedures increases. This must be balanced against
patients increasing expectations for higher quality of life, function, and mobility, however,
for which arthrodesis technology has not kept pace. This could account for both the
decrease in per capita arthrodesis rates and the observation that arthrodesis rates do not
mirror increases in total knee revision rates. Given the steady number of knee arthrodesis
procedures, it is likely that reconstructive knee replacement is already performed in as
many cases as is feasible. It is also possible that high risk reconstructions are performed
too often, and that knee arthrodesis should be attempted earlier in some cases to preserve
bone stock and ensure the greatest chance of success [4].
We found that patients who do undergo arthrodesis are generally older, with over
80% of all patients above the age of 45, and over 41% of patients above the age of 65.
Age alone does not fully explain the prominence of Medicare as a payment method,
however. Assuming that all patients above the standard eligibility age of 65 utilized
Medicare as a primary payment method, there was still a significant proportion (12.3%)
of younger patients utilizing it. These patients most likely received Social Security
Disability benefits prior to their knee arthrodesis procedure, an indication of the
debilitating nature of the knee dysfunction and injuries that are present in patients who
undergo the procedure.
We also found that a significant majority of arthrodesis patients obtained
treatment in metropolitan areas and at teaching hospitals. This may be indicative of the
complicated nature of the procedure, the severity of the negative side effects, and the
severity of the potential complications. It is possible that only a small number of

55
orthopedic surgeons perform the majority of these procedures, but this was not explored
in the current study. Patients appear to be much more likely to either receive referrals or
actively seek out specialists in knee reconstruction.
Arthrodesis can enable a patient to ambulate independently, but permanent rigid
knee extension has severe functional limitations and can make sitting uncomfortable.
Simple activities of daily living, such as bathing or tying one’s shoes, can become
difficult or impossible. Independence may be lost as patients have difficulty sitting in cars,
busses, or planes, and patients may find it difficult to engage in activities in public such
as in theaters. Some surgeons may request that a patient give fusion a test run by wearing
a full leg brace for an extended period of time prior to surgery to see if permanent
extension of the limb is acceptable, and it often isn’t.
These patients often face poor alternatives, however, including transfemoral
amputation and resection knee arthroplasty [5]. Some patients may voice a preference for
amputation, but functional outcomes are typically worse than those of arthrodesis [10].
And while resection arthroplasty both salvages the limb and enables a patient to bend the
knee and sit comfortably, patients are typically unable to walk. At least one knee implant
type design has been developed to address this population [31], but it offers patients no
functional advantage over traditional fusion methods. When compared against these
options, arthrodesis often offers the best combination of function and risk. Based on
personal communication with orthopedic surgeons experienced in knee reconstruction
and arthrodesis, we estimate that only one quarter to one third the number of patients who

56
are suitable candidates for knee arthrodesis actually undergo the procedure, often in an
attempt to avoid its limitations.
This investigation shows that there is a relatively small, but significant number of
knee arthrodesis procedures performed each year, and that this number has remained
relatively steady over the past two decades. The average cost of these discharges has
more than tripled (Figure 12) in that time, even as the average length of stay has gone
down (Figure 10). The high level of interest in knee arthrodesis, as evidenced by the
number of published articles, is likely due to both the undesirability of the procedure and
the significant number of affected or candidate patients seen by publishing/researching
clinicians.
Looking forward, we expect the number of knee arthrodesis procedures to remain
steady and the associated costs to continue to rise. These trends could be affected by the
development of technological or procedural advances to address the affected patient
subpopulation. This could include implants specifically designed to provide limited knee
function or modular implant systems to improve outcomes following massive knee
reconstruction. The quantification and characterization of patients undergoing knee
arthrodesis and the characterization of hospitals where it is performed provides
researchers, clinicians, and medical device manufacturers with information critical to
assessing the demand for new treatment approaches and implant design in this area.
The results of this study support the significance of the need.

57
Acknowledgements
The following people are gratefully acknowledged for their assistance in this
work: William Bridges, Ph.D.

58
CHAPTER SIX
CHANGES TO GAIT KINEMATICS AND KINETICS INDUCED BY RIGID KNEE
CONSTRAINT
In which the kinematics and kinetics of rigid knee gait are quantified.
“The true method of knowledge is experiment.” – William Blake Read
Hypothesis
Rigid immobilization of a single knee will induce immediate changes in gait
kinematics and kinetics. Further, acclimation to rigid knee immobilization will have a
continued effect on these kinematic and kinetic changes.
Abstract
The purpose of this study is to determine and quantify differences in human gait
due to a ‘learning effect’ after complete constraint of a single knee. We hypothesize that
with increased immobilization time, patients with a single immobilized knee will undergo
changes in movement and muscular force generation (as measured by kinematics and
ground reaction forces.) Ten healthy subjects (M/F, n=5/5; aged 18-23) with no history of
gait abnormalities were recruited for this study, and knee arthrodesis was simulated for 0
through 24+ hours using an immobilizing knee brace. Gait analysis was conducted during
level walking on a 15-meter walkway using an eight-camera motion tracking system with
a six-axis ground reaction force platform. Normal gait served as each subject’s control,
and multiple measurements of braced gait were taken immediately following fitting of the

59
brace, after walking 0.4 kilometers (0.25 miles) on a treadmill, after walking 1.2
kilometers (0.75 miles) on a treadmill, and after wearing the brace for 24 hours.
Additionally, the percentage of lean muscle and fatty tissue were recorded for each body
segment using dual energy x-ray absorptiometry. Results showed that simulated knee
arthrodesis caused statistically significant and interrelated changes to gait kinematics
when compared to normal gait, including increased ankle dorsiflexion and pelvic
obliquity during swing phase of the braced limb, increased abduction of the left and right
hip during stance of the braced limb, and an increase in the net joint reaction force at the
contralateral hip. These changes facilitated ground clearance of the braced limb and
minimized displacement of the center of gravity of the pelvis. Increased acclimation time
was not found to significantly alter braced gait kinematics, supporting the use of short
term bracing as a model for longer-term immobilization of the knee.
Introduction
Knee arthrodesis, or permanent fusion of the knee, is performed to treat pain and
instability in cases of multiple failed knee replacement surgeries, bone loss, traumatic
injury, infection, or loss of the quadriceps extensor mechanism [10], [11]. Knee
arthrodesis can enable a patient to walk independently, and approximately one to two
thousand procedures are performed in the United States each year. The inability to bend
the knee can significantly affect patient quality of life, however, as patients can no longer
bend their leg during activities such as sitting, bathing, and driving. In addition, the
procedure necessarily affects gait biomechanics. Clinically, knee arthrodesis has been

60
hypothesized to increase loading and induce degeneration of the adjacent joints and spine
[5], [11], [38]. There has been a high level of clinical interest in the procedure in the past
five years, with over sixty case reports and review articles published in that time. The
availability of detailed information on the resulting kinematic and kinetic changes,
however, is limited [52], [53], potentially due to the difficulty in accessing the affected
patient population. In addition, the diverse range of clinical indications for arthrodesis
can introduce confounding factors that make meaningful comparison of the resulting
pathologic gait difficult. This combination of current clinical interest, significant patient
morbidity, and lack of quantitative biomechanical data necessitate the further study of
this condition to improve treatment options and patient outcomes.
One potential, documented method of conducting arthrodesis studies is to
temporarily simulate knee arthrodesis in normal, healthy subjects by applying an
immobilizing brace or cast. This allows researchers to examine the effects of knee
immobilization without the presence of confounding gait abnormalities, and increases the
number of potential subjects. Subject-specific control data can be collected from the
normal gait of each subject, enabling researchers to isolate changes solely attributable to
joint immobilization. Some preliminary work has been done in this area, but most studies
have focused on energy expenditure and there is a notable lack of reporting of
comprehensive kinematic and kinetic data. The few studies that have included kinematic
and kinetic data have limited their reporting to an undefined sagittal plane, and none have
taken account of the importance of defining joint rotations [54], [55]. They have been
limited by 2D data capture methods [56] or have otherwise not included kinematic and

61
kinetic measures outside of the “sagittal” plane [57], [58]. A comprehensive and well-
defined account of lower body knee kinematics and kinetics is thus needed.
While immobilizing the knee will induce immediate biomechanical changes, it is
possible that changes will continue to occur with long-term immobilization as subjects
become accustomed to the newly immobilized joint. No studies, however, have
investigated the potential for these changes. In nine studies involving gait after
immobilization of the knee, the methods accounted for acclimation in only a limited
manner (Table 5). Subjects walked until they reached a steady-state heart rate in three of
these studies [30], [59], [60], subjects walked until they reached steady state oxygen
consumption in two studies [57], [58], and subjects were given various, but limited
accommodation in four studies [58], [61]-[63]. Given the absence of study into changes
in gait kinematics with increased knee immobilization time, an appropriate acclimation
protocol is unknown. If gait adaptation continues to cause kinematic changes after short-
term immobilization of the knee, as could be the case with clinical knee arthrodesis, it is
possible that the methods used in the above studies were insufficient to capture these
changes. The poor functional outcomes in patients with arthrodesis necessitate the
development of an immobilization protocol to appropriately model stiff knee gait.
Peer-reviewed research studies utilizing knee immobilization in gait
analysis
Study Acclimation Method Length
Hanada and
Kerrigan[59]
Walk on treadmill until steady-state heart
rate
No time
given
Abdulhadi et al. [30] Walk down 20ft. data collection area at least
5x until steady-state heart rate
Approx.
3 min
Mattson and Walk until steady-state heart rate > 4 min

62
Brostrom[60]
Lewek et al.[57] Walk on treadmill until “metabolic”
“steady-state” 5 min
Kerrigan et al.[64] Walk until steady-state oxygen consumption <2 min
Senden et al.[63] Familiarize with limitation Approx.
1 min
Boone[62] “The subjects were previously familiarized
with the treadmill.” 10 min
Kerrigan et al.[58]
“To allow some accommodation time, each
subject walked up and down the length of
the walkway approximately five times
before data was collected.”
No time
given
Waters et al.[61] “The subjects were instructed to become
accustomed to walking”
No time
given Table 5 – Peer reviewed publications utilizing knee immobilization in gait
The objective of this research is to provide a definitive dataset quantifying the
changes to gait kinematics and kinetics resulting from immobilization of the knee, as well
as to quantify the influence of these changes on loading at the affected knee. To add to
previous work utilizing short-term immobilization using a brace or cast, we will evaluate
changes over distance and time to establish a robust model for representing long-term
immobilization, as would be the case with clinical knee arthrodesis.
Materials and Methods
This study received approval from the Institutional Review Board (IRB) of
Greenville Health System, Clemson University, and Furman University, and informed
consent was obtained from each study subject. Gait analysis trials were conducted within
the Molnar Human Performance Laboratory of Furman University (Figure 19), which
was equipped with an 8-camera motion capture system (ProReflex MCU 240, Qualsys,

63
Gothenburg, Sweden)(Figure 20) and 6-axis force platform (LG6-4-1, Advanced
Mechanical Technology, Inc., Newton, Massachusetts).
Figure 19 – Gait analysis pathway instrumented with six-axis force platform

64
Figure 20 – One of eight ProReflex infrared motion capture cameras used to conduct the study
A total of ten subjects [(n=10), five male (n=5) and five female (n=5); Age range
18 to 23] with no history of joint or gait abnormalities were recruited for this study from
a volunteer sample, which was solicited through Clemson University and Furman
University campus email and bulletin posts.
Subjects were instructed to wear compression athletic clothing and low-cut
athletic shoes prior to testing, which were provided if unavailable. Upon arrival at the gait
laboratory, subjects were given all appropriate literature, including an informed consent

65
form. Testing did not proceed until any questions the subject had were answered, and the
informed consent form was signed.
Designated anthropometric measurements of the subject, including age, mass,
height, and body segment dimensions were taken and recorded. Tissue composition
measurements were recorded using Dual Energy X-ray Absorptiometry equipment,
including segmental tissue mass, fat mass, and lean mass. The provided report is included
in each subject’s file.
Bony landmarks were identified with the assistance of a provided diagram.
Figure 21 – Diagrams identifying bony anatomic landmarks used to locate and place reflective markers
Reference Landmarks were marked with a ½” solid black dot using a permanent
marker, mascara pen, or other method.
Sacral Vertebrae

66
Anterior Spina Iliaca Superior
Crista Iliaca
Greater Trochanter
Superior part of the Patella
Lateral side of the Patella
Medial Condylis of the Femur
Medial Malleolus
Lateral Malleolus
Reflective markers were placed over the following anatomic landmarks to
facilitate motion capture:
Sternum
C7 spine
L5 spine
Acromium (left and right)
Humerus (left and right)
Elbow(left and right)
Radius (left and right)
Ulna (left and right)
Hand (left and right)
Anterior spine of the iliac crest (left and right)

67
Greater trochanter (left and right)
Medial and lateral condyles of the knee (left and right)
Medial and lateral malleoli (left and right)
Proximal, distal, and lateral sides of the heel (left and right)
First and fifth metatarsals(left and right)
Toes (left and right)
A rigid polymer shell with four rigidly attached markers was secured to each
thigh and shank via an elastic band (Figure 22).
Figure 22 – Researcher demonstrating placement of reflective tracking markers while wearing the immobilizing brace.

68
Data from each subject was collected on two consecutive days. The force plate
and motion tracking equipment were calibrated each day prior to subject data collection.
Six groups of trials were conducted. Prior to the start of each group of trials, the subject
was asked to stand motionless in the anatomic position for the collection of calibration
data.
Table 6 – Experimental trial names, conditions, and the day on which they occured.
The subject was first asked to walk normally (at a self-selected speed) along a 15-
meter, straight, level pathway for the collection of control data (C1 – Control Trial 1).
Subjects were asked to repeat this motion until data was collected from five left and five
right clean and complete foot strikes on the force platform were recorded. This data was
used to establish the normal gait of each subject.
Upon completion of the first control trial, knee arthrodesis was simulated in the
right knee of each subject using a locking knee brace (Telescoping IROM, DJO Global,
Vista, California). The length of the brace was adjusted to extend from the ankle to the
inseam of each subject, and the flexion angle was set to 0 degrees for all trials and all
subjects. Data capture commenced immediately upon fitting the subject with the brace,
preventing the subject from gaining any familiarity to walking with the brace. The subject
Experimental Condition Day
C1 Control Trial 1 Normal gait, before fitting the immobilizing brace Day 1
B1 Brace Trial 1 Immediately after subject is fitted with the brace Day 1
B2 Brace Trial 2 After walking on treadmill for 0.402 kilometers (0.25 miles) Day 1
B3 Brace Trial 3 After walking additional 0.805 kilometers (0.50 miles) on treadmill Day 1
B4 Brace Trial 4 After wearing the brace for 24 hours Day 2
C2 Control Trial 2 Normal gait, after removing the immobilizing brace Day 2
Trials

69
walked along the 15-meter pathway for data collection, as during the control trial. After
completion of this experimental trial (B1), the subjects were instructed to walk on a level
treadmill for 0.25 miles at 2.5 miles per hour.
After walking 0.25 miles in the brace on the treadmill, the second experimental
trial (B2) was conducted in the same manner and data collection sequence as the first two
trials. The subject was then instructed to walk an additional 0.50 miles on the treadmill,
for a total of 0.75 miles, after which additional data was captured (B3). Motion tracking
markers were removed and their locations marked. The subjects were instructed to wear
the brace, which was fitted with a pedometer, for an additional 24 hours pending a return
visit and additional trial measurements the next day.
Motion tracking markers were replaced on the second day, and a final set of
experimental data was collected (B4.) The brace was then removed, the subject was
asked to acclimate to normal gait for at least three minutes, and a second set of control
data was then collected (C2.)
Three-dimensional motion capture and ground reaction force data was collected
and processed using Qualisys Track Manager (Qualsys, Gothenburg, Sweden) and
exported to Visual3D (C-Motion, Germantown, Maryland) for analysis. A rigid body
model was created to correlate the location of motion tracking markers with anatomical
landmarks, and was scaled to match subject-specific measurements. The Cardan rotation
sequence described by Cole was used to describe hip, knee, and ankle joint rotations [65],
while the convention proposed by Baker was used for the pelvis [66]. Net reaction forces

70
and moments of the ankle, knee, and hip were calculated using an inverse dynamics
approach, and were normalized to subject mass[67].
Figure 23 – Model constructed in Visual3D for the purpose of associating motion tracking markers with subject anatomy. The local coordinate systems of each rigid segment are shown (x=red, y=green,
z=blue). In this figure, the local coordinate systems of the feet are rotated about the x axis by 90 degrees from the orientation used in all calculations.
The following kinematic and kinetic data was normalized to the gait cycle (0-
100%) and output from Visual3D:

71
Walking velocity (meters/second)
Stance duration (seconds and percent of gait cycle)
Swing duration (seconds and percent of gait cycle)
Sagittal (x), Frontal (y), and Transverse (z) plane movement of the center of
gravity of the pelvis
Sagittal (x), Frontal (y), and Transverse (z) plane kinematics of the pelvis with
respect to the lab
Sagittal (x), Frontal (y), and Transverse (z) plane joint rotations of the hip, knee,
and ankle
Sagittal (x), Frontal (y), and Transverse (z) plane net reaction forces of the hip,
knee, and ankle
Sagittal (x), Frontal (y), and Transverse (z) plane net joint moments of the hip,
knee, and ankle
Data from each subject (1-10), joint (pelvis, hip, knee, ankle), side (left/right),
experimental trial (C1, C2, B1, B2, B3, B4), and rotation plane (x, y, z) were calculated
for the entire gait cycle of each trial repetition. Data analysis was performed using SAS
software (Version 9 of the SAS System for Windows. Copyright 2013 SAS Institute Inc.
SAS and all other SAS Institute Inc. product or service names are registered trademarks
or trademarks of SAS Institute Inc., Cary, NC, USA.) A complete SAS program was
coded to simplify analysis and to facilitate future investigations of similar nature, and is
provided in the Appendices.

72
Figure 24 – Master program coded in SAS to analyze gait data
Kinematic and kinetic values of interest (e.g. peak knee flexion during stance
phase) were calculated by determining the minimum, maximum, mean, or range of values
within a specific range of the gait cycle. The times where minimum and maximum values
occurred (in percent gait cycle or percent stance phase) were also recorded and compared.
(e.g. peak knee flexion during stance was determined by finding the maximum value of
knee flexion between 0% and 40% of the gait cycle for each trial.) Each value of interest
was determined for every motion capture trial. Comparison of experimental conditions
(C1, B1, B2, B3, B4, and C2) and sides (left/right) was performed using analysis of
variance followed by Fisher’s Pairwise Comparison. Experimental conditions were
compared against same-day control trials (C1 vs. B1, B2, B3; C2 vs. B4). Values of
p<0.05 were considered statistically significant for all measures.
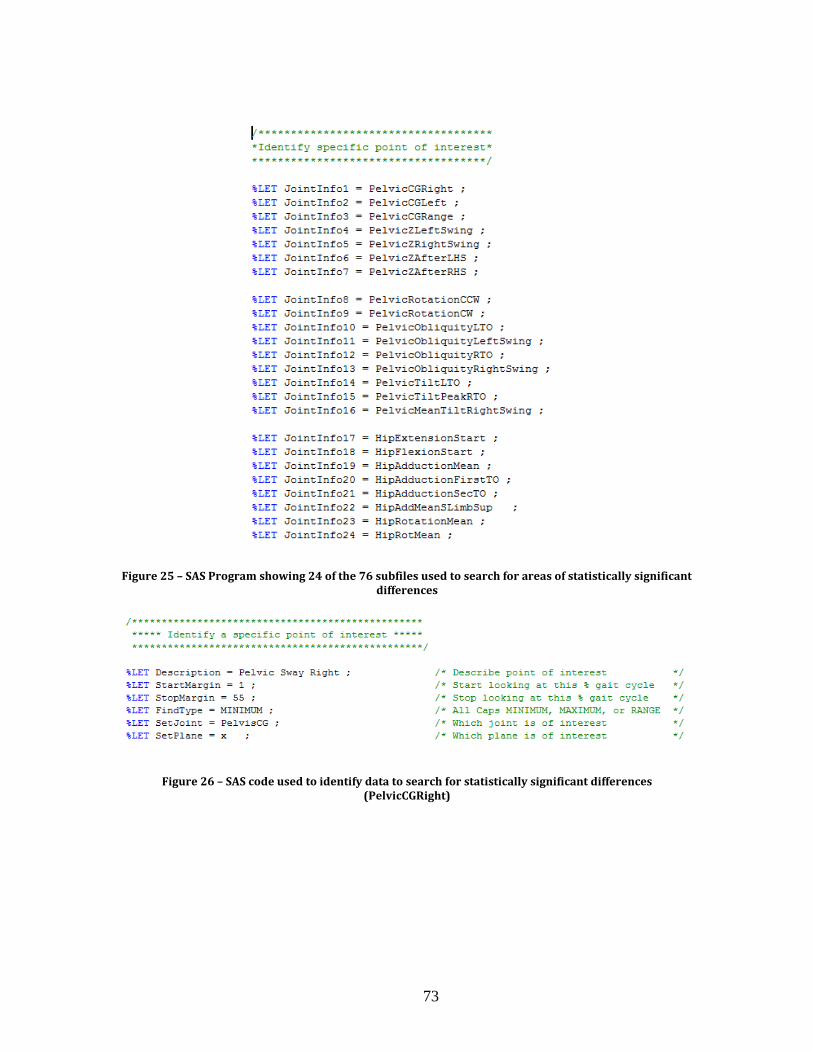
73
Figure 25 – SAS Program showing 24 of the 76 subfiles used to search for areas of statistically significant differences
Figure 26 – SAS code used to identify data to search for statistically significant differences (PelvicCGRight)

74
Table 7 – Kinematic values of interest that were analyzed to find statistically significant differences. Values that differed between "Control" and "Brace" trials are indicated with a "*" in the right column
Joint Plane Value of InterestRange (%
Gait Cycle) (p<0.05)
Peak pelvic sway to the Right side 0% to 50%
Peak pelvic sway to the Left side 50% to 100%
Overall range of pelvic sway 0% to 100% *
Minimum after Right Heel Strike 0% to 25%
Maximum during Left Swing 10% to 50%
Minimum after Left Heel Strike 35% to 75%
Maximum during Right Swing 60% to 100% *
Peak towards Left side 0% to 50%
Peak towards Right side 25% to 75% *
Minimum at Left Toe Off 0% to 25%
Maximum during Left Swing 0% to 45%
Maximum at Right Toe Off 50% to 75% *
Minimum during Right Swing 50% to 95% *
Maximum at Left Toe Off 5% to 30%
Minimum at Right Toe Off 55% to 75% *
Mean during Right Swing 55% to 100% *
Peak Extension 25% to 75%
Peak Flexion before Heel Strike 75% to 100% *Right
Peak Adduction in early stance 0% to 30% *Left
Mean during Single Limb Support 12% to 50% *
Peak Abduction in late stance 50% to 75% *Left
Internal(+) / External(-) Rotation Mean Rotation Angle 75% to 100%
Peak Flexion during early stance 0% to 40% *Right
Peak Flexion during Swing 50% to 100% *Right
Peak Abduction in early swing 60% to 80%
Peak Adduction in late swing 70% to 100% *Right
Internal(+) / External(-) Rotation Peak External Rotation in late swing 75% to 100% *Right
Peak Plantarflexion after Heel Strike 0% to 25% *Right
Peak Plantarflexion at Toe Off 50% to 75% *Right
Mean during Single Limb Support 12% to 50%
Peak Inversion at Toe Off 50% to 75%
Peak Abduction at Contralateral Toe Off 0% to 25%
Peak Adduction at Toe Off 50% to 75%
Peak Adduction before Heel Strike 90% to 100%
Ankle
Dorsiflexion(+) / Plantarflexion(-)
Inversion(+) / Eversion(-)
FF Adduction(+) / FF
Abduction(-)
Hip
Flexion(+) / Extension(-)
Adduction(+) / Abduction(-)
Knee
Flexion (+)
Adduction(+) / Abduction(-)
Pelvic
Center of
Gravity
Side to Side Displacement
[Right(+) / Left(-)]
Vertical Displacement
Pelvis
Rotation [CCW(+) / CW(-)]
Obliquity
Rear(+) / Forward(-) Tilt
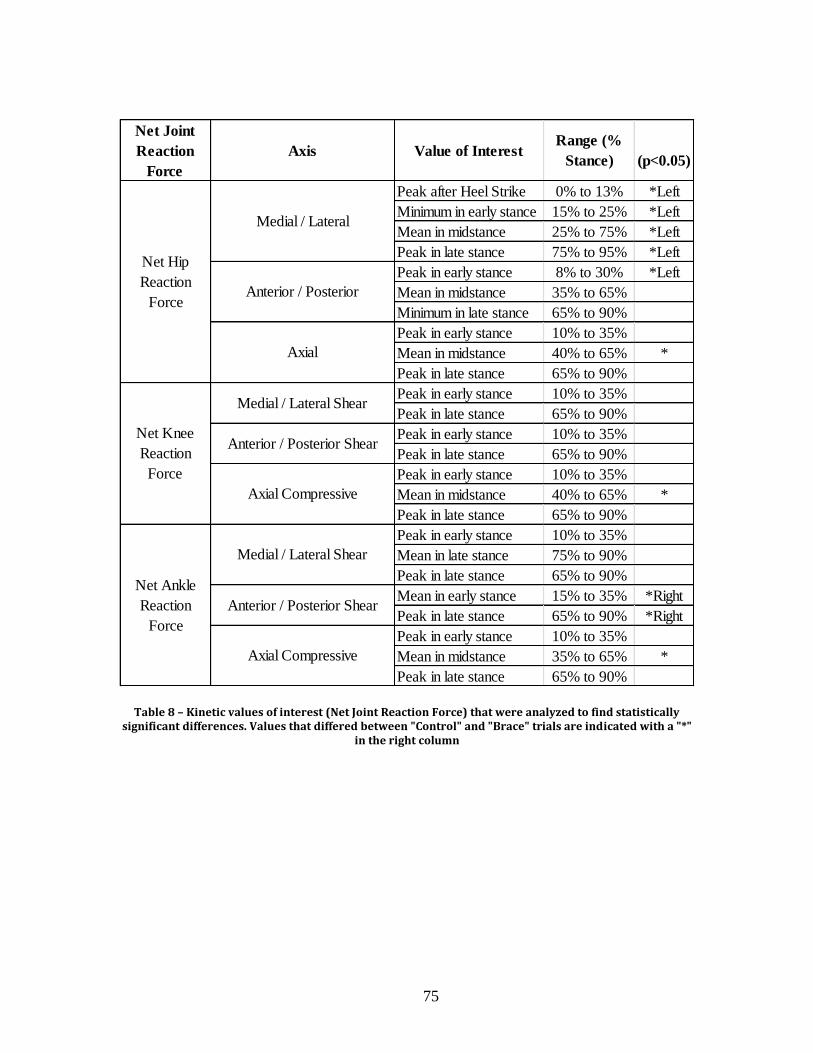
75
Table 8 – Kinetic values of interest (Net Joint Reaction Force) that were analyzed to find statistically significant differences. Values that differed between "Control" and "Brace" trials are indicated with a "*"
in the right column
Net Joint
Reaction
Force
Axis Value of InterestRange (%
Stance)
(p<0.05)
Peak after Heel Strike 0% to 13% *Left
Minimum in early stance 15% to 25% *Left
Mean in midstance 25% to 75% *Left
Peak in late stance 75% to 95% *Left
Peak in early stance 8% to 30% *Left
Mean in midstance 35% to 65%
Minimum in late stance 65% to 90%
Peak in early stance 10% to 35%
Mean in midstance 40% to 65% *
Peak in late stance 65% to 90%
Peak in early stance 10% to 35%
Peak in late stance 65% to 90%
Peak in early stance 10% to 35%
Peak in late stance 65% to 90%
Peak in early stance 10% to 35%
Mean in midstance 40% to 65% *
Peak in late stance 65% to 90%
Peak in early stance 10% to 35%
Mean in late stance 75% to 90%
Peak in late stance 65% to 90%
Mean in early stance 15% to 35% *Right
Peak in late stance 65% to 90% *Right
Peak in early stance 10% to 35%
Mean in midstance 35% to 65% *
Peak in late stance 65% to 90%
Net Ankle
Reaction
Force
Medial / Lateral Shear
Anterior / Posterior Shear
Axial Compressive
Net Hip
Reaction
Force
Medial / Lateral
Anterior / Posterior
Axial
Net Knee
Reaction
Force
Medial / Lateral Shear
Anterior / Posterior Shear
Axial Compressive

76
Table 9 – Kinetic values of interest (Net Joint Moment) that were analyzed to find statistically significant differences. Values that differed between "Control" and "Brace" trials are indicated with a "*" in the right
column
Results
Kinematic and kinetic data was quantified, and mean values for combined data
from Control (C1, C2) and Brace trials (B1, B2, B3, B4) are visualized with respect to the
gait cycle for kinematics (Figure 27, Figure 28) and with respect to stance phase for
kinetics (Figure 29, Figure 30). Statistically significant changes to gait kinematics and
kinetics were observed when the knee was immobilized, and remained significant across
all experimental trials (B1- B4) (Table 7, Table 8, Table 9). A small number of changes
were only significant immediately after immobilization (Control vs. B1), but were no
longer significantly different from control values in subsequent trials (Table 10). No
significant differences were observed between braced trials (B1 vs. B2 vs. B3 vs. B4).
Net Joint
MomentPlane Value of Interest
Range (%
Gait Cycle)
(p<0.05)
Flexion (+) / Extension (-) Peak Extension Moment 6% to 25% *Left
Peak Adduction Moment in early stance 10% to 30% *
Peak Adduction Moment in late stance 60% to 90%
Peak Internal Rotation Moment 10% to 40%
Peak External Rotation Moment 60% to 85%
Peak Flexion Moment 6% to 40% *Right
Peak Extension Moment 60% to 90%
Peak Abduction Moment in early stance 10% to 30% *Left
Peak Abduction Moment in late stance 65% to 85%
Peak Internal Rotation Moment 15% to 35%
Peak External Rotation Moment 60% to 85%
Peak Plantarflexion Moment 5% to 25%
Peak Dorsiflexion Moment 60% to 95%
Peak Inversion Moment 15% to 35%
Peak Eversion Moment 65% to 90%
FF Adduction(+) / FF
Abduction(-)Mean Adduction Moment 0% to 100%
Ankle
Adduction(+) / Abduction(-)
Internal(+) / External(-)
Rotation
Flexion (+)
Adduction(+) / Abduction(-)
Internal(+) / External(-)
Rotation
Dorsiflexion(+) /
Plantarflexion(-)
Hip
Knee
Inversion(+) / Eversion(-)

77
Figure 27– Mean values (shaded regions represent standard deviation) of the pelvic center of gravity and pelvic rotation in three planes (Columns A-C). (Gait cycle displayed from ipsilateral heel strike to
ipsilateral heel strike.)

78
Figure 28 – Joint Rotation Angle. Mean values (shaded regions represent standard deviation) of the Hip Rotation Angle (Row 1), Knee Angle (Row 2), and Ankle Angle (Row 3) in three planes (Columns A-C).
(Gait cycle displayed from ipsilateral heel strike to ipsilateral heel strike.)

79
Figure 29 – Joint Reaction Forces. Mean values (shaded regions represent standard deviations) of the normalized (to subject mass) net joint reaction force of the hip (Row 1), knee (Row 2), and ankle (Row
3). (Legend: Control Trials – Right=Red, Left=Blue; Braced Trials: Right=Purple, Left=Cyan) (Stance phase displayed from ipsilateral heel strike to ipsilateral toe off.)

80
Figure 30 – Joint Net Moments. Mean values (shaded regions represent standard deviations) of the normalized (to subject mass) net moment of the hip (Row 1), knee (Row 2), and ankle (Row 3). (Stance
phase displayed from ipsilateral heel strike to ipsilateral toe off.)
When braced, each subject’s self-selected gait speed and stride length was
reduced (p<0.0001), while stride width was increased (p=0.0103). Right (braced) stance
time, right (braced) swing time, and left stance time were increased (p<0.0001), but there
was no difference in swing time of the left (unbraced) leg (p=0.6168). Some of the
differences in kinematics can be observed relatively easily by overlaying a model of the
braced subject on a model of the same subject during normal gait (Figure 32).

81
Figure 31 – A visual comparison of the relative stance and swing times of the left and right side during Control (C1, C2) and Experimental Trials (B1, B2, B3, B4).
Table 10 – The above values of interest were significantly different from Control values during the first brace trial (B1) but were no longer significantly different in subsequent trials
Swin
g
Ph
ase
Stan
ce
Ph
ase
RightG
ait
Cyc
leLeft
Left 0.657 (s)
Left 0.773 (s)
Right 0.658 (s)
Right 0.709 (s)
0% 10% 20% 30% 40% 50% 60% 70% 80% 90% 100%
Brace
Control
Left 0.435 (s)
Left 0.44 (s)
Right 0.436 (s)
Right 0.515 (s)
0% 10% 20% 30% 40% 50% 60% 70% 80% 90% 100%
Brace
Control
Stance 0.657 (s)
Stance 0.773 (s)
Swing 0.435 (s)
Swing 0.44 (s)
0% 20% 40% 60% 80% 100%
Brace
Control
Stance 0.658 (s)
Stance 0.709 (s)
Swing 0.436 (s)
Swing 0.515 (s)
0% 20% 40% 60% 80% 100%
Brace
Control
Pelvis - Maximum Obliquity during Left Swing 0% to 45%
Hip - Peak Adduction Moment in late stance 60% to 90% Right
Hip - Peak Internal Rotation Moment 10% to 40% Right
Ankle - Peak Dorsiflexion Moment 60% to 95% Both
Hip - Mean M/L force in midstance 25% to 75% Right
Hip - Peak A/P shear force in late stance 65% to 90% Right
Hip - Maximum axial force in late stance 65% to 90% Right
Knee - Peak A/P shear force in early stance 10% to 30% Right
Knee - Maximum compressive force in late stance 65% to 90% Right
Net Joint Force
Net Joint Moment
Joint Angle

82
Figure 32 – Posterior view visualization of a braced subject model (lighter) overlaid on the normal gait of the same model (darker) during (A) midstance and (B) midswing of the right leg. The left hip is more abducted and the pelvis is rotated obliquely during midswing, resulting in a rise of the center of gravity of the pelvis and the right hip joint center, helping the right foot to clear the ground as it is brought forward. Subject’s right and left feet are further away from the centerline of the body during their respective swing phases.
Significant kinematic differences between normal gait and immobilized trials
(B1-B4) are listed below in the order in which they occur during a single gait cycle (The
right knee was immobilized in all cases, and the gait cycle is listed from Right Heel
Strike to Right Heel Strike).
Following Right Heel Strike, the right foot plants flat on the ground with a
greater degree of ankle plantarflexion (p=0.0014)
Following Left Toe Off, the left hip abducts more than normal gait
(p=0.0397)
The right hip is more abducted through single leg stance (p=0.0020)
83
Clockwise pelvic rotation reaches a greater peak immediately after Left
Heel Strike (p=0.0143)
The oblique pelvic dip towards the right foot is attenuated (p=0.0005)
The right hip continues to extend longer into the gait cycle, until toe off
(p<0.0001)
With reduced heel rise, maximum plantar flexion of the right ankle is
reduced (p<0.0001), and reaches its peak at Right Toe Off
Dorsiflexion of the right ankle begins earlier, immediately at Right Toe
Off rather than afterwards (p<0.0001) , and neutralizes ankle plantar
flexion more rapidly (Figure 8)
The left hip is much more abducted through single leg stance (p<0.0001)
Pelvic obliquity decreases (left side down, right side up) dramatically
during right swing (p<0.0001)
The center of gravity of the pelvis rises to a higher peak (along the vertical
axis) as the rigidly extended right leg moves through swing phase
(p=0.0093)
The left ankle is more inverted as the right leg begins swing phase
(p=0.0059)
Pelvic tilt is reversed during right swing, tilting forward rather than
towards the rear (p<0.0001)
Maximum hip flexion prior to Right Heel Strike is reduced (p=0.0496)
and occurs much closer to heel strike (p<0.0001)

84
Significant kinetic differences between normal gait and the immobilized trials
(B1-B4) are listed below with respect to right and left stance phases:
Right Side – Early Stance
Right ankle peak M/L force decreased (p=0.0046)
Right ankle A/P force decreased (p=0.0007)
Right hip peak adduction moment decreased (p=0.0004)
Right knee peak flexion moment decreased (p=0.0109)
Right Side – Midstance
Right hip axial compressive force increased (p<0.0001)
Right knee axial compressive force increased (p<0.0001)
Right ankle axial compressive force increased (p<0.0001)
Right Side – Late Stance
Right ankle M/L force decreased (p=0.0063)
Right ankle A/P force decreased (p=0.0003)
Left Side – Early Stance
Left hip M/L force increased immediately after LHS (p=0.0010)
Left hip M/L force remains increased as load transferred (p<0.0001)
Left hip peak A/P force increased (minimum goes more negative)
(p=0.0235)
Left ankle peak M/L force decreased (p=0.0014)
Left hip peak extension moment increased (p=0.0030)

85
Left hip peak adduction moment decreased (p<0.0001)
Left knee peak abduction moment decreased (p=0.0061)
Left Side – Midstance
Left hip M/L Force increased (p<0.0001)
Left hip axial compressive force increased (p<0.0001)
Left knee axial compressive force increased (p<0.0001)
Left ankle axial compressive force increased (p<0.0001)
Left Side - Late Stance
Left hip M/L force increased (p=0.0031)
Discussion
This data confirms that gait kinematics and kinetics undergo immediate changes
upon immobilization of a single knee. The most obvious change in kinematics is at the
immobilized knee itself, which loses all range of motion. The effective length of the limb
(the distance from the hip to most distal point of the foot) cannot be significantly reduced
with the knee unable to bend, requiring subjects to compensate with kinematic changes in
order for the foot to clear the ground during the swing phase of gait. While it may seem
intuitive that increased adduction of the hip of the brace limb could help swing the leg out
to assist in ground clearance, this does not occur. (In fact, there is slightly more abduction,
though it is not statistically significant.)
The purpose of gait is forward motion, but the normal physiological modus
operandi is to optimize energy expenditure by minimizing excess vertical and lateral

86
movement of the body’s center of gravity [68], [69]. Constraints on normal gait, such as
an immobilized knee, will require simultaneous compensations to minimize energy use,
and the gait alterations observed in this study may be understood as interrelated within
this paradigm[69]. The most immediate impact of immobilizing the knee in full extension
was during the two phases of gait where the knee normally flexes the most: midstance
and swing phase (Figure 33). This is consistent with the fact that most of the statistically
significant changes to gait kinematics correspond with these parts of the gait cycle
(Figure 35).
Figure 33 – Knee flexion during Brace trial, showing the significant difference in knee flexion between the left and right sides.
Kinematic compensations are required to assist in clearing the floor with the limb,
as noted previously [70], while simultaneously working to minimize energy expenditure.
This is observable as a delay in the initiation of hip flexion in the right (braced) leg,
immediate dorsiflexion of the ankle following Toe Off, left hip abduction, and a dramatic
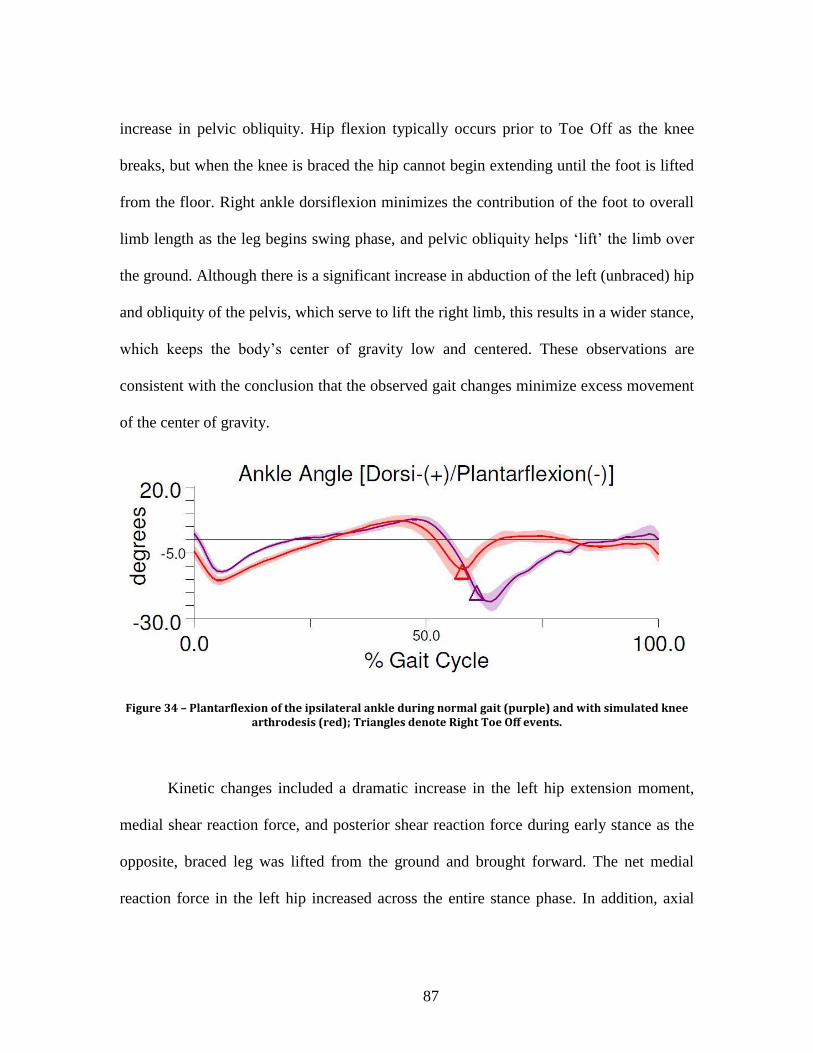
87
increase in pelvic obliquity. Hip flexion typically occurs prior to Toe Off as the knee
breaks, but when the knee is braced the hip cannot begin extending until the foot is lifted
from the floor. Right ankle dorsiflexion minimizes the contribution of the foot to overall
limb length as the leg begins swing phase, and pelvic obliquity helps ‘lift’ the limb over
the ground. Although there is a significant increase in abduction of the left (unbraced) hip
and obliquity of the pelvis, which serve to lift the right limb, this results in a wider stance,
which keeps the body’s center of gravity low and centered. These observations are
consistent with the conclusion that the observed gait changes minimize excess movement
of the center of gravity.
Figure 34 – Plantarflexion of the ipsilateral ankle during normal gait (purple) and with simulated knee arthrodesis (red); Triangles denote Right Toe Off events.
Kinetic changes included a dramatic increase in the left hip extension moment,
medial shear reaction force, and posterior shear reaction force during early stance as the
opposite, braced leg was lifted from the ground and brought forward. The net medial
reaction force in the left hip increased across the entire stance phase. In addition, axial

88
compressive loading during midstance increased in all joints. All other significant
changes to joint kinetics were reductions in the magnitudes of joint reaction forces and
moments. This suggest that contralateral hip extensors play an outsized role in the gait
compensations required to bring forward an immobilized limb, and may help explain
subsequent degeneration of this joint in patients with an arthrodesed knee [5], [11], [38].
Several kinematic and kinetic measures differed significantly from control values
immediately after initial knee immobilization (C1 vs. B1), but were attenuated and no
longer significantly different from control values in subsequent trials (Table 10). This
suggests that acclimation has a limited effect on gait, but that directing subjects to
ambulate 0.4 kilometers (0.25 miles) is sufficient to account for changes that would occur
over a 24 hour immobilization time. This would appear to support the use of short-term
bracing as a model (Table 5) for simulating long term knee immobilization, such as with
knee arthrodesis. One limitation of this model, however, is that it does not take into
account long-term, chronic changes in adjacent joint conditions that could affect patient
kinematics. It is possible that long-term brace immobilization (greater than 24 hours)
would result in significantly altered gait compared to the immediately braced and +24
hour braced knee, although no trends were noted in this study to support this hypothesis.
In spite of the high level of clinical interest in knee arthrodesis, as evidenced by
the large number of published reviews and case reports, there is a notable lack of
available information on the changes to gait kinematics and kinetics induced by the
procedure, and a consequent lack of information on loading patterns at the affected knee.
The goal of traditional methods of knee arthrodesis has been to fuse the femur and tibia

89
directly or with bone graft, and these fusions have generally been robust. This robustness
has meant that there has been little need or benefit to quantifying the loading patterns of a
fused knee, and may explain why there has been little interest in this subject.
When patients lack significant bone stock, however, new approaches to spanning
the joint have been required [9], [33], and at least one total knee replacement like design
has been developed to address knee arthrodesis [31]. With the development of these new
implants, there have been examples of implant failure due to fracture [31], [33], which
may suggest that the loading conditions used to design and test implants for use in knee
immobilization were inadequate. There may be a question of quantifying the mechanics
of knee arthrodesis to be used in the design of such devices. It is likely that the altered
kinematics of arthrodesis gait play a significant role in altering the loading patterns at the
knee. The development of detailed musculoskeletal models, using gait kinematics, has
enabled researchers to create better informed finite element analysis models, and has
been used in the testing of orthopedic implants [71]. Data from this study provides a
robust account of the kinematic and kinetic gait resulting from knee immobilization, and
can be used to assist in future computational modeling and testing of arthrodesis implants
or implants that temporarily simulate arthrodesis.

90
Figure 35 –Phases of the gait cycle where lower body joint kinematics differed significantly from those of normal gait. Each row represents a joint of the lower body as it progresses through a single gait cycle, and is shaded in phases where the joint kinematics of the Experimental condition (right knee braced) differed significantly, in any plane, from the joint kinematics of the Control condition (normal gait). The gait cycle begins and ends with Right Heel Strike events, and Left Toe Off, Left Heel Strike, and Right Toe Off events are indicated with dashed lines. Significant differences at the right knee, which was braced, are more darkly shaded to emphasize its primacy in causing the other changes.
Acknowledgements
The following people are gratefully acknowledged for their assistance in this
work: Roy Davis, Ph.D. and Randy Hutchison, Ph.D. of Furman University, Ray Moss,
Ph.D. of Shriners Hospital for Children, William Bridges, Ph.D., Justin Marro, M.S., and
Taylor Gambin.

91
CHAPTER SEVEN
ESTIMATED JOINT LOADING AT A RIGIDLY CONSTRAINED KNEE
In which the joint loading patterns of a rigidly constrained knee are estimated using a
computational model incorporating musculoskeletal features and geometry.
Hypothesis
Knee joint reaction forces and moments during gait are significantly altered when
the knee is fully constrained.
Abstract
Having established an unmet clinical need in support of a novel implantable
medical device model in Chapters 3 through 5 of this dissertation, and having examined
the kinematic and kinetic changes to gait that such a treatment model would induce in
Chapter 6, this Chapter quantifies the mechanical loading patterns that would be present
at such an implant.
Introduction
Knee arthrodesis, as reviewed in detail in Chapter 4, is a treatment in which the
bones of the upper and lower leg are permanently fused, and may be used to salvage a leg
that would otherwise require amputation. By imposing permanent rigidity at the knee,
arthrodesis provides patients with the stability necessary to ambulate independently. This

92
independence can provide a greater level of function than amputation, as well as a better
quality of life [38].
The inability to bend the arthrodesed knee, however, necessarily affects gait
biomechanics. Some secondary effects of the biomechanical changes resulting from stiff-
knee gait have been demonstrated, including increased energy expenditure and oxygen
consumption [30], [57]-[59], [61], [62], [70], and pain in other joints and the lower back
have been associated with knee arthrodesis. It has been asserted that knee arthrodesis may
induce arthritis in other joints, including the contralateral hip, but no studies have
established this causation or shown a conclusive link between the procedure and
subsequent joint degeneration.
In addition to effects at other joints, there is a question of the robustness of a
rigidly fused joint to bear the loading patterns produced by daily activity, such as during
gait. The long term viability of some methods of knee fusion and their ability to
withstand these loads has been questioned [9], and there have been published cases of
knee arthrodesis implant fracture [31], [33]. It is common for orthopedic implants to
undergo testing, but the in vivo mechanical failure of these implantable medical devices
suggests that the parameters used for testing may have been inadequate. There have been
no publications to date providing estimates of the loading patterns at an immobilized
knee, and it is therefore necessary to undertake this quantification.
Measuring in vivo loading conditions, including the forces in muscles, ligaments,
and joints, however, is often difficult or impossible. Instrumented total hip and total knee
implant designs have been developed and used to acquire in vivo loading data in some

93
patients undergoing hip or knee arthroplasty, but this approach has not been used in knee
fusion. Simplified net joint reaction forces and moments (net effect, neglecting
musculature) can be calculated to balance a given load using an inverse dynamics
approach with knowledge of the following information:
Body/Segment mass properties:
o Mass, m
o Mass moment of inertia, I
Body segment kinematics (from 3D motion capture data):
o Position
o Linear velocity
o Linear acceleration
o Angular Velocity
o Angular acceleration
External forces (such as from force platform data)
This approach underestimates actual joint loads, however, by neglecting the
contributions of musculature. Co-contraction, or simultaneous contraction of antagonist
muscles about a joint, is physiologically common, and increases the magnitude of joint
reaction forces without changing measured kinematics. This increase in magnitude goes
undetected when musculature is ignored [72], [73].

94
Figure 36 – A model with the addition of musculature
The complexity of a biomechanical model can be increased to include
musculature and detailed skeletal geometry Figure 36) using a system of equations of the
following form:
𝐶𝑓 = 𝑟
Where f is a vector of joint and muscle forces, r is a vector representing the external and
inertial forces, and C is a matrix of equation coefficients. In addition to the large increase

95
in computational complexity, however, the redundant nature of musculature increases the
number of unknowns beyond that of the number of equilibrium equations needed to
balance a given set of loading conditions; the result is an unlimited number of potential
solutions. An optimization function based on the minimization of muscle forces, and
requiring that muscle forces are positive (can only contract), takes the following form:
Minimize: 𝐺(𝑓𝑀)
Subject to: 𝐶𝑓 = 𝑟 ; 𝑓𝑖(𝑀)
≥ 0, 𝑖 = 1. . 𝑛(𝑀)
In order to solve this set of equations in a physiologically meaningful way,
assumptions must be made about how the central nervous system recruits muscle
activation. Published musculoskeletal models address this problem with the use of an
optimization function that minimizes the overall muscle forces or muscle stress of the
modeled system [74]-[77]. These functions have generally taken a single form, but with
differences in polynomial order: (linear: p=1 , quadratic: p=2, cubic: p=3 [78]-[80] …
Min/Max: p essentially infinite) (Table 11):
𝐺 = ∑ (𝑓𝑖
𝑁𝑖)
𝑝
𝑖
Where fi is muscle force, Ni is a normalization factor (such as muscle strength), and p is
the order of polynomial. Put simply, the higher the order of polynomial, the more load
sharing by synergistic muscles is predicted, as more highly loaded individual muscle
terms are punished.

96
Optimization Functions in Published Musculoskeletal Modeling Simulations
Publication Type
Grujicic, 2010; [81] Min/Max
Grujicic, 2010; [82] Min/Max
Carbone, 2012; [78] Cubic
Eltoukhy, 2011; [83] Unspecified - “Postpone fatigue”
Grujicic, 2011; [71] Unspecified – same as above
Anderson, 2011; [84] Unknown
Damsgaard, 2006; [77] All of them – balance, none proven
superior
Wagner, 2010; [85] Min/Max – “Minimum effort”
Holmberg, 2008; [76] Min/Max
Erdemir, 2007; [86] Review – Third Order Common for lower
body
Crowninshield, 1981; [79] Third Order
Seireg, 1975 [87] Linear + 4M + Joint Force
Crowninshield, 1978 [88] Linear
Patriario, 1981 Second Order + Power Output
Rohrle, 1984 Linear
Brand, 1986 Third Order
Collins, 1995; Second Order, Linear, Etc.
Pederson, 1997 Third Order
Table 11 – Optimization functions in peer reviewed publications
97
A number of analytical software packages have been developed over the past
several years to assist in the creation and simulation of musculoskeletal models. These
include AnyBody [77], LifeMod [89](since purchased by Smith & Nephew and no longer
publically available), SIMM [90], and Open SIMM [91]. These software packages
facilitate the construction of models and enable dynamic simulations of those models
using motion capture data.
The relevance of any musculoskeletal model is its ability to accurately predict in
vivo loading conditions. Confidence in the ability to do this requires validation of the
model, which is complicated by the fact that models are often constructed to predict
conditions that are difficult or impossible to measure in vivo. The assumptions,
limitations, and uncertainties of a particular model must be assessed for its intended use
[92]. Force and moment data acquired from subjects with instrumented joint
replacements has been published, and this data has been used to validate and improve the
construction of musculoskeletal models for gait analysis that are available to others [74].
Expected loading patterns are an important design parameter in engineered
systems, and have been essential to the design and material selection of modern
orthopedic implants. Musculoskeletal models have allowed researchers to predict how
implanted prosthetics will perform [81], [93], [94], and have been used to assist in the
design of new orthopedic implants [81], [82]. In order to either investigate the
biomechanical effect of knee arthrodesis on other joints, or to accurately predict the
mechanical failure of a knee arthrodesis implant due to local loading conditions, the

98
altered joint biomechanics resulting from knee arthrodesis must be known. These open
questions demonstrate a compelling need for this data, which musculoskeletal modeling
techniques are well suited to provide.
We hypothesize that joint reaction forces and moments at the knee in a patient
with a single fully constrained knee are significantly different from the forces and
moments at the knee in a patient without a fully constrained knee. Changes to gait
kinematics and kinetics resulting from rigid knee immobilization were investigated and
quantified in a study described in Chapter 6, and the kinematic and kinetic data gathered
in that study was then used to construct a computational biomechanical model. This
model was then used to drive a series of dynamic simulations, providing estimates of
lower body reaction forces, including those at the immobilized knee, during walking with
and without a single fully constrained knee.
Materials and Methods
The AnyBody Modeling System (Version 5.2.0) was used to construct a
musculoskeletal model, which was subsequently driven through a series of dynamic
simulations. These simulations were driven by three-dimensional kinematic and kinetic
data obtained from a previously conducted gait analysis study, described in detail in
Chapter 6. That study was designed and conducted to simulate arthrodesis in normal,
healthy subjects using an adjustable locking knee brace, and three dimensional data was
captured using an 8-camera motion capture system (ProReflex MCU 240, Qualsys,
Gothenburg, Sweden) and a ground reaction force platform (LG6-4-1, Advanced
Mechanical Technology, Inc., Newton, Massachusetts).

99
In that study, subjects were first instructed to walk normally, and the gait
kinematics and kinetics captured were used as Control trials. Subjects were then fitted
with an immobilizing brace on their right knee in all cases, and a series of trials were
captured immediately after fitting of the brace, after walking 0.25 miles on a treadmill,
and after walking an additional 0.50 miles on a treadmill. These distances were evaluated
for effects due to acclimation to the immobilization. Three-dimensional motion capture
data and force platform data from the preliminary Control trials (C1) and the third set of
Brace trials (B3) was selected to create and drive a musculoskeletal model through
dynamic simulations, providing estimates of knee joint reaction forces and moments
during gait.
The musculoskeletal model constructed for the purpose of this study was based
upon the Twente Lower Leg Model [95] (Figure 37) consisting of:
19 Rigid Segments – This included 5 segments in each of the lower extremities, 1
pelvis segment, and 8 segments in the spine, thorax, and skull.
8 Joints – The joints provide a total of 72 kinematic constraints to the model, and
allow for 36 axes of rotation.
450+ Muscles – Muscle recruitment works both synergistically and
antagonistically in order to reduce the total effort required by the system and to
provide joint stabilization.
Model attributes, including total height and mass, were set to match those of the
gait subjects from which kinematic and kinetic data was drawn, and the following model

100
segments were scaled to match subject anthropometry based on the placement of motion
tracking markers:
Upper Arm Lengths
Lower Arm Lengths
Trunk Height
Pelvis Width
Thigh Lengths
Shank Lengths

101
Figure 37 – Musculoskeletal model consisting of 19 rigid segments, 18 joints, and 450+ muscles. The force platform, ground reaction force vector, and motion tracking markers are also visualized.
The model was used to run a series of dynamic simulations, including both
normal and immobilized-knee gait. Fused knee conditions were simulated using a driver
that locked the rotation of the right thigh and shank with respect to each other, and

102
determined the resultant joint moments.
Static optimization was used to calculate muscle activation at each time step of
the simulation by minimizing the following fifth order objective function:
𝐺 = ∑ (𝑓𝑖
𝑁𝑖)
5
𝑖
Where fi is force of the muscle and Ni is the normalization factor of the muscle
[77]. The following lower limb muscle forces, joint reaction forces, and joint moments
were collected for each trial (Control and Brace).
Ankle
Joint Contact Forces
o Proximal-Distal
o Medial-Lateral
o Anterior-Posterior
Joint Moments
o Plantarflexion/Dorsiflexion
o Subtalar Inversion/Eversion
o Axial (Forefoot Adduction/Abduction)
Knee
Joint Contact Forces
o Proximal-Distal
o Medial-Lateral
o Anterior-Posterior

103
Joint Moments
o Flexion/Extension
o Adduction/Abduction
o Internal/External Rotation
Hip
Joint Contact Forces
o Proximal-Distal
o Medial-Lateral
o Anterior-Posterior
Joint Moments
o Flexion/Extension
o Adduction/Abduction
o Axial (Internal/External Rotation)
Muscle Forces
Quadriceps
o Rectus Femoris
o Vastus Lateralis
o Vastus Medialis
o Vastus Intermedius
Sartorius
Biceps Femoris
Semitendinosus

104
Semimembranosus
Gastrocnemius
Soleus
Statistical Analysis
Data analysis was performed using SAS software (Version 9 of the SAS System
for Windows. Copyright 2013 SAS Institute Inc. SAS and all other SAS Institute Inc.
product or service names are registered trademarks or trademarks of SAS Institute Inc.,
Cary, NC, USA.) A complete SAS program was coded to simplify analysis and to
facilitate future investigations of similar nature, and it is provided in the Appendices.
Figure 38 – Display of heading code used in AnyBody to drive the musculoskeletal simulations

105
Joint force and joint moment values of interest (e.g. peak Anterior-Posterior knee
force during late stance) were calculated by determining the minimum, maximum, mean,
or range of force/moment values within a specific range of the gait cycle. The times
where minimum and maximum values occurred (in percent gait cycle) were also recorded
and compared (e.g. peak Anterior-Posterior knee force during late stance was determined
by finding the maximum value of the Anterior-Posterior knee force between 40% and
60% of the gait cycle and the moment when that maximum occurred in each trial.) Each
value of interest was determined for every trial, and comparison of experimental
conditions (Control vs. Immobilized Knee) and sides (left/right) was performed using
analysis of variance followed by Fisher’s Pairwise Comparison. A value of α<0.05 was
considered statistically significant for all measures.
Results
Joint forces, joint moments, and muscle forces were quantified, and mean values
(± standard deviation) for data from Control and Knee Immobilization trials are
visualized below with respect to the gait cycle. Statistically significant changes to joint
contact forces, joint moments, and muscle forces were observed when the right knee was
immobilized. Areas where values of interest were examined are shaded, and the location
of statistically significant differences are indicated with an (*). Detailed changes are
described for each joint.
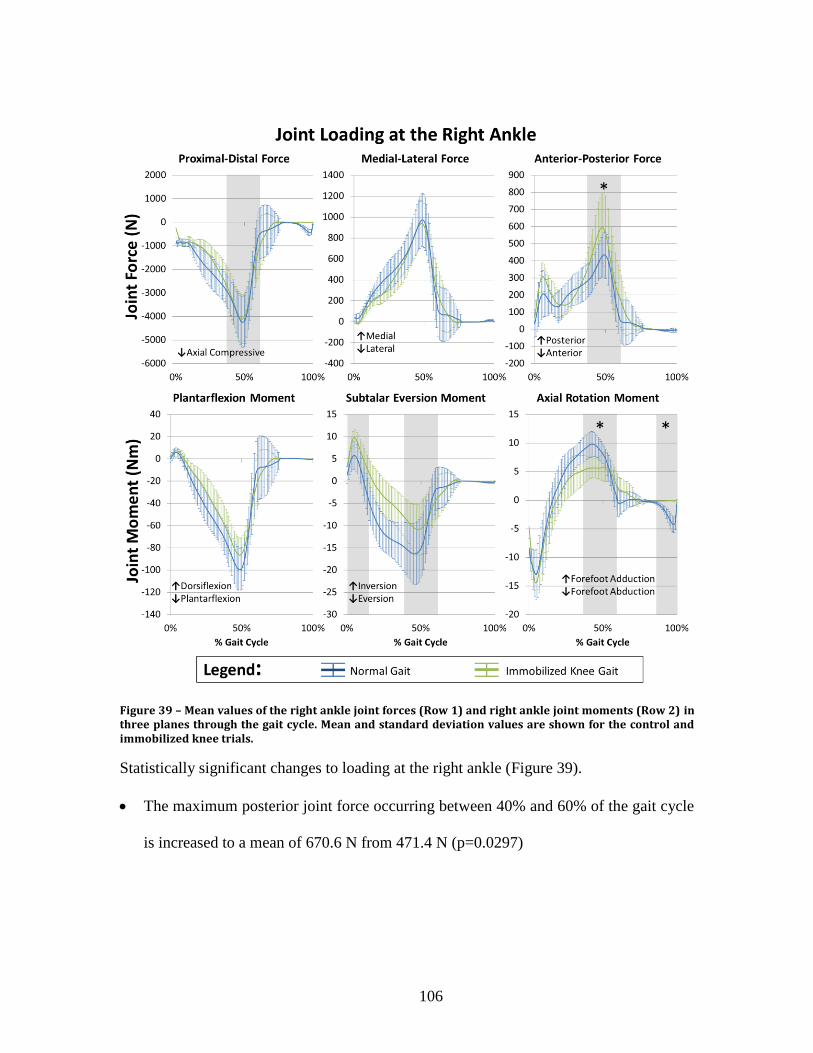
106
Figure 39 – Mean values of the right ankle joint forces (Row 1) and right ankle joint moments (Row 2) in three planes through the gait cycle. Mean and standard deviation values are shown for the control and immobilized knee trials.
Statistically significant changes to loading at the right ankle (Figure 39).
The maximum posterior joint force occurring between 40% and 60% of the gait cycle
is increased to a mean of 670.6 N from 471.4 N (p=0.0297)

107
The maximum forefoot adduction moment occurring between 40% and 60% of the
gait cycle is decreased to a mean of 6.7 Nm from 10.4 Nm (p=0.0214) and occurs
later in the gait cycle (p<0.0001)
The minimum forefoot adduction moment occurring between 90% and 100% of the
gait cycle is reduced to a mean of -0.156 Nm from -4.3 Nm (p=0.0014)

108
Figure 40 – Mean values of the right knee joint forces (Row 1) and right knee joint moments (Row 2) in three planes through the gait cycle. Mean and standard deviation values are shown for the control and immobilized knee trials.
Statistically significant changes to loading at the right knee (Figure 40).
The peak compression joint force occurring between 5% and 20% of the gait cycle is
reduced to -1180.0 Nm from -1534.7 Nm (p<0.0001)
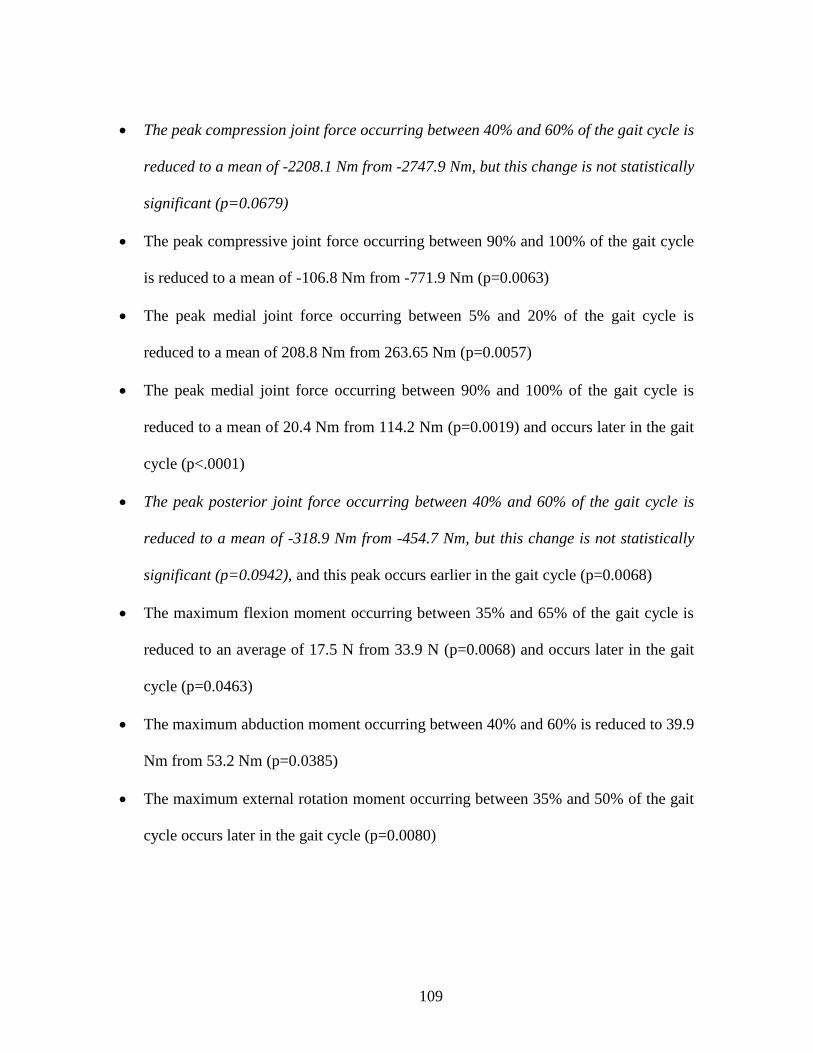
109
The peak compression joint force occurring between 40% and 60% of the gait cycle is
reduced to a mean of -2208.1 Nm from -2747.9 Nm, but this change is not statistically
significant (p=0.0679)
The peak compressive joint force occurring between 90% and 100% of the gait cycle
is reduced to a mean of -106.8 Nm from -771.9 Nm (p=0.0063)
The peak medial joint force occurring between 5% and 20% of the gait cycle is
reduced to a mean of 208.8 Nm from 263.65 Nm (p=0.0057)
The peak medial joint force occurring between 90% and 100% of the gait cycle is
reduced to a mean of 20.4 Nm from 114.2 Nm (p=0.0019) and occurs later in the gait
cycle (p<.0001)
The peak posterior joint force occurring between 40% and 60% of the gait cycle is
reduced to a mean of -318.9 Nm from -454.7 Nm, but this change is not statistically
significant (p=0.0942), and this peak occurs earlier in the gait cycle (p=0.0068)
The maximum flexion moment occurring between 35% and 65% of the gait cycle is
reduced to an average of 17.5 N from 33.9 N (p=0.0068) and occurs later in the gait
cycle (p=0.0463)
The maximum abduction moment occurring between 40% and 60% is reduced to 39.9
Nm from 53.2 Nm (p=0.0385)
The maximum external rotation moment occurring between 35% and 50% of the gait
cycle occurs later in the gait cycle (p=0.0080)

110
The peak internal rotation moment occurring between 50% and 60% of the gait cycle
is lost. The moment is increased to an 3.7 Nm external rotation moment from a 5.5
Nm internal rotation moment (p=0.0123)

111
Figure 41 – Mean values of the right hip joint forces (Row 1) and right hip joint moments (Row 2) in three planes through the gait cycle. Mean and standard deviation values are shown for the control and immobilized knee trials.
Statistically significant changes to loading at the right hip (Figure 41).
The minimum compressive joint load occurring between 10% and 45% of the gait
cycle was reduced to a mean of 1075.9 N from 1507.8 N (p=0.0096)
The maximum compressive joint force occurring between 40% and 60% of the gait
cycle is reduced to a mean of 2420.9 N from 3341.5 N (p=0.0357)

112
The maximum anterior joint force occurring between 5% and 20% of the gait cycle
was reduced to a mean of 42.5 N from 227.5 N (p=0.0059)
The minimum A-P joint force occurring between 20% and 40% of the gait cycle
reversed direction and increased in magnitude to a mean 72.8 N posterior force from
a 9.9 N anterior force (p=0.0162)
The maximum anterior joint force occurring between 40% and 75% of the gait cycle
occurred later in the gait cycle (p=0.0301)
The maximum internal rotation moment occurring between 0% and 20% of the gait
cycle increased to 23.2 Nm from 17.0 Nm (p=0.0355)

113
Figure 42– Mean values of the left ankle joint forces (Row 1) and left ankle joint moments (Row 2) in three planes through the gait cycle. Mean and standard deviation values are shown for the control and immobilized knee trials.
No statistically significant changes to joint loading were observed at the left ankle
(Figure 42).
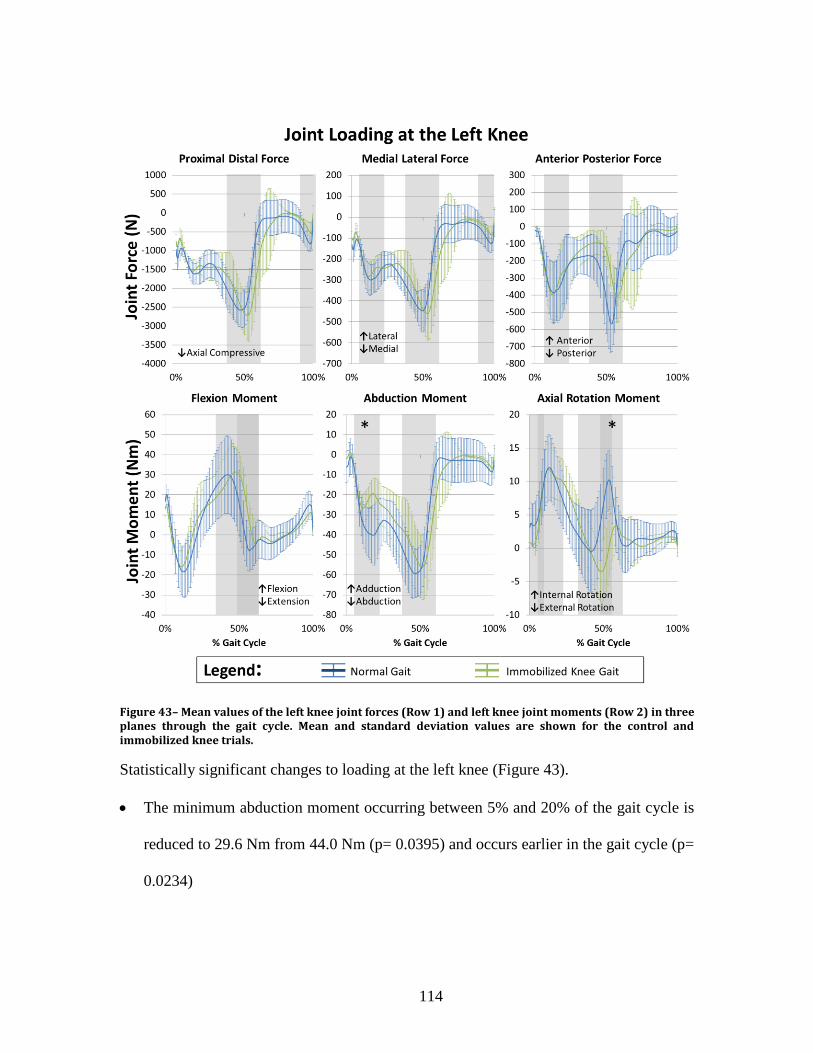
114
Figure 43– Mean values of the left knee joint forces (Row 1) and left knee joint moments (Row 2) in three planes through the gait cycle. Mean and standard deviation values are shown for the control and immobilized knee trials.
Statistically significant changes to loading at the left knee (Figure 43).
The minimum abduction moment occurring between 5% and 20% of the gait cycle is
reduced to 29.6 Nm from 44.0 Nm (p= 0.0395) and occurs earlier in the gait cycle (p=
0.0234)

115
The maximum internal rotation moment occurring between 50% and 60% of the gait
cycle is reduced to 4.5 Nm from 10.7 Nm (p= 0.0281) and occurs earlier in the gait
cycle (p= 0.0236)

116
Figure 44– Mean values of the left hip joint forces (Row 1) and left hip joint moments (Row 2) in three planes through the gait cycle. Mean and standard deviation values are shown for the control and immobilized knee trials.
Statistically significant changes to loading at the left hip (Figure 44).
The maximum anterior joint force occurring between 5% and 20% of the gait cycle is
reduced to 329.4 N from 391.2 N (p<0.0001)
The maximum abduction moment occurring between 0% and 20% of the gait cycle
was reduced to a mean of 40.6 Nm from 58.0 Nm (p=0.0474)

117
Figure 45 – Mean tensile force of the muscles spanning the right knee during gait. Mean and standard deviation are shown for the control and immobilized knee trials.

118
Statistically significant changes to force in muscles spanning the right knee (Figure 45).
The maximum force occurring in the right Vastus Lateralis between 0% and 25% of
the gait cycle was reduced to a mean of 6.0 N from 172.8 N (p=0.0125)
The maximum force occurring in the right Vastus Medialis between 0% and 25% of
the gait cycle was reduced to a mean of 4.5 N from 111.0 N (p= 0.0183)
The maximum force occurring in the right Vastus Intermedius between 0% and 25%
of the gait cycle was reduced to a mean of 2.9 N from 69.5 N (p= 0.0128)
The maximum force occurring in the right Sartorius between 40% and 70% of the gait
cycle was reduced to a mean of 122.7 N from 178.9 N (p=0.0434)
The maximum force occurring in the right Sartorius between 90% and 100% of the
gait cycle was reduced to a mean of 1.9 N from 39.5 N (p=0.0013)
The maximum force occurring in the right Biceps Femoris between 0% and 20% of
the gait cycle was reduced to 208.7 N from 400.5 N (p<.0001)
The maximum force occurring in the right Biceps Femoris between 40% and 55% of
the gait cycle was reduced to null from 114.2 N (p<0.0001)
The maximum force occuring in the right Biceps Femoris 3 between 90% and 100%
of the gait cycle was reduced to 66.7 N from 229.1 N (p=0.0216)
The maximum force occurring in the right Semitendinosus between 0% and 15% of
the gait cycle was reduced to 85.3 N from 234.0 N (p=<.0001)
The maximum force occurring in the right Semitendinosus between 25% and 45% of
the gait cycle was reduced to null from 154.8 N (p=0.0047)

119
The maximum force occurring in the right Semitendinosus between 90% and 100% of
the gait cycle was reduced to 29.5 N from 138.1 N (p=0.0137)
The maximum force occurring in the right Semimembranosus between 0% and 15%
of the gait cycle was reduced to 108.8 N from 262.0 N (p<.0001)
The maximum force occurring in the right Semimembranosus between 35% and 45%
of the gait cycle was reduced to null from 201.8 N (p=0.0006)
The maximum force occurring in the right Semimembranosus between 90% and
100% of the gait cycle was reduced to 35.4 N from 154.2 N (p=0.0148)
The maximum force occurring in the right Gastrocnemius between 30% and 65% of
the gait cycle was reduced to 1121.2 N from 1623.8 N (p=0.0093)

120
Figure 46 – Mean tensile force of the muscles spanning the left knee during gait. Mean and standard deviation are shown for the control and immobilized knee trials.
121
Statistically significant changes to force in muscles spanning the left knee (Figure 46).
The maximum force occurring in the left Biceps Femoris between 0% and 20% of the
gait cycle was reduced to 314.2 N from 371.6 N (p=0.0346)
The maximum force occurring in the left Semimembranosus between 0% and 15% of
the gait cycle was reduced to 185.6 N from 262.0 N (p=0.0318)

122
Discussion
The greatest number of significant changes to joint and muscle loading occurred
in the immobilized (right) leg, with more changes occurring at the right knee than any
other joint. No statistically significant changes were observed at the left ankle, and only
two changes each were observed at the left knee and hip, all of which were reductions in
magnitude. Only two joint loads increased in magnitude when the knee was immobilized
– the maximum posterior force occurring at the right ankle, and the maximum internal
rotation moment at the right hip. Two loads reversed direction – during the right stance
phase of gait, the joint reaction force at the right hip became a posterior force rather than
an anterior force, and as the subjects neared the Right Toe Off phase of gait, the axial
rotation moment at the right knee remained an external rotation moment rather than
reversing direction to peak in an internal rotation moment. The remainder of the
statistically significant changes to joint and muscle loading were reductions in magnitude.
These results have positive implications for the concern that immobilized knee
gait, such as that resulting from knee arthrodesis, induces damage to these joints. This
damage and joint degradation has been asserted by a number of publications [5], [10],
[11], [52], but thus far no data has been presented to support it. The present study finds
that lower body joint loading, which has been linked to osteoarthritis [96], [97], is
generally reduced as a result of rigid knee immobilization, failing to support the assertion
that this immobilization induces damage to these joints. It is possible that damage to
these joints may occur as a result of other factors, including loading rate or impact [98],

123
deviation from normal loading patterns, or a reduced range of motion resulting in load
concentrations, but these were not investigated and would require further study.
It is likely that walking speed played a role in these reductions [99]. Subjects
walked at a self-selected speed in the gait analysis study, and as demonstrated in the
previous chapter, this resulted in a reduction in speed during the immobilized knee
condition. Since speed was not a controlled variable, it is impossible to know the exact
contribution to the reductions in joint and muscle loading – this is irrelevant to the aim of
the current study, however, the purpose of which was to quantify and determine changes
to joint and muscle loading due to knee immobilization. Since a reduction in walking
speed occurs as a result of immobilization, and is likely to similarly occur in patients who
undergo knee arthrodesis, it was important to incorporate this reduction in speed into the
simulations.
Particularly notable among the changes induced by immobilization of the knee
was the effect on quadriceps forces (Figure 45). Forces in the vastus lateralis, vastus
intermedius, and vastus medialis muscles were effectively reduced to zero, while loading
of the rectus femoris took on a dramatically altered pattern. Reduction of vasti forces is
readily explained; the origin of each lies on the femur, and they all share insertion into
the tibia via patellar ligament via the patella via the quadriceps tendon. With the femur
and tibia fused, preempting any degree of knee extension, activation of these muscles
contributes nothing to kinematics. The altered loading pattern of the rectus femoris, with
an origin at the anterior inferior iliac spine, is a result of its increased contribution to hip
flexion (as resistance to hip extension). Comparison to the hip flexion angle of Figure 28

124
in Chapter 6 is illustrative; rectus femoris force increases with eccentric contraction as
the hip extends, peaking as the hip reaches its peak extension angle and begins to flex.
While this result makes sense mechanically, and is intuitively predictable when
using the given musculoskeletal modeling parameters, it is unknown whether it is
physiologically accurate. Synergistic recruitment of the vasti resulting from paired
muscle innervation may result in varying levels of vasti interaction, in spite of the
complete lack of functional benefit. Clinically, patients who undergo knee arthrodesis
and then subsequent reversal demonstrate an extensive reduction in quadriceps muscle
strength [12], [44], [45] consistent with muscular disuse atrophy, and supportive of the
results of the present simulation.
Surface electromyography could provide some measure of muscle activation for
comparison against these results; the use of surface electromyography was explored
during the design of the gait study giving rise to the data used to drive these simulations,
and it was collected from some subjects, but the data was not ultimately usable.
Regardless, the muscle activation patterns of subjects who have been temporarily fitted
with an immobilizing brace are likely to be different from those of patients who have
undergone long-term knee fusion, making the relevance of such data questionable. One
potential method of validating the predicted quadriceps activity is the use of surface
electromyography to measure quadriceps activation during gait in patients who have
undergone permanent knee arthrodesis, but no data of this type is presently available.
The present research has significant implications for the clinical decision making
process regarding knee arthrodesis, as well as the development and testing of rigid knee

125
implants. Concern over subsequent damage to other joints resulting from knee arthrodesis
may be overblown, a result of conservatives estimates due to a lack of data. These results
support the reduction of the weight of this concern as a factor weighing against a decision
to performing knee fusion. In as much as this factor has reduced the incidence of knee
arthrodesis, as explored in Chapter 5, this work may serve to increase the number of knee
arthrodesis procedures performed. Joint loading values during gait with an immobilized
knee have been heretofore unquantified – this data may be used as input parameters for
the testing of rigid knee implants by means of finite element analysis or benchtop
mechanical testing. This may help prevent mechanical failure of rigid knee implants, as
reported in literature, in future implant designs.
Acknowledgements
The following people are gratefully acknowledged for their assistance in this
work: John O’Donnell, Taylor Gambon.

126
CHAPTER EIGHT
DESIGN OF AN IMPLANTABLE DEVICE TO SATISFY THE PROPOSED
TREATMENT MODEL
A surgical treatment model is designed as an alternative to knee arthrodesis, and
preliminary development work is undertaken to assist in the licensing and clinical
translation of said treatment model.
Abstract
Having identified severe knee dysfunction as an inadequately addressed condition
in patients, a novel treatment model is proposed. The constraints of this model require
that it provide a patient with a weakened or missing knee extensor mechanism the
stability to ambulate independently, such as with knee arthrodesis, while allowing the
patient to otherwise bend the knee. Design of the proposed treatment model occurred
over the course of several years, included development of functional prototypes, and was
guided by the regulatory requirements for the design of medical devices in the United
States. Two patent applications have been filed with the United States Patent and
Trademark Office for protection of the intellectual property generated from this work,
and the Clemson University Research Foundation is actively seeking to license this work
for clinical translation.

127
Present Need
Severe knee dysfunction can interfere with patient independence, quality of life,
and mental health, and current treatment options often leave patients and surgeons to
choose between poor alternatives. These alternatives, explored in detail in Chapter 4,
require that patients have adequate remaining anatomy and strength for knee stability
with a total knee replacement, or else provide complete stability at the expense of
permanent knee immobilization. While existing total knee replacement designs provide
varying levels of mechanical stability at the expense of natural knee kinematics, no
designs compensate for extensor mechanism damage or weakness [100]. When this
stability is required, the most viable treatment option, arthrodesis, eliminates all
movement at the knee. The resulting loss of function and poor outcome measures relative
to unaffected patients often conflict with patients’ expectations for surgery. Patients may
strongly resist the selection of knee arthrodesis as treatment, in spite of the high risk and
poor prospects of salvage total knee replacement. This results in an ethical dilemma for
surgeons, who must weigh the benefits of arthrodesis against the low probability of
success of salvage total knee replacement in this patient subset [8].
Initial collaboration with two practicing orthopedic surgeons, Frank Voss, M.D.
of USC Medical School in Columbia, SC, and Kim Chillag, M.D. of the Moore Center
for Orthopedics in Columbia, SC, resulted in the proposal of a theoretically superior
alternative treatment that would provide both complete stability and an ability to flex the
knee. Such a treatment could compensate for lost anatomy or strength during ambulation

128
and standing activities, but could otherwise allow a patient to flex the knee so as to
minimize interference with other activities of daily living.
The initial proposal, by Kim Chillag, M.D., took the form of a total knee
replacement that could be locked in full extension to provide the stability necessary to
walk, but that could otherwise be unlocked to allow the patient to flex the knee. This
initial concept utilized a “sliding lock pin” which would reside fully within the femoral
component during knee flexion, and which could, with the assistance of gravity, slide
down into a recess within the tibial component when the user fully extended their knee
(Figure 47). This design would require that the patient lift their fully extended leg until
the tibia was raised above the femur so that the pin could slide back into the femoral
component with the assistance of gravity, in order to unlock and allow the patient to
again flex the knee.
Figure 47 – Device Prototype – Preliminary drawing of a total knee replacement with a sliding lock pin, as proposed by Kim Chillag, M.D.

129
Design Controls
While the initially proposed design embodied the core elements of the
theoretically superior treatment alternative, practical limitations interfered with its
viability, e.g. the physical capability of a patient with severe knee dysfunction to
disengage the locking mechanism by lifting his fully extended leg above parallel with the
ground. In addition to the core design requirements, a clinically viable alternative
treatment must satisfy a number of additional elements, including requirements of the
surgeons, patients, and the relevant regulatory authority. One can best account for this by
using a structured design process. Federal regulations govern the design of medical
devices in the United States, overseen by the Food and Drug Administration (FDA), and
these regulations are located in Title 21 of the Code of Federal Regulations, Part 820,
Subsection 30 - Design Controls. This subsection was used as a guide to assist this work
throughout the design process.
Criteria for the physical and performance requirements of the desired design
solution were developed in collaboration with the clinician partners, and while not
formalized, were used as a set of Design Inputs [820.30(f)] (Table 12).

130
Example Design Inputs
Functional /
Performance
Must enable patients with deficient or missing quadriceps
mechanisms to walk
Should flex freely when a patient is sitting, lying down, or
otherwise inactive.
Design should not require invasive interaction.
Similar Designs Must provide stable interface suitable for bone-PMMA cement
adhesion.
Must interface with variable length bone augments or
intramedullary stems.
Design should be as durable as existing salvage total knee
replacement designs.
Regulatory The design should be manufactured from materials used in
previously cleared or approved medical devices for use in the
knee.
Output from Risk
Management
Implant design should minimize the risk of failure of the
locking mechanism during walking.
The device should remain locked until the patient takes specific
action to unlock it. It cannot accidentally unlock while walking.
Implant geometry should prevent the locking mechanism from
engaging when the device is not in full extension.
Other Essential Design
Requirements
The design should interface with an existing modular total knee
replacement platform to assist in translation/licensing. Table 12 – Design inputs for the proposed treatment model

131
Design Review meetings, as prescribed by 21 CFR 820.30(e), were conducted
periodically throughout the design process, and included our clinical partners. The
purpose of these meetings was to ensure that all relevant design requirements were
identified, that the proposed designs satisfied these requirements, and to prioritize further
work. Design Review meetings were conducted on the follow dates:
Tuesday, August 10, 2010
Friday, September 24, 2010
Wednesday, October 20, 2010
Tuesday, November 9, 2010
Friday, January 14, 2011
Friday, April 1, 2011
Friday, October 21, 2011
Friday, January 13, 2012
Friday, March 30, 2012
Friday, April 27, 2012
Friday, October 25, 2013

132
Prior Art Review
In addition to satisfying the design requirements, the commercial viability of any
proposed device is highly dependent on the current intellectual property landscape. Any
similarity of the developed work to existing intellectual property held by others may
require license of said IP, and could prove to be an insurmountable barrier to
commercialization. Ideally, the intellectual property of any proposed treatment method
would also be protectable, providing value and an incentive to commercialization.
A diligent prior art review was conducted, and similarity to the desired treatment
model was found in three general categories of technologies: external knee braces,
prosthetic limbs (for transfemoral amputees), and implantable knee joint replacements.
There was no more than a moderate degree of similarity between the proposed device and
existing technology (Table 13).
The most relevant limitations on device design are those of total knee replacement
designs, which can be found under US Patent Class 623, “Prosthesis (i.e. artificial body
members), parts therof, or aids and accessories therefor”, within subclass “Implantable
Prosthesis” (11.11) and subclass “Joint Bone” (18.11). Here, relevant subclasses include
“With Magnet” (18.12) and “Knee Joint Bone (20.14). All categories within the 20.14
parent were searched, including “Constrained Joint” (Class 623/20.24), “Including an
intermediate member” (20.28), “Movable” (20.29), and “Moveable Bearing” (20.33).

133
Prior Art Review
Description of Prior
Art
Type Degree of
Similarity
Primary Differentiator(s) of Our Technology
Surgically Implantable Devices
Anatomical Motion
Hinged Prosthesis /
US 12/307,102
Patent
App.
Low One example of an industry standard hinge and
rotating platform design. Other examples can be
found in 623/20.24, 20.25, 20.28, 20.29. Our
device locks in extension as an improvement upon
arthrodesis, negating the purpose for the various
changes/improvements to hinged/rotating designs.
Orthopaedic knee
fusion apparatus /
5,108,398
Issued
Patent
Low Our device does not assist in bone-to-bone fusion,
but rather replaces the need for it.
Knee Arthrodesis
Implant / US
13/061,415
Patent
App.
Low This device is one example of many that serve to
permanently fuse the femur and tibia. Our device
resembles a total knee replacement, providing
knee flexion as desired. This prior art offers no
advantages over a successful knee fusion.
The Stanmore Knee
Arthrodesis
Prosthesis / 2010
Journal
Article
Moderate This device is one many that permanently fuse the
knee, preventing any motion. Our device
resembles a total knee replacement, providing
knee flexion as desired. This prior art offers no
advantages over a successful knee fusion.
Surgical Distraction
Device / US
6,849,076
Issued
Patent
Low Similarity: Our device will use an internal magnet
in a knee implant, and will require an external
magnetic field to actuate the locking mechanism.
Differentiator: Everything else.
Prosthetic Limbs for Transfemoral Amputees
Artificial knee / US
4,756,713
Issued
Patent
Low Our device is surgically implanted, and the
locking mechanism is distinct.
Above-Knee Prosthesis
With Variable Resistance
Knee Joint / US
10/707,732
Issued
Patent
Low Our device is surgically implanted, and the
locking mechanism is distinct.
Stabilized artificial knee
mechanism / US 4,206,519
Issued
Patent
Low Our device is surgically implanted, and the
locking mechanism is distinct.
External Knee Braces
Self-Locking and
Unlocking Pivot / US
2646793
Issued
Patent
Low Our device is surgically implanted, and the
locking mechanism is distinct.
Locking Knee Joint for
Orthopaedic Brace /
3,826,251
Issued
Patent
Low Our device is surgically implanted, and the
locking mechanism is distinct.
Automatic locking orthotic
knee device / 5,267,950
Issued
Patent
Low Our device is surgically implanted, and the
locking mechanism is distinct. Table 13 – Existing intellectual property with a minimum of a low degree of similarity to the proposed
treatment model.
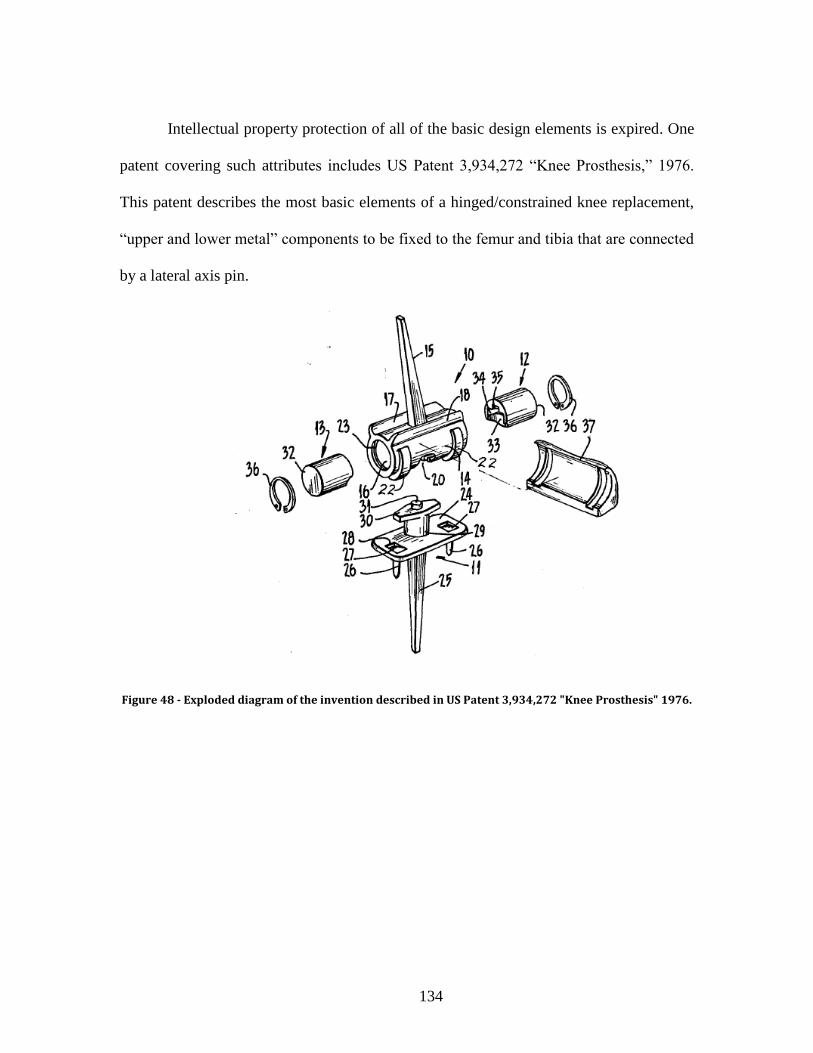
134
Intellectual property protection of all of the basic design elements is expired. One
patent covering such attributes includes US Patent 3,934,272 “Knee Prosthesis,” 1976.
This patent describes the most basic elements of a hinged/constrained knee replacement,
“upper and lower metal” components to be fixed to the femur and tibia that are connected
by a lateral axis pin.
Figure 48 - Exploded diagram of the invention described in US Patent 3,934,272 "Knee Prosthesis" 1976.

135
In addition to the basic elements of a hinged/constrained knee design, US Patent
4,262,368, “Rotating and Hinged Knee Prosthesis,” 1981 describes an implant that
includes a rotating bearing that allows for internal/external rotation. In addition to the
essential femoral and tibial components and a lateral axis pin constraining motion outside
of the flexion/extension axis of the implant, this patent describes a proximal-distal pin
and bushing that constrain motion outside of the internal-external rotation axis.
Figure 49 - Exploded diagram of the invention described in US Patent 4,262,368 "Rotating and Hinged Knee Prosthesis" 1981.
The results of this preliminary prior art review show that intellectual property
protection the most basic design elements has expired, allowing a wide freedom to
operate.
136
Prototyping and Preliminary Designs
The Frank H. Stelling and C. Dayton Riddle Orthopaedic Education and Research
Laboratory, located within CUBEInC, was the primary base of operations for design of
the proposed treatment model. Design of an alternative treatment was undertaken within
the confines of the proposed design inputs, resulting in a number of competing alternative
proposals. SolidWorks 3D modeling software was used to create and convey
representations of the proposed device designs, and a ProJect SD 3000 (3D Systems,
Rock Hill, SC) (Figure 51), located within CUBEInC, was used to create rapid prototypes
for proof of concept. Several device designs were developed, each of which was intended
to provide the beneficial stability of knee fusion without the drawbacks associated with a
permanently fused knee. Several of these designs are described in detail below.
Figure 50 – Design work was based in the Frank H. Stelling and C. Dayton Riddle Orthopaedic Education and Rearch Laboratory at CUBEInC, in Greenville, South Carolina

137
Figure 51 – Rapid techniques, using the on-site ProJet 3000 system, assisted in the design process
Dropping Pin
This design, developed by Dr. Kim Chillag, was established prior to the
collaborative research effort. It uses an internal locking pin and is assisted by gravity
(Figure 47). The femoral and tibial components of this design have internal channels,
which hold the pin, and can slide freely along the proximal/distal axis. When the user
moves his leg to full extension, the pin may translate distally with the assistance of
gravity, allowing the pin to reside within the femoral and tibial channels simultaneously.
In this position, the pin prevents flexion of the joint. When the user wishes to resume
flexion, he may raise his leg above parallel with the ground to allow gravity to assist the
pin to fully return to the channel of the femoral component.

138
Cam Lock
The femoral component of this design has the curvature of a cam in the sagittal
plane, allowing for complete freedom of rotation in flexion, a very tight fit in mid-flexion,
and a stable fit in complete extension (Figure 52). There are internal springs which
compress as the hinge component of the design rises vertically. As the femoral
component (cam) rotates, the variable distances of the articulating surface from the hinge
axis causes the component to rise and fall.
In order to move from flexion to extension, the user must overcome the force of
internal springs. The distance from the hinge axis to the articular surface increases as the
device moves into midflexion, causing spring compression. As the device continues to
move into full extension, the distance from the hinge to the articulating surface decreases,
and spring tension is relieved. In addition to the lower energy state of the spring, the
increased congruency between the femoral and tibial components (flat on flat) assists in
maintaining full extension. In order to flex the knee, sufficient rotational force must be
applied to overcome spring tension to return the device to flexion.
Figure 52 – Device Prototypes - Cam-Lock design utilizing variable flexion radius and spring

139
Proximal-Distal Magnet
This design is based on a typical hinged knee device, but utilizes magnets to keep
the femoral and tibial components in contact in full extension. Magnets fully embedded
in the femoral component line up with magnets embedded within the tibial component
when the device is rotated into full extension. This generates continuous attractive force
that serves to pulls the femoral and tibial components together. This results in some
degree of compression of the conforming articular surfaces, and flexion is countered by
magnetic attraction. In order the flex the knee, the patient must apply sufficient flexion
force, which may be supplied by an external brace.
Figure 53 – Device Prototypes – Rapid Prototype of the Proximal-Distal Magnet design
Medial-Lateral Magnet
This design is also based on a typical hinged knee device, but utilizes magnets to
keep the femoral and tibial components in full extension. Four magnets are embedded in

140
the femoral and tibial component, two in each, in such a way as to be lined up when the
device rotation is at full extension. The magnets are rigidly attached to their respective
knee components. The four magnets are aligned in a single axis when in full extension,
where the device maintains the most stable position within the magnetic field. The lowest
energy state of the device is reached when in full extension, allowing the device to resist
flexion during stiff gait walking. When the user wishes to flex the device, force sufficient
to overcome the magnetic field is applied.
Figure 54 – Device Prototypes – Rapid prototype of the Medial-Lateral Magnet design
Pushbutton Latch
Once the user moves this knee design into full extension it mechanically locks,
requiring actuation of a pushbutton to release the device back into flexion. A spring-
loaded latch rests in the center of the tibial component, between the femoral condyles. As
the femoral component moves into extension, an angled surface pushes the latch back,
compressing the spring. In full extension, the latch reaches a recessed area of the femoral
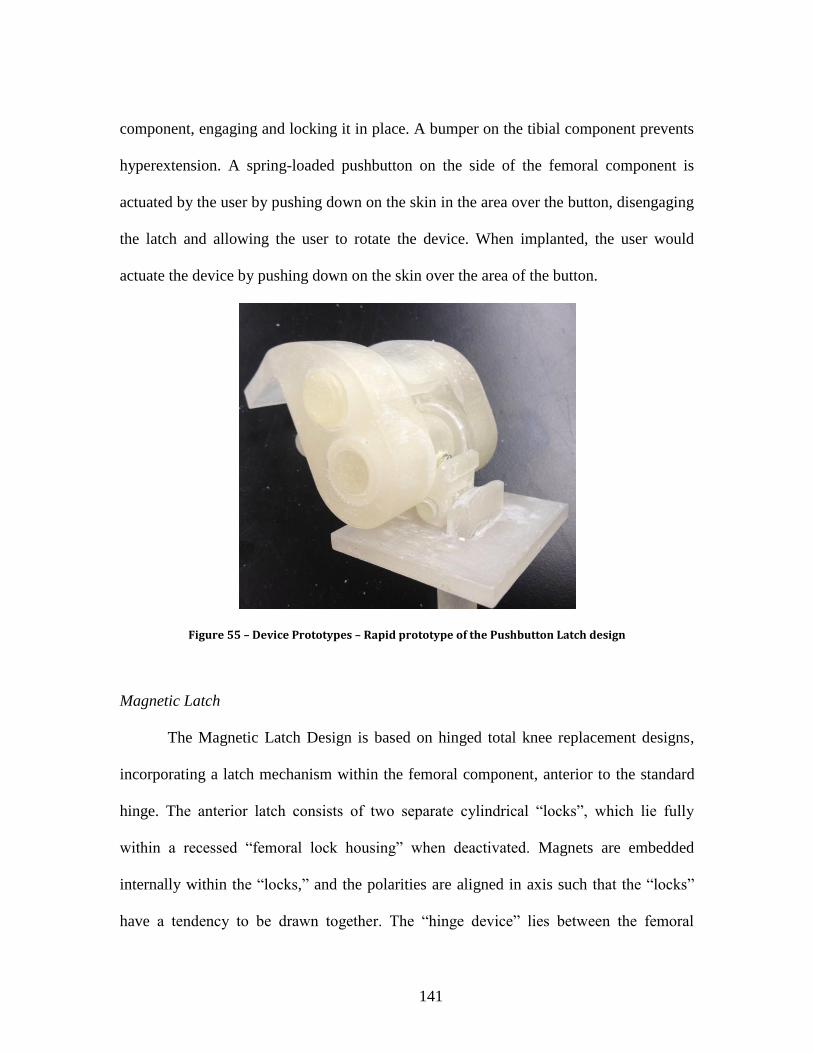
141
component, engaging and locking it in place. A bumper on the tibial component prevents
hyperextension. A spring-loaded pushbutton on the side of the femoral component is
actuated by the user by pushing down on the skin in the area over the button, disengaging
the latch and allowing the user to rotate the device. When implanted, the user would
actuate the device by pushing down on the skin over the area of the button.
Figure 55 – Device Prototypes – Rapid prototype of the Pushbutton Latch design
Magnetic Latch
The Magnetic Latch Design is based on hinged total knee replacement designs,
incorporating a latch mechanism within the femoral component, anterior to the standard
hinge. The anterior latch consists of two separate cylindrical “locks”, which lie fully
within a recessed “femoral lock housing” when deactivated. Magnets are embedded
internally within the “locks,” and the polarities are aligned in axis such that the “locks”
have a tendency to be drawn together. The “hinge device” lies between the femoral

142
condyles and partially covers the “femoral lock housing”, preventing the “locks” from
moving beyond the recess of the “femoral lock housing” in the femoral component.
When the knee is rotated to full extension, the locks line up with a matching “hinge lock
recess” within the “hinge device.” This prevents the device from locking in place unless
the user has aligned the knee in extension.
Figure 56 – Device Prototypes – CAD rendering of the Magnetic Latch design
The device may be locked in extension by briefly passing a specially designed
two-sided magnetic key (Figure 57) within close proximity to both sides of the knee
(Figure 60). This handheld key contains specifically oriented magnets, and its magnetic
field serves to actuate the internal locking mechanism of the implant system, which
contains several fully sealed magnets of its own. Once the “locks” are drawn together on
either side of the “hinge lock recess bumper”, attraction due to the magnetic field will
maintain their proximity and the implant will remain locked in extension until the

143
handheld key is reapplied in its reversed polarity orientation (performed by simply
turning the key over), allowing a patient to walk with the rigid knee with the functional
equivalence of an arthrodesis. Because the knee system has two internal magnetic levers,
the locking the mechanism requires simultaneous application of a magnetic field to both
the medial and lateral sides of the knee. This may be accomplished with the handheld key,
thus preventing accidental disengagement from unknowingly standing near a strong
magnetic field.
Figure 57 – Rendering of the Engage Key. Magnets are embedded within the cylindrical endpieces
Design Decision Matrix
The ability of each proposed design concept to satisfy Design Input criteria was
evaluated, scored, and weighted in order to select a single design for further development
work.

144
Design Inputs
To
tal
Wei
gh
tin
g F
acto
r
Ra
nk
ing
Fu
nct
ion
al /
Per
form
ance
Sim
ilar
Des
ign
s
Reg
ula
tory
Ou
tpu
t fr
om
Ris
k
Man
agem
ent
Oth
er E
ssen
tial
Req
uir
emen
ts
Mu
st e
nab
le p
atie
nts
wit
h d
efic
ien
t o
r m
issi
ng
qu
adri
cep
s m
echan
ism
s to
wal
k
Sh
ou
ld f
lex
fre
ely
when
a p
atie
nt
is s
itti
ng
, ly
ing d
ow
n, o
r o
ther
wis
e in
acti
ve.
Des
ign
sho
uld
not
requ
ire
invas
ive
inte
ract
ion.
Mu
st p
rovid
e st
able
in
terf
ace
suit
able
fo
r bon
e-P
MM
A c
emen
t ad
hes
ion.
Mu
st i
nte
rfac
e w
ith
var
iab
le l
ength
bon
e au
gm
ents
or
intr
amed
ull
ary
ste
ms.
Des
ign
sho
uld
be
as d
ura
ble
as
exis
ting
sal
vag
e to
tal
kn
ee r
epla
cem
ent
des
ign
s.
Sh
ou
ld b
e m
anu
fact
ure
d f
rom
mat
eria
ls u
sed
in
pre
dic
ate
kn
ee i
mpla
nt
des
ign
s
Sh
ou
ld m
inim
ize
risk
of
fail
ure
of
lock
ing m
echan
ism
du
rin
g w
alkin
g.
Dev
ice
shou
ld r
emai
n l
ock
ed u
nti
l sp
ecif
ic a
ctio
n
tak
en t
o u
nlo
ck i
t. I
t ca
nn
ot
acci
den
tall
y u
nlo
ck w
hil
e w
alk
ing
.
Imp
lant
geo
met
ry s
hou
ld p
rev
ent
the
lock
ing
mec
han
ism
fro
m e
ng
agin
g w
hen
the
dev
ice
is n
ot
in f
ull
ex
ten
sion
.
Th
e des
ign
sh
ou
ld i
nte
rfac
e w
ith
an
ex
isti
ng m
odu
lar
tota
l knee
rep
lace
men
t
pla
tfo
rm t
o a
ssis
t in
tra
nsl
atio
n/l
icen
sin
g.
Requirement
Weighting 15%
15%
10%
5%
5%
5%
10%
10%
10%
10%
5%
10
0%
Des
ign
Alt
ern
ati
ves
1. Dropping Pin 10 1 5 10 10 8 9 9 9 2 9
690 4 150 15 50 50 50 40 90 90 90 20 45
2. Cam Lock 10 4 4 10 10 5 7 6 6 10 9
710 3 150 60 40 50 50 25 70 60 60 100 45
3. P-D Magnet 10 4 4 10 10 8 9 5 5 5 9
675 6 150 60 40 50 50 40 90 50 50 50 45
4. M-L Magnet 10 4 4 10 10 8 9 5 5 6 9
685 5 150 60 40 50 50 40 90 50 50 60 45
5. Pushbutton Latch 10 8 1 10 10 5 9 9 9 10 9
820 2 150 120 10 50 50 25 90 90 90 100 45
6. Magnetic Latch 10 9 9 10 10 8 9 8 9 10 9
920 1 150 135 90 50 50 40 90 80 90 100 45
Table 14 – Decision matrix used to evaluate the proposed implant designs

145
Final Model Development
The Magnetic Latch design, subsequently named “The Engage,” best satisfied all
input criteria. Continued design work has resulted in iterative improvements on this basic
design (Figure 58, Figure 56, Figure 59).
Figure 58 – Photo rendering of the Engage design

146
Figure 59 – Prototype of the Engage design as implanted in SawBones bone analog
Figure 60 – Photograph of the Engage Key in use, as it would be used to unlock the device

147
With the Engage, a patient may sit comfortably with a flexible knee. This enables
sitting in close-quarter spaces, such as a plane or the front seat of a car, and performing
otherwise difficult or impossible activities, such as tying one’s shoes. When standing or
walking is desired, a patient extends his leg while sitting and passes the handheld key
over the knee to lock the device (Figure 61). A video demonstration of these activities
may be found at: http://www.youtube.com/watch?v=OgxpPxNkgGw&
Figure 61 – Demonstration of use: 1) Patient sits comfortably; 2) Patient extends right knee and prepares to use key; 3) Patient passes key over the implant, locking it in extension; 4) Patient ambulates with rigid-knee gait; 5) Patient sits, unlocks the device with key in order to sit comfortably again
The use of magnets implanted within orthopedic knee joint replacement devices is
not novel, but predicate devices have not applied this concept to rigid knee
immobilization [101], [102]. This should facilitate regulatory clearance or approval of the
Engage without infringing on existing intellectual property. One such predicate device,
cleared by the FDA through the 510(k) process (K09218), contains an internally sealed
magnet used to drive a screw mechanism when an external magnetic field is applied,
providing a non-invasive post-surgical method of lengthening the femoral shaft of the
implant.

148
In support of full scale manufacturing, manufacturing cost estimates were
developed (Table 15). Initial functional prototypes were manufactured through Medcast,
Inc. (C/O Tom Myers, 596 East 200 North, Warsaw, Indiana 46582, Telephone: (574)
269-6142, [email protected], www.medcast.com) and Machining and Technical
Services (MTS) of Clemson University (C/O Jeff Holliday, Riggs Hall, Clemson, South
Carolina, 29634, Telephone: (864) 656-3202, [email protected],
www.clemson.edu/ces/research/mts/).

149
Estimated Manufacturing Costs
Individual
Assembly
Components
Material Manufacturing Operations
Initial
Tooling &
Setup ($)
Marginal
Unit ($)
Femoral
Component
CoCrMo Lost wax investment cast1 ≈$15,000 ≈$200
Milling2
Laser etch (Lot, Part, Unique ID #s) 2
Shot peening2
Polishing2
Tibial Tray CoCrMo Lost wax investment casting1 ≈$15,000 ≈$150
Milling2
Laser etch (Lot, Part, Unique ID #s) 2
Shot peening2
Tibial Poly Moderately
Crosslinked
UHMWPE
Mill2 ≈$200 ≈$100
Axle 316L SS Lathe2 ≈$200 ≈$50
Laser etch (Lot, Part, Unique ID #s) 2
Polishing2
Passivation2
Bushings (x4) Moderately
Crosslinked
UHMWPE
Milling2 ≈$200 ≈$50
Yoke 316L SS Milling2 ≈$400 ≈$100
Polishing2
Passivation2
Locking
Mechanism
(Multiple
Components)
316L SS,
NdFeB
Lathe2 ≈$500 ≈$100
Assembly2
Polishing2
Laser etch (Lot, Part, Unique ID #s) 2
Passivation2
Additional Operations
(Not applicable to prototypes)
Cleaning2 N/A ≈$7
Packaging3 ≈$20,000 ≈$15
Labeling3 ≈$10,000 ≈$4
Sterilization (& 5 year Validation) 4 ≈$30,000 ≈$10
Total Initial Setup and Marginal Unit Costs ≈ $91,500 ≈$776
Per Unit Cost Prototype Production (Non-Implantable) 10 qty. $3,926 ea.
100 qty. $1,691 ea.
1,000 qty. $868 ea.
10,000 qty. $785 ea.
Table 15 – Contract Manufacturing Suppliers with appropriate Quality Assurance Systems. (1. Medcast, Inc., Warsaw, Indiana - ISO 13485 Certification; 2. Micropulse, Inc., Columbia City, Indiana – ISO 13485 Certification; 3. Tegra Medical, Franklin, Massachusetts – ISO 13485 Certification; 4. Steris, Inc., Spartanburg, South Carolina – ISO 13485 Certification)
150
Intellectual Property Protection
The above design work was presented to the Clemson University Research
Foundation (CURF). Upon review, CURF approved funding for the pursuit of intellectual
property protection. Myers Bigel Sibley & Sajovec, P.A. (4140 Parklake Ave, Suite 600,
Raleigh, NC 27612, Telephone: (919) 854-1400, Fax: (919) 854-1401,
www.myersbigel.com) was selected as the representative law firm, and a provisional
patent application was filed on July 17, 2012 (Lockable Knee Implants and Related
Methods, U.S. Provisional Patent Application 61/672,352). The provisional patent
application was subsequently converted to two full patent applications on July 17, 2013,
additionally incorporating the use in other joints of the body:
Eric M. Lucas, John DesJardins, Kim Chillag, Frank Voss, 2013, Lockable
Implants and Related Methods, U.S. Patent Application 13/944,606
Eric M. Lucas, John DesJardins, Kim Chillag, Frank Voss, 2013, Lockable
Knee Implants and Related Methods, U.S. Patent Application 13/944,161

151
Figure 62 – First two figures of Utility Patent, “Lockable Knee Implants and Related Methods”
Commercial Outreach
A number of commercial outreach activities were undertaken in support of
external licensing of the intellectual property generated as part of this work.

152
April 6, 2011 Preliminary discussion of the technology and the potential for
collaboration was initiated with Carlos Sanchez of Stryker
Orthopaedics (Mahwah, NJ)
September 26, 2012 Kevin Cook of Zimmer Orthopaedics was contacted by email.
November 16, 2012 Mutual NDAs were signed with Biomet (Warsaw, IN), and the
technology was presented by teleconference. Biomet requested an
update after completion of the research studies proposed as a part
of this body of work.
December 5, 2012 Commercialization of the Engage through the formation of a
startup company was proposed by Eric M. Lucas at the LaunchPad
SC competition. The proposal received second place.
July 9, 2013 License of the intellectual property was proposed to John
Vinciguerra of DJO Surgical during a visit to Clemson University.
Mr. Vinciguerra requested an update after feedback from a
previously submitted grant application.
July 29, 2013 The Engage was presented to an audience at CUBEInC put on by
Michael Gara.
November 15, 2013 The Engage was presented during the Elevator Pitch Competition
of SC BIO annual meeting in Charleston, South Carolina.
January 30, 2014 The work was presented by teleconference to the management
team of DJO Surgical.

153
February 20, 2014 The Engage was presented to a visiting group of investors from
Net Scientific at CUBEInC.
The current status of commercialization efforts is positive, but confidential, and
may be out of date at the time of publication of this document. Lisa Perpall, of the
Clemson University Research Foundation, recommends the following statement: “We are
in tentative talks with a prospective licensee, which happens to be a global orthopedic
OEM, so we are very hopeful we may soon have a partner in commercialization to bring
this technology to market.”
Acknowledgements
The following people are gratefully acknowledged for their assistance in this
work: Lisa Perpall, M.S., M.B.A., and Jan Comfort, M.L.S.

154
CHAPTER NINE
DISCUSSION
In which the preceding body of research is discussed.
Surgical treatment options are limited in patients whose knee dysfunction
preempts salvage by means of total knee replacement. While total knee replacement
designs with varying degrees of mechanical stability have been developed to compensate
for anatomic deficiencies, no such designs compensate for a missing or severely
compromised knee extensor mechanism. Knee arthrodesis may salvage the limb and
provide the stability necessary to ambulate independently, but the resulting inability to
bend the knee affects gait biomechanics and can cause restrictive functional problems.
These limitations contribute to the undesirability of knee arthrodesis among patients and
surgeons alike [8]. In spite of these limitations, however, it is apparent from the large
number of recently published case reports that the procedure is still the most clinically
appropriate treatment in many cases.
It is proposed that an alternative treatment could provide these patients with
increased function over the current standard of care. Such a treatment could incorporate
aspects of existing approaches to provide patients with maximum stability while
minimizing functional limitations. The inclusion criteria for this approach can be defined
as dysfunction of the knee with contraindication for existing total knee replacement
designs. This includes, but is not limited to, patients who currently undergo knee

155
arthrodesis. In spite of the number of published case reports, however, the total number
of affected patients has not been previously quantified, and thus the need for such an
alternative treatment is unknown.
In Chapter 5, this dissertation establishes the overall incidence of knee arthrodesis
in the United States over the past two decades, and thus a measure of the need for an
alternative treatment. The Nationwide Inpatient Sample, the largest all-payer inpatient
database in the United States, was acquired to facilitate estimates of this patient subset. A
significant portion of the time and effort for this work went into the creation of a custom
database analysis tool, programmed using SAS (Cary, NC, USA). This tool allowed for
custom database searches by ICD-9-CM procedural code, and performed appropriate
statistical analysis on the queried data. The results of this work show that in spite of the
severe functional limitations and undesirability of the procedure, its incidence averaged
over 1,000 cases annually. And while the total number of knee arthrodesis cases has not
risen with the increased incidence of total knee replacement, it has also not seen a
significant decline, suggesting that increased awareness and improvements in current
treatment alternatives are not sufficient to address the significant number of affected
patients. The age and method of reimbursement of this patient group indicates a high
incidence of Social Security Disability, which may, in turn, suggest that existing
treatment methods have been unable to restore these patients to sufficient function to
participate in the workforce. Knee arthrodesis procedures are concentrated in teaching
hospitals and in urban areas, suggesting that these patients are increasingly driven to seek
out surgeons outside of their local area, and most likely a result of a selection for or

156
referrals to orthopedic surgeons who specialize in knee reconstruction. This same
concentration may also serve to facilitate targeting of this patient subset, both in the
dissemination of knowledge of a novel treatment and the physical outlays required for
such a treatment.
These results demonstrate a compelling opportunity for the proposed alternative
treatment model. One of the primary benefits of knee arthrodesis is joint stability,
enabling patients to ambulate independently. Fusing the knee, however, necessarily
affects the biomechanics of gait, and the temporary stability of the proposed treatment
model would induce biomechanical changes similar or equivalent to those of knee
arthrodesis treatment. Knee arthrodesis itself is contraindicated in patients with
contralateral hip arthritis or replacement, and it has been suggested that knee arthrodesis
may induce pain in other joints and the spine. In spite of these clinical concerns, the
changes to gait kinematics and kinetics induced by knee arthrodesis have not been
directly explored. The importance of understanding the changes to gait kinematics and
kinetics induced by knee immobilization is discussed in Chapter 4.
In Chapter 6, these gait changes are simulated and quantified by studying the gait
of normal, healthy subjects with an artificially immobilized knee. In order to account for
this potential limitation, the work of Chapter 6 was conducted over the course of an
extended period of knee immobilization, and the effects of increased acclimation time
was also studied. This work suggests that allowing a subject to acclimate to an
immobilized knee for a minimum of 0.25 miles of walking is not significantly different
from acclimation over 24+ hours. It is possible that longer term immobilization induces

157
additional changes, but ethical considerations precluded such study. An analysis of the
gait changes induced by knee immobilization shows that gait changes primarily result in
order to assist ground clearance of the immobilized limb and to minimize excess energy
expenditures. Complete quantification of the specific changes in joint angle, net joint
moment, and net joint reaction force are provided, and will assist in the development of
future hypotheses regarding the effects of knee arthrodesis. The increase in reaction
forces at the contralateral hip may be of particular consequence, as it has been suggested
that this joint is associated with early induced arthritis after knee arthrodesis. The
complete characterization of rigid knee gait is also important for the design and testing of
an implantable device that would be subjected to these gait changes, such as the proposed
treatment model.
One significant limitation of gait analysis and the resulting calculations of net
joint moment and net reaction force, however, is the neglect of musculature. This
approach underestimates joint loading, and does not provide a picture of the muscular
changes that are induced by rigid knee immobilization. A musculoskeletal model was
developed and used, in conjunction with motion capture data from the previous gait
analysis study, to run simulations comparing normal and immobilized knee gait. A
complete characterization of joint forces, joint moments, and muscle forces is provided in
Chapter 7. These results showed that while the loading patterns were sometimes altered,
there was generally a reduction in the peak magnitude of joint forces, joint moments, and
muscle forces. Of particular note was the near-complete reduction of quadriceps forces.
Aside from the rectus femoris, which spans the hip and can serve as a hip flexor, the

158
vastus medialis, vastus intermedius, and vastus lateralis do not functionally contribute
when the knee is rigidly immobilized. This is an important consideration for the
estimation of joint loading at the knee, and provides insight into muscular disuse atrophy
after knee arthrodesis. The full characterization of loading patterns provided in Chapter 7
can be used in the development and testing of existing and future orthopedic implants
subjected to such conditions, driving computational, wear, or mechanical testing
conditions.
Design of an alternative treatment model occurred with the assistance of the
practicing clinical collaborators, and occurred in parallel with the preceding research
studies. This design process was guided by the requirements of medical device
development regulations in the United States, as outlined in 21 CFR 820.30, facilitating
translation of the device to clinical use. The proposed design is a variant of a total knee
replacement, satisfying the material, functional, regulatory, and risk requirements of such
designs. The novelty of the proposed treatment lies in the engagement of a temporary
locking mechanism, which is actuated by means of the application of an external
magnetic field. This actuation method is not novel, having been used in orthopedic knee
joint replacement applications that have been cleared for market by the FDA through the
less stringent 510(k) process. This locking mechanism compensates for a lost or
weakened quadriceps extensor mechanism, maintaining the knee in extension to enable a
patient to stand or ambulate independently with the functional equivalence of knee
arthrodesis. Unlike arthrodesis, this locking mechanism can be disengaged to facilitate
knee bending. Applications for protection of the intellectual property created out of this

159
work have been filed, and are assigned to Clemson University. The inventors have
engaged industry members in support of the license of said intellectual property.
The preceding body of work represents the identification and elimination of gaps
in knowledge in diverse areas relating to knee dysfunction and arthrodesis, through which
the common thread is support for a proposed device design. These advances call attention
to the previously unrecognized significance of the clinical need, and provide insight into
the biomechanical effects of knee immobilization (as in knee arthrodesis). In addition to
the scientific and clinical value of the individual research components, the synergism of
this work provides a cohesive package supporting translation of the proposed treatment
model to clinical and commercial use. Components of this work are critical to many
commercialization processes, including market analysis, market strategy, and design
control, and the intellectual property generated from this work enables industry-
University partnership through licensing. In advancing knowledge in these areas, this
work also creates opportunities for further study, and recommendations for building upon
it are made in the next chapter.

160
CHAPTER TEN
RECOMMENDATIONS FOR FUTURE WORK
In which recommendations are made for subsequent researchers to build upon the results
of this body of work.
The focus of this work is severe knee dysfunction and its treatment. The research
methods utilized within the work are varied, but interrelated, and were necessary to build
and defend a robust case for an alternative treatment model. This collection of work
forms a robust and cohesive dissertation, containing the elements necessary to achieve its
stated objectives. With that said, there are a number of opportunities to further
development or build upon the work contained within.
The total number of patients undergoing knee arthrodesis in the United States was
estimated in Chapter 5, using the Nationwide Inpatient Sample. This patient
subpopulation had never been quantified before, and in spite of the detailed
characterizations provided within this work, these results provides fertile ground for
further analysis. The underlying etiologic reasons for undergoing knee arthrodesis are
diverse, as discussed in Chapter 4, and include the failure of total knee replacements. The
author was intrigued by the fact that the number of knee arthrodesis procedures remained
relatively constant, in spite of a significant increase in the number of total knee
replacement surgeries over the same time period. Further study into the reasons for
undergoing knee arthrodesis may provide insight into the question of why the number of

161
knee arthrodesis procedures has not changed over time. Longitudinal analysis using the
Nationwide Inpatient Sample, however, is impossible, as identifying patient information
is stripped from the data, and each record represents a single discharge. A patient
hospitalized twice will show up as two different records, with no possible way to connect
them. One reason given for undergoing knee arthrodesis is infection, and one possible
approach using the Nationwide Inpatient Sample is to document the number of
procedures performed with an associated diagnosis of infection[47]. This requires,
however, that one assumes that the presence of infection is always the direct cause of
failure and the reason for surgery. Another promising approach, though one that was not
open to the author, is to supplement the present national estimates with longitudinal
patient data from a different data source, such as the registry of a large scale research
institute [28].
Normal, healthy subjects with a rigidly immobilized knee were used as a proxy
for patients with knee arthrodesis in Chapter 5. This approach has precedents in the
literature, and it provided reliable control trials for direct comparison. While the present
work showed that short term immobilization (after walking 0.25 miles) was not
significantly different from longer term immobilization (24+ hours), there is no evidence
that this approach effectively simulates gait after immobilization over a much longer term,
as would be the case in patients with an actual knee arthrodesis. In spite of the
confounding factors involved, a future study of patients with an actual arthrodesis may be
considered. The number and dispersion of such patients, in addition to exclusion criteria
resulting from varying etiologies, however, may make such a study difficult. The design

162
of such a study would require a reliable control group, utilizing age or otherwise matched
control variables. The author suggests that such a study also collect surface
electromyography data, particularly monitoring the activity of the vastus lateralis, vastus
intermedius (if plausible), vastus medialis, and rectus femoris. This data can then be
compared against the estimation of muscle activity in Chapter 7.
If those estimations are accurate, they serve as a potential source of difference
between short and long term knee immobilization. When the knee is rigidly immobilized,
the computational model estimated that quadriceps muscle forces drop to near-zero, with
the exception of the rectus femoris, which spans the hip and acts as a hip flexor. It is
likely that over the long term, such as in a patient with a permanent knee arthrodesis, the
quadriceps muscles would atrophy due to functional disuse. We used Dual-energy Xray
Absorptiometry to characterize the lean muscle mass, among other things, of the subjects
in Chapter 6. This technique could similarly be used in patients with a permanent knee
arthrodesis, allowing for a comparison of the lean muscle mass of the thigh in the
operated vs. non-operated legs. It may be hypothesized that differences in lean muscle
mass are a result of atrophy due to functional disuse.
As has been mentioned previously in this work, several authors of articles in
clinical journals have asserted a link between knee arthrodesis and pain and arthritis in
other joints of the lower body. While this link has been suggested or hypothesized, no
studies have established or even explored either correlation or causation. The muscle and
joint loading patterns established by the computational modeling of Chapter 7 suggest a
potential source of such a link, and provide a unique opportunity for further investigation.
163
One possible method to establish correlation would be a longitudinal clinical study,
documenting radiographic evidence for arthritis in other joints at the time of knee fusion
and for a period of subsequent years. It would be more difficult to establish causation
clinically, but the results of Chapter 7 the use of similar musculoskeletal modeling
techniques may provide evidence for such a link.
Failure Mode and Effects Analysis (FMEA) entails the use of methods to pre-
emptively detect causes of failure. One such method is the use of finite element analysis
techniques, and they have seen extensive adoption in design and reliability studies.
Meaningful output from FEA studies is dependent on meaningful and accurate
assumptions, however, such as an accurate estimation of the loading conditions of an
orthopedic implant. Utilization of FEA to test any implantable, rigid-knee orthopedic
device, including the proposed treatment method of Chapter 8, is made possible through
the reporting of loading patterns provided in Chapter 7. The author recommends that
future work utilize this technique to predict potential causes of failure of the proposed
treatment model, and to thus assist in the refinement of design parameters. This
recommendation has already, in fact, been taken; this work is currently being performed
as the focus of the Master’s thesis of a current graduate student, John P. O’Donnell.
Given the purpose of the preceding research, the investigation and proposal of
clinical treatment models, it is not surprising that the methods utilized are diverse.
Inpatient database analysis, motion capture, human subject testing, computational
modeling, and FDA guided design and development techniques were required to achieve
the stated objective. As the preceding dissertation shows, this research successfully
164
accomplishes its stated aims. In accomplishing these aims, however, the previously
uninvestigated research areas broached by this work have demonstrated the potential for
future work, and the techniques employed leave fertile ground for subsequent researchers.
The author has documented several of his approaches in “Standard Operating Procedures”
and has, in some cases, created automated programs to assist in this work; It is his hope
that future researchers will continue to build upon the foundation laid in this work. The
author and his collaborators have also secured intellectual property on the development
work. This dissertation provides strong support for the licensing and translation of this
intellectual property.

165
APPENDICES

166
APPENDIX A – ADDITIONAL DATA FROM THE NATIONWIDE INPATIENT
SAMPLE
Data from the Nationwide Inpatient Sample that hasn’t been developed far enough to
merit an individual chapter.
The SAS program developed in Chapter 5 to query and analyze the Nationwide
Inpatient Sample, documented in the Appendix B, was used to procure additional data on
orthopedic knee joint procedures for comparison against knee arthrodesis.
0
100,000
200,000
300,000
400,000
500,000
600,000
700,000
800,000
1990 1995 2000 2005 2010 2015
Nu
mb
er
of
Pro
ced
ure
s
Year
Number of Procedures Performed in United States
Knee Arthrodesis
Primary TKR
RevisionTKR SUM

167
While the relative number of primary and revision total knee replacement procedures has
grown since 1993, no such increase has occurred with knee arthrodesis.
0.00
0.50
1.00
1.50
2.00
2.50
3.00
3.50
4.00
4.50
1990 1995 2000 2005 2010 2015
Nu
mb
er
of
Pro
ced
ure
s /
(# i
n 1
99
3)
Year
Growth of Procedures Performed in United States (Normalized to 1993)
Knee Arthrodesis
Primary TKR
RevisionTKR SUM
0
2
4
6
8
10
12
14
16
1990 1995 2000 2005 2010 2015
Le
ng
th o
f S
tay
(D
ay
s)
Year
Average Length of Stay
Knee Arthrodesis
Primary TKR
Revision TKR NOS

168
Aside from a dramatic reduction in the length of stay for all procedures occurring
between 1993 and 1997, this measure has not continued to decrease for knee arthrodesis
in subsequent years.
The cost of all procedures has risen in the United States over the past two decades. These
costs have increased at a greater rate for revision total knee replacement and knee
arthrodesis.
$0
$20,000
$40,000
$60,000
$80,000
$100,000
$120,000
$140,000
1990 1995 2000 2005 2010 2015
Ho
spit
al
Ch
arg
es
($)
Year
Average Hospital Charge Per Discharge
Knee Arthrodesis
Primary TKR
Revision TKR NOS
ALL Discharges

169
A greater percentage of revision total knee replacements than primary total knee
replacements are performed in metropolitan areas. An even greater percentage of knee
arthrodesis procedures are performed in metropolitan areas.
80%
82%
84%
86%
88%
90%
92%
94%
96%
98%
100%
1990 1995 2000 2005 2010 2015
Pe
rce
nt
Te
ach
ing
Ho
spit
als
Year
Percent Procedures Performed at Metropolitan Hospital (vs. Rural)
Knee Arthrodesis
Primary TKR
Revision TKR NOS
ALL Discharges
30%
35%
40%
45%
50%
55%
60%
65%
70%
75%
1990 1995 2000 2005 2010 2015
Pe
rce
nt
Te
ach
ing
Ho
spit
als
Year
Percent Procedures Performed at Teaching Hospitals
Knee Arthrodesis
Primary TKR
Revision TKR NOS
ALL Discharges

170
The increasing complexity of revision total knee replacement and knee arthrodesis, as
compared to primary total knee replacement, is reflected in the greater number of
procedures performed at teaching hospitals.
Prior to 2005, a single ICD-9-CM Procedural code (Revision TKR – Not Otherwise
Specified) was used to classify any and all revision total knee replacements. In that year,
new codes were introduced to allow for a more detailed description of the revision work,
i.e. whether only some or all of the previously implanted components were replaced.
0
10000
20000
30000
40000
50000
60000
70000
80000
Nu
mb
er
of
Pro
ced
ure
s
Year
The Introduction of Detailed Revision TKR Codes
RevisionTKR - Tibial Liner (0084)
RevisionTKR - Patellar Component (0083)
RevisionTKR - Femoral Component (0082)
RevisionTKR - Tibial Component (0081)
RevisionTKR - All Components (0080)
Revision TKR - NOS (8155)

171
The number of diagnoses of knee stiffness has increased over the past two decades.
0
500
1,000
1,500
2,000
2,500
3,000
3,500
4,000
4,500
1992 1994 1996 1998 2000 2002 2004 2006 2008 2010 2012
Nu
mb
er
of
Dia
gn
ose
s
Year
Diagnoses of Stiffness(One Measure of Knee Dysfunction)
0
100,000
200,000
300,000
400,000
500,000
600,000
700,000
800,000
Primary TKR Demographics
75+
70-74
65-69
60-64
55-59
50-54
45-49
40-44
35-39
0-34

172
TKR by age/gender trends (reproduction of previous publications, but required for further
breakdown)
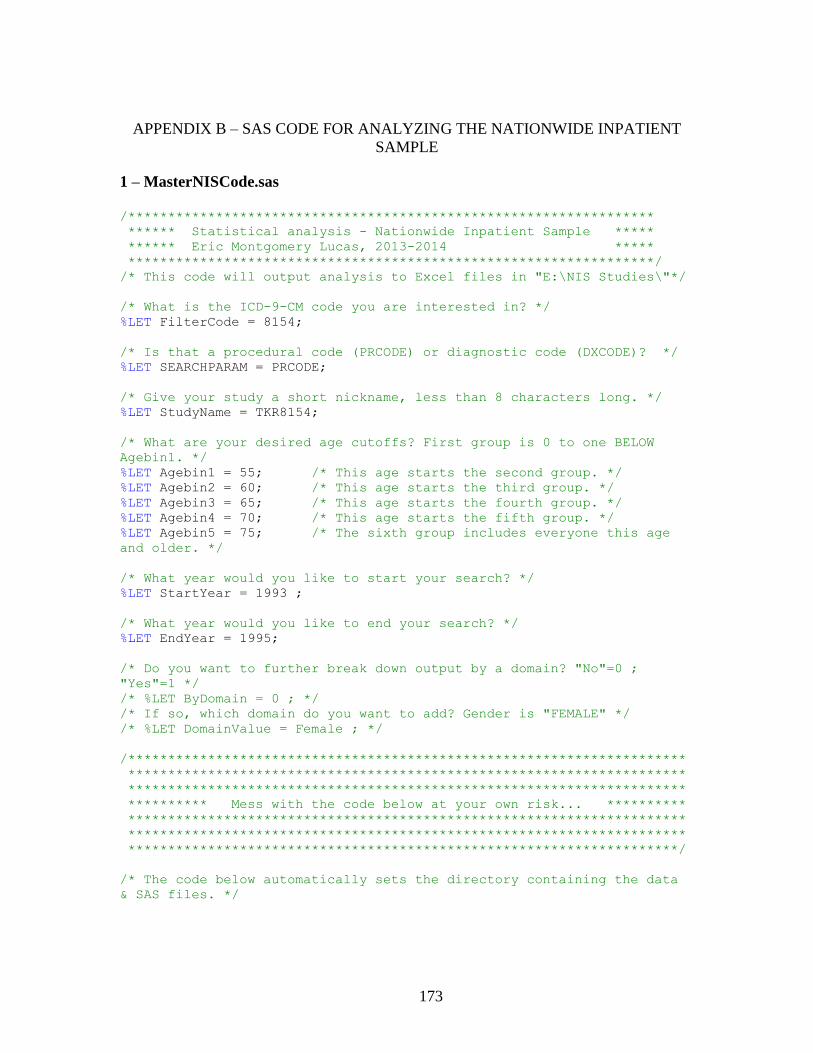
173
APPENDIX B – SAS CODE FOR ANALYZING THE NATIONWIDE INPATIENT
SAMPLE
1 – MasterNISCode.sas
/******************************************************************
****** Statistical analysis - Nationwide Inpatient Sample *****
****** Eric Montgomery Lucas, 2013-2014 *****
******************************************************************/
/* This code will output analysis to Excel files in "E:\NIS Studies\"*/
/* What is the ICD-9-CM code you are interested in? */
%LET FilterCode = 8154;
/* Is that a procedural code (PRCODE) or diagnostic code (DXCODE)? */
%LET SEARCHPARAM = PRCODE;
/* Give your study a short nickname, less than 8 characters long. */
%LET StudyName = TKR8154;
/* What are your desired age cutoffs? First group is 0 to one BELOW
Agebin1. */
%LET Agebin1 = 55; /* This age starts the second group. */
%LET Agebin2 = 60; /* This age starts the third group. */
%LET Agebin3 = 65; /* This age starts the fourth group. */
%LET Agebin4 = 70; /* This age starts the fifth group. */
%LET Agebin5 = 75; /* The sixth group includes everyone this age
and older. */
/* What year would you like to start your search? */
%LET StartYear = 1993 ;
/* What year would you like to end your search? */
%LET EndYear = 1995;
/* Do you want to further break down output by a domain? "No"=0 ;
"Yes"=1 */
/* %LET ByDomain = 0 ; */
/* If so, which domain do you want to add? Gender is "FEMALE" */
/* %LET DomainValue = Female ; */
/**********************************************************************
**********************************************************************
**********************************************************************
********** Mess with the code below at your own risk... **********
**********************************************************************
**********************************************************************
*********************************************************************/
/* The code below automatically sets the directory containing the data
& SAS files. */

174
X "cd
""%substr(%sysget(SAS_EXECFILEPATH),1,%eval(%length(%sysget(SAS_EXECFIL
EPATH))-%length(%sysget(SAS_EXECFILENAME))))""";
/* Imports census data to make appropriate estimates. */
%INCLUDE "2-ImportCensusData.sas";
/* Big ol' Macro to run my data */
%macro DataProcessing;
%do i=&StartYear %to &EndYear;
%INCLUDE "3-PrepareNISData.sas";
%INCLUDE "4-GenerateOutput.sas";
%INCLUDE "4-GenerateOutput xDomain.sas";
%INCLUDE "5-ProcessData.sas";
%END;
%mend DataProcessing;
%DataProcessing;
%INCLUDE "6-PoissonAnalysis.sas";
ODS TAGSETS.EXCELXP
file="E:\NIS Studies\&studyname._info_general.xls"
STYLE=minimal
OPTIONS ( Orientation = 'landscape'
FitToPage = 'yes'
Pages_FitWidth = '1'
Pages_FitHeight = '100' );
Title "&Studyname Information on Demographics";
PROC PRINT DATA=Yearstest;
Run;
ods tagsets.excelxp close;
Run;

175
2–ImportCensusData.sas
/* Import US Census data broken down by age, gender. */
PROC IMPORT datafile="CensusYearAgeGender.csv"
out=Census
dbms=csv
replace;
getnames=yes;
RUN;
/* Creates a new variable to describe which age group each age is in.*/
DATA CensusBinned;
set Census;
AGEBIN = 0;
IF (.< AGE < &AgeBin1 ) THEN AgeBin = 1;
IF (&Agebin1. <= AGE < &AgeBin2.) THEN AGEBIN = 2;
IF (&Agebin2. <= AGE < &Agebin3.) THEN AGEBIN = 3;
IF (&Agebin3. <= AGE < &Agebin4.) THEN AGEBIN = 4;
IF (&Agebin4. <= AGE < &Agebin5.) THEN AGEBIN = 5;
IF (AGE >= &Agebin5.) THEN AGEBIN = 6;
RUN;
/* Sorts the data to prepare for summing it. */
PROC SORT;
by year AGEBIN;
/* Sums the appropriate age groups and puts the total into a new
variable. */
PROC MEANS NOPRINT;
by year AGEBIN;
var N MaleN FemaleN;
output out=CensusN sum=AgeBinSum MaleNSum FemaleNSum;
Run;
Data YearsTest;
set CensusN;
Run;
Data YearsTestMale;
Set YearsTest;
Female=0;
Run;
Data YearsTestFemale;
Set YearsTest;
Female=1;
Run;
Data YearsTest;
Set YearsTestMale YearsTestFemale;
Run;
PROC SORT DATA=YearsTest ;
BY YEAR AGEBIN FEMALE ;
RUN;

176
3–PrepareNISData.sas
/* Prepare a year if NIS data for analysis. */
LIBNAME NIS&i "E:\NIS Data\&i\";
Run;
DATA NIS_&StudyName._&i;
SET NIS&i..NIS_trends_supplemental_&i.;
RETAIN DISCHGS 1;
RETAIN YEAR &i;
&StudyName = 0;
/*PR1&StudyName = 0;
IF pr1="&FilterCode"
THEN PR1&StudyName = 1; */
IF pr1="&FilterCode" OR
pr2="&FilterCode" OR
pr3="&FilterCode" OR
pr3="&FilterCode" OR
pr4="&FilterCode" OR
pr5="&FilterCode" OR
pr6="&FilterCode" OR
pr7="&FilterCode" OR
pr8="&FilterCode" OR
pr9="&FilterCode" OR
pr10="&FilterCode" OR
pr11="&FilterCode" OR
pr12 ="&FilterCode" OR
pr13 ="&FilterCode" OR
pr14="&FilterCode" OR
pr15="&FilterCode"
THEN &StudyName = 1;
AGEBIN = 0;
IF (.< AGE < &AgeBin1 ) THEN AGEBIN = 1;
IF (&Agebin1 <= AGE < &AgeBin2 ) THEN AGEBIN = 2;
IF (&Agebin2 <= AGE < &Agebin3 ) THEN AGEBIN = 3;
IF (&Agebin3 <= AGE < &Agebin4 ) THEN AGEBIN = 4;
IF (&Agebin4 <= AGE < &Agebin5 ) THEN AGEBIN = 5;
IF (AGE >= &Agebin5 ) THEN AGEBIN = 6;
/* Includes formatting files to make data from the NIS readable. */
%INCLUDE "E:\NIS Studies\Sas Code\HCUP_FORMATS.sas";
%INCLUDE "E:\NIS Studies\Sas Code\I9_Formats.sas";
PROC FORMAT;
VALUE AGEBIN
0="Missing"
1="0 to &Agebin1 minus 1"
2="&Agebin1 to &Agebin2 minus 1"
3="&Agebin2 to &Agebin3 minus 1"
4="&Agebin3 to &Agebin4 minus 1"
5="&Agebin4 to &Agebin5 minus 1"
6="&Agebin5 and up";
RUN;

177
4-GenerateOutput.sas
/* Run the data analysis and create a PDF for each year. */
ODS TAGSETS.EXCELXP
file="E:\NIS Studies\&studyname._CountData_&i.Total.xls"
STYLE=statistical
OPTIONS ( Orientation = 'landscape'
FitToPage = 'yes'
Pages_FitWidth = '1'
Pages_FitHeight = '100' );
Title "&Studyname Information &i.";
PROC SURVEYMEANS MISSING SUM MEAN STDERR;
WEIGHT discwt ;
CLASS
agebin
FEMALE
died
pay1
elective
hosp_teach
hosp_locteach
hosp_location
hosp_region;
CLUSTER hospid ;
STRATA NIS_stratum ;
VAR
dischgs
/*PR1&StudyName*/
agebin
died
pay1
elective
hosp_teach
hosp_locteach
hosp_location
hosp_region
NPR
LOS
totchg ;
DOMAIN &StudyName.;
RUN;
ods tagsets.excelxp close;
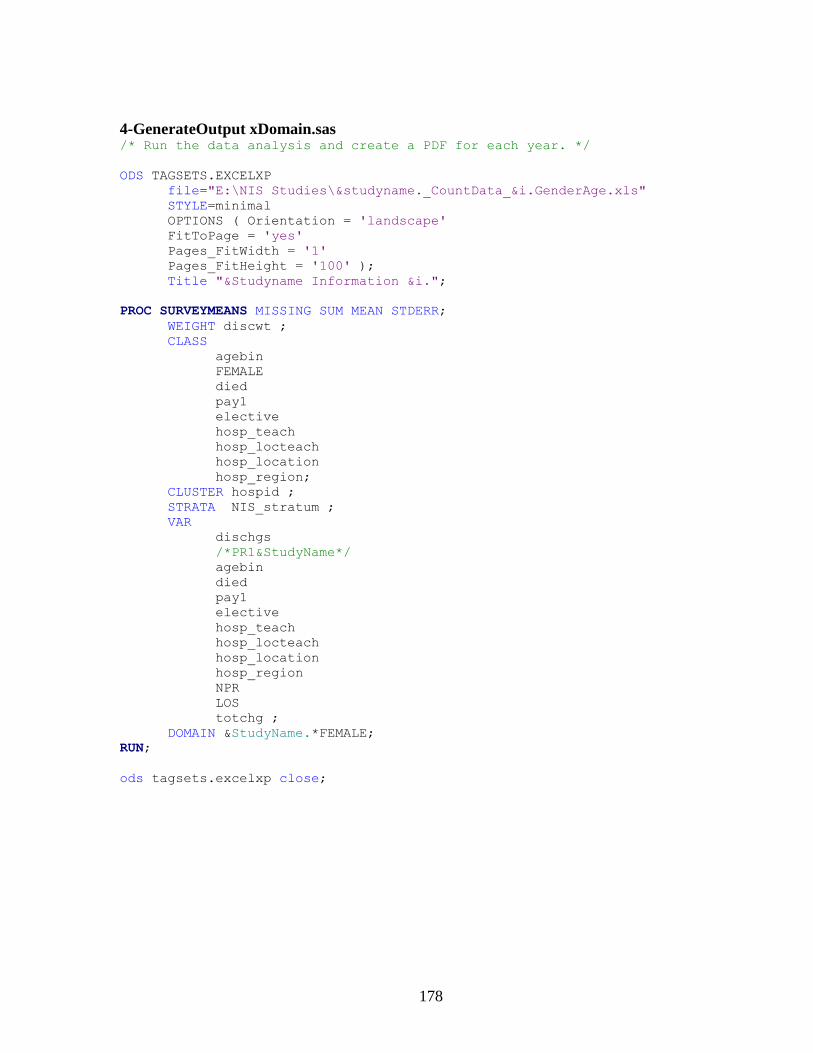
178
4-GenerateOutput xDomain.sas /* Run the data analysis and create a PDF for each year. */
ODS TAGSETS.EXCELXP
file="E:\NIS Studies\&studyname._CountData_&i.GenderAge.xls"
STYLE=minimal
OPTIONS ( Orientation = 'landscape'
FitToPage = 'yes'
Pages_FitWidth = '1'
Pages_FitHeight = '100' );
Title "&Studyname Information &i.";
PROC SURVEYMEANS MISSING SUM MEAN STDERR;
WEIGHT discwt ;
CLASS
agebin
FEMALE
died
pay1
elective
hosp_teach
hosp_locteach
hosp_location
hosp_region;
CLUSTER hospid ;
STRATA NIS_stratum ;
VAR
dischgs
/*PR1&StudyName*/
agebin
died
pay1
elective
hosp_teach
hosp_locteach
hosp_location
hosp_region
NPR
LOS
totchg ;
DOMAIN &StudyName.*FEMALE;
RUN;
ods tagsets.excelxp close;

179
5-ProcessData.sas
/* Delete all observations that don't satisfy the searched code. */
DATA NIS_&StudyName._&i;
SET NIS_&StudyName._&i;
IF &StudyName = 1;
/* Prepare each dataset for a Poisson analysis. */
PROC SORT;
BY YEAR AGEBIN FEMALE ;
title1 "Set with desired data from all years.";
RUN;
/* Delete gender values that are not 0 or 1 (Male or Female)*/
Data NIS_&StudyName._&i ;
Set NIS_&StudyName._&i ;
IF Female ^= 1 AND Female ^=0 THEN delete ;
Run;
/* Output a dataset with the weighted counts for each year */
PROC MEANS DATA=NIS_&StudyName._&i NOPRINT ;
by YEAR AGEBIN FEMALE;
VAR DISCWT;
OUTPUT out=a&i sum=countwt;
RUN;
/* Sort the dataset to be merged */
PROC SORT DATA=a&i ;
BY YEAR AGEBIN FEMALE ;
RUN;
/* Merge the datasets into a single dataset 'YearsTest' to be read and
analyzed */
Data YearsTest ;
Set YearsTest ;
Merge YearsTest a&i ;
By Year Agebin Female ;
Run;
/* Add variable DemographicN so that the male and female counts can be
analyzed */
Data YearsTest ;
Set YearsTest ;
IF Female = 0 THEN DemographicN = MaleNSum ;
IF Female = 1 THEN DemographicN = FemaleNSum ;
Run;
/* Create a new variable 'CountMil' so that the data can be read in the
poisson analysis (sig figs) */
Data YearsTest ;
Set YearsTest ;
Count = countwt*1 ;
CountMil = count * 1000000 ;
Run;
/* Format the table 'YearsTest' in this order for easy comparison */
Data YearsTest ; /*(Drop = countwt); */
Set YearsTest ;
Format Year Agebin Female _FREQ_ AgeBinSum DemographicN Count
CountMil ;
Run;

180
6-PoissonAnalysis.sas /* Prep data for Poisson Analysis */
Data Yearstest;
SET Yearstest;
ln = log(DemographicN);
Run;
/* Poisson Analysis */
PROC GENMOD DATA=Yearstest ;
class Agebin Female Year;
model CountMil = Female Agebin Year / dist = poisson
link = log
offset = ln
Type1
Type3;
estimate "Rate: Agebin=1 Sex=male" intercept 1 Agebin 1 0 0 0 0
0 Female 1 0;
estimate "Rate: Agebin=2 Sex=male" intercept 1 Agebin 0 1 0 0 0
0 Female 1 0;
estimate "Rate: Agebin=3 Sex=male" intercept 1 Agebin 0 0 1 0 0
0 Female 1 0;
estimate "Rate: Agebin=4 Sex=male" intercept 1 Agebin 0 0 0 1 0
0 Female 1 0;
estimate "Rate: Agebin=5 Sex=male" intercept 1 Agebin 0 0 0 0 1
0 Female 1 0;
estimate "Rate: Agebin=6 Sex=male" intercept 1 Agebin 0 0 0 0 0
1 Female 1 0;
estimate "Rate: Agebin=1 Sex=female" intercept 1 Agebin 1 0
0 0 0 0 Female 0 1;
estimate "Rate: Agebin=2 Sex=female" intercept 1 Agebin 0 1
0 0 0 0 Female 0 1;
estimate "Rate: Agebin=3 Sex=female" intercept 1 Agebin 0 0
1 0 0 0 Female 0 1;
estimate "Rate: Agebin=4 Sex=female" intercept 1 Agebin 0 0
0 1 0 0 Female 0 1;
estimate "Rate: Agebin=5 Sex=female" intercept 1 Agebin 0 0
0 0 1 0 Female 0 1;
estimate "Rate: Agebin=6 Sex=female" intercept 1 Agebin 0 0
0 0 0 1 Female 0 1;
/*estimate "1994 from 1993 Rate Ratio" year -1 1 0 0 0 0 0 0 0 0 0 0
0 0 0 0 0 0 0 0 ;
estimate "1995 from 1993 Rate Ratio" year -1 0 1 0 0 0 0 0 0 0 0 0
0 0 0 0 0 0 0 0 ;
estimate "1996 from 1993 Rate Ratio" year -1 0 0 1 0 0 0 0 0 0 0 0
0 0 0 0 0 0 0 0 ;*/
estimate "male/female Rate Ratio" Female 1 -1;
estimate "female/male Rate Ratio" Female -1 1;

181
estimate "Agebin (&Agebin1. to one year less than &Agebin2.)/(0
to one year less than &Agebin1. ) Rate Ratio" agebin -1 1 0 0 0
0 ;
estimate "Agebin (&Agebin2. to one year less than &Agebin3.)/(0
to one year less than &Agebin1. ) Rate Ratio" agebin -1 0 1 0 0
0 ;
estimate "Agebin (&Agebin3. to one year less than &Agebin4.)/(0
to one year less than &Agebin1. ) Rate Ratio" agebin -1 0 0 1 0
0 ;
estimate "Agebin (&Agebin4. to one year less than &Agebin5.)/(0
to one year less than &Agebin1. ) Rate Ratio" agebin -1 0 0 0 1
0 ;
estimate "Agebin (&Agebin5. and up)/(0 to one year less than
&Agebin1. ) Rate Ratio" agebin -1 0 0 0 0 1 ;
lsmeans agebin / diff exp cl;
lsmeans Female / diff exp cl;
lsmeans year / diff exp cl;
output out=poissonoutput xbeta=xb stdxbeta=std;
run;
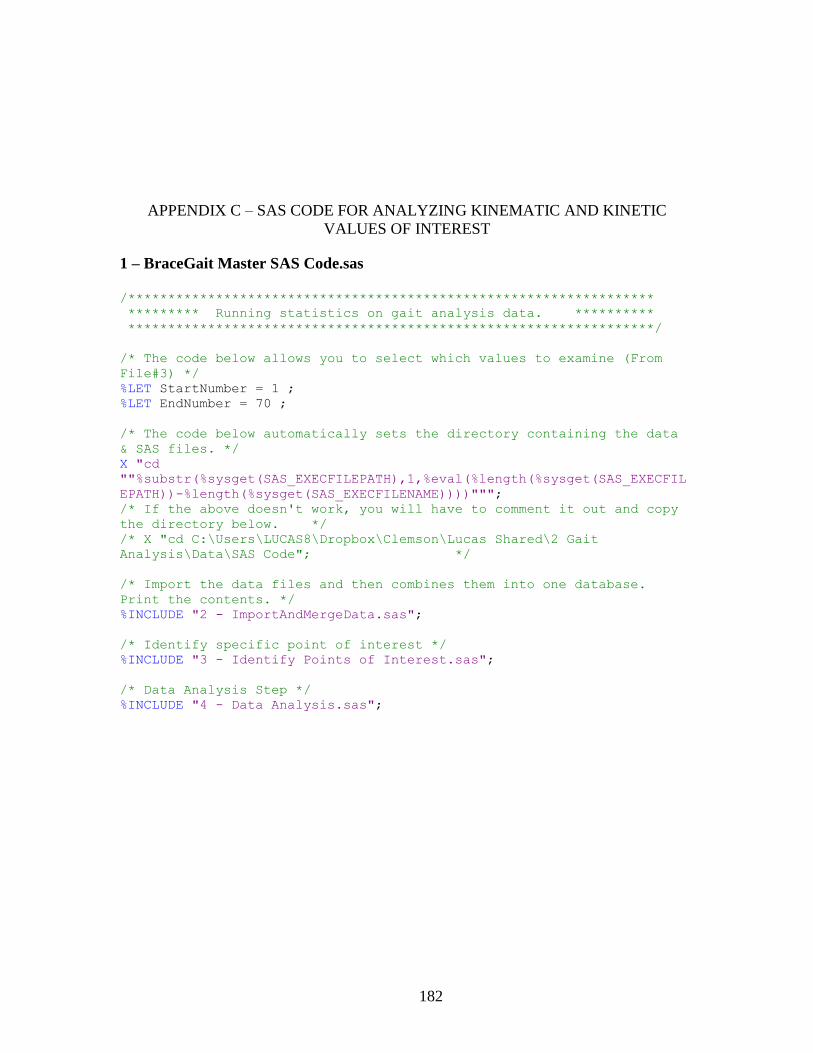
182
APPENDIX C – SAS CODE FOR ANALYZING KINEMATIC AND KINETIC
VALUES OF INTEREST
1 – BraceGait Master SAS Code.sas
/******************************************************************
********* Running statistics on gait analysis data. **********
******************************************************************/
/* The code below allows you to select which values to examine (From
File#3) */
%LET StartNumber = 1 ;
%LET EndNumber = 70 ;
/* The code below automatically sets the directory containing the data
& SAS files. */
X "cd
""%substr(%sysget(SAS_EXECFILEPATH),1,%eval(%length(%sysget(SAS_EXECFIL
EPATH))-%length(%sysget(SAS_EXECFILENAME))))""";
/* If the above doesn't work, you will have to comment it out and copy
the directory below. */
/* X "cd C:\Users\LUCAS8\Dropbox\Clemson\Lucas Shared\2 Gait
Analysis\Data\SAS Code"; */
/* Import the data files and then combines them into one database.
Print the contents. */
%INCLUDE "2 - ImportAndMergeData.sas";
/* Identify specific point of interest */
%INCLUDE "3 - Identify Points of Interest.sas";
/* Data Analysis Step */
%INCLUDE "4 - Data Analysis.sas";

183
2 - ImportAndMergeData.sas
/*Import the three data files and then combine them into one database.
*/
proc import datafile="DataX.csv"
out=DataX
dbms=csv
replace;
getnames=yes;
run;
proc import datafile="DataY.csv"
out=DataY
dbms=csv
replace;
getnames=yes;
run;
proc import datafile="DataZ.csv"
out=DataZ
dbms=csv
replace;
getnames=yes;
run;
proc import datafile="DataPelvicCGxz.csv"
out=PelvicCGxy
dbms=csv
replace;
getnames=yes;
run;
proc import datafile="DataForcesMomentsX.csv"
out=DataMomentsX
dbms=csv
replace;
getnames=yes;
run;
proc import datafile="DataForcesMomentsY.csv"
out=DataMomentsY
dbms=csv
replace;
getnames=yes;
run;
proc import datafile="DataForcesMomentsZ.csv"
out=DataMomentsZ
dbms=csv
replace;
getnames=yes;
run;

184
/***** Combine the above datasets. *****/
data GaitData;
set DataX DataY DataZ PelvicCGxy DataMomentsX DataMomentsY
DataMomentsZ ;
run;
Data GaitData;
set GaitData;
TRIALBIN = "A";
IF TRIAL="C1" THEN TRIALBIN="C" ;
IF TRIAL="B1" THEN TRIALBIN="B" ;
IF TRIAL="B2" THEN TRIALBIN="B" ;
IF TRIAL="B3" THEN TRIALBIN="B" ;
Run;
/***** Copies the data to a new database and *****
***** prints its contents for verification. *****/
data a;
set GaitData;
Run;
PROC contents;
title1 'Data Contents';

185
3 - Identify Points of Interest.sas
/************************************
*Identify specific point of interest*
************************************/
%LET JointInfo1 = PelvicCGRight ;
%LET JointInfo2 = PelvicCGLeft ;
%LET JointInfo3 = PelvicCGRange ;
%LET JointInfo4 = PelvicZLeftSwing ;
%LET JointInfo5 = PelvicZRightSwing ;
%LET JointInfo6 = PelvicZAfterLHS ;
%LET JointInfo7 = PelvicZAfterRHS ;
%LET JointInfo8 = PelvicRotationCCW ;
%LET JointInfo9 = PelvicRotationCW ;
%LET JointInfo10 = PelvicObliquityLTO ;
%LET JointInfo11 = PelvicObliquityLeftSwing ;
%LET JointInfo12 = PelvicObliquityRTO ;
%LET JointInfo13 = PelvicObliquityRightSwing ;
%LET JointInfo14 = PelvicTiltLTO ;
%LET JointInfo15 = PelvicTiltPeakRTO ;
%LET JointInfo16 = PelvicMeanTiltRightSwing ;
%LET JointInfo17 = HipExtensionStart ;
%LET JointInfo18 = HipFlexionStart ;
%LET JointInfo19 = HipAdductionMean ;
%LET JointInfo20 = HipAdductionFirstTO ;
%LET JointInfo21 = HipAdductionSecTO ;
%LET JointInfo22 = HipAddMeanSLimbSup ;
%LET JointInfo23 = HipRotationMean ;
%LET JointInfo24 = HipRotMean ;
%LET JointInfo25 = KneeFlexionTO ;
%LET JointInfo26 = KneeFlexionSwing ;
%LET JointInfo27 = KneeAdductionMax ;
%LET JointInfo28 = KneeAdductionMin ;
%LET JointInfo29 = KneeRotMin ;
%LET JointInfo30 = AnkleFlexionTO ;
%LET JointInfo31 = AnkleFlexionContraTO ;
%LET JointInfo32 = AnkleMaxInversion ;
%LET JointInfo33 = AnkleMeanInversion ;
%LET JointInfo34 = AnkleMaxAdduction ;
%LET JointInfo35 = AnkleAdductionHS ;
%LET JointInfo36 = AnkleAddCTO ;
%LET JointInfo37 = HipExtensionMoment ;
%LET JointInfo38 = HipFlexionMoment ;
%LET JointInfo39 = KneeFlexionMoment ;
%LET JointInfo40 = KneeExtensionMoment ;
%LET JointInfo41 = AnklePlantarMom ;
%LET JointInfo42 = AnkleDorsiMom ;

186
%LET JointInfo43 = HipAddMom1 ;
%LET JointInfo44 = HipAddMom2 ;
%LET JointInfo45 = KneeAbdMom1 ;
%LET JointInfo46 = KneeAbdMom2 ;
%LET JointInfo47 = AnkleInvMom ;
%LET JointInfo48 = AnkleEvMom ;
%LET JointInfo49 = HipIntRotMom ;
%LET JointInfo50 = HipExtRotMom ;
%LET JointInfo51 = KneeIntRotMom ;
%LET JointInfo52 = KneeExtRotMom ;
%LET JointInfo53 = MeanFFAdductionMom ;
%LET JointInfo54 = HipForceXStart ;
%LET JointInfo55 = HipForceXTO ;
%LET JointInfo56 = HipForceXSS ;
%LET JointInfo57 = HipForceXHS ;
%LET JointInfo58 = KneeForceXTO ;
%LET JointInfo59 = KneeForceXHS ;
%LET JointInfo60 = AnkleForceXTO ;
%LET JointInfo61 = AnkleForceXHS ;
%LET JointInfo62 = HipForceYTO ;
%LET JointInfo63 = HipForceYSS ;
%LET JointInfo64 = HipForceYHS ;
%LET JointInfo65 = KneeForceYTO ;
%LET JointInfo66 = AnkleForceYTO ;
%LET JointInfo67 = AnkleForceYHS ;
%LET JointInfo68 = HipForceZTO ;
%LET JointInfo69 = HipForceZSS ;
%LET JointInfo70 = HipForceZHS ;
%LET JointInfo71 = KneeForceZTO ;
%LET JointInfo72 = KneeForceZSS ;
%LET JointInfo73 = KneeForceZHS ;
%LET JointInfo74 = AnkleForceZTO ;
%LET JointInfo75 = AnkleForceZSS ;
%LET JointInfo76 = AnkleForceZHS ;

187
4 - Data Analysis.sas
%macro JointAnalysis;
%do i=&StartNumber. %to &EndNumber.;
/* Reference out to each of the Joint Info Files. */
%INCLUDE "&&JOINTINFO&i...sas" ;
Run;
/* And here begins the analysis, which is run on each Joint Info File.
*/
DATA B;
set GaitData;
if joint="&SetJoint." and plane="&SetPlane." ;
if gaitcycle < &StartMargin or gaitcycle > &StopMargin then
delete;
PROC SORT;
by subject joint side plane trial repetition;
%MACRO MinMaxOrOther;
%if &FindType = MINIMUM %then
%do;
PROC MEANS NOPRINT;
by subject joint side plane trial repetition;
var degrees;
output out=c min=targetdegree
minid(Degrees(gaitcycle))=CycleDegMinMax ;
%put Type used: MINIMUM ;
%end;
%else %if &FindType = MAXIMUM %then
%do;
PROC MEANS NOPRINT;
by subject joint side plane trial repetition;
var degrees;
output out=c max=targetdegree
maxid(Degrees(gaitcycle))=CycleDegMinMax ;
%put Type used: MAXIMUM ;
%end;
%else %if &FindType = MEAN %then
%do;
PROC MEANS NOPRINT;
by subject joint side plane trial repetition;
var degrees;
output out=c mean=targetdegree;
%put Type used: MEAN ;
%end;
%else %if &FindType = RANGE %then
%do;
PROC MEANS NOPRINT;
by subject joint side plane trial repetition;
var degrees;
output out=c range=targetdegree ;

188
%put Type used: MAXIMUM ;
%end;
%else %put &FindType Something messed up. Look through your work
and try again.;
%MEND MinMaxOrOther;
%MinMaxOrOther;
*PROC PRINT;
%MACRO PelvisOrOther;
%if &SetJoint = Pelvis OR &SetJoint = PelvisCG
%then %do;
/* Does this if pelvis (because "Side" messes it up.) */
/*proc freq;
by subject;
tables trial/norow nocol nopercent;
proc freq;
tables trial/norow nocol nopercent;
tables trial*subject/norow nocol nopercent;
tables subject/norow nocol nopercent;
proc sort;
by side;
proc freq;
by side;
tables subject*trial/norow nocol nopercent;
*/
proc sort data=c;
by joint plane;
title1 "&Description. (&FindType. DEGREES between
&StartMargin. and &StopMargin. )";
proc glimmix nobound data=c;
*plots=residualpanel; /* Max, Min, or Mean
Degrees */
by joint plane;
class subject trial ;
model targetdegree = trial ;
random subject subject*trial ;
lsmeans trial /diff lines;
output out=res1 residual=rtargetdegree;
ods select lsmeans;
ods trace on;
ods show;
proc univariate plot normal data=res1;
var rtargetdegree;
ods select 'Tests for Normality';
ods trace on;
ods show;
proc glm data=res1;
class trial;
model rtargetdegree=trial;
means trial/hovtest=levene;
ods select "Levene's HoV Test";

189
ods trace on;
ods show;
RUN; QUIT;
title1 "&Description. (% Gait Cycle where &FindType.
between &StartMargin. and &StopMargin. occurs.)";
proc glimmix nobound data=c;
*plots=residualpanel; /* % Gait Cycle where
above occurs */
by joint plane;
class subject trial ;
model CycleDegMinMax = trial;
random subject subject*trial;
lsmeans trial /diff lines;
output out=res2 residual=rtargetdegree;
ods select lsmeans;
ods trace on;
ods show;
proc univariate plot normal data=res2;
var rtargetdegree;
ods select 'Tests for Normality';
ods trace on;
ods show;
proc glm data=res2;
class trial;
model rtargetdegree=trial;
means trial/hovtest=levene;
ods select "Levene's HoV Test";
ods trace on;
ods show;
RUN; QUIT;
%put Joint: Pelvis ;
%end;
%else %do;
/* Everything except pelvis. */
/*proc freq; by subject;
tables trial*side/norow nocol nopercent;
proc freq;
tables trial*side/norow nocol nopercent;
tables trial*subject/norow nocol nopercent;
tables subject*side/norow nocol nopercent;
proc sort; by side;
proc freq; by side;
tables subject*trial/norow nocol nopercent;
*/
proc sort;
by joint plane;

190
title1 "&Description. (&FindType. DEGREES between
&StartMargin. and &StopMargin. )";
proc glimmix nobound data=c ;
*plots=residualpanel; /* Max, Min, or Mean
Degrees */
by joint plane;
class subject trial side;
model targetdegree = trial side trial*side;
random subject subject*trial subject*trial*side;
lsmeans trial side trial*side/diff lines;
output out=res3 residual=rtargetdegree;
ods select lsmeans;
ods trace on;
ods show;
data res3 ;
set res3;
trialside=trial||side;
proc univariate plot normal data=res3 ;
var rtargetdegree;
ods select 'Tests for Normality';
ods trace on;
ods show;
proc glm data=res3 ;
class trialside;
model rtargetdegree=trialside;
means trialside/hovtest=levene;
ods select "Levene's HoV Test";
ods trace on;
ods show;
RUN; QUIT;
title1 "&Description. (% Gait Cycle where &FindType.
between &StartMargin. and &StopMargin. occurs.)";
proc glimmix nobound data=c;
*plots=residualpanel; /* % Gait Cycle where
above occurs */
by joint plane;
class subject trial side;
model CycleDegMinMax = trial side trial*side;
random subject subject*trial subject*trial*side;
lsmeans trial side trial*side/diff lines;
output out=res4 residual=rtargetdegree;
ods select lsmeans;
ods trace on;
ods show;
data res4;
set res4;
trialside=trial||side;
proc univariate plot normal data=res4;
var rtargetdegree;
ods select 'Tests for Normality';
ods trace on;
ods show;
proc glm data=res4;

191
class trialside;
model rtargetdegree=trialside;
means trialside/hovtest=levene;
ods select "Levene's HoV Test";
ods trace on;
ods show;
RUN; QUIT;
%put Joint: Not Pelvis ;
%end;
%MEND PelvisOrOther;
%PelvisOrOther;
%end;
%mend JointAnalysis;
%JointAnalysis;

192
Below is just one example of the 60+ Joint Info files used to examine particular
points of interest. Each file took the same format, but the Description, StartMargin,
Stop Margin, FindType, SetJoint, SetPlane, and SetSide values differed.
PelvicCGRight.sas /*************************************************
***** Identify a specific point of interest *****
*************************************************/
%LET Description = Pelvic Sway Right ;
/* Describe point of interest */
%LET StartMargin = 1 ;
/* Start looking at this % gait cycle */
%LET StopMargin = 55 ;
/* Stop looking at this % gait cycle */
%LET FindType = MINIMUM ;
/* All Caps MINIMUM, MAXIMUM, or RANGE */
%LET SetJoint = PelvisCG ;
/* Which joint is of interest */
%LET SetPlane = x ;
/* Which plane is of interest */

193
APPENDIX D – SAS CODE FOR ANALYZING JOINT AND MUSCLE LOADING
1 – Stat Analysis Master Program.sas
/***********************************************************
***** Running statistical analysis on AnyBody data. *****
***********************************************************/
/* Which points of interest would you like to analyze? Enter the first
and last numbers, and this program will analyze them along with every
value in between. You need to look in the third include file (#3) in
order to get the correct numbers. */
%LET StartValue = 1;
%LET EndValue = 1;
/* The code below automatically sets the directory containing the data
& SAS files. */
X "cd
""%substr(%sysget(SAS_EXECFILEPATH),1,%eval(%length(%sysget(SAS_EXECFIL
EPATH))-%length(%sysget(SAS_EXECFILENAME))))""";
/* If the above doesn't work, you will have to comment it out and copy
the directory below. */
/* X "cd C:\Users\LUCAS8\Dropbox\Clemson\Lucas Shared\2 Gait
Analysis\Data\SAS Code"; */
/* Import the data files and then combines them into one database.
Print the contents. */
%INCLUDE "2 - Import And Merge Data.sas";
/* Identify specific point of interest */
%INCLUDE "3 - Identify Points of Interest.sas";
/* Data Analysis Step */
%INCLUDE "4 - Data Analysis.sas";
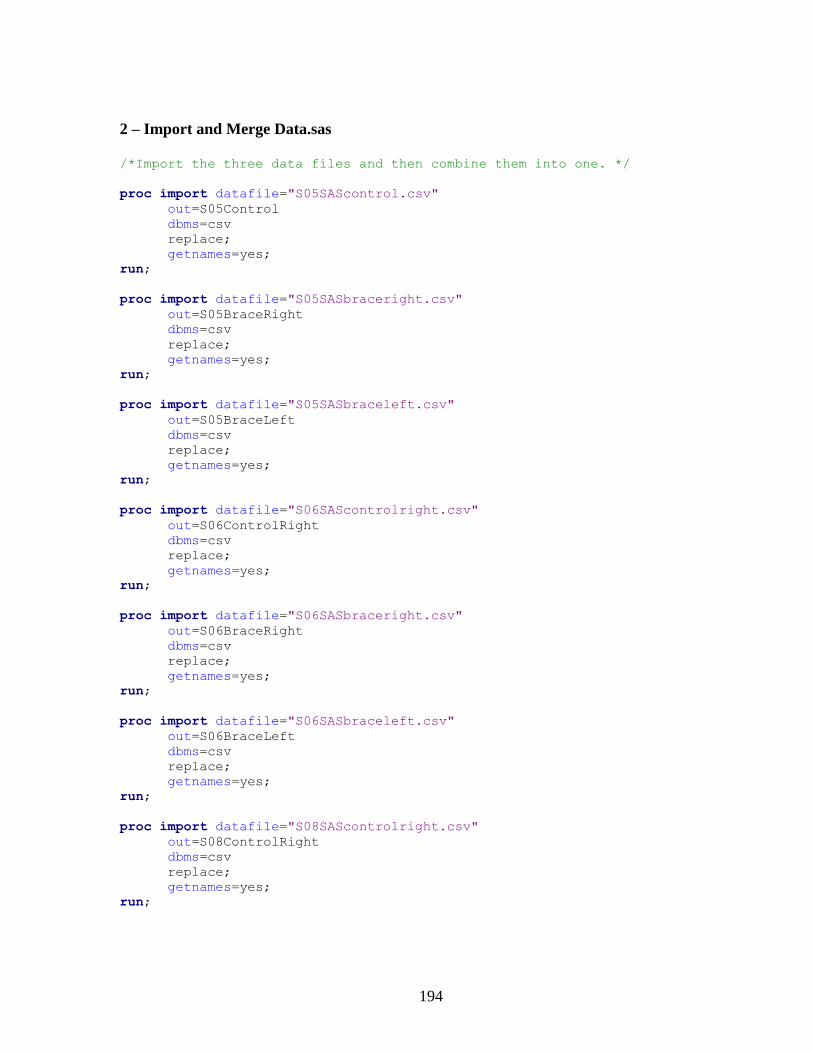
194
2 – Import and Merge Data.sas
/*Import the three data files and then combine them into one. */
proc import datafile="S05SAScontrol.csv"
out=S05Control
dbms=csv
replace;
getnames=yes;
run;
proc import datafile="S05SASbraceright.csv"
out=S05BraceRight
dbms=csv
replace;
getnames=yes;
run;
proc import datafile="S05SASbraceleft.csv"
out=S05BraceLeft
dbms=csv
replace;
getnames=yes;
run;
proc import datafile="S06SAScontrolright.csv"
out=S06ControlRight
dbms=csv
replace;
getnames=yes;
run;
proc import datafile="S06SASbraceright.csv"
out=S06BraceRight
dbms=csv
replace;
getnames=yes;
run;
proc import datafile="S06SASbraceleft.csv"
out=S06BraceLeft
dbms=csv
replace;
getnames=yes;
run;
proc import datafile="S08SAScontrolright.csv"
out=S08ControlRight
dbms=csv
replace;
getnames=yes;
run;
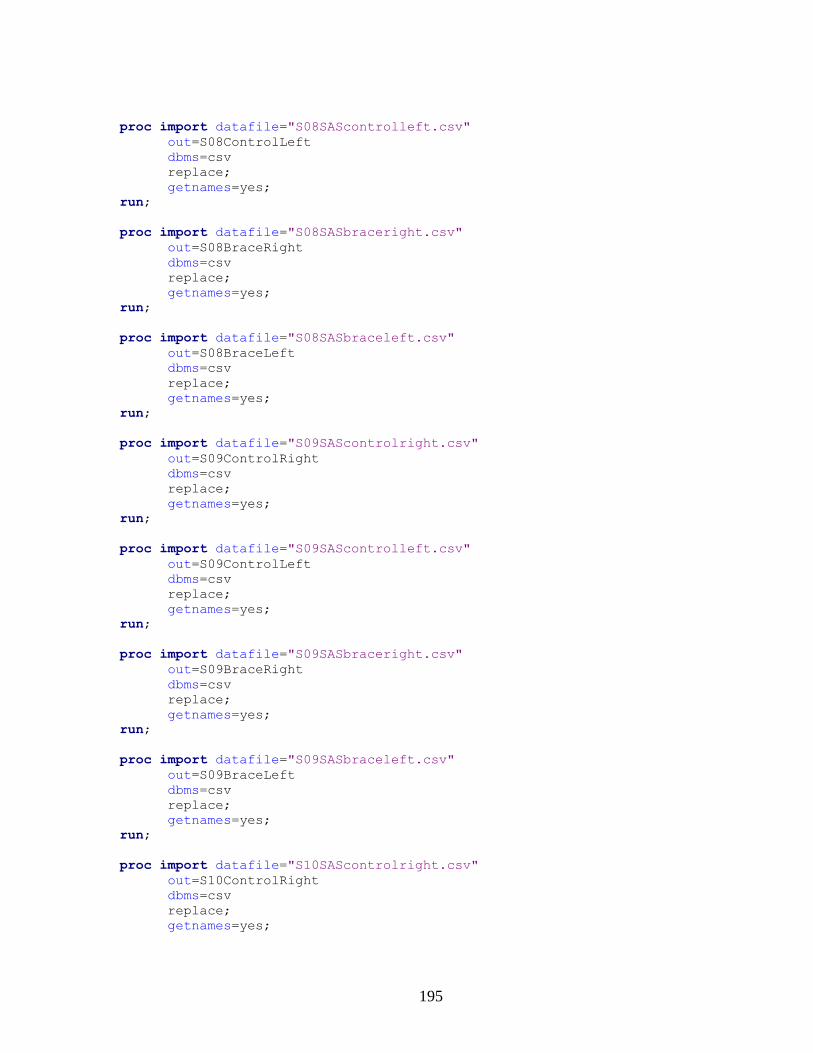
195
proc import datafile="S08SAScontrolleft.csv"
out=S08ControlLeft
dbms=csv
replace;
getnames=yes;
run;
proc import datafile="S08SASbraceright.csv"
out=S08BraceRight
dbms=csv
replace;
getnames=yes;
run;
proc import datafile="S08SASbraceleft.csv"
out=S08BraceLeft
dbms=csv
replace;
getnames=yes;
run;
proc import datafile="S09SAScontrolright.csv"
out=S09ControlRight
dbms=csv
replace;
getnames=yes;
run;
proc import datafile="S09SAScontrolleft.csv"
out=S09ControlLeft
dbms=csv
replace;
getnames=yes;
run;
proc import datafile="S09SASbraceright.csv"
out=S09BraceRight
dbms=csv
replace;
getnames=yes;
run;
proc import datafile="S09SASbraceleft.csv"
out=S09BraceLeft
dbms=csv
replace;
getnames=yes;
run;
proc import datafile="S10SAScontrolright.csv"
out=S10ControlRight
dbms=csv
replace;
getnames=yes;

196
run;
proc import datafile="S10SAScontrolleft.csv"
out=S10ControlLeft
dbms=csv
replace;
getnames=yes;
run;
proc import datafile="S10SASbraceright.csv"
out=S10BraceRight
dbms=csv
replace;
getnames=yes;
run;
proc import datafile="S10SASbraceleft.csv"
out=S10BraceLeft
dbms=csv
replace;
getnames=yes;
run;
proc import datafile="AllSubjectLeftMuscle.csv"
out=LeftMuscle
dbms=csv
replace;
getnames=yes;
run;
proc import datafile="AllSubjectRightMuscle.csv"
out=RightMuscle
dbms=csv
replace;
getnames=yes;
run;
/***** Combine the above datasets. *****/
data AnyBody;
set S05Control
S05BraceRight
S05BraceLeft
S06ControlRight
S06BraceRight
S06BraceLeft
S08ControlRight
S08ControlLeft
S08BraceRight
S08BraceLeft
S09ControlRight
S09ControlLeft
S09BraceRight
S09BraceLeft
S10ControlRight

197
S10ControlLeft
S10BraceRight
S10BraceLeft
LeftMuscle
RightMuscle ;
run;
/***** Copies the data to a new database and *****
***** prints its contents for verification. *****/
data a;
set AnyBody;
Run;
PROC contents;
title1 'Data Contents';

198
3 – Identify Points of Interest.sas
/************************************
*Identify specific point of interest*
************************************/
%LET Info1 = 1RightAnkleForceAP ;
%LET Info2 = 2RightAnkleMomentSE1 ;
%LET Info3 = 3RightAnkleMomentSE2 ;
%LET Info4 = 4RightAnkleMomentAxial1 ;
%LET Info5 = 5RightAnkleMomentAxial2 ;
%LET Info6 = 6RightKneeForcePD1 ;
%LET Info7 = 7RightKneeForcePD2 ;
%LET Info8 = 8RightKneeForcePD3 ;
%LET Info9 = 9RightKneeForceML1 ;
%LET Info10 = 10RightKneeForceML2 ;
%LET Info11 = 11RightKneeForceML3 ;
%LET Info12 = 12RightKneeForceAP1 ;
%LET Info13 = 13RightKneeForceAP2 ;
%LET Info14 = 14RightKneeMomentF1 ;
%LET Info15 = 15RightKneeMomentF2 ;
%LET Info16 = 16RightKneeMomentAb1 ;
%LET Info17 = 17RightKneeMomentAb2 ;
%LET Info18 = 18RightKneeMomentAxial1 ;
%LET Info19 = 19RightKneeMomentAxial2 ;
%LET Info20 = 20RightKneeMomentAxial3 ;
%LET Info21 = 21RightKneeMomentAxial4 ;
%LET Info22 = 22RightHipForcePD1 ;
%LET Info23 = 23RightHipForcePD2 ;
%LET Info24 = 24RightHipForceML1 ;
%LET Info25 = 25RightHipForceML2 ;
%LET Info26 = 26RightHipForceML3 ;
%LET Info27 = 27RightHipForceAP1 ;
%LET Info28 = 28RightHipForceAP2 ;
%LET Info29 = 29RightHipForceAP3 ;
%LET Info30 = 30RightHipMomentAb1 ;
%LET Info31 = 31RightHipMomentAb2 ;
%LET Info32 = 32RightHipMomentEx ;
%LET Info33 = 33LeftAnkleForceAP ;
%LET Info34 = 34LeftAnkleMomentSE1 ;
%LET Info35 = 35LeftAnkleMomentSE2 ;
%LET Info36 = 36LeftAnkleMomentAxial1 ;
%LET Info37 = 37LeftAnkleMomentAxial2 ;
%LET Info38 = 38LeftKneeForcePD1 ;
%LET Info39 = 39LeftKneeForcePD2 ;
%LET Info40 = 40LeftKneeForceML1 ;
%LET Info41 = 41LeftKneeForceML2 ;
%LET Info42 = 42LeftKneeForceML3 ;
%LET Info43 = 43LeftKneeForceAP1 ;
%LET Info44 = 44LeftKneeForceAP2 ;
%LET Info45 = 45LeftKneeMomentF1 ;
%LET Info46 = 46LeftKneeMomentF2 ;
%LET Info47 = 47LeftKneeMomentAb1 ;
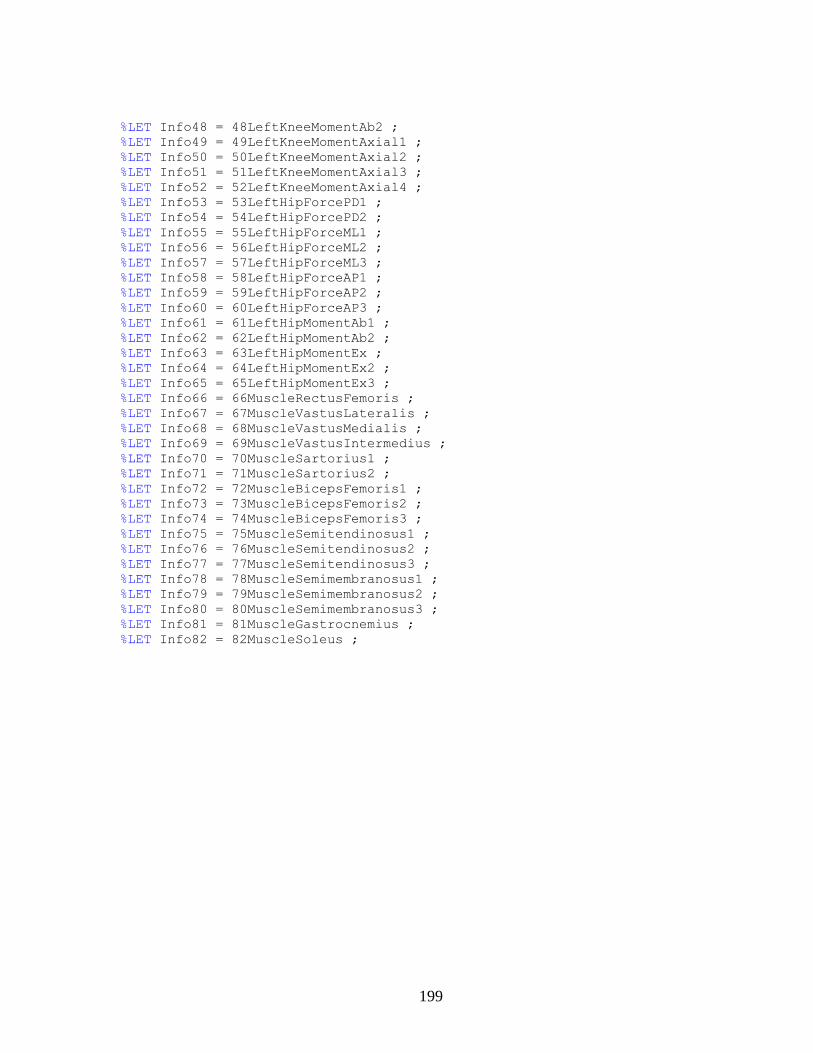
199
%LET Info48 = 48LeftKneeMomentAb2 ;
%LET Info49 = 49LeftKneeMomentAxial1 ;
%LET Info50 = 50LeftKneeMomentAxial2 ;
%LET Info51 = 51LeftKneeMomentAxial3 ;
%LET Info52 = 52LeftKneeMomentAxial4 ;
%LET Info53 = 53LeftHipForcePD1 ;
%LET Info54 = 54LeftHipForcePD2 ;
%LET Info55 = 55LeftHipForceML1 ;
%LET Info56 = 56LeftHipForceML2 ;
%LET Info57 = 57LeftHipForceML3 ;
%LET Info58 = 58LeftHipForceAP1 ;
%LET Info59 = 59LeftHipForceAP2 ;
%LET Info60 = 60LeftHipForceAP3 ;
%LET Info61 = 61LeftHipMomentAb1 ;
%LET Info62 = 62LeftHipMomentAb2 ;
%LET Info63 = 63LeftHipMomentEx ;
%LET Info64 = 64LeftHipMomentEx2 ;
%LET Info65 = 65LeftHipMomentEx3 ;
%LET Info66 = 66MuscleRectusFemoris ;
%LET Info67 = 67MuscleVastusLateralis ;
%LET Info68 = 68MuscleVastusMedialis ;
%LET Info69 = 69MuscleVastusIntermedius ;
%LET Info70 = 70MuscleSartorius1 ;
%LET Info71 = 71MuscleSartorius2 ;
%LET Info72 = 72MuscleBicepsFemoris1 ;
%LET Info73 = 73MuscleBicepsFemoris2 ;
%LET Info74 = 74MuscleBicepsFemoris3 ;
%LET Info75 = 75MuscleSemitendinosus1 ;
%LET Info76 = 76MuscleSemitendinosus2 ;
%LET Info77 = 77MuscleSemitendinosus3 ;
%LET Info78 = 78MuscleSemimembranosus1 ;
%LET Info79 = 79MuscleSemimembranosus2 ;
%LET Info80 = 80MuscleSemimembranosus3 ;
%LET Info81 = 81MuscleGastrocnemius ;
%LET Info82 = 82MuscleSoleus ;

200
3 – Data Analysis.sas
%macro JointAnalysis;
%do i=&StartValue. %to &EndValue.;
/* Reference out to each of the Joint Info Files. */
%INCLUDE "Points of Interest\&&INFO&i...sas" ;
Run;
/* And here begins the analysis, which is run on each Joint Info File.
*/
DATA B;
set AnyBody;
if joint = "&SetJoint." and plane = "&SetPlane." ;
if gaitcycle < &StartMargin or gaitcycle > &StopMargin then
delete;
PROC SORT;
by subject joint side plane trial repetition;
Run;
/* Define and run a macro that determines whether we are searching
for a Minimum, Maximum, Mean, or Range. It pulls this information
for each point of interest file. */
%MACRO MinMaxOrOther;
%if &FindType = MINIMUM %then
%do;
PROC MEANS NOPRINT;
by subject joint side plane trial repetition;
var Value;
output out=c min=targetdegree
minid(Value(gaitcycle))=CycleDegMinMax ;
%put Type used: MINIMUM ;
%end;
%else %if &FindType = MAXIMUM %then
%do;
PROC MEANS NOPRINT;
by subject joint side plane trial repetition;
var Value;
output out=c max=targetdegree
maxid(Value(gaitcycle))=CycleDegMinMax ;
%put Type used: MAXIMUM ;
%end;
%else %if &FindType = MEAN %then
%do;
PROC MEANS NOPRINT;
by subject joint side plane trial repetition;
var Value;
output out=c mean=targetdegree;
%put Type used: MEAN ;
%end;
%else %if &FindType = RANGE %then
%do;

201
PROC MEANS NOPRINT;
by subject joint side plane trial repetition;
var Value;
output out=c range=targetdegree ;
%put Type used: MAXIMUM ;
%end;
%else %put &FindType Something messed up. Look through your work
and try again.;
%MEND MinMaxOrOther;
%MinMaxOrOther;
*PROC PRINT;
%MACRO OneOrBothSides;
%if &SetSide = Right OR &SetSide = Left
%then %do;
/* Delete all observations from opposite side. */
DATA C ;
set C;
if Side ^= "&SetSide." then delete;
Run;
/* Does this because some of the left and right values are inverted.
This only compares one side against itself. */
/* And here begins the analysis, which is run on each Joint Info File.
*/
proc freq;
by subject;
tables trial/norow nocol nopercent;
proc freq;
tables trial/norow nocol nopercent;
tables trial*subject/norow nocol nopercent;
tables subject/norow nocol nopercent;
proc sort;
by side;
proc freq;
by side;
tables subject*trial/norow nocol nopercent;
title1 "&Description. (&FindType. VALUE (N or Nm) between
&StartMargin. and &StopMargin. )";
/**********************************************************************
We FIRST look at the Maximum/Minimum/Mean/Range with the following code.
**********************************************************************/
proc glimmix nobound data=c;
*plots=residualpanel; /* Max, Min, or Mean
Value */
by joint plane;
class subject trial ;
model targetdegree = trial ;
random subject subject*trial ;
lsmeans trial /diff lines;

202
output out=res1 residual=rtargetdegree;
/* ods select lsmeans;
ods trace on;
ods show;
*/
proc sort;
by joint plane subject trial;
proc means noprint;
by joint plane subject trial;
var rtargetdegree;
output out=res11 mean=rtargetdegree;
proc univariate plot normal data=res11;
var rtargetdegree;
/* ods select 'Tests for Normality';
ods trace on;
ods show;
*/
proc glm data=res11;
class trial;
model rtargetdegree=trial;
means trial/hovtest=levene;
/* ods select "Levene's HoV Test";
ods trace on;
ods show;
*/
RUN; QUIT;
title1 "&Description. (% Gait Cycle where &FindType.
between &StartMargin. and &StopMargin. occurs.)";
/*****************************************************************
We NEXT look at the % of the gait cycle where the Maximum/Minimum
occurs.
If we are looking at a Mean or Range, this code will error out but
that's okay.
********************************************************************/
proc glimmix nobound data=c;
*plots=residualpanel; /* % Gait Cycle where
above occurs */
by joint plane;
class subject trial ;
model CycleDegMinMax = trial;
random subject subject*trial;
lsmeans trial /diff lines;
output out=res2 residual=rCycleDegMinMax;
/* ods select lsmeans;
ods trace on;
ods show;
*/
proc sort;
by joint plane subject trial;

203
proc means noprint;
by joint plane subject trial;
var rCycleDegMinMax;
output out=res22 mean=rCycleDegMinMax;
proc univariate plot normal data=res22;
by joint plane;
var rCycleDegMinMax;
/* ods select 'Tests for Normality';
ods trace on;
ods show;
*/
proc glm data=res22;
by joint plane;
class trial;
model rCycleDegMinMax=trial;
means trial/hovtest=levene;
/* ods select "Levene's HoV Test";
ods trace on;
ods show;
*/
RUN; QUIT;
%put No comparison of sides (Left/Right) ;
%end;
%else %do;
/* Left and Right sides together. */
/*proc freq; by subject;
tables trial*side/norow nocol nopercent;
proc freq;
tables trial*side/norow nocol nopercent;
tables trial*subject/norow nocol nopercent;
tables subject*side/norow nocol nopercent;
proc sort; by side;
proc freq; by side;
tables subject*trial/norow nocol nopercent;
*/
proc sort;
by joint ;
title1 "&Description. (&FindType. Value between
&StartMargin. and &StopMargin. )";
/**********************************************************************
We FIRST look at the Maximum/Minimum/Mean/Range with the following code.
*********************************************************************/
proc glimmix nobound data=c ;
*plots=residualpanel; /* Max, Min, or Mean
Value */
by joint plane;
class subject trial side;
model targetdegree = trial side trial*side;

204
random subject subject*trial subject*trial*side;
lsmeans trial side trial*side/diff lines;
output out=res3 residual=rtargetdegree;
/* ods select lsmeans;
ods trace on;
ods show;
*/
proc sort;
by joint plane subject trial side;
proc means noprint;
by joint plane subject trial side;
var rtargetdegree;
output out=res33 mean=rtargetdegree;
data res33 ;
set res33;
trialside = trial||side;
proc univariate plot normal data=res33 ;
by joint plane;
var rtargetdegree;
/* ods select 'Tests for Normality';
ods trace on;
ods show;
*/
proc glm data=res33 ;
by joint plane;
class trialside;
model rtargetdegree=trialside;
means trialside/hovtest=levene;
/* ods select "Levene's HoV Test";
ods trace on;
ods show;
*/
RUN; QUIT;
title1 "&Description. (% Gait Cycle where &FindType.
between &StartMargin. and &StopMargin. occurs.)";
/********************************************************************
We NEXT look at the % of the gait cycle where the Maximum/Minimum
occurs.
If we are looking at a Mean or Range, this code will error out but
that's okay.
*********************************************************************/
proc glimmix nobound data=c;
*plots=residualpanel; /* % Gait Cycle where
above occurs */
by joint plane;
class subject trial side;
model CycleDegMinMax = trial side trial*side;
random subject subject*trial subject*trial*side;
lsmeans trial side trial*side/diff lines;
output out=res4 residual=rCycleDegMinMax;

205
/* ods select lsmeans;
ods trace on;
ods show;
*/
proc sort;
by joint plane subject trial side;
proc means noprint;
by joint plane subject trial side;
var rCycleDegMinMax;
output out=res44 mean=rCycleDegMinMax;
data res44;
set res44;
trialside = trial||side;
proc univariate plot normal data=res44 ;
by joint plane;
var rCycleDegMinMax;
/* ods select 'Tests for Normality';
ods trace on;
ods show;
*/
proc glm data=res44;
by joint plane;
class trialside;
model rCycleDegMinMax=trialside;
means trialside/hovtest=levene;
/* ods select "Levene's HoV Test";
ods trace on;
ods show;
*/
RUN; QUIT;
%put Comparison of Left vs. Right Included ;
%end;
%MEND OneOrBothSides;
%OneOrBothSides;
%end;
%mend JointAnalysis;
%JointAnalysis;

206
Below is just one example of the 43+ Point of Interest files used to examine
particular values of interest. Each file took the same format, but the Description,
StartMargin, Stop Margin, FindType, SetJoint, SetPlane, and SetSide values
differed.
LeftAnkleMomentAxial1.sas /*************************************************
***** Identify a specific point of interest *****
*************************************************/
/* Describe point of interest. */
%LET Description = LeftAnkleMomentAxial1 ;
/* Start looking at this % gait cycle */
%LET StartMargin = 40 ;
/* Stop looking at this % gait cycle */
%LET StopMargin = 60 ;
/* All Caps MINIMUM, MAXIMUM, or RANGE */
%LET FindType = MINIMUM ;
/* Which joint is of interest */
%LET SetJoint = Anklemom ;
/* Which plane is of interest */
%LET SetPlane = z ;
/* Which side is of interest */
%LET SetSide = Both ;

207
REFERENCES
[1] R. L. Mizner and L. Snyder-Mackler, “Altered loading during walking and sit-
to-stand is affected by quadriceps weakness after total knee arthroplasty,” J.
Orthop. Res., vol. 23, no. 5, pp. 1083–1090, 2005.
[2] M. Silva, E. F. Shepherd, W. O. Jackson, J. A. Pratt, C. D. McClung, and T. P.
Schmalzried, “Knee strength after total knee arthroplasty.,” The Journal of
Arthroplasty, vol. 18, no. 5, pp. 605–611, Aug. 2003.
[3] K. Knutson, L. Hovelius, and et al, “Arthrodesis after failed knee arthroplasty:
a nationwide multicenter investigation of 91 cases,” … and related research,
1984.
[4] K. Knutson, A. Lindstrand, and L. Lidgren, “Arthrodesis for failed knee
arthroplasty. A report of 20 cases.,” J Bone Joint Surg [Br], vol. 67, no. 1, pp.
47–52, Jan. 1985.
[5] R. E. Jones, R. D. Russell, and M. H. Huo, “Alternatives to revision total knee
arthroplasty.,” J Bone Joint Surg [Br], vol. 94, no. 11, pp. 137–140, Nov. 2012.
[6] R. Sinha and W. J. A. Van Den Heuvel, “A systematic literature review of
quality of life in lower limb amputees.,” Disabil Rehabil, vol. 33, no. 11, pp.
883–899, 2011.
[7] Y. H. Kim, J. S. Kim, and S. H. Cho, “Total knee arthroplasty after
spontaneous osseous ankylosis and takedown of formal knee fusion.,” The
Journal of Arthroplasty, vol. 15, no. 4, pp. 453–460, Jun. 2000.

208
[8] J. D. Capozzi, R. Rhodes, and D. Chen, “Discussing treatment options.,” J
Bone Joint Surg [Am], vol. 91, no. 3, pp. 740–742, Mar. 2009.
[9] F. Voss, “A new technique of limb salvage after infected revision total knee
arthroplasty - Artificial fusion,” The Journal of Arthroplasty, vol. 16, no. 4, pp.
524–528, 2001.
[10] J. D. Conway, M. A. Mont, and H. P. Bezwada, “Arthrodesis of the knee.,” J
Bone Joint Surg [Am], vol. 86, no. 4, pp. 835–848, Apr. 2004.
[11] J. H. MacDonald, S. Agarwal, M. P. Lorei, N. A. Johanson, and A. A. Freiberg,
“Knee arthrodesis.,” J Am Acad Orthop Surg, vol. 14, no. 3, pp. 154–163, Feb.
2006.
[12] P. Ruggieri, G. Kasimatis, C. Errani, G. Bosco, and M. Mercuri,
“Desarthrodesis and prosthetic reconstruction of the knee after resection of
bone tumors.,” J Surg Oncol, vol. 102, no. 7, pp. 832–837, Dec. 2010.
[13] T. R. Henkel, J. G. Boldt, T. K. Drobny, and U. K. Munzinger, “Total knee
arthroplasty after formal knee fusion using unconstrained and semiconstrained
components: a report of 7 cases.,” The Journal of Arthroplasty, vol. 16, no. 6,
pp. 768–776, Sep. 2001.
[14] K. L. Ong, E. Lau, J. Suggs, S. M. Kurtz, and M. T. Manley, “Risk of
Subsequent Revision after Primary and Revision Total Joint Arthroplasty,” Clin
Orthop Relat Res, vol. 468, no. 11, pp. 3070–3076, Nov. 2010.

209
[15] S. M. Kurtz, F. Mowat, K. Ong, N. Chan, E. Lau, and M. Halpern, “Prevalence
of primary and revision total hip and knee arthroplasty in the United States
from 1990 through 2002,” J Bone Joint Surg [Am], vol. 87, no. 7, pp. 1487–
1497, Jul. 2005.
[16] K. G. Vince, “Why knees fail,” The Journal of Arthroplasty, vol. 18, no. 3, pp.
39–44, Apr. 2003.
[17] S. M. Kurtz, K. Ong, E. Lau, F. Mowat, and M. Halpern, “Projections of
primary and revision hip and knee arthroplasty in the United States from 2005
to 2030.,” J Bone Joint Surg [Am], vol. 89, no. 4, pp. 780–785, Apr. 2007.
[18] K. J. Saleh, D. C. Dykes, R. L. Tweedie, K. Mohamed, A. Ravichandran, R. M.
Saleh, T. J. Gioe, and D. A. Heck, “Functional outcome after total knee
arthroplasty revision: a meta-analysis.,” The Journal of Arthroplasty, vol. 17,
no. 8, pp. 967–977, Dec. 2002.
[19] C. M. Callahan, B. G. Drake, D. A. Heck, and R. S. Dittus, “Patient outcomes
following tricompartmental total knee replacement. A meta-analysis.,” JAMA,
vol. 271, no. 17, pp. 1349–1357, May 1994.
[20] N. V. Greidanus, R. C. Peterson, B. A. Masri, and D. S. Garbuz, “Quality of
life outcomes in revision versus primary total knee arthroplasty.,” The Journal
of Arthroplasty, vol. 26, no. 4, pp. 615–620, Jun. 2011.
[21] D. J. Deehan, J. D. Murray, P. D. Birdsall, and I. M. Pinder, “Quality of life
after knee revision arthroplasty,” Acta Orthop, vol. 77, no. 5, pp. 761–766,
2006.

210
[22] D. Moxley Scarborough, D. E. Krebs, and B. A. Harris, “Quadriceps muscle
strength and dynamic stability in elderly persons.,” Gait Posture, vol. 10, no. 1,
pp. 10–20, Sep. 1999.
[23] M. D. Lewek and et al, “Quadriceps femoris muscle weakness and activation
failure in patients with symptomatic knee osteoarthritis,” Journal of
Orthopaedic …, 2004.
[24] C. Slemenda, K. D. Brandt, D. K. Heilman, S. Mazzuca, E. M. Braunstein, B. P.
Katz, and F. D. Wolinsky, “Quadriceps weakness and osteoarthritis of the knee,”
Ann Intern Med, vol. 127, no. 2, pp. 97–104, Jul. 1997.
[25] J. E. Stevens, R. L. Mizner, and L. Snyder-Mackler, “Quadriceps strength and
volitional activation before and after total knee arthroplasty for osteoarthritis.,”
J Orthop Res, vol. 21, no. 5, pp. 775–779, Sep. 2003.
[26] M. Walsh, L. J. Woodhouse, S. G. Thomas, and E. Finch, “Physical
impairments and functional limitations: a comparison of individuals 1 year after
total knee arthroplasty with control subjects,” Phys Ther, vol. 78, no. 3, pp.
248–258, Mar. 1998.
[27] R. L. Mizner, S. C. Petterson, J. E. Stevens, K. Vandenborne, and L. Snyder-
Mackler, “Early quadriceps strength loss after total knee arthroplasty. The
contributions of muscle atrophy and failure of voluntary muscle activation,” J
Bone Joint Surg [Am], vol. 87, no. 5, pp. 1047–1053, May 2005.

211
[28] R. J. Sierra, R. T. Trousdale, and M. W. Pagnano, “Above-the-knee amputation
after a total knee replacement: prevalence, etiology, and functional outcome.,”
J Bone Joint Surg [Am], vol. 85, no. 6, pp. 1000–1004, Jun. 2003.
[29] Z. U. Isiklar, G. C. Landon, and H. S. Tullos, “Amputation after failed total
knee arthroplasty.,” Clin Orthop Relat Res, no. 299, pp. 173–178, Feb. 1994.
[30] H. M. Abdulhadi, D. C. Kerrigan, and P. J. LaRaia, “Contralateral shoe-lift:
effect on oxygen cost of walking with an immobilized knee.,” Arch Phys Med
Rehabil, vol. 77, no. 7, pp. 670–672, Jul. 1996.
[31] W. Bartlett, S. Vijayan, R. Pollock, J. Skinner, G. W. Blunn, S. Cannon, and T.
W. Briggs, “The Stanmore knee arthrodesis prosthesis.,” The Journal of
Arthroplasty, vol. 26, no. 6, pp. 903–908, Sep. 2011.
[32] M. Campanacci, “Total resection of distal femur or proximal tibia for bone
tumours. Autogenous bone grafts and arthrodesis in twenty-six cases,” J Bone
Joint Surg [Br], 1979.
[33] A. Angelini, E. Henderson, G. Trovarelli, and P. Ruggieri, “Is there a role for
knee arthrodesis with modular endoprostheses for tumor and revision of failed
endoprostheses?,” Clin Orthop Relat Res, vol. 471, no. 10, pp. 3326–3335, Oct.
2013.
[34] P. J. H. Van Rensch, G. J. Van de Pol, J. H. M. Goosen, A. B. Wymenga, and F.
H. R. De Man, “Arthrodesis of the knee following failed arthroplasty.,” Knee
Surg Sports Traumatol Arthrosc, May 2013.
212
[35] R. A. Brand, “Arthrodesis of the knee joint. F. H. Moore and I. S. Smillie.
CORR;13:215-221,” Clin Orthop Relat Res, vol. 468, no. 1, pp. 294–295, 2010.
[36] M. C. Rao, O. Richards, C. Meyer, and R. S. Jones, “Knee stabilisation
following infected knee arthroplasty with bone loss and extensor mechanism
impairment using a modular cemented nail,” Knee, vol. 16, no. 6, pp. 489–493,
Dec. 2009.
[37] K. Bargiotas, D. Wohlrab, J. J. Sewecke, G. Lavinge, P. J. DeMeo, and N. G.
Sotereanos, “Arthrodesis of the knee with a long intramedullary nail following
the failure of a total knee arthroplasty as the result of infection,” J Bone Joint
Surg [Am], vol. 88, no. 3, pp. 553–558, Mar. 2006.
[38] H. S. Somayaji, P. Tsaggerides, H. E. Ware, and G. S. E. Dowd, “Knee
arthrodesis—A review,” The Knee, vol. 15, no. 4, pp. 247–254, Aug. 2008.
[39] M. Spina, G. Gualdrini, M. Fosco, and A. Giunti, “Knee arthrodesis with the
Ilizarov external fixator as treatment for septic failure of knee arthroplasty.,” J
Orthop Traumatol, vol. 11, no. 2, pp. 81–88, Jun. 2010.
[40] B. Leroux, G. Aparicio, N. Fontanin, X. Ohl, K. Madi, E. Dehoux, and S.
Diallo, “Arthrodesis in septic knees using a long intramedullary nail: 17
consecutive cases.,” Orthop Traumatol Surg Res, Apr. 2013.
[41] S. Lee, J. Jang, S. C. Seong, and M. C. Lee, “Distraction arthrodesis with
intramedullary nail and mixed bone grafting after failed infected total knee
arthroplasty.,” Knee Surg Sports Traumatol Arthrosc, vol. 20, no. 2, pp. 346–
355, Feb. 2012.

213
[42] C. Lv, C. Tu, L. Min, and H. Duan, “Allograft arthrodesis of the knee for giant
cell tumors.,” Orthopedics, vol. 35, no. 3, pp. e397–402, Mar. 2012.
[43] S. Putman, G. Kern, E. Senneville, E. Beltrand, and H. Migaud, “Knee
arthrodesis using a customised modular intramedullary nail in failed infected
total knee arthroplasty.,” Orthop Traumatol Surg Res, Mar. 2013.
[44] S. H. Cho, S. T. Jeong, H. B. Park, S. C. Hwang, and D. H. Kim, “Two-stage
conversion of fused knee to total knee arthroplasty.,” The Journal of
Arthroplasty, vol. 23, no. 3, pp. 476–479, Apr. 2008.
[45] D. Clemens, P. Lereim, I. Holm, and O. Reikerås, “Conversion of knee fusion
to total arthroplasty: complications in 8 patients.,” Acta Orthop, vol. 76, no. 3,
pp. 370–374, Jun. 2005.
[46] S. H. Kim, B. L. Wise, Y. Zhang, and R. M. Szabo, “Increasing incidence of
shoulder arthroplasty in the United States.,” J Bone Joint Surg [Am], vol. 93,
no. 24, pp. 2249–2254, Dec. 2011.
[47] S. M. Kurtz, K. L. Ong, J. Schmier, F. Mowat, K. Saleh, E. Dybvik, J.
Kärrholm, G. Garellick, L. I. Havelin, O. Furnes, H. Malchau, and E. Lau,
“Future clinical and economic impact of revision total hip and knee
arthroplasty.,” J Bone Joint Surg [Am], vol. 89, pp. 144–151, Oct. 2007.

214
[48] V. L. Roger, A. S. Go, D. M. Lloyd-Jones, R. J. Adams, J. D. Berry, T. M.
Brown, M. R. Carnethon, S. Dai, G. de Simone, E. S. Ford, C. S. Fox, H. J.
Fullerton, C. Gillespie, K. J. Greenlund, S. M. Hailpern, J. A. Heit, P. M. Ho, V.
J. Howard, B. M. Kissela, S. J. Kittner, D. T. Lackland, J. H. Lichtman, L. D.
Lisabeth, D. M. Makuc, G. M. Marcus, A. Marelli, D. B. Matchar, M. M.
McDermott, J. B. Meigs, C. S. Moy, D. Mozaffarian, M. E. Mussolino, G.
Nichol, N. P. Paynter, W. D. Rosamond, P. D. Sorlie, R. S. Stafford, T. N.
Turan, M. B. Turner, N. D. Wong, J. Wylie-Rosett, American Heart
Association Statistics Committee and Stroke Statistics Subcommittee, “Heart
disease and stroke statistics--2011 update: a report from the American Heart
Association.,” Circulation, vol. 123, no. 4, pp. e18–e209, Feb. 2011.
[49] P. R. D. BS, R. G. W. MD, G. A. S. MD, M. G. M. PhD, and J. K. R. MD,
“Impact of bone morphogenetic proteins on frequency of revision surgery, use
of autograft bone, and total hospital charges in surgery for lumbar degenerative
disease: review of the Nationwide Inpatient Sample from 2002 to 2008,” The
Spine Journal, pp. 1–10, Sep. 2013.
[50] M. Manley, K. Ong, E. Lau, and S. M. Kurtz, “Total Knee Arthroplasty
Survivorship in the United States Medicare Population Effect of Hospital and
Surgeon Procedure Volume,” The Journal of Arthroplasty, vol. 24, no. 7, pp.
1061–1067, Oct. 2009.

215
[51] Introduction to the HCUP Nationwide Inpatient Sample (NIS). Agency for
Healthcare Research and Quality, Healthcare Cost and Utilization Project
(HCUP), 2012, pp. 1–85.
[52] S. Giannini, “Long Term Functional Assessment of Patients Operated for
Arthrodesis of the Lower Limb,” in Gait analysis: Methodologies and Clinical
Applications, no. 2, IOS Press, 1997.
[53] F. Catani, S. Giannini, F. Bombardi, M. Marcacci, F. Ceccarelli, A. Ferrari, and
M. G. Benedetti, “GAIT ANALYSIS STUDY OF LOWER LIMB JOINT
ARTHRODESIS,” presented at the Images of the Twenty-First Century.
Annual International Engineering in Medicine and Biology Society, 1989, p.
828.
[54] R. Baker, “Globographic visualisation of three dimensional joint angles.,” J
Biomech, vol. 44, no. 10, pp. 1885–1891, Jul. 2011.
[55] K. A. Ball and T. M. Greiner, “On the problems of describing joint axis
alignment.,” J Biomech, vol. 41, no. 7, pp. 1599–1603, 2008.
[56] K. J. Lage, S. C. White, and H. J. Yack, “The effects of unilateral knee
immobilization on lower extremity gait mechanics.,” Med Sci Sports Exerc, vol.
27, no. 1, pp. 8–14, Jan. 1995.
[57] M. D. Lewek, A. J. Osborn, and C. J. Wutzke, “The influence of mechanically
and physiologically imposed stiff-knee gait patterns on the energy cost of
walking.,” Arch Phys Med Rehabil, vol. 93, no. 1, pp. 123–128, Jan. 2012.

216
[58] D. C. Kerrigan, H. M. Abdulhadi, T. A. Ribaudo, and U. Della Croce,
“Biomechanic effects of a contralateral shoe-lift on walking with an
immobilized knee.,” Arch Phys Med Rehabil, vol. 78, no. 10, pp. 1085–1091,
Oct. 1997.
[59] E. Hanada and D. C. Kerrigan, “Energy consumption during level walking with
arm and knee immobilized.,” Arch Phys Med Rehabil, vol. 82, no. 9, pp. 1251–
1254, Sep. 2001.
[60] E. Mattsson and L. A. Brostrom, “The Increase in Energy Cost of Walking
With an Immobilized Knee or an Unstable Ankle,” Scand J Rehabil Med, vol.
22, no. 1, pp. 51–53, 1990.
[61] R. L. Waters, J. Campbell, L. Thomas, L. Hugos, and P. Davis, “Energy costs
of walking in lower-extremity plaster casts.,” J Bone Joint Surg [Am], vol. 64,
no. 6, pp. 896–899, Jul. 1982.
[62] T. Boone, “Metabolic cost of walking with and without a shoe lift on the
contralateral foot of an immobilised extended knee.,” Aust J Physiother, vol. 47,
no. 2, pp. 141–145, 2001.
[63] R. Senden, I. C. Heyligers, K. Meijer, H. Savelberg, and B. Grimm,
“Acceleration-based motion analysis as a tool for rehabilitation: exploration in
simulated functional knee limited walking conditions.,” Am J Phys Med
Rehabil, vol. 90, no. 3, pp. 226–232, Mar. 2011.

217
[64] D. C. Kerrigan, B. E. Viramontes, P. J. Corcoran, and P. J. LaRaia, “Measured
versus predicted vertical displacement of the sacrum during gait as a tool to
measure biomechanical gait performance.,” Am J Phys Med Rehabil, vol. 74,
no. 1, pp. 3–8, Jan. 1995.
[65] G. K. Cole, B. M. Nigg, J. L. Ronsky, and M. R. Yeadon, “Application of the
joint coordinate system to three-dimensional joint attitude and movement
representation: a standardization proposal.,” J Biomech Eng, vol. 115, no. 4, pp.
344–349, Nov. 1993.
[66] R. Baker, “Pelvic angles: a mathematically rigorous definition which is
consistent with a conventional clinical understanding of the terms.,” Gait
Posture, vol. 13, no. 1, pp. 1–6, Feb. 2001.
[67] A. G. Schache and R. Baker, “On the expression of joint moments during gait,”
Gait Posture, vol. 25, no. 3, pp. 440–452, 2007.
[68] U. U. Della Croce, P. O. P. Riley, J. L. J. Lelas, and D. C. D. Kerrigan, “A
refined view of the determinants of gait.,” Gait Posture, vol. 14, no. 2, pp. 79–
84, Oct. 2001.
[69] J. B. Saunders, V. T. Inman, and A. Eberhart, “The major determinants in
normal and pathological gait,” J Bone Joint Surg [Am], vol. 35, no. 3, pp. 543–
558, Jul. 1953.
[70] R. L. Waters and S. Mulroy, “The energy expenditure of normal and pathologic
gait.,” Gait Posture, vol. 9, no. 3, pp. 207–231, Jul. 1999.

218
[71] A. Grujicic, M. LaBerge, X. Xie, G. Arakere, B. Pandurangan, M. Grujicic, K.
J. Jeray, and S. L. Tanner, “Computational investigation of the relative
efficacies of nail- and plate-type proximal femoral-fracture fixation implants,”
Multidiscipline Modeling in Materials and Structures, vol. 7, no. 3, pp. 212–
244, Sep. 2011.
[72] K. Sasaki and R. R. Neptune, “Individual muscle contributions to the axial knee
joint contact force during normal walking.,” J Biomech, vol. 43, no. 14, pp.
2780–2784, Oct. 2010.
[73] D. D. D'Lima, B. J. Fregly, S. Patil, N. Steklov, and C. W. Colwell, “Knee joint
forces: prediction, measurement, and significance.,” P I Mech Eng H, vol. 226,
no. 2, pp. 95–102, Feb. 2012.
[74] B. J. Fregly, T. F. Besier, D. G. Lloyd, S. L. Delp, S. A. Banks, M. G. Pandy,
and D. D. D'Lima, “Grand challenge competition to predict in vivo knee loads.,”
J. Orthop. Res., vol. 30, no. 4, pp. 503–513, Apr. 2012.
[75] C. R. Winby, D. G. Lloyd, T. F. Besier, and T. B. Kirk, “Muscle and external
load contribution to knee joint contact loads during normal gait.,” J Biomech,
vol. 42, no. 14, pp. 2294–2300, Oct. 2009.
[76] L. J. Holmberg and A. M. Lund, “A musculoskeletal full-body simulation of
cross-country skiing,” P I Mech Eng P-J Spo, vol. 222, pp. 11–22, 2008.
[77] M. Damsgaard, J. Rasmussen, and S. T. Christensen, “Analysis of
musculoskeletal systems in the AnyBody Modeling System,” Simulation
Modelling …, 2006.

219
[78] V. Carbone, M. M. van der Krogt, H. F. J. M. Koopman, and N. Verdonschot,
“Sensitivity of subject-specific models to errors in musculo-skeletal geometry.,”
J Biomech, vol. 45, no. 14, pp. 2476–2480, Sep. 2012.
[79] R. D. Crowninshield and R. A. Brand, “A physiologically based criterion of
muscle force prediction in locomotion.,” J Biomech, vol. 14, no. 11, pp. 793–
801, 1981.
[80] J. Brand, D. Hamilton, J. Selby, D. Pienkowski, D. N. Caborn, and D. L.
Johnson, “Biomechanical comparison of quadriceps tendon fixation with
patellar tendon bone plug interference fixation in cruciate ligament
reconstruction,” Arthroscopy, vol. 16, no. 8, pp. 805–812, Nov. 2000.
[81] M. Grujicic, G. Arakere, X. Xie, M. LaBerge, A. Grujicic, D. W. Wagner, and
A. Vallejo, “Design-optimization and material selection for a femoral-fracture
fixation-plate implant,” Mater Design, vol. 31, no. 7, pp. 3463–3473, Aug.
2010.
[82] M. Grujicic, X. Xie, G. Arakere, and A. Grujicic, “Design-optimization and
material selection for a proximal radius fracture-fixation implant,” Journal of
materials …, 2010.
[83] S. A. A. M. Eltoukhy, “Development and Validation of a Three-Dimensional
Biomechanical Model of the Lower Extremity,” pp. 1–26, Oct. 2011.
[84] R. Anderson, “Subject-specific Musculoskeletal Simulation of Hip Dislocation
Risk in Activities of Daily Living,” Whitepaper. pp. 1–1, 15-Jul-2011.

220
[85] D. W. Wagner, K. Divringi, C. Ozcan, M. Grujicic, B. Pandurangan, and A.
Grujicic, “Combined musculoskeletal dynamics/structural finite element
analysis of femur physiological loads during walking,” Multidiscipline
Modeling in Materials and Structures, vol. 6, no. 4, pp. 417–437, Nov. 2010.
[86] A. Erdemir, S. McLean, W. Herzog, and A. J. van den Bogert, “Model-based
estimation of muscle forces exerted during movements.,” Clin Biomech (Bristol,
Avon), vol. 22, no. 2, pp. 131–154, Feb. 2007.
[87] A. Seireg and M. Gerath, “An in vivo investigation of wear in animal joints.,” J
Biomech, vol. 8, no. 3, pp. 169–172, Jul. 1975.
[88] R. D. Crowninshield, R. C. Johnston, J. G. Andrews, and R. A. Brand, “A
biomechanical investigation of the human hip.,” J Biomech, vol. 11, no. 1, pp.
75–85, 1978.
[89] B. Innocenti, S. Pianigiani, L. Labey, J. Victor, and J. Bellemans, “Contact
forces in several TKA designs during squatting: A numerical sensitivity
analysis,” J Biomech, vol. 44, no. 8, pp. 1573–1581, May 2011.
[90] S. L. Delp and J. P. LOAN, “A Graphics-Based Software System to Develop
and Analyze Models of Musculoskeletal Structures,” Comput. Biol. Med., vol.
25, no. 1, pp. 21–34, Jan. 1995.
[91] S. L. Delp, F. C. Anderson, A. S. Arnold, P. Loan, A. Habib, C. T. John, E.
Guendelman, and D. G. Thelen, “OpenSim: open-source software to create and
analyze dynamic Simulations of movement,” IEEE Trans Biomed Eng, vol. 54,
no. 11, pp. 1940–1950, Nov. 2007.

221
[92] M. E. Lund, M. de Zee, M. S. Andersen, and J. Rasmussen, “On validation of
multibody musculoskeletal models.,” P I Mech Eng H, vol. 226, no. 2, pp. 82–
94, Feb. 2012.
[93] R. D. Komistek, T. R. Kane, M. Mahfouz, J. A. Ochoa, and D. A. Dennis,
“Knee mechanics: a review of past and present techniques to determine in vivo
loads.,” J Biomech, vol. 38, no. 2, pp. 215–228, Feb. 2005.
[94] R. Willing and I. Y. Kim, “Design optimization of a total knee replacement for
improved constraint and flexion kinematics.,” J Biomech, vol. 44, no. 6, pp.
1014–1020, Apr. 2011.
[95] M. D. Klein Horsman, H. F. J. M. Koopman, F. C. T. van der Helm, L. P. Prosé,
and H. E. J. Veeger, “Morphological muscle and joint parameters for
musculoskeletal modelling of the lower extremity.,” Clin Biomech (Bristol,
Avon), vol. 22, no. 2, pp. 239–247, Feb. 2007.
[96] N. Shakoor, M. Sengupta, K. C. Foucher, M. A. Wimmer, L. F. Fogg, and J. A.
Block, “Effects of Common Footwear on Joint Loading in Osteoarthritis of the
Knee,” Arthritis Care Res (Hoboken), vol. 62, no. 7, pp. 917–923, Jul. 2010.
[97] K. L. Bennell, K.-A. Bowles, Y. Wang, F. Cicuttini, M. Davies-Tuck, and R. S.
Hinman, “Higher dynamic medial knee load predicts greater cartilage loss over
12 months in medial knee osteoarthritis.,” Ann. Rheum. Dis., vol. 70, no. 10, pp.
1770–1774, Oct. 2011.

222
[98] E. L. RADIN, H. G. PARKER, J. W. PUGH, S. RS, I. L. PAUL, and R. M.
ROSE, “Response of Joints to Impact Loading .3. Relationship Between
Trabecular Microfractures and Cartilage Degeneration,” J Biomech, vol. 6, no.
1, pp. 51–&, 1973.
[99] M. J. Robon, K. L. Perell, M. Fang, and E. Guererro, “The relationship between
ankle plantar flexor muscle moments and knee compressive forces in subjects
with and without pain,” Clin Biomech, vol. 15, no. 7, pp. 522–527, Aug. 2000.
[100] J. P. McAuley and G. A. Engh, “Constraint in total knee arthroplasty - When
and what?,” The Journal of Arthroplasty, vol. 18, no. 3, pp. 51–54, Apr. 2003.
[101] A. Gupta, J. Meswania, G. W. Blunn, S. R. Cannon, and T. W. Briggs,
“Stanmore non-invasive growing arthrodesis endoprosthesis in the
reconstruction of complicated total knee arthroplasty,” Knee, vol. 13, no. 3, pp.
247–251, 2006.
[102] M. D. Sewell, B. G. I. Spiegelberg, S. A. Hanna, W. J. S. Aston, J. M.
Meswania, G. W. Blunn, C. Henry, S. R. Cannon, and T. W. Briggs, “Non-
invasive extendible endoprostheses for limb reconstruction in skeletally-mature
patients.,” J Bone Joint Surg [Br], vol. 91, no. 10, pp. 1360–1365, Oct. 2009.