climate extremes, regional impacts, and the case for ... · sea level is projected to rise more...
TRANSCRIPT

Climate Extremes, Regional Impacts, and the Case for Resilience
Turn Down Heatth
e
Regional Summaries

Climate Extremes, Regional Impacts, and the Case for Resilience
Turn Down Heatth
e
June 2013
A Report for the World Bank by the Potsdam Institute for Climate Impact Research and Climate Analytics
Regional Summaries

© 2013 International Bank for Reconstruction and Development / The World Bank1818 H Street NWWashington DC 20433Telephone: 202-473-1000Internet: www.worldbank.org
This report was prepared for the World Bank by the Potsdam Institute for Climate Impact Research and Climate Analytics. The findings, interpretations, and conclusions expressed in this work do not necessarily reflect the views of The World Bank, its Board of Executive Directors, or the governments they represent.
The World Bank does not guarantee the accuracy of the data included in this commissioned work. The boundaries, colors, denominations, and other information shown on any map in this work do not imply any judgment on the part of The World Bank concerning the legal status of any territory or the endorsement or acceptance of such boundaries.
Rights and PermissionsThe material in this work is subject to copyright. Because the World Bank encouragesdissemination of its knowledge, this work may be reproduced, in whole or in part,for noncommercial purposes as long as full attribution to this work is given.
Any queries on rights and licenses, including subsidiary rights, should be addressedto the Office of the Publisher, The World Bank, 1818 H Street NW, Washington, DC20433, USA; fax: 202-522-2422; e-mail: [email protected].

1
Sub-Saharan Africa: Food Production at Risk
Regional SummaRy
Sub-Saharan Africa is a rapidly developing region of over 800 mil-lion people, with 49 countries,1 and great ecological, climatic, and cultural diversity. By 2050, its population is projected to approach 1.5–1.9 billion people. With a 4°C global warming by the end of the century, sea level is projected to rise up to 100 cm, droughts are expected to become increasingly likely in central and southern Africa, and never-before-experienced heat extremes are projected to affect increasing proportions of the region. Projections also show an increased likelihood of increased annual precipitation in the Horn of Africa and parts of East Africa that is likely to be concentrated in bursts and, thereby, increase the risk of flooding. Increased atmospheric concentrations of CO
2 are likely to facilitate a shift from grass to woodland savanna and thereby negatively impact pastoral livelihoods if grass-based forage is reduced. Climate change is expected to have adverse impacts and pose severe risks, particularly on agricultural crop production, pastoral and livestock systems, and capture fisheries. It may also significantly increase the challenges of ensuring food security and eradicating poverty.
Sub-Saharan Africa is particularly vulnerable to impacts on agriculture. Most of the region´s agricultural crop production is rainfed and therefore highly susceptible to shifts in precipitation and temperature. A net expansion of the overall area classified as arid or hyper-arid is projected for the region as a whole, with likely adverse consequences for crop and livestock production. Since the 1950s, much of the region has experienced increased drought and the population´s vulnerability is high: The 2011 drought in the Horn of Africa, for example, affected 13 million people and led to extremely high rates of malnutrition, particularly among children. Under future climate change, droughts are projected to
become increasingly likely in central and southern Africa, with a 40-percent decrease in precipitation in southern Africa if global temperatures reach 4°C above pre-industrial levels by the 2080s (2071–2099 relative to 1951–1980).
1 This report defines Sub-Saharan Africa as the region south of the Sahara. For the projections on changes in temperature, precipitation, aridity, heat extremes, and sea-level rise, the area corresponds broadly to regions 15, 16, and 17 in the IPCC´s special report on Managing the Risks of Extreme Events and Disasters to Advance Climate Change Adaptation (SREX).

Turn Down The heaT: ClimaTe exTremes, regional impaCTs, anD The Case for resilienCe
2
Pastoral systems are also at risk from climate impacts, as livestock is affected by extreme heat, water stress, an increased prevalence of diseases, and reduced fodder availability. Marine fish stocks migrate toward higher latitudes as waters warm and potential catches may be diminished locally, adding to the already large pressure placed on ecosystems by overfishing.
Heat extremes are projected to affect increasing proportions of the region, with adverse consequences for food production sys-tems, ecosystems and human health. Direct and indirect impacts on human health are also expected, and an acceleration of the urbanization trend in response to additional pressures caused by climate change is likely to compound vulnerability.
Current Climate Trends and Projected Climate Change to 2100
Climate change exerts pressure on ecosystems and key sectors in Sub-Saharan Africa, with repercussions for the human populations dependent on them.
RainfallIn terms of precipitation, the region is characterized by significant inter-annual and inter-decadal variability, and long-term trends are uncertain and inconsistent on the sub-regional scale: For example, while West Africa has experienced declines in mean annual precipitation over the past century, an increase in the Sahel has been observed over the last decade. In southern Africa and the tropical rainforest zone, no long-term trend has been observed. Inter-annual variability has increased, however, with more intense droughts and rainfall events reported in parts of southern Africa. Eastern Africa has seen increasing rainfall in some parts over the past decades, which is a reversal of a drying trend over most parts of the region during the past century.
Under 2°C warming, the existing differences in water availability across the region are likely to become more pronounced. For example, average annual rainfall is projected to increase mainly in the Horn of Africa (with both positive and negative impacts), while parts of Southern and West Africa may see decreases in rainfall and ground-water recharge rates of 50–70 percent. Under 4°C warming, annual precipitation in Southern Africa may decrease by up to 30 percent, while East Africa is projected by many models to be wetter than today, leading to an overall decrease in the risk of drought. Some important caveats are in order however, on precipitation projections. First, there is a significant degree of uncertainty, particularly for east and west Africa. Second, even if, on an annual average, precipitation does increase, it is likely to be concentrated in bursts rather than evenly distributed over the year.2 In addition, droughts are projected to become increasingly likely over southern and central Africa. A “likely” event is defined as a >66 percent chance of occurring, using the modeling approaches adopted in this report.
TemperatureSince the 1960s, measurements show that there has been a warm-ing trend that has continued to the present, with an increase in the number of warm spells over southern and western Africa. Recent work has found a detectable human-induced warming over Africa as a whole, with warm extremes in South Africa since 1961. A summer warming trend is projected to be mostly uniformly distributed throughout the region. In a 4°C world and relative to a 30-year baseline period (1951–80), monthly summer temperature increases over Sub-Saharan Africa are projected to reach 5°C above the baseline temperature by 2100. In a 2°C world, increases in African summer temperatures are projected to peak at about 1.5°C above the baseline temperature by 2050.
As global mean temperatures rise, unusual and unprecedented heat extremes3 are projected to occur with greater frequency dur-ing summer months. By the time global warming reaches 1.5°C in the 2030s, heat extremes that are unusual or virtually absent today are projected to cover over one-fifth of land areas in the Southern Hemisphere summer months. Unprecedented monthly heat extremes, could cover up to 5 percent of land areas in this timeframe. Under 2°C warming, monthly heat extremes that are unusual or virtually absent in today´s regional climate are projected to cover nearly 45 percent of land areas by the 2050s, and unprecedented heat extremes are expected to cover up to 15 percent of land area in the summer. With global warming reaching about 4°C by the end of the century, unusual summer-time heat extremes are projected to cover most of the land areas (85 percent), with unprecedented heat extremes covering more than 50 percent.
2 Uncertainty is particularly large for East Africa due to concerns about whether the GCM models adequately capture the dynamics of the rainy seasons in that region and because higher resolution regional climate models do not seem to reproduce, but rather contradict, the increase in precipitation seen in the projections of most global models. Drought risk results from periods of anomalously low precipitation or high warming or both, but this risk is also influenced by other climate variables like wind speed and incoming radiation. Climate-model projections of warming generally have lower uncertainty, while uncertainties in precipitation projections differ between regions. Uncertainties in drought projections are smallest for Southern Africa (primarily driven by warming), somewhat larger for Central Africa (because of smaller signals of change), and largest for West Africa (for which there is large disagreement across models on precipitation changes, both in sign and in amplitude).3 In this report, unusual and unprecedented heat extremes are defined using thresholds based on the historical variability of the current local climate. The absolute level of the threshold thus depends on the natural year-to-year variability in the base period (1951–1980), which is captured by the standard deviation (sigma). Unusual heat extremes are defined as 3-sigma events. For a normal distribution, 3-sigma events have a return time of 740 years. The 2012 U.S. heat wave and the 2010 Russian heat wave classify as 3-sigma events. Unprecedented heat extremes are defined as 5-sigma events. They have a return time of several million years. Monthly temperature data do not necessarily follow a normal distribution (for example, the distribution can have “long” tails, making warm events more likely) and the return times can be dif-ferent from the ones expected in a normal distribution. Nevertheless, 3-sigma events are extremely unlikely and 5-sigma events have almost certainly never occurred.

Sub-Saharan africa: food Production at riSk
3
Likely Physical and Biophysical Impacts of Projected Climate ChangeThe projected changes in rainfall, temperature, and extreme event frequency and/or intensity will have both direct and indirect impacts on sea-level rise, aridity, crop yields, and agro-pastoral systems that would affect populations.
Projected Aridity TrendsPatterns of aridity4 are projected to shift and expand within the total area classified as such due to changes in temperature and precipitation. Arid regions are projected to spread, most notably in Southern Africa but also in parts of West Africa. Total hyper-arid and arid areas are projected to expand by 10 percent compared to the 1986–2005 period. Where aridity increases, crop yields are likely to decline as the growing season shortens. Decreased aridity is projected in East Africa; the change in area, however, does not compensate for increases elsewhere.
Sea-level RiseSea level is projected to rise more than the global average in the tropics and sub-tropics. Under a warming of 1.5°C, sea-level is projected to rise by 50 cm along Sub-Saharan Africa’s tropical coasts by 2060, with further rises possible under high-end projec-tions. In the 2°C warming scenario, sea-level rise is projected to reach 70 cm by the 2080s, with levels higher toward the south. The 4°C warming scenario is projected to result in a rise of 100 cm of sea-level by the 2090s. The difference in rate and magnitude of
sea-level rise between the 4°C warming scenario and the 2°C warm-ing scenario by 2100 becomes pronounced due to the continuing rate of sea-level rise in the higher warming scenario relative to the stabilized level under 2°C. The projected sea-level under 4°C would increase the share of the population at risk of flooding in Guinea-Bissau and Mozambique to around 15 percent by 2100, compared to around 10 percent in projections without sea-level rise; in The Gambia, the share of the population at risk of flooding would increase many fold to 10 percent of the population by 2070.
Sector-based and Thematic Impacts
EcosystemsSavanna grasslands may be reduced in area, with potential impacts on livelihoods and pastoral systems. By the time 3°C global warm-ing is reached, savannas are projected to decrease from about a quarter at present to approximately one-seventh of total land area, reducing the availability of food for grazing animals. Both changes in climatic conditions and increasing atmospheric CO2 concentration are projected to play a role in bringing about regime shifts in African ecosystems, thereby altering the composition of species. Due to
Figure 3.1: Sub-Saharan Africa – Multi-model mean of the percentage change in the Aridity Index in a 2°C world (left) and a 4°C world (right) for Sub-Saharan Africa by 2071–2099 relative to 1951–1980
In non-hatched areas, at least 4/5 (80 percent) of models agree. In hatched areas, 2/5 of the models disagree. Note that a negative change corresponds to a shift to more arid conditions. Particular uncertainty remains for East Africa, where regional climate model projections tend to show an increase in precipitation, which would be associated with a decrease in the Aridity Index (see also footnote 2). A decrease in aridity does not necessarily imply more favorable conditions for agriculture or livestock, as it may be associated with increased flood risks.
4 Aridity is characterized by a structural precipitation deficit-meaning a lack of necessary rainfall amounts for vegetation and/or crop growth-and is potentially driven by a positive feedback mechanism. In regions where the soil dries out due to a lack of precipitation, no more heat can be converted into latent heat and all heat results in increased surface temperatures. This additional heating of the land increases evaporative demand of crops and amplifies the precipitation deficit.

Turn Down The heaT: ClimaTe exTremes, regional impaCTs, anD The Case for resilienCe
4
5 The range is given across the following crops: millet, sorghum, wheat, cassava, and groundnuts.
CO2 fertilization, trees may be able to outcompete shade-intolerant grasses in savannas, leading to a reduction in grassland area and declines in food availability for livestock and other animals. It is not yet clear if the negative effects of increased drought on trees in the region would limit such forest expansion. In response to changes in temperature and rainfall variability, a 20-percent decline in tree density in the western Sahel has been observed since the 1950s.
Agricultural ProductionSeveral lines of evidence indicate a likely substantial risk to crop yields and food production adversely affecting food security by 1.5–2°C warming, with growing risks at higher levels of warming.
• High temperature sensitivity thresholds for some important crops, such as maize, wheat, and sorghum, have been observed, with large yield reductions once the threshold is exceeded. For example, the photosynthesis rate (key factor in growth and yield) of crops such as wheat and rice is at a maximum for temperatures from about 20–32°C. The IPCC AR4 report (IPCC 2007) stated that even moderate increases (1–2°C) are likely to have a negative effect on yields for major cereals like
wheat, maize, and rice; further warming will have increasingly negative effects, showing decreases in wheat yield in low latitude regions of approximately 50 percent for an increase in mean local temperature of about 5°C. As these temperature thresholds are exceeded more frequently with 2°C and 4°C warming, significant production shocks are likely.
• Loss or change of suitable areas. A 1.5°–2°C warming by the 2030s–2040s could lead to about 40–80 percent reductions in present maize, millet, and sorghum cropping areas for cur-rent cultivars. By 3°C warming, this reduction could grow to more than 90 percent.
• Significant yield decreases are expected in the near term under relatively modest levels of warming. Under 1.5–2°C warming, median yield losses of around 5 percent are pro-jected, increasing to median estimates of around –15 percent (range –5 percent to –27 percent for 2–2.5°C warming).5 Under 3–4°C warming there are indications that yields may
Table 3.1: Summary of climate impacts and risks in Sub-Saharan Africaa
Risk/Impact
Observed Vulnerability or Change
Around 1.5°Cb,c (≈2030sd)
Around 2°C (≈2040s)
Around 3°C (≈2060s)
Around 4°C (≈2080s)
Heat extremee (in the Southern Hemisphere summer)
Unusual heat extremes
Virtually absent
20–25 percent of land
45 percent of land 70 percent of land >85 percent of land
Unprecedented heat extremes
absent <5 percent of land 15 percent of land 35 percent of land >55 percent of land
Drought Increasing drought trends observed since 1950
Increasing drought risk in southern, cen-tral, and West Africa, decrease in East Africa, but West and East African projec-tions are uncertain
Likely risk of severe drought in south-ern and central Africa, increased risk in West Africa, decrease in east Africa but west and East African projec-tions are uncertain
Likely risk of extreme drought in southern Africa and severe drought in central Af-rica, increased risk in West Africa, decrease in East Africa, but West and East African pro-jections are uncertain
Likely risk of extreme drought in southern Africa and severe drought in cen-tral Africa, increased risk in West Africa, decrease in East Africa, but West and East African projections are uncertain
Aridity increased drying
Little change expected
Area of hyper-arid and arid regions grows by 3 percent
Area of hyper-arid and arid regions grows by 10 percent. Total arid and semi-arid area increases by 5 percent
Sea-level rise above present (1985–2005)
About 21 cm to 2009f
30cmg-2040s50cm-207070cm by 2080–2100
30cm-2040s50cm-207070cm by 2080–2100
30cm-2040s50cm-206090cm by 2080–2100
30cm-2040s50cm-2060105cm by 2080–2100
a A more comprehensive table of impacts and risks for SSA is presented at the end of Chapter 3.b Refers to the global mean increase above pre-industrial temperatures.c Years indicate the decade during which warming levels are exceeded in a business-as-usual scenario exceeding 4°C by the 2080s.d Years indicate the decade during which warming levels are exceeded with a 50 percent or greater change (generally at the start of the decade) in a business-as-usual scenario (RCP8.5 scenario). Exceedance with a likely chance (>66 percent) generally occurs in the second half of the decade cited.e Mean heat extremes across climate model projections are given. Illustrative uncertainty range across the models (minimum to maximum) for 4°C warming are 70–100 percent for unusual extremes, and 30–100 percent for unprecedented extremes. The maximum frequency of heat extreme occurrence in both cases is close to 100 percent, as indicator values saturate at this level.f Above 1880 estimated global mean sea level.g Add 20 cm to get an approximate estimate above the pre-industrial sea level.

Sub-Saharan africa: food Production at riSk
5
decrease by around 15–20 percent across all crops and regions, although the availability of studies estimating potential yield impacts is limited.
• Per capita crop production at warming of about 1.8°C (by the 2050s) is projected to be reduced by 10 percent compared to a case without climate change. With larger yield reductions projected for higher levels of warming, this risk could grow; however, this has yet to be quantified. Livestock production is also expected to suffer due to climate impacts on forage availability and heat stress.
• Diversification options for agro-pastoral systems (e.g., switch-ing to silvopastoral systems, irrigated forage production, and mixed crop-livestock systems) are likely to dwindle as climate change reduces the carrying capacity of the land and livestock productivity. The livestock sector has been vulnerable to drought in the past. For example, pastoralists in southern Ethiopia lost nearly 50 percent of their cattle and about 40 percent of their sheep and goats to droughts between 1995–97.
• The CO2 fertilization effect remains uncertain. A strong positive response of crops to increasing atmospheric CO2 concentrations would help to dampen the impacts related to changes in tem-perature and precipitation. However, important crops, including maize, sorghum, and pearl millet—among the dominant crops in Africa—are not very sensitive to atmospheric CO2 concen-trations. Furthermore, the magnitude of these effects remains uncertain when compared with the results from the free-air CO2 enrichment (FACE)6 experiments, because the fertilization effects used in various models appear to be overestimated. Under sustained CO2 fertilization, the nutritional value of grain per unit of mass has been observed to decrease.
FisheriesLivelihoods dependent on fisheries and other ecosystem services are projected to be threatened in some regions, with critical species possibly ceasing to be locally available. Potential fish catches off the coast of West Africa, where fish accounts for as much as 50 per-cent of the animal protein consumed, is likely to be reduced by as much as 50 percent by the 2050s (compared to 2000 levels). In other regions, such as the eastern and southeastern coasts of Sub-Saharan Africa, yield potential has been projected to increase.
HealthMalnutrition can have major secondary health implications by causing childhood stunting or by increasing susceptibility to other diseases. Under warming of 1.2–1.9°C, undernourishment levels are expected to be in the range of 15–65 percent, depend-ing on the sub-region, due to crop yield and nutritional quality declines. Moderate stunting of children under age five is expected to occur at a rate of 16–22 percent, and severe stunting at a rate
of 12–20 percent. Without climate change, however, moderate stunting rates are projected to remain close to present levels (21–30 percent across the region), and severe stunting is projected to decrease by 40 percent.
Integrated Synthesis of Climate Change Impacts in Sub-Saharan Africa
Sub-Saharan Africa is confronted with a range of climate risks that could have far-reaching repercussions for the region´s societies and economies. Even in a situation in which warming is limited below 2°C, there are very substantial risks that would continue to grow as warming approaches 4°C.
Climate Change Projected to Increase Poverty and Risks from DiseasePoverty in the region may grow even further due to climate impacts, as poor households with climate sensitive sources of income are often disproportionately affected by climate change and large parts of the population still depend on the agricultural sector as their primary source of food security and income. Below 2°C warming, large regional risks to food production and security emerge; these risks would become stronger if adaptation measures were inad-equate and the CO2 fertilization effect is weak. Poverty has been estimated to increase by up to one percent following severe food production shocks in Malawi, Uganda, and Zambia. As warming approaches 4°C, the impacts across sectors increase.
Malnutrition as a consequence of impacts on food production further increases susceptibility to diseases, compounding the overall health risks in the region. Childhood stunting resulting from malnutrition is associated with reductions in both cognitive ability and school performance. Projected crop yield losses and adverse effects on food production that result in lower real incomes would exacerbate poor health conditions and malnutrition; with malaria and other diseases expected to worsen under climate change, adverse effects on childhood educational performance may be expected.
The diseases that pose a threat in Sub-Saharan Africa as a conse-quence of climate change include vector- and water-borne diseases such as malaria, Rift Valley fever, and cholera. The risk of these diseases is expected to rise as changes in temperature and precipita-tion patterns increase the extent of areas with conditions conducive to vectors and pathogens. Other impacts expected to accompany climate change include mortality and morbidity due to such extreme events as flooding and more intense and hotter heat waves.
6 FACE experiments measure the effect of elevated CO2 concentrations in the open air, thereby excluding factors in a traditional laboratory setting that may influence experimental results.

Turn Down The heaT: ClimaTe exTremes, regional impaCTs, anD The Case for resilienCe
6
Climate Change Expected to Challenge Urban Development, Infrastructure, and EducationThe existing urbanization trend in Sub-Saharan Africa could be accelerated by the stresses that climate change is expected to place on rural populations. These pressures are expected to arise partly through impacts on agricultural production, which currently provides livelihoods to 60 percent of the labor force in the region. Migration to urban areas may provide new livelihood opportunities, but it also exposes migrants to new risks. Conditions that characterize poor urban areas, including overcrowding and inadequate access to water, drainage, and sanitation facilities, aid the transmission of vector- and water-borne diseases. As many cities are located in coastal areas, they are exposed to coastal flooding because of sea-level rise. The poorest urban dwellers tend to be located in vulnerable areas, such as floodplains and steep slopes, further plac-ing them at risk of extreme weather events. Impacts occurring even far-removed from urban areas can be felt in these communities. For example, food price increases following agricultural produc-tion shocks have the most damaging consequences within cities.
Impacts on infrastructure caused by sea-level rise can have effects on human and economic development, including impacts on human health, port infrastructure, and tourism. For example, floods in 2009 in the Tana Delta in Kenya cut off medical ser-vices to approximately 100,000 residents; sea-level rise of 70cm by 2070 would cause damages to port infrastructure in Dar es Salaam, Tanzania—a hub for international trade—exposing assets of US$10 billion, or more than 10 percent of the city’s GDP (Kebede and Nicholls 2011). Such damage to the Dar es Salaam port would have would have larger economic consequences since it serves as the seaport for several of its landlocked neighbours.
There are indications that climate change could impact the ability to meet the educational needs of children in particularly vulnerable regions. Projected crop yield losses and adverse effects on food production would exacerbate poor health conditions and malnutrition; with malaria and other diseases expected to worsen under climate change, adverse effects on childhood educational performance may be expected. Childhood stunting resulting from malnutrition is associated with reduced cognitive ability and school performance. The projected increase in extreme monthly tempera-tures within the next few decades may also have an adverse effect on learning conditions for students and teachers.
Overall, populations in Sub-Saharan Africa are expected to face mounting pressures on food production systems and risks associated with rising temperature and heat extremes, drought, changing precipitation patterns, sea-level rise, and other extreme events. Health impacts are likely to increase and be exacerbated by high rates of malnutrition, with possible far-reaching and long-term consequences for human develop-ment. Significant crop yield reductions at warming levels as low as 2°C warming are expected to have strong repercussions on food security for vulnerable populations, including in many growing urban areas. These and other impacts on infrastructure, in combination, may negatively impact economic growth and poverty reduction in the region. A warming of 4°C is projected to bring large reductions in crop yield, with highly adverse effects on food security, major increases in drought severity and heat extremes, reductions in water availability, and disruption and transformation of important ecosystems. These impacts may cause large adverse consequences for human populations and livelihoods and are likely to be highly deleterious to the development of the region.

7
coastal zones across a diverse mix of mainland, peninsulas, and islands; the related regional sea-land interactions; and the large num-ber of interacting climate drivers that give rise to the local climate.
TemperatureIn a 2°C world, average summer warming in the region is projected to be around 1.5°C (1.0–2.0°C) by the 2040s. In a 4°C world, South East Asian average summer temperatures over land are projected to increase by around 4.5°C (3.5–6°C) by 2100. This is
7 Brunei, Cambodia, Indonesia, Laos, Malaysia, Myanmar, Papua New Guinea, the Philippines, Singapore, Thailand, Timor Leste, and Vietnam.
Regional SummaRy
In this report, South East Asia refers to a region comprising 12 coun-tries7 with a population of ~590 million in 2010. In 2050, the population is projected to be around 760 million, 65 percent urban-based, and concentrated along the coast.
Major impacts on the region and its natural resources are projected for warming levels of 1.5–2°C, resulting in coral reefs being threatened with consequent damage to tourism- and fisheries-based livelihoods and decreases in agricultural production in the delta regions due to sea-level rise. For example, by the 2040s, a 30 cm sea-level rise is projected to reduce rice production in the region’s major rice growing region—the Mekong River Delta—by about 2.6 million tons per year, or about 11 percent of 2011 pro-duction. Marine fish capture is also projected to decrease by about 50 percent in the southern Philippines during the 2050s due to warmer sea temperatures and ocean acidification.
With 4°C global warming, there could be severe coastal ero-sion due to coral reef dieback. Sea level is projected to rise up to 100 cm by the 2090s; this would be compounded by projected increases in the intensity of the strongest tropical cyclones making landfall in the region. In addition, unprecedented heat extremes over nearly 90 percent of the land area during the summer months (June, July and August) is likely to result in large negative impacts.
Current Climate Trends and Projected Climate Change to 2100
Climate projections for South East Asia are very challenging due to the region’s complex terrain, comprising mountains, valleys, and
South East Asia: Coastal Zones and Productivity at Risk

Turn Down The heaT: ClimaTe exTremes, regional impaCTs, anD The Case for resilienCe
8
substantially lower than the global-mean surface warming over land, because the region’s climate is more strongly influenced by sea-surface temperatures that are increasing at a slower rate than in other regions with a larger continental land surface.
In tropical South East Asia, however, heat extremes are projected to escalate with extreme temperature events frequently exceeding temperature ranges due to natural climate variability. For example, under a 2°C global warming scenario, currently unusual heat extremes8 during the summer are projected to cover nearly 60–70 per-cent of the land area. Unprecedented heat extremes could occupy up to 30–40 percent of land area. In a 4°C world, summer months that in today´s climate would be termed unprecedented might be the new normal, affecting nearly 90 percent of the land area during the summer months. More important, the South East Asia region is one of two regions (the other being the Amazon) which is projected to see, in the near-term, a strong increase in monthly heat extremes with the number of warm days9 projected to increase from 45–90 days/year under a 2°C world to around 300 days for a 4°C world.
RainfallThe use of climate models to project future rainfall changes is espe-cially difficult for South East Asia because both the Asian and the Australian summer monsoons affect the region and large differences remain between individual models. For 4°C warming, there is no agreement across models for South East Asia, with changes either not statistically significant, or ranging from a decrease of 5 percent to an increase of 10 percent in monsoon rainfall. Despite these moderate changes, the latest model projections show a substantial and rising increase in both the magnitude and frequency of heavy precipitation events. The increase of extreme rainfall events10 is projected to rise rapidly with warming, and to contribute more than a 10-percent share of annual rainfall for 2°C and a 50-percent share for 4°C warming, respectively. At the same time the maximum number of consecutive dry days, which is a measure for drought, is also projected to increase, indicating that both minimum and maximum precipitation extremes are likely to be amplified.
Likely Physical and Biophysical Impacts as a Function of Projected Climate Change
Sea-level RiseSea-level rise along the South East Asian coastlines is projected to be about 10–15 percent higher than the global mean by the end of the 21st century. In a 4°C world, the projected regional sea-level rise is likely11 to exceed 50 cm above present levels12 by 2060, and 100 cm by 2090, with Manila being especially vulnerable. In a 2°C world, the rise is significantly lower for all locations, but still considerable, at 75 (65–85) cm by 2090. Local land subsidence due to natural or human influences would increase the relative sea-level rise in specific locations.
Tropical Cyclone RiskAn increase in the frequency of the most intense storms13 along with associated extreme rainfall is projected for South East Asia. Maximum surface wind speed during tropical cyclones is projected to increase by 7–18 percent for a warming of around 3.5°C above pre-industrial levels for the western North Pacific basin, but the center of activity is projected to shift north and eastward. The maximum wind speed of tropical cyclones making landfall is projected to increase by 6 and 9 percent respectively for mainland South East Asia and the Philippines, combined with a decrease of 35 and 10 percent respectively in the overall number of land-falling cyclones. As sea-surface temperatures rise, tropical-cyclone-related rainfall is expected to increase by up to a third, indicating a higher level of flood risk in low lying and coastal regions.
Saltwater IntrusionFor several South East Asia countries, salinity intrusion in coastal areas is projected to increase significantly with rising sea levels. For example, a 1 m sea-level rise by 2100 in the land area affected by saltwater intrusion in the Mahaka River region in Indonesia is expected to increase by 7–12 percent under 4°C warming. In the Mekong River Delta, it is projected that a 30-cm sea-level rise by the 2050s in both the 2°C and 4°C worlds would increase by over 30 percent the total current area (1.3 million ha) affected by salinity intrusion.
Coral Reef Loss and DegradationCoral reefs flourish in a relatively narrow range of temperature tolerance and are hence highly vulnerable to sea-surface tempera-ture increases; together with the effects of ocean acidification, this exposes coral reefs to more severe thermal stress, resulting in bleaching. Rising sea surface temperatures have already led to major, damaging coral bleaching events14 in the last few decades. Under 1.5°C warming, there is a high risk (50-percent probabil-ity) of annual bleaching events occurring as early as 2030 in the
8 Extremes are defined by present-day, local natural year-to-year variability of around 1°C, which are projected to be exceeded frequently even with low levels of average warming. Unprecedented = record breaking over the entire measurement recording period.9 Defined by historical variability, independent of emissions scenario, with tem-perature beyond the 90th percentile in the present-day climate.10 Estimated as the share of the total annual precipitation.11 Where “likely” is defined as >66 percent chance of occurring, using the modeling approaches adopted in this report.12 1986–2005 levels.13 Category 4 and 5 on the Saffir-Simpson wind scale.14 Coral bleaching events can be expected when a regional, warm seasonal maximum temperature is exceeded by 1°C for more than four weeks, and bleaching becomes progressively worse at higher temperatures or longer periods over which the regional threshold temperature is exceeded. While coral reefs can survive a bleaching event, they are subject to high mortality and take several years to recover. When bleaching events become too frequent or extreme, coral reefs can fail to recover.

SoUTh EAST ASIA: CoASTAL ZoNES ANd PRodUCTIVITY AT RISk
9
region. Projections indicate that all coral reefs are very likely to experience severe thermal stress by the year 2050 at warming levels of 1.5°C–2°C above pre-industrial levels. In a 2°C world, coral reefs will be under significant threat, and most coral reefs are projected to be extinct long before 4°C warming is reached with the loss of associated marine fisheries, tourism, and coastal protection against sea-level rise and storm surges.
Sector-based and Thematic Impacts
River deltas, such as the Mekong River Delta, experience regular flooding as part of the natural annual hydrological cycle. Such flooding plays an important economic and cultural role in the region’s deltas. Climate change projections for sea-level rise and tropical cyclone intensity, along with land subsidence caused by human activities, would expose populations to heightened risks, including excess flooding, saltwater intrusion, and coastal erosion. These consequences would occur even though deltaic regions tend to be relatively resilient to unstable water levels and salinity. The three river deltas of the Mekong, Irrawaddy, and Chao Phraya, all with significant land areas below 2 m above sea level, are highly threatened by these risk factors.
Coastal cities with large and increasing populations and assets are exposed to climate-change-related risks, including increased tropical storm intensity, long-term sea-level rise, and sudden-onset fluvial and coastal flooding. Estimating the number of people exposed to the impacts of sea-level rise is made difficult
by uncertainties inherent to sea-level rise projections, as well as population and economic growth scenarios. Bangkok,15 Jakarta, Ho Chi Minh City, and Manila stand out as being particularly vulnerable to climate-driven impacts. Many millions in Bangkok and Ho Chi Minh City are projected to be exposed to the effects of a 50 cm sea-level rise16 by the 2070s. High levels of growth of both urban populations and GDP further increase exposure to climate change impacts in these areas. Further, the effect of heat extremes are also particularly pronounced in urban areas due to the urban heat island effect, caused in large part by the density of buildings and the size of cities, which results in higher human mortality and morbidity rates in cities than in the rural surround-ings. The urban poor are particularly vulnerable to environmental stresses; floods associated with sea-level rise and storm surges pose significant flood damage and health risks to populations in informal settlements. In 2005, about 40 percent of the urban population of Vietnam and 45 percent of the urban population in the Philippines lived in informal settlements.
Agricultural production in the region, particularly rice pro-duction in the Mekong Delta, is exposed to sea-level rise due to
15 Without adaptation, the area of Bangkok is projected to be inundated result-ing from flooding due to extreme rainfall events and sea-level rise increases from around 40 percent under a 15 cm sea-level rise above present levels (which could occur by the 2030s), to about 70 percent under an 88 cm sea-level rise scenario (which would be approached by the 2080s under 4°C warming).16 Assuming 50 cm local subsidence.
Figure 4.1: South East Asia – The regional pattern of sea-level rise in a 4°C world (left; RCP8.5) as projected by using the semi-empirical approach adopted in this report and time-series of projected sea-level rise for two selected cities in the region (right) for both RCP2.6 (2ºC world) and RCP8.5 (4°C world)
Turn Down The heaT: ClimaTe exTremes, regional impaCTs, anD The Case for resilienCe
10
its low elevation above sea level. A sea-level rise of 30 cm, which could occur as early as 2040, is projected to result in the loss of about 12 percent of the cropping area of the Mekong Delta Province due to flooding (5 percent loss) and salinity intrusion (7 percent). Whilst some rice cultivars are more resilient than others, there is evidence that all rice is vulnerable to sudden and total inundation when this is sustained for several days, where flooding, sensitivity thresholds even of relatively resilient rice cultivars may be exceeded and production severely impacted. Temperature increases beyond thresholds during critical rice growth phases (tillering, flowering, grain filling) may further impact productivity.
Aquaculture, which is also at risk from several climate change impacts, is a rapidly growing and economically important industry in South East Asia. In Vietnam, for example, it has grown rapidly; in 2011, it generated about 5 percent of its GDP, up from about 3 per-cent in 2000. Rapid sectoral growth has also been observed in other South East Asian countries. Aquaculture also supplies nearly 40 per-cent of dietary animal protein in South East Asia derived from fish, and is thus critical to food security in the region. Aquaculture farms are projected to be damaged by increasingly intense tropical cyclones and salinity intrusion associated with sea-level rise, particularly for
freshwater and brackish water aquaculture farms. In addition increas-ing temperatures may exceed the tolerance thresholds of regionally important farmed species. Extreme weather events, such as tropical cyclones and coastal floods, already affect aquaculture activities in South East Asia. For example, the category 4 Typhoon Xangsane devastated more than 1,200 hectares of aquaculture area in Vietnam in 2006 while the Indonesian Typhoons Vincente (Category 4) and Saola (Category 2) negatively impacted about 3,000 aquaculture farmers and resulted in over $9 million in damages to the fishery sector (Xinhua, 2012).
Fisheries, particularly coral reef fisheries, are expected to be effected by the impacts of sea-level rise, warmer oceans, and ocean acidification associated with rising atmospheric and ocean CO2 concentrations. Substantial reductions in catch potential are projected. The projected changes in maximum catch potential range from a 16-percent decrease in the waters of Vietnam to a 6–16 percent increase around the northern Philippines. Addition-ally, marine capture fisheries production (not directly associated with coral systems) are projected to decline by 50 percent around the southern Philippines. Such shifts in catch potential are likely to place additional challenges on coastal livelihoods in the region.
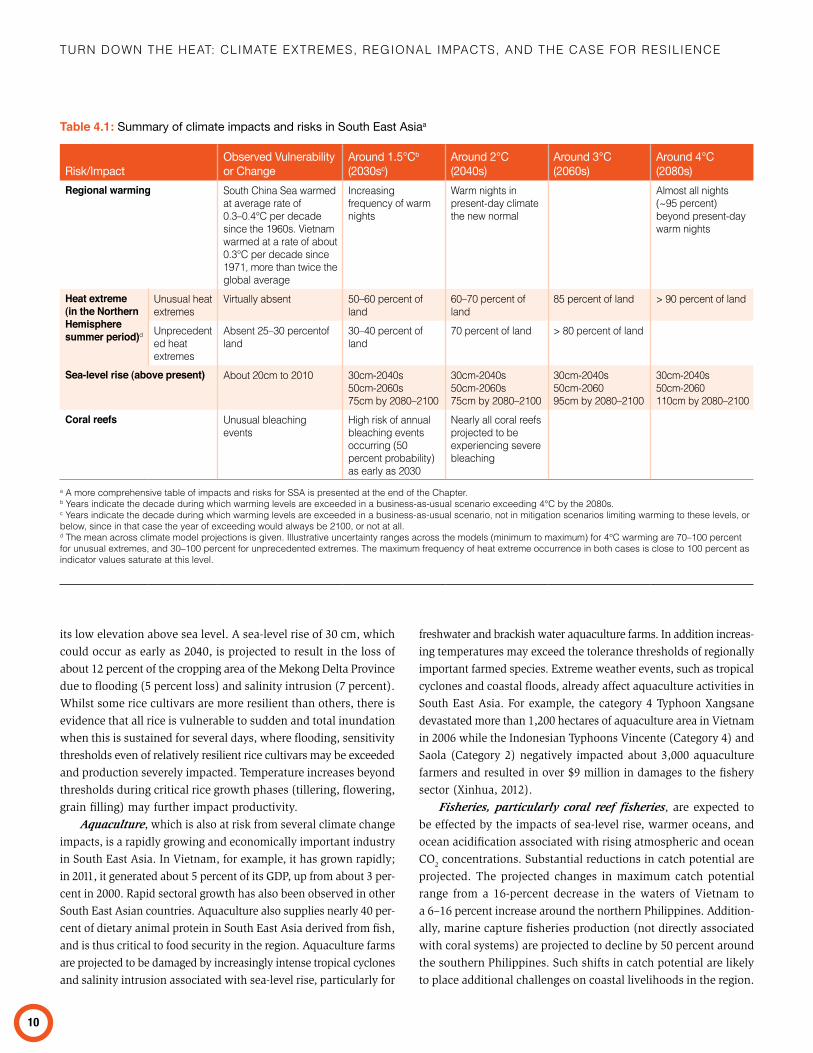
Table 4.1: Summary of climate impacts and risks in South East Asiaa
Risk/ImpactObserved Vulnerability or Change
Around 1.5°Cb (2030sc)
Around 2°C (2040s)
Around 3°C (2060s)
Around 4°C (2080s)
Regional warming South China Sea warmed at average rate of 0.3–0.4°C per decade since the 1960s. Vietnam warmed at a rate of about 0.3°C per decade since 1971, more than twice the global average
Increasing frequency of warm nights
Warm nights in present-day climate the new normal
Almost all nights (~95 percent) beyond present-day warm nights
Heat extreme (in the Northern Hemisphere summer period)d
Unusual heat extremes
Virtually absent 50–60 percent of land
60–70 percent of land
85 percent of land > 90 percent of land
Unprecedent ed heat extremes
Absent 25–30 percentof land
30–40 percent of land
70 percent of land > 80 percent of land
Sea-level rise (above present) About 20cm to 2010 30cm-2040s 50cm-2060s 75cm by 2080–2100
30cm-2040s 50cm-2060s 75cm by 2080–2100
30cm-2040s 50cm-2060 95cm by 2080–2100
30cm-2040s 50cm-2060 110cm by 2080–2100
Coral reefs Unusual bleaching events
high risk of annual bleaching events occurring (50 percent probability) as early as 2030
Nearly all coral reefs projected to be experiencing severe bleaching
a A more comprehensive table of impacts and risks for SSA is presented at the end of the Chapter.b Years indicate the decade during which warming levels are exceeded in a business-as-usual scenario exceeding 4°C by the 2080s.c Years indicate the decade during which warming levels are exceeded in a business-as-usual scenario, not in mitigation scenarios limiting warming to these levels, or below, since in that case the year of exceeding would always be 2100, or not at all.d The mean across climate model projections is given. Illustrative uncertainty ranges across the models (minimum to maximum) for 4°C warming are 70–100 percent for unusual extremes, and 30–100 percent for unprecedented extremes. The maximum frequency of heat extreme occurrence in both cases is close to 100 percent as indicator values saturate at this level.

SoUTh EAST ASIA: CoASTAL ZoNES ANd PRodUCTIVITY AT RISk
11
Integrated Synthesis of Climate Change Impacts in the South East Asia Region
South East Asia is highly and increasingly exposed to slow onset impacts associated with sea-level rise, ocean warming and acidification, coral bleaching, and associated loss of biodiversity, combined with sudden-onset impacts associated with increased tropical cyclone intensity and greater heat extremes. The combined impacts are likely to have adverse effects on several sectors simul-taneously. The cumulative effects of the slow-onset impacts may undermine resilience and increase vulnerability to more extreme weather events, with this complex pattern of exposure increasing with higher levels of warming and sea-level rise.
Growing Risks to Populations, Livelihoods and Food Production in River DeltasPopulations and associated cropping and fisheries systems and livelihoods along the rivers and in the river deltas are expected to be the most severely affected by risks from rising sea levels, more intense rainfall events, and storm surges associated with tropical cyclones.
For example, the Mekong River and its tributaries are crucial to rice production in Vietnam. A total of 12 provinces constitute the Mekong Delta, popularly known as the “Rice Bowl” of Vietnam; it is home to some 17 million people, of whom 80 percent are engaged in rice cultivation. The delta produces around 50 percent of the country’s total production and contributes significantly to Vietnam’s rice exports. Any shortfall in rice production in this area because of climate change would not only affect the economy in and food security of Vietnam but would also have repercussions for the international rice market.
The Mekong Delta is also Vietnam’s most important fishing region. It is home to almost half of Vietnam’s marine fishing ves-sels and produces two thirds of Vietnam’s fish from aquaculture systems. Important industries such as aquaculture are projected to suffer increasing costs and damages associated with salinization and rising temperatures. Observed human vulnerability in deltas in the region is high: When tropical cyclone Nargis17 hit the Irrawaddy River Delta in Myanmar in 2008 it resulted in over 80,000 deaths, temporarily displaced 800,000 people, submerged large areas of farming land, and caused substantial damage to food production and storage.
Health impacts associated with saltwater intrusion are likely to increase. Sea-level rise and tropical cyclones may increase salinity intrusion, thereby contaminating freshwater resources—an effect that can persist for years. The most common health implication is hypertension; however there are a broad range of health problems potentially linked to increased salinity exposure through bathing, drinking, and cooking. These include miscarriages, skin disease, acute respiratory infection, and diarrheal disease.
Increasing Pressure on Coastal Cities and Urban ExposureEspecially in South East Asia, coastal cities concentrate increas-ingly large populations and assets exposed to increased tropical storm intensity, long-term sea-level rise, sudden-onset coastal flooding, and other risks associated with climate change. Without adaptation, Bangkok is projected to be inundated due to extreme rainfall events and sea-level rise increases from around 40 percent under a 15 cm sea-level rise above present levels (which could occur by the 2030s) to about 70 percent under an 88 cm sea-level rise scenario (which could occur by the 2080s under 4°C warm-ing). The effect of heat extremes are particularly pronounced in urban areas due to the urban heat island effect; this could result in high human mortality and morbidity rates in cities. These risks are particularly acute, as in the Philippines and Vietnam, where almost 40 percent of the population lives in informal settlements, where health threats can quickly be exacerbated by a lack of, and/or damage to, sanitation and water facilities. The high population density in such areas compounds these risks.
The projected degradation and loss of coral reefs, decreased fish availability, and pressures on other near-coastal rural produc-tion due to sea-level rise within the next few decades is likely to lead to diminishing livelihoods in coastal and deltaic areas. Increased migration to urban areas has already been occurring. Urban migration may result in more urban dwellers being exposed to climate impacts in the cities of South East Asia, especially new arrivals who are likely to crowd into existing and densely populated informal settlements.
Compound Risks to the Tourism Industry and to BusinessesProjected increases in sea-level rise, the intensity of tropical cyclones, and the degradation and loss of coral reefs pose signifi-cant risks to the tourism industry by damaging infrastructure and natural resources and assets that enhance the region’s appeal as a tourist destination. Research indicates that the threat of tropi-cal cyclones appears to have a negative effect on tourists’ choice of destination on the same scale as deterrents such as terrorist attacks and political crises.
Loss of coastal assets due to erosion has already been observed and can be expected to accelerate. Sea-level rise has already con-tributed directly to increased coastal erosion in the Red River Delta and other regions. Coastal erosion in the Mekong River Delta is expected to increase significantly under a 100 cm sea-level rise by 2100. Projected beach losses for the San Fernando Bay area of the Philippines will substantially affect beach assets and a considerable number of residential structures.
17 Land fall as a Category 4 storm on the Saffir-Simpson scale.

Turn Down The heaT: ClimaTe exTremes, regional impaCTs, anD The Case for resilienCe
12
Coral bleaching and reef degradation and losses are very likely to accelerate in the next 10–20 years; hence, revenue generated from diving and sport fishing also appears likely to be affected in the near term. The degradation of coral reefs could result in the loss of fisheries and the coastal protection offered by reefs, as well as the loss of tourists upon whom coastal populations and economies often depend.
The risks and damages projected for a warming level of 1.5–2°C in South East Asia are very significant. The physical exposure to climate change at this level of warming includes substantial areas
of South East Asia subjected to unprecedented heat extremes, 50 cm of sea-level rise by the 2050s and 75 cm or more by 2100. The biophysical damages projected include the loss of large areas of coral reefs, significant reductions in marine food production, and more intense tropical cyclones with related storm surges and flooding. Substantial losses of agricultural production in impor-tant rice-growing regions are projected to result from sea-level rise, as is the risk of significant flooding in major coastal cities. Significant damages to the tourism industry and to aquaculture are also projected.

13
South Asia: Extremes of Water Scarcity and Excess
Regional SummaRy
In this report, South Asia refers to a region comprising seven coun-tries18 with a growing population of about 1.6 billion people in 2010, which is projected to rise to over 2.2 billion by 2050. At 4°C global warming, sea level is projected to rise over 100 cm by the 2090s, monsoon rainfall to become more variable with greater frequency of devastating floods and droughts. Glacier melting and snow cover loss could be severe, and unusual heat extremes in the summer months (June, July, and August) are projected to affect 70 percent of the land area. Furthermore, agricultural production is likely to suffer from the combined effects of unstable water supply, the impacts of sea-level rise, and rising temperatures. The region has seen robust economic growth in recent years, yet poverty remains widespread and the combination of these climate impacts could severely affect the rural economy and agriculture. Dense urban populations, meanwhile, would be especially vulnerable to heat extremes, flooding, and disease.
Current Climate Trends and Projected Climate Change to 2100
South Asia has a unique and diverse geography dominated in many ways by the highest mountain range on Earth, the Himalayan mountain range and Tibetan Plateau, giving rise to the great river systems of the Indus, Ganges, and Brahmaputra. The climate of the region is dominated by the monsoon: The largest fraction of precipitation over South Asia occurs during the summer monsoon season. Eighty percent of India’s rainfall, for example, occurs in this period. The timely arrival of the summer monsoon, and its regular-ity, are critical for the rural economy and agriculture in South Asia.
Under future climate change, the frequency of years with above normal monsoon rainfall and of years with extremely deficient rainfall is expected to increase. The Ganges, Indus, and Brahmaputra—are vulnerable to the effects of climate change due to the melting of glaciers and loss of snow cover. The result
18 Bangladesh, Bhutan, India, the Maldives, Nepal, Pakistan, and Sri Lanka. This follows the SREX regional definition and hence does not include Afghanistan. Some of the studies reviewed in the report however include Afghanistan, and less frequently Iran or Turkey, in their assessment for South Asia.

Turn Down The heaT: ClimaTe exTremes, regional impaCTs, anD The Case for resilienCe
14
is a significant risk to stable and reliable water resources for the region, with increases in peak flows associated with the risk of flooding and dry season flow reductions threatening agriculture.
In the past few decades a warming trend has begun to emerge over South Asia, particularly in India, which appears to be consis-tent with the signal expected from human induced climate change. Recent observations of total rainfall amounts during the monsoon period indicate a decline in rainfall, likely due to the effects of anthropogenic aerosols, particularly black carbon. In addition to these patterns there are observed increases in the frequency of the most extreme precipitation events, as well as increases in the frequency of short drought periods.
RainfallDuring recent decades, increases in the frequency of the most extreme precipitation events have been observed. Annual pre-cipitation is projected to increase by up to 30 percent in a 4°C world. The seasonal distribution of precipitation is expected to become amplified, with a decrease of up to 30 percent during the dry season and a 30 percent increase during the wet season.
TemperatureIn a 4°C world, South Asian summer temperatures are projected to increase by 3°C to nearly 6°C by 2100, with the warming most pronounced in Pakistan. The pattern remains the same in a 2°C world, with warming reaching 2°C in the northwestern parts of the region and 1°C to 2°C in the remaining regions. By the time 1.5°C warming is reached, heat extremes that are unusual or virtually absent in today´s climate in the region are projected to cover 15 percent of land areas in summer.
Under 2°C warming, unusual extreme heat over 20 percent of the land area is projected for Northern Hemisphere summer months, with unprecedented heat extremes affecting about 5 percent of the land area, principally in the south. Under 4°C warming, the west coast and southern India, as well as Bhutan and north-ern Bangladesh, are projected to shift to new, high-temperature climatic regimes. Unusual heat is projected for 60–80 percent of the Northern Hemisphere summer months in most parts of the region. Some regions are projected to experience unprecedented heat during more than half of the summer months, including Sri Lanka and Bhutan. In the longer term, the exposure of South Asia
Figure 5.1: South Asia Multi-model mean of the percentage change dry-season (DJF, left) and wet-season (JJA, right) precipitation for RCP2.6 (2ºC world; top) and RCP8.5 (4ºC world; bottom) for South Asia by 2071–2099 relative to 1951–1980
hatched areas indicate uncertainty regions with 2 out of 5 models disagreeing on the direction of change compared to the remaining 3 models.
SoUTh ASIA: ExTREMES of WATER SCARCITY ANd ExCESS
15
to an increase in these extremes could be substantially limited by holding warming below 2°C.
Likely Physical and Biophysical Impacts as a Function of Projected Climate ChangeThe projected changes in rainfall, temperature, and extreme event frequency and/or intensity would have both direct and indirect impacts on monsoon activity, droughts, glacial loss, snow levels, river flow, ground water resources, and sea-level rise.
MonsoonWhile most modeling studies project increases in average annual monsoonal precipitation over decadal timescales, they also project significant increases in inter-annual and intra-seasonal variability.
For global mean warming approaching 4°C, a 10 percent increase in annual mean monsoon intensity and a 15 percent increase in year-to-year variability of Indian summer monsoon precipitation is projected compared to normal levels during the first half of the 20th century. Taken together, these changes imply
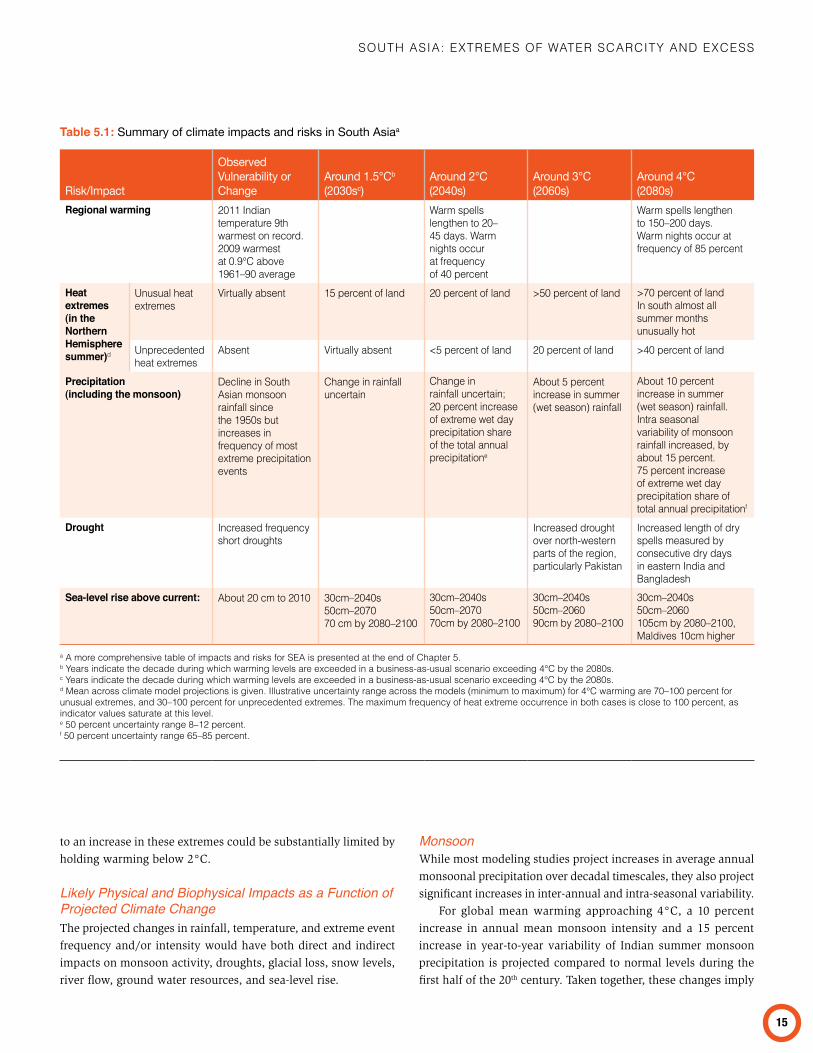
Table 5.1: Summary of climate impacts and risks in South Asiaa
Risk/Impact
Observed Vulnerability or Change
Around 1.5°Cb (2030sc)
Around 2°C (2040s)
Around 3°C (2060s)
Around 4°C (2080s)
Regional warming 2011 Indian temperature 9th warmest on record. 2009 warmest at 0.9°C above 1961–90 average
Warm spells lengthen to 20–45 days. Warm nights occur at frequency of 40 percent
Warm spells lengthen to 150–200 days. Warm nights occur at frequency of 85 percent
Heat extremes(in the Northern Hemisphere summer)d
Unusual heat extremes
Virtually absent 15 percent of land 20 percent of land >50 percent of land >70 percent of landIn south almost all summer months unusually hot
Unprecedented heat extremes
absent Virtually absent <5 percent of land 20 percent of land >40 percent of land
Precipitation(including the monsoon)
decline in South Asian monsoon rainfall since the 1950s but increases in frequency of most extreme precipitation events
Change in rainfall uncertain
Change in rainfall uncertain; 20 percent increase of extreme wet day precipitation share of the total annual precipitatione
About 5 percent increase in summer (wet season) rainfall
About 10 percent increase in summer (wet season) rainfall. intra seasonal variability of monsoon rainfall increased, by about 15 percent.75 percent increase of extreme wet day precipitation share of total annual precipitationf
Drought Increased frequency short droughts
Increased drought over north-western parts of the region, particularly Pakistan
Increased length of dry spells measured by consecutive dry days in eastern India and Bangladesh
Sea-level rise above current: About 20 cm to 2010 30cm–2040s50cm–207070 cm by 2080–2100
30cm–2040s50cm–207070cm by 2080–2100
30cm–2040s50cm–206090cm by 2080–2100
30cm–2040s50cm–2060105cm by 2080–2100, Maldives 10cm higher
a A more comprehensive table of impacts and risks for SEA is presented at the end of Chapter 5.b Years indicate the decade during which warming levels are exceeded in a business-as-usual scenario exceeding 4°C by the 2080s.c Years indicate the decade during which warming levels are exceeded in a business-as-usual scenario exceeding 4°C by the 2080s.d Mean across climate model projections is given. Illustrative uncertainty range across the models (minimum to maximum) for 4°C warming are 70–100 percent for unusual extremes, and 30–100 percent for unprecedented extremes. The maximum frequency of heat extreme occurrence in both cases is close to 100 percent, as indicator values saturate at this level.e 50 percent uncertainty range 8–12 percent.f 50 percent uncertainty range 65–85 percent.

Turn Down The heaT: ClimaTe exTremes, regional impaCTs, anD The Case for resilienCe
16
that an extreme wet monsoon that currently has a chance of occur-ring only once in 100 years is projected to occur every 10 years by the end of the century.
A series of unusually intense monsoonal rainfall events in the mountainous catchment of the Indus River was one of the main physical drivers of the devastating Pakistan floods of 2010, which resulted in more than 1,900 casualties and affected more than 20 million people. Farms and key infrastructure, such as bridges, were washed away in the predominantly rural areas affected. The rainfall event itself was only the start of a chain of events that led to prolonged and wide-scale flooding downstream, with many other factors due to human activity. Irrigation dams, barrages, river embankments, and diversions in the inland basins of rivers can seriously exacerbate the risk of flooding downstream from extreme rainfall events higher up in river catchments.
Large uncertainty remains about the behavior of the Indian summer monsoon under global warming. An abrupt change in the monsoon, for example, toward a drier, lower rainfall state, could precipitate a major crisis in South Asia, as evidenced by the anomalous monsoon of 2002, which caused the most serious drought in recent times (with rainfall about 209 percent below the long-term normal and food grain production reductions of about 10–15 percent compared to the average of the preceding decade). Physically plausible mechanisms have been proposed for such a switch, and changes in the tropical atmosphere that could precipitate a transition of the monsoon to a drier state are projected in the present generation of climate models.
DroughtsThe projected increase in seasonality of precipitation is associated with an increase in the number of dry days and droughts with adverse consequences for human lives. Droughts are expected to pose an increasing risk in parts of the region, particularly Paki-stan, while increasing wetness is projected for southern India. The direction of change is uncertain for northern India. Of the ten most severe drought disasters globally in the last century, measured in terms of the number of people affected, six were in India, affecting up to 300 million people. For example, the Indian droughts of 1987 and 2002/2003 affected more than 50 percent of the crop area in the country and, in 2002, food grain pro-duction declined by 29 million tons compared to the previous year. It is estimated that in the states of Jharkhand, Orissa, and Chhattisgarh, major droughts, which occur approximately every five years, negatively impact around 40 percent of agricultural production.
Glacial Loss, Snow Cover Reductions, and River FlowOver the past century most of the Himalayan glaciers have been retreating. Currently, 750 million people depend on the glacier-fed
Indus and Brahmaputra river basins for freshwater resources, and reductions in water availability could significantly reduce the amount of food that can be produced within the river basins. These rivers depend heavily on snow and glacial melt water, which makes them highly susceptible to climate-change-induced glacier and snowmelt. Warming projections of about 2.5°C above pre-industrial levels by the 2050s indicate the risk of substantial reductions in the flow of the Indus and Brahmaputra in summer and late spring, after a period with increased flow. The availability of water for irrigation is very much contingent on these water resources, particularly during the dry seasons.
• An increased river flow in spring is projected due to stronger glacial melt and snowmelt, with less runoff available prior to monsoon onset in late spring and summer.
• For the Indus River Delta, high flow is projected to increase by about 75 percent for warming above 2°C. Higher peak river flows expose a growing number of people inhabiting the densely populated river deltas of the regions to the com-bined risks of flooding, sea-level rise, and increasing tropical cyclone intensity.
Groundwater Resources Groundwater resources, which are mainly recharged by precipita-tion and surface-water, are also expected to be impacted by climate change. South Asia, especially India and Pakistan, are highly sensitive to decreases in groundwater recharge as these countries are already suffering from water scarcity and largely depend on a supply of groundwater for irrigation. In India, for example, 60 per-cent of irrigation depends on groundwater, while about 15 percent of the country’s groundwater tables are overexploited, including the Indus basin. Groundwater resources are particularly important to mitigate droughts and related impacts on agriculture and food security. With increased periods of low water availability and dry spells projected, it is likely that groundwater resources will become even more important for agriculture, leading to greater pressure on resources. Projected increases in the variability and seasonality of monsoon rainfall may affect groundwater recharge during the wet season and lead to increased exploitation during the dry season.
Sea-level RiseWith South Asian coastlines being located close to the equa-tor, projections of local sea-level rise show a greater increase compared to higher latitudes. Sea-level rise is projected to be approximately 100–115 cm by the 2090s in a 4°C world, and 60–80 cm in a 2°C world, by the end of the 21st century rela-tive to 1986–2005, with the highest values (up to 10 cm more) expected for the Maldives. This is generally around 5–10 percent higher than the global mean, and a 50 cm sea-level rise would likely occur by 2060.

SoUTh ASIA: ExTREMES of WATER SCARCITY ANd ExCESS
17
Sector-based and Thematic Impacts
Water Resources are already at risk in the densely populated countries of South Asia, according to most studies that assess this risk. One study indicates that for a warming of about 3°C above pre-industrial levels by the 2080s, it is very likely that per capita water availability will decrease by more than 10 percent due to a combination of population increase and climate change in South Asia. Even for 1.5–2°C warming, major investments in water storage capacity would be needed in order to utilize the potential benefits of increased seasonal runoff and compensate for lower dry seasons flows, to allow improved water availability throughout the year.
The quality of freshwater is also expected to suffer from poten-tial climate impacts. Sea-level rise and storm surges in coastal and deltaic regions would lead to saltwater intrusion degrading groundwater quality. Contamination of drinking water by saltwater intrusion may cause an increasing number of diarrhea cases. Cholera outbreaks may also become more frequent as the bacterium that causes cholera, vibrio cholerae, survives longer in saline water. About 20 million people in the coastal areas of Bangladesh are already affected by salinity in their drinking water.
Crop Yields are vulnerable to a host of climate-related factors in the region, including seasonal water scarcity, rising temperatures, and salinity intrusion due to sea-level rise. Rising temperatures and changes in rainfall patterns have contributed to reduced relative yields of rice, the most important crop in Asia, especially in rainfed areas. Cultivated crops have been observed to also be sensitive to rising temperatures. One study finds that compared to calculations of potential yields without historic trends of tem-perature changes since the 1980s, rice and wheat yields have declined by approximately 8 percent for every 1°C increase in average growing-season temperatures. Another study found that the combination of warmer nights and lower precipitation at the end of the growing season has caused a significant loss of rice production in India: yields could have been almost 6-percent higher without the historic change in climatic conditions.
While overall yields have increased over the last several decades, in the last decade worrying signs have emerged of crop yield stagnation on substantial areas of Indian cropland. The projected increase in extreme heat affecting 10 percent of total land area by 2020 and 15 percent by 2030 poses a high risk to crop yields. Crop yields are projected to decrease significantly for warming in the 1.5–2.0°C range; if there is a strong CO
2 fertilization effect, however, the negative effects of warming might be offset in part by low-cost adaptation measures. Above about 2°C warming above pre-industrial levels, crop yields are projected to decrease around 10–30 percent for warming of 3–4.5°C, with the largest reductions in the cases where the CO2 fertilization effect is weak.
Total Crop Production without climate change is projected to increase significantly (by 60 percent) in the region and be under
increased price pressure and a trend factor expressing techno-logical improvements, research and development, extension of markets, and infrastructure. Under 2°C warming by the 2050s, the increase may be reduced by at least 12 percent, requiring more than twice the imports to meet per capita demand than is required without climate change. As a result, per-capita calorie availability is projected to decrease significantly. Decreasing food availability can lead to significant health problems in affected populations, including childhood stunting, which is projected to increase by 35 percent by 2050 compared to a scenario without climate change.
Energy Security is expected to come under increasing pressure from climate-related impacts to water resources. The two dominant forms of power generation in the region are hydropower and ther-mal power generation (e.g., fossil fuel, nuclear, and concentrated solar power), both of which can be undermined by inadequate water supplies. Thermal power generation may also be affected through pressure placed on cooling systems by increases in air and water temperatures.
Integrated Synthesis of Climate Change Impacts in the South Asia Region
Water resource dynamics: Many of the climate risks and impacts that pose potential threats to populations in the South Asia region can be linked back to changes to the water cycle—extreme rainfall, droughts, and declining snow fall and glacial loss in the Himalayas leading to changes in river flow—combined in the coastal regions with the consequences of sea-level rise and increased tropical cyclone intensity. Increasing seasonality of precipitation as a loss of snow cover is likely to lead to greater levels of flooding, and higher risks of dry periods and droughts. Exacerbating these risks are increases in extreme temperatures, which are already observed to adversely affect crop yields. Should these trends and patterns continue, substantial yield reductions can be expected in the near and midterm. Changes in projected rainfall amounts and geographical distribution are likely to have profound impacts on agriculture, energy, and flood risk.
The region is highly vulnerable even at warming of less than 2°C given the significant areas affected by droughts and flooding at present temperatures. In addition, the projected risks to crop yields and water resources, and sea-level rise reaching 70 cm by the 2070s, are likely to affect large populations.
Deltaic Regions and Coastal Cities are particularly exposed to cascading risks resulting from a combination of climatic changes, including increased temperature, increased river flooding, rising sea levels, and increasingly intense tropical cyclones and their consequences. Deaths in India and Bangladesh currently account for 86 percent of global mortalities from cyclones even though only 15 percent of all tropical cyclones affect this region.

Turn Down The heaT: ClimaTe exTremes, regional impaCTs, anD The Case for resilienCe
18
• Bangladesh emerges as an impact hotspot with increasing and compounding challenges occurring in the same timeframe from extreme river floods, more intense tropical cyclones, rising sea levels, extraordinarily high temperatures, and declining crop yields. Increased river flooding combined with tropical cyclone surges poses a high risk of inundation in areas with the largest shares of poor populations. A 27 cm sea-level rise, projected for the 2040s, in combination with storm surges from an average 10-year return period cyclone, such as Cyclone Sidr, could inundate an area more than 80-percent larger than the area inundated at present by a similar event.
• Kolkata and Mumbai are highly vulnerable to the impacts of sea-level rise, tropical cyclones, and riverine flooding. Floods and droughts are associated with health impacts, including diarrheal diseases, which at present are a major cause of child mortality in Asia and the Pacific.
Climate change shocks to seasonal water availability would confront populations with ongoing and multiple challenges to accessing safe drinking water, sufficient water for irrigation, and adequate cooling capacity for thermal power production.
Irrespective of future emission paths, in the next 20 years a several-fold increase in the frequency of unusually hot and extreme summer months can be expected from warming already underway.
A substantial increase in excess mortality is expected to be associ-ated with such heat extremes and has been observed in the past.
Increasing risks and impacts from extreme river floods, more intense tropical cyclones, rising sea levels, and extraordinarily high temperatures are projected. Population displacement, which already periodically occurs in flood-prone areas, is likely to continue to result from severe flooding and other extreme events. Agricultural production is likely to suffer from the combined effects of rising temperatures, impacts on seasonal water availability, and the impacts of sea-level rise.
Future economic development and growth will contribute to reducing the vulnerability of South Asia’s large and poor popula-tions. Climate change projections indicate, however, that high levels of vulnerability are projected and their societal implications indicate that high levels of vulnerability are likely to remain and persist. Warming is projected to significantly slow the expected reduction in poverty levels. Many of the climate change impacts in the region pose a significant challenge to development, even with relatively modest warming of 1.5–2°C. Major investments in infrastructure, flood defense, and development of high temperature and drought resistant crop cultivars, and major improvements in such sustainability practices as groundwater extraction, would be needed to cope with the projected impacts under this level of warming.

19
Abbreviations
°C degrees Celsius3-sigma events Events that are three standard deviations
outside the historical mean5-sigma events Events that are five standard deviations out-
side the historical meanAI Aridity IndexANN AnnualAOGCM Atmosphere-Ocean General Circulation ModelAR4 Fourth Assessment Report of the Inter-
governmental Panel on Climate ChangeAR5 Fifth Assessment Report of the Inter-
governmental Panel on Climate ChangeBAU Business as UsualCaCO3 Calcium CarbonateCAT Climate Action TrackerCMIP5 Coupled Model Intercomparison Project
Phase 5CO2 Carbon Dioxide DIVA Dynamic Interactive Vulnerability
AssessmentDJF December January FebruaryECS Equilibrium Climate SensitivityGCM General Circulation ModelGDP Gross Domestic ProductFPU Food Productivity UnitsGFDRR Global Facility for Disaster Reduction and
RecoveryIAM Integrated Assessment Model
IEA International Energy AgencyIPCC Intergovernmental Panel on Climate ChangeISI-MIP Inter-Sectoral Impact Model Intercomparison
ProjectJJA June July AugustMAGICC Model for the Assessment of Greenhouse-gas
Induced Climate ChangeMGIC Mountain Glaciers and Ice Caps NH Northern Hemisphere OECD Organisation for Economic Cooperation and
DevelopmentPDSI Palmer Drought Severity Indexppm parts per millionRCP Representative Concentration PathwaySCM Simple Climate ModelSLR Sea-level RiseSRES IPCC Special Report on Emissions Scenarios SREX IPCC Special Report on Managing the Risks
of Extreme Events and Disasters to Advance Climate Change Adaptation
SSA Sub-Saharan AfricaUNEP United Nations Environment ProgrammeUNFCCC United Nations Framework Convention on
Climate ChangeUNRCO United Nations Resident Coordinator’s OfficeUSAID United States Agency for International
DevelopmentWBG World Bank Group


21
Glossary
Aridity Index The Aridity Index (AI) is an indicator designed for identifying structurally “arid” regions, that is, regions with a long-term average precipitation deficit. AI is defined as total annual precipitation divided by potential evapotranspiration, with the latter a measure of the amount of water a representative crop type would need as a function of local conditions such as temperature, incoming radiation and wind speed, over a year to grow, which is a standardized measure of water demand.
Biome A biome is a large geographical area of distinct plant and animal groups, one of a limited set of major habitats, classified by climatic and predominant vegetative types. Biomes include, for example, grasslands, deserts, evergreen or deciduous forests, and tundra. Many different ecosystems exist within each broadly defined biome, which all share the limited range of climatic and environmental conditions within that biome.
C3/C4 plants refers to two types of photosynthetic biochemical “pathways”. C3 plants include more than 85 percent of plants on Earth (e.g. most trees, wheat, rice, yams and potatoes) and respond well to moist conditions and to additional carbon dioxide in the atmosphere. C4 plants (for example savanna grasses, maize, sorghum, millet, sugarcane) are more efficient in water and energy use and outperform C3 plants in hot and dry conditions.
CAT The Climate Action Tracker (CAT) is an independent science-based assessment, which tracks the emission commitments and actions by individual countries. The estimates of future emissions deducted from this assessment serve to analyse warming scenarios that would result from current policy: (a) CAT Reference BAU: a lower reference ‘business-as-usual’ (BAU) scenario that includes existing climate policies, but not pledged emission reductions; and (b) CAT Current Pledges:
a scenario additionally incorporating reductions currently pledged internationally by countries.
CMIP5 The Coupled Model Intercomparison Project Phase 5 (CMIP5) brought together 20 state-of-the-art GCM groups, which generated a large set of comparable climate-projections data. The project provided a framework for coordinated climate change experiments and includes simulations for assessment in the IPCC´s AR5.
CO2 fertilization The CO2 fertilization effect may increase the rate of photosynthesis mainly in C3 plants and increase water use efficiency, thereby producing increases in agricultural C3 crops in grain mass and/or number. This effect may to some extent offset the negative impacts of climate change, although grain protein content may decline. Long-term effects are uncertain as they heavily depend on a potential physiological long-term acclimation to elevated CO2, as well as on other limiting factors including soil nutrients, water and light.
GCM A General Circulation Model is the most advanced type of climate model used for projecting changes in climate due to increasing greenhouse-gas concentrations, aerosols and external forcings like changes in solar activity and volcanic eruptions. These models contain numerical representations of physical processes in the atmosphere, ocean, cryosphere and land surface on a global three-dimensional grid, with the current generation of GCMs having a typical horizontal resolution of 100 to 300 km.
GDP (Gross Domestic Product) is the sum of the gross value added by all resident producers in the economy plus any product taxes and minus any subsidies not included in the value of the products. It is calculated without deductions for

Turn Down The heaT: ClimaTe exTremes, regional impaCTs, anD The Case for resilienCe
22
depreciation of fabricated assets or for depletion and degrada-tion of natural resources.
GDP (PPP) per capita is GDP on a purchasing power parity basis divided by population. Please note: Whereas PPP estimates for OECD countries are quite reliable, PPP estimates for develop-ing countries are often rough approximations.
Hyper-aridity Land areas with very low Aridity Index (AI), gener-ally coinciding with the great deserts. There is no universally standardized value for hyper-aridity, and values between 0 and 0.05 are classified in this report as hyper-arid.
IPCC AR4, AR5 The Intergovernmental Panel on Climate Change (IPCC) is the leading body of global climate change assess-ments. It comprises hundreds of leading scientists worldwide and on a regular basis publishes assessment reports which give a comprehensive overview over the most recent scientific, technical and socio-economic information on climate change and its implications. The Fourth Assessment Report (AR4) was published in 2007. The upcoming Fifth Assessment Report (AR5) will be completed in 2013/2014.
ISI-MIP The first Inter-Sectoral Impact Model Intercomparison Project (ISI-MIP) is a community-driven modeling effort which provides cross-sectoral global impact assessments, based on the newly developed climate [Representative Concentration Pathways (RCPs)] and socio-economic scenarios. More than 30 models across five sectors (agriculture, water resources, biomes, health and infrastructure) participated in this model-ing exercise.
MAGICC Carbon-cycle/climate model of “reduced complexity,” here applied in a probabilistic set-up to provide “best-guess” global-mean warming projections, with uncertainty ranges related to the uncertainties in carbon-cycle, climate system and climate sensitivity. The model is constrained by historical observations of hemispheric land/ocean temperatures and historical estimates for ocean heat-uptake, reliably determines the atmospheric burden of CO2 concentrations compared to high-complexity carbon-cycle models and is also able to project global-mean near-surface warming in line with estimates made by GCMs.
Pre-industrial levels (what it means to have present 0.8°C warming) The instrumental temperature records show that the 20-year average of global-mean near-surface air tempera-ture in 1986–2005 was about 0.6°C higher than the average over 1851–1879. There are, however, considerable year-to-year variations and uncertainties in data. In addition the 20-year average warming over 1986–2005 is not necessarily
representative of present-day warming. Fitting a linear trend over the period 1901 to 2010 gives a warming of 0.8°C since “early industrialization.” Global-mean near-surface air temperatures in the instrumental records of surface-air temperature have been assembled dating back to about 1850. The number of measurement stations in the early years is small and increases rapidly with time. Industrialization was well on its way by 1850 and 1900, which implies using 1851–1879 as a base period, or 1901 as a start for linear trend analysis might lead to an underestimate of current and future warming, but global greenhouse-gas emissions at the end of the 19th century were still small and uncertainties in temperature reconstructions before this time are considerably larger.
RCP Representative Concentration Pathways (RCPs) are based on carefully selected scenarios for work on integrated assessment modeling, climate modeling, and modeling and analysis of impacts. Nearly a decade of new economic data, information about emerging technologies, and observations of environmental factors, such as land use and land cover change, are reflected in this work. Rather than starting with detailed socioeconomic sto-rylines to generate emissions scenarios, the RCPs are consistent sets of projections of only the components of radiative forcing (the change in the balance between incoming and outgoing radiation to the atmosphere caused primarily by changes in atmospheric composition) that are meant to serve as input for climate modeling. These radiative forcing trajectories are not associated with unique socioeconomic or emissions scenarios, and instead can result from different combinations of economic, technological, demographic, policy, and institutional futures.
RCP2.6 RCP2.6 refers to a scenario which is representative of the literature on mitigation scenarios aiming to limit the increase of global mean temperature to 2°C above the pre-industrial period. This emissions path is used by many studies that are being assessed for the IPCC´s Fifth Assessment Report and is the underlying low emissions scenario for impacts assessed in other parts of this report. In this report we refer to the RCP2.6 as a 2°C World.
RCP8.5 RCP8.5 refers to a scenario with no-climate-policy baseline with comparatively high greenhouse gas emissions which is used by many studies that are being assessed for the upcoming IPCC Fifth Assessment Report (AR5). This scenario is also the underlying high emissions scenario for impacts assessed in other parts of this report. In this report we refer to the RCP8.5 as a 4°C World above the pre-industrial period.
Severe & extreme Indicating uncommon (negative) consequences. These terms are often associated with an additional qualifier

GloSSary
23
like “unusual” or “unprecedented” that has a specific quanti-fied meaning (see “Unusual & unprecedented”).
SRES The Special Report on Emissions Scenarios (SRES), published by the IPCC in 2000, has provided the climate projections for the Fourth Assessment Report (AR4) of the Intergovernmental Panel on Climate Change (IPCC). They do not include mitiga-tion assumptions. The SRES study includes consideration of 40 different scenarios, each making different assumptions about the driving forces determining future greenhouse gas emissions. Scenarios are grouped into four families, corresponding to a wide range of high and low emission scenarios.
SREX In 2012 the IPCC published a special report on Managing the Risks of Extreme Events and Disasters to Advance Climate Change Adaptation (SREX). The report provides an assessment of the physical as well as social factors shaping vulnerability to climate-related disasters and gives an overview of the potential for effective disaster risk management.
Unusual & unprecedented In this report, unusual and unprec-edented heat extremes are defined using thresholds based on the historical variability of the current local climate. The absolute level of the threshold thus depends on the natural year-to-year variability in the base period (1951–1980), which is captured by the standard deviation (sigma). Unusual heat extremes are defined as 3-sigma events. For a normal distri-bution, 3-sigma events have a return time of 740 years. The 2012 U.S. heat wave and the 2010 Russian heat wave classify as 3-sigma and thus unusual events. Unprecedented heat extremes are defined as 5-sigma events. They have a return time of several million years. Monthly temperature data do not necessarily follow a normal distribution (for example, the distribution can have “long” tails, making warm events more likely) and the return times can be different from the ones expected in a normal distribution. Nevertheless, 3-sigma events are extremely unlikely and 5-sigma events have almost certainly never occurred.


Climate Extremes, Regional Impacts, and the Case for Resilience
Turn Down Heatth
e
Regional Summaries