climate extremes and climate change: the russian heat wave and other climate extremes ...€¦ ·...
TRANSCRIPT

Climate extremes and climate change: The Russian heat waveand other climate extremes of 2010
Kevin E. Trenberth1 and John T. Fasullo1
Received 27 April 2012; revised 25 July 2012; accepted 25 July 2012; published 5 September 2012.
[1] A global perspective is developed on a number of high impact climate extremes in2010 through diagnostic studies of the anomalies, diabatic heating, and global energy andwater cycles that demonstrate relationships among variables and across events. Naturalvariability, especially ENSO, and global warming from human influences together resultedin very high sea surface temperatures (SSTs) in several places that played a vital role insubsequent developments. Record high SSTs in the Northern Indian Ocean in May 2010,the Gulf of Mexico in August 2010, the Caribbean in September 2010, and north ofAustralia in December 2010 provided a source of unusually abundant atmosphericmoisture for nearby monsoon rains and flooding in Pakistan, Colombia, and Queensland.The resulting anomalous diabatic heating in the northern Indian and tropical AtlanticOceans altered the atmospheric circulation by forcing quasi-stationary Rossby waves andaltering monsoons. The anomalous monsoonal circulations had direct links to higherlatitudes: from Southeast Asia to southern Russia, and from Colombia to Brazil. Strongconvection in the tropical Atlantic in northern summer 2010 was associated with a Rossbywave train that extended into Europe creating anomalous cyclonic conditions over theMediterranean area while normal anticyclonic conditions shifted downstream where theylikely interacted with an anomalously strong monsoon circulation, helping to support thepersistent atmospheric anticyclonic regime over Russia. This set the stage for the“blocking” anticyclone and associated Russian heat wave and wild fires. Attribution islimited by shortcomings in models in replicating monsoons, teleconnections and blocking.
Citation: Trenberth, K. E., and J. T. Fasullo (2012), Climate extremes and climate change: The Russian heat wave and otherclimate extremes of 2010, J. Geophys. Res., 117, D17103, doi:10.1029/2012JD018020.
1. Introduction
[2] The focus of this paper is on some notable climateextremes experienced in 2010 and how they relate to thelarge-scale environment in which they occurred. In 2010,record high SSTs in many regions were in close proximity toplaces where record flooding subsequently occurred. As weshow here, this is unlikely to be a coincidence. Moreover,increased rainfall and associated atmospheric diabatic heating,largely from latent heat release, led to changes in the mon-soon circulation and atmospheric teleconnections with con-sequences for other parts of the world. This paper providesdiagnostic results mainly on the events of the latter half of2010.[3] There are many examples of climate extremes in 2010
but especially notable are those following the demise of theMay 2009 to May 2010 El Niño when record high SSTsdeveloped (see Figures 1, 2 and 4 presented later). Hence of
particular interest are the following, listed approximatelychronologically: intense heavy rains and flooding in parts ofChina and India (June, July) and Pakistan (July, August); theRussian heat wave and wild fires (July, August); the vigorousAtlantic hurricane season; record flooding in Colombia(October–December); drought in Brazil (October); and flood-ing in Queensland, Australia as the year came to an end. Manyof the extreme events of 2010 are described in detail onlineat the NOAA National Climatic Data Center, State of theClimate, Global Hazards site: http://www.ncdc.noaa.gov/sotc/hazards/2010/m where m is the month number. For Colombia,see also http://climatesignals.org/2010/12/columbia-hit-by-heaviest-rains-in-countrys-history/. These climate extremesare typically treated individually, but in fact many are likelyrelated.[4] Record-breaking extremes are always expected to
happen as the climate record gets longer even in a stationaryclimate in inverse proportion to the length of record. So whilerecords become rarer as time goes on, they still occur. Yetcertain extremes related to heating are occurring much morefrequently than expected. For example in the United States,extremes of high temperatures have been occurring at a rateof twice those of cold extremes [Meehl et al., 2009]. However,the clustering of extremes occurs when natural variability
1National Center for Atmospheric Research, Boulder, Colorado, USA.
Corresponding author: K. E. Trenberth, National Center for AtmosphericResearch, PO Box 3000, Boulder, CO 80307, USA. ([email protected])
©2012. American Geophysical Union. All Rights Reserved.0148-0227/12/2012JD018020
JOURNAL OF GEOPHYSICAL RESEARCH, VOL. 117, D17103, doi:10.1029/2012JD018020, 2012
D17103 1 of 12

creates anomalies that are in the same direction as globalwarming [e.g., see Rahmstorf and Coumou, 2011]. Thisoccurs, for instance, as heat leaves the ocean during andfollowing the warm El Niño phase of El Niño-SouthernOscillation (ENSO) [Trenberth et al., 2002]. During ENSO,large regional changes occur in SSTs throughout the tropics.Large positive SST anomalies in the central and easternPacific during El Niño tend to focus convective activity(thunderstorms, tropical storms, etc.) into those regions whilesuppressing activity elsewhere via both changes in atmo-spheric stability and wind shear. Meanwhile lighter windsand decreased evaporative cooling, and sunny skies in thetropical Atlantic and Indian oceans result in higher thannormal SSTs 3 to 7 months after the peak SSTs in theNiño 3.4 region [Trenberth et al., 2002]. A rapid transitionto La Niña conditions, as occurred in May–June 2010 (andalso in 1998 following the big 1997–98 El Niño event), thenfocused activity away from the Pacific into the Atlantic andIndian ocean sectors, where weather systems could feed uponthe extra energy available from the above normal oceantemperatures. A plausible working hypothesis is that this iswhat happened in 2010 and relates to the exceptional numberof extremes observed.[5] In both the Indian Ocean and Atlantic sectors, as
shown here, since mid-2010, high SSTs were accompaniedby heavy rains, flooding over nearby land, increased diabaticheating in the atmosphere largely from latent heat release,and thus changes in the monsoon circulation and forcedquasi-stationary Rossby wave trains. The resulting atmo-spheric teleconnections had consequences for other parts ofthe world, most notably Russia. Given our knowledge andunderstanding of the atmosphere and the climate system,it is not surprising that events in remote regions areconnected. In the northern summer and autumn of 2010, theconnectivity throughout Eurasia is evident from diagnosticstudies, as given here and see alsoHong et al. [2011] and Lauand Kim [2012]. Moreover, connectivity between events inthe Atlantic and throughout the Americas seems clear, but italso seems likely that these two regions were linked by morethan coincident high SSTs via the atmosphere. There remainquestions about the degree and mechanisms and the impli-cations of these for attribution efforts [Otto et al., 2012].
While relevant, this study is not about attribution but ratherit explores aspects of the physical environment in which theextremes occurred. Central to the analysis here is the questionas to whether models are capable of depicting the modes ofvariability associated with the extremes generally. Our anal-yses suggest that they are not.
2. Methods and Data
[6] The focus here is on the period from June to Augustcoinciding with the Russian Heat Wave (RHW) and thePakistan floods. As the main anomalous events in theAmericas occurred somewhat later, only a brief reference ismade to those. Most of our climate diagnostics are withmonthly or seasonal means, but a special effort has beenmade to generate averages over the period of the RHW, from16 June to 15 August 2010 using 6-hourly data. We have alsoused the monthly means for July 2010 and 3 month values forJune–July–August 2010 and their anomalies to providecontext, although only Jun–Aug anomalies are shown.[7] SST values were computed from HADISST [Rayner
et al., 2003] and ERSST [Smith et al., 2008] data sets at1� resolution although only the former are shown. The mainatmospheric data used here are the ERA-Interim (ERA-I)reanalyses from ECMWF [Dee et al., 2011] which recentlybecame available from 1979 on. These were mostly used atfull T255 (�79 km) resolution although results are truncated
Figure 1. Monthly anomalies in SST (�C) for 10–25�N50–100�E encompassing the Arabian Sea and Bay ofBengal. May 2010 is the highest anomaly (0.9�C) on recordand the SST was 30.4�C. This figure uses the HADISSTdata, but values are similar in the ERSST data set.
Figure 2. Seasonal Jun–Jul–Aug 2010 mean SSTs andtheir anomalies relative to 1951–70, based on HADISST data.Dark green boxes on the lower panel indicate the regions dis-cussed in the text for, from left to right, the Northern IndianOcean, North Australia, Niño 3.4, Gulf of Mexico, andCaribbean.
TRENBERTH AND FASULLO: CLIMATE EXTREMES—THE RUSSIAN HEAT WAVE D17103D17103
2 of 12

to T63 for presentation purposes. However, many other datasets have been compared to evaluate the veracity of the rea-nalyses [Trenberth et al., 2011]. Vertical integrals of thereanalyses using model level data are used to compute com-prehensive energy, heat and moisture budgets incorporatingmass budget adjustments as in Trenberth and Stepaniak[2003]. Because there are spurious changes over time in allreanalyses associated with changes in the observing system[Trenberth et al., 2011], an emphasis in the figures presentedis on the total fields although anomalies are also presented.[8] Outgoing Longwave Radiation (OLR) values are mainly
from the NOAAAdvanced Very High Resolution Radiometer(AVHRR) data set at 2.5� resolution beginning in 1979[Liebmann and Smith, 1996], although ERA-I OLR is alsoused. There are known spurious variations in the OLR data,which degrade relationships somewhat [Waliser and Zhou,1997].[9] Precipitation estimates from both CMORPH at 0.73�
resolution [Joyce et al., 2004] and ERA-I are used. Theformer are probably noisier as they depend on sampling. TheCMORPH analyses start only in 2003, but the major aspectsare robust and reproduced in both data sets.
3. The 2010 Russian Heat Wave (RHW)and Pakistan Floods
[10] The Russian heat wave in summer 2010 [Matsueda,2011; Dole et al., 2011; Barriopedro et al., 2011; Lau andKim, 2012] lasted from June until mid-August. The tre-mendous heat in Russia was preceded by very dry conditions,setting the stage for wild fires. We focus on the two monthduration of the RHW from 16 June to 15 August 2010 whenthe heat wave was most intense and persistent. Because thecritical period goes from mid-month to mid-month, dailyvalues are used where available. The associated atmosphericphenomenon was a persistent blocking anticyclone. Extendedrange forecasts of the blocking [Matsueda, 2011] were quitegood although not as good in the last two weeks when theheat was at its peak. However, weather and climate modelshave difficulty in the initiation and maintenance of atmo-spheric blocking [Brunet et al., 2010; Scaife et al., 2010]. Allfour studies note that blocking normally occurs in this regionand Dole et al. [2011] concluded that the RHWwas largely anatural event. From an attribution aspect, the main questionin this case is why was the blocking so persistent and strong?What influences external to the atmosphere played a role?Rahmstorf and Coumou [2011] provide a thorough statisticalanalysis of the Russian heat wave and suggest that there wasan approximate 80% probability that the 2010 July Russianheat record would not have occurred without climate warm-ing, or alternatively the probability increased by a factor of five[Otto et al., 2012]. Otto et al. [2012] reconcile the apparentlydisparate views of Dole et al. [2011] and Rahmstorf andCoumou [2011], but we also ask what are the physicalmechanisms and sequence of events that lead to this statisti-cal result? Hence we provide some physical insights into howglobal warming may have affected the region.[11] Extratropical disturbances downstream of the blocking
interacted with monsoon surges [Houze et al., 2011; Honget al., 2011; Lau and Kim, 2012] to help produce the rainsthat led to flooding in Pakistan. The evolution of rains anddrought in China prior to the period of interest is given by
Barriopedro et al. [2012]. The anomalous precipitation overland was symptomatic of very heavy precipitation moregenerally over the Bay of Bengal and the Arabian Sea, and akey question is whether these monsoon-related rains werealso related to the higher latitude blocking.[12] To address this question, the broader setting in which
these extremes occurred is examined. SSTs in the northernIndian Ocean region 10–25�N, 50–100�E, which encom-passes the Bay of Bengal and Arabian Sea, were the highest onrecord for any month in May 2010 at 30.4�C and the anoma-lies were also highest on record and 2.3 standard deviationsabove the normal (relative to 1960 to 1989) (Figure 1; and seeFigure 2 for the region); the biggest anomalies were in theArabian Sea. Area average SSTs exceeded 29�C also inApril and June 2010. Subsequent evaporative cooling of theocean (especially the Arabian Sea) following monsoon onset(e.g., see Figure 8 presented later) provided moisture for theatmosphere and thus for the Southeast Asian monsoon rains.[13] The SSTs for Jun–Aug 2010 (Figure 2) show extensive
regions of 0.5 to 1.5�C anomalies throughout the northernIndian Ocean and Indonesian region as well as throughoutthe tropical Atlantic (relative to a 1951–1970 normal thatprecedes most anthropogenic warming). These regions arenormally very warm anyway. In 2010, the total SSTsexceeded 29�C over broad regions and, because the waterholding capacity of the atmosphere increases exponentiallywith temperature [Trenberth, 2011], a positive anomaly ontop of already high SSTs has much greater effect than iflocated elsewhere. Indeed, the high SSTs were accompaniedby very high water vapor amounts (not shown). The surfaceair temperature anomalies (Figure 3) are dominated by theRHW, where they exceeded 7�C for 16 June to 15 August2010. Dole et al. [2011] and Lau and Kim [2012] providefurther details.[14] Record breaking SST anomalies also occurred in
other regions. We defined broad regions for the Caribbean as10 to 20�N 70 to 80�W, and Gulf of Mexico as 20 to 30�N98 to 82�W (see Figure 2 for regions). In the Gulf in August2010, SSTs were the highest on record for any month at30.2�C although only 0.53�C above the 30 year normal1960–89 (highest anomaly for August). For the Caribbean,September 2010 recorded its highest SST at 29.5�C (anomalyof 0.70�C), but was exceeded in October 2010 (29.6�C;+0.66�C), with only October 2003 being higher. From 10 to20�S 120 to 160�E (Figure 2), north of Australia, theanomalies were the second highest on record for Septemberto November 2010, and the highest on record in December2010 when SSTs were 29.6�C and an anomaly of 0.8�Cexisted (2.4 standard deviations above normal).[15] The time series of Niño 3.4 region (5�N-5�S; 120–
170�W) SSTs indicates ENSO conditions (Figure 4) andshows the El Niño persisting through April 2010 but rapidlygave way to La Niña conditions by June. During La Niña,convective action moves away from the tropical Pacific intothe Indonesian and Indian Ocean sector, and tropical Atlantic.[16] The anomalous atmospheric circulation is indicated
by the winds and geopotential height at 250 hPa (Figure 5).While large anomalies are not unexpected in the winterhemisphere, the strong anticyclonic feature centered overRussia is very unusual mainly due to its exceptional durationand intensity. However, it is not alone, and weaker wavelikestructures occur throughout the northern hemisphere. In
TRENBERTH AND FASULLO: CLIMATE EXTREMES—THE RUSSIAN HEAT WAVE D17103D17103
3 of 12

midlatitudes, a wave 6 structure is evident in the high pressurecenters spanning the northern hemisphere, and these mayrelate to the Circumglobal Waveguide Pattern (CWP) ofBranstator [2002] whose structure is documented for summerby Ding and Wang [2005]. The CWP is a leading structure ina linear-based analysis of intrinsic variability. However, thelack of zonal symmetry suggests that regional forcings of thiswave may also be important [see Trenberth et al., 1998]. Forinstance, in the Pacific, a coherent wave structure is evidentemanating from the subtropics with the first cyclonic centernear 25�N 145�E, just north of large positive OLR anomalies(Figure 6). A strong anticyclonic center also is present overthe Southeast United States, with a wavelike structurestretching northeastward across the Atlantic to encompass theRussian feature. Further discussion of these aspects is givenlater.[17] OLR anomalies (Figure 6) show a strong La Niña
signature with very high OLR, signaling low cloud tops andless deep convection and precipitation in the tropical Pacificeast of 135�E, but with anomalous deep convection and highcloud tops west of 135�E over Indonesia and extendingthroughout the northern Indian Ocean. The total OLR field(Figure 6) reveals OLR less than 190 W m�2 in the Bay ofBengal as the dominant global feature. It also shows thestructure of the monsoon rainbands over Africa, southern Asiaand Central America, along with the Inter-Tropical Conver-gence Zone (ITCZ) in the Pacific and Atlantic Oceans. Belownormal OLR (Figure 6) and implied heavy rains are apparentin the Caribbean, Central America and Colombia. The positive
OLR anomalies also reveal the RHW region very clearly,north of the Caspian Sea.[18] Precipitation estimates for mid-June to mid August
2010 and their anomalies (Figure 7) reveal that the heavyrain anomalies are somewhat stronger over Pakistan in theCMORPH analyses. However, there is excellent agreementin the overall patterns and anomalies. The precipitation anal-yses (Figure 7) confirm the very heavy rains over the Bay ofBengal and Arabian Sea, extending into Pakistan, and also
Figure 3. The surface air (2 m) temperature anomaly rela-tive to 1980–2009 for 16 June to 15 August 2010 fromERA-I reanalyses.
Figure 4. Time series of Niño 3.4 (5�N-5�S, 120–170�W)SST anomalies relative to 1951–2010.
Figure 5. Geopotential height anomalies at 250 hPa andassociated total wind anomalies 16 June to 15 August 2011relative to the base period 1980–2009. Note the shift inmap by 180� longitude relative to other maps. Units are geo-potential meters and m s�1.
Figure 6. The (top) total field and (bottom) anomaly rela-tive to 1980 to 2009 for OLR for Jun 16–Aug 15, 2010 inW m�2.
TRENBERTH AND FASULLO: CLIMATE EXTREMES—THE RUSSIAN HEAT WAVE D17103D17103
4 of 12
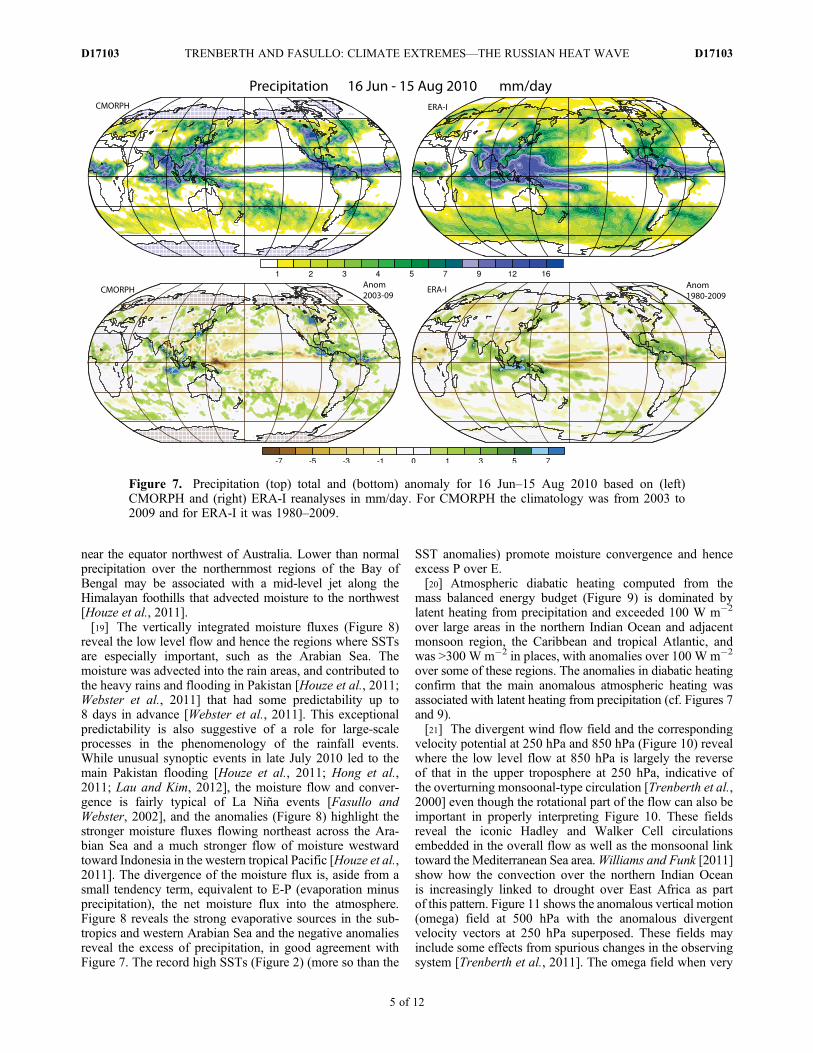
near the equator northwest of Australia. Lower than normalprecipitation over the northernmost regions of the Bay ofBengal may be associated with a mid-level jet along theHimalayan foothills that advected moisture to the northwest[Houze et al., 2011].[19] The vertically integrated moisture fluxes (Figure 8)
reveal the low level flow and hence the regions where SSTsare especially important, such as the Arabian Sea. Themoisture was advected into the rain areas, and contributed tothe heavy rains and flooding in Pakistan [Houze et al., 2011;Webster et al., 2011] that had some predictability up to8 days in advance [Webster et al., 2011]. This exceptionalpredictability is also suggestive of a role for large-scaleprocesses in the phenomenology of the rainfall events.While unusual synoptic events in late July 2010 led to themain Pakistan flooding [Houze et al., 2011; Hong et al.,2011; Lau and Kim, 2012], the moisture flow and conver-gence is fairly typical of La Niña events [Fasullo andWebster, 2002], and the anomalies (Figure 8) highlight thestronger moisture fluxes flowing northeast across the Ara-bian Sea and a much stronger flow of moisture westwardtoward Indonesia in the western tropical Pacific [Houze et al.,2011]. The divergence of the moisture flux is, aside from asmall tendency term, equivalent to E-P (evaporation minusprecipitation), the net moisture flux into the atmosphere.Figure 8 reveals the strong evaporative sources in the sub-tropics and western Arabian Sea and the negative anomaliesreveal the excess of precipitation, in good agreement withFigure 7. The record high SSTs (Figure 2) (more so than the
SST anomalies) promote moisture convergence and henceexcess P over E.[20] Atmospheric diabatic heating computed from the
mass balanced energy budget (Figure 9) is dominated bylatent heating from precipitation and exceeded 100 W m�2
over large areas in the northern Indian Ocean and adjacentmonsoon region, the Caribbean and tropical Atlantic, andwas >300 W m�2 in places, with anomalies over 100 W m�2
over some of these regions. The anomalies in diabatic heatingconfirm that the main anomalous atmospheric heating wasassociated with latent heating from precipitation (cf. Figures 7and 9).[21] The divergent wind flow field and the corresponding
velocity potential at 250 hPa and 850 hPa (Figure 10) revealwhere the low level flow at 850 hPa is largely the reverseof that in the upper troposphere at 250 hPa, indicative ofthe overturning monsoonal-type circulation [Trenberth et al.,2000] even though the rotational part of the flow can also beimportant in properly interpreting Figure 10. These fieldsreveal the iconic Hadley and Walker Cell circulationsembedded in the overall flow as well as the monsoonal linktoward the Mediterranean Sea area.Williams and Funk [2011]show how the convection over the northern Indian Oceanis increasingly linked to drought over East Africa as partof this pattern. Figure 11 shows the anomalous vertical motion(omega) field at 500 hPa with the anomalous divergentvelocity vectors at 250 hPa superposed. These fields mayinclude some effects from spurious changes in the observingsystem [Trenberth et al., 2011]. The omega field when very
Figure 7. Precipitation (top) total and (bottom) anomaly for 16 Jun–15 Aug 2010 based on (left)CMORPH and (right) ERA-I reanalyses in mm/day. For CMORPH the climatology was from 2003 to2009 and for ERA-I it was 1980–2009.
TRENBERTH AND FASULLO: CLIMATE EXTREMES—THE RUSSIAN HEAT WAVE D17103D17103
5 of 12

heavily smoothed relates directly to anomalies in velocitypotential and reveals fine grain structure in addition to thatshown in Figure 10. It indicates the exceptional vigor of theoutflow region in the Asian monsoon with some penetrationto the region northeast of the Caspian Sea, while the cyclonicstructure over the northern Mediterranean and Black Searegion (Figure 5) suggests that the normal anticyclonic sub-sidence there has been shifted to the RHW region.[22] The Asian monsoon rains are normally linked to the
Mediterranean climate through the monsoon circulation[Rodwell and Hoskins, 2001] via the overturning circulationand the Rossby wave response to atmospheric heating.Goswami et al. [1999] discuss indices on the Indian summermonsoon for rainfall and circulation. However, the mainanomalies in diabatic heating are over the northern IndianOcean (NIO) (Figure 9), and hence we use the same coreregion as in Figure 1, 10–25�N, 50 to 100�W, over the oceanto compute the mean ocean OLR anomalies for Jun–Augand correlate that time series with OLR anomalies elsewhere(Figure 12). With 32 values that are largely independent, thetwo-sided 5% significance level for correlations is 0.36.Figure 12 reveals that while the main variability associatedwith this index is over the Arabian Sea, there are distinctivesignificant relationships in the Pacific associated with ENSO;and significant positive correlations occur over northernSouth America. There are also significant inverse relation-ships between the northern Indian Ocean and the northernMediterranean–Black Sea area, that extend to the region of
the RHW. The observed pattern of OLR anomalies in 2010(Figure 6) bears a reasonable resemblance to much ofFigure 12. The climatological relationship is one where theconvective activity is suppressed over the Mediterranean butFigure 12 demonstrates that a link also exists between thevariations in Mediterranean climate and the Asian monsoon/Indian Ocean convection. Figure 12 also shows results forthe NCAR Community Climate System Model, version 4(CCSM4) run in fully coupled mode with only the externalforcings specified for 1850 to 2010 [see Gent et al., 2011]and for the atmospheric component Community AtmosphericModel version 4 (CAM4) run with only SSTs specified asobserved for 1979–2010. These results are discussed in thenext section.[23] The basis for why the canonical downward branch of
the northern summer monsoon circulation occurs over theMediterranean can be seen from Figure 9 and relates in partto the presence of the cool ocean relative to the surroundingland domains combined with the Rossby wave response tomonsoonal heating [Rodwell and Hoskins, 1996]. However,this circulation was evidently disrupted in summer 2010,as seen by the striking cyclonic anomalies in the anomalousgeopotential height at 250 hPa (Figure 5) that are linkedup- and down-stream via a Rossby wave that had a quasi-stationary component throughout this period. To explore theevolution of the wave train and the blocking over Russia
Figure 9. Vertically integrated diabatic heating in theatmosphere for Jun–Aug 2010 computed as a residual fromthe energy equation using ERA-I reanalyses. (top) Totaland (bottom) anomaly relative to 1989–2009 in W m�2.The dominant atmospheric heating comes from precipitationlatent heat release of >200 W m�2 over extensive areas ofthe Northern Indian Ocean and near Central America.
Figure 8. For June–July–August 2010, the vertically inte-grated atmospheric moisture transport (vectors, scale inset inkg m�1 s�1); with colored shading indicating the divergenceof the latent energy in W m�2, based on ERA-I reanalysis.(top) Total and (bottom) anomaly relative to 1980–2009.
TRENBERTH AND FASULLO: CLIMATE EXTREMES—THE RUSSIAN HEAT WAVE D17103D17103
6 of 12

further, Figure 13 presents the regional circulation anomaliesat 250 hPa for 16 Jun–15 Aug 2010 for the stream functionfield, which is similar to the geopotential height field butaccounts for the variations in the Coriolis parameter withlatitude, and hence the anomalies are more uniform withlatitude in magnitude. The line on this plot from 90�W 30�N(over the southeastern United States) to 60�E 60�N (overRussia) is roughly aligned with the wave train. The secondpart of this figure shows a time slice along this line of thestream function anomalies for Jun–Aug 2010 computedevery six hours as anomalies from a smoothed annual cycle
climatology that includes the first three harmonics. It showsthe propagation of features northeast from the United Statesthat led to fluctuations in the blocking. Note in particular thestrong anticyclonic disturbance originating in the tropicalNorth Atlantic in the second half of June that led directlyto the main intensification of the blocking anticyclone overRussia in mid-July.[24] The quasistationary blocking anticyclone (Figures 5
and 13) from mid-June to mid August was most intense frommid to end of July from 35 to 55�N. The structures revealedare strongly suggestive of a quasi-stationary Rossby wavethat is enhanced by converging wave-activity with the strongtendency for the blocking high to reform in the same location[e.g., Trenberth and Mo, 1985; Trenberth, 1986; Nakamuraet al., 1997; Takaya and Nakamura, 2001; Schneidereit et al.,2012]. The evolution of these transients suggests an impor-tant role in reinforcing and reestablishing the anticyclone.
Figure 10. For 16 Jun–15 Aug 2010, velocity potential(contours) and divergent wind component (vectors, scaleinset in m s�1), at (top) 250 hPa in the upper troposphereand (bottom) 850 hPa in the lower troposphere. Vectorsare missing at 850 hPa where below ground.
Figure 11. The anomalous divergent wind at 250 hPa(m s�1) is shown on a background of the anomalous verticalmotion at 500 hPa in Pa s�1 for 16–June to 15 August 2010.
Figure 12. Correlation between OLR averaged over thenorthern Indian Ocean between 10 and 25�N and 50–100�Ewith other locations for JJA for (top) observed from ERA-Ifor 1979 to 2010; (middle) CAM-4 for 1979–2010; and(bottom) CCSM-4 for 1850–2005.
TRENBERTH AND FASULLO: CLIMATE EXTREMES—THE RUSSIAN HEAT WAVE D17103D17103
7 of 12

[25] The persistent wave structures (Figure 13) reveal qua-sistationary features over southeast United States between60 and 90�W and a somewhat weaker feature in the centralAtlantic between about 0 and 30�W. These features werepresent in June as part of a Rossby wave structure.Schneidereit et al. [2012] identified a wave train (theirFigure 12) from the tropical west Atlantic to northern Europeand note how the regime change to La Niña helped modulatethe quasi-stationary wave structure. The main anomalousatmospheric forcing (Figure 9) was the strong convection overthe tropical North Atlantic (including the Gulf and Caribbean)where very high SSTs (Figure 2) prevailed throughout thisperiod (Figures 6, 7, 9, and 10). Cassou et al. [2005] havenoted the tropical Atlantic influence on European heat wavesrelated to wetter than average conditions in the Caribbeanand the wave train path is as expected for a tropical source[Trenberth et al., 1998].[26] We interpret the RHW and the blocking as part of the
same phenomenon. There have been several studies of theatmospheric aspects related to the development of the RHW
blocking anticyclone and the climate question is whatexternal influences from outside of the atmosphere may haveplayed a role in making the blocking so persistent andintense. The main anomalous atmospheric forcings were inthe tropical Atlantic and the northern Indian Ocean, and ofreversed sign in the central tropical Pacific (Figure 9). TheMediterranean climate normally has a predisposition foranticyclonic conditions, and the evidence presented heresuggests that the preferred downward branch of the monsooncirculation was displaced northeast of its normal positionin JJA 2010 giving the Rossby wave structure noted inFigures 5 and 13, and in Dole et al. [2011].[27] Hence, an interpretation of the RHW in 2010 is that
the canonical settled weather regime associated with thedownward branch of Asian summer monsoon was extendedeastward over southern Russia partly in response to the wavetrain from the strong persistent anomalous convection in thetropical Atlantic and the intensity was enhanced by theanomalous monsoon heating and circulation. The map ofthe divergent flow in the upper troposphere for mid-June tomid-August (Figure 11) is extended with a wrap-aroundsection in Figure 14 so that the RHW region repeats, and withschematic indicators of the main components of the circula-tion. It shows the direct link between the monsoon rains andthe subsiding air in the blocking anticyclone over Russia. Italso reveals the Hadley circulation to the south, and theWalker circulation to the east, made stronger by the La Niñaconditions. The anomalous Rossby wave associated withanomalous Caribbean heating is also indicated.
4. The Americas
[28] La Niña conditions are well known to be associatedwith major anomalies in the Americas. In summer andautumn, the hurricane season is more active owing to a morefavorable tropical circulation that allows storms to form inan environment of reduced wind shear and stability [Vecchiet al., 2008]. Precipitation and flooding risk increase sub-stantially in northern South America, such as in Colombia[Poveda et al., 2011].[29] The SSTs (Figure 2) in the Atlantic sector throughout
the region north of Colombia were above 29�C in July toOctober, and September and October 2010 were the thirdand second highest SST for any months on record in theCaribbean. Anomalies exceeded 0.5 to 1.5�C relative to the1951–1970 base period (Figure 2). SST anomalies wereespecially large off the Colombian coast. The much coolerconditions to the west of the Central American isthmus bothin absolute and anomaly terms understandably focusedconvective activity as a whole into the Atlantic and awayfrom the Pacific. North of the equator, the result was a muchabove normal Atlantic hurricane season, in which there were19 named storms, and 12 hurricanes, of which 4 were cate-gory 4 or 5, likely making it the second most active year after2005 since 1944 when aircraft surveillance was imple-mented. SSTs in the tropical North Atlantic region critical forhurricanes (10� to 20�N) were at record high levels in theextended summer (June to October 2005) and were a majorreason for the record 2005 hurricane season [Trenberth andShea, 2006].[30] The OLR negative anomalies and precipitation field
(Figures 6 and 7) show the extensive heavy rain region in the
Figure 13. (top) Mean 16 Jun–15 Aug 2010 streamfunction and rotational wind (m s�1, key at top right) anoma-lies at 250 hPa. The line shows the cross-section used in thebottom panel. (bottom) Time section for 90�W30�N to 60�W60�N for June–August 2010 of stream function anomalies.The main blocking period between 30 to 60�N is indicatedby the black line at right.
TRENBERTH AND FASULLO: CLIMATE EXTREMES—THE RUSSIAN HEAT WAVE D17103D17103
8 of 12

Caribbean extending across parts of Colombia and Venezuela.The main flooding in 2010 in Colombia developed in sub-sequent months. Meanwhile above normal OLR anomaliesover South America, including Brazil coincided with thedrought onset there. The actual precipitation anomalies(Figure 7) suggest somewhat below normal rains, but theanomalies are not large, as the main drought in Brazil did notdevelop until 2 months later. Espinoza et al. [2011] describethe exceptional drought in 2010 as the strongest on recordin the western Amazon basin, and pointed out the similar-ities to the 2005 drought both in terms of the drought itselfand the anomalous SSTs in the tropical North Atlantic thatwere associated with the drought.[31] The divergent winds and anomalous upward motion
(Figures 10, 11, and 14) show the strong overturning linkbetween the tropical Atlantic rainy areas and the dry seasonin Brazil. These set the stage for the anomalous convection,rainfall, and flooding that ensued in subsequent months asthe high SSTs persisted and the ITCZ progressed furthersouth.
5. Discussion
[32] In this paper a global perspective is provided and, asshown here, is essential for addressing the phenomenologyof the RHW, while other studies have taken a more regionalapproach. For instance, Dole et al. [2011] and Lau and Kim[2012] showed only the regional anomalies in the immediatearea. Motivating our global approach is the fact that climate
anomalies in one place are often connected to large anomalieselsewhere via teleconnections in the atmosphere. Theimportance of the strong La Niña that developed by June2010 was not adequately appreciated in some previousstudies but has been brought out by Schneidereit et al.[2012]. The negative diabatic heating anomalies in the trop-ical Pacific arise from the La Niña and help drive an anom-alous Rossby wave train. The La Niña also focused themonsoon rains in southern Asia in conjunction with excep-tionally high SSTs in the Indonesian and Indian Oceanregions and in the tropical Atlantic. Both regions featurestrong convection and anomalous diabatic heating in theatmosphere (Figure 9) and associated atmospheric circulationanomalies. In part the high SSTs in the Indian and Atlanticsectors were a consequence of the previous El Niño [Trenberthet al., 2002], however, there is also a significant globalwarming component [Gillett et al., 2008]. The human influ-ence is systematic and persistent and can be thought of as theunderlying warming of order 0.6�C since the 1950s whilethere are large regional and temporal fluctuations superposedon this warming by natural variability. Very large anomaliesalso existed at this time in Arctic sea ice, and some connec-tions to the events in Eurasia are suggested in conjunctionwith positive Arabian Sea SST anomalies [Sedláček et al.,2011]. However, if such an influence is present, it is notevident in the anomalous diabatic heating (Figure 9).[33] A finding is that discerning the causal interactions
between these events is a considerable challenge given theshortcomings of many models. A major difficulty is that
Figure 14. For mid-June to mid-August 2010, shown is a map of the velocity potential (color shading) at250 hPa and the divergent wind component (black arrows). Note that the map wraps around so the RHWregion is duplicated on the left and right. The outflow from the monsoon rain areas, given by the redarrows, is (i) to the south as the upper branch of the Hadley circulation with subsidence over Australiaand the subtropical Indian Ocean; (ii) to the east as part of the upper branch of the Walker circulation asso-ciated with the La Niña event so that there is subsidence over the central and eastern Pacific; and (iii) to thenorthwest to the region north of the Caspian Sea where the blocking anticyclone and the Russian droughtand heat wave were taking place (labeled RHW for Russian Heat Wave). In the Atlantic/Americas sector,the main overturning circulation is the monsoon Hadley circulation linking the activity in the Gulf ofMexico, Caribbean and Colombian region to the drought in Brazil. In the northern hemisphere a quasista-tionary Rossby wave (wiggly red arrow) is likely forced from the diabatic heating in the tropical Atlanticand helps determine where the subsidence from the monsoon occurs.
TRENBERTH AND FASULLO: CLIMATE EXTREMES—THE RUSSIAN HEAT WAVE D17103D17103
9 of 12

climate models do not simulate monsoon rains well [Meehlet al., 2012], or tropical heating more generally, and thelinks to Europe and other regions are often poorly capturedas a result. Many climate models cannot replicate the kindsof patterns seen in Figure 12 [see, e.g., Shin et al., 2010;Yang and DelSole, 2012]. Moreover, models are deficient insimulating blocking [Scaife et al., 2010]. We have examinedseveral runs with the latest versions of the NCAR Commu-nity Atmospheric Model (CAM) versions 3, 4 and 5 run withspecified SSTs for 2010. The results were judged in terms ofthe RHW blocking and the anomalous rainfalls in the tropicslinked to SST anomalies. Only some results from CAM-4and CCSM-4 are given in Figure 12, very similar resultsoccur in CAM5 (but the runs available are much shorter).These models, like many others, tend to place too muchconvection over high SSTs in the Arabian Sea especially inuncoupled runs [Meehl et al., 2012], and in association withENSO [Deser et al., 2012]. For the metric in Figure 12, theCAM4 run for 1979 to 2010 has quite similar patterns, par-ticularly over Indonesia, Australia and South Pacific basin, tothe much longer (and therefore more statistically significant)run from 1850 to 2005 of the fully coupled CCSM4. Thereare some differences, which relate to the coupling [Meehlet al., 2012] and CCSM4 has an ENSO cycle that is reason-able in pattern but overestimated by about 30% of theobserved amplitude [Deser et al., 2012]. In general, monsoonrainfall is too heavy in the uncoupled run with CAM4, andmonsoon rainfall amounts are generally better simulated withocean coupling in CCSM4 [Meehl et al., 2012]. As inobservations (Figure 12), correlations with the NorthernIndian Ocean SSTs of OLR feature a La Niña pattern in thePacific, although quite weak in CAM4. They also reveal apositive relation with the northern part of South America, asobserved. The comparison of observed and modeled showsquite good agreement here, and it is much better than forCAM3 and CCSM3 (not shown) and also many other CMIP-3model runs (not shown). Both CAM4 and CCSM4 runsreveal a negative correlation over the Mediterranean area,although weaker than observed and not extending as far northor east (to the RHW region). It is critical for attributionstudies, such as Dole et al. [2011], to test for model fidelityrelative to the phenomena of importance regarding the salientinteractions before broaching attribution [e.g., Otto et al.,2012].[34] Of particular interest from a climate perspective are
the influences external to the atmosphere on the develop-ments. The blocking anticyclone was not the “cause” of theheat wave in the sense that it was not external to the atmo-sphere. Rather it was a key part of the RHW phenomenon.The question is why the blocking high was so intense andlasted for 2 months with only minor breaks? The study byScaife et al. [2010] demonstrates the importance of the basicclimatology of models in simulating blocking and thus thediabatic heating and rainfall patterns are important. This isalso suggested by Figure 13.[35] Natural weather varies widely, but when unusual
persistence occurs it is usually linked to anomalous forcingof the atmosphere, such as from anomalous SSTs [Trenberthet al., 1998]. A predominant example is ENSO. Hence aninfluence external to the atmosphere (the ocean), puts animprint on the atmosphere via anomalous diabatic heatingarising from copious rainfall locked in place by SST patterns.
With the action focused in southern Asia during the Asianmonsoon season of July–August 2010 and in the tropicalAtlantic, owing to La Niña, and very high SSTs in theseregions, abundant moisture was supplied to the Asian landareas receiving monsoon rains in record amounts. Intensewell above normal rainfalls also occurred over the Bay ofBengal and Arabian and Caribbean seas.[36] Here we have presented empirical evidence that
anomalies in the diabatic heating were important in settingup the anomalous atmospheric circulation pattern. Theresulting teleconnections made some regions favorable foranticyclones to develop, persist, and redevelop as synopticweather events pass through the region, as happened overRussia (Figure 13). We hypothesize in this case that theproximate cause of the persistence and intensity of the RHWexternal to the atmosphere may have been high SSTs in theNorthern Indian Ocean region [see also Yun et al., 2010] andin the tropical Atlantic, which undoubtedly contain a globalwarming component even though dominated by a naturalvariability (ENSO related) component. The uniqueness ofthis situation and its event-like nature is related to thesimultaneous SST anomalies in the tropical Atlantic with theassociated Rossby wave propagating across the Atlantic aswell as in the northern Indian Ocean with its enhanced Asianmonsoon circulation. Both regions experienced record highSSTs.[37] Meanwhile, in the Atlantic, the absence of competition
from the Pacific and a more favorable wind (and wind shear)environment led to a vigorous Atlantic hurricane season.As the ITCZ migrated south, in association with very highSSTs in the region, it resulted in exceptionally heavy rainsin Colombia. The monsoon and Hadley circulation links tothe dry winter monsoon over South America, in turn, ledto drought in the Amazon in 2010 that was reminiscent ofthe drought in 2005 [Xu et al., 2011; Espinoza et al.,2011] when the all time record breaking Atlantic hurri-cane season occurred.[38] For the RHW, given the strong persistent anticyclone,
there are also important feedbacks that come into play thatamplify the drought and heat and set the stage for wildfires.There is a direct local contribution to the drying and hightemperatures in the absence of evaporative cooling [Trenberth,2011] in the Russian region that has been quantified by Lauand Kim [2012].[39] Increased greenhouse gases add only a small amount
to this directly (order 1 to 2%) [Trenberth, 2012], but theyaccumulate over months and powerful feedbacks greatlyamplify the effects. In mid-to-late July 2012, the reduction inclouds and associated increase in shortwave radiation at thesurface by order 20 W m�2 led to increased surface warm-ing. Reduced soil moisture led to a reduction in evaporativelatent heat flux of about 10 W m�2 and increased the sen-sible heat flux by order 15 W m�2 and longwave flux byabout 10 W m�2, as expected with higher surface tempera-tures. These anomalies in surface fluxes were increased by afurther 25% from late July to mid-August thereby providinga strong positive amplification of the warming by localfeedbacks [Lau and Kim, 2012]. The feedbacks highlight thefallacious argument often invoked that global warming cancontribute only 0.6�C (or so since the 1970s; i.e., the globaltemperature increase) to the huge temperature anomaliesrecorded in Russia. These strong positive feedbacks in
TRENBERTH AND FASULLO: CLIMATE EXTREMES—THE RUSSIAN HEAT WAVE D17103D17103
10 of 12

summer amplify the atmospheric circulation-induced effectsand thereby provide a means by which global warminglikely influenced the RHW as concluded by Rahmstorf andCoumou [2011].[40] In the Asian sector, as the northern monsoon faded,
activity began to pick up across Australia, which switched tobecome very wet in September, again reflecting the veryhigh SSTs to the north (second highest on record), associatedabundant moisture and the La Niña conditions. This was afore-runner to the heavy rains in Queensland in December2010 and January 2011 where the southern monsoon rainskicked in with the presence of very high SSTs (highestDecember SSTs on record).[41] It remains a challenge for climate models to correctly
simulate mean rainfall distributions, and as a result it is evenmore of a challenge to reproduce anomalies and associatedteleconnections [Yang and DelSole, 2012], such as thoseobserved in 2010. However, unless the diabatic heating,mainly from latent heating in precipitation linked to SSTanomalies, is properly simulated in both its spatial and tem-poral character, it will likely not be possible to simulate,predict, or fully attribute blocking events and climateanomalies such as observed.
[42] Acknowledgments. The National Center for AtmosphericResearch is sponsored by the National Science Foundation. Thanks go toDennis Shea for Figure 1 and other SST computations, Grant Branstatorfor discussions and use of his model, and NCAR colleagues for accessto model runs. This research is partially sponsored by NASA grantNNX09AH89G.
ReferencesBarriopedro, D., E. M. Fischer, J. Lutenbacher, R. M. Trigo, and R. Garcia-Herrera (2011), The hot summer of 2010: Redrawing the temperature recordmap of Europe, Science, 332, 220–224, doi:10.1126/science.1201224.
Barriopedro, D., C. Gouveia, R. Trigo, and L. Wang (2012), The 2009–2010 drought in China: Possible causes and impacts on vegetation,J. Hydrometeorol., doi:10.1175/JHM-D-11-074.1, in press.
Branstator, G. (2002), Circumglobal teleconnections, the jet stream wave-guide, and the North Atlantic Oscillation, J. Clim., 15, 1893–1910,doi:10.1175/1520-0442(2002)015<1893:CTTJSW>2.0.CO;2.
Brunet, G., et al. (2010), Collaboration of the weather and climate commu-nities to advance subseasonal-to-seasonal prediction, Bull. Am. Meteorol.Soc., 91, 1397–1406, doi:10.1175/2010BAMS3013.1.
Cassou, C., L. Terray, and A. S. Phillips (2005), Tropical Atlantic influenceon European heat waves, J. Clim., 18, 2805–2811, doi:10.1175/JCLI3506.1.
Dee, D., et al. (2011), The ERA Interim reanalysis: Configuration and per-formance of the data assimilation system, Q. J. R. Meteorol. Soc., 137,553–597, doi:10.1002/qj.828.
Deser, C., et al. (2012), ENSO and its Pacific decadal variability in CCSM4,J. Clim., 25, 2622–2651, doi:10.1175/JCLI-D-11-00301.1.
Ding, Q., and B. Wang (2005), Circumglobal teleconnection in the NorthernHemisphere summer, J. Clim., 18, 3483–3505, doi:10.1175/JCLI3473.1.
Dole, R., M. Hoerling, J. Perlwitz, J. Eischeid, P. Pegion, T. Zhang, X.-W.Quan, T. Xu, and D. Murray (2011), Was there a basis for anticipating the2010 Russian heat wave?, Geophys. Res. Lett., 38, L06702, doi:10.1029/2010GL046582.
Espinoza, J. C., J. Ronchail, J. L. Guyot, C. Junquas, P. Vauchel,W. Lavado,G. Drapeau, and R. Pombosa (2011), Climate variability and extremedrought in the upper Solimões River (western Amazon Basin): Under-standing the exceptional 2010 drought, Geophys. Res. Lett., 38, L13406,doi:10.1029/2011GL047862.
Fasullo, J., and P. J. Webster (2002), Hydrological signatures relatingthe Asian summer monsoon and ENSO, J. Clim., 15, 3082–3095,doi:10.1175/1520-0442(2002)015<3082:HSRTAS>2.0.CO;2.
Gent, P. R., et al. (2011), The Community Climate System Model version 4,J. Clim., 24, 4973–4991, doi:10.1175/2011JCLI4083.1.
Gillett, N. P., P. A. Stott, and B. D. Santer (2008), Attribution of cyclogenesisregion sea surface temperature change to anthropogenic influence,Geophys.Res. Lett., 35, L09707, doi:10.1029/2008GL033670.
Goswami, B. N., V. Krishnamurthy, and H. Annamalai (1999), A broad-scale circulation index for the interannual variability of the Indian summermonsoon, Q. J. R. Meteorol. Soc., 125, 611–633, doi:10.1002/qj.49712555412.
Hong, C.-C., H.-H. Hsu, N.-H. Lin, and H. Chiu (2011), Roles of Europeanblocking and tropical-extratropical interaction in the 2010 Pakistan flooding,Geophys. Res. Lett., 38, L13806, doi:10.1029/2011GL047583.
Houze, R. A., K. L. Rasmussen, S.Medina, S. R. Brodzik, and U. Romatschke(2011), Anomalous atmospheric events leading to the Summer 2010floods in Pakistan, Bull. Am. Meteorol. Soc., 92, 291–298, doi:10.1175/2010BAMS3173.1.
Joyce, R. J., J. E. Janowiak, P. A. Arkin, and P. Xie (2004), CMORPH:A method that produces global precipitation estimates from passivemicrowave and infrared data at high spatial and temporal resolution,J. Hydrometeorol., 5, 487–503, doi:10.1175/1525-7541(2004)005<0487:CAMTPG>2.0.CO;2.
Lau, W. K. M., and K.-M. Kim (2012), The 2010 Pakistan flood andRussian heat wave: Teleconnection of hydrometeorologic extremes,J. Hydrometeorol., 13, 392–403, doi:10.1175/JHM-D-11-016.1.
Liebmann, B., and C. A. Smith (1996), Description of a complete (inter-polated) outgoing longwave radiation dataset, Bull. Am. Meteorol. Soc.,77, 1275–1277.
Matsueda, M. (2011), Predictability of Euro-Russian blocking in summerof 2010, Geophys. Res. Lett., 38, L06801, doi:10.1029/2010GL046557.
Meehl, G. A., C. Tebaldi, G. Walton, D. Easterling, and L. McDaniel(2009), Relative increase of record high maximum temperatures comparedto record low minimum temperatures in the U.S., Geophys. Res. Lett., 36,L23701, doi:10.1029/2009GL040736.
Meehl, G. A., et al. (2012), Monsoon regimes and processes in CCSM4,Part 1: The Asian-Australian monsoon, J. Clim., 25, 2583–2608,doi:10.1175/JCLI-D-11-00184.1.
Nakamura, H.,M. Nakamura, and J. L. Anderson (1997), The role of high- andlow-frequency dynamics in the blocking formation, Mon. Weather Rev.,125, 2074–2093, doi:10.1175/1520-0493(1997)125<2074:TROHAL>2.0.CO;2.
Otto, F. E. L., N. Massey, G. J. van Oldenborgh, R. G. Jones, andM. R. Allen (2012), Reconciling two approaches to attribution of the 2010Russian heat wave, Geophys. Res. Lett., 39, L04702, doi:10.1029/2011GL050422.
Poveda, G., D. M. Álvarez, and Ó. A. Rueda (2011), Hydro-climatic vari-ability over the Andes of Colombia associated with ENSO: A review ofclimatic processes and their impact on one of the Earth’s most importantbiodiversity hotspots, Clim. Dyn., 36, 2233–2249, doi:10.1007/s00382-010-0931-y.
Rahmstorf, S., and D. Coumou (2011), Increase of extreme events in awarming world, Proc. Natl. Acad. Sci. U. S. A., 108(44), 17,905–17,909,doi:10.1073/pnas.1101766108.
Rayner, N. A., D. E. Parker, E. B. Horton, C. K. Folland, L. V. Alexander,D. P. Rowell, E. C. Kent, and A. Kaplan (2003), Global analyses of seasurface temperature, sea ice, and night marine air temperature since thelate nineteenth century, J. Geophys. Res., 108(D14), 4407, doi:10.1029/2002JD002670.
Rodwell, M. J., and B. J. Hoskins (1996), Monsoons and the dynamicsof deserts, Q. J. R. Meteorol. Soc., 122, 1385–1404, doi:10.1002/qj.49712253408.
Rodwell, M. J., and B. J. Hoskins (2001), Subtropical anticyclonesand summer monsoons, J. Clim., 14, 3192–3211, doi:10.1175/1520-0442(2001)014<3192:SAASM>2.0.CO;2.
Scaife, A. A., T. Woollings, J. Knight, G. Martin, and T. Hinton (2010),Atmospheric blocking and mean biases in climate models, J. Clim., 23,6143–6152, doi:10.1175/2010JCLI3728.1.
Schneidereit, A., S. Schubert, P. Vargin, F. Lunkeit, X. Zhu, D. Peters, andK. Fraedrich (2012), Large scale flow and the long-lasting blocking highover Russia: Summer 2010, Mon. Weather Rev., doi:10.1175/MWR-D-11-00249.1, in press.
Sedláček, J., O. Martius, and R. Knutti (2011), Influence of subtropicaland polar sea‐surface temperature anomalies on temperatures in Eurasia,Geophys. Res. Lett., 38, L12803, doi:10.1029/2011GL047764.
Shin, S.-I., P. D. Sardeshmukh, and K. Pegion (2010), Realism of local andremote feedbacks on tropical sea surface temperatures in climate models,J. Geophys. Res., 115, D21110, doi:10.1029/2010JD013927.
Smith, T. M., R. W. Reynolds, T. C. Peterson, and J. Lawrimore (2008),Improvements to NOAA’s historical merged land–ocean surface tempera-ture analysis (1880–2006), J. Clim., 21, 2283–2296, doi:10.1175/2007JCLI2100.1.
Takaya, K., and H. Nakamura (2001), A formulation of a phase-independentwave-activity flux for stationary and migratory quasigeostrophic eddies ona zonally varying basic flow, J. Atmos. Sci., 58, 608–627, doi:10.1175/1520-0469(2001)058<0608:AFOAPI>2.0.CO;2.
TRENBERTH AND FASULLO: CLIMATE EXTREMES—THE RUSSIAN HEAT WAVE D17103D17103
11 of 12
Trenberth, K. E. (1986), The signature of a blocking episode on the generalcirculation in the Southern Hemisphere, J. Atmos. Sci., 43, 2061–2069,doi:10.1175/1520-0469(1986)043<2061:TSOABE>2.0.CO;2.
Trenberth, K. E. (2011), Changes in precipitation with climate change,Clim. Res., 47, 123–138, doi:10.3354/cr00953.
Trenberth, K. E. (2012), Framing the way to relate climate extremes toclimate change, Clim. Change, doi:10.1007/s10584-012-0441-5, in press.
Trenberth, K. E., and K. C. Mo (1985), Blocking in the Southern Hemi-sphere, Mon. Weather Rev., 113, 3–21, doi:10.1175/1520-0493(1985)113<0003:BITSH>2.0.CO;2.
Trenberth, K. E., and D. J. Shea (2006), Atlantic hurricanes and natural var-iability in 2005, Geophys. Res. Lett., 33, L12704, doi:10.1029/2006GL026894.
Trenberth, K. E., and D. P. Stepaniak (2003), Co-variability of componentsof poleward atmospheric energy transports on seasonal and interannualtimescales, J. Clim., 16, 3691–3705, doi:10.1175/1520-0442(2003)016<3691:COCOPA>2.0.CO;2.
Trenberth, K. E., G. W. Branstator, D. Karoly, A. Kumar, N.-C. Lau, andC. Ropelewski (1998), Progress during TOGA in understanding andmodeling global teleconnections associated with tropical sea surface tem-peratures, J. Geophys. Res., 103, 14,291–14,324, doi:10.1029/97JC01444.
Trenberth, K. E., D. P. Stepaniak, and J. M. Caron (2000), The global mon-soon as seen through the divergent atmospheric circulation, J. Clim., 13,3969–3993, doi:10.1175/1520-0442(2000)013<3969:TGMAST>2.0.CO;2.
Trenberth, K. E., J. M. Caron, D. P. Stepaniak, and S. Worley (2002),The evolution of ENSO and global atmospheric surface temperatures,J. Geophys. Res., 107(D8), 4065, doi:10.1029/2000JD000298.
Trenberth, K. E., J. T. Fasullo, and J. Mackaro (2011), Atmospheric mois-ture transports from ocean to land and global energy flows in reanalyses,J. Clim., 24, 4907–4924, doi:10.1175/2011JCLI4171.1.
Vecchi, G. A., K. L. Swanson, and B. J. Soden (2008), Whither hurricaneactivity?, Science, 322, 687–689, doi:10.1126/science.1164396.
Waliser, D. E., and W. Zhou (1997), Removing satellite equatorial crossingtime biases from the OLR and HRC datasets, J. Clim., 10, 2125–2146,doi:10.1175/1520-0442(1997)010<2125:RSECTB>2.0.CO;2.
Webster, P. J., V. E. Toma, and H.-M. Kim (2011), Were the 2010 Pakistanfloods predictable?, Geophys. Res. Lett., 38, L04806, doi:10.1029/2010GL046346.
Williams, A. P., and C. Funk (2011), A westward extension of the warmpool leads to a westward extension of the Walker circulation, drying easternAfrica, Clim. Dyn., 37, 2417–2435, doi:10.1007/s00382-010-0984-y.
Xu, L., A. Samanta, M. H. Costa, S. Ganguly, R. R. Nemani, andR. B. Myneni (2011), Widespread decline in greenness of Amazonianvegetation due to the 2010 drought, Geophys. Res. Lett., 38, L07402,doi:10.1029/2011GL046824.
Yang, X., and T. DelSole (2012), Systematic comparison of ENSO telecon-nection patterns between models and observations, J. Clim., 25, 425–446,doi:10.1175/JCLI-D-11-00175.1.
Yun, K.-S., K.-J. Ha, and B. Wang (2010), Impacts of tropical ocean warm-ing on East Asian summer climate, Geophys. Res. Lett., 37, L20809,doi:10.1029/2010GL044931.
TRENBERTH AND FASULLO: CLIMATE EXTREMES—THE RUSSIAN HEAT WAVE D17103D17103
12 of 12