climate change sensitivity assessment on ...yosemite.epa.gov/sab/sabhap.nsf...jha, manoj, jeffrey g....
TRANSCRIPT
ABSTRACT: The Soil and Water Assessment Tool (SWAT)model was used to assess the effects of potential future climatechange on the hydrology of the Upper Mississippi River Basin(UMRB). Calibration and validation of SWAT were performedusing monthly stream flows for 1968-1987 and 1988-1997,respectively. The R2 and Nash-Sutcliffe simulation efficiencyvalues computed for the monthly comparisons were 0.74 and0.69 for the calibration period and 0.82 and 0.81 for the valida-tion period. The effects of nine 30-year (1968 to 1997) sensitiv-ity runs and six climate change scenarios were then analyzed,relative to a scenario baseline. A doubling of atmospheric CO2to 660 ppmv (while holding other climate variables constant)resulted in a 36 percent increase in average annual streamflowwhile average annual flow changes of -49, -26, 28, and 58 per-cent were predicted for precipitation change scenarios of -20, -10, 10, and 20 percent, respectively. Mean annual streamflowchanges of 51, 10, 2, -6, 38, and 27 percent were predicted bySWAT in response to climate change projections generatedfrom the CISRO-RegCM2, CCC, CCSR, CISRO-Mk2, GFDL, andHadCM3 general circulation model scenarios. High seasonalvariability was also predicted within individual climate changescenarios and large variability was indicated between scenarioswithin specific months. Overall, the climate change scenariosreveal a large degree of uncertainty in current climate changeforecasts for the region. The results also indicate that the simu-lated UMRB hydrology is very sensitive to current forecastedfuture climate changes. (KEY TERMS: climate change; general circulation model (GCM);simulation; hydrologic cycle, streamflow; Soil and WaterAssessment Tool (SWAT)).
Jha, Manoj, Jeffrey G. Arnold, Philip W. Gassman, Filippo Gior-gi, and Roy R. Gu, 2006. Climate Change Sensitivity Assess-ment on Upper Mississippi River Basin Streamflows UsingSWAT. Journal of the American Water Resources Association(JAWRA) 42(4):997-1016.
INTRODUCTION
Many coupled atmospheric ocean general circula-tion model (AOGCM) experiments have been per-formed in the past two decades to investigate theeffects of increasing greenhouse gas concentrations.These studies indicate that a rise in global mean tem-perature of between 1.4ºC and 5.8ºC would be expect-ed following a doubling of carbon dioxide (CO2)concentrations (Houghton et al., 2001). Changes inprecipitation are more speculative than temperatureprojections, especially for smaller regions. Althoughthe regional distribution is uncertain, precipitation isgenerally expected to increase worldwide, especiallyin higher latitudes (Houghton et al., 2001). Globalwarming is also projected to alter potential evapora-tion. The most immediate effect will be an increase inthe air’s ability to absorb water as temperature rises.Budyko (1982) estimated that potential evapotranspi-ration would increase by 4 percent for every degreeCelsius increase in temperature. Numerous studies(e.g., Saxe et al., 1998; Wullschleger et al., 2002b)
1Paper No. 04006 of the Journal of the American Water Resources Association (JAWRA) (Copyright © 2006). Discussions are open untilFebruary 1, 2007.
2Respectively, Center for Agricultural and Rural Development, Department of Economics, Iowa State University, Ames, Iowa, 50011-1070;Grassland, Soil and Water Research Laboratory, U.S. Department of Agriculture, Agricultural Research Service, 808 East Blackland Road,Temple, Texas 76502; Center for Agricultural and Rural Development, Department of Economics, Iowa State University, Ames, Iowa, 50011-1070; Abdus Salam International Centre for Theoretical Physics, Physics of Weather and Climate Section, Strada Costeira 11, 34100 Trieste,Italy; Department of Civil Engineering, 494 Town Engineering, Iowa State University, Ames, Iowa 50011-3232 (E-Mail/Gassman: [email protected]).
JOURNAL OF THE AMERICAN WATER RESOURCES ASSOCIATION 997 JAWRA
JOURNAL OF THE AMERICAN WATER RESOURCES ASSOCIATIONAUGUST AMERICAN WATER RESOURCES ASSOCIATION 2006
CLIMATE CHANGE SENSITIVITY ASSESSMENT ON UPPERMISSISSIPPI RIVER BASIN STREAMFLOWS USING SWAT1
Manoj Jha, Jeffrey G. Arnold, Philip W. Gassman, Filippo Giorgi, and Roy R. Gu2
have found that vegetative characteristics such asstomatal conductance and leaf area have also beenfound to change as a result of elevated CO2 concentra-tions, which in turn impact the rate of potential evap-otranspiration.
These projected effects of potential future climatechange would have significant impacts on manyhydrologic systems. The assessment of climate changeeffects generally follows an “impact approach” forhydrological and water resource studies (Carter etal., 1994). The impact approach is a linear analysis ofcause and effect: if climate were to change in adefined way, what would happen? The impact assess-ment scenarios include arbitrary changes, temporalanalogues, spatial analogues, and scenarios developedusing climate models (Arnell, 1996). Numerous stud-ies have been conducted at scales ranging from smallwatersheds to the entire globe to assess the impacts ofclimate change on hydrologic systems. Arnell et al.(2001) list nearly 80 studies published in the late1990s in which climate change impacts for one ormore watersheds were analyzed using a coupled cli-mate model hydrologic model approach. These studiesrepresented various subregions of the six inhabitedcontinents; over half of the studies were performed forwatersheds in Europe. Studies in the U.S. have beenperformed at both a national scale (48-state contermi-nous region) and for specific watersheds. Many of thestudies have been performed for watersheds in thewestern portion of the U.S. including all or portions ofthe Colorado River Basin (Nash and Gleick, 1991;Gleick and Chaleki, 1999; Wilby et al., 1999; Wolockand McCabe, 1999; Rosenberg et al., 2003; Chris-tensen et al., 2004; Barnett et al., 2004), ColumbiaRiver Basin (Hamlet and Lettenmaier, 1999; Letten-maier et al., 1999; Wolock and McCabe, 1999; Mileset al., 2000; Mote et al., 2003; Rosenberg et al., 2003;Payne et al., 2004; Barnett et al., 2004), and MissouriRiver Basin (Revelle and Waggoner, 1983; Frederick,1993; Fontaine et al., 2001; Hubbard, 1998; Letten-maier et al., 1999; Wolock and McCabe, 1999; Stone-felt et al., 2000; Stone et al., 2001; Stone et al., 2003;Rosenberg et al., 2003).
Comparatively few studies have been performed forthe Upper Mississippi River Basin (UMRB) region.According to the U.S. Geological Survey (USGS, 1999),the UMRB is very sensitive to climate change due tothe intersection within the region of the three airmasses (Pacific, Arctic, and Gulf of Mexico) that con-trol the climate of North America. This sensitivity toclimate change has been confirmed by analysis ofHolocene (last 10,000 years) sediment core data fromlakes (USGS, 1999) and streams (Knox, 2002) in theregion. The stream sediment data indicate thatextreme floods are especially sensitive to climaticchange. Shifts in precipitation and other climatic
conditions in the UMRB region could also have majorenvironmental consequences. Nitrate loads dis-charged from the mouth of the Mississippi River havebeen implicated as the primary cause of the Gulf ofMexico seasonal oxygen depleted hypoxic zone, whichcovered nearly 20,000 km2 in 1999 (Rabalais et al.,2002). Goolsby et al. (2001) estimated that 35 percentof the nitrate load discharged to the Gulf originatedfrom tributary rivers located in Iowa and Illinois dur-ing average discharge years between 1980 and 1996.It is possible that changes in UMRB flow characteris-tics due to future climate change could further exacer-bate this nitrate loading problem.
The majority of studies that include an assessmentof future climate change impacts on the hydrology ofthe UMRB have been performed within the context oflarger national or regional studies. Frederick (1993)conducted an assessment of the effects of an analog“dust bowl” climate (1931 to 1940), assumed to repre-sent potential future climate conditions of reducedprecipitation and higher temperatures, on the stream-flows of the Missouri, Upper Mississippi, andArkansas river basins. Wolock and McCabe (1999)performed a national assessment of projected futureclimate trends on the hydrology of 18 U.S. majorwater resource regions by linking a simple water-bal-ance model to two different AOGCMs: the CanadianCentre for Climate Modelling and Analysis CGCM1model (Flato et al., 2000) and the Hadley Centre forClimate Prediction and Research HadCM2 model(Johns et al., 1997). Rosenberg et al. (2003) also ana-lyzed the impact of HadCM2 projections for the 18major water resource regions, using the Soil andWater Assessment Tool (SWAT) watershed model(Arnold et al., 1998) within the Hydrologic Unit Modelfor the United States (HUMUS) modeling framework(Arnold et al., 1999). In contrast to these studies, Jhaet al. (2004) concentrated on analyzing the hydrologiceffects of potential future climate change for just theUMRB. Climate projections for the study were gener-ated for years 2040 to 2049 by downscaling aHadCM2 climate scenario with a regional climatemodel (RegCM2) developed by Giorgi et al. (1993).
This study builds on previous UMRB studies byusing SWAT to assess the impacts of simple sensitivi-ty scenarios and a suite of climate change scenarioson the hydrologic responses of the UMRB. The climatesensitivity assessment is similar to the approach usedby Stonefelt et al. (2000) and includes temperature,precipitation, and/or atmospheric CO2 sensitivity sce-narios. Actual assessments of potential future climatechanges cannot be performed via sensitivity changescenarios. However, Arnell et al. (2001, p. 203) statethat such scenarios do “provide extremely valuableinsights into the sensitivity of hydrological systems to changes in climate.” Wolock and McCabe (1999)
JAWRA 998 JOURNAL OF THE AMERICAN WATER RESOURCES ASSOCIATION
JHA, ARNOLD, GASSMAN, GIORGI, AND GU

further state that sensitivity studies of temperatureand precipitation variations can provide importantinsight regarding the responses and vulnerabilities ofdifferent hydrologic systems to climate change, espe-cially when there is a great deal of uncertaintybetween available AOGCM projections. The climatechange scenarios are based on monthly projections fora single downscaled climate scenario reported byGiorgi et al. (1998) and five AOGCM simulations per-formed for the A2 “Differentiated World” scenario thatis described in Carter et al. (2001). These six scenar-ios represent a range of future temperature and pre-cipitation projections for the UMRB region thatprovide important insight regarding the sensitivity ofthe UMRB stream system to future climate change.
The specific objectives of this study are to: (1) cali-brate and validate the SWAT hydrologic componentover a 30-year period (1968 to 1997) by using histori-cal climate data and comparing simulated outputwith observed streamflows measured at a gauge locat-ed near Grafton, Illinois; and (2) estimate fluctuationsin UMRB seasonal and average annual streamflowswith SWAT in response to nine climate sensitivityscenarios and six climate change scenarios.
MODEL DESCRIPTION
A brief description of the SWAT model is providedhere, with an emphasis on model functions that arefocused on reflecting the impacts of climate change.Detailed descriptions of the different model compo-nents can be found in Arnold et al. (1998) and Neitschet al. (2002a).
The SWAT model is a conceptual, physically-based,long term continuous watershed scale simulationmodel. The model is capable of simulating a high levelof spatial detail by allowing the division of a water-shed into a large number of subwatersheds. In SWAT,a watershed is divided into multiple subwatershedsthat are then further subdivided into uniquesoil/land-use characteristics called hydrologicresponse units (HRUs). Flow generation, sedimentyield, and nonpoint source loadings are summedacross all HRUs in a subwatershed, and the resultingloads are then routed through channels, ponds, and/orreservoirs to the watershed outlet. The model inte-grates functionalities of several other models, allow-ing for the simulation of climate, hydrology, plantgrowth, erosion, nutrient transport and transforma-tion, pesticide transport, and management practices.Previous applications of SWAT for flow and/or pollu-tant loadings have compared favorably with measured data for a variety of watershed scales (e.g.,Rosenthal et al., 1995; Arnold and Allen, 1996;
Srinivasan et al., 1998; Arnold et al., 1999; Saleh etal., 2000; Santhi et al., 2001).
Climate change impacts are simulated directly inSWAT by accounting for the effects of increased CO2on plant development and evapotranspiration(Neitsch et al., 2002a). The plant growth component ofSWAT utilizes routines for phenological plant devel-opment based on plant specific input parameters suchas energy and biomass conversion, precipitation andtemperature constraints, canopy height and rootdepth, and shape of the growth curve. Conversion ofintercepted light into biomass is simulated assuminga plant species specific radiation use efficiency (RUE).The RUE quantifies the efficiency of a plant in con-verting light energy into biomass and is assumed tobe independent of the plant’s growth stage. The RUEvalues are adjusted in SWAT as a function of CO2concentrations in the range of 330 to 660 parts permillion by volume (ppmv), following the approachdeveloped by Stockle et al. (1992). The effect ofincreasing vapor pressure deficit, which can result indecreased RUE, is factored into the RUE adjustment.
Three options are provided in SWAT to simulateevapotranspiration: Priestley-Taylor, Hargreaves, andPenman-Monteith. A modified version of the Penman-Monteith method is used in SWAT that accounts forthe effects of changing atmospheric CO2 in the tran-spiration computations, again in the range of 330 to660 ppmv. Initially, the impact of CO2 on leaf stom-atal conductance is computed following the modifica-tion used by Easterling et al. (1992), which assumes a40 percent reduction in leaf conductance at an atmo-spheric CO2 concentration of 660 ppmv, as found byMorison and Gifford (1983). The impact of elevatedCO2 on transpiration is then further accounted for bysimulating the effect of vapor pressure deficit on leafstomatal conductance, based on the approach used byStockle et al. (1992).
Implications of SWAT CO2 Assumptions
The assumption that higher atmospheric CO2 con-centrations will result in reduced leaf stomatal con-ductance has been confirmed across numerousexperimental and review studies conducted for a widevariety of vegetative species (e.g., Morison and Gif-ford, 1983; Morison, 1987; Hendry et al., 1993; Tyreeand Alexander, 1993; Field et al., 1995; Saxe et al.,1998; Wand et al., 1999; Medlyn et al., 2001;Wullschleger et al., 2002b). However, Wullschleger etal. (2002b) point out that there is a broad range ofstomatal conductance responses between differentplant species in response to elevated CO2 levels. Leafstomatal conductance reductions ranging from 27 to40 percent have been measured for herbaceous plant
JOURNAL OF THE AMERICAN WATER RESOURCES ASSOCIATION 999 JAWRA
CLIMATE CHANGE SENSITIVITY ASSESSMENT ON UPPER MISSISSIPPI RIVER BASIN STREAMFLOWS USING SWAT

species for elevated CO2 environments (Morison andGifford, 1983; Morison, 1987; Field et al., 1995), butlower or no impacts have been found for different treespecies (Saxe et al., 1998; Wullschleger et al.,2002a,b). In addition, it has been found that the totalleaf area of different plant types can increase inresponse to increasing levels of atmospheric CO2 (e.g.,Wand et al., 1999; Pritchard et al., 1999; Saxe et al.,1998), which potentially can offset the effect of stom-atal conductance reduction. Eckhardt and Ulbrich(2003) have directly addressed variable stomatal con-ductance and leaf area responses by incorporating dif-ferent stomatal conductance decline factors and leafarea index (LAI) values, as a function of five mainvegetation types, into a modified version of SWAT, butsuch an approach has not yet been adopted for thestandard version of SWAT used here.
Other research has further indicated that theeffects of CO2 measured at the leaf or plant level maybe reduced or negated at the broader field or regionallevels, due to a number of different factors (Jarvis and McNaughton, 1991; Polley et al., 2002;Wullschleger et al., 2002a). However, Kimball et al.(1999) and Wullschleger et al. (2002b) describe or cite other results that show that regional impacts can be
expected to occur, at least for some plant species andenvironmental conditions. For the present study, itcan be expected that the current approach used inSWAT will result in decreased evapotranspirationrates and subsequent increases in streamflows acrossthe UMRB. Previous applications of the standardSWAT model focused solely on evaluating the effectsof a doubled atmospheric CO2 concentration report awide range of impacts on average annual streamflow,including 0.4 percent for the 5,000 km2 Upper WindRiver Basin in northwestern Wyoming (Stonefelt etal., 2000), 16 percent for 427 km2 Spring CreekWatershed located in the Black Hills of South Dakota(Fontaine et al., 2001), and 13 to 38 percent for fivemajor subwatersheds of the Missouri River Watershed(Chen, 2001).
INPUT DATA
The UMRB is located in the north central UnitedStates (Figure 1). The UMRB extends from the sourceof the river at Lake Itasca in Minnesota to a pointjust north of Cairo, Illinois. The entire UMRB covers
JAWRA 1000 JOURNAL OF THE AMERICAN WATER RESOURCES ASSOCIATION
JHA, ARNOLD, GASSMAN, GIORGI, AND GU
Figure 1. Location of Grafton, Illinois, and the 131 USGS 8-Digit Watersheds Within the Upper MississippiRiver Basin (UMRB), and the Location of the UMRB Within the Mississippi River Basin.

a drainage area of approximately 491,700 km2. Theprimary land use is agricultural (over 75 percent) fol-lowed by forest (20 percent), wetlands, lakes, prairies,and urban areas.
Land use, soil, and topography data required forsimulating the UMRB in SWAT were obtained fromthe Better Assessment Science Integrating Point andNonpoint Sources (BASINS) Package Version 3(USEPA, 2001). Land-use categories available fromBASINS are relatively simplistic; for example, onlyone category for agricultural use that is defined as“Agricultural Land-Generic” (AGRL) is provided. TheBASINS soil data comes from the U.S. Department ofAgriculture (USDA) State Soil Geographic (STATS-GO) database (USDA, 1994), which contains soil mapsat a scale of 1:250,000. The STATSGO map unit islinked to a soil interpretations record attributedatabase that provides the proportionate extent of thecomponent soils and soil layer physical properties(texture, bulk density, available water capacity, satu-rated conductivity, soil albedo, and organic carbon) forup to 10 layers. Topographic information is providedin BASINS in the form of 90 m resolution digital ele-vation model (DEM) data.
The management operations were based on defaultassumptions provided by the SWAT2000 ArcViewinterface (AVSWAT), developed by Di Luzio et al.(2002), and consisted simply of planting, harvesting,and automatic fertilizer applications for the agricul-tural lands. No attempt was made to improve themanagement data because the main intent was toassess the sensitivity of climate change on streamflowrather than on water quality, and the managementassumptions have only minor impact on the SWAThydrologic estimates.
Climate data required by the model are daily pre-cipitation, maximum/minimum air temperature, solarradiation, wind speed and relative humidity. Thesedaily climatic inputs can be entered from historicalrecords, and/or generated internally in the modelusing monthly climate statistics that are based onlong-term weather records. In this study, historicalprecipitation and temperature records for the UMRBwere obtained for 111 weather stations located in andaround of the watershed (C. Santhi, personal commu-nication, Blacklands Research and Extension Labora-tory, Temple, Texas, 2002). Missing data in theprecipitation and temperature records, as well asdaily solar radiation, wind speed, and relative humid-ity inputs, were generated internally in SWAT.
The UMRB stream network and subwatershedswere delineated using AVSWAT, following specifica-tion of the threshold drainage area and the watershedoutlet. The threshold area is the minimum drainagearea required to form the origin of the stream. The accuracy of the delineation depends upon the
accuracy of the DEM data. USGS stream networkdata obtained from USEPA (2001) were used as a ref-erence to ensure that the stream system and associat-ed subwatersheds were accurately delineated, whichis an important component of simulating the waterrouting process. Several iterations were performed toalign the delineated stream network as closely as pos-sible to the USGS referenced stream network. Simi-larly, the subwatershed outlets were also adjusted sothat the subwatershed boundaries were as consistentas possible with the boundaries of 8-digit hydrologiccataloging units watersheds as defined by the USGS(Seaber et al., 1987). A total of 119 subwatershedswere delineated up to the point just before the conflu-ence of the Missouri River into the Mississippi River(i.e., Mississippi river at Grafton, Illinois). This pointconstitutes a drainage area of 447,500 km2 thatdrains approximately 90 percent of the entire UMRB,and was assumed to be the UMRB outlet for thisanalysis. Multiple HRUs were created automaticallywith AVSWAT within each subwatershed, as a func-tion of the dominant land-use and soil types within agiven subwatershed.
SIMULATION METHODOLOGY
The SWAT UMRB simulation methodology consist-ed of an initial calibration and validation phase fol-lowed by a second phase in which the impact ofvariations in climatic inputs was assessed for theUMRB hydrology. The following model options wereused for all of the UMRB simulations performed inboth phases: curve number (CN) method for the parti-tioning of precipitation between surface runoff andinfiltration, Muskingum method for channel routing,and modified Penman-Monteith method for potentialevapotranspiration.
Calibration and Validation of SWAT
The SWAT model was calibrated and validatedusing measured streamflow data collected at a USGSstream gauge located on the Mississippi River atGrafton, Illinois (Station No. 05587450) (NWIS,2001). The total available historical weather data(1967-1997) were divided into two sets: 20 years(1968-1987) for calibration (1967 was assumed to bean initialization year) and 10 years for validation(1988-1997). The watershed characteristics, includingland-use, soil properties, and anthropogenic effects(e.g., agricultural management), were held constantthroughout the simulation period. The coefficient of
JOURNAL OF THE AMERICAN WATER RESOURCES ASSOCIATION 1001 JAWRA
CLIMATE CHANGE SENSITIVITY ASSESSMENT ON UPPER MISSISSIPPI RIVER BASIN STREAMFLOWS USING SWAT

determination (R2) and Nash-Sutcliffe simulation effi-ciency (E) were used to evaluate the model predictionsfor both time periods. The R2 value is an indicator ofstrength of relationship between the observed andsimulated values. The E value indicates how well theplot of the observed versus the simulated values fitsthe 1:1 line. If the R2 values are close to zero, and theE values are less than or close to zero, then the modelprediction is unacceptable. If the values equal one,the model predictions are considered perfect.
The selection of parameters for the streamflow cali-bration and the final calibrated values of thoseparameters (Table 1) were based on guidelines givenin Neitsch et al. (2002b) or on previous SWAT stream-flow calibration results reported by Santhi et al.(2001) and Jha et al. (2003). Detailed descriptions ofeach of the calibration parameters are provided inNeitsch et al. (2002a). The initial values of each cali-bration parameter were generated by AVSWAT (Table1). The parameters were then allowed to vary duringthe calibration process within suggested rangesacross the basin until an acceptable fit between themeasured and simulated values was obtained atwatershed outlet. No changes were made to the cali-brated parameters during the 10-year validation sim-ulation.
Scenario Baseline
A scenario baseline, assumed to reflect current con-ditions, was executed prior to performing the sensitiv-ity and climate scenario simulations. Each scenariowas then run for the same simulation period, exceptwith modified climate inputs, to provide a consistentbasis for comparison of the scenario impacts. The
predicted outcomes can be affected by the choice oftime period for the baseline, due to climatic variationsthat have occurred between different time periods.Arnell (1996) summarized simulation periods used inseveral hydrological climate change impact studiesand found that a 30-year period from 1951 to 1980 (orshorter) was assumed for many climate change stud-ies to define baseline conditions. Thus, the 30-yearperiod from 1968 to 1997, which was used for the calibration and validation phase, was selected to rep-resent baseline conditions for this study. An atmo-spheric CO2 concentration of 330 ppmv was assumedfor the baseline scenario.
Climate Sensitivity Runs
A complete depiction of climate change consists oftwo components: emission of CO2 (and potentiallyother greenhouse gases) and a corresponding climateresponse. The emission component reflects the con-centration of greenhouse gases in the atmosphere atany given time while the climate response portiondefines the changes in climate that occur due tochanges in CO2 concentrations. The impacts of thesetwo climate change components on watershed hydrol-ogy can be simulated simultaneously in SWAT oraccounted for separately by simulating only the effectof an increase in atmospheric CO2 concentrations onplant growth and evapotranspiration, or simulatingtemperature, precipitation and/or other climaticchanges that serve as a proxy for assumed (but notsimulated) increases in CO2 concentrations. Decou-pling of the atmospheric CO2 effects from the climaticinputs facilitates sensitivity analyses of different cli-mate change influences on hydrologic responses; thus
JAWRA 1002 JOURNAL OF THE AMERICAN WATER RESOURCES ASSOCIATION
JHA, ARNOLD, GASSMAN, GIORGI, AND GU
TABLE 1. Hydrologic Calibration Parameters and Their Values for the UMRB.
Initial CalibratedCalibration Parametera Symbol Guidelinesb Estimates Values
Curve Number for Moisture Condition II CN2 ±10% –c -10%
Soil Evaporation Compensation Factor ESCO 0.0-1.00 0.95 0.75
Soil Available Water Capacity (mm) SOL_AWC ±0.04 –d - 0.02
Ground Water Revap Coefficient GW_REVAP max.: 0.2 0.02 0.02
Ground Water Delay Time (day) GW_DELAY – 31 20
Surface Runoff Lag Coefficient SURLAG – 4 2
aDetailed descriptions are given in Neitsch et al. (2002b).bCN2 and ESCO guidelines are given in Santhi et al. (2001); SOL_AWC and GW_REVAP guidelines are given in Neitsch et al. (2002b); bGW_DELAY and SURLAG calibration based on results reported by Jha et al. (2003).cA range of values was used for CN2; e.g., 67, 77, 83, and 87 were the original CN2 values selected by AVSWAT for the agricultural (AGRL) cland-use area for soil hydrologic group A, B, C, and D, respectively.dA range of values was used for the SOL_AWC based on guidance given by USDA (1994).

the two CO2 sensitivity runs reported here were exe-cuted independently of other climatic changes whilethe remaining sensitivity runs were performed with-out any changes in CO2 levels.
Table 2 lists the nine primary climate sensitivitysimulations that were performed for this study. Thefirst two sensitivity runs focused on multiplying thebaseline daily atmospheric CO2 level of 330 ppmv byfactors of 1.5 and 2.0, which follows the direct CO2doubling (2xCO2) approach described by Rosenberg etal. (1999) and are within the range of atmosphericconcentration projections for the second half of thetwenty-first century (Carter et al., 2001). SensitivityRuns 3 to 5 depict daily increases of 2, 4, and 6˚C tothe maximum and minimum temperatures simulatedin the 30-year baseline run. These temperature sensi-tivity simulations reflect the trends of increased glob-al temperatures forecast by current AOGCMs(Houghton et al., 2001). Sensitivity Runs 6 to 9 repre-sent adjustments of -20, -10, 10, and 20 percent to thedaily precipitation amounts incorporated in the base-line scenario. The 10 and 20 percent sensitivity runsreflect trends reported by the National Science Foun-dation (NSF, 2001) that precipitation in much of theMidwest including the UMRB region has increased by10 to 20 percent over the past century, and recent pro-jections by some AOGCMs that point to continuingtrends of increased rainfall in the region across thenext century (NSF, 2001: Hadley Centre, 2003; Giorgiet al., 1998; Pan et al., 2001). However, the contrast-ing scenarios of 10 and 20 percent precipitationdecreases were also simulated because some AOGCM2xCO2 climate projections point to the potential fordecreased precipitation in the region, at least overmuch of the year (e.g., RO-Mk2 projection describedbelow). Four other sensitivity runs were attempted(not shown in Table 2) that included three variationsof solar radiation levels (-10 percent, +10 percent, and+15 langleys) and one relative humidity sensitivitysimulation (+5 percent). The impacts of these fouradditional simulations were mostly minor asdescribed in the Results and Discussion section.
Climate Change Scenarios
The monthly precipitation and temperature fluctu-ations simulated for the six climate change scenariosare listed in Table 3. The CSIRO-RegCM2 scenariowas based on a future climate projection reported byGiorgi et al. (1998) that was generated for the Missouri-Iowa-Nebraska-Kansas (MINK) region bynesting RegCM2 within the Australian Common-wealth Scientific and Industrial Research Organiza-tion (CSIRO) AOGCM, described by Watterson et al.
(1995). A five-year scenario reflecting 2xCO2 concen-tration conditions (660 ppmv) was simulated in thestudy conducted by Giorgi et al. (1998); the 2xCO2 cli-mate was assumed to represent future conditions andwas not referenced to any specific time period. Forthis study, the average monthly temperature and pre-cipitation changes (Table 3) projected by RegCM2over the five-year period for the MINK region wereassumed to represent potential future UMRBintraseasonal precipitation and temperature shiftsover the 30-year SWAT simulation period, incombination with the 2xCO2 climate. A second 30-year SWAT CSIRO-RegCM2 scenario was also per-formed in which the precipitation and temperatureprojections were interfaced with the baseline atmo-spheric CO2 concentration of 330 ppmv, to providefurther insight into the sensitivity of SWAT to climat-ic variations.
The average monthly precipitation and tempera-ture projections for the other five climate change scenarios (Table 3) were obtained from the Intergov-ernmental Panel on Climate Change (IPCC) Data Dis-tribution Centre (IPCC, 2005). The five AOGCMmodels are the Canadian Centre for Climate Mod-elling and Analysis CCC model (Flato et al., 2000),the Centre for Climate Study Research CCSR model(Emori et al., 1999), the Geophysical Fluid DynamicsLaboratory GFDL model (Delworth et al., 2002), theCSIRO-Mk2 model described by Gordon and O’Farrell(1997), and the Hadley Centre for Climate Predictionand Research HadCM3 model (Johns et al., 2001). Theprecipitation and temperature projections shown in
JOURNAL OF THE AMERICAN WATER RESOURCES ASSOCIATION 1003 JAWRA
CLIMATE CHANGE SENSITIVITY ASSESSMENT ON UPPER MISSISSIPPI RIVER BASIN STREAMFLOWS USING SWAT
TABLE 2. Assumed Changes in Relevant Climate Parametersfor the Nine Climate Sensitivity Simulations.
ModifiedSensitivity Climate Magnitude
Run Parameter of Change* Run ID
1 CO2 (ppmv) 1.5 x 330 1.5xCO2
2 CO2 (ppmv) 2.0 x 330 2.0xCO2
3 Temperature (ºC) +2 +2C
4 Temperature (ºC) +4 +4C
5 Temperature (ºC) +6 +6C
6 Precipitation (%) -20 -20%
7 Precipitation (%) -10 -10%
8 Precipitation (%) +10 +10%
9 Precipitation (%) +20 +20%
*The changes shown here were applied uniformly across each day *of the 30-year baseline simulation period (the baseline atmospher-*ic CO2 concentration was 330 ppmv).

Table 3 represent the forecasts of these five modelsaveraged over the 30-year period 2061 to 2090 for theregion bounded between latitude 37 to 50˚N and lon-gitude 85 to 98˚W; this 30-year period represented theapproximate period in which the 2xCO2 climate (660ppmv) was projected to occur. These projections weregenerated in response to the A2 “DifferentiatedWorld” scenario, one of four IPCC scenarios describedby Carter et al. (2001). The average monthly precipi-tation and temperature fluctuations were then againused to simulate future UMRB hydrologic impacts inSWAT for the 30-year simulation period.
RESULTS AND DISCUSSION
Figure 2 shows the time-series comparison of pre-dicted and measured cumulative monthly stream-flows for the Mississippi River at Grafton, Illinois,over the 20-year (1968 through 87) calibration period.In general, SWAT accurately tracked the measuredstreamflows for the time period, although some peakflow months were overpredicted and many of the lowflow months were underpredicted. The time seriescomparison of predicted and measured cumulativemonthly streamflows for the 10-year (1988through1997) validation period is shown in Figure 3,again for the Mississippi River at Grafton, Illinois.
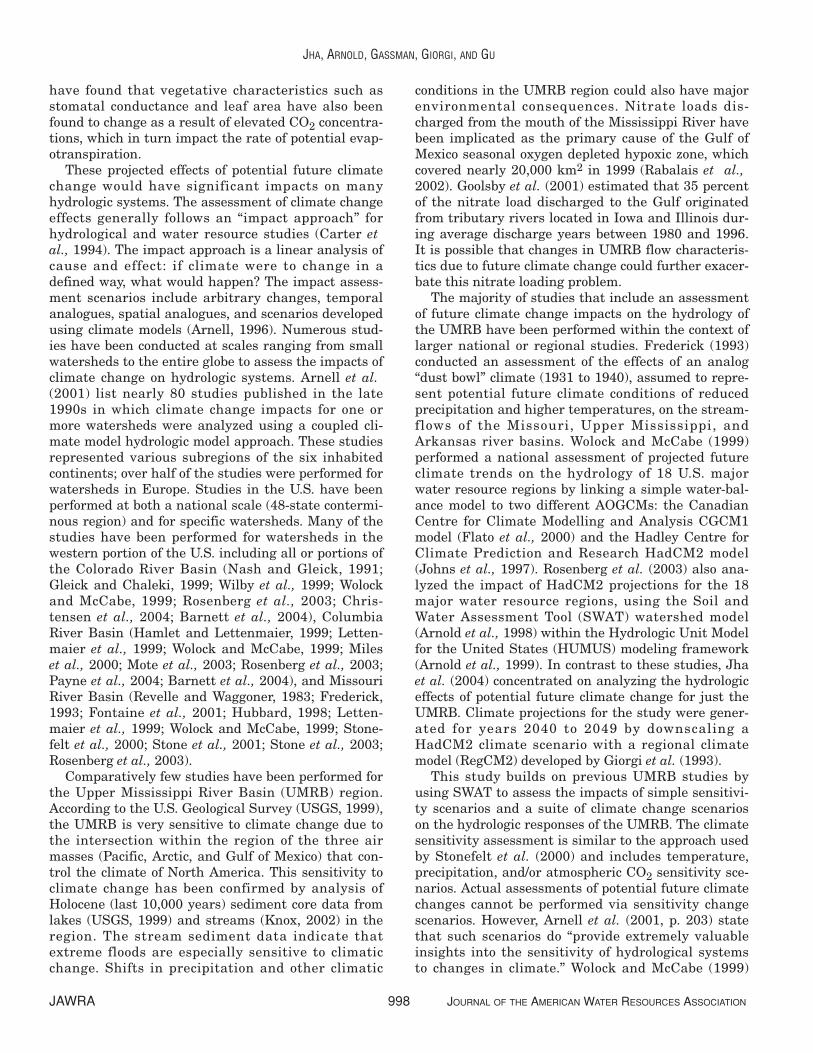
The predicted flows closely followed the correspondingmeasured flows, with less overprediction of peak flowmonths and less underprediction of low flow months,as compared to the calibration period. Daily, monthly,and annual flow statistics computed for the calibra-tion and validation periods (Table 4) also show astrong correlation between the simulated and mea-sured flows. The validation period statistics werestronger than those computed for the calibration peri-od (e.g., monthly validation R2 and E values of 0.82and 0.81 versus corresponding values of 0.74 and 0.69for the calibration period). A positive bias was foundfor all of the predicted streamflows, which was over 6 percent for the calibration period and under 4 per-cent for the validation period. Regression lines plottedbetween the simulated and measured monthly valuesreveal that this overprediction occurred primarily forlower flows (Figure 4).
Comparisons between measured and predictedannual average streamflows for 1968 to 1997 for theMississippi River at Grafton and 11 upstream subwa-tersheds were also conducted (Table 5), to provide anadditional assessment of how well SWAT trackedflows throughout the UMRB. No calibration was per-formed for the streamflow estimates for the 11upstream subwatersheds. The differences between the predicted and measured annual average stream-flows were 13 percent or less for 8 of the 12 water-sheds. The largest error occurred for the station near
JAWRA 1004 JOURNAL OF THE AMERICAN WATER RESOURCES ASSOCIATION
JHA, ARNOLD, GASSMAN, GIORGI, AND GU
TABLE 3. Assumed Changes in Relevant Climate Parameters on a MonthlyBasis for Each of the Six AOGCM Climate Change Scenarios.a
ClimateAOGCM Parameter J F M A M J J A S O N D
CSIRO-RegCM2b Temperature (ºC) 4.6 7.2 7.8 5.6 3.6 4.3 4.8 4.4 5.3 4.3 5.8 4.0Precipitation (%) 11 11 24 24 24 6 6 6 14 14 14 11
CCCc Temperature (ºC) 7.1 8.3 7.2 6.4 5.6 4.8 4.5 3.7 4.8 3.8 2.5 2.2Precipitation (%) -4.0 5.2 8.5 12.1 15.9 -3.2 -18.9 -13.3 -11.5 3.8 1.2 8.4
CCSRc Temperature (ºC) 8.6 8.0 7.8 9.3 7.2 6.7 6.5 7.1 7.6 6.6 7.9 8.7Precipitation (%) 13.5 15.9 11.9 9.3 15.5 0.4 10.9 4.8 -6.2 -31.3 -26.8 -7.9
CSIRO-Mk2c Temperature (ºC) 7.3 7.3 6.2 8.0 4.2 4.5 5.9 6.3 5.7 3.8 4.3 6.3Precipitation (%) 3.0 28.8 14.2 13.0 15.5 -9.3 -28.9 -32.6 -26.7 -11.2 -3.1 7.0
GFDLc Temperature (ºC) 3.9 4.9 3.5 3.5 2.8 3.0 4.6 4.6 3.2 4.3 3.4 4.1Precipitation (%) 16.8 22.8 10.9 15.7 10.1 -1.5 -7.0 -5.2 10.2 7.7 13.8 12.0
HadCM3c Temperature (ºC) 3.6 3.8 3.3 3.6 3.9 5.0 6.0 6.1 5.9 4.6 3.4 3.3Precipitation (%) 9.9 21.7 11.5 22.6 17.2 -10.4 -15.6 -10.4 -8.8 21.8 14.7 0.6
aAn atmospheric CO2 concentration of 660 ppmv (2xCO2) was assumed for each scenario.bThese projections were averaged over five years as described by Giorgi et al. (1998); RegCM2 is a regional model that was nested within the bCSIRO AOGCM.cProjections based on 30-year (2061-2090) averages of the A2 scenario, which is described by Carter et al. (2001).

Wapello, Iowa; the streamflows for this subwatershedwere underpredicted by about 21 percent. An R2 of0.66 was determined between the 12 simulated aver-age annual flows and corresponding measured flows,indicating that the model captured the average annu-al flow trends across the region. Overall, these aver-age annual results further confirm that SWAT wasable to reflect actual hydrologic conditions in theUMRB.
As a final check, average annual hydrologic bud-gets were computed for the scenario baseline and thenine sensitivity runs (Table 6) for the 30-year simula-tion period of 1968 to 1997. The shifts in the predictedhydrologic budget components between the baselineand the scenarios exhibit expected patterns including:(1) decreased evapotranspiration and subsequentincreased surface runoff and ground water flow for
JOURNAL OF THE AMERICAN WATER RESOURCES ASSOCIATION 1005 JAWRA
CLIMATE CHANGE SENSITIVITY ASSESSMENT ON UPPER MISSISSIPPI RIVER BASIN STREAMFLOWS USING SWAT
Figure 2. Monthly Time Series Comparison of Measured Versus Predicted Streamflowat Grafton, Illinois, During the 20-Year Calibration Period (1968-1987).
Figure 3. Monthly Time Series Comparison of Measured Versus Predicted Streamflowat Grafton, Illinois, During the 10-Year Validation Period (1988-1997).
JAWRA 1006 JOURNAL OF THE AMERICAN WATER RESOURCES ASSOCIATION
JHA, ARNOLD, GASSMAN, GIORGI, AND GU
TABLE 5. Comparisons Between Measured and Simulated Annual Average Streamflows During 1968 to 1997(30 years) for the Mississippi River at Grafton, Illinois, and 11 Upstream Subwatersheds.
Drainage Measured SimulatedUSGS Area Flow Flow Bias
USGS Station Name Station No. (km2) (mm) (mm) (percent)
Mississippi River near Royalton, Minnesota 05267000 30,175 168 196 17
Minnesota River near Jorden, Minnesota 05330000 43,715 121 129 11
St. Croix River at St Croix Falls, Wisconsin 05340500 20,030 227 180 -20
Chippewa River at Durand, Wisconsin 05369500 24,722 319 277 -8
Wisconsin River at Muscoda, Wisconsin 05407000 28,926 310 225 -17
Rock River near Joslin, Illinois 05446500 25,401 270 264 0.5
Iowa River at Wapello, Iowa 05465500 32,796 268 210 -21
Skunk River at Augusta, Iowa 05474000 11,246 252 283 13
Des Moines River at Keosaqua/St Francis, Iowa 05490500 37,496 207 215 7
Illinois River at Valley City, Illinois 05586100 74,603 332 282 -8
Maquoketa River at Maquoketa, Iowa 05418500 4,827 271 232 3
Mississippi River at Grafton, Illinois 05587450 447,539 253 236 -8
Figure 4. Regression Plots of Measured Versus Simulated Monthly Streamflows Relative to 1:1 Linesfor the (a) Calibration Period (1968-1987), and (b) Validation Period (1988-1997).
TABLE 4. Evaluation Statistics for the Simulated UMRB Streamflows at Grafton, Illinois.
Calibration Period (1968-1987) Validation Period (1988-1997)Streamflow Bias BiasComparison R2 E (percent) R2 E (percent)
Annual 0.82 0.75 6.4 0.91 0.90 3.3
Monthly 0.74 0.69 6.6 0.82 0.81 3.9
Daily 0.67 0.58 6.5 0.75 0.65 3.9
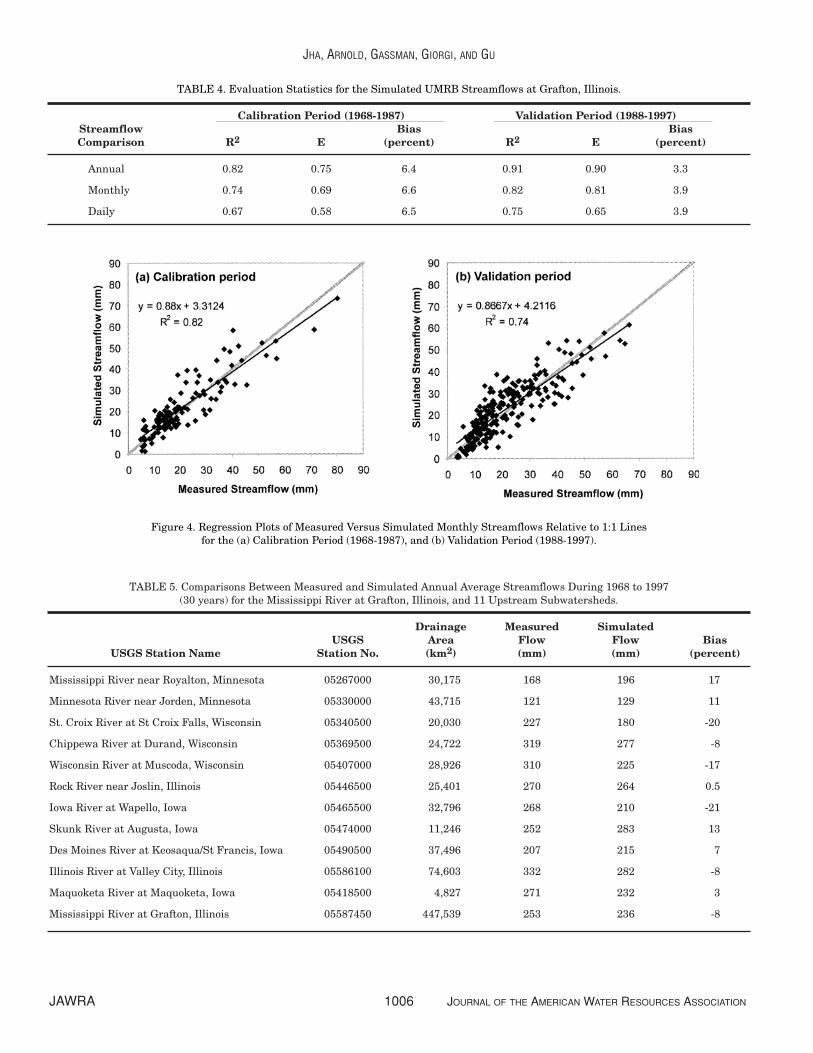
higher CO2 concentrations; (2) increased evapotran-spiration and decreased snowmelt, surface runoff, andground water flow in response to increased tempera-tures; and (3) increased evapotranspiration, surfacerunoff and ground water flows when precipitation isincreased (and vice versa for a precipitation decrease).Overall, the hydrologic budgets given in Table 6 con-firm that SWAT responded logically to the simulatedclimatic changes incorporated in the sensitivity runs.
Sensitivity Runs
Table 7 lists the average monthly and averageannual streamflows predicted for the UMRB outlet atGrafton, Illinois, for the scenario baseline, the corre-sponding relative differences in the average monthlystreamflows for the nine different sensitivity runs,and the standard deviations of the streamflows that were determined for the baseline and the sensi-tivity runs. The average monthly streamflows for the
JOURNAL OF THE AMERICAN WATER RESOURCES ASSOCIATION 1007 JAWRA
CLIMATE CHANGE SENSITIVITY ASSESSMENT ON UPPER MISSISSIPPI RIVER BASIN STREAMFLOWS USING SWAT
TABLE 7. Predicted Relative Changes in Total Water Yield for the Mississippi River atGrafton, Illinois, for the Nine Climate Sensitivity Simulations.
Baseline 1.5xCO2 2xCO2 +2C +4C +6C -20% -10% +10% +20%Month (mm) Percent Change
January 11.3 13 28 19 29 30 -44 -22 24 47
February 11.9 9 20 2 -2 -9 -41 -21 21 42
March 22.0 9 20 -24 -38 -47 -45 -24 23 47
April 21.6 14 32 -16 -26 -35 -47 -24 27 55
May 25.9 16 35 -9 -20 -31 -46 -23 27 53
June 27.4 15 34 -12 -26 -41 -48 -25 27 56
July 25.3 17 39 -12 -31 -44 -50 -26 30 61
August 19.6 21 50 -13 -22 -26 -55 -29 34 72
September 17.7 21 51 -3 -2 0 -56 -31 35 74
October 17.8 20 48 3 6 7 -54 -29 32 67
November 18.4 17 41 1 2 0 -52 -28 27 60
December 16.8 15 34 10 12 9 -46 -24 26 52
Average Annual (mm) 235.5 16 36 -7 -14 -21 -49 -26 28 58
Monthly Standard Deviation 5.1 6.0 7.2 3.6 2.8 2.7 2.7 3.9 6.7 8.3
TABLE 6. Average Annual Hydrologic Budget Components Simulated by SWATfor the UMRB Baseline and Nine Climate Sensitivity Simulations.
Climate Sensitivity SimulationsHydrologic Budget Baseline 1.5xCO2 2xCO2 +2C +4C +6C -20% -10% +10% +20%
Components (mm) (mm) (mm) (mm) (mm) (mm) (mm) (mm) (mm) (mm)
Precipitation 846 846 846 846 846 846 678 762 932 1,016
Snowfall 118 118 118 93 70 52 94 106 129 141
Snowmelt 116 116 116 92 69 51 93 104 127 138
Surface Runoff 92 100 110 79 70 61 47 68 120 150
Base Flow 149 178 217 145 138 131 77 111 188 228
Potential ET 1,180 1,083 949 1,288 1,394 1,503 1,186 1,186 1,184 1,184
Evapotranspiration (ET) 597 560 512 614 631 647 547 575 614 628
Total Water Yield* 235 272 321 219 203 187 120 175 302 371
*Total water yield (streamflow) = surface runoff + base flow – transmission losses; transmission losses are a minor component of the overall *hydrologic balance (ranged from 4 to 7 mm).

baseline and the sensitivity runs are also plotted inFigure 5 to further illustrate the predicted seasonaleffects of the assumed climate changes on the Missis-sippi flows at Grafton.
Relative water yield increases ranging from 9 to 21percent and 20 to 51 percent were predicted by SWATin response to the 1.5xCO2 and 2xCO2 sensitivityruns, respectively, with the greatest increases occur-ring between July and November (Table 7). Thetrends shown in Figure 5 indicate that the flowincrease magnitudes were relatively consistent out-side of the winter months of December throughFebruary for both CO2 change simulations. Overall,the average annual streamflow increases were 16 and36 percent for the two CO2 sensitivity runs (Table 7)over the 30-year simulation period. The correspondingstandard deviations were determined to be 6.0 and7.2, indicating greater variability occurred within thetwo CO2 sensitivity runs relative to the baseline.These results suggest that the hydrology of theUMRB region is potentially very sensitive toincreased atmospheric CO2 concentrations and areconsistent with expectations; i.e., that transpirationwill decrease in response to increased CO2 levels,resulting in greater soil moisture levels and in turnhigher flow.
Mixed streamflow results at Grafton were predict-ed by SWAT in response to the three temperaturesensitivity runs depicting average monthly increasesof 2, 4, and 6°C (Table 7 and Figure 5). A linear pat-tern was exhibited in the average annual streamflowdecreases of -7, -14, and -21 percent predicted for the2, 4, and 6°C sensitivity runs, respectively. This linear
pattern was also evident for the relatively largedecreases in streamflows predicted for all three tem-perature sensitivity runs for the five-month span fromMarch to July. However, the predicted monthly flowsreflect nonlinear behavior between these three simu-lations for most of the fall and winter months. Thepredicted flows for the temperature sensitivity runstended to converge during this period, especially dur-ing the months of September to December. In general,the magnitude of the predicted flow impacts weremuch greater during the spring and summer months(Figure 5). Standard deviations of 3.6, 2.8, and 2.7were determined for the 2, 4, and 6°C sensitivity runs,respectively, which were all lower than the baselinestandard deviation of 5.1.
Two key effects of the increased temperature sensi-tivity runs were a decrease in snowpack levels accom-panied by an increase in snowmelt runoff, whichresulted in the increased flows in the winter monthsat Grafton. The decrease in snowpack levels is consis-tent with similar temperature increase scenariosreported by Nash and Gleick (1991), van Katwijk etal. (1993), and Stonefelt et al. (2000) for studiesfocused on snowmelt dominated watersheds. However,those studies showed that the annual peak runoffperiod that occurs due to snowmelt was predicted toshift from June to May or April; in contrast, flowincreases were predicted in this study to occur duringDecember and January due to increased snowmeltand precipitation in the form of rainfall, but largedecreases in flow were predicted from Februarythrough August (Table 7 and Figure 5).
JAWRA 1008 JOURNAL OF THE AMERICAN WATER RESOURCES ASSOCIATION
JHA, ARNOLD, GASSMAN, GIORGI, AND GU
Figure 5. Change in Average Monthly Streamflows Predicted for Climate SensitivityRuns 1-9 Relative to the Baseline Over the 30-Year Simulation Period.

Essentially linear changes in the UMRB stream-flows were predicted for the simulated decreases orincreases in precipitation, which were incorporated insensitivity runs 6 through 9 (Table 7 and Figure 5).The relative average monthly flow decreases werenear or greater than 50 percent for nine of the 12months for Scenario 3 (-20 percent precipitationdecline). Even greater relative average monthly flowchanges were predicted for Scenario 6, which reflecteda 20 percent increase in precipitation. The predictedaverage annual flow changes were -49, -26, 28, and 58percent for Scenarios 3, 4, 5, and 6 (Table 7). Thestandard deviations ranged from 2.7 for the -20 per-cent precipitation decline to 8.3 for the +20 percentprecipitation increase, indicating that the streamflowvariability increased with increasing precipitation.The flow responses estimated by SWAT for these fourscenarios indicate that the UMRB hydrologic systemis very sensitive to fluctuations in precipitation levels.
The predicted decrease in water yield of almost 50percent for a 20 percent decline in precipitation wasconsiderably higher than the 29 percent decrease inUMRB flows reported by Frederick (1993) for an ana-logue dust bowl climate, which included the effects ofhigher temperature. The effects of the -20 and +20percent precipitation sensitivity runs (Table 7) weresimilar to UMRB seasonal flow impacts reported byThomson et al. (2003), which ranged from -59 percentin summer to -33 percent in spring and 37 percent insummer to 62 percent in winter in response to
El Niño and Strong El Niño climate patterns, respec-tively, and also included effects of temperaturechanges as well as precipitation fluctuations. Howev-er, the largest flow increases were predicted to occurduring the summer or fall in the present study, whichis essentially opposite of what Thomson et al. (2003)found.
The impacts of the solar radiation sensitivity runs(not shown) were relatively minor, resulting in a fluc-tuation range of -2 to +4 percent in average annualstreamflows at Grafton. This would indicate thatsolar radiation shifts would be a minor factor inaffecting UMRB hydrology. However, increasing rela-tive humidity by +5 percent (not shown) resulted inan increase of 14 percent in the average annualstreamflows at Grafton, due to a decrease of roughly30 mm in average annual evapotranspiration.
Climate Change Scenarios
The climate change scenario impacts on the UMRBstreamflows at Grafton are shown in Table 8 and inFigures 6 and 7. Large variations in average annualstreamflows relative to the baseline were predicted bySWAT in response to the six different AOGCM sce-narios (Table 8). In general, the predicted seasonalstreamflow impacts varied greatly between the six cli-mate change projections, which reflects the widerange of temperature and precipitation projections
JOURNAL OF THE AMERICAN WATER RESOURCES ASSOCIATION 1009 JAWRA
CLIMATE CHANGE SENSITIVITY ASSESSMENT ON UPPER MISSISSIPPI RIVER BASIN STREAMFLOWS USING SWAT
TABLE 8. Predicted Relative Changes in Total Water Yield for the Mississippi River atGrafton, Illinois, for the Six AOGCM Climate Change Scenarios for a 2xCO2 Climate.
CSIRO- CSIRO-Baseline RegCM2 CCC CCSR Mk2 GFDL HadCM3
Month (mm) Percent Change
January 11.3 99 81 24 53 94 80
February 11.9 45 15 2 28 60 49
March 22.0 -4 -21 -28 -13 1 2
April 21.6 37 10 -3 13 34 41
May 25.9 55 24 8 25 43 55
June 27.4 37 4 -10 0 27 21
July 25.3 30 -17 2 -26 12 -6
August 19.6 48 -14 37 -46 11 -14
September 17.7 79 -1 43 -49 43 -5
October 17.8 85 21 11 -32 56 36
November 18.4 73 26 -22 -15 58 49
December 16.8 77 43 -20 16 71 58
Average Annual (mm) 235.5 51 10 2 -6 38 27
Monthly Standard Deviation 5.1 6.6 5.2 5.9 6.9 5.3 7.1

listed in Table 3. Greater fluctuations between pre-dicted streamflow decreases and increases occurredfor the CCC, CCSR, and CSIRO-Mk2 scenarios, withnoticeable differences in seasonal patterns. The pre-dicted streamflows also varied greatly between theclimate change scenarios within a single month. Themost extreme differences were predicted for themonth of September, for which the streamflowchanges was predicted to range from -49 percent forthe CISRO-Mk2 projection to 79 percent for the CISRO-RegCM2 scenario. The CISRO-RegCM2,
GFDL, and HadCM3 scenarios resulted in large rela-tive streamflow increases being predicted in mostmonths and in the largest estimated overall averageannual flow increases of 51, 38, and 27 percent,respectively. Relatively slight overall average annualstreamflow increases of 10 and 2 percent were pre-dicted for the CCC and CCSR projections. TheCISRO-Mk2 scenario resulted in the only estimatedaverage annual streamflow decrease (-6 percent),which was likely due to the large forecasted decreasesin precipitation during June to October (Table 3).
JAWRA 1010 JOURNAL OF THE AMERICAN WATER RESOURCES ASSOCIATION
JHA, ARNOLD, GASSMAN, GIORGI, AND GU
Figure 6. Change in Average Monthly Streamflows Predicted for CSIRO-RegCM2 Climate Change Scenario, With No Changein CO2 (330 ppmv) and a 2xCO2 Climate (660 ppmv), Relative to the Baseline Over the 30-Year Simulation Period.
Figure 7. Change in Average Monthly Streamflows Predicted for Five AOGCM Climate ChangeScenarios With 2xCO2 Relative to the Baseline Over the 30-Year Simulation Period.

Large relative increases in January streamflowwere predicted for all of the scenarios; Januaryincreases of 80 percent or more were predicted inresponse to the CSIRO-RegCM2, CCC, GFDL, andHadCM3 projections. These January increases cou-pled with the February streamflow increases point toincreased snowmelt and more precipitation in theform of rainfall during these two winter months, simi-lar to the previously described results for the temper-ature sensitivity runs. These winter flow trends againdiffer from those reported for climate change studiesfocused on snowmelt-dominated watersheds in thewestern U.S. (Leavesley et al., 1994; McCabe andWolock, 1999; Christensen et al., 2004).
Markedly different patterns emerged for thestreamflow trends predicted for the AOGCM scenar-ios (Figures 6 and 7) relative to the trends predictedfor the sensitivity runs (Figure 5). The CISRO-RegCM2 scenario was split out into a separate figure(Figure 6) to provide a comparison between a 2xCO22climate and baseline ambient CO22 conditions. A near-ly uniform shift of roughly 10 mm in average stream-flow increase was predicted for the majority of monthsin response to the doubled CO22 environment, confirm-ing that CO22 concentration is a key driver in thestreamflow predictions estimated by SWAT. The flowpatterns generated for the CCC, GFDL, and HadCM3scenarios were similar to the CISRO-RegCM2 sce-nario (Figures 6 and 7) and generally resulted in pre-dicted flow increases relative to the baseline inJanuary and February, April to June, and Septemberto December, and decreases or no change in flow inMarch, July, and August. The average monthly flowpatterns generated by SWAT in response to the CCSR
and CISRO-Mk2 scenarios deviated noticeably formthe other scenarios during July to December. This wasespecially true of the CCSR scenario, which resultedin relatively large flows in August and September andthen declined below the baseline during October toDecember.
The standard deviations determined for the six cli-mate scenarios ranged from 5.2 to 7.1 and were allhigher than the baseline standard deviation of 5.1(Table 8), indicating that the variability in stream-flows was higher for the climate change scenarios.Boxplot representations of streamflow variability areshown in Figure 8 for the baseline, climate changescenarios, and the measured streamflows. These plotsfurther confirm the general patterns of variability,and indicate that the streamflows predicted for theCISRO-RegCM2 and GFDL scenarios were consis-tently higher than those predicted for the baselineand other climate scenarios. The plots also show thatthe median streamflow predicted for the baseline andall six climate change scenarios exceeded that foundfor the measured streamflows.
The results of this study and of several previousstudies present a conflicting picture of potentialfuture climate change impacts on UMRB streamflows.Rosenberg et al. (2003) report 2095 UMRB averageannual streamflow increases of 53 and 48 percent, inresponse to a HadCM2 projection that was simulatedwith and without a doubled CO22 concentration,respectively. Jha et al. (2004) report a 50 percentUMRB annual average flow increase for 2040 to 2049that was predicted via downscaled HadCM2 inputsinto SWAT, but without accounting for the CO22concentration level (assumed to be 480 ppmv). The
JOURNAL OF THE AMERICAN WATER RESOURCES ASSOCIATION 1011 JAWRA
CLIMATE CHANGE SENSITIVITY ASSESSMENT ON UPPER MISSISSIPPI RIVER BASIN STREAMFLOWS USING SWAT
Figure 8. Box Plots Depicting the Variabilityof the 30-Year Average Measured, Baseline,
and Climate Change ScenarioStreamflows at Grafton, Illinois.

magnitude of the CISRO-RegCM2 scenario presentedhere was similar to the results reported in these twostudies. However, exclusion of CO22 for the CISRO-RegCM2 simulation resulted in only a 17 percentannual average flow increase at Grafton and the sea-sonal shifts found for both CISRO-RegCM2 simula-tions (Figure 5) varied considerably from thosereported by Rosenberg et al. (2003). Mirror oppositeshifts of -22 and +22 percent in 2030 UMRB wateryields were found by Wolock and McCabe (1999), inresponse to CGCM1 and HadCM2 climate projectioninputs, respectively. Water yields driven by 2095HadCM2 projections were predicted to increase by 68percent for the UMRB (Wolock and McCabe, 1999);the CGCM1 inputs had no effect on the flows. Theresults found by Wolock and McCabe reflect the largerange in predicted future streamflow impacts thatwere found in this study with the five AOGCMs for2061 to 2090 (Table 5).
Analyses of U.S. precipitation trends over the pastcentury indicate that average U.S. precipitation hasincreased by 5 to 10 percent and the average increasein the UMRB region is even higher (NSF, 2001). Muchof this precipitation increase can be attributed to anincrease in the frequency and intensity of heavy and extreme precipitation events (Karl and Knight,1998; NSF, 2001). These trends suggest that the CISRO-RegCM2, GFDL, and HadCM3 projections forthe UMRB, which reflect higher future precipitationlevels and greater streamflows, may be the most accu-rate for the region. If so, this could portend moreextreme flooding events in the future for the region.Recent analyses of U.S. streamflow trends do notreveal any clear increases in extreme flow events(McCabe and Wolock, 2002; Lins and Slack, 1999),which underscores that increased rainfall levels in thefuture will not definitely result in increased extremestreamflow events. However, Knox (2000) states thatalluvial records of UMRB paleofloods indicate thatpast natural floods were very sensitive to even modestchanges in climate, which were similar in magnitudeto current projections of climate change. The issue ofextreme stream events is of less interest if the pre-dicted streamflows found here for the CCC, CCSR,and CISRO-Mk2 projections are more indicative offuture UMRB trends.
CONCLUSIONS
The results of this study indicate that the simulat-ed UMRB hydrologic system is very sensitive to cli-matic variations, both on a seasonal basis and over
longer time periods. The sensitivity runs showed thatprecipitation and CO22 fertilization shifts would havea greater impact on future flow changes, as comparedto increased temperature impacts. However, theimpact of temperature clearly increased as the magni-tude of temperature change was increased. Mostly minor impacts were predicted for four solar radiationand relative humidity sensitivity runs.
Changes in annual average UMRB streamflows atGrafton for 2061 to 2090 were predicted to range from-6 to +51 percent for the six AOGCM projections thatwere analyzed for this study. These results point to agreat deal of uncertainty in current AOGCM projec-tions for the region and make it difficult to draw anydefinitive conclusions about future UMRB streamflowimpacts. However, it is noteworthy that several cli-mate change studies have reported future UMRBannual average streamflow impacts of a similar mag-nitude to the 50 percent increase reported here for theCISRO-RegCM2 scenario, which could indicate futureproblems regarding extreme streamflow events in theregion. The results reported here would indicate thatsnowmelt and rainfall would increase in January andFebruary, and that large increases in spring stream-flow could be expected.
The results of this study point to the need to per-form a more extensive assessment of potential climatechange impacts on UMRB hydrology by simulatingthe same downscaled climate change scenario(s) withseveral AOGCMs (e.g., CSIRO, HadCM3) in tandemwith one or more RCMs. Future UMRB climatechange studies should also be performed withimproved land-use data, such as the approach initiat-ed by Gassman et al. (2003) using land use data pro-vided by the USDA National Resources Inventorydatabase (Nusser and Goebel, 1997), which facilitatesthe assessment of both flow and environmentalimpacts for current and potential future climate pat-terns. There is also a need to incorporate a morerefined method of estimating CO2 concentrationeffects on crop growth and transpiration into the stan-dard version of SWAT, which accounts for the impactof CO2 on leaf area and stomatal conductance as afunction of vegetative species. Finally, analysis of bothextreme flow events and average flow conditions, sim-ilar to the procedures described by Boorman andSefton (1997), is needed to provide a more completepicture of the potential impacts of projected future cli-mates on UMRB hydrology.
JAWRA 1012 JOURNAL OF THE AMERICAN WATER RESOURCES ASSOCIATION
JHA, ARNOLD, GASSMAN, GIORGI, AND GU

LITERATURE CITED
Arnell, N.W., 1996. Global Warming, River Flows and WaterResources. Water Science Series, Institute of Hydrology, JohnWiley and Sons, New York, New York, ISBN 0-471-96599-5.
Arnell, N.W., C. Liu, R. Compagnucci, L. da Cunha, K. Hanaki, C. Howe, G. Mailu, I. Shiklomanov, and E. Stakhiv, 2001.Hydrology and Water Resources. In: Climate Change 2001:Impacts, Adaptation, and Vulnerability. JJ. McCarthy, O. Canziani, N.A. Leary, D.J. Dokken, and K.S. White (Editors).Cambridge University Press, Cambridge, United Kingdom,Chapter 4, pp. 191-233.
Arnold, J.G. and P.M. Allen, 1996. Estimating Hydrologic Budgetsfor Three Illinois Watersheds. Journal of Hydrology 176:57-77.
Arnold, J.G., R. Srinivasan, R.S. Muttiah, and P.M. Allen, 1999.Continental Scale Simulation of the Hydrologic Balance. Jour-nal of American Water Resources Association (JAWRA) 35(5):1037-1051.
Arnold, J.G., R. Srinivasan, R.S. Muttiah, and J.R. Williams, 1998.Large Area Hydrologic Modeling and Assessment Part I: ModelDevelopment. Journal of the American Water Resources Associ-ation (JAWRA) 34(1):73-89.
Barnett, T., R. Malone, W. Pennell, D. Stammer, B. Semtner, and W. Washington, 2004. The Effects of Climate Change on WaterResources in the West: Introduction and Overview. ClimaticChange 62(1-3):1-11.
Boorman, D.B. and C.E.M. Sefton, 1997. Recognizing the Uncer-tainty in the Quantification of the Effects of Climate Change onHydrological Response. Climatic Change 35:415-434.
Budyko, M.I., 1982. The Earth’s Climate: Past and Future. Interna-tional Geophysics Series, Academic Press, New York, New York,Vol. 29.
Carter, T.R., E.L. La Rovere, R.N. Jones, R. Leemans, L.O. Mearns,N. Nakicenovic, A.B. Pittock, S.M. Semenov, and J. Skea, 2001.Hydrology and Water Resources. In: Climate Change 2001:Impacts, Adaptation, and Vulnerability, JJ. McCarthy, O. Canziani, N.A. Leary, D.J. Dokken, and K.S. White (Editors).Cambridge University Press, Cambridge, United Kingdom,Chapter 4, pp. 145-190.
Carter, T.R., M.L. Parry, H. Harasawa, and S. Nishioka, 1994. IPCCTechnical Guidelines for Assessing Climate Change Impacts andAdaptation. Intergovernmental Panel on Climate Change,CGER-I015-94, Department of Geography, University CollegeLondon, United Kingdom, and the Center for Global Environ-mental Research, National Institute for Environmental Studies,Tsukuba, Japan. Available at http://www-cger.nies.go.jp/cger-e/e_report/r_index-e.html. Accessed in April 2005.
Chen, P., 2001. Impacts of Stomatal Resistance on Evapotranspira-tion and Water Yield in Climate Change Modeling. MS Thesis,Washington State University, Pullman, Washington, 110 pp.
Christensen, N.S., A.W. Wood, N. Voisin, D.P. Lettenmaier, and R.N.Palmer, 2004. The Effects of Climate Change on the Hydrologyand Water Resources of the Colorado River Basin. ClimaticChange 62(1-3):337-363.
Delworth, T.L., A.J. Broccoli, K.W. Dixon, T.R. Knutson, P.J. Kushn-er, M.J. Spelman, R.J. Stouffer, and R.T. Wetherald, 2002. Simu-lation of Climate Variability and Change by the GFDL R30Coupled Climate Model. Climate Dynamics 9:555-574.
Di Luzio, M., R. Srinivasan, J.G. Arnold, and S. Neitsch, 2002.ArcView Interface for SWAT 2000 User’s Guide. BlacklandResearch Center, Texas Agricultural Experiment Station, Temple, Texas. Available at http://www.brc.tamus.edu/swat/downloads/doc/swatav2000.pdf. Accessed in June 2005.
Easterling, W.E., N.J. Rosenberg, M.S. McKenney, C.A. Jones, P.T.Dyke, and J.R. Williams, 1992. Preparing the Erosion Productiv-ity Impact Calculator (EPIC) Model to Simulate Crop Response
to Climate Change and the Direct Effects of CO2. AgriculturalForest Meteorology 59(1-2):17-34.
Eckhardt, K. and U. Ulbrich, 2003. Potential Impacts of ClimateChange on Groundwater Recharge and Streamflow in a CentralEuropean Low Mountain Range. Journal of Hydrology 284(1-4):244-252.
Emori, S., T. Nozawa, A. Abe-Ouchi, A. Numaguti, M. Kimoto, andT. Nakajima, 1999. Coupled Ocean-Atmosphere Model Experi-ments of Future Climate Change With an Explicit Representa-tion of Sulfate Aerosol Scattering. Journal of the MeteorologicalSociety of Japan 77:1299-1307.
Field, C.B., R.B. Jackson, and H.A. Mooney, 1995. StomatalResponses to Increased CO2: Implications From the Plant to theGlobal Scale. Plant Cell Environment 18:1214-1225.
Flato, G.M., G.J. Boer, W.G. Lee, N.A. McFarlane, D. Ramsden, M.C.Reader, and A.J. Weaver, 2000. The Canadian Centre for Cli-mate Modeling and Analysis Global Coupled Model and Its Cli-mate. Climate Dynamics 16:451-467.
Fontaine, T.A., J.F. Klassen, T.S. Cruickshank, and R.H. Hotchkiss,2001. Hydrological Response to Climate Change in the BlackHills of South Dakota, USA. Hydrological Sciences-Journal46(1):27-40.
Frederick, K.D., 1993. Climate Change Impacts on Water Resourcesand Possible Responses in the MINK Region. Climatic Change24:83-115.
Gassman, P.W., M. Jha, S. Secchi, and J.G. Arnold, 2003. InitialCalibration and Validation of the SWAT Model for the UpperMississippi River Basin. In: Diffuse Pollution and Basin Man-agement, M. Bruen (Editor). Centre for Water ResourcesResearch, Civil Engineering Dept., Univ. College, Dublin,Ireland. pp. 10-35 to 10-40.
Giorgi, F., M.R. Marinucci, and G.T. Bates, 1993. Development of aSecond Generation Regional Climate Model (RegCM2): Bound-ary Layer and Radiative Transfer Processes. Monthly WeatherReview 121(10):2794-2813.
Giorgi, F., L.O. Mearns, C. Shields, and L. McDaniel, 1998. Region-al Nested Model Simulations of Present Day and 2xCO2 ClimateOver the Central Plains of the U.S. Climatic Change 40(3-4):457-493.
Gleick, P.H. and E.L. Chaleki, 1999. The Impacts of ClimateChanges for Water Resources of the Colorado and Sacramento-San Joaquin River Basins. Journal of the American WaterResources Association (JAWRA) 35(6):1429-1441.
Goolsby, D.A., W.A. Battaglin, B.T. Aulenbach, and R.P. Hooper,2001. Nitrogen Input to the Gulf of Mexico. Journal of Environ-mental Quality 30:329-336.
Gordon, H.B. and S.P. O’Farrell, 1997. Transient Climate Change inthe CSIRO Coupled Model With Dynamic Sea Ice. MonthlyWeather Review 125:875-907.
Hadley Centre, 2003. Climate Change Observations and Predic-tions: Recent Research on Climate Change Science From theHadley Centre. Hadley Centre, Met Office, Department forEnvironment, Food and Rural Affairs. Exeter, United Kingdom.Available at http://www.metoffice.gov.uk/research/hadleycen-tre/pubs/brochures/. Accessed in December 2003.
Hamlet, A.F. and D.P. Lettenmaier, 1999. Effects of Climate Changeon Hydrology and Water Resources Objectives in the ColumbiaRiver Basin. Water Resources Bulletin 35(6):1597-1623.
Hendry, G.R., K.F. Lewin, and K.F., Nagy, 1993. Free Air CarbonDioxide Enrichment: Development, Progress, Results. Vegetatio104/105:17-31.
Houghton, J.T., Y. Ding, D.J. Griggs, M. Noguer, P.J. van der Lin-den, X. Dai, K. Maskell, and C.A. Johnson (Editors), 2001. Cli-mate Change 2001: The Scientific Basis. Contribution ofWorking Group I to the Third Assessment Report of the Inter-governmental Panel on Climate Change. Intergovernmental
JOURNAL OF THE AMERICAN WATER RESOURCES ASSOCIATION 1013 JAWRA
CLIMATE CHANGE SENSITIVITY ASSESSMENT ON UPPER MISSISSIPPI RIVER BASIN STREAMFLOWS USING SWAT
Panel on Climate Change. Cambridge University Press, Cam-bridge, United Kingdom.
Hubbard, C.M., 1998. Hydrologic Modeling of the Missouri River ina Climate Change Model. MS Thesis, University of Nebraska-Lincoln, Lincoln, Nebraska.
IPCC (Intergovernmental Panel on Climate Change), 2005. TheIPCC Data Distribution Centre. Intergovernmental Panel onClimate Change, Climatic Research Unit, University of EastAnglia, United Kingdom. Available at http://ipcc-ddc.cru.uea.ac.uk/. Accessed in April 2005.
Jarvis, P.G. and K.G. McNaughton, 1991. Stomatal Control of Tran-spiration – Scaling Up From Leaf to Region. Advanced Ecologi-cal Research 15:1-49.
Jha, M., P.W. Gassman, S. Secchi, R. Gu, and J.G. Arnold, 2003.Hydrological Simulations of the Maquoketa River Watershed.In: Agricultural Hydrology and Water Quality, J.D. Williams andD.W. Kolpin (Editors). American Water Resources Association,Middleburg, Virginia, CD-ROM.
Jha, M., Z. Pan, E.S. Takle, and R. Gu, 2004. Impacts of ClimateChange on Streamflow in the Upper Mississippi River Basin: A Regional Climate Model Perspective. Journal of GeophysicalResearch 109(D9):D09105, doi:10.1029/2003JD003686.
Johns, T.C., R.E. Carnell, J.F. Crossley, J.M. Gregory, J.F.B.Mitchell, C.A. Senior, S.F.B. Tett, and R.A. Wood, 1997. The Sec-ond Hadley Centre Coupled Ocean-Atmosphere GCM: ModeDescription, Spinup and Validation. Climate Dynamics 13:103-134.
Johns, T.C., J.M. Gregory, W.J. Ingram, C.E. Johnson, A. Jones,J.F.B. Mitchell, D.L. Roberts, D.M.H. Sexton, D.S. Stevenson,S.F.B. Tett, and M.J. Woodage, 2001. Anthropogenic ClimateChange for 1860 to 2100 Simulated With the HadCM3 ModelUnder Updated Emission Scenarios. Hadley Centre TechnicalNote No. 22, Met Office, Hadley Centre for Climate Predictionand Research, Bracknell, United Kingdom. Available at http://www.metoffice.com/research/hadleycentre/pubs/HCTN/HCTN_22.pdf. Accessed in April 2005.
Karl, T.R. and R.W. Knight, 1998. Secular Trends of PrecipitationAmount, Frequency, and Intensity in the United States. Bulletinof the American Meteorological Society 79(2):231-241.
Kimball, B.A., R.L. LaMorte, P.J. Pinter, G.W. Wall, D.J. Hunsaker,E.J. Adamsen, S.W. Leavitt, T.L. Thompson, A.D. Matthius, andT.J. Brooks, 1999. Free-Air CO2 Enrichment and Soil NitrogenEffects on Energy Balance and Evapotranspiration of Wheat.Water Resources Research 35:1179-1190.
Knox, J.C., 2000. Sensitivity of Modern and Holocene Floods to Cli-mate Change. Quaternary Science Reviews 19:439-457.
Knox, J.C., 2002. Sensitivity of Large Upper Mississippi RiverFloods to Climate Change. Available at http://gsa.confex.com/gsa/2002AM/finalprogram/abstract_46957.htm. Accessed inJune 2005.
Leavesley, G.H., 1994. Modeling the Effects of Climate Change onWater Resources: A Review. Climatic Change 28:159-177.
Lettenmaier, D.P., A.W. Wood, R.N. Palmer, E.F. Wood, and E.Z.Stakhiv, 1999. Water Resources Implications of Global Warming:A U.S. Regional Perspective. Climatic Change 43:537-579.
Lins, H.F. and J.R. Slack, 1999. Streamflow Trends in the UnitedStates. Geophysical Research Letters 26(2):227-230.
McCabe, G.J. and D.M. Wolock, 1999. General-Circulation-ModelSimulations of Future Snowpack in the Western United States.Journal of the American Water Resources Association (JAWRA)35(6):1473-1484.
McCabe, G.J. and D.M. Wolock, 2002. A Step Increase in Stream-flow in the Conterminous United States. Geophysical ResearchLetters 29(24):38-1 to 38-4.
Medlyn, B.E., C.V.M. Barton, M.S.J. Broadmeadow, R. Ceulemans,P. De Angelis, M. Forstreuter, M. Freeman, S.B. Jackson, S. Kel-lomaki, E. Laitat, A. Rey, P. Roberntz, B.D. Sigurdsson, J. Strassemeyer, K. Wang, P.S. Curtis, and P.G. Jarvis, 2001.Stomatal Conductance of Forest Species After Long-Term Expo-sure to Elevated CO2 Concentrations: A Synthesis. New Phytol-ogist 149:247-264.
Miles, E.L., A.K. Snover, A.F. Hamlet, B. Callahan, and D. Fluharty,2000. Pacific Northwest Regional Assessment: The Impacts ofClimate Variability and Climate Change on the Water Resourcesof the Columbia River Basin. Journal of the American WaterResources Association (JAWRA) 36(2):399-420.
Morison, J.I.L., 1987. Intercellular CO2 Concentration and Stom-atal Response to CO2. In: Stomatal Function, E. Zeiger, I.R.Cowan, and G.D. Farquhar (Editors). Stanford University Press,Stanford, California, pp. 229-251.
Morison, J.I.L. and R.M. Gifford, 1983. Stomatal Sensitivity to Car-bon Dioxide and Humidity. Plant Physiology 71:789-796.
Mote, P.W., E.A. Parson, A.F. Hamlet, W.S. Keeton, D. Lettenmaier,N. Mantua, E.L. Miles, D.W. Peterson, D.L. Peterson, R. Slaugh-ter, and A.K. Snover, 2003. Preparing for Climatic Change: TheWater, Salmon, and Forests of the Pacific Northwest. ClimaticChange 61(1):45-88.
Nash, L. and P.H. Gleick, 1991. Sensitivity of Streamflow in theColorado Basin to Climate Change. Journal of Hydrology125:221-241.
Neitsch, S.L., J.G. Arnold, J.R. Kiniry, J.R. Williams, and K.W.King, 2002a. Soil and Water Assessment Tool Theoretical Docu-mentation, Version 2000. Blackland Research Center, TexasAgricultural Experiment Station, Temple, Texas. Available athttp://www.brc.tamus.edu/swat/downloads/doc/swat2000theory.pdf. Accessed in June 2005.
NSF (National Science Foundation), 2001. Climate Change Impactson the United States: The Potential Consequences of ClimateVariability and Change. Foundation: A Report of the NationalAssessment Synthesis Team, U.S. Global Change Research Pro-gram. National Science Foundation. Cambridge UniversityPress, Cambridge, United Kingdom. Available at http://www.usgcrp.gov/usgcrp/Library/nationalassessment/00Intro.pdf.Accessed in June 2005.
NWIS (National Water Information System), 2001. National WaterInformation System. U.S. Geological Survey, Reston, Virginia.Available at http://nwis.water.usgs.gov/nwis. Accessed on Jan-uary 15, 2004.
Neitsch, S.L., J.G. Arnold, J.R. Kiniry, R. Srinivasan, and J.R.Williams, 2002b. Soil and Water Assessment Tool User’s Manu-al, Version 2000. Blackland Research Center, Texas AgriculturalExperiment Station, Temple, Texas. Available athttp://www.brc.tamus.edu/swat/downloads/doc/swatuserman.pdf.Accessed in June 2005.
Nusser, S.M. and J.J. Goebel, 1997. The National Resources Inven-tory: A Long-Term Multi-Resource Monitoring Programme.Environmental and Ecological Statistics 4:181-204.
Pan, Z., J.H. Christensen, R.W. Arritt, W.J. Gutowski, Jr., E.S.Takle, and F. Otieno, 2001. Evaluation of Uncertainties inRegional Climate Change Simulations. Journal of GeophysicalResearch 106(D16):17,737-17,751.
Payne, J.T., A.W. Wood, A.F. Hamlet, R.N. Palmer, and D.P. Letten-maier, 2004. Mitigating the Effects of Climate Change on theWater Resources of the Columbia River Basin. Climatic Change62(1-3):233-256.
Polley, H.W., 2002. Implications of Atmospheric and ClimaticChange for Crop Yield and Water Use Efficiency. Crop Science42:131-140.
Pritchard, S.G., H.H. Rogers, S.A. Prior, and C.M. Peterson, 1999.Elevated CO2 and Plant Structure: A Review. Global ChangeBiology 5:807-837.
JAWRA 1014 JOURNAL OF THE AMERICAN WATER RESOURCES ASSOCIATION
JHA, ARNOLD, GASSMAN, GIORGI, AND GU
Rabalais, N.N., R.E. Turner, and D. Scavia, 2002. Beyond ScienceInto Policy: Gulf of Mexico Hypoxia and the Mississippi River.BioScience 52(2):129-142.
Revelle, R.R. and P.E. Waggoner, 1983. Effects of a Carbon-Dioxide-Induced Climatic Change on Water Supplies in the WesternUnited States. In: Changing Climate. National Academy of Sci-ences, National Academy Press, Washington, D.C., pp. 419-432.
Rosenberg, N.J., R.A. Brown, R.C. Izaurralde, and A.M. Thomson,2003. Integrated Assessment of Hadley Centre (HadCM2) Cli-mate Change Projections on Agricultural Productivity and Irri-gation Water Supply in the Conterminous United States I.Climate Change Scenarios and Impacts on Irrigation WaterSupply Simulated With the HUMUS Model. Agricultural andForest Meteorology 117(1-2):73-96.
Rosenberg, N.J., D.J. Epstein, D. Wang, L. Vail, R. Srinivasan, andJ.G. Arnold, 1999. Possible Impacts of Global Warming on theHydrology of the Ogallala Aquifer Region. Climatic Change42:677-692.
Rosenthal, W.D., R. Srinivasan, and J.G. Arnold, 1995. AlternativeRiver Management Using a Linked GIS-Hydrology Model.Transactions of the ASAE 38(3):783-790.
Saleh, A., J.G. Arnold, P.W. Gassman, L.M. Hauck, W.D. Rosenthal,J.R. Williams, and A.M.S. McFarland, 2000. Application ofSWAT for the Upper North Bosque River Watershed. Transac-tions of the ASAE 43(5):1077-1087.
Santhi, C., J.G. Arnold, J.R. Williams, W.A. Dugas, R. Srinivasan,and L.M. Hauck, 2001. Validation of the SWAT Model on aLarge River Basin With Point and Nonpoint Sources. Journal ofthe American Water Resources Association (JAWRA) 37(5):1169-1188.
Saxe, H., D.S. Ellsworth, and J. Heath, 1998. Trees and ForestFunctioning in an Enriched CO2 Atmosphere. New Phytologist139:395-436.
Seaber, P.R., F.P. Kapinos, and G.L. Knapp, 1987. Hydrologic UnitsMaps. U.S. Geological Survey Water-Supply Paper 2294. Reston,Virginia.
Srinivasan, R., T.S. Ramanarayanan, J.G. Arnold, and S.T. Bednarz,1998. Large Area Hydrologic Modeling and Assessment Part II:Model Application. Journal of the American Water ResourcesAssociation (JAWRA) 34(1):73-89.
Stockle, C.O., J.R. Williams, N.J. Rosenberg, and C.A. Jones, 1992.A Method for Estimating the Direct and Climatic Effects of Ris-ing Atmospheric Carbon Dioxide on Growth and Yield of Crops:Part I – Modification of the EPIC Model for Climate ChangeAnalysis. Agriculture Systems 38:225-238.
Stone, M.C., R.H. Hotchkiss, C.M. Hubbard, T.A. Fontaine, L.O.Mearns, and J.G. Arnold, 2001. Impacts of Climate Change onMissouri River Basin Water Yield. Journal of the AmericanWater Resources Association (JAWRA) 37(5):1119-1130.
Stone, M.C., R.H. Hotchkiss, and L.O. Mearns, 2003. Water YieldResponses to High and Low Spatial Resolution Climate ChangeScenarios in the Missouri River Basin. Geophysical ResearchLetters 30(4):35-1-35-4.
Stonefelt, M.D., T.A. Fontaine, and R.H. Hotchkiss, 2000. Impactsof Climate Change on Water Yield in the Upper Wind RiverBasin. Journal of the American Water Resources Association(JAWRA) 36(2):321-336.
Thomson, A.M., R.A. Brown, N.J. Rosenberg, R.C. Izaurralde, D.M.Legler, and R. Srinivasan, 2003. Simulated Impacts of ElNiño/Southern Oscillation on United States Water Resources.Journal of the American Water Resources Association (JAWRA)39(1):137-148.
Tyree, M.T. and J.D. Alexander, 1993. Plant Water Relations andthe Effects of Elevated CO2: A Review and Suggestions forFuture Research. Vegetatio 104/105:47-62.
USDA (U.S. Department of Agriculture, 1994. State Soil Geograph-ic (STATSGO) Data Base: Data Use Information. MiscellaneousPublication Number 1492, U.S. Department of Agriculture, Nat-ural Resource Conservation Service, National Soil Survey Cen-ter, Lincoln, Nebraska.
USEPA (U.S. Environmental Protection Agency), 2001. BASINS3.0: Better Assessment Science Integrating Point and NonpointSources. U.S. Environmental Protection Agency, Office of Water,Office of Science and Technology, Washington, D.C. Available athttp://www.epa.gov/ost/BASINS/. Accessed in June 2005.
USGS (U.S. Geological Survey), 1999. Evidence of Climate ChangeOver the Last 10,000 Years From the Sediments of Lakes in theUpper Mississippi Basin. U.S. Geological Survey Fact Sheet FS-059-99. Available at http://pubs.usgs.gov/fs/fs-0059-99/.Accessed in June 2005.
van Katwijk, V.F., A. Rango, and A.E. Childress, 1993. Effect ofSimulated Climate Change on Snowmelt Runoff Modeling inSelected Basins. Water Resources Bulletin 29(5):755-766.
Wand, S.J.E., G.F. Midgley, M.H. Jones, and P.S. Curtis, 1999.Responses of Wild C4 and C3 Grass (Poaceae) Species to Elevat-ed Atmospheric CO2 Concentrations: A Meta-Analytic Test ofCurrent Theories and Perceptions. Global Change Biology 5:723-741.
Watterson, I.G., M.R. Dix, H.B. Gordon, and J.L. McGregor, 1995.The CSIRO Nine-Level Atmospheric General Circulation Modeland Its Equilibrium Present and Doubled CO2 Climates. Aus-tralian Meteorology Magazine 44:111-125.
Wilby, R.L., L.E. Hay, and G.H. Leavesley, 1999. A Comparison ofDownscaled and Raw GCM Output: Implications for ClimateChange Scenarios in the San Juan River Basin, Colorado. Jour-nal of Hydrology 225:67-91.
Wolock, D.M. and G.J. McCabe, 1999. Estimates of Runoff UsingWater-Balance and Atmospheric General Circulation Models.Journal of the American Water Resources Association (JAWRA)35(6):1341-1350.
Wullschleger, S.D., C.A. Gunderson, P.J. Hanson, K.B. Wilson, andR.J. Norby, 2002a. Sensitivity of Stomatal and Canopy Conduc-tance to Elevated CO2 Concentration – Interacting Variablesand Perspectives of Scale. New Phytologist 153:485-496.
Wullschleger, S.D., T.J. Tschaplinski, and R.J. Norby, 2002b. PlantWater Relations at Elevated CO2 – Implications for Water-Lim-ited Environments. Plant, Cell and Environment 25:319-331.
JOURNAL OF THE AMERICAN WATER RESOURCES ASSOCIATION 1015 JAWRA
CLIMATE CHANGE SENSITIVITY ASSESSMENT ON UPPER MISSISSIPPI RIVER BASIN STREAMFLOWS USING SWAT