climate change resilience report - oil search · “ratchet up” their paris climate change...
TRANSCRIPT

A
C L I M A T E C H A N G E R E S I L I E N C E R E P O R T
2 0 1 7


C l i m a t e C h a n g e R e s i l i e n c e R e p o r t 2 0 1 7
01 Introduction
03 Message from Chairman Rick Lee and Managing Director Peter Botten
04 Our Climate Position
06 How Our Corporate Strategy Considers Climate
08 Operationalising Our Strategy
11 Climate Governance
12 Climate Metrics, Targets and Indicators
15 Climate Risk Management
20 Climate Scenario Analysis
22 Overview of Scenario Analysis Outcomes
24 Scenario Insights
26 Summary of Possible Portfolio Impacts
28 IEA New Policies Scenario
30 IEA 450 Scenario (2°C)
32 Greenpeace Advance Energy [R]evolution Scenario (1.5°C)
34 Basis of Preparation
36 TCFD Reference Guide
I N T R O D U C T I O N
Oil Search has made a policy commitment to disclose and report transparently in alignment with the 2017 Financial Stability
Board’s TCFD recommendations.
We have tested our portfolio against International Energy Agency (IEA) New Policies and IEA 450 (2°C) scenarios, and the Greenpeace Advanced Energy [R]evolution (~1.5°C) scenario.
Our climate scenario analysis indicates long-term resilience and continued economic value generation for Oil Search in a range of decarbonisation
scenarios, including a 2°C pathway.
Our LNG Expansion Project1 in PNG is likely to be among the most cost-competitive of new projects required to meet growing LNG
demand, making it one of the most resilient LNG projects in a carbon-constrained 2°C world.
C O N T E N T S
C l i m a t e C h a n g e R e s i l i e n c e R e p o r t 2 0 1 7
Forward Looking Statements The information contained in this report is based on assumptions and contingencies which are subject to change without notice and involve known and unknown risks, uncertainties and other factors which are beyond the control of Oil Search Limited. Oil Search Limited assumes no obligation to update this information, which is provided as a general guide only and should not be relied upon as an indication or guarantee of future performance. While every effort is made to provide accurate and complete information, Oil Search Limited does not warrant that the information in this report is free from errors or omissions or is suitable for its intended use. Subject to any terms implied by law which cannot be excluded, Oil Search Limited accepts no responsibility for any loss, damage, cost or expense (whether direct or indirect) incurred by you as a result of any error, omission or misrepresentation in information in this report. All information in this report is subject to change without notice. This report also contains forward-looking statements including with respect to climate change scenario analysis, carbon pricing, demand for oil and gas and the possible effect and impact of climate change on the value of Oil Search’s portfolio and Oil Search’s plans, strategies and objectives all of which are subject to particular risks associated with the oil and gas industry. Oil Search Limited believes there are reasonable grounds for the expectations on which the statements are based. However, actual outcomes could differ materially due to a range of factors including oil and gas prices, demand for oil, currency fluctuations, drilling results, field performance, the timing of well work-overs and field development, reserves depletion, progress on gas commercialisation and fiscal and other government issues and approvals. In respect of the forward-looking statements in relation to scenario analysis, while the use of scenarios may assist in the understanding and description of possible future events or circumstances, scenarios may have their own inherent disadvantages, limitations or deficiencies. Oil Search is not able to predict which if any of the scenarios referred to in this report may eventuate and does not regard any particular scenario as a preferred outcome for Oil Search.
1. Oil Search’s LNG Expansion Project is a proposed 8 MTPA expansion at the PNG LNG Project site that includes Papua LNG (Elk-Antelope), P’nyang and foundation field gas.


M E S S A G E F R O M O I L S E A R C H ’ S
Climate change is a significant global issue that poses a challenge to meeting growing energy demands while ensuring supply is both sustainable and affordable.
No single sector or technology can tackle this complex issue alone. It requires a coordinated approach by governments, companies and communities. At Oil Search,
we believe a variety of energy sources have a role to play in meeting the global demand for sustainable energy, each with its own positives and challenges.
We have considered the recommendations of the 2017 Financial Stability Board’s Task Force on Climate-related Financial Disclosures (TCFD) when preparing this Climate Change Resilience Report and aligned Oil Search’s other public disclosures with those recommendations.
We are pleased to be one of the first companies to voluntarily release this information in response to stakeholder feedback.
This Report explains how we have positioned Oil Search for a low-carbon world and demonstrates the resilience of our current and growth portfolio. It clearly explains how we manage our climate risks, conduct climate scenario stress tests and the targets and metrics we use to monitor performance.
Our analysis indicates that our assets should remain economic under most climate scenarios, are resilient to a 2°C2 pathway and will continue to provide positive shareholder returns. The scenarios tested conclude that our Liquefied Natural Gas (LNG)
projects should remain robust under all scenarios except the most extreme, and that the medium-term development optionality inherent in our new oil asset in Alaska provides us with the ability to adapt as required.
We expect our climate risks and the scenarios we assess will continue to evolve as countries legislate for, and “ratchet up” their Paris climate change commitments. There will be renewable energy and technology advances, and a greater understanding of the potential physical implications of climate change. We will use a range of lead indicators (or “signposts”) to monitor this changing landscape and identify early signals of likely pathways.
Our Annual Reports and Social Responsibility Reports will provide updates to these climate risks and how Oil Search is managing them and we will periodically update this report.
Over the past twelve months, as well as conducting detailed climate scenario analysis, we have adopted a stand-alone Climate Policy, introduced an internal carbon price, included
climate as a component of our Short Term Incentive scheme, made climate related risks more explicit in our governance documents, and increased our in-house climate resourcing.
Whether you are an investor or another stakeholder, this Report should increase your confidence that our portfolio is resilient, we are managing our climate risks responsibly, and have a robust strategy in place to enhance the resilience of our portfolio under different climate outcomes.
Rick Lee CHAIRMAN
Peter Botten MANAGING DIRECTOR
March 2018
Message From
Chairm
an & M
anaging Director
2. Long-term goal of holding global average warming this century to well below 2 degrees Celsius above pre-industry levels. Enshrined in the Paris Agreement by the United Nations Framework Convention on Climate Change.
C H A I R M A N & M A N A G I N G D I R E C T O R
3

O U R C L I M A T E C H A N G E P O S I T I O N
The consensus of multiple scenarios is that oil and gas will continue to have a major role to play, and that natural gas will be pivotal in the transition to a low-emission energy system. At Oil Search, we support this position and believe a variety of energy sources have a role to play in meeting the global demand for sustainable energy; each with its own benefits and challenges.
We also support global efforts to move towards implementing an effective global climate agreement, and advocate for governments to establish a clear, stable policy framework that supports a global warming trajectory of 2°C. This will help the energy industry to make informed decisions and effective and meaningful contributions to addressing climate change. Market mechanisms such as an emissions trading scheme or other carbon pricing arrangements are an efficient response, and we support these and other measures that improve certainty.
To meet growing energy demands while ensuring supply is sustainable and affordable, there must be investment now in gas, renewables and technologies that reduce greenhouse gases (GHGs), such as carbon capture and storage (CCS). This will greatly contribute to reducing the cost and impact of climate change for future generations.
In late 2017, the Oil Search Board approved a new stand-alone Climate Change Policy, making our position and commitments around climate change explicit.
We are committed to understanding and managing the regulatory, reputational and market risks of climate change to our business. This includes maintaining open lines of communication on the topic with a broad range of stakeholders, including governments, investors and non-governmental organisations, as well as transparently reporting our emissions and energy consumption performance, and disclosing material climate risks. We participate in the Carbon Disclosure Project (CDP) and have submitted a response to CDP Climate Change since 2010. Our latest responses are available on the Oil Search website.
The Financial Stability Board’s TFCD released its final recommendations in June 2017. Our Report represents the first initiative to align our reporting and disclosures with the recommendations and we have provided a TCFD reference guide at the back of this Report. As we consult with our key stakeholders we will continue to evolve our disclosures.
ENGAGING ON CLIMATE POLICY
As one of the largest companies in Papua New Guinea (PNG) and a socially responsible operator, we seek to engage with governments, industry groups, landowners, and other people with the ability to shape policies that impact our business and stakeholders. We do this with integrity and in an accurate, factual, transparent and meaningful way.
We actively engage with regulatory and other government agencies, including the PNG Climate Change Development Authority (CCDA), on proposed and existing legislation and commitments related to climate change. We belong to the CCDA industry stakeholder group.
We disclose any climate policy submissions annually in our Social Responsibility Report.
We are members of several associations and networks and we monitor and engage with these groups to ensure their submissions and research in this area consider Oil Search’s position on climate change.
We belong to the global oil and gas industry association for environmental and social issues, IPIECA, and the Australian Petroleum Production and Exploration Association (APPEA). These forums provide useful information and industry thought leadership and the opportunity to contribute knowledge and best practice.
For a full list of Oil Search’s trade association memberships and further information about our principles for engaging with government on public policy, see the public policy engagement section of the Oil Search website.
Providing access to affordable and sustainable energy is a goal for every government around the world. It is essential for the social and economic health of citizens,
communities and countries. The impact of climate change presents a major challenge to this goal, and no one organisation or sector can provide the solution.
4
C l i m a t e C h a n g e R e s i l i e n c e R e p o r t 2 0 1 7

Our C
limate C
hange Position
CORE ELEMENTS OF TCFD RECOMMENDED CLIMATE‑RELATED FINANCIAL DISCLOSURES
Governance
The organisation’s governance around climate-related risks and opportunities.
Strategy
The actual and potential impacts of climate-related risks and opportunities on the organisation’s businesses, strategy, and financial planning.
Risk Management
The processes used by the organisation to identify, assess, and manage climate-related risks.
Metrics and Targets
The metrics and targets used to assess and manage relevant climate-related risks and opportunities.
OIL SEARCH ASSETS AND OPERATIONS
Oil Search was established in PNG in 1929. The Company operates all PNG’s producing oil fields, holds an extensive appraisal and exploration portfolio, and has a 29% interest in the PNG LNG Project, which is operated by ExxonMobil PNG Limited. This world-class LNG development came on-stream in 2014 and has transformed
Oil Search into a regionally-significant oil and gas producer, with a long-term, low-cost, high quality LNG revenue stream. The Company also holds a 23% interest in PRL 15, operated by Total SA, which contains the
world-class Elk-Antelope gas fields in the onshore Gulf Province.
Oil Search has a clear strategy to drive future growth in PNG. We are pursuing opportunities to develop additional LNG trains in PNG, underpinned by existing discovered gas resources in the NW Highlands,
including the P’nyang gas field in PRL 3, and the Elk-Antelope fields. We believe there is presently sufficient gas to support at least 8 Million tonnes per annum (MTPA) of additional LNG capacity, and potentially
more, contingent on additional appraisal drilling.
We are undertaking a range of exploration and appraisal activities to support further LNG expansion in PNG. Outside PNG, Oil Search has recently acquired interests in the Alaska North Slope, including the Nanushuk
undeveloped onshore oil field. We believe this is a tier one resource with significant exploration and appraisal upside. This acquisition, which marks Oil Search’s entry into Alaska, provides significant optionality
and diversifies our portfolio over the medium term. As the future Operator, we will have the opportunity to drive commercialisation and believe it will deliver attractive shareholder returns.
5
Our C
limate C
hange Position
Governance
Strategy
Risk Management
Metricsand Targets
Figure 1: Core Elements of TCFD disclosures (Source: www.fsb-tcfd.org/publications/final-recommendations-report)
C l i m a t e C h a n g e R e s i l i e n c e R e p o r t 2 0 1 7
H O W O U R C O R P O R AT E S T R AT E G Y C O N S I D E R S C L I M AT E
As an oil and gas company, we recognise it is impossible to decouple climate change from our Corporate Strategy: the two must be fully integrated.
Oil Search’s Corporate Strategy is focused on having a globally competitive energy portfolio that is sustainable over the long-term.
Our integrated planning process refreshes the Corporate Strategy periodically and produces updated Strategic Objectives approximately every three years. For the next strategic review the climate inputs will include:
� climate risks and opportunities
� climate scenario analysis
� Oil Search’s internal carbon price
� Oil Search’s climate commitments
� climate policies and regulations in the countries where we operate
� global climate policy trends (e.g. Paris commitments) and changing societal expectations.
CLIMATE PROGNOSIS SUPPORTS OUR STRATEGY
Reflecting on climate risks, global climate policy trends and the climate scenario analysis has reinforced Oil Search’s Corporate Strategy of focusing on a globally competitive energy portfolio that is sustainable over the long-term.
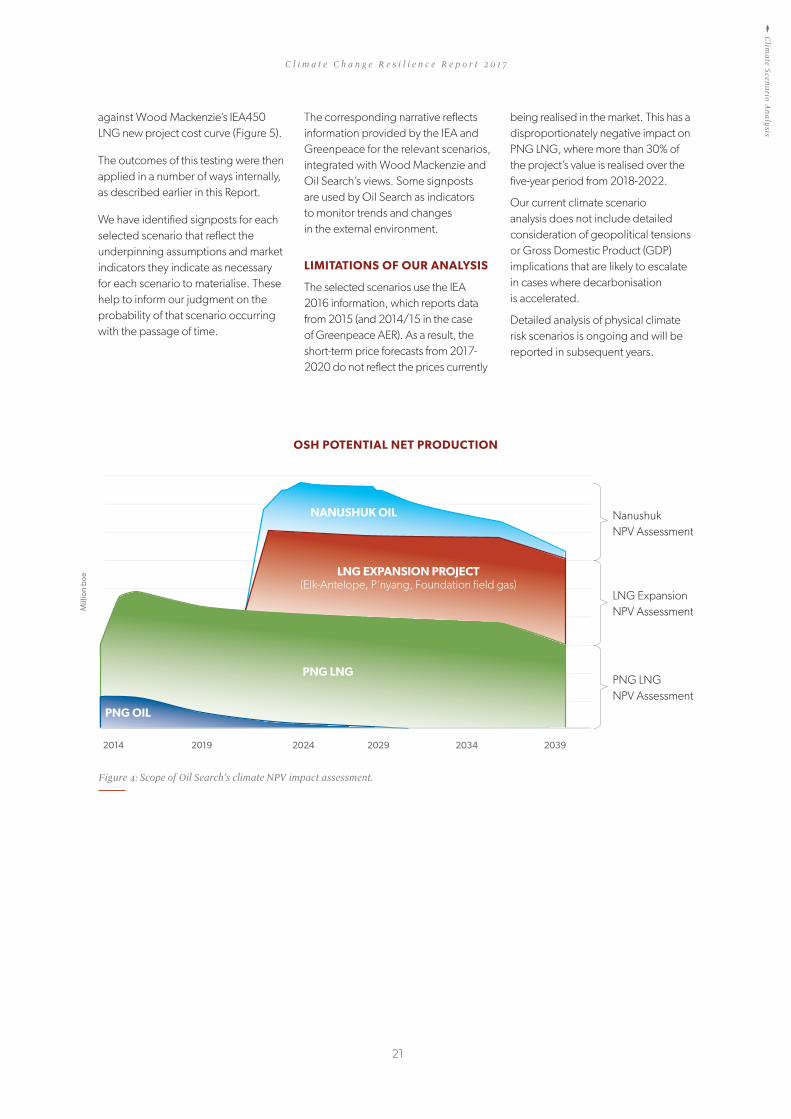
Oil Search’s net production potential (Figure 2) shows that our portfolio is currently gas-dominant, and despite the introduction of Nanushuk will continue to be so over the medium-long-term.
Our proposed significant investment in our LNG Expansion Project in PNG is consistent with our Corporate Strategy, and our climate commitments and analysis. We will support the Operator’s efforts on this project to minimise emissions, build resilience to climate change and contribute positively to PNG’s climate goals.
The acquisition and development of the Nanushuk oil field is also consistent with our corporate strategy and climate change assessment and commitments, and recognises the medium-term commercial opportunities for high quality, low-cost oil projects. This conventional onshore oil project is expected have a lower emission intensity than Oil Search’s existing oil and LNG assets.
As production volume from our PNG oil assets declines, we expect the Nanushuk oil asset to begin production; however, oil is likely to remain secondary to natural gas in our portfolio. As the Operator of Nanushuk, we will continue to seek opportunities to minimise emissions and reduce costs, and will investigate project efficiencies as we progress towards a Final Investment Decision (FID).
EMBEDDING CLIMATE CONSIDERATIONS
In 2016, we identified the actions required to ensure we were appropriately considering and managing our climate risks and developed a Climate Change Strategy to further embed climate considerations into our business practices.
The Climate Change Strategy is consistent with our Climate Policy and aligns with our Social Responsibility Policy and strategies. It helps to ensure the Company is prepared for future carbon constraints and that we understand the potential risks and impacts to our business.
We designed our Climate Change Strategy to operationalise our corporate climate commitments, to embed climate risk into our decision-making, strategy development and risk management practices.
Given rapidly changing stakeholder expectations and changes to technology and government policies, we expect our Climate Change Strategy to continue to evolve and to be regularly updated (Table 1).
6
C l i m a t e C h a n g e R e s i l i e n c e R e p o r t 2 0 1 7
HOW OUR CLIMATE CHANGE STRATEGY ALIGNS WITH CORPORATE OBJECTIVES
REDUCE RISK ENHANCE VALUE RESPONSIBLE OPERATOR
Internal carbon price for investments
and design decisions
Embed findings of climate change scenario analysis into
Corporate Strategy
Assisting PNG to meet its climate and
development objectives
Incorporate climate risk into strategy and
decision-making processes
Include climate performance Key Performance Indicators (KPI) as a component in management
Short Term Incentives (STI’s)
Reduce emission intensity of our portfolio
Conduct physical climate risk assessments
Investigate renewable power opportunities in PNG
Support host government efforts to establish policy
frameworks for 2°C
Table 1: Oil Search climate change strategy aligned with corporate objectives.
OSH POTENTIAL NET PRODUCTION
Figure 2: Oil Search net production potential in million BOE.
2014 2019 2024 2029 2034 2039
PNG OIL
PNG LNG
LNG EXPANSION PROJECT(Elk-Antelope, P’nyang, Foundation field gas)
NANUSHUK OIL
Mill
ion
boe
How
Our C
orporate Strategy Considers C
limate
7

O P E R A T I O N A L I S I N G O U R S T R A T E G Y
EMISSION INTENSITY
We recognise that as a responsible operator, Oil Search must continue to reduce the GHG intensity of our operations. Since 2009, we have reduced our operated emission intensity by 50%.
In 2018, we will undertake a fugitive methane emission assessment against the Climate and Clean Air Coalition (CCAC) guiding principles for reducing methane emissions3, and will report on our strategy to reduce these emissions in our Annual and Social Responsibility Reports in 2019. We will also evaluate potential participation in the World Bank’s ‘Zero Routine Flaring by 2030’4 initiative, which aims to eliminate the contribution to climate change from routine gas flaring.
Oil Search’s scale, age of directly operated assets and limited geographic scope mean that, compared to our peers, we have limited material opportunities to
improve energy efficiency, reduce GHG intensity or materially invest in researching and developing new technologies.
The Nanushuk Project will provide opportunities to improve our operated emission intensity by optimising the development concept to identify energy efficiencies and incorporate zero routine flaring. It is expected to have a much lower emission intensity compared to our current operated assets and as production commences, our Company-operated emission intensity should decrease.
We intend to continue to influence our Operator partners to adopt and integrate low-emission technologies into our non-operated assets, such as PNG LNG and the LNG Expansion Project, and to be a leader in adopting commercially feasible, proven technological developments.
CLIMATE CHANGE ADAPTATION IMPACTS
Ensuring operations, investments and project-impacted communities are resilient to the physical impacts of climate change is critical to business continuity and the long-term sustainability of the Company.
The effects of climate change will impact some of our existing physical and non-physical business risks and potentially expose us to new ones. See Table 2 for further detail on risk.
We consider climate risks when designing projects and in our life-of-asset planning. Our engineering risk management processes require potential impacts from climate variability on new facilities and infrastructure to be identified and assessed. The assessment outcomes must be incorporated into engineering design decisions, in accordance with our internal engineering procedures.
3. http://www.ccacoalition.org/en/resources/reducing-methane-emissions-across-natural-gas-value-chain-guiding-principles4. http://www.worldbank.org/en/programs/zero-routine-flaring-by-2030
Camp site at Barikewa gas field, a potential option for small scale LNG.

C l i m a t e C h a n g e R e s i l i e n c e R e p o r t 2 0 1 7
ASSISTING PNG TO MEET ITS CLIMATE AND DEVELOPMENT OBJECTIVES
PNG has one of the world’s lowest levels of access to power, with approximately 13% of the population connected to the electricity grid. Those who are connected pay very high prices and much of the electricity is generated from diesel.
The significant economic, health and educational benefits of ready access to electricity mean energy supply improvements are essential if PNG is to achieve its development goals. The PNG Government has set a goal of connecting 70% of the population to the power grid by 2030, using various power solutions.
PNG has also committed to transitioning to 100% renewable energy by 2030, if donor funding is available. Scalable renewable energy solutions will need to be rapidly introduced for PNG to meet this target. By implementing our Power Strategy, Oil Search will seek to assist the PNG Government to meet its development goals and its Nationally Determined Contribution (NDC) commitments under the Paris Agreement, by encouraging the adoption of gas as a transition fuel to displace diesel and high sulphur fuel, and improving the distribution network.
Our Power Strategy in PNG focuses on biomass renewable energy, gas-fired power and domestic LNG distribution for mining, power generation and transport.
PNG Biomass Renewable Energy
PNG Biomass is a renewable power project in the Markham Valley, Morobe Province of PNG that is wholly-owned by Oil Search and supported by a 25-year Power Purchase Agreement with PNG Power Limited (PPL). The project involves developing up to 16,000 hectares of Forestry Stewardship
Council certified tree plantations that will produce fuel for up to 30MW of renewable, biomass-fired, reliable baseload power for the Ramu grid from mid-2020 onwards.
Domestic LNG in PNG
NiuEnergy, a joint venture being established between Oil Search and Kumul Petroleum, is investigating the potential for developing a domestic LNG market in PNG. The market would fall into three broad categories.
� Mining: The biggest opportunity for domestic LNG is in the mining sector. High Sulphur Fuel Oil (HSFO – with a sulphur content of 3.5%) is used in power generation, predominantly for mineral processing and ancillary services. Displacing existing HSFO and future low sulphur fuels with LNG will result in zero SOx emissions, zero particulates and reduced NOx emissions. Like pipeline gas, LNG also has significantly lower CO2 emissions compared to liquid fuels and offers efficiency benefits in power generation, particularly with new generator installations.
� Coastal power: At power generation sites in Lae, Madang and numerous other coastal and island towns, LNG will largely displace diesel use. The volume of fuel is significantly smaller than fuel demand from mining, but is still important; LNG is scalable for growth, aiding PNG’s electrification plans and providing a hedge against future oil price rises.
� Shipping: The LNG growth in this market will take longer than mining, but is potentially more significant, as the shipping industry is moving towards using LNG/dual fuel systems on new builds. While Singapore is positioning itself as a regional
bunker port, Lae (PNG north-east coast) has potential leverage given its geographic location relative to major seagoing routes between Australia and northern Asia.
Meteorological data
PNG lacks meteorology and biodiversity data, hampering efforts to consistently and reliably measure the impacts of climate change. Oil Search has a strong database of information in project impact areas and will investigate opportunities to share it with the PNG Government and other stakeholders so we can support PNG’s efforts to adapt to climate change in the medium- and longer-term.
WORKING WITH PEERS TO BUILD A COLLECTIVE RESPONSE
Achieving the trajectory required to meet a 2°C global warming scenario will require a collective response. To contribute to progress, our approach to climate change is underpinned by engagement and involvement in national and industry initiatives. A key way to reduce our overall climate risk and impact is to work with our partners and advocate for climate-compatible approaches to the project design, development and operation of non-operated assets. An example of this is improving overall efficiency and reducing costs through project integration.
The key gas owners in PNG, including ExxonMobil, operator of the PNG LNG Project and the P’nyang gas field, and Total, operator of the Elk-Antelope fields, have reached broad alignment to locate future LNG capacity at the PNG LNG plant site which will result in material capital and operating cost savings.
Operationalising O
ur Stragegy
9


C L I M A T E G O V E R N A N C E
Oil Search’s Board oversees our climate risk management and its potential to influence and inform our Corporate Strategy and decision-making. In late 2017, the Board
endorsed a Climate Policy that expresses its expectations on how climate risks should be managed and disclosed within the business.
Health Safety and Sustainability (HSS) Committee: oversees the Company’s strategies, processes and performance relating to health, safety, security and social responsibility, including climate change. The Committee endorses our Climate Change Strategy and scrutinises the management of the risks and opportunities climate poses to our assets.
Executive Leadership Team (ELT): establishes the structures, reporting lines, and responsibilities to oversee the management of our key risks, including climate change. Oil Search’s business units are accountable for managing these risks.
ELT members are financially incentivised to manage longer-term risks that could impact on the value of the Company, including climate risk, through the at-risk component of executive remuneration. From 2018, a component of the STI scheme will be linked to the use of our internal carbon price.
Executives and managers also participate in a long-term incentive (LTI) plan, with payments linked to the relative shareholder returns generated by the Company compared to a global peer group of oil and gas companies and to the 50 largest companies listed on the Australian Securities Exchange. Failure to effectively address climate
risk would be expected to translate into relative underperformance in terms of creating long-term, sustainable shareholder value and impact on LTI benefits.
Managers: A General Manager level position is responsible for advising business units, the ELT and Board on climate risk strategy, issues, trends and management, and related matters that may impact broader strategy or decision-making.
Monthly HSS senior management meetings are the primary forum for keeping managers informed about climate risks, performance and initiatives.
Clim
ate Governance
PNG CLIMATE CONTEXT
PNG is a signatory to the Paris Agreement, and was the first country globally to formally submit its NDC to the UNFCCC under the Agreement. The country’s United Nations Paris Agreement (Implementation) Act 2016
supports action to address climate change issues and PNG’s commitments under the Paris Agreement. The PNG Government’s 40-year development strategy, PNG Vision 2050, focuses on shifting socio-economic growth away from the current emissions-intensive growth strategy towards sustainable, climate-compatible growth,
leveraging PNG’s competitive advantages, natural wealth and significant human capital.
While PNG has low absolute emissions and relatively low per capita emissions, the people of PNG are already experiencing the impacts of global climate change. Most of PNG’s population lives in rural areas and three
quarters of households depend on subsistence agriculture. Changes in climate such as rising sea levels, severe drought, frosts and changing rainfall patterns impact crop yield, reducing cash crops and access to food.
These physical impacts of climate change and their ramifications for project communities and our operations are being considered as part of Oil Search’s physical risk assessment.
Growth in PNG’s economy in recent decades has seen an increase in GHG emissions. While this growth is expected to continue as the country develops, the PNG Government is committed to climate change mitigations in the forestry
and electricity generation sectors with adequate and predictable support. PNG’s primary mitigation effort is to reduce emissions from land use change and forestry, seeking to reduce deforestation, promote forest conservation and sustainable management of forests. In recognition of growth in fuel use to support economic development,
the PNG Government also aims to transition to 100% renewable energy by 2030, subject to donor funding.
11

As a socially responsible oil and gas producer, reducing the intensity of our greenhouse gas emissions is an important element of our Climate Change Strategy.
In 2009, Oil Search set a target of reducing our emission intensity by 12% by 2016. Oil Search’s emissions in 2016 were 941 ktCO2-e and our emission intensity was 46 ktCO2 -e/mmboe. This represents a 50% reduction in emission intensity and a 33% reduction in overall emissions against a 2009 baseline. This achievement was predominantly due to ongoing flare reduction initiatives and, to a lesser extent, the gradual shift in our production mix from largely oil, to oil and gas.
The age of Oil Search’s current operated assets in PNG makes it impractical for us to continue making material inroads into energy efficiency or emission reductions. In addition, as a growth focussed company, future investment decisions associated with the LNG Expansion Project and the Nanushuk oil project will have a material impact on our emission profile.
We plan on assessing the remaining emission reduction opportunities of our PNG operated assets in 2018 before then evaluating options for, and if appropriate, setting a new emission intensity target as part of our next corporate strategic review. In addition to this intensity target, Oil Search is focused on continuing to reduce flaring-related emissions in existing assets and avoiding routine flaring in new oil field developments. For our new investment in Alaska and
non-operated projects in PNG, we will continue to monitor new technologies and, where appropriate, adopt and integrate low-emission technologies.
Our project planning and design procedures mandate that energy efficiency and emission reductions are considered at the outset and during the design phase of all new projects. They require that options for reducing greenhouse gas emissions from operating sites are periodically identified and reviewed, to demonstrate we have reduced emissions as much as practically possible in our asset design and operation.
INTERNAL INDICATORS
In 2018 we are introducing new internal metrics:
� Number of new energy efficiency and GHG reduction initiatives assessed and identified,
� Number of relevant capital expenditure decisions using the nominated internal carbon price,
� Number of project design decisions using the nominated internal carbon price.
Oil Search has publicly reported a range of climate metrics since 2010 and participated in CDP Climate Change since 2010.
Our performance against these metrics is reported annually in our Social Responsibility Report and our CDP submissions can be found on our website.
These metrics include:
� GHG emission intensity on an operated basis (kt CO2-e/mmboe),
� GHG by Scope 1 emissions (kt CO2-e),
� GHG by Scope 2 emissions (kt CO2-e),
� GHG by Scope 3 emissions (kt CO2-e).
Subject to the availability of timely information from our joint venture partners, from 2019 we plan to also report GHG emission intensity on an equity basis (kt CO2-e/mmboe).
EXTERNAL INDICATORS
To monitor Oil Search’s external business environment from a strategic and risk management perspective, Oil Search also monitors external climate indicators. We support government efforts to establish and implement a clear, stable policy framework towards a global warming trajectory of 2°C.
We are monitoring climate indicators, developed from our scenario analysis, to help inform us about the planet’s climate change trajectory.
Lag indicators tell us where the world is now, while lead indicators signal where we may be going. We also monitor step change indicators such as global CO2 levels and natural disaster losses. Significant movement in the step change indicators may indicate that government climate policy will shift more quickly than anticipated.
C L I M A T E M E T R I C S , T A R G E T S A N D I N D I C A T O R S
12
C l i m a t e C h a n g e R e s i l i e n c e R e p o r t 2 0 1 7
LAG INDICATORS
Annual CO2 emissions in Mt and growth / decline from previous year
Global oil demand and supply
Global gas demand and supply
Global LNG demand and supply
Global coal demand and supply
Annual global investment in renewable and non-renewable energy
Electric vehicle growth (number of new cars and percentage of global fleet)
LEAD INDICATORS
Battery prices per kilowatt-hour
Carbon pricing schemes (percentage of global economy and average price)
Carbon Capture and Storage (CCS) scope and price of abatement
Nuclear power plants under construction
OTHER INDICATORS TO MONITOR (RISK OF STEP CHANGE IN POLICY)
Global Atmospheric CO2 levels
Overall losses (in billions USD) of climate related natural disasters
Clim
ate Governance and R
isk Managem
entC
limate M
etrics, Targets and Indicators
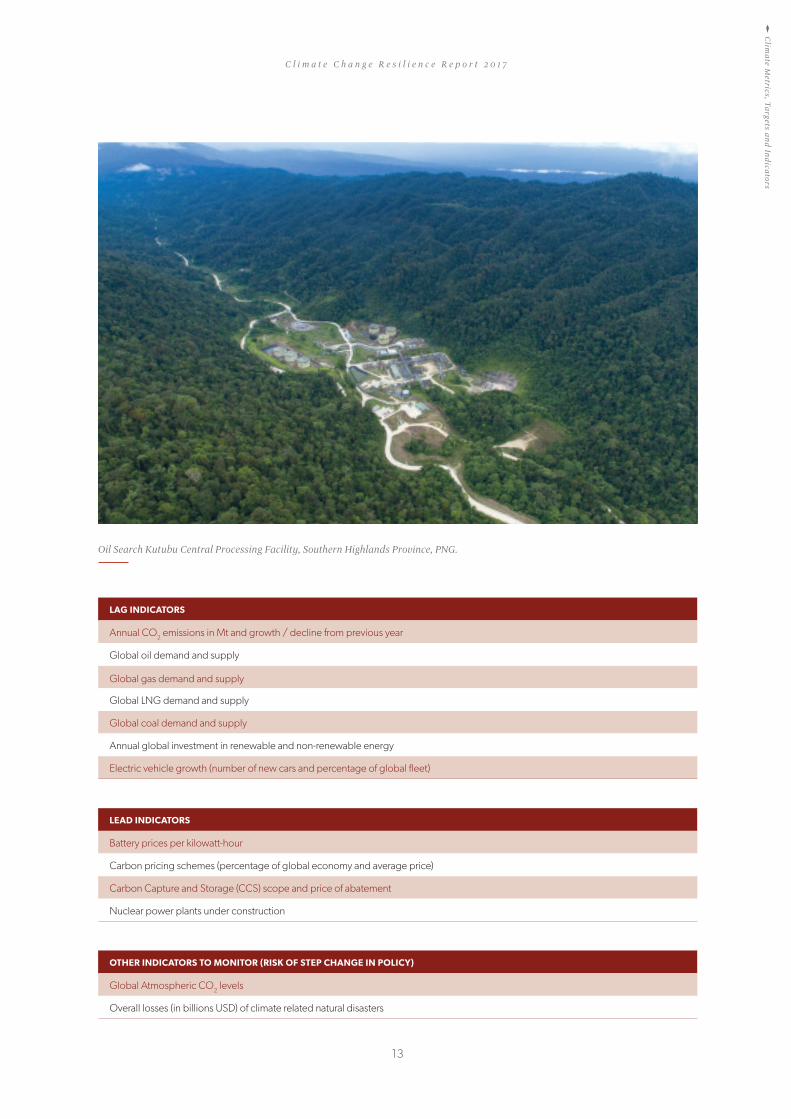
Oil Search Kutubu Central Processing Facility, Southern Highlands Province, PNG.
13


Oil Search’s corporate risk management process aims to ensure we have appropriate strategies for managing key risks to our objectives. Risk management procedures underpin our risk management governance and enable a consistent approach to how we oversee all organisational risks. Oil Search has adopted common requirements for the governance and reporting of risk, based on ISO 31000. We manage climate risks within this corporate risk management framework.
Climate risks are assessed at least quarterly as part of our corporate risk management process and reviewed annually during the broader strategic planning and decision-making process. We regularly monitor and assess transitional climate risks and broader societal trends and issues through our scenario analysis and strategy planning processes. Climate risks are also assessed during the Company’s regular Board-led strategic reviews.
As part of the quarterly climate risk review, we first assess any changes in our operating environment. These include regulatory changes in countries where we operate and the markets we sell to; new benchmark or reporting recommendations (e.g. TCFD); the direction of global climate negotiations; emerging stakeholder concerns; and technological advancements. Using the Oil Search Corporate Risk Assessment Matrix, we consider if the likelihood or impact of our climate risks have changed, or if there are new risks to evaluate. Finally, we review our controls to assess whether they are effectively managing the risks and if we need to implement additional controls.
MATERIAL CLIMATE RISKS
Our material corporate climate risks include:
� Transitional risk: Changes in demand for our products due to emission reduction policies or technological changes. Time horizon: long-term.
� Operating costs: Increase in operating costs of our long-life assets due to carbon pricing policies or other market mechanisms or regulations. Time horizon: medium- and long-term.
� Reputational risk: Reputational impacts, driven by stakeholder activism and increasing societal expectations that negatively impact our social licence to operate. Time horizon: short-, medium- and long-term.
� Physical risk: Physical impact of climate on our assets and on the communities where we operate. Time horizon: medium and long-term.
For the purposes of this report, Oil Search’s risk time horizons are:
� Short-term: 1 to 5 years.
� Medium-term: 5 to 15 years.
� Long-term: 15 to 20 years.
Clim
ate Risk M
anagement
ALASKA CLIMATE CONTEXT
Alaska’s proximity to the Arctic Circle and extensive coastline means the state has been experiencing the physical impacts of climate change first-hand for several years now. As global ocean temperatures rise,
Arctic sea ice is retreating, the permafrost is thawing, and average temperatures across the state are warming in winter and summer. The State of Alaska recognises the potential risks these physical changes pose
to the safety of its people, as well as the social and cultural traditions of the region.
As a member of the eight-nation intergovernmental Arctic Council, the USA signed a declaration in May 2017 reiterating the importance of global action to “reduce both greenhouse gases and short-lived
climate pollutants to mitigate climate change” and reaffirming the USA’s commitment to the sustainable development and protection of the Arctic environment.
While the US Administration signalled its intent to withdraw from the Paris Agreement in June 2017, the State of Alaska continues to implement initiatives to address climate change.
In October 2017, the Governor of Alaska announced the development of a Climate Change Strategy for the state to provide a framework for innovative solutions to a “rapidly changing climate” informed by
science, Indigenous and local knowledge, and consideration of Alaska’s economic interests. A Climate Action for Alaska Leadership team was also appointed to investigate ways to limits the effects of climate change.
The Strategy is due to be completed by September 2018.
C L I M A T E R I S K M A N A G E M E N T
15

C l i m a t e C h a n g e R e s i l i e n c e R e p o r t 2 0 1 7
RISK TYPE DESCRIPTION FINANCIAL IMPACTS TIME HORIZON OUR RESPONSE5
Non
-Phy
sica
l Ris
ks
Policy/Legal/Litigation
Legislation and regulation to address climate change and risks associated with policy-driven transitions (transition risks and liability risks).
Compliance costs; liabilities; restrictions on use of carbon-intensive assets; stranded assets
Medium and Long-term
Undertake climate scenario analysis to inform strategy. Retain focus on low cost assets.
Use an internal carbon price. Maintain engagement with host government climate authorities and policy-makers.
Embed internal procedures to reduce emissions/improve energy efficiency in all maintenance/upgrades and new assets, as well as ‘Life of Asset’ planning.
Technology Changes in supply, demand and competition; re-pricing of carbon-intensive assets.
Investment in new technology required; write-offs of existing technology.
Long-term Monitor emerging issues and technology developments.
Fast-follower adoption of feasible technological solutions.
Market/Economic
Changes in supply, demand and competition; re-pricing of carbon –intensive assets.
Asset impairment; viability of certain business models; Company or securities valuation.
Long-term Use of scenario analysis. Use an internal carbon price.
Advocate for market mechanism as the most efficient response.
Monitor global and local regulatory changes and trends.
Reputation Damage to reputation stemming from association with an asset or company.
Damage to brand value; lost revenue; additional expenditure.
Short / Medium / Long-term
Consider climate risks and opportunities during project design, development and operation of operated and non-operated assets. Further embed climate in decision-making. Corporate KPIs relating to the Climate Change Strategy. Establishing and reporting progress against targets.
Reputation Damage to reputation by targeted shareholder activism or divestment.
Damage to brand value; declining access to finance.
Short / Medium / Long-term
Adoption of TCFD recommendations for reporting & disclosure.
Proactive support for PNG country goals (including power solutions) and market mechanisms.
Clear public position statements on aspects of interest to stakeholders, including climate change resilience.
OIL SEARCH’S CLIMATE RISKS AND OPPORTUNITIES
C l i m a t e R i s k M a n a g e m e n t
5. These initiatives may be ongoing.
16

C l i m a t e C h a n g e R e s i l i e n c e R e p o r t 2 0 1 7
RISK TYPE DESCRIPTION FINANCIAL IMPACTS TIME HORIZON OUR RESPONSE5
Phy
sica
l Ris
ks
Acute Physical impact of more intense weather on investments.
Damage to physical assets; disruptions to operations, supply chains etc.
Medium / Long-term
Embed internal procedures to ensure potential climate impacts are considered in design and construction of new/upgraded assets.
Chronic Physical impact of more frequent catastrophic weather events.
Degradation of, or limitations on, resources.
Increased community needs/expectations following catastrophic events.
Medium / Long-term
Embed internal procedures to ensure potential climate impacts are considered in design and construction of new/ upgraded assets.
Support community emergency preparedness and response (if required).
Partner with host governments for adaptation initiatives.
Op
por
tuni
ties
Financial Commercial opportunities stemming from the transition to a lower-carbon economy.
Identification of new revenue streams; improved operating efficiency; enhanced market pricing and transparency; accelerated technological innovation.
Short / Medium / Long-term
Fast follower of viable new technologies.
Implement Power Strategy: contribute to helping PNG meet goals by increasing access to energy and through promoting both biomass and the use of gas as a transition fuel/fuel switch.
Reputation/ Financial
Alignment with PNG sustainable development and climate change goals for adaptation and mitigation.
Maintenance of stable operating environment.
Ability to leverage existing initiatives.
Short / Medium / Long-term
Integrate climate adaptation opportunities into sustainable development strategies.
Table 2: Oil Search’s climate risks and opportunities. This table has been adapted and customised from the Task Force on Climate-Related Financial Disclosures.
Clim
ate Risk M
anagement
17
C l i m a t e C h a n g e R e s i l i e n c e R e p o r t 2 0 1 7
CLIMATE RISK CONTROLS
We have identified three primary controls to help manage our climate risks: climate (transition) scenario analysis; an internal carbon price; and physical climate risk assessment.
Climate scenario analysis
Climate scenario analysis is a key organisational control for identifying and managing our climate transition risk. By using scenarios in business planning, we can test the resilience of assets under different climate transition outcomes (e.g different climate policies or technological changes) that may impact demand for our products.
We conduct climate scenario analysis on three contrasting potential outcomes, assessing the resilience of our current assets and growth assets under these different scenarios. The Oil Search Board and ELT have oversight of the results.
In 2017, we followed the TCFD recommendations when preparing our scenario analysis assessment .
Internal carbon price
To identify and control the potential costs of climate risks, Oil Search has adopted an internal carbon price.
The price is risk-based, country-specific and applied to the base case of project economics. For projects in PNG we apply a US$25 price and for projects in the USA we apply a US$40 price. When testing project economics sensitivities, we also use a low and high carbon price.
An internal carbon price embeds awareness and consideration of climate risks in decision-making by:
� Enabling Oil Search decision-makers to consider the future risk of carbon costs (direct or implicit prices) when making capital investment decisions.
� Ensuring carbon price risks are assessed and managed in the same way as any other financial risk.
� Enabling Oil Search’s project teams to optimise project design decisions and reduce our exposure to future carbon costs.
Physical climate risk assessment
To minimise the physical risk of climate change to Oil Search’s assets, we consider climate risks when developing projects and in our planning procedures. Any potential impacts from climate variability on new facilities and infrastructure are identified and assessed as part of the engineering risk process, with the outcomes incorporated into engineering design decisions.
For example, in 2017 we assessed potential climate impacts on the Oil Search-operated Kumul Marine Terminal in PNG to test its climate change resilience. To determine if wave conditions at the Kumul Marine Terminal would be impacted, the study used projections for elements of PNG’s future climate: annual mean temperatures, extreme high temperatures, average annual rainfall, extreme rain events, sea level rise and wind storm events.
To test the resilience of the assets under worst-case situations, the study examined high-emission scenarios, including the Intergovernmental Panel on Climate Change (IPCC) RCP8.5 path-way. This has a projected global temperature increase of 3.7°C.
Using IPCC RCP8.5, the climate risk analysis showed that wave conditions at Kumul Marine Terminal should not materially change. The outcomes of this analysis were included in the facility design process.
We plan to conduct a comprehensive physical climate risk assessment of our operated assets over the next two years where third party climate data is available. This review will consider the direct physical impacts of climate change on Oil Search’s assets and the indirect impacts, such as infectious diseases or heatwaves impacting our work force and communities.
Oil Search relies on third party organisations to research and publish data on climate impacts. As more detailed climate information is released, we will continue to refine and update our physical climate change risk assessments.
C l i m a t e R i s k M a n a g e m e n t C l i m a t e C h a n g e R e s i l i e n c e R e p o r t 2 0 1 7
18

C l i m a t e C h a n g e R e s i l i e n c e R e p o r t 2 0 1 7
Clim
ate Risk M
anagement
C l i m a t e C h a n g e R e s i l i e n c e R e p o r t 2 0 1 7

C L I M AT E S C E N A R I O A N A LYS I S
Scenario analysis is not forecasting. Scenarios are hypothetical constructs that examine different climate scenarios and help us to test the financial resilience of our assets against a range of possible outcomes. Analysing factors that are different to our reference case, such as aggressive technology or regulatory changes, contributes a range of different insights for the Company to consider.
CLIMATE SCENARIO ANALYSIS METHODOLOGY
Using a robust scenario analysis approach, Oil Search chose an external third party, Wood Mackenzie, to provide the necessary supply data and price forecasts, building on the demand projections from
the published scenarios (Figure 3). Independent published climate scenarios were selected so that underlying assumptions and data are accessible, transparent and comparable. As recommended by the TCFD6, the scenarios selected reflect a wide range of possible climate change outcomes:
� IEA New Policies Scenario (IEA NP): Reflects announced government policies (including 2015 Paris pledges)7.
� IEA 450 Scenario (IEA 2°C): IEA’s 2-degree Celsius scenario8.
� Greenpeace Advance Energy [R]evolution Scenario (GP AER): Complete decarbonisation scenario (~1.5°C)9.
Using the oil and gas demand projections provided by these scenarios, Wood Mackenzie developed oil and gas supply projections and used them to calculate oil and gas price forecasts for each climate change scenario.
Oil Search then applied these price forecasts to generate LNG contract price forecasts as inputs into our economic models to evaluate the potential impact on asset Net Present Value (NPV) (Figure 4). The NPV impact for each scenario was then compared with the current base and low economic models that Oil Search uses to evaluate the resilience of Oil Search investments and expansion projects. Resilience was further assessed by evaluating our LNG Expansion Project
Figure 3: Climate scenario analysis methodology applied by Oil Search in 2017
Climate scenario analysis forms an important part of Oil Search’s risk assessment, strategy development and decision-making processes.
6. www.fsb-tcfd.org/publications/final-implementing-tcfd-recommendations/
7. www.iea.org/bookshop/720-World_Energy_Outlook_2016
8. www.iea.org/bookshop/720-World_Energy_Outlook_2016
9. www.greenpeace.org/archive-international/en/publications/Campaign-reports/Climate-Reports/Energy-Revolution-2015/
Senarios Selected OSL Stress Test
Confirm OSL Resilience
Develop scenarios based oil and gas forcasts
Provides oil and gas demand projections
Wood Mackenzie used their commodity price models and global supply data
� Used Wood Mackenzie’s price forecasts in OSL’s economic models (NPV impact)
� Compared scenario price forecasts with OSL’s current mid and low prices
� Considered robustness of OSL’s existing assets and expansion plans under the climate change scenarios
20
C l i m a t e C h a n g e R e s i l i e n c e R e p o r t 2 0 1 7
against Wood Mackenzie’s IEA450 LNG new project cost curve (Figure 5).
The outcomes of this testing were then applied in a number of ways internally, as described earlier in this Report.
We have identified signposts for each selected scenario that reflect the underpinning assumptions and market indicators they indicate as necessary for each scenario to materialise. These help to inform our judgment on the probability of that scenario occurring with the passage of time.
The corresponding narrative reflects information provided by the IEA and Greenpeace for the relevant scenarios, integrated with Wood Mackenzie and Oil Search’s views. Some signposts are used by Oil Search as indicators to monitor trends and changes in the external environment.
LIMITATIONS OF OUR ANALYSIS
The selected scenarios use the IEA 2016 information, which reports data from 2015 (and 2014/15 in the case of Greenpeace AER). As a result, the short-term price forecasts from 2017-2020 do not reflect the prices currently
being realised in the market. This has a disproportionately negative impact on PNG LNG, where more than 30% of the project’s value is realised over the five-year period from 2018-2022.
Our current climate scenario analysis does not include detailed consideration of geopolitical tensions or Gross Domestic Product (GDP) implications that are likely to escalate in cases where decarbonisation is accelerated.
Detailed analysis of physical climate risk scenarios is ongoing and will be reported in subsequent years.
OSH POTENTIAL NET PRODUCTION
2014 2019 2024 2029 2034 2039
PNG OIL
PNG LNG
LNG EXPANSION PROJECT(Elk-Antelope, P’nyang, Foundation field gas)
NANUSHUK OIL
Mill
ion
boe
Figure 4: Scope of Oil Search’s climate NPV impact assessment.
Nanushuk NPV Assessment
LNG Expansion NPV Assessment
PNG LNG NPV Assessment
Clim
ate Scenario Analysis
21

10. Oil Search’s CEA include High, Base and Low oil price assumptions. When we assess our investments we use the Base CEA oil price as the reference case and test the High and Low oil prices as sensitivities.
� Oil Search’s climate scenario analysis indicates long-term resilience and value generation in a range of decarbonisation scenarios including a 2oC outcome.
� Oil Search’s high quality, globally competitive LNG assets will continue to be resilient under the IEA scenarios we tested.
� Our LNG Expansion Project’s performance is positively impacted under an IEA NP scenario and performs no worse than Oil Search’s current low Corporate Economic Assumption10 (CEA ) in an IEA 450 (2°C) scenario.
� The LNG Expansion Project sits within the lower quartile of the cost curve compared to other proposed projects needed to meet additional LNG demand, making it one of the most price-resilient proposed LNG projects globally.
� In a 2°C scenario, PNG LNG and our LNG Expansion Project will continue to have positive NPVs and will have economic lives consistent with our CEAs, whilst Nanushuk remains NPV positive.
� Under the IEA New Policies, the Nanushuk oil assets perform better than our base CEA.
� Under the IEA 450 scenario, an additional 20 mmb/d of oil is required to meet demand. Oil Search’s globally competitive Nanushuk oil project is able to meet this additional demand and remains NPV-positive.
� There is a low risk of our low-cost assets being stranded in a carbon-constrained world.
O V E R V I E W O F S C E N A R I O A N A L Y S I S O U T C O M E S
22

Overview
Of Scenario A
nalysis Outcom
es
Figure 5: 2035 LNG break-even cost stacks under IEA 450. Cross-section of projects required to meet the additional demand required under an IEA 450 scenario. Excludes projects that are currently operational or under construction. Source: Wood Mackenzie (2017).
Figure 6: Oil and gas demand outlook for each climate change scenario. Source: Wood Mackenzie (2017).
OIL SEARCH’S LNG EXPANSION PROJECT IS ONE OF THE MOST PRICE‑RESILIENT LNG PROJECTS GLOBALLY
OIL DEMAND OUTLOOK BY SCENARIO GAS DEMAND OUTLOOK BY SCENARIO
Oil
dem
and
(Mto
e)
6000
5000
4000
3000
2000
1000
0
Gas
dem
and
(Mto
e)
5000
4500
4000
3500
3000
2500
2000
1500
1000
500
0
‘18 ‘18‘22 ‘22‘26 ‘26‘30 ‘30‘38 ‘38‘36 ‘36‘32 ‘32‘40 ‘40‘34 ‘34‘28 ‘28‘24 ‘24‘20 ‘20
0 10 20 30 40 50 60 70 80 90 100 110 120 130 140 150 1600
2
4
6
8
10
OSH
LN
G E
XPA
NSI
ON
MO
ZAM
BIQ
UE
LNG
EXP
AN
SIO
N
QAT
ARI
D
EBO
TTLE
NEC
KIN
G
MO
ZAM
BIQ
UE
LNG
GO
LDEN
PA
SS L
NG
CA
MER
ON
TRA
IN 4
JORD
AN
CO
VE
MA
GN
OLI
A L
NG
Shipping
Upstream and liquefaction
OSH LNG Expansion
US LNG142 MTPA of new supply required by 2035 under the
IEA 450 (2°C) scenario equates to a breakeven of US$8.8/mBtu
6.1 Wood Mackenzie’s breakeven
IEA NP IEA 450 Greenpeace
23
C l i m a t e C h a n g e R e s i l i e n c e R e p o r t 2 0 1 7

Figure 7: Oil and spot gas price forecasts under the IEA New Policies, IEA 450 and Greenpeace Advanced Energy Revolution scenario. Source: Wood Mackenzie (2017).
Across the three scenarios, gas is less impacted than oil, particularly in non-OECD driven Asian markets. This outcome is driven by the role of gas as a transition fuel for a low-carbon future.Based on Wood Mackenzie’s analysis, gas prices are positioned for growth under all three scenarios and the oil price increases under the IEA NP scenario. Oil prices remain robust enough to encourage development of new supplies under both IEA scenarios. In the IEA NP scenario, despite limited oil demand growth, 40 mmb/d of new supply is still needed to offset declines from producing fields. Higher-cost sources of both discovered and yet-to-find supply will be needed to fill this gap, pushing oil prices to US$70/bbl (real) by 2030 and above US$100/bbl post-2035. In the IEA
450 (2oC) scenario, despite declining oil demand, 20 mmb/d of new supply is still needed to compensate for declines from on-stream fields. In the IEA NP scenario, strong gas demand growth, combined with declines from producing fields, mean ~2,500 bcm per annum of new gas supply will be required to meet demand by 2040. LNG demand will double, accounting for 20% of demand by 2040 versus 11% today. However, continued near-term oversupply means prices remain depressed until post-2025, when demand picks up, driving a more than 4x increase in Asian and European gas prices. In the IEA 450 (2oC) scenario, ~2,000 bcm per annum of new gas supply is needed by 2040 to meet demand.
LNG demand grows 75% through the forecast period. The period of near-term oversupply is extended until the mid-2020s, delaying an uptick in prices, which also plateau at lower levels due to weaker long-term demand. Gas prices are still expected to increase from today’s lows, particularly in Asian and European markets, where prices triple by 2030.In the Greenpeace (1.5oC) scenario, gas demand is largely maintained until 2030, such that 1,000 bcm per annum of new supply is still needed. LNG demand grows 30% to 2030 before declining. Gas prices still increase post-2020, peaking in the early 2030s before also entering a decline (Wood Mackenzie 2017).
BRENT OIL PRICE, 2018 ‑ 2040 SPOT GAS PRICE, 2018 ‑ 2040
2018 2018
0 0
20 2
40 4
606
80
8
100
120
10
2022 20222026 20262030 20302038 20382036 20362032 20322040 20402034 20342028 20282024 20242020 2020
IEA NP IEA NP Japan IEA NP HHIEA 450
Greenpeace JapanIEA 450 HH
GreenpeaceIEA 450 Japan
Greenpeace HH
$ /
bb
l
US$
/ m
mb
tu
S C E N A R I O I N S I G H T S
� LNG demand grows under all three scenarios.
� Oil demand remains robust enough to encourage development of new supplies under the IEA scenarios.
� There is a large range and variability across the scenarios in terms of possible oil prices (US$5/bbl - US$115/bbl).
� Peak oil and gas demand does not occur before 2040 under IEA NP.
24

Scenario Insights
C l i m a t e C h a n g e R e s i l i e n c e R e p o r t 2 0 1 7
Figure 8: Summary assumptions and key characteristics of each of the published scenarios used to test Oil Search climate resilience. Compiled by Wood Mackenzie.
O U R C L I M A T E C H A N G E P O S I T I O N
Figure 4: Summary of indicative climate impact and emissions of each of the three scenarios assessed (Wood Mackenzie 2017).
The assumptions applied by Wood Mackenzie and Oil Search in assessing the impacts of the scenarios are outlined in the Basis of Preparation section at the end of this document.
Scenario Characteristic lEA New Policies (NP) lEA 450 (2°C)Greenpeace Advanced
Energy [R]evolution
Overview Scenario reflecting announced
government climate policies De-carbonisation scenario
Complete de-carbonisation scenario
Target N/A 50% chance of limiting global warming to a 2°C temperature
rise in 2100
100% renewable energy supply by 2050
2040 CO2 emissions (Mt) 36,290 18,427 8,086
Primary energy demand 19% of 18,000 Mtoe 31% of 15,000 Mtoe 66% of 482,000 PJa
Power demand 37% of 39,000 TWh 58% of 34,000 TWh 87% of 52,000 TWh
Transport demand 7% of 3,400 Mtoe 20% of 2,700 Mtoe 61% of 68,000 PJa
Transport / Electric Vehicles (EVs)
10% EVs reaching total 150M; some rise in biofuels
to 4.2 mboed
Almost 50% EVs reaching total 710M; bigger rise in biofuels
to 9 mboed
Electricity contributes 37% of transport demand; biofuels
consumption at 7,436 PJa
Technology change (Generation & storage)
No major step-changes Significant cost reductions in renewable technologies and broader deployment of CCS
Improvements in smart grids, renewables system integration,
and storage/batteries— based on latest technologies at an assumed
reasonable rate of replacement
Regulatory change As per announced global
and government targets
Greater policy initiatives (e.g. energy intensity targets, efficiency initiatives, fuel-switching, carbon
pricing, CCS, system-wide measures)
Active policy and technical support for energy efficiency
measures; supportive government climate policy
Others Fossil fuel subsidies phased out Fossil fuel subsidies phased out;
major capital inflow to clean energy tech
Includes phasing out of nuclear along with fossil fuels
20
40
sha
re o
f ren
ewab
les
25


C l i m a t e C h a n g e R e s i l i e n c e R e p o r t 2 0 1 7
SUMMARY OF POSSIBLE PORTFOLIO IMPACTS UNDER THE SCENARIOS TESTED
Positive impact on project economics
NPV positive and above OSH’s base CEA
Impact within OSH’s base and low case.
NPV positive and within OSH’s base and low CEA
Returns are less than planned but asset is still economic and makes positive returns
NPV positive and below OSH’s low CEA
Significant negative impact and project does not pay back investment
NPV negative. Project would not be economic if this scenario was to eventuate
PROJECT SCENARIO NPV IMPACT11 COMMENTS
PNG LNG (including Oil Search oil assets)
IEA NPS
� Economic life not negatively impacted compared to our base case.
� NPV impacted by short-term price drop inherent in scenario12.
IEA 450 (2°C) � Economic life comparable to our low case.
� NPV impacted by short-term prices inherent in scenario12.
GREENPEACE AER (1.5°C)
� Value would be eroded under this scenario. However, the project would remain NPV-positive.
LNG Expansion Project (Elk-Antelope, P’nyang, and foundation field gas)
IEA NPS
� NPV impacts are significantly more favourable than our base economic assumptions.
� Extends economic life of project by approximately two years.
IEA 450 (2°C) � NPV and asset economic life impact falls between our base
and low economic cases.
GREENPEACE AER (1.5°C)
� Value would be eroded under this scenario. However, the project would remain NPV-positive.
Nanushuk Project13
IEA NPS � NPV impacts are more favourable than our base CEA.
IEA 450 (2°C) � Value is eroded but the project would remain NPV-positive.
GREENPEACE AER (1.5°C)
� Long-term oil price of US$5 significantly impacts the NPV of the project and the project would not be sanctioned.
11. Compared with Oil Search’s internal economic assumptions.
12. 30% of PNG LNG’s value is realised over the five-year period from 2018-2022. The scenarios show a short-term drop in prices to the US$30s and US$40s starting in 2018, and this negatively impacts the NPV of PNG LNG. Actual oil prices in late 2017 and early 2018 have instead ranged between US$60 and US$70. PNG LNG would have a much higher NPV if the climate scenarios did not have a short-term drop in oil prices and actuals were used. We have chosen to preserve the integrity of the scenario and report the impact using the embedded numbers for this period, not substituting for actuals.
13. Oil Search acquired the Nanushuk assets in November 2017. The climate NPV analysis is based on a conservative acquisition case development concept. The acquisition case is based on a resource of 500 million barrels, compared to the existing joint venture partners’ estimates of at least 1.2 billion barrels. The NPV analysis does not include the anticipated design efficiencies, opportunities to realise synergies with existing infrastructure, or the value of our option to double our interest in the asset by mid-2019. It does include the lower USA corporate tax rate that became law in December 2017.

I E A N E W P O L I C I E S S C E N A R I O
� Demand for all energy sources increases and global emissions continue to grow.
� Significant sources of new supply are needed to meet future demand growth, driving oil and gas prices higher.
� LNG demand doubles by 2040.
� 40 mmb/d of new oil supply is needed to offset declines from producing fields.
� Oil prices rise to US$70/bbl (real) by 2030 and above US$100/bbl post-2035.
� Gas demand grows faster than oil, driven by policies to support gas as a cleaner-burning alternative to coal.
The IEA New Policies (IEA NP) scenario is the IEA’s reference scenario and was published in the World Energy Outlook 2016 (WEO 2016).
This scenario reflects existing government policies and announced plans, particularly the Nationally Determined Contributions (NDCs) made for COP21. The scenario includes the IEA’s assessment of the likely results if existing policy commitments are implemented, with some evaluation of yet-to-be implemented policies.
The IEA NP does not anticipate future policy shifts or predict major technological change. It is a non-normative scenario, which means it is not target-driven, but merely serves to provide a view of the future energy market based on current actions and expectations.
The IEA NP scenario reflects an increase in CO2 emissions, reaching 36,290 Mt in 2040, up from 32,264 Mt in 2017 (Wood Mackenzie 2017).
The IEA NP scenario is predicated on continued policymaker support for decarbonisation measures, particularly those needed for developed countries to achieve the NDCs they submitted as part of the Paris Agreement.
Developed countries would need to see emissions growth slow, and additional measures promoting energy efficiency would be needed for the
USA, European Union (EU) and Japan to meet their Paris pledges. The IEA NP assumes these are implemented by the early 2020s, helping to slow global emissions growth to 160 MT annually (from 540 MT 2016-2017). It also assumes that by 2030, Japan, the USA and Europe have met their Paris pledges. Note that the 2016 edition of the IEA NP used for the Oil Search analysis pre-dates President Trump’s election and the roll-back in American environmental and climate policy.
Rising investment in energy efficiency will be an important component in reaching emissions goals. According to the IEA, global investment in energy efficiency reached US$220 billion in 2016 (all sectors, but dominated by buildings). The IEA NP requires a cumulative spend of US$23 trillion by 2040 — a five-fold increase in annual spend from 2020 onwards.
Decarbonisation of the transport sector would be moderate under the IEA NP scenario. Battery costs would need to decline, and policymaker support would remain necessary for consumers to preferentially choose electric vehicles (EVs) over traditional vehicles. By 2025, the global stock of EVs would need to reach 30 million (from 2 million in 2017), representing approximately 2% of the total fleet. By 2040, the EV population would need to hit 150 million, about 8-10% of all vehicles on the road.
Renewable energies would need to see continued cost declines, and while subsidies and other support measures would be essential in the medium-term, these would fall away over time. Relative to 2015, solar PV costs would need to decline up to 70% by 2040. This would enable China to cut solar subsides by 75% by 2025, making Indian solar cost-competitive without subsidy by 2030. By 2040, renewables would need to be cost-competitive without subsidy globally, and renewable power sources (excluding hydro) would need to account for approximately 27% of total capacity, up from 16% in 2020.
Environmental concerns slow growth in coal demand, but a decline does not occur before 2040; instead demand approaches a plateau. Competition from alternative fuels is not enough to curb demand growth for oil and natural gas (Wood Mackenzie, 2017).
28

IEA
NE
W P
OLIC
IES
: SIGN
POSTS
OPEN
IEA
45
0 (2
°C): SIG
NPO
STS
GR
EE
NP
EA
CE
AD
VA
NC
E E
NE
RG
Y [R
]EV
OLU
TION
(1.5°C
): SIGN
POSTS
BRENT OIL PRICE, 2018 ‑ 2040
40 mmb/d of new supply needed to meet demand by 2040 requiring a Brent oil price of $115/bbl.
SPOT GAS PRICES, 2018 ‑ 2040
By 2029 new LNG supply required to meed demand. Full cost US LNG set the marginal cost of supply
From 2029 to 2032 marginal cost of supply set by full cost US LNG
Higher cost LNG supplies need to balance market from 2035 onwards
$/m
mb
tu
2018 - 2026 Period of LNG capacity under-utilisation weighs on price as demand growth works through available capacity, prices are forced to rise
2018 2020 2022 2024 2026 2028 2030 2032 2034 2036 2038 2040
0
2
4
6
8
10
12
20
40
60
80
100
120
Japan UK USA Henry Hub
Near-term volatility continures with USL48 tight oil the swing factor until supply tightens suffiently relative to demand growth
Figure 9: Oil and spot gas price forecasts under the IEA New Policies scenario. Source: Wood Mackenzie (2017).
$ /
bb
l
China LNG demand slips mid 2030s, lowering NE Asia prices; increasing India demand drives recovery
2018 2020 2022 2024 2026 2028 2030 2032 2034 2036 2038 2040
C l i m a t e C h a n g e R e s i l i e n c e R e p o r t 2 0 1 7
29

I E A N E W P O L I C I E S : S I G N P O S T SI N D I C AT O R S & A S S U M P T I O N S N E C E S S A R Y F O R T H I S S C E N A R I O T O M AT E R I A L I S E
CO2 projected to increase 540Mt
Coal year-on-year growth rate plateaus at
0.3%
Global CO2 growth slows to
160MtGlobal CO2 Emissions continue
to grow at a slow rate
Sales 750,000; fleet >2M vehicles;
cost $250-$300/kWh
US$241bn invested globally in 2016
US$220bn investment in energy
efficiency
Nuclear 4%
of China’s electricity
vs. 70% Coal
fleet reaches
>30M VEHICLESFalling battery costs and
policies spur EV Fleet growth to
10M VEHICLES
30% of electricity generation
(including hydro) is from renewable sources
China solar PV subsidies
fall by
75%

I E A N E W P O L I C I E S : S I G N P O S T SI N D I C AT O R S & A S S U M P T I O N S N E C E S S A R Y F O R T H I S S C E N A R I O T O M AT E R I A L I S E
Coal year-on-year growth rate
starts to slow
US stops net imports of oil
Global Annual CO2 Emissions reach
36,290 Mt
fleet reaches
>150M VEHICLES
China / India solar becomes economic
without subsidies
US$8.8tn Cumulative investment
in global renewables
37% of electricity generation
(including hydro) is from renewable sources
Nuclear is 10% of China’s power supply (800 TWh)
US$23tn cumulative investment in energy
efficiency, improvement
>1.5tn per year
Japan, US, Europe meet Paris pledges

I E A 4 5 0 S C E N A R I O ( 2 ° C )
� Strong policy support for energy efficiency, renewables and low-carbon technologies reduces hydrocarbon demand by 15% by 2040.
� Gas demand grows at 0.6% CAGR, while oil declines at a rate of -1.1% CAGR through 2040.
� LNG demand grows 75% through 2040.
� Oil stabilises at ~US$40/bbl (real) post-2020.
� 20 mmb/d of new oil supply is still needed to compensate for declines from on-stream fields.
The IEA 450 scenario is IEA’s main decarbonisation scenario and was also published in the WEO 2016.
This scenario sets a target of limiting average global temperature increases by 2100 to 2 degrees Celsius above pre-industrial levels . As such, it has been used by Oil Search as a 2°C scenario. To achieve this target, the scenario relies more heavily than the IEA NP on renewables, particularly wind and solar. It also envisions a broader adoption of energy efficiency policies and low-carbon technologies.
The IEA 450 (2°C) scenario assumes a decrease in CO2 emissions, which decline to 18,427 Mt in 2040 from 32,264 Mt in 2017.
The IEA 450 (2°C) scenario is built around a specific goal to limit global CO2 concentrations to 450 parts per million, the level needed to hold global warming to no more than 2°C above pre-industrial levels. Current Paris Agreement targets are only the start; the IEA 450 (2°C) scenario requires that countries return to the negotiating table every five years, starting from 2020, and agree increasingly strict limits on emissions. Global CO2 output would need to peak in 2020, as would US, EU and China emissions. India’s emissions would be allowed to grow through to 2030, from where they would need to enter a slow decline to 2040.
Because of the aggressive emission declines necessary, the IEA 450 (2°C) scenario is interventionist, with governments acting to drive specific energy outcomes. Cost reductions for renewables are similar to those seen in IEA NP, but deployment would need to be accelerated; non-hydro capacity would have to reach 5.2 TW by 2040, up from 3.3 TW under IEA NP. Also notable is the reliance on nuclear power; capacity would need to roughly double from today’s levels by 2040, with virtually all growth occurring in non-OECD areas. Non-fossil power sources (including nuclear) would have to satisfy more than half of all global electricity demand as early as 2030; by 2040 this share would need to reach almost 70%.
The scenario requires that policymakers push for electrification of energy end-use, but simultaneously invest heavily in energy efficiency measures, such that total global power demand under the IEA 450 (2°C) scenario is 17% lower in 2040 than IEA NP. Industrial sectors alone would need to garner US$300 billion of additional investment in electric motor technology. A system-wide approach would be essential, likely requiring a level of industrial cooperation between countries and regions far in advance of what exists today. Overall, energy efficiency spend would need to be 50% higher than under
the IEA NP scenario, reaching a cumulative total of US$35 trillion by 2040.
Policymakers would also be required to turn their sights on the transportation sector, supporting EV uptake with financial incentives. Stricter fuel efficiency regulations would be needed to help to drive down demand from legacy engine types. Oil demand from transportation would need to peak by 2020, in advance of the real acceleration of EV demand (from 2030), reflecting the importance of energy efficiency in curtailing demand under this scenario. By 2040, the EV fleet would need to reach 715 million vehicles worldwide, or about 40-50% of global stock. This implies that virtually all new cars sold by this time would be electric.
Competition from alternative fuels as well as policymakers’ intervention radically curb demand for fossil fuels, despite increasing use of carbon capture and storage technology. Gas is the only fossil fuel for which demand does not peak by 2020; the peak instead comes globally by 2030, but demand growth remains positive through 2040 in the key markets of China and India (Wood Mackenzie, 2017).
30

OPEN
IEA
45
0 (2
°C): SIG
NPO
STS
GR
EE
NP
EA
CE
AD
VA
NC
E E
NE
RG
Y [R
]EV
OLU
TION
(1.5°C
): SIGN
POSTS
C l i m a t e C h a n g e R e s i l i e n c e R e p o r t 2 0 1 7
IEA 450 (2°C) – BRENT OIL PRICE 2018‑2040
Though demand falls, 20 mmb/d of new supply needed to compensate for underlying declines. Brent price flat at ~$40/bbl.
SPOT GAS PRICES, 2018 ‑ 2040
By 2030 new LNG supply required to meed demand. Full cost US LNG set the marginal cost of supply
From 2030 to 2034 marginal cost of supply set by lower cost expansion developments in US and Pacific Basin
$/m
mb
tu
2018 - 2030 Period of LNG capacity under-utilisation weighs on price as demand growth works through available capacity, prices are forced to rise
2018 2020 2022 2024 2026 2028 2030 2032 2034 2036 2038 2040
0
0
2
4
6
8
10
12
20
40
60
80
100
Japan UK USA Henry Hub
Near-term oversupply combined with lower than expected demand results in price collapse to $30/bbl before rebounding to 40/bbl as new supply sources are needed post 2020
Figure 10: Oil and spot gas price forecasts under the IEA 450 scenario. Source: Wood Mackenzie (2017).
Higher cost greenfield and brownfield projects needed to balance market from 2035 onwards
$ /
bb
l
2018 2020 2022 2024 2026 2028 2030 2032 2034 2036 2038 2040
31
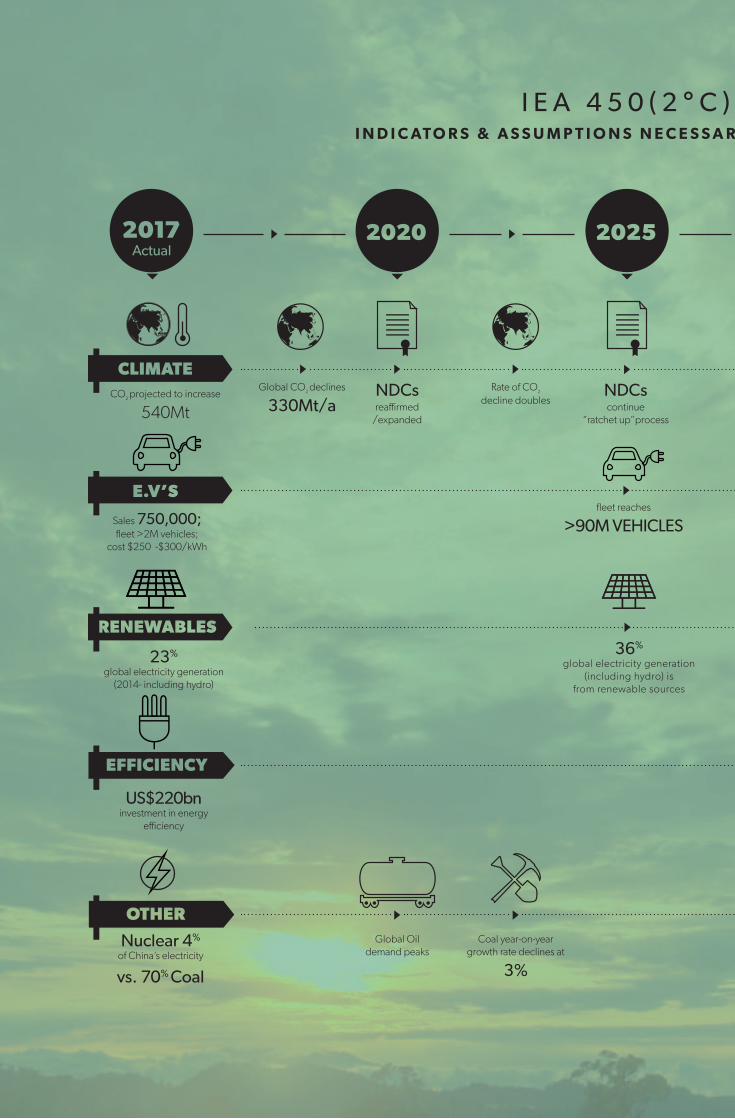
I E A 4 5 0 ( 2 ° C ) : S I G N P O S T SI N D I C AT O R S & A S S U M P T I O N S N E C E S S A R Y F O R T H I S S C E N A R I O T O M AT E R I A L I S E
CO2 projected to increase 540Mt
NDCs continue
“ratchet up”process
NDCs reaffirmed
/expanded
Sales 750,000; fleet >2M vehicles;
cost $250 -$300/kWh
Global CO2 declines
330Mt/aRate of CO2
decline doubles
fleet reaches
>90M VEHICLES
36%
global electricity generation (including hydro) is
from renewable sources
23%
global electricity generation (2014- including hydro)
US$220bn investment in energy
efficiency
Coal year-on-year growth rate declines at
3%
Global Oil demand peaks
Nuclear 4%
of China’s electricity
vs. 70% Coal
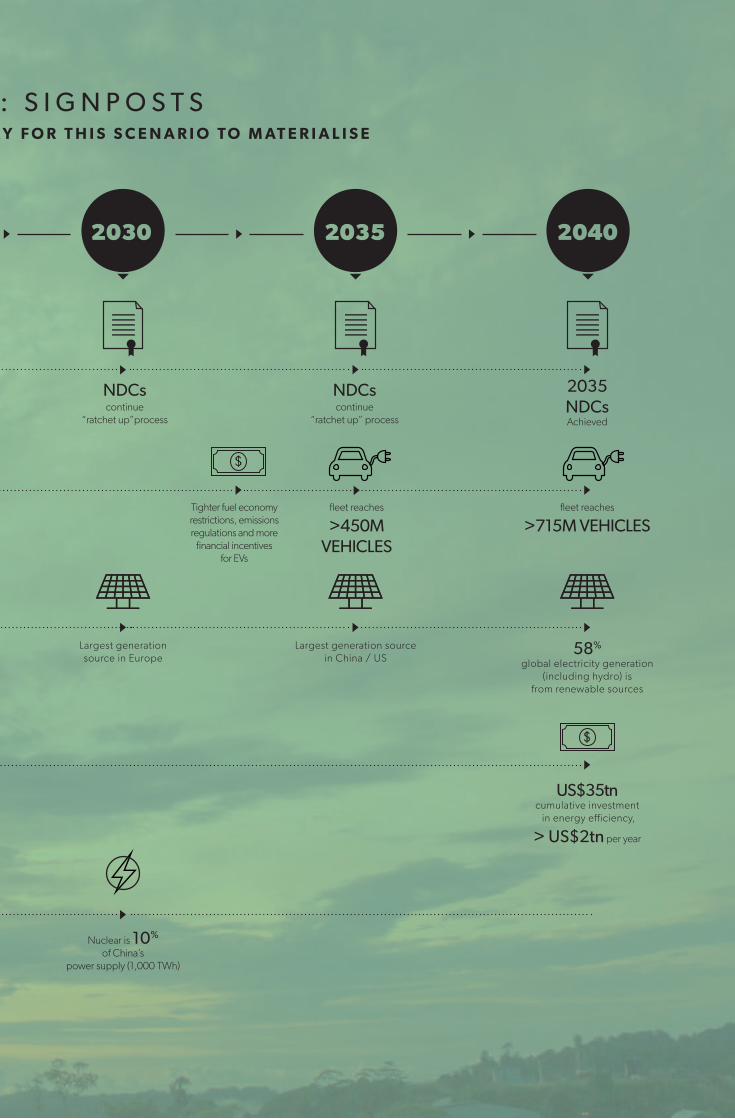
I E A 4 5 0 ( 2 ° C ) : S I G N P O S T SI N D I C AT O R S & A S S U M P T I O N S N E C E S S A R Y F O R T H I S S C E N A R I O T O M AT E R I A L I S E
NDCs continue
“ratchet up”process
NDCs continue
“ratchet up” process
2035 NDCs Achieved
Tighter fuel economy restrictions, emissions regulations and more
financial incentives for EVs
fleet reaches
>715M VEHICLESfleet reaches
>450M VEHICLES
Largest generation source in Europe
Largest generation source in China / US
58% global electricity generation
(including hydro) is from renewable sources
US$35tn cumulative investment in energy efficiency,
> US$2tn per year
Nuclear is 10%
of China’s power supply (1,000 TWh)

� Decarbonisation of largest energy demand sectors leads to collapse in oil demand and prices.
� -4.4% CAGR decline in oil demand and -2.5% CAGR decline in gas demand through 2040.
� Oil demand collapses to 40 mmb/d by 2040, with transport and non-energy use the only two significant remaining demand sectors.
G R E E N P E A C E A D V A N C E E N E R G Y [ R ] E V O L U T I O N S C E N A R I O ( 1 . 5 ° C )
The Greenpeace AER scenario was published in the organisation’s Energy Revolution 2015 report.
The scenario sets a target for complete decarbonisation by 2050, across sectors such as power, heat and transport. The scenario assumes a near-zero emissions world in 2050, based on 100% renewable energy supply. As such, this scenario has been used by Oil Search as our ‘less than 2°C’ or 1.5°C scenario.
The Greenpeace AER (1.5°C) scenario assumes a decrease in CO2 emissions, from 30,436 Mt in 2017 to 8,086 Mt in 2040.
The Greenpeace AER (1.5°C) scenario is a radical outlook, plotting a path towards 100% renewable energy by 2050. To materialise, it would rely on several aggressive improvements in energy efficiency, renewables uptake, transportation electrification and replacement of legacy fossil fuel demand with hydrogen. No fossil fuel would escape some level of demand destruction by 2040, but gas would be undoubtedly best-placed in this challenging world.
As with the IEA 450 (2°C) scenario, governments would need to agree stricter emissions targets every five years, starting in 2020.
However, the Greenpeace scenario also demands that governments commit to phasing out fossil fuel subsidies for production and consumption in their entirety by 2020 – something that would undoubtedly pose a challenge for many emerging markets.
Following on from this, policymakers would need to phase out consumption of specific fuels, starting with lignite and hard coal. Oil and gas supply would be phased out as existing production declines; no new production would be sanctioned.
By 2040, oil represents approximately 10% of world primary energy demand under this scenario, down from 28% in 2020. Gas meets 17% of global energy needs in 2040, down from 23% in 2020.
Underpinning the shift away from fossil fuels is an uplift in renewable energy investment to US$2.5 trillion annually. Additional spend is required to produce synthetic fuels for transportation. Capital stock replacement and renovation of existing structures would need to be a theme, with the introduction of low-energy standards for buildings essential to curb demand growth.
Electrification of the transport sector would need to progress apace, and hybrids would be used only as a stop-gap technology. Full electric vehicles would need to become the standard by 2025, though the rate of capital stock turnover means petroleum would likely persist as a transport fuel for some years afterwards.
The investment figures for the Greenpeace scenario are staggering, but the scenario asserts that at least some of the spend will be offset by savings made on fossil fuels not consumed – estimated at a total of US$42 trillion. By 2040, the Greenpeace AER (1.5°C) scenario describes a world in which fossil fuel costs are a burden that no longer needs to be accommodated, due to the maturity and scale of low-carbon alternatives.
The Greenpeace AER (1.5°C) scenario describes an extremely ambitious aspiration for decarbonisation, with market indicators and signposts that are already lagging. Like the other scenarios we considered, the Greenpeace AER does not consider the geopolitical or GDP implications or reaction, which are likely to be extreme in this instance.
32
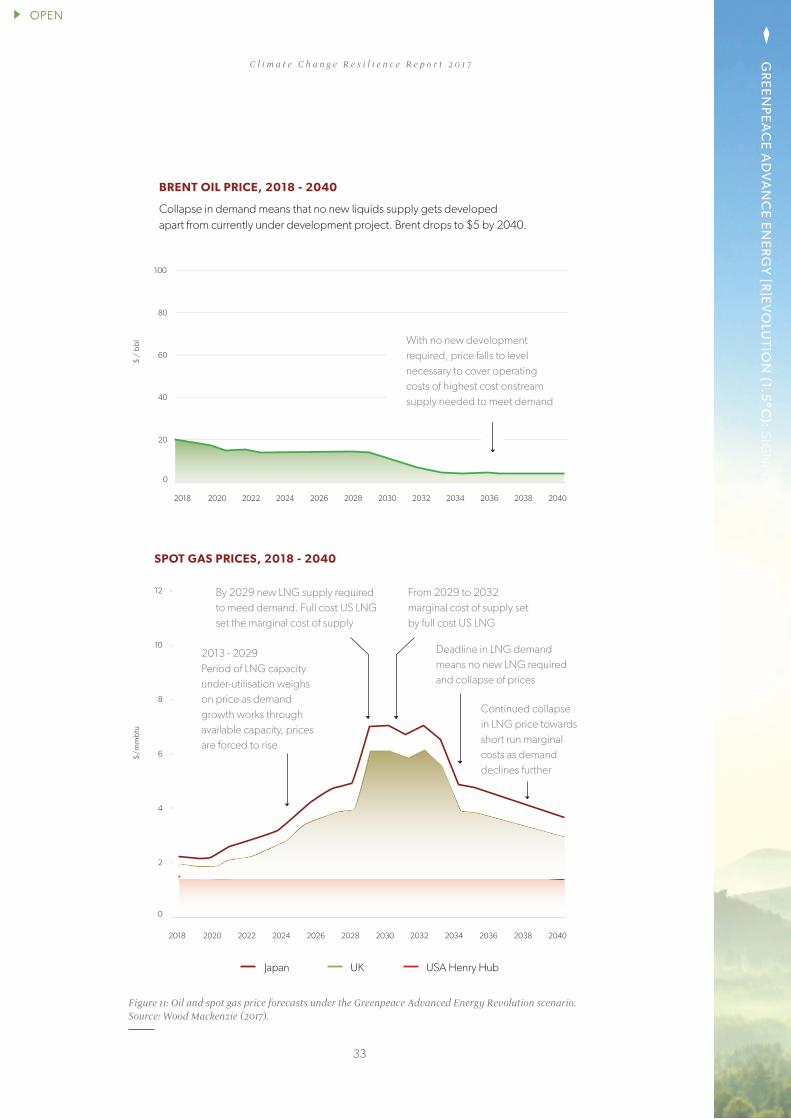
OPENG
RE
EN
PE
AC
E A
DV
AN
CE
EN
ER
GY
[R]E
VO
LUTIO
N (1.5
°C): SIG
NPO
STS OPEN
33
C l i m a t e C h a n g e R e s i l i e n c e R e p o r t 2 0 1 7
Continued collapse in LNG price towards short run marginal costs as demand declines further
BRENT OIL PRICE, 2018 ‑ 2040
Collapse in demand means that no new liquids supply gets developed apart from currently under development project. Brent drops to $5 by 2040.
SPOT GAS PRICES, 2018 ‑ 2040
By 2029 new LNG supply required to meed demand. Full cost US LNG set the marginal cost of supply
From 2029 to 2032 marginal cost of supply set by full cost US LNG
Deadline in LNG demand means no new LNG required and collapse of prices
2013 - 2029 Period of LNG capacity under-utilisation weighs on price as demand growth works through available capacity, prices are forced to rise
2018 2020 2022 2024 2026 2028 2030 2032 2034 2036 2038 2040
0
0
2
4
6
8
10
12
20
40
60
80
100
Japan UK USA Henry Hub
With no new development required, price falls to level necessary to cover operating costs of highest cost onstream supply needed to meet demand
Figure 11: Oil and spot gas price forecasts under the Greenpeace Advanced Energy Revolution scenario. Source: Wood Mackenzie (2017).
$/m
mb
tu$
/ b
bl
2018 2020 2022 2024 2026 2028 2030 2032 2034 2036 2038 2040

G R E E N P E A C E A D V A N C E D E N E R G Y [ R ] E V O L U T I O N S C E N A R I O ( 1 . 5 ° C ) : S I G N P O S T SI N D I C AT O R S & A S S U M P T I O N S N E C E S S A R Y F O R T H I S S C E N A R I O T O M AT E R I A L I S E
CO2 projected to increase 540Mt
NDC’s reaffirmed /
expanded with 5 year mechanism
NDC’s reaffirmed
/expanded
Significant transition from hybrids to
FULL ELECTRIC
Rise of de-centralised
GENERATION
New European buildings near
CARBON ZERO
Low energy standards for
BUILDINGS
900Mt/aEmissions decline
1,200Mt/a Emissions decline
Sales 750,000; fleet >2M vehicles;
cost $250-$300/kWh
Less than 1% of all buildings
CARBON ZERO
303 GW of installed PV capacity (2016)
844 GW of installed PV capacity
1.9% of aviation is powered by
biofuels and synfuels
Highly efficient
AIR-CON SYSTEMS
US$241bn invested globally in 2016

G R E E N P E A C E A D V A N C E D E N E R G Y [ R ] E V O L U T I O N S C E N A R I O ( 1 . 5 ° C ) : S I G N P O S T SI N D I C AT O R S & A S S U M P T I O N S N E C E S S A R Y F O R T H I S S C E N A R I O T O M AT E R I A L I S E
Electricity used in road transport is
2,010 TIMES GREATER than to 2012.
1,200Mt/a Emissions decline
3,725 GW of installed PV capacity
6,678 GW of installed PV capacity
37% of aviation is powered by biofuels
and synfuels
Highly efficient
AIR-CON SYSTEMS
Highly efficient propulsion technology for
TRAINS
US$1.8tn average investment per year
in renewables
US$2.5tn average investment per year
in renewables
Key emitters renew
NDC’s Key emitters
further renew
NDC’s
2035 NDC’s Achieved
Electricity used in road transport is
911 TIMES GREATER than to 2012.

A NOTE ON THE 2017 UPDATE TO THE IEA SCENARIOS AND IEA WORLD ENERGY OUTLOOK (WEO) 2017
The IEA NP and 450 scenarios relied on by Wood Mackenzie and Oil Search for this analysis were published in the 2016 version of the WEO. The IEA released an update to these scenarios in November 2017 after Oil Search’s scenario analysis work was substantially advanced. A tabular comparison of the 2017 data with the 2016 version is presented on the next page.
In summary, the 2017 NP scenario is only marginally different in terms of oil and gas demand from the 2016 version, with higher growth for non-bioenergy renewables and lower growth for coal and nuclear. There is also an increased projection of EV fleet growth from 150 million by 2040 to 280 million under the 2017 NP scenario. The 2017 publication includes a Sustainable Development scenario (SDS) instead of a 450 scenario. However, the 450 scenario has not disappeared. The SDS incorporates the 450 scenario and also considers the Sustainable Development Goals (SDGs) of universal energy access and improving air quality. The 2040 emissions figure of the SDS are broadly in line (18,310 vs. 18,427) with the 450 scenario. However, assumptions on how the energy mix evolves have changed more significantly, with higher demand for gas and a more significant increase in non-bioenergy renewables. Though oil and gas demand in each scenario is higher than in the 2016 versions, the differences are not great enough to have a significant impact on the conclusions of this analysis in terms of longer-term implications for Oil Search (Wood Mackenzie, 2017).
OIL SEARCH’S ECONOMIC ANALYSIS ASSUMPTIONS
� The scenario NPV impact analysis for PNG LNG includes Oil Search’s PNG oil assets. The interdependency of these projects – both technically and financially - makes separation inappropriate.
� The scenario NPV impact analysis was undertaken using the most recent understanding of the commercial structure for the LNG Expansion Project (drawing on Elk-Antelope, P’nyang and foundation field gas).
� Nanushuk scenario NPV analysis is based on a conservative acquisition case development concept.
• The acquisition case is based on a resource of 500 million barrels, compared to the existing JV partners’ estimate of at least 1.2 billion barrels.
• Our entry price using a 500- million-barrel resource is just over US$3 per barrel; this will decrease to approximately US$1.30 per barrel if the 1.2 billion upside is proven.
• The NPV analysis has not considered potential cost savings and opportunities to improve efficiencies, optimise the design, and realise synergies with existing infrastructure.
• The NPV analysis does not include the value of our option to double our interest in the asset by mid-2019.
• The NPV analysis includes the lower USA corporate tax rate, which became law in December 2017.
• The IEA450 and Greenpeace scenario analyses include additional cost deflation consistent with a low oil price environment.
� IEA NP, IEA 450 and Greenpeace AER oil and gas price scenario forecasts are provided by Wood Mackenzie.
� Wood Mackenzie has modelled the pricing scenarios firstly through their Oil Price Model and subsequently through their Global Gas Model.
� Wood Mackenzie does not provide contract LNG pricing levels required to underpin FIDs. Oil Search has inferred contract pricing levels based on oil, spot LNG and US Henry Hub pricing levels.
� Analysis does not account for potential changes to project timing, cost structures or geopolitical impacts derived from the climate scenarios.
B A S I S O F P R E PA R AT I O N
34

IEA
45
0: SIG
NPO
STS
New Policies WE0 2016 WE0 2017 WE0 2017 vs. 2016
Units 2025 2030 2035 2040 2025 2030 2035 2040 2025 2030 2035 2040
TPED Mtoe 15,340 16,185 17,057 17,866 15,183 16,010 16,806 17,584 -1% -1% -1% -2%
Coal 3,955 4,039 4,101 4,140 3,842 3,896 3,909 3,929 -3% -4% -5% -5%
Oil 4,577 4,630 4,708 4,775 4,633 4,715 4,764 4,830 1% 2% 1% 1%
Gas 3,390 3,686 4,011 4,313 3,436 3,737 4,068 4,356 1% 1% 1% 1%
Nuclear 888 1,003 1,096 1,181 839 897 949 1,002 -5% -11% -13% -15%
Hydro 420 463 502 536 413 459 499 533 -2% -1% -1% -1%
Bioenergy 1,633 1,721 1,804 1,883 1,530 1,630 1,721 1,801 -6% -5% -5% -4%
Other renewables 478 643 835 1,037 490 676 896 1,133 2% 5% 7% 9%
450 / Sustainable Development
WEO 2016 WEO 2017 WEO 2017 vs. 2016
Units 202514 2030 2040 2025 2030 2040 2025 2030 2040
TPED Mtoe 14,186 14,468 14,878 13,921 13,837 14,084 -2% -4% -5%
Coal 3,098 2,650 2,000 3,023 2,457 1,777 -2% -7% -11%
Oil 4,107 3,883 3,326 4,247 3,966 3,306 3% 2% -1%
Gas 3,241 3,349 3,301 3,397 3,510 3,458 5% 5% 5%
Nuclear 1,003 1,234 1,590 920 1,120 1,393 -8% -9% -12%
Hydro 429 486 593 429 489 596 0% 1% 1%
Bioenergy 1,728 1,928 2,310 1,272 1,258 1,558 -26% -35% -33%
Other renewables 580 939 1,759 633 1,037 1,996 9% 10% 13%
14. Extrapolated based on 2020 and 2030 data points.
C l i m a t e C h a n g e R e s i l i e n c e R e p o r t 2 0 1 7
Basis O
f Preparation
WOOD MACKENZIE DEMAND ASSUMPTIONS
Conversion of demand data from the three chosen external scenarios to the format needed for Wood Mackenzie’s Oil Price Model (OPM) and Global Gas Model (GGM) in terms of granularity, time scale and geographic definition.
� OPM and GGM include annual data for 15 countries and regions for the period 2017-2035.
� The external scenarios chosen provide less granular demand data and/or use different geographic definitions.
� For example, IEA scenarios provide demand projections in five-year increments between now and 2040.
� Interpolation was required to produce annual demand data for each of the scenarios to align with inputs required for GGM and OPM.
• Extension of the Wood Mackenzie data beyond 2035 to 2040 required interpolation, with a corresponding trade-off in accuracy.
• Linear interpolation has less value when trying to understand inflexion points.
Determination of the implications of each demand scenario (IEA NP, IEA 450 and Greenpeace AER) for future oil and gas supply and pricing.
� Oil: Based on oil demand data for each scenario, Wood Mackenzie used proprietary OPM to derive implied annual oil supply and Brent oil price through the forecast period.
� Gas: Based on gas demand data for each scenario, Wood Mackenzie used proprietary GGM to derive regional gas marker prices (Henry Hub, NBP etc.) as well as gas supply and export volumes (piped and LNG).
� A fundamentals-based approach was used to derive supply and price forecasts between 2017 and 2035; extension of results beyond this period was done by extrapolation.
35

TC F D R E F E R E N C E G U I D E
Core Element
Recommended Disclosure
Guidance for Energy Group
Disclosed in Climate Change Resilience Report
GovernanceDisclose the organisation’s governance around climate-related risks and opportunities
a) Describe the board’s oversight of climate-related risks and opportunities.
(i) Processes and frequency by which the board and/or board committees (e.g. audit, risk, or other committees) are informed about climate-related issues.
- Climate Governance
- Climate Risk Management
(ii) Whether the board and/or board committees consider climate-related issues when reviewing and guiding strategy, major plans of action, risk management policies, annual budgets, and business plans as well as setting the organisation’s performance objectives, monitoring implementation and performance, and overseeing major capital expenditures, acquisitions, and divestitures.
- Climate Governance
- Climate Risk Management
(iii) How the board monitors and oversees progress against goals and targets for addressing climate-related issues.
- Climate Governance
- Climate Risk Management
b) Describe management’s role in assessing and managing climate-related risks and opportunities.
(i) Whether the organisation has assigned climate-related responsibilities to management-level positions or committees; and, if so, whether such management positions or committees report to the board or a committee of the board and whether those responsibilities include assessing and/or managing climate-related issues.
- Climate Governance
(ii) A description of the associated organisational structure(s). - Climate Governance
(iii) Processes by which management is informed about climate-related issues.
- Climate Governance
- Climate Risk Management
(iv) How management (through specific positions and/or management committees) monitors climate-related issues.
- Climate Governance
- Climate Risk Management
Strategy Disclose the actual and potential impacts of climate-related risks and opportunities on the organisations businesses, strategy, and financial planning where such information is material
a) Describe the climate-related risks and opportunities the organisation has identified over the short-, medium-, and long-term.
(i) A description of what they consider to be the relevant short-, medium-and long-term horizons, taking into consideration the useful life of the organisation’s assets or infrastructure and the fact that climate-related issues often manifest themselves over the medium and longer terms.
- Climate Risk Management
(ii) Specific climate-related issues for each time horizon (short-, medium-and long-term) that could have a material financial impact on the organisation and distinguish whether the climate-related risks are physical or transition risks.
- Climate Risk Management
(iii) A description of the process(es) used to determine which risks and opportunities could have a material financial impact on the organisation.
- Climate Risk Management
(iv) Organisations should consider providing a description of their risks and opportunities by sector and/or geography, as appropriate. In describing climate-related issues, organisations should refer to Tables 1 and 2.
- Climate Risk Management
36

C l i m a t e C h a n g e R e s i l i e n c e R e p o r t 2 0 1 7
Core Element
Recommended Disclosure
Guidance for Energy Group
Disclosed in Climate Change Resilience Report
Strategy Disclose the actual and potential impacts of climate-related risks and opportunities on the organisations businesses, strategy, and financial planning where such information is material
b) Describe the impact of climate-related risks and opportunities on the organisation’s businesses, strategy, and financial planning
(i) Organisations should disclose how identified climate-related issues have affected their businesses, strategy, and financial planning.
Organisations should consider including the impact on their businesses and strategy in the following areas:• Products and services,• Supply chain and/or value chain,• Adaptation and mitigation activities,• Investment in research and development,• Operations (including types of operations and location of facilities).
- Corporate Strategy considers climate
(ii) Organisations should describe how climate-related issues serve as an input to their financial planning process, the time period(s) used, and how these risks and opportunities are prioritised.
Organisations’ disclosures should reflect a holistic picture of the interdependencies among the factors that affect their ability to create value over time.Organisations should also consider including in their disclosures the impact on financial planning in the following areas:• Operating costs and revenues,• Capital expenditures and capital allocation,• Acquisitions or divestments,• Access to capital.If climate-related scenarios were used to inform the organisation’s strategy and financial planning, such scenarios should be described.
- Corporate Strategy considers climate
(iii) Supplemental Guidance for Non‑Financial GroupsConsider discussing how climate-related risks and opportunities are integrated into their (1) current decision-making and (2) strategy formulation, including planning assumptions and objectives around climate change mitigation, adaptation, or opportunities such as:• R&D and adoption of new technology,• Existing and committed future activities such as investments,
restructuring, write-downs, or impairment of assets,• Critical planning assumptions around legacy assets, for
example, strategies to lower-carbon, energy, and/or water-intensive operations,
• How GHG emissions, energy, and water issues, if applicable, are considered in capital planning and allocation; this could include a discussion of major acquisitions and divestments, joint-ventures, and investments in technology, innovation, and new business areas in light of changing climate-related risks and opportunities,
• The organisation’s flexibility in positioning/repositioning capital to address emerging climate-related risks and opportunities.
- Corporate Strategy considers climate
c) Describe the resilience of the organisation’s strategy, taking into consideration different climate-related scenarios, including 2°C scenario
Organisations should describe how resilient their strategies are to climate-related risks and opportunities, taking into consideration a transition to a lower-carbon economy consistent with increased physical climate-related risks.Organisations should consider discussing:• where they believe their strategies may be affected by climate-
related risks and opportunities;• how their strategies might change to address such potential risks and
opportunities; and• the climate-related scenarios associated time horizon(s)
considered.
- Climate Scenario Analysis
TC
FD R
eference Guide
37

Core Element
Recommended Disclosure
Guidance for Energy Group
Disclosed in Climate Change Resilience Report
Strategy Disclose the actual and potential impacts of climate-related risks and opportunities on the organisations businesses, strategy, and financial planning where such information is material
Supplemental Guidance for Non‑Financial GroupsOrganisation’s with more than one billion USD in annual revenue should consider conducting more robust scenario analysis to assess the resilience of their strategies against a range of climate-related scenarios, including a 2oC or lower scenario and, where relevant to the organisation, scenarios consistent with increased physical climate-related risks.Organisations should consider discussing the implications of different policy assumptions, macro-economic trends, energy pathways, and technology assumptions used in publicly available climate-related scenarios to assess the resilience of their strategies.For the climate-related scenarios used, organisations should consider providing information on the following factors to allow investors and others to understand how conclusions were drawn from scenario analysis:• Critical input parameters, assumptions, and analytical choices for
the climate-related scenarios used, particularly as they relate to key areas such as policy assumptions, energy deployment pathways, technology pathways, and related timing assumptions,
• Potential qualitative or quantitative financial implications of the climate-related scenarios, if any.
- Climate Scenario Analysis
Risk Management Disclose how the organisation identifies, assesses, and manages climate-related risks
a) Describe the organisation’s processes for identifying and assessing climate-related risks.
(i) Organisations should describe their risk management processes for identifying and assessing climate-related risks. An important aspect of this description is how organisations determine the relative significance of climate-related risks in relation to other risks.
- Climate Risk Management
(ii) Organisations should describe whether they consider existing and emerging regulatory requirements related to climate change (e.g. limits on emissions) as well as other relevant factors considered.
- Climate Risk Management
(iii) Organisations should also consider disclosing the following: • processes for assessing the potential size and scope of
identified climate-related risks and, • definitions of risk terminology used or references to existing
risk classification frameworks used.
- Climate Risk Management
b) Describe the organisation’s processes for managing climate-related risks.
Organisations should describe their processes for managing climate-related risks, including how they make decisions to mitigate, transfer, accept, or control those risks. In addition, organisations should describe their processes for prioritizing climate-related risks, including how materiality determinations are made within their organisations.
- Climate Risk Management
c) Describe how processes for identifying, assessing, and managing climate-related risks are integrated into the organisation’s overall risk management.
Organisations should describe how their processes for identifying, assessing, and managing climate-related risks are integrated into their overall risk management.
- Climate Risk Management
T C F D R e f e r e n c e G u i d e
38

C l i m a t e C h a n g e R e s i l i e n c e R e p o r t 2 0 1 7
Core Element
Recommended Disclosure
Guidance for Energy Group
Disclosed in Climate Change Resilience Report
Metrics and TargetsDisclose the metrics and targets used to assess and manage relevant climate-related risks and opportunities where such information is material
a) Disclose the metrics used by the organisation to assess climate-related risks and opportunities in line with its strategy and risk management process.
(i) Organisations should provide the key metrics used to measure and manage climate-related risks and opportunities. Organisations should consider including metrics on climate-related risks associated with water, energy, landuse, and waste management where relevant and applicable.
Where climate-related issues are material, organisations should consider describing whether and how related performance metrics are incorporated in to remuneration policies.
Where relevant, organisations should provide their internal carbon prices as well as climate-related opportunity metrics such as revenue from products and services designed for a low-carbon economy.
Metrics should be provided for historical periods to allow for trend analysis. In addition, where not apparent, organisations should provide a description of the methodologies used to calculate or estimate climate-related metrics.
- Climate Risk Controls
- Climate Metrics
Supplemental Guidance for Non‑Financial Groups (ii) For all relevant metrics, Energy Group organisations should
consider providing historical trends and forward-looking projections (by relevant country and/or jurisdiction, business line, or asset type).
- Climate Scenario Analysis Signposts
(iii) Organisations should also consider disclosing metrics that support their scenario analysis and strategic planning process and that are used to monitor the organisation’s business environment from a strategic and risk management perspective.
- Climate Metrics
- Climate Scenario Analysis Signposts
(iv) Energy Group organisations should consider providing key metrics related to GHG emissions, energy, water, land use and, if relevant, low-carbon alternatives that address potential financial aspects of shifting demand, cost of supply, reserves, and capital allocation.
- Portfolio Impacts
b) Disclose Scope 1, Scope 2, and, if appropriate, Scope 3 greenhouse gas (GHG) emissions, and the related risks.
(i) Organisations should provide their Scope 1 and Scope 2 GHG emissions and, if appropriate, Scope 3 GHG emissions and the related risks. GHG emissions should be calculated in line with the GHG Protocol methodology to allow for aggregation and comparability across organisations and jurisdictions.
As appropriate, organisations should consider providing related, generally accepted industry-specific GHG efficiency ratios.
Not included in Climate Change Resilience Report. This can be found be in the Social Responsibility Report.
c) Describe the targets used by the organisation to manage climate-related risks and opportunities and performance against targets.
Organisations should describe their key climate-related targets such as those related to GHG emissions, water usage, energy usage, etc., in line with anticipated regulatory requirements or market constraints or other goals. Other goals may include efficiency or financial goals, financial loss tolerances, avoided GHG emissions through the entire product life cycle, or net revenue goals for products and services designed for a low-carbon economy. In describing their targets, organisations should consider including the following: whether the target is absolute or intensity based; time frames over which the target applies; base year from which progress is measured and key performance indicators used to assess progress against targets. Where not apparent, organisations should provide a description of the methodologies used to calculate targets and measures.
- Climate Metrics, Targets and Indicators
Core Element
Recommended Disclosure
Guidance for Energy Group
Disclosed in Climate Change Resilience Report
Strategy Disclose the actual and potential impacts of climate-related risks and opportunities on the organisations businesses, strategy, and financial planning where such information is material
Supplemental Guidance for Non‑Financial GroupsOrganisation’s with more than one billion USD in annual revenue should consider conducting more robust scenario analysis to assess the resilience of their strategies against a range of climate-related scenarios, including a 2oC or lower scenario and, where relevant to the organisation, scenarios consistent with increased physical climate-related risks.Organisations should consider discussing the implications of different policy assumptions, macro-economic trends, energy pathways, and technology assumptions used in publicly available climate-related scenarios to assess the resilience of their strategies.For the climate-related scenarios used, organisations should consider providing information on the following factors to allow investors and others to understand how conclusions were drawn from scenario analysis:• Critical input parameters, assumptions, and analytical choices for
the climate-related scenarios used, particularly as they relate to key areas such as policy assumptions, energy deployment pathways, technology pathways, and related timing assumptions,
• Potential qualitative or quantitative financial implications of the climate-related scenarios, if any.
- Climate Scenario Analysis
Risk Management Disclose how the organisation identifies, assesses, and manages climate-related risks
a) Describe the organisation’s processes for identifying and assessing climate-related risks.
(i) Organisations should describe their risk management processes for identifying and assessing climate-related risks. An important aspect of this description is how organisations determine the relative significance of climate-related risks in relation to other risks.
- Climate Risk Management
(ii) Organisations should describe whether they consider existing and emerging regulatory requirements related to climate change (e.g. limits on emissions) as well as other relevant factors considered.
- Climate Risk Management
(iii) Organisations should also consider disclosing the following: • processes for assessing the potential size and scope of
identified climate-related risks and, • definitions of risk terminology used or references to existing
risk classification frameworks used.
- Climate Risk Management
b) Describe the organisation’s processes for managing climate-related risks.
Organisations should describe their processes for managing climate-related risks, including how they make decisions to mitigate, transfer, accept, or control those risks. In addition, organisations should describe their processes for prioritizing climate-related risks, including how materiality determinations are made within their organisations.
- Climate Risk Management
c) Describe how processes for identifying, assessing, and managing climate-related risks are integrated into the organisation’s overall risk management.
Organisations should describe how their processes for identifying, assessing, and managing climate-related risks are integrated into their overall risk management.
- Climate Risk Management
TC
FD R
eference Guide
39

Transparency Report
Climate Change Report
VPSHR Report
Enquiries and feedback on this report and its content is welcome.Please contact the Oil Search social responsibility team on:
Social Responsibility Microsite
2 0 1 7 S O C I A L R E S P O N S I B I L I T Y R E P O R T S
Picture TBC
T R A N S P A R E N C Y R E P O R T
2 0 1 7
C L I M A T E C H A N G E R E P O R T
2 0 1 7
C L I M A T E C H A N G E R E P O R T 2 0 1 7
V O L U N T A R Y P R I N C I P L E S O N S E C U R I T Y A N D H U M A N R I G H T S
A N N U A L R E P O R T T O T H E V P S H R I N I T I A T I V E 2 0 1 7
Social Responsibility Report
40

Designed and produced by Helicopter Creative www.helicoptercreative.com.au
