climate change may restrict dryland forest … change may restrict dryland forest regeneration in...
TRANSCRIPT

1548
Climate change may restrict dryland forest regeneration in the 21st century
M. D. Petrie,1,2,6 J. B. BraDforD,1 r. M. HuBBarD,3 W. K. LauenrotH,4 C. M. anDreWs,1 anD D. r. sCHLaePfer5
1US Geological Survey, Southwest Biological Science Center, Room #202, 525 S. Beaver Street #5614, Flagstaff, Arizona 86011 USA
2Department of Plant and Environmental Sciences, New Mexico State University, MSC 3JER, Las Cruces, New Mexico 88003 USA3USDA Forest Service, Rocky Mountain Research Station, 240 West Prospect Road, Fort Collins, Colorado 80526 USA
4School of Forestry and Environmental Studies, Yale University, New Haven, Connecticut 06511 USA5Section of Conservation Biology, Department of Environmental Sciences, University of Basel,
St. Johanns-Vorstadt 10, CH-4056, Basel, Switzerland
Abstract. The persistence and geographic expansion of dryland forests in the 21st century will be influenced by how climate change supports the demographic processes associated with tree regeneration. Yet, the way that climate change may alter regeneration is unclear. We developed a quantitative framework that estimates forest regeneration potential (RP) as a function of key environmental conditions for ponderosa pine, a key dryland forest species. We integrated meteorological data and climate projections for 47 ponderosa pine forest sites across the western United States, and evaluated RP using an ecosystem water balance model. Our primary goal was to contrast conditions supporting regeneration among historical, mid- 21st century and late- 21st century time frames. Future climatic conditions supported 50% higher RP in 2020–2059 relative to 1910–2014. As temperatures increased more substantially in 2060–2099, seedling survival decreased, RP declined by 50%, and the frequency of years with very low RP increased from 25% to 58%. Thus, climate change may initially support higher RP and increase the likelihood of successful regeneration events, yet will ultimately reduce average RP and the frequency of years with moderate climate support of regeneration. Our results suggest that climate change alone may begin to restrict the persistence and expansion of dryland forests by limiting seedling survival in the late 21st century.
Key words: climate change; demographics; persistence; ponderosa pine; regeneration.
introDuCtion
Dryland forests are facing biotic and abiotic threats to their persistence in the 21st century. Over the past 50 yr, these forests have experienced disturbance events outside their normal historical range of variability, including fire (Savage and Mast 2005, Parker et al. 2006, Hurteau et al. 2014), insect outbreaks (Parker et al. 2006, Briggs et al. 2015), and drought (Breshears et al. 2005, van Mantgem et al. 2009, Allen et al. 2010, Williams et al. 2013). As the prevalence and rate of disturbance and associated tree mortality continues to increase, the ability of dryland forests to persist in their current geographic ranges and to colonize new habitats may decline (Bell et al. 2014b, Rehfeldt et al. 2014b), and their persistence will be increas-ingly dependent on tree regeneration. In the 20th century, regeneration was episodic and limited to infrequent periods of favorable climatic and environmental condi-tions (Savage et al. 1996, Mast et al. 1999, Brown and Wu 2005). Climate variability may therefore play an important role in forest recovery from disturbance and in natural
forest regeneration (Savage et al. 1996, Mast et al. 1999, Brown and Wu 2005). Forest regeneration is subject to many factors including physiological processes, landscape alteration, competition, and environmental conditions (Montes- Helu et al. 2009, Rehfeldt et al. 2014b), yet the role of climate variability and anticipated climate change on natural forest regeneration remains relatively under-studied and not well- quantified (Rother et al. 2015, Petrie et al. 2016). We propose that this uncertainty portends an important question: Will climate change produce condi-tions that are unsuitable for dryland forest regeneration?
Modeling and empirical studies suggest that the climate- driven niche space of dryland forests will decline in the 21st century (Coops et al. 2005, van Mantgem et al. 2009, Williams et al. 2013), although climate change may support both range expansion and contraction regionally (Bell et al. 2014a). By focusing on the niche space of mature, extant populations under average climate conditions, many studies ignore the regeneration niche—the climatic and environmental conditions that support seed pro-duction, germination and juvenile survival—which ulti-mately controls a population’s long- term persistence (Grubb 1977, Poorter 2007). Physiological requirements for successful seed production, germination and juvenile survival of ponderosa pine (Pinus ponderosa), one of the
Ecology, 98(6), 2017, pp. 1548–1559© 2017 by the Ecological Society of America
Manuscript received 11 November 2016; revised 9 February 2017; accepted 16 February 2017. Corresponding Editor: Rebecca L. McCulley.
6E-mail: [email protected]
CLIMATE MAY RESTRICT REGENERATIONJune 2017 1549
most widespread dryland forest species in North America, suggest that the species’ regeneration niche is constrained to periods of high moisture availability combined with timely intervals of above- average, but not extremely high, temperatures, and thus differs from the niche of mature forests (Savage et al. 1996, 2013, Bell et al. 2014a, Rother et al. 2015, Petrie et al. 2016). In dryland forests, periods of high moisture availability occur infrequently, under-scoring the important geographic restriction imposed by regeneration for tree species. In fact, many dryland tree populations are actually located in cooler and less water- limited climates than those optimal for adult trees (Rehfeldt et al. 1999, 2001). Although variables including soil type, forest stand density, microclimate, herbivory and compe-tition all constrain the regeneration niche (Elliott and White 1987, Wagner et al. 1989, Zabowski et al. 2000, Puhlick et al. 2013), it is clear that dryland forest persis-tence and expansion will only be possible where local climate is also favorable. Thus, understanding the impact of climate change on the regeneration niche of ponderosa pine offers an opportunity to forecast the 21st century dis-tribution of these and other similar dryland forest types.
We postulate that the impact of climate change on the early developmental stages (i.e., regeneration niche) of tree species will play a large, and perhaps primary, role in the 21st century persistence of many forests. Yet, the need to effectively relate periods of high and low temperature and moisture availability to biotic processes such as regener-ation is difficult because average, long- term climate condi-tions are not effective predictors of favorable and unfavorable conditions, which may occur at the extremes of the climate distribution, and at differing time scales (Katz and Brown 1992, Jentsch and Beierkuhnlein 2008, Reichstein et al. 2013). Thus, what is needed to understand current and future patterns of regeneration is an analytical approach that captures the effect of interactions between climate and environmental conditions over long time periods and at high temporal resolution, so the frequency of observing conditions that both support and limit regeneration can be quantified, both historically and in the future.
Here we develop an analytical framework for assessing regeneration in dryland forests using ponderosa pine as an example for assessing the impacts of climate change on regeneration. We deem that published information on regeneration is likely most satisfactory for ponderosa pine among all dryland tree species. In a recent literature review, Petrie et al. (2016) found that germination of ponderosa pine seeds was supported by intermediate temperatures and low moisture stress, and that juvenile survival in the first year was highest when maximum temperatures were warm but not extremely high, and annual rainfall was above- average. Feddema et al. (2013) and Savage et al. (2013) developed a criteria- based approach to estimate regener-ation success in ponderosa pine over five developmental stages, using regeneration periods in the southwestern United States and historical publications to develop and validate their framework. In a recent field study, Rother et al. (2015) found that the survival of juvenile ponderosa
pine in Colorado was inhibited by higher, drought- associated temperatures. The adaptive capacities and phys-iological limitations of tree species and their sub- specific varieties may also result in differing regional response to climate change, especially between populations in the Intermountain Zone and Pacific Northwest of the U.S. (Norris et al. 2006, Aitken et al. 2008, Rehfeldt et al. 2014b). Although the interactive effects of climatic, phenotypic, disturbance, and management components of regeneration are not fully understood, these established relationships provide a basis for quantifying ponderosa pine regener-ation, and to assess how scenarios of future climate change might impact regeneration in ponderosa pine and other dryland tree species compared to historical conditions.
To investigate forest regeneration historically and in the future, we used the SOILWAT ecosystem water balance model to simulate climate and environmental var-iables including air and soil temperature, evaporation and moisture availability for 47 ponderosa pine- dominated sites across the western U.S. from 1910 to 2014, and under scenarios of future climate change from 2020 to 2059 and 2060 to 2099. We evaluated the interannual regeneration potential (RP: quantified as a metric from 0 to 1) of these sites using a criteria- based framework that quantified RP in response to variation in simulated climate and environ-mental variables. Our primary goals were to: (1) develop a quantitative, criteria- based method to evaluate pon-derosa pine RP in response to variation in climate and environmental variables; (2) compare and contrast RP in the 20th century to the 21st century; (3) determine which driving variables and developmental stages were most influential on historical RP, and which are likely to be influential in the future; and (4) to investigate regional dif-ferences in RP between the Intermountain Zone and Pacific Northwest of the U.S. We hypothesized that sim-ulations of future climate change would reduce average RP, and reduce the frequency of periods with high RP, due to lower moisture availability. Conversely, we expected that higher temperatures associated with climate change would support early developmental stages of seed production and germination, but that these positive increases would be offset by reductions in survival in later stages, resulting in lower RP overall.
site DesCriPtion
We examined 47 U.S. Historical Climatology Network (USHCN) sites located in or nearby a ponderosa pine forest in the western U.S. (Appendix S1: Table S1, Fig. S1). Generally, Northwestern ponderosa pine stands expe-rience a more maritime climate, whereas Intermountain stands experience a continental climate with greater vari-ation in air temperature and annual precipitation (Appendix S1: Table S1; Norris et al. 2006, Rehfeldt et al. 2014b). We observed lower mean annual temperature (MAT: °C) and higher mean annual precipitation (MAP: mm) at Northwestern sites and higher MAT and lower MAP at Intermountain sites from 1910 to 2014. There was

1550 Ecology, Vol. 98, No. 6M. D. PETRIE ET AL.
relatively high variation in MAT and MAP within these regions, especially as a result of differences in elevation, which ranged from a low of 69 m in Oregon to a high of 2,643 m in Colorado (Appendix S1: Table S1).
Intermountain Zone ponderosa pine populations are dominated by Rocky Mountain P. ponderosa var. scopu-lorum, whereas Northwestern U.S. and Canadian popu-lations are dominated by Sierra Nevada var. ponderosa (Norris et al. 2006, Rehfeldt et al. 2014a; Fig. 1). The geographic intersection of these sub- specific varieties occurs in western Montana (Norris et al. 2006, Rehfeldt et al. 2014b). These varieties are genetically- distinct and have slightly different sensitivities to temperature (Norris et al. 2006, Rehfeldt et al. 2014c), and slightly larger dif-ferences in their sensitivity to low winter (var. ponderosa) and summer (var. scopulorum) precipitation (Norris et al. 2006). Due to projected changes in climate and the phys-iology of these sub- specific varieties, Rehfeldt et al. (2014b, c) suggest that Rocky Mountain var. scopulorum populations are more likely than var. ponderosa to expe-rience range contraction in coming decades. Information pertaining to the differences between these sub- specific varieties was not adequate to inform separate develop-mental stage criteria for Intermountain and Northwestern regions in our study, yet we looked for differences in climate- supported RP between them.
MateriaLs anD MetHoDs
Site selection and data inputs
We investigated historical ponderosa pine RP across the western U.S. from 1910 to 2014, and using future climate
conditions forecasted by 9 global climate models (GCMs) and two representative concentration pathways (RCPs) from 2020 to 2099. All 47 USHCN stations in our analysis were located within or nearby a ponderosa pine forest, and had gapfilled daily meteorological data from 1910 to 2014 (Williams et al. 2006). We chose sites with data availability in the early 20th century to capture known forest regener-ation events (Critchfield and Elbert 1966, Little 1971, Savage et al. 1996). Our 47 sites were located in the western U.S. states of Arizona (2 sites), California (10), Colorado (5), Idaho (6), Montana (4), New Mexico (5), Oregon (8), South Dakota (1), Washington (4), and Wyoming (2; Williams et al. 2006; Fig. 1; Appendix S1: Table S1). We further verified the location of these sites to be within or nearby a ponderosa pine stand using NatureServe Terrestrial Ecological Systems of the U.S. imagery and imagery from Google Earth (Comer et al. 2003, Sayre et al. 2009, Google Earth 2016).
Developmental stage criteria and scoring
Our regeneration criteria were based on Feddema et al. (2013) and Savage et al.’s (2013) criteria for ponderosa pine developmental stages. Feddema et al. (2013) and Savage et al.’s (2013) criteria were developed from quan-titative and qualitative assessments of conditions that supported historical ponderosa pine establishment. Using these criteria, Feddema et al. (2013) were able to identify past ponderosa pine recruitment events in the southwestern U.S., with the caveat that some of these sites experienced additional influences such as antecedent fire events, and regeneration at these sites was thus not influenced solely by climate variability. Our framework
fig. 1. Ponderosa pine range (in grey) from Little (1971), and site locations in the Intermountain Zone (blue dots) and Pacific Northwest region (red dots). [Colour figure can be viewed at wileyonlinelibrary.com]
CLIMATE MAY RESTRICT REGENERATIONJune 2017 1551
expanded on this in five ways using published, quanti-tative data (Table 1): (1) We increased the number of criteria to 20, and extended the timescale of analysis from 6 to 9 yr, (2) We modified criteria to better capture pub-lished relationships between developmental stages and environmental variables, and to evaluate sites outside the southwestern U.S., (3) We expressed each criterion as a linear regression from 0 to 1 instead of a fixed score from 0 to 5, (4) We estimated potentials from 0 to 1 for each of five developmental stages (Ds) with the average or product of the criterion values instead of adding up scores, and (5) Ds 3 and Ds 4 potentials were calculated for germination events occurring in each month (May–September) of the germination year, and the final value was the total potential from the entire cohort. In Feddema et al. (2013) and Savage et al. (2013), all criteria are additive, such that a positive change in one driving var-iable can mask a negative change in another throughout their entire 16 criteria. By expressing each developmental stage independently and each criterion on a ratio scale, our method diminished this problem and addressed potential interactions.
We used measured meteorological data and simula-tions of environmental variables to inform 20 criteria that influence ponderosa pine seedling development and sur-vival (Table 1). All criteria and developmental stages were expressed on a ratio scale from 0 to 1 (not favorable to highly favorable). We grouped criteria into one of five sep-arate developmental stages for ponderosa pine: tree flow-ering (Ds 1), cone development (Ds 2), germination (Ds 3), seedling survival (Ds 4) and juvenile survival (Ds 5; Table 1). These stages spanned a nine- year moving- window analysis period from adult tree flowering 3 yr before germination to juvenile survival 5 yr after germi-nation. RP was the product of the five developmental stage potentials, and each developmental stage potential was the average (Ds 1–3), product (Ds 5), or average and product (Ds 4) of the climate and environmental criteria within each stage, based on whether the criteria in each developmental stage were expected to support (average) or limit (product) regeneration (Table 1). Thus, RP corre-sponds to the probability of successful seed production, germination and establishment over a 9- yr period: a potential of 0.0 indicated no climatic support for regener-ation, and a potential of 1.0 indicated maximum support for recruitment and survival of the largest potential pop-ulation. We expressed RP for the year of germination; that is, RP in 1950 corresponded to the 9- yr period sur-rounding the 1950 germination year (1947–1955).
SOILWAT analysis and future climate projections
We simulated mean soil temperature (Ts: °C), soil water potential (ψ: MPa), evaporation (E: mm/d) and potential evaporation (Ep: mm/d) at the daily time step for each ponderosa pine site using the SOILWAT ecosystem water balance model (Bradford et al. 2014, Schlaepfer et al. 2015). SOILWAT simulates water interception and
infiltration, evaporation and transpiration, snowmelt, hydraulic redistribution and deep drainage for multiple soil layers, and has been applied in a number of eco-systems to determine the importance of water balance on biotic behavior, including forested ecosystems (Bradford et al. 2014). We obtained soils data for each site from the U.S. Department of Agriculture, Natural Resources Conservation Service STATSGO database (http://water.usgs.gov/GIS/metadata/usgswrd/XML/ussoils.xml). We parametrized the meteorology of each site (cloud cover, wind speed, solar radiation) using monthly National Oceanic and Atmospheric Administration, National Centers for Environmental Information Climate Atlas data (https://www.ncdc.noaa.gov/climate-information/climate-us). We estimated forest density and aboveground biomass (i.e., leaf area) at each site as averages of the nearest three U.S. Department of Agriculture Forest Service Forest Inventory Analysis (FIA) sites with the same ecological classification (http://www.fia.fs.fed.us/). We estimated a uniform litter layer for all sites using average litter values for ponderosa pine forests using the U.S. Department of the Interior and U.S. Department of Agriculture Forest Service Landscape Fire and Resource Management Planning Tools (LANDFIRE) dataset (http://www.landfire.gov/).
For simulations from 1910 to 2014, we used USHCN daily meteorological data of minimum Ta, maximum Ta and daily precipitation to drive SOILWAT (Williams et al. 2006). For simulations from 2020 to 2099, we extracted daily 1/8th- degree downscaled and bias- corrected meteorological projections from the fifth phase of the climate model intercomparison project (CMIP5; Taylor et al. 2012), provided by the Lawrence Livermore National Laboratory (https://www.llnl.gov/). These pro-jections include output from nine GCMs that perform well in the western U.S. (Rupp et al. 2013; Similar results for the southwestern U.S. submitted to the USGS Southwest Biological Science Center), and two RCPs, RCP 4.5 and 8.5, from the Downscaled CMIP3 and CMIP5 Climate and Hydrology Projections archive (http://gdo-dcp.ucllnl.org/downscaled_cmip_projec-tions/; Maurer et al. 2007, Moss et al. 2010). We focused on RCP 8.5, which is the high future emissions scenario and projects a radiative forcing of 8.5 W/m2 at the end of the 21st century (Riahi et al. 2011; Appendix S1: Table S2), and also include results from RCP 4.5, a more mod-erate scenario (Appendix S1: Table S3). We present results for the median regeneration potential from the set of 9 GCMs, and used the first year of each simulation period as a spin up (i.e., 1910, 2019).
To estimate daily minimum soil temperature (Tsmin: °C) for Criteria 10a and 11, and daily maximum soil temper-ature (Tsmax: °C) for Criterion 13 from daily mean values (Table 1), we obtained 30- min soil temperature data for three ponderosa pine sites that are part of the Ameriflux network (http://ameriflux.ornl.gov/). These sites were located in Arizona (US- Fmf, lat: 35.14° N, lon: 111.73° W), California (US- Blo, lat: 38.90° N, lon: 120.63° W)

1552 Ecology, Vol. 98, No. 6M. D. PETRIE ET AL.
taBLe 1. Summary of the criteria associated with each developmental stage in ponderosa pine, including the calculation of values for each criteria on a ratio scale, and for developmental stage potentials and regeneration potential.
CriterionDevelopmental
stage
Year relative to
germination Variable UnitsDepth (cm) Citation Calculation
1 Flowering −3 June GDD °C — Feddema et al. (2013), Savage et al. (2013)
C1 = 10th–90th percentile
2 −3 June Tamin °C – Feddema et al. (2013), Savage et al. (2013)
C2 = 0.2 × Ta + 1.2
3 −3 September–October GDD
°C — Feddema et al. (2013), Savage et al. (2013)
C3 = 10th–90th percentile
4 −2 June–July GDD
°C — Feddema et al. (2013), Savage et al. (2013)
C4 = 10th–90th percentile
Ds1 =XC1−4
5 Cone development
−2 August–October E/Ep
% — Feddema et al. (2013), Savage et al. (2013)
C5 = 4.0 × E/Ep − 2.4
6 −2 August–October GDD
°C — Feddema et al. (2013), Savage et al. (2013)
C6 = 10th–90th percentile
7 −1 July E/Ep % – Feddema et al. (2013), Savage et al. (2013)
C7 = 4.0 × E/Ep – 2.0
8 −1 September–November GDD
°C — Feddema et al. (2013), Savage et al. (2013)
C8 = 10th–90th percentile
9 0 May GDD °C — Feddema et al. (2013), Savage et al. (2013)
C9 = 10th–90th percentile
Ds2 =XC5−9
10a Germination 0 10 d Tsmin °C 5 Pearson (1950), Larson (1961), Schubert (1969), Goodwin (2004), Petrie et al. (2016)
C10a = 0.05 × Ts + 0.0
10b 0 10 d GDD °C — Goodwin (2004), Feddema et al. (2013), Savage et al. (2013)
50th–90th percentile
10c 0 10 d ψ MPa 5 Larson and Schubert (1969), Goodwin (2004), Feddema et al. (2013), Savage et al. (2013), Petrie et al. (2016)
C10c = 1.0 MPa + 1.2
Ds3 =XC10a−c
11 Seedling 0 G- +40 d Tsmin
°C 5 Larson (1967), Penner and Walton (1979), Heidmann (1981), Petrie et al. (2016)
C11 = 0.333 × Ts + 1.0
12 0 G- November ψ
MPa 0–50 Larson (1967), Heidmann and King (1992), Heidmann (1998)
C12 = 0.5 MPa + 1.25
13 0 G- November Tsmax
°C 5 Hare (1961), Hungerford and Babbitt (1987), Rother et al. (2015), Petrie et al. (2016)
C13 = −0.1 × Ts + 4.0
14 0 November ψ
MPa 0–50 Heidmann and King (1992), Heidmann (1998), Feddema et al. (2013), Savage et al. (2013)
C14 = 0.5 MPa + 1.25
Ds4 = 3/4ΠC11–13 + 1/4C14

CLIMATE MAY RESTRICT REGENERATIONJune 2017 1553
and Oregon (US- Me2, lat: 44.45° N, lon: 121.56° W). We calculated mean daily Tsmin and Tsmax at 4–5 cm depth for each site, and for 3–4 yr (US- Fmf from 2007 to 2010, US- Blo from 2004, 2006 to 2007, and US- Me2 from 2009 to 2012). We used linear regressions to estimate the rela-tionship between daily mean Ts, Tsmin and Tsmax as:
and:
resuLts
Average RP was 0.15 ± 0.08 from 1910 to 2014, and Intermountain sites had higher average RP (0.21 ± 0.09; one standard deviation) than Northwestern sites did (0.12 ± 0.07; Appendix S1: Table S2; values for all sites in Appendix S1: Figs. S4–S6). From 1910 to 2014, average RP increased slightly from 0.20 in 1910–1960 to 0.23 in 1960–2014 at Intermountain sites, and from 0.11 in 1910–1960 to 0.13 in 1960–2014 in the Northwest. Sites experi-enced broad variation in RP in 2020–2099, including for example higher average RP, decreasing average RP, and also no change in average RP (Appendix S1: Fig. S1). Within- site variation in RP was also broad; many sites experienced an increase in RP from 2020 to 2059 and a decline from 2060 to 2099 (Appendix S1: Fig. S1b), and others experienced higher interannual variability in RP from 2020 to 2099 due to more frequent years with low RP (Appendix S1: Fig. S1d). Generally, RP displayed a positive but highly variable increase in 2020–2059 by an
average of 50% ± 106% (Appendix S1: Table S2). A reversal in this pattern occurred in 2060–2099, and RP displayed a negative and less variable decline by an average of 50% ± 62% compared to 1910–2014 (Appendix S1: Table S2). RP in Northwestern sites was reduced by an average of 67% ± 50% compared to a 29% ± 76% average reduction in Intermountain sites over this time period (Appendix S1: Table S2).
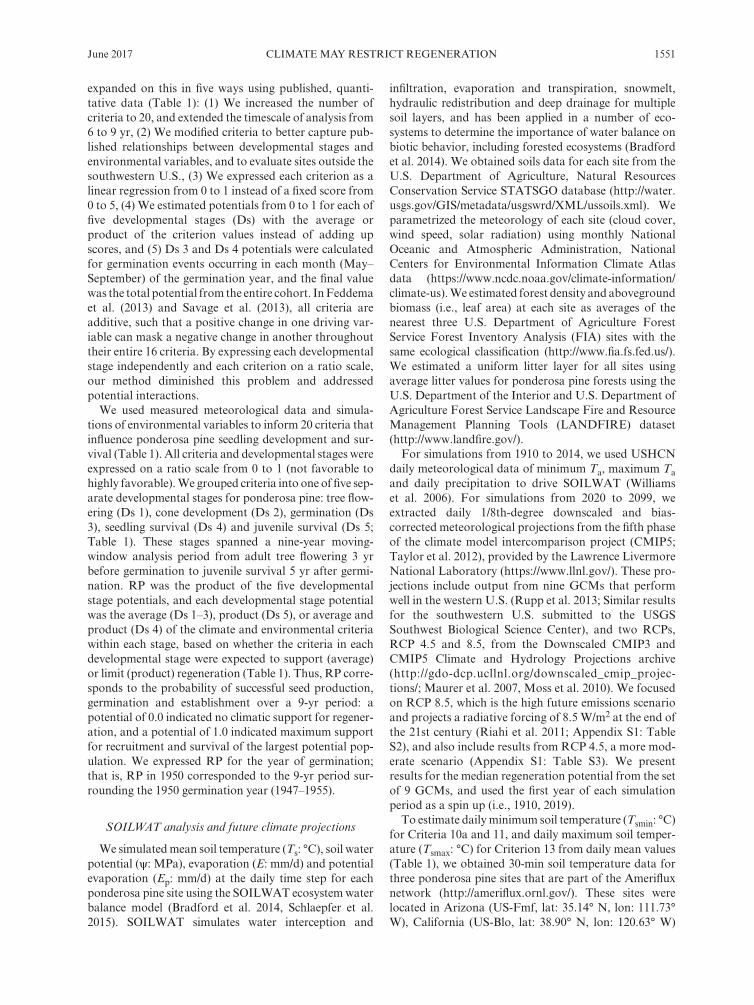
Differences in historical and future RP were the result of increasing temperatures and lower moisture availability under future models of climate change. Climate change increased support for criteria that comprised the flowering (Ds 1), seed production (Ds 2) and germination (Ds 3) developmental stages, all of which were positively- influenced by higher temperatures and only slightly impacted by lower evaporation and moisture availability (Appendix S1: Figs. S2, S3, Table S1; Fig. 2). Average Ds 1–3 potentials increased from ~ 0.6–0.9 in 1910–2014 to ~ 0.9–1.0 in 2020–2099, and were also less variable (Fig. 2; Appendix S1: Table S2). These positive changes in Ds 1–3 that supported RP from 2020 to 2059 were offset by larger negative changes to the seedling (Ds 4) and survival (Ds 5) developmental stages in 2060–2099. Higher temperatures reduced the incidence of frost heaving (Criterion 11) in Ds 5, but also increased the incidence of temperature- and moisture- related mortality (Criteria 13 and 15; Criteria 12, 16–20; Appendix S1: Fig. S2).
Intermountain sites had higher average RP than Northwestern sites from 1910 to 2014, and the magnitude of these differences increased in 2020–2059, and increased further in 2060–2099 (Figs. 3, 4; Appendix S1: Table S2). The southern Intermountain Zone (Arizona, Colorado and New Mexico) experienced the highest average RP in
(1)Tsmin =0.796×T
s−0.488 (R
2=0.96),
(2)Tsmax =1.285×T
s+0.544 (R
2=0.95)
CriterionDevelopmental
stage
Year relative to
germination Variable UnitsDepth (cm) Citation Calculation
15 Survival +1 Tamax °C — Petrie et al. (2016) C15 = −0.067 × Ta + 3.016 +1 ψmin MPa 0–50 Heidmann and King
(1992), Heidmann (1998)
C16 = 0.5 MPa + 1.25
17 +2 ψmin MPa 0–50 Heidmann and King (1992), Heidmann (1998)
C17 = 0.5 MPa + 1.25
18 +3 ψmin MPa 0–50 Heidmann and King (1992), Heidmann (1998)
C18 = 0.5 MPa + 1.25
19 +4 ψmin MPa 0–50 Heidmann and King (1992), Heidmann (1998)
C19 = 0.5 MPa + 1.25
20 +5 ψmin MPa 0–50 Heidmann and King (1992), Heidmann (1998)
C20 = 0.5 MPa + 1.25
Ds5 = ΠC15–20Ensemble 1–20
E = ΠDs1–5
Note: Criteria values for growing degree days (GDD; criteria 1, 3, 4, 6, 8, and 9) are scaled linearly between the 10th percentile (0.0) and the 90th percentile (1.0), based on 1910–2014 averages at each site.
taBLe 1. Continued.
1554 Ecology, Vol. 98, No. 6M. D. PETRIE ET AL.
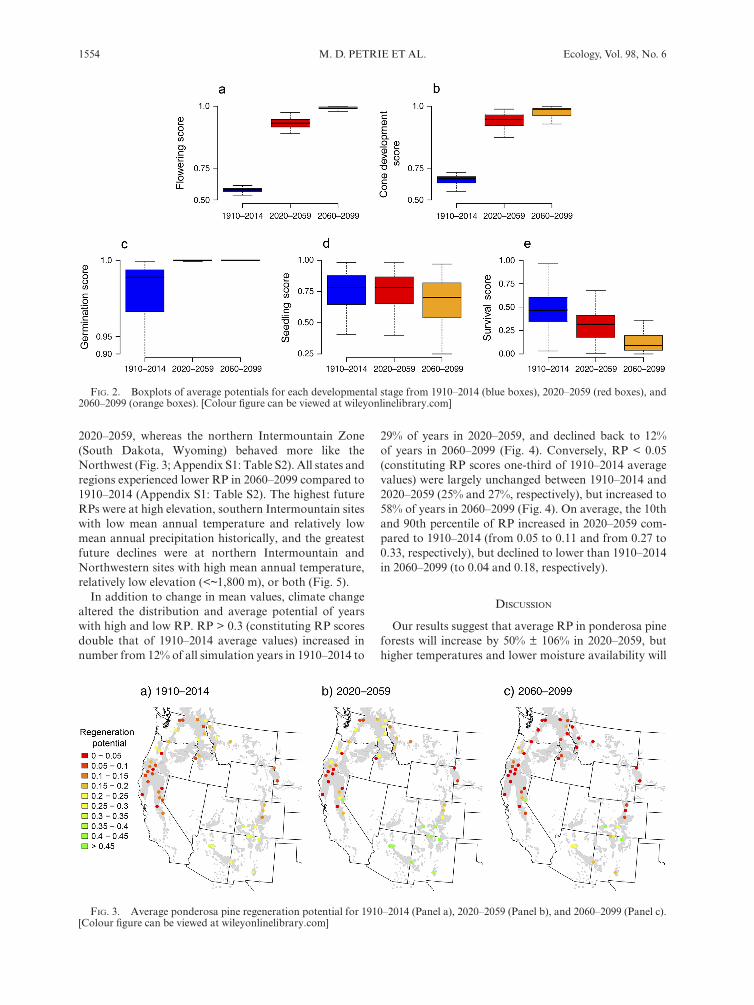
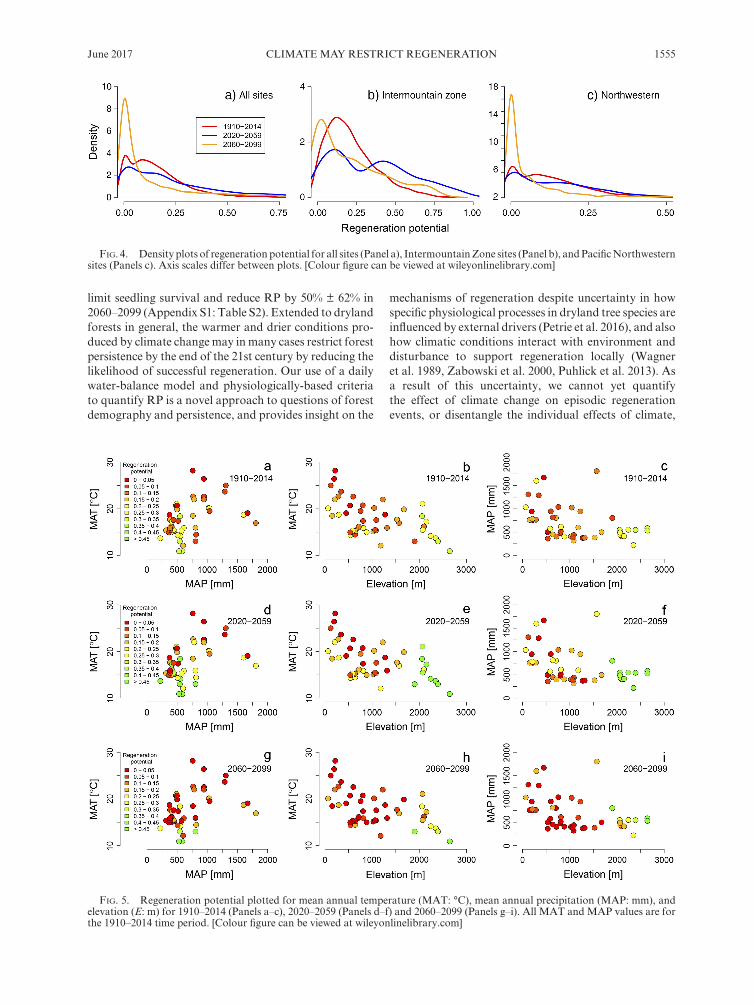
2020–2059, whereas the northern Intermountain Zone (South Dakota, Wyoming) behaved more like the Northwest (Fig. 3; Appendix S1: Table S2). All states and regions experienced lower RP in 2060–2099 compared to 1910–2014 (Appendix S1: Table S2). The highest future RPs were at high elevation, southern Intermountain sites with low mean annual temperature and relatively low mean annual precipitation historically, and the greatest future declines were at northern Intermountain and Northwestern sites with high mean annual temperature, relatively low elevation (<~1,800 m), or both (Fig. 5).
In addition to change in mean values, climate change altered the distribution and average potential of years with high and low RP. RP > 0.3 (constituting RP scores double that of 1910–2014 average values) increased in number from 12% of all simulation years in 1910–2014 to
29% of years in 2020–2059, and declined back to 12% of years in 2060–2099 (Fig. 4). Conversely, RP < 0.05 ( constituting RP scores one- third of 1910–2014 average values) were largely unchanged between 1910–2014 and 2020–2059 (25% and 27%, respectively), but increased to 58% of years in 2060–2099 (Fig. 4). On average, the 10th and 90th percentile of RP increased in 2020–2059 com-pared to 1910–2014 (from 0.05 to 0.11 and from 0.27 to 0.33, respectively), but declined to lower than 1910–2014 in 2060–2099 (to 0.04 and 0.18, respectively).
DisCussion
Our results suggest that average RP in ponderosa pine forests will increase by 50% ± 106% in 2020–2059, but higher temperatures and lower moisture availability will
fig. 2. Boxplots of average potentials for each developmental stage from 1910–2014 (blue boxes), 2020–2059 (red boxes), and 2060–2099 (orange boxes). [Colour figure can be viewed at wileyonlinelibrary.com]
fig. 3. Average ponderosa pine regeneration potential for 1910–2014 (Panel a), 2020–2059 (Panel b), and 2060–2099 (Panel c). [Colour figure can be viewed at wileyonlinelibrary.com]
CLIMATE MAY RESTRICT REGENERATIONJune 2017 1555
limit seedling survival and reduce RP by 50% ± 62% in 2060–2099 (Appendix S1: Table S2). Extended to dryland forests in general, the warmer and drier conditions pro-duced by climate change may in many cases restrict forest persistence by the end of the 21st century by reducing the likelihood of successful regeneration. Our use of a daily water- balance model and physiologically- based criteria to quantify RP is a novel approach to questions of forest demography and persistence, and provides insight on the
mechanisms of regeneration despite uncertainty in how specific physiological processes in dryland tree species are influenced by external drivers (Petrie et al. 2016), and also how climatic conditions interact with environment and disturbance to support regeneration locally (Wagner et al. 1989, Zabowski et al. 2000, Puhlick et al. 2013). As a result of this uncertainty, we cannot yet quantify the effect of climate change on episodic regeneration events, or disentangle the individual effects of climate,
fig. 4. Density plots of regeneration potential for all sites (Panel a), Intermountain Zone sites (Panel b), and Pacific Northwestern sites (Panels c). Axis scales differ between plots. [Colour figure can be viewed at wileyonlinelibrary.com]
fig. 5. Regeneration potential plotted for mean annual temperature (MAT: °C), mean annual precipitation (MAP: mm), and elevation (E: m) for 1910–2014 (Panels a–c), 2020–2059 (Panels d–f) and 2060–2099 (Panels g–i). All MAT and MAP values are for the 1910–2014 time period. [Colour figure can be viewed at wileyonlinelibrary.com]
1556 Ecology, Vol. 98, No. 6M. D. PETRIE ET AL.
environment and disturbance on historical events. Instead, we quantified the climate- driven potential for ponderosa pine regeneration, and did so in a way that is comparable between sites and time periods, and can identify which developmental stages may control dryland forest persistence now and in the future.
There is strong support that climate change will favor higher germination rates (Criterion 10), lower incidence of frost heaving (Criterion 11), and higher incidence of tem-perature- and moisture- related mortality (Criteria 12–13 and 15–20; Table 1; Appendix S1: Table S1). Yet, higher- temperature related disturbances including insect out-breaks and fire may reduce forest canopy cover and support lower nighttime temperatures, increasing the risk of frost heaving in some cases (Savage et al. 2013). The preliminary validation of SOILWAT that we have con-ducted for dryland forest sites suggests that the model may slightly over predict soil moisture during summer by ~ 3–8% volumetrically (not shown), which suggests our predictions of higher moisture- related mortality could in fact be low. The most uncertain of our criteria are the early developmental stages of flowering (Ds 1) and seed pro-duction (Ds 2). It is clear that carbohydrate stores in many tree species are depleted by warmer and drier conditions, to the degree that these trees are unable to produce suffi-cient carbohydrate- based defensive compounds or to stave off carbon starvation during periods of water- limitation (McDowell 2011, Gaylord et al. 2013). Additionally, observed high interannual variability in cone production suggests that carbohydrates required for early develop-mental stages are not maintained at high levels even under favorable conditions (Greene and Johnson 2004, Ichie et al. 2013). Therefore, the large declines in RP we observed may actually be conservative because flowering and cone production may be lower than we have predicted, and moisture- driven mortality may be higher.
We hypothesized that climate change would support early developmental stages and restrict later stages, but we did not anticipate that RP would increase in 2020–2059. To elaborate, ~ 29% of years in 2020–2059 experi-enced RP > 0.3 compared to ~ 12% of years in 1910–2014 (Fig. 4; Appendix S1: Table S2). In 2060–2099, our sim-ulations suggest that the proportion of RP > 0.3 will decline back to ~ 12%, but with a higher proportion of years with very low (<0.05) RP (58% compared to 25%; Fig. 4). Furthermore, the 10th and 90th percentile of RPs will also be lower; that is, the climatic component of epi-sodic recruitment will become less- supported by local climate on average, and the frequency of years with low regeneration will increase.
Under the RCP 8.5 scenario, which proposes increasing greenhouse gas emissions throughout the 21st century (Riahi et al. 2011), we expect climate- supported forest regeneration to be more favorable in the first half of the 21st century, but less favorable in the second. Our results from the RCP 4.5 scenario (more moderate future radi-ative forcing) suggest that the impacts of increasing tem-peratures on RP can be delayed and perhaps to some
degree offset. In these simulations, we found that average RP was nearly identical in 2020–2059 compared to the RCP 8.5 scenario (RCP 4.5 = 0.224 ± 0.155, RCP 8.5 = 0.223 ± 0.158), and was slightly higher in 2060–2099 (RCP 4.5 = 0.11 ± 0.14, RCP 8.5 = 0.08 ± 0.09; Appendix S1: Table S3). It may therefore be possible to delay the adverse effects of climate change on ponderosa pine regeneration by reducing greenhouse gas emissions, although we caution that climate change will progress beyond the 21st century (IPCC 2013).
Our study underscores the need for additional research on the physiology of ponderosa pine and other dryland tree species, as well as these species’ sub- specific varieties. For example, varieties of ponderosa pine (var. ponderosa and var. scopulorum) may exhibit distinct adaptive responses to climate change: Northwestern ponderosa pine dominated by var. ponderosa may be less susceptible to the negative impacts of warmer temperatures and lower moisture availability than Intermountain var. scop-ulorum (Grant et al. 1989, Monson and Grant 1989, Rehfeldt et al. 2014a, b, c). It is possible that these sub-species have different physiological requirements for seed production, germination and survival. Future studies and refinements to our developmental stage criteria would benefit from more detailed physiological infor-mation on how sub- specific varieties differ in their phys-iological requirements for regeneration.
Better understanding of how climate variability influ-ences RP would support and augment techniques to estimate the potential future expansion and contraction of dryland forests, such as species distribution modeling (SDM; Guisan and Zimmermann 2000, Pearson and Dawson 2003, Guisan and Thuiller 2005). We caution that models focusing on long- term average climate con-ditions and their effects on mature populations may in fact be quite imprecise if the success of individual regen-eration events indeed controls persistence and expansion, and if these dynamics are controlled by climate at rela-tively fine temporal scales. Our results suggest that the regeneration niche of ponderosa pine is likely to be most restricted in the Northwestern U.S. and possibly in the northern Intermountain states, although our sample size is small for Wyoming and South Dakota (Fig. 3; Appendix S1: Table S2). It is difficult to disentangle whether the underlying reason for higher RP in the southern Intermountain Zone is that the higher elevation, cooler and wetter sites in this region will be less- negatively impacted by climate change, or if the southern Intermountain Zone will experience climatic change that is more favorable for regeneration (Fig. 5). Despite this uncertainty, elevational migration of low- elevation pon-derosa pine and other dryland tree species may be pro-moted by climate change and implemented as a tool by land managers, although local topography may limit migration success (Bell et al. 2014b). Forest management, including the mechanical thinning of forested stands, may be an additional way to increase the health of dryland forests, and support the likelihood of successful
CLIMATE MAY RESTRICT REGENERATIONJune 2017 1557
regeneration (Sorensen et al. 2011, Zhang et al. 2013, Flathers et al. 2016). Our RP criteria suggest that thinning practices which can increase near- surface moisture avail-ability without increasing surface temperatures could promote seedling survival and germination (Appendix S1: Table S1), and are consistent with a recent study showing that maintaining stands at intermediate density enhances ponderosa pine regeneration (Flathers et al. 2016). By identifying specific demographic processes and developmental stages that are critical for regeneration, and linking these to climate and environmental condi-tions, it will be possible to more effectively constrain the scope and scale of SDMs, field studies, and management approaches, producing a more comprehensive under-standing of how ponderosa pine and other dryland forest persistence may change in the 21st century.
aCKnoWLeDgMents
Portions of this study were funded by a grant from the USDA Forest Service, Western Wildland Environmental Threat Assessment Center. Any use of trade, product, or firm names is for descriptive purposes only and does not imply endorsement by the U.S. Government.
Literature CiteD
Aitken, S., S. Yeaman, J. Holliday, T. Wang, and S. Curtis-McLane. 2008. Adaptation, migration or extirpation: climate change outcomes for tree populations. Evolutionary Appli-cations 1:95–111.
Allen, C., et al. 2010. A global overview of drought and heat- induced tree mortality reveals emerging climate change risks for forests. Forest Ecology and Management 259:660–684.
Bell, D., J. Bradford, and W. Lauenroth. 2014a. Early indica-tors of change: divergent climate envelopes between tree life stages imply range shifts in the western United States. Global Ecology and Biogeography 23:168–180.
Bell, D., J. Bradford, and W. Lauenroth. 2014b. Mountain landscapes offer few opportunities for high- elevation tree species migration. Global Change Biology 20:1441–1451.
Bradford, J., D. Schlaepfer, and W. Lauenroth. 2014. Ecohydrology of adjacent sagebrush and lodgepole pine eco-systems: the consequences of climate change and disturbance. Ecosystems 17:590–605.
Breshears, D. D., et al. 2005. Regional vegetation die- off in re-sponse to global- change- type drought. Proceedings of the National Academy of Sciences USA 102:15144–15148.
Briggs, J., T. Hawbaker, and D. Vandendriesche. 2015. Resilience of ponderosa and lodgepole pine forests to moun-tain pine beetle disturbance and limited regeneration. Forest Science 61:689–702.
Brown, P., and R. Wu. 2005. Climate and disturbance forcing of episodic tree recruitment in a southwestern ponderosa pine landscape. Ecology 86:3030–3038.
Comer, P., et al. 2003. Ecological systems of the United States: a working classification of U.S. terrestrial systems. NatureServe, Arlington, Virginia, USA.
Coops, N., R. Waring, and B. Law. 2005. Assessing the past and future distribution and productivity of ponderosa pine in the Pacific Northwest using a process model, 3- PG. Ecological Modelling 183:107–124.
Critchfield, W., and L. Elbert. 1966. Geographic distribution of the pines of the world. Pages 1–97. Miscellaneous Publication 991, U.S. Department of Agriculture, Washington, D.C., USA.
Elliott, K., and A. White. 1987. Competitive effects of various grasses and forbs on ponderosa pine- seedlings. Forest Science 33:356–366.
Feddema, J., J. Mast, and M. Savage. 2013. Modeling high- severity fire, drought and climate change impacts on pon-derosa pine regeneration. Ecological Modelling 253: 56–69.
Flathers, K., T. Kolb, J. Bradford, K. Waring, and W. Moser. 2016. Long- term thinning alters ponderosa pine reproduction in northern Arizona. Forest Ecology and Management 374:154–165.
Gaylord, M., T. Kolb, W. Pockman, J. Plaut, E. Yepez, A. Macalady, R. Pangle, and N. McDowell. 2013. Drought predisposes pinon- juniper woodlands to insect attacks and mortality. New Phytologist 198:567–578.
Goodwin, K. 2004. Modeling natural regeneration of ponder-osa pines on the Coconino National Forest in Arizona. Dissertation. Page 129. Northern Arizona University, Flagstaff, Arizona, USA.
Google Earth. 2016. Imagery of the western United States. Google Inc. http://maps.google.com
Grant, M., Y. Linhart, and R. Monson. 1989. Experimental studies of ponderosa pine 2. Quantitative genetics of morphological traits. American Journal of Botany 76: 1033–1040.
Greene, D., and E. Johnson. 2004. Modelling the temporal var-iation in the seed production of North American trees. Canadian Journal of Forest Research 34:65–75.
Grubb, P. 1977. Maintenance of species- richness in plant communities – importance of regeneration niche. Biological Reviews of the Cambridge Philosophical Society 52: 107–145.
Guisan, A., and W. Thuiller. 2005. Predicting species distribu-tion: offering more than simple habitat models. Ecology Letters 8:993–1009.
Guisan, A., and N. Zimmermann. 2000. Predictive habitat distribution models in ecology. Ecological Modelling 135: 147–186.
Hare, R. 1961. Heat effects on live plants. Occasional Paper 183, USDA Forest Service, SFES.
Heidmann, L. 1981. Overcoming temperature-dependent dor-mancy of southwestern ponderosa pine seed. Page 4. Research Note, RM-406, U.S. Forest Service, Rocky Mountain Forest and Range Experiment Station, Fort Collins, Colorado, USA.
Heidmann, L. 1998. Forest regeneration research at Fort Valley. RMRS-P-55, Pages 25–37. U.S. Department of Agriculture, Forest Service, Rocky Mountain Research Station, Fort Collins, Colorado, USA.
Heidmann, L., and R. King. 1992. Effect of prolonged drought on water relations of ponderosa pine seedlings grown in basalt and sedimentary soils. Page 8. Res. Pap. RM-301, U.S. Department of Agriculture, Forest Service, Rocky Mountain Forest and Range Experiment Station, Fort Collins, Colorado, USA.
Hungerford, R., and R. Babbitt. 1987. Overstory removal and residue treatments affect soil surface, air, and soil tempera-ture: implications for seedling survival. Page 19. Research Paper INT-377, USDA Forest Service, Ogden, Utah, USA.
Hurteau, M., J. Bradford, P. Fule, A. Taylor, and K. Martin. 2014. Climate change, fire management, and ecological services in the southwestern US. Forest Ecology and Manage-ment 327:280–289.
Ichie, T., S. Igarashi, S. Yoshida, T. Kenzo, T. Masaki, and I. Tayasu. 2013. Are stored carbohydrates necessary for seed production in temperate deciduous trees? Journal of Ecology 101:525–531.
1558 Ecology, Vol. 98, No. 6M. D. PETRIE ET AL.
IPCC. 2013. Climate change 2013: I. The physical science basis. Cambridge University Press, London, UK.
Jentsch, A., and C. Beierkuhnlein. 2008. Research frontiers in climate change: effects of extreme meteorological events on ecosystems. Comptes Rendus Geoscience 340:621–628.
Katz, R., and B. Brown. 1992. Extreme events in a changing climate – variability is more important than averages. Climatic Change 21:289–302.
Larson, M. 1961. Seed size, germination dates, and survival re-lationships of ponderosa pine in the Southwest. Page 4. RMRS Res. Note 66, USDA Forest Service, Fort Collins, Colorado, USA.
Larson, M. 1967. Effect of temperature on initial development of ponderosa pine seedlings from three tree sources. Forest Science 13:286–294.
Larson, M., and G. H. Schubert. 1969. Effect of osmotic water stress on germination and initial development of ponderosa pine seedlings. Forest Science 15:30–36.
Little, E. 1971. Atlas of United States trees, volume 1, conifers and important hardwoods. Pages 1–9. Miscellaneous Publication 1146, U.S. Department of Agriculture.
Mast, J., P. Fule, M. Moore, W. Covington, and A. Waltz. 1999. Restoration of presettlement age structure of an Arizona ponderosa pine forest. Ecological Applications 9:228–239.
Maurer, E., L. Brekke, T. Pruitt, and P. Duffy. 2007. Fine- resolution climate projections enhance regional climate change impact studies. Eos, Transactions, American Geo-physical Union 88:504.
McDowell, N. 2011. Mechanisms linking drought, hydraulics, carbon metabolism, and vegetation mortality. Plant Physiology 155:1051–1059.
Monson, R., and M. Grant. 1989. Experimental studies of pon-derosa pine. III. Differences in photosynthesis, stomatal con-ductance, and water- use efficiency between two genetic lines. American Journal of Botany 76:1041–1047.
Montes-Helu, M., T. Kolb, S. Dore, B. Sullivan, S. Hart, G. Koch, and B. Hungate. 2009. Persistent effects of fire- induced vegetation change on energy partitioning and evapo-transpiration in ponderosa pine forests. Agricultural and Forest Meteorology 149:491–500.
Moss, R., et al. 2010. The next generation of scenarios for climate change research and assessment. Nature 463: 747–756.
Norris, J., S. Jackson, and J. Betancourt. 2006. Classification tree and minimum- volume ellipsoid analyses of the distribu-tion of ponderosa pine in the western USA. Journal of Biogeography 33:342–360.
Parker, T., K. Clancy, and R. Mathiasen. 2006. Interactions among fire, insects and pathogens in coniferous forests of the interior western United States and Canada. Agricultural and Forest Entomology 8:167–189.
Pearson, G. 1950. Management of ponderosa pine in the Southwest. Page 218. Monograph 6, USDA, Washington, D.C., USA.
Pearson, R., and T. Dawson. 2003. Predicting the impacts of climate change on the distribution of species: are bioclimate envelope models useful? Global Ecology and Biogeography 12:361–371.
Penner, E., and T. Walton. 1979. Effects of temperature and pressure on frost heaving. Engineering Geology 13:29–39.
Petrie, M., A. Wildeman, J. Bradford, R. Hubbard, and W. Lauenroth. 2016. A review of precipitation and tempera-ture control on seedling emergence and establishment for ponderosa and lodgepole pine forest regeneration. Forest Ecology and Management 361:328–338.
Poorter, L. 2007. Are species adapted to their regeneration niche, adult niche, or both? American Naturalist 169:433–442.
Puhlick, J., M. Moore, and A. Weiskittel. 2013. Factors influ-encing height- age relationships and recruitment of ponderosa pine regeneration in Northern Arizona. Western Journal of Applied Forestry 28:91–96.
Rehfeldt, G., B. Jaquish, J. Lopez-Upton, C. Saenz-Romero, J. St Clair, L. Leites, and D. Joyce. 2014a. Comparative genetic responses to climate for the varieties of Pinus ponder-osa and Pseudotsuga menziesii: realized climate niches. Forest Ecology and Management 324:126–137.
Rehfeldt, G., B. Jaquish, C. Saenz-Romero, D. Joyce, L. Leites, J. St Clair, and J. Lopez-Upton. 2014b. Comparative genetic responses to climate in the varieties of Pinus ponderosa and Pseudotsuga menziesii: reforestation. Forest Ecology and Management 324:147–157.
Rehfeldt, G., L. Leites, J. St Clair, B. Jaquish, C. Saenz-Romero, J. Lopez-Upton, and D. Joyce. 2014c. Comparative genetic responses to climate in the varieties of Pinus ponderosa and Pseudotsuga menziesii: clines in growth potential. Forest Ecology and Management 324:138–146.
Rehfeldt, R., G. E. Wykoff, and C. Ying. 2001. Physiologic plasticity, evolution, and impacts of a changing climate in Pinus contorta. Climatic Change 50:355–376.
Rehfeldt, G., C. Ying, D. Spittlehouse, and D. Hamilton. 1999. Genetic responses to climate in Pinus contorta: niche breadth, climate change, and reforestation. Ecological Monographs 69:375–407.
Reichstein, M., et al. 2013. Climate extremes and the carbon cycle. Nature 500:287–295.
Riahi, K., S. Rao, V. Krey, C. Cho, V. Chirkov, G. Fischer, G. Kindermann, N. Nakicenovic, and P. Rafaj. 2011. RCP 8.5: a scenario of comparatively high greenhouse gas emis-sions. Climatic Change 109:33–57.
Rother, M., T. Veblen, and L. Furman. 2015. A field experi-ment informs expected patterns of conifer regeneration after disturbance under changing climate conditions. Canadian Journal of Forest Research 45:1607–1616.
Rupp, D., J. Abatzoglou, K. Hegewisch, and P. Mote. 2013. Evaluation of CMIP5 20th century climate simulations for the Pacific Northwest USA. Journal of Geophysical Research – Atmospheres 118:10884–10906.
Savage, M., P. Brown, and J. Feddema. 1996. The role of cli-mate in a pine forest regeneration pulse in the southwestern United States. Ecoscience 3:310–318.
Savage, M., and J. Mast. 2005. How resilient are southwestern ponderosa pine forests after crown fires? Canadian Journal of Forest Research 35:967–977.
Savage, M., J. Mast, and J. Feddema. 2013. Double whammy: high- severity fire and drought in ponderosa pine forests of the Southwest. Canadian Journal of Forest Research 43: 570–583.
Sayre, R., P. Comer, H. Warner, and J. Cress. 2009. A new map of standardized terrestrial ecosystems of the conterminous United States. Page 17. Professional Paper 1768, U.S. Geo-logical Survey.
Schlaepfer, D., K. Taylor, V. Pennington, K. Nelson, T. Martyn, C. Rottler, W. Lauenroth, and J. Bradford. 2015. Simulated big sagebrush regeneration supports predicted changes at the trailing and leading edges of distri-bution shifts. Ecosphere 6. https://doi.org/10.1890/ES14- 00208.1
Schubert, G. 1969. Ponderosa pine regeneration problems in the Southwest. Regeneration of Ponderosa Pine Symposium. Oregon State University, Corvallis, Oregon, USA.
Sorensen, C., A. Finkral, T. Kolb, and C. Huang. 2011. Short- and long- term effects of thinning and prescribed fire on carbon stocks in ponderosa pine stands in northern Arizona. Forest Ecology and Management 261:460–472.

CLIMATE MAY RESTRICT REGENERATIONJune 2017 1559
Taylor, K., R. Stouffer, and G. Meehl. 2012. An overview of CMIP5 and the experiment design. Bulletin of the American Meteorological Society 93:485–498.
van Mantgem, P. J., et al. 2009. Widespread increase of tree mor-tality rates in the western United States. Science 323:521–524.
Wagner, R., T. Petersen, D. Ross, and S. Radosevich. 1989. Competition thresholds for the survival and growth of pon-derosa pine seedlings associated with woody and herbaceous vegetation. New Forests 3:151–170.
Williams Jr., C., R. Vose, D. Easterling, and M. Menne. 2006. United States historical climatology network daily tempera-ture, precipitation, and snow data. Tech. Rep. ORNL/CDIAC-118, NDP-070, Carbon Dioxide Information Analysis
Center, Oak Ridge National Laboratory, Oak Ridge, Ten-nessee, USA.
Williams, A. P., et al. 2013. Temperature as a potent driver of regional forest drought stress and tree mortality. Nature Climate Change 3:292–297.
Zabowski, D., B. Java, G. Scherer, R. Everett, and R. Ottmar. 2000. Timber harvesting residue treatment: Part 1. Responses of conifer seedlings, soils and microclimate. Forest Ecology and Management 126:25–34.
Zhang, J., M. Ritchie, D. Maguire, and W. Oliver. 2013. Thinning ponderosa pine (Pinus ponderosa) stands reduces mortality while maintaining stand productivity. Canadian Journal of Forest Research 43:311–320.
suPPorting inforMation
Additional supporting information may be found in the online version of this article at http://onlinelibrary.wiley.com/doi/10.1002/ecy.1791/suppinfo