climate change impacts on irrigation water requirements: effects of mitigation, 1990–2080
TRANSCRIPT

Technological Forecasting & Social Change 74 (2007) 1083–1107
Climate change impacts on irrigation water requirements:Effects of mitigation, 1990–2080
Günther Fischer a,⁎, Francesco N. Tubiello a,b,Harrij van Velthuizen a, David A. Wiberg a
a Land-Use Change and Agriculture Program at the International Institute for Applied Systems Analysis (IIASA),Laxenburg, Austria
b Goddard Institute for Space Studies, Columbia University, New York, NY, USA
Received 7 February 2006; received in revised form 10 May 2006; accepted 24 May 2006
Abstract
Potential changes in global and regional agricultural water demand for irrigation were investigated within a newsocio-economic scenario, A2r, developed at the International Institute for Applied Systems Analysis (IIASA) withand without climate change, with and without mitigation of greenhouse gas emissions. Water deficits of crops weredeveloped with the Food and Agriculture Organization (FAO)–IIASA Agro-ecological Zone model, based on dailywater balances at 0.5° latitude×0.5° longitude and then aggregated to regions and the globe. Future regional andglobal irrigation water requirements were computed as a function of both projected irrigated land and climatechange and simulations were performed from 1990 to 2080. Future trends for extents of irrigated land, irrigationwater use, and withdrawals were computed, with specific attention given to the implications of climate changemitigation. Renewable water-resource availability was estimated under current and future climate conditions.Results suggest that mitigation of climate change may have significant positive effects compared with unmitigatedclimate change. Specifically, mitigation reduced the impacts of climate change on agricultural water requirementsby about 40%, or 125–160billionm3 (Gm3) compared with unmitigated climate. Simple estimates of futurechanges in irrigation efficiency and water costs suggest that by 2080 mitigation may translate into annual costreductions of about 10billion US$.© 2006 Elsevier Inc. All rights reserved.
Keywords: Water; Agriculture; Irrigation; Climate change; Mitigation
⁎ Corresponding author.E-mail addresses: [email protected] (G. Fischer), [email protected] (F.N. Tubiello), [email protected] (H. van Velthuizen).
0040-1625/$ - see front matter © 2006 Elsevier Inc. All rights reserved.doi:10.1016/j.techfore.2006.05.021

1084 G. Fischer et al. / Technological Forecasting & Social Change 74 (2007) 1083–1107
1. Introduction
Water is a key driver of agricultural production and its most precious input. Since the very beginning ofplant cultivation, over 10,000years ago, irrigation water has enabled farmers to increase crop yields byreducing their dependence on rainfall patterns, thus boosting the average crop production whiledecreasing the interannual variability [1,2]. Today, the irrigated area has expanded to over 270Mhaworldwide, about 18% of total cultivated land. Agriculture is the largest user of water among humanactivities: irrigation water withdrawals are 70% of the total anthropogenic use of renewable waterresources – about 2630Gm3/year (Gm3/year) out of 3815Gm3/year (Table 1). An estimated 50% ofagricultural water withdrawals (AWWs) reach the crops – the remainder is lost in irrigation infrastructures(e.g., leaking and/or evaporating from irrigation canals and pipes). Irrigated crops produce about 40% oftotal agricultural output; their yields are typically twice those of rain-fed crops. For instance, the Food andAgriculture Organization (FAO) estimated that irrigated cereals produce yearly about 60% of a total of1.2Gt in the developing countries [3]; globally-averaged irrigated cereal yields for developing countriesare thus 3.9tons/ha, compared with roughly 1.8tons/ha under rain-fed conditions [3].
In addition to the direct impacts of climate change on crop production [4,5], there is concern aboutfuture agricultural water requirements vis-à-vis water availability under the combined effects of climatechange, growing population demands, and competition from other economic sectors under future socio-economic development. Renewable water resources are being increasingly recognized as essential to thesustainability of human societies in coming decades, just as increasing numbers of people live in water-scarce conditions [6–8].
Table 1Year 2000 statistics used for calibration in AEZ–BLS
Cultivated land Irrig. % Irrig. land WRQ AWW Irreff TWW % AW WRI
WORLD 1540 17.6 271 1350 2630 0.51 3816 69 43,006MDC 632 10.9 69 255 523 0.49 1215 43 13,999LDC 908 22.3 202 1095 2106 0.52 2602 81 29,007NAM 235 10.5 25 107 203 0.53 525 39 5650WEU 103 17.2 18 53 107 0.50 269 40 2221PAO 56 9.1 5 16 44 0.37 114 38 1249EEU+FSU 263 9.8 26 98 197 0.49 344 57 4879AFR 204 3.8 8 45 91 0.50 101 90 2959LAM 172 11.5 20 82 187 0.44 265 71 13,413MEA 75 26.6 20 169 254 0.67 283 90 1072CPA 146 39.6 58 213 496 0.43 736 67 3622SAS 200 39.1 78 496 852 0.58 951 90 2547PAS 70 17.8 12 65 185 0.35 207 89 4107
From first to last column: (1) Cultivated land for the year 2000 (Mha); (2) Shares (%) of irrigated land in total cultivated land forthe year 2000; (3) Irrigated land (Mha); (4) Results of AEZ computations of net irrigation water requirements (WRQ, Gm3 year);(5) FAOAQUASTATstatistics on average 1998–2002 agricultural water withdrawals (AWW, Gm3year); (6) Irrigation efficiency(Irreff); (7) Total water withdrawals (TWW, Gm3year); (8) Agricultural share (%) of water withdrawals; and (9) Renewableinternal water resources (WRI, Gm3year).MDC, developed countries; LDC, developing countries; NAM, North America; WEU, Other developed countries (mainly Europe, includingTurkey); PAO, Developed Pacific Asia; EEU+FSU, Eastern Europe and former USSR; AFR, Sub-Saharan Africa; LAM, Latin America; MEA,Middle East and North Africa; CPA, East Asia; SAS, South Asia; PAS, Developing countries in Southeast Asia.
1085G. Fischer et al. / Technological Forecasting & Social Change 74 (2007) 1083–1107
With respect to agriculture, considerable research has investigated the impacts of socio-economicdevelopment, climate change, and variability on global crop production. Yet a much smaller body ofwork has investigated implications for irrigation water use, both regionally and globally. On the onehand, most such studies have focused solely on the local and regional aspects of irrigation water demand[9–11]. On the other hand, global analyses to date have largely focused on water availability – for bothagriculture and other sectors – using hydrological models to estimate changes in precipitation,evapotranspiration, and river runoff, which are of importance to water resources. Such studies oftenincluded some basic interactions of climate and population as a function of the studied socio-economicscenario, to determine levels of regional and global water availability over the 21st century [12–14].Results indicate that climate change is likely to increase water scarcity around the globe, mostly inregions that already suffer under present conditions, such as the southern Mediterranean, the MiddleEast, and Sub-Saharan Africa. Within this context, even fewer studies have specifically addressed futureregional and global changes in irrigation water for agriculture. Döll and Siebert [15] developed a globalirrigation model by integrating simplified agro-ecological and hydrological approaches. Döll [16] usedthis framework to investigate global impacts of climate change and variability on agricultural water-irrigation demand by comparing the impacts of current and future climate on irrigated cropland. Shefound that changes in precipitation, combined with increases in evaporative demands, increase the needfor irrigation worldwide, with small relative changes in total, about +5–8% by 2070 – depending on thegeneral circulation model (GCM) projection – and larger impacts, about +15%, in Southeast Asia andthe Indian subcontinent.
Yet much remains to be done to improve the predictions of future irrigation water requirement inagriculture. First, biophysically and agronomically based hydrology computations, such as those used byDöll [16], should be performed within a spatially detailed agro-ecological zone (AEZ) assessment model,so that water-demand estimates are consistent with predictions of crop biomass production and yield.Second, because many interactive processes determine the dynamics of crop production beyond agro-climatic conditions [4], studies that focus on irrigation water should also include, apart from climatechange, the impacts of socio-economic scenarios [3,4,17].
This paper reports on a new methodology aimed to improve, within a coherent AEZ framework,estimates of irrigation water requirements under current and future decades brought about by changes inboth climate and socio-economic conditions. As part of this methodology, regional renewable waterresources were estimated as a function of precipitation and evapotranspiration. For the analysis, the FAO–International Institute of Applied Systems Analysis (IIASA) agro-ecological modeling framework (AEZ)and associated agro-climatic and land-resources database [18] were employed in conjunction withIIASA's world food system model, or Basic Linked System (BLS) [19,20]. Specifically, we focused onagricultural development within a new A2 socio-economic scenario, A2r, developed at IIASA [21], toquantify global and regional trends from 1990 to 2080, as well as impacts of associated climate change,with and without mitigation options.
Climate change impacts on cultivated land and crop production patterns are described in this SpecialIssue [5]. In this paper we report on changes in irrigation water demand, focusing on the followingresearch questions:
• What are the implications of mitigating climate change for global and regional irrigation waterrequirements and withdrawals?
• Where does it matter most?

1086 G. Fischer et al. / Technological Forecasting & Social Change 74 (2007) 1083–1107
As a caveat to the reader, both previous literature results and our own computations herein refer mainlyto irrigation water requirements (i.e., the amount of water necessary for optimal crop production).Additional considerations on irrigation water efficiency and water costs are necessary to project actualwater withdrawals as a function of those requirements, yet the historical data and model feedbacksnecessary for such estimates are poorly developed. We nonetheless developed our own rough estimates ofchanges in irrigation efficiency and water costs over the coming decades, and provide at the end of thispaper a first-order quantification of future irrigation water withdrawals and expenditures.
2. Materials and methods
The combination of a spatially detailed biophysical–agronomic assessment tool and a global foodsystem model provided an integrated framework for the assessment of future water resources within thisstudy. Descriptions of the key components of the IIASA modeling systems are given elsewhere [4,5,19].Here we further specify the methodology employed to compute water-related variables.
2.1. AEZ modeling methodology: crop water requirements
The AEZ model uses detailed agronomic-based procedures to simulate land resources availability anduse, farm-level management options, and crop production potentials as a function of climate, soil, andterrain conditions. At the same time, it employs detailed spatial biophysical and socio-economic datasetsto distribute its computations at fine-grid intervals over the entire globe. It has been validated for use inagricultural resource assessment and applied in many studies, at (sub)national, regional, and global scales[4,18,22]; AEZ is one of the main tools used by the FAO to analyze present and future land resources,both regionally and globally [3].
For this work, AEZ was used to compute water movement through the soil–plant–atmospherecontinuum, to assess net crop irrigation water requirements (WRQ). The WRQ is defined herein as theamount of water – in addition to available soil moisture from precipitation – that crop plants onirrigated land must receive to grow without water stress. Gross AWWs for irrigation were then estimatedfrom WRQ via an irrigation efficiency parameter (Irreff) an indirect proxy of irrigation water loss:AWW=WRQ/Irreff.
Computations used a gridded climate database of the Climate Research Unit (CRU) of the Universityof East Anglia, which consists of historical monthly mean data for the period 1901–1996 and includes amonthly mean climatology based on the decades 1961–1990 (mean monthly minimum temperature,mean monthly maximum temperature, precipitation, cloudiness, vapor pressure deficit, wind speed, wet-day frequency). For AEZ applications, the monthly data of CRUwere transformed into pseudo-daily data,using spline interpolation for temperature, and by generating rainfall events in accordance with monthlywet-day frequency and rainfall totals in a grid cell.
Computations of WRQ were carried out for each grid cell in five successive steps, in the followingmanner:
• First, the Global Map of Irrigated Areas was used to define irrigated shares of cultivated land in 5′latitude×5′ longitude grid cells (i.e., with a size of about 10×10km at the equator) (http://www.fao.org/ag/agl/aglw/aquastat/irrigationmap/index.stm).

1087G. Fischer et al. / Technological Forecasting & Social Change 74 (2007) 1083–1107
• Second, based on irrigated shares of cultivated land in each grid cell, agro-ecological suitability forfour distinct crop groups in terms of water requirements – wetland rice, a generic dry-land crop, ageneric perennial (fruit trees, citrus), and sugar cane – was estimated with AEZ to determine waterdeficits of crops under rain-fed conditions.
• Third, Crop calendars, from AQUASTAT (http://www.fao.org/ag/agl/aglw/aquastat/water_use/index4.stm) for developing countries and compiled from national statistics for selected developed countries,were used to determine the irrigation-use fraction at each grid cell (i.e., the fraction of time in a yearwhen irrigated crops were actually grown). WRQ was equated to a crop's water deficits, computed indaily time-steps, and summed over the length of each crop growth cycle. Water deficits were derived inAEZ by comparing crop-specific actual and potential evapotranspiration rates [3,18].
• Fourth, total WRQ of each country was computed by determining the contributions of the foursimulated crop groups, using agricultural statistics (AQUASTAT online; EUROSTAT online [23]).
• Finally, grid-cell WRQ computations were aggregated to national and regional levels in the world foodsystem model, and up to the world regions considered in the A2r scenario (see below). National-leveluse fractions of irrigated land, as computed in AEZ and aggregated over grid cells, were harmonizedwith FAO-reported values (from AQUASTAT) by applying country-specific adjustment factors, toensure consistency with available water use statistics.
2.2. AEZ modeling methodology: renewable water resources
A robust methodology was developed to assess renewable internal water resources at regional level(WRI), and thus enable the consequences of changes in water requirements and withdrawals to beevaluated under different climate and socio-economic scenarios.
Although current global water resources are sufficient to satisfy irrigation water demands globally,there is concern about specific regions, such as North Africa and the Middle East, the Indian subcontinent,and North China, as to whether future water demand and competition from other sectors may create severeconditions of water scarcity. For this purpose, we defined a water scarcity index (WSI) as the ratio ofAWWs to internal renewable water resources (WRI), i.e., WSI=AWW/WRI. According to FAOdefinitions, conditions of water scarcity are impending when water withdrawals exceed 20% of a region'srenewable water resources and can be regarded as critical when water withdrawals exceed 40% (http://www.fao.org/ag/agl/aglw/aquastat/water_use/index5.stm).
To estimate WRI from climatology, we ran multiple regressions of observed WRI (data reported inFAO AQUASTAT) against annual precipitation and annual reference evapotranspiration, calculated usingaverage 1961–1990 CRU climatology, and aggregated over individual countries and 35 AEZ–BLS sub-regions (Fig. 1). The regression was estimated in the formWRI/P= f(P/PETref), with f a quadratic functionof its argument, had good predictive power (R2 =0.74) and plausible parameter values. We then appliedthis regression to estimating future changes in regional WRI, using levels of precipitation and futurereference evapotranspiration according to the climate scenario.
2.3. Socio-economic scenario
This paper focuses on the modified Special Report on Emissions Scenarios (SRES) A2r, with lowerpopulation projections than the original SRES-A2, and discussed in detail in this Special Issue [21].Agricultural water resources under A2r were aggregated to ten world regions: North America (NAM),

Fig. 1. Scatter diagram to show the ratio of internal renewable water resources to precipitation against ratio of precipitation byreference evapotranspiration. Data are derived from FAO AQUASTAT (for water resources), the CRU 1961–1990 meanclimatology (for precipitation), and simulated by AEZ (for potential evapotranspiration).
1088 G. Fischer et al. / Technological Forecasting & Social Change 74 (2007) 1083–1107
developed Pacific Asia (PAO), Eastern Europe and former Soviet Union (EEU+FSU), other developed(WEU; mainly Europe, including Turkey), Sub-Saharan Africa (AFR), Latin America (LAM), MiddleEast and North Africa (MEA), East Asia (CPA), South Asia (SAS), and Southeast Asia (PAS).
Irrigation water requirements in each decade of the A2r reference scenario were computed as follows.First, percentage shares of irrigated land from 1990 to 2080 were specified externally, using datadeveloped by FAO [3]. These data were used to compute total irrigated land extents, Airr
i (t), in Mha, fromtotal cultivated land projected by BLS over the same period. Second, net irrigation water requirementsunder the reference climate in each decade were estimated using AEZ-derived per hectare waterrequirements for the reference climate, WRQ(2000), and irrigated land (by 35 BLS regions):
WRQiðtÞ ¼ WRQið2000ÞTAiirrðtÞ=Ai
irrð2000Þ;
where Airri is irrigated land in region i.It is important that the computations of irrigation water requirements discussed herein were
dynamically carried out within AEZ, based on biophysical equations of crop water deficits, as previouslyspecified. By contrast, estimates of actual water withdrawals for irrigation were external to the model, andmust thus be regarded as first-order approximations: the AEZ–BLS framework currently lacks theeconomic feedback between land use and water demand variables necessary to compute actual water userealistically. Specifically, regional AWWs were simply estimated fromWRQ by assuming a 10% increasein irrigation efficiency from 2000 to 2030 [3], and a further 10% increase from 2030 to 2080, equally in allregions:
AWWiðtÞ ¼ WRQiðtÞ=Irrieff ðtÞ;
where Irreffi (t)= Irreffi (2000)⁎ (1+δ(t)), and Irreff
i (2000)=WRQi(2000)/AWWi(2000) is calculated frombase-year data. AWWi(2000) values were taken from the AQUASTAT online database. With respect to

1089G. Fischer et al. / Technological Forecasting & Social Change 74 (2007) 1083–1107
these assumptions, the changes in irrigation water efficiency are highly uncertain, and may importantlydepend on regional and international dynamics of water scarcity. Our own assumed increases onlyrepresent such interactions implicitly. Furthermore, for the lack of any published projections past 2030,we chose to apply changes to Irr(t) uniformly across BLS regions, starting from regionally specificvalues derived from year 2000 statistics. Alternative projections would produce changes in AWW thatscale linearly with those presented herein.
Improved estimates in Irr are necessary to improve our projections of water withdrawals. In particular,preliminary calculations we performed indicated that irrigation efficiency correlates well with regionalwater scarcity, and lead to predicted maximum values of efficiency in the range of 80–90% (data notshown). These values, as discussed in later sections, are consistent with our simple projections ofirrigation efficiency in the only two regions undergoing water scarcity by 2100 (i.e., the Middle East andthe Indian subcontinent).
Finally, the WSI was computed in each region and through time as:
WSIiðtÞ ¼ WRQiðtÞ=WRIið2000Þ;
with WRIi(2000) representing renewable internal water resources in region i in the year 2000 fromAQUASTAT (http://www.fao.org/ag/agl/aglw/aquastat/dbase/index.stm). Renewable water resourceswere assumed constant through time under the A2r reference scenario with no climate change.The impacts of climate change on agricultural water use over this century were assessed with andwithout mitigation. The following two-step strategy was followed:
(i) The impacts of socio-economic variables were analyzed against present conditions, without climatechange;
(ii) Impacts of climate change, without and with mitigation, were superimposed to this referencescenario, and differences between unmitigated and mitigated climates were computed.
2.4. Climate change scenario generation
GCMs compute future climates under anthropogenic forcing (i.e., present and projected futureemissions of greenhouse gases [24]). Their use in studies of climate change impact assessment iswidespread [10,25]. We utilized climate change scenarios from two GCMs, HadCM3 and CSIRO (see thisSpecial Issue [5]). Projected GCM climate changes for each decade of interest, from 1990 to 2080, werecomputed relative to a baseline climate (1961–1990) at 0.5° latitude×0.5° longitude, and used to generatefuture agronomic and water data.
Only one socio-economic scenario, A2r, was associated in this work with both non-mitigated andmitigated climates. In other words, the costs of mitigation – and thus potential feedback on the socio-economic path itself – were considered negligible. By contrast, two separate climate change scenarioswere considered: SRES A2 climate projections were used as a proxy for the A2r unmitigated climate,while SRES B1 climate projections were employed as a proxy for climate change under the A2rmitigated scenario. For simplicity, in the following analyses we refer to these two scenarios as A2rand A2r-mit.
The following equations were used to derive water resource variables. Water requirements underclimate change for region i and time t, WRQcc
i (t), were computed for each region as the product ofaverage regional aggregated daily water demand –wrqcc
i (t), derived from AEZ as a function of changes in

1090 G. Fischer et al. / Technological Forecasting & Social Change 74 (2007) 1083–1107
temperature and precipitation as well as possible increases in land occupation time (i.e., irrigation land-use fraction) within a year – multiplied by the corresponding amount of irrigated land:
WRQiccðtÞ ¼ wrqiccðtÞTAi
irrðtÞ:
For the calculation of water impacts, irrigated land extents were kept the same as in the A2r referencecase. However, over those lands, the extent of the growing period was allowed to change in response toclimate change. This resulted, in general, in longer growing seasons – and thus increased water demandover and above increases caused by warmer climates – at mid-to-high latitudes, with little changes in thetropics. AWWs under climate change, AWWcc
i (t), were estimated from net water requirement, similarly tocomputations in the reference case:
AWWiccðtÞ ¼ WRQi
ccðtÞ=Irrieff ðtÞ:
As in the reference case, irrigation efficiency was assumed to increase by 20% during 2000 to 2080.Subsequently, the WSI was computed by region and time step, as follows:
WSIiccðtÞ ¼ WRQiccðtÞ=WRIiccðtÞ;
with renewable water resources, WRIcci (t), calculated over time, used to evaluate the estimated
regression equation with projected precipitation and potential evapotranspiration, as previouslydiscussed in Section 2.2.
2.5. Economic costs of changes in irrigation water requirements
We used AEZ–BLS computations of water requirements, together with our simple estimates ofirrigation efficiency, to derive first-order quantifications of the cost of increasing irrigation under climatechange. Water price and irrigation cost data were available for a few regions, and are used herein toestimate the cost of additional irrigation within BLS. For the USA, the cost of providing irrigation to anadditional hectare of land was $290/ha, or $57/1000m3 (derived from available data [23]). This includesthe cost of supplying water from different sources, investment in irrigation equipment, facilities, landimprovement, and computer technology; maintenance and repair, and labor. Additional capital costs ofincreasing irrigation on already irrigated land were assumed to be minimal, and included additionalpumping and energy cost and/or water price, operation and maintenance, and labor. We estimated these at$37/1000m3 of water withdrawal.
Data available for China suggested average irrigation costs of $131/ha [26,27]. Given that Chinaapplies on average 6000m3/ha on irrigated land, the corresponding cost of water was estimated at $22/1000m3. In India, the average cost of groundwater irrigation is $158/ha, equivalent to $18/1000m3, with8677m3 applied per hectare [28]. In Sub-Saharan Africa, substantially greater prices were related to highwater usage (i.e., on average 14,400m3/ha [29,30]). Cost estimates for Africa were only made forgroundwater pumping, and resulted in $709/ha, or about $49/1000m3.
We applied these regional unit prices to projected changes in irrigated land and irrigated water amountsin each BLS region. Lacking a dynamic land–water feedback in BLS, as well as any projection on futureregional costs, we chose to keep unit costs constant to 2080. Our resulting estimates are thus highlyuncertain and are meant to provide only first-order estimates. They may possibly be taken to representlower limits to future cost, since increased competition for water and energy – and declining subsidies –may lead, in the future, to higher water and energy prices compared to those of today.

1091G. Fischer et al. / Technological Forecasting & Social Change 74 (2007) 1083–1107
2.6. Limitations of modeling framework
Simulation models investigate complex interactions and feedbacks of many variables. As aconsequence, several limitations and uncertainties apply to the results presented here. A number ofgeneric limitations, relative to the nature of climate predictions, such as the effects of elevated CO2 oncrop growth and the assumptions on cost of mitigation within A2r, are discussed in this Special Issue [5].Here we further analyze limitations to estimates of agricultural water resources.
First, under no climate change, we assumed that future increases in water requirements and use wouldfollow proportionally the projected increases in irrigated land. In fact, this assumption is correct only if theaverage water deficits on current and future additional land are similar. In practice, in some regionsirrigation would develop over increasingly marginal land, perhaps with higher annual water requirementsthan current irrigated areas, so that our computations of WRQ in the reference scenario mightunderestimate future increases.
Second, the effects of elevated CO2 were included herein, to simulate a reduction of leaf stomatalresistance and thus transpiration. Crop water-use efficiency – the amount of biomass fixed inphotosynthesis to water loss – is believed to increase under elevated CO2, yet it is unclear whetherequations based on leaf-level knowledge are appropriate to capture water dynamics at the field level. Thestronger this effect is in real-world field conditions the more it would lower future WRQ. However, it ispossible that under climate change the ratio of irrigated to total cultivated land may change in addition tothe values already specified in the socio-economic scenario — as an adaptation strategy. By contrast, inthese simulations this ratio is the same as in the reference case.
Third, we assumed that irrigation efficiency, or the ratio between WRQ and AWW, although changingthrough time, would be the same with and without climate change. In fact, it is plausible that— all otherthings being equal – irrigation efficiency would decrease under climate change, as warmer climates andincreased evaporative demands could lead to larger water losses during transportation to the fields. In suchcases, future AWW and WSI values would be larger than computed herein.
Fourth, although the WSI is a useful indicator that allows for large-scale regional comparisons, it doesnot capture water scarcity conditions on a finer scale, such as those that arise from overuse of groundwaterresources, a main cause of falling water tables in many key producing world regions. Also, by usingannual totals, the WSI does not reveal specific patterns of seasonal water scarcity.
Fifth, the cost estimates for increased irrigation water use discussed here, particularly for Asia andAfrica, are only rough estimates. Directly comparable irrigation cost information is not available aroundthe world, so that the average estimates from each country and region involve different cost components.In addition, irrigation water in most countries is often subsidized by governments. For instance, USstatistics show that 25% of farms receive off-farm water for free. The costs discussed here are on-farmcosts. To estimate direct costs, we assumed that additional water would be supplied by increasedirrigation, without the need for a new large water-supply infrastructure. These capital costs for newirrigation projects can be as much as $15,000/ha in Africa and only $1500/ha in China [31]. Spread overthe lifespan of an irrigation project, about 50years, these would amount to $350/ha per year for Africa and$35/ha per year in China.
Finally, although water amounts computed within the AEZ–BLS systems were consistent withagriculture production figures generated in the A2r development scenario [5], water and crop productionwere not fully coupled. This is because changes in crop mix and management decisions simulated by BLSwere not fully reflected in the AEZ water estimations. Results could be further improved by allowing BLS

1092 G. Fischer et al. / Technological Forecasting & Social Change 74 (2007) 1083–1107
to allocate irrigated and rain-fed land dynamically, and therefore actual irrigation-water withdrawals,based on cost of water and irrigation infrastructure.
3. Results: world food system, 1990–2080
The following sections describe the results obtained with AEZ–BLS for irrigation water requirements,withdrawals, and renewable water resources. All simulations started in 1990 and were carried out inyearly increments; the results are presented in 10-year time steps, from 2000 to 2080.
3.1. Impacts of socio-economic development, no climate change
We first assessed the implications of the A2r reference scenario on agricultural water use, starting frompresent conditions (year 2000). Simulation results without climate change represented the referenceagainst which climate change impacts were then analyzed.
3.1.1. Current irrigated area and irrigation water requirementsIn the year 2000, world total irrigated area was nearly 18% of total cultivated land, with larger shares in
developing countries, especially in Asia (Table 1). These data were combined with BLS-computed globaland regional amounts of cultivated land under the A2r reference scenario, to derive amounts of futureirrigated areas. BLS estimated total irrigated land of 271Mha in 2000, of which three-fourths are indeveloping countries. These figures are in good agreement with current statistics (FAOSTAT; FAOAQUASTAT). By using the methodology previously described, AEZ computed over this land the total netwater irrigation requirements of 1350Gm3/year (Table 1). Compared to current statistics of waterwithdrawals for agriculture of 2630Gm3/year, the AEZ figures implied an irrigation efficiency (Irreff, orthe ratio of plant water requirements to water withdrawals) of roughly 50%, also in good agreement withobservations. Mirroring the regional distribution and intensity of use of irrigated land, net irrigationrequirements in developing countries represent more than three-fourths of the total; they are locatedmainly in the Indian subcontinent, Southeast Asia, and China. Additionally, by comparing AEZcomputations with current statistics of AWWs, irrigation efficiency is quite similar across regions, withvalues slightly below 40% in those areas with a high percentage of wetland rice cultivation on irrigatedland, such as the Asian Pacific and Southeast Asia regions (Table 1).
AEZ–BLS computations of water requirements and agricultural production were combined to estimatecrop irrigation water-use efficiency (WUEirr), defined as the ratio of total net irrigation water requirementsto total production. For cereals, production in developing countries amounted to 1.2Gt in 2000, of which60% were produced on irrigated land [3]. We thus computed WUEirr as about 1015 liters irrigation waterper ton of irrigated grain – assuming two-thirds of irrigation water was used for cereal production – afigure quite consistent with observations.
3.1.2. Projected future irrigated area and irrigation water requirementsBy 2080, BLS projected global irrigated land of 393Mha (Table 2), or 22% of global cultivated land.
This corresponds to a +45% increase from 2000 levels, or an addition of 122Mha. Of the additionalirrigated land, the large majority – or 112Mha irrigated – is in developing countries (+56%), mainly inSouth Asia, Africa, and Latin America. For large Asian producers increases of irrigated land are less

Table 2BLS-projected irrigated land (Mha) under the A2r scenario, from 2000 to 2080, used for all scenario cases
2000 2010 2020 2030 2040 2050 2060 2070 2080
WORLD 271 292 313 327 342 356 369 382 393MDC 69 70 71 73 75 76 77 78 79LDC 202 222 242 254 268 280 292 304 315NAM 25 26 28 29 30 30 30 30 31WEU 18 18 18 18 19 19 19 18 18PAO 5 5 5 5 5 5 6 6 6EEU+FSU 26 26 26 27 28 29 29 30 31AFR 8 10 13 15 18 21 25 29 32LAM 20 23 28 31 35 38 41 44 46MEA 20 21 22 23 25 26 27 27 28CPA 58 62 65 66 67 68 69 70 71SAS 78 85 92 95 98 101 104 107 109PAS 12 13 14 15 16 16 17 17 18
1093G. Fischer et al. / Technological Forecasting & Social Change 74 (2007) 1083–1107
pronounced. For instance, in India and China irrigated land by 2080 represents 45% and 50%, respectively,of total cultivated land in these countries, an average increase of 28% compared to the year 2000.
Total net irrigation water requirements, WRQ, increase proportionally with irrigated land (Table 3a).Specifically, global net irrigation requirements increase from 1350Gm3/year to 1960Gm3/year. Irrigationwater requirements increase over 50% in developing regions, and by about 16% in developed regions.The largest relative increases from 2000 to 2080 – also substantial in absolute amounts – were computedfor Africa, from 45 to 180Gm3/year (+300%) and Latin America, from 82 to 179Gm3/year (+119%).Developed regions were computed to add about 40Gm3/year in total, with North America (+25Gm3/year, or +23%) experiencing the largest increase.
Two main factors are responsible for the increased net irrigation water requirements. Two-thirds of theincreases (75–80% in developing countries, but only 50–60% in developed countries) arises from anincrease in average daily water requirements caused by warming and changed precipitation patterns, andglobally one-third occurs because of extended crop calendars in temperate and sub-tropical zones. Fig. 2illustrates the variable importance of the two factors in different regions and compares the magnitude ofclimate change impacts to average net water requirements under reference climate.
3.1.3. Water scarcityAs discussed, the ratio of water withdrawals for irrigation to total internal renewable water resources, or
WSI, is an important indicator of regional water status. To deriveWSI, AWWswere first estimated in BLSfrom the net irrigation water requirements (Table 3a and b) by assuming the regional irrigation efficiencywould improve, compared to the year 2000, by 10% until 2030 – in agreement with FAO projections [3] –and an additional 10% from 2030 to 2080. For these reasons, estimated relative increases in AWW weremuch smaller than those computed for WRQ. For instance, global increases in AWW in 2080 wereprojected to be only +25%, compared to increases of +45% in WRQ.
To produce a more relevant indicator of water scarcity with regard to (irrigated) agriculture, a weightedscheme was used to aggregate WSI for broad world regions using shares of irrigated land in each BLS sub-region in the total regional irrigated land as aggregation weights for AWWandWRI. In the year 2000, smallglobal WSI values of 14% (an aggregate index of 20% for developing countries) were computed, but with
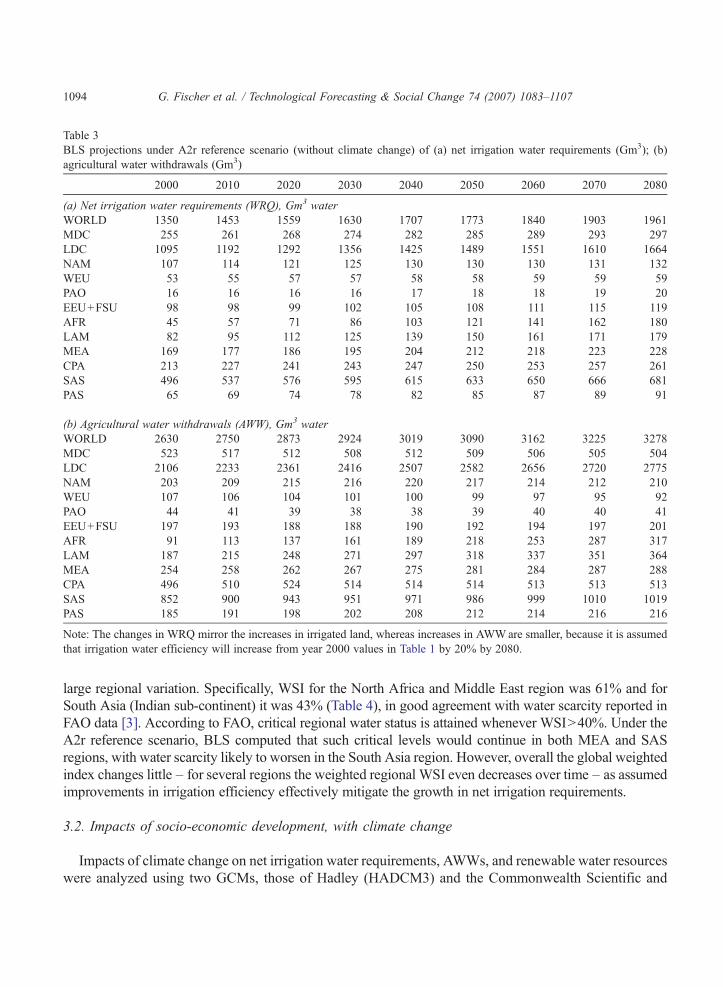
Table 3BLS projections under A2r reference scenario (without climate change) of (a) net irrigation water requirements (Gm3); (b)agricultural water withdrawals (Gm3)
2000 2010 2020 2030 2040 2050 2060 2070 2080
(a) Net irrigation water requirements (WRQ), Gm3 waterWORLD 1350 1453 1559 1630 1707 1773 1840 1903 1961MDC 255 261 268 274 282 285 289 293 297LDC 1095 1192 1292 1356 1425 1489 1551 1610 1664NAM 107 114 121 125 130 130 130 131 132WEU 53 55 57 57 58 58 59 59 59PAO 16 16 16 16 17 18 18 19 20EEU+FSU 98 98 99 102 105 108 111 115 119AFR 45 57 71 86 103 121 141 162 180LAM 82 95 112 125 139 150 161 171 179MEA 169 177 186 195 204 212 218 223 228CPA 213 227 241 243 247 250 253 257 261SAS 496 537 576 595 615 633 650 666 681PAS 65 69 74 78 82 85 87 89 91
(b) Agricultural water withdrawals (AWW), Gm3 waterWORLD 2630 2750 2873 2924 3019 3090 3162 3225 3278MDC 523 517 512 508 512 509 506 505 504LDC 2106 2233 2361 2416 2507 2582 2656 2720 2775NAM 203 209 215 216 220 217 214 212 210WEU 107 106 104 101 100 99 97 95 92PAO 44 41 39 38 38 39 40 40 41EEU+FSU 197 193 188 188 190 192 194 197 201AFR 91 113 137 161 189 218 253 287 317LAM 187 215 248 271 297 318 337 351 364MEA 254 258 262 267 275 281 284 287 288CPA 496 510 524 514 514 514 513 513 513SAS 852 900 943 951 971 986 999 1010 1019PAS 185 191 198 202 208 212 214 216 216
Note: The changes in WRQ mirror the increases in irrigated land, whereas increases in AWWare smaller, because it is assumedthat irrigation water efficiency will increase from year 2000 values in Table 1 by 20% by 2080.
1094 G. Fischer et al. / Technological Forecasting & Social Change 74 (2007) 1083–1107
large regional variation. Specifically, WSI for the North Africa and Middle East region was 61% and forSouth Asia (Indian sub-continent) it was 43% (Table 4), in good agreement with water scarcity reported inFAO data [3]. According to FAO, critical regional water status is attained whenever WSI>40%. Under theA2r reference scenario, BLS computed that such critical levels would continue in both MEA and SASregions, with water scarcity likely to worsen in the South Asia region. However, overall the global weightedindex changes little – for several regions the weighted regional WSI even decreases over time – as assumedimprovements in irrigation efficiency effectively mitigate the growth in net irrigation requirements.
3.2. Impacts of socio-economic development, with climate change
Impacts of climate change on net irrigation water requirements, AWWs, and renewable water resourceswere analyzed using two GCMs, those of Hadley (HADCM3) and the Commonwealth Scientific and

Fig. 2. Impacts of A2r climate change on average regional net irrigation water requirements (mm per year) in 2080, for (a) HadleyGCM and (b) CSIRO GCM. Diagrams indicate values under reference climate (A2r-ref), increase because of warming andchanged precipitation patterns (Climate), and increases caused by expanded crop calendars (Season).
1095G. Fischer et al. / Technological Forecasting & Social Change 74 (2007) 1083–1107
Industrial Research Organisation CSIRO [5]. AEZ–BLS simulations were performed with and withoutmitigation, and the results were tabulated in 10-year time steps. In general, in these simulations the highertemperatures and altered precipitation regimes impacted net irrigation water requirements in two distinctways. First, by affecting crop evapotranspiration rates, and thus crop water demand; and second, byaltering crop calendars (i.e., by modifying – typically extending in temperate and sub-tropical zones – theduration over which a crop could be grown and irrigated at a given location).
3.2.1. Irrigation water requirementsImpacts of climate change on world aggregate net irrigation water requirements are significant. Total
increases of about 395–410Gm3 water in 2080 were projected with AEZ–BLS, similarly under both
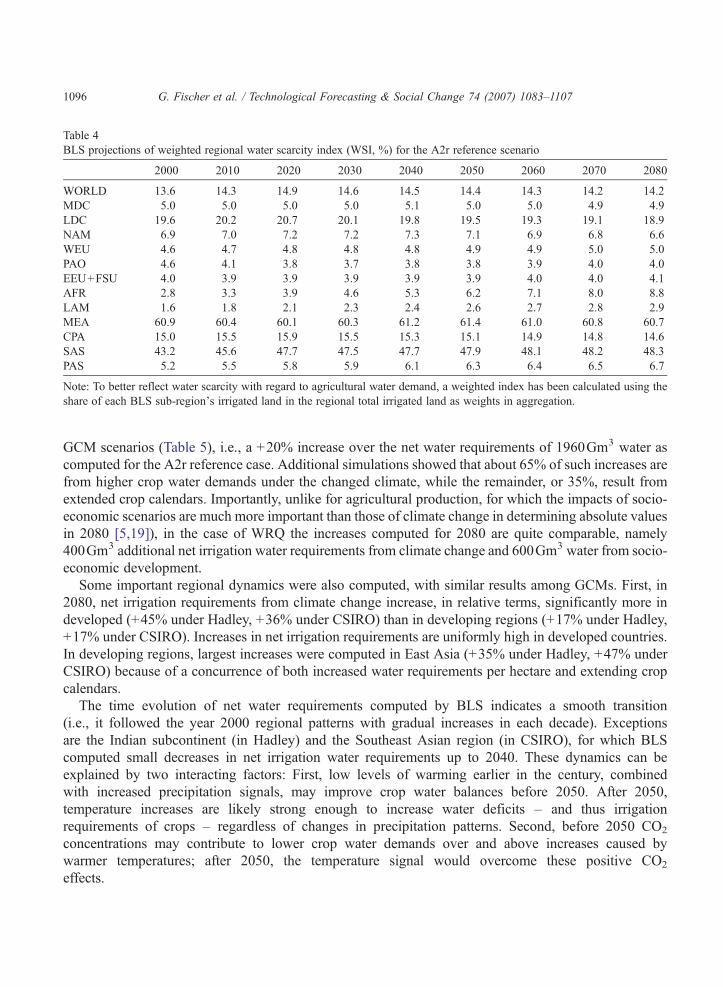
Table 4BLS projections of weighted regional water scarcity index (WSI, %) for the A2r reference scenario
2000 2010 2020 2030 2040 2050 2060 2070 2080
WORLD 13.6 14.3 14.9 14.6 14.5 14.4 14.3 14.2 14.2MDC 5.0 5.0 5.0 5.0 5.1 5.0 5.0 4.9 4.9LDC 19.6 20.2 20.7 20.1 19.8 19.5 19.3 19.1 18.9NAM 6.9 7.0 7.2 7.2 7.3 7.1 6.9 6.8 6.6WEU 4.6 4.7 4.8 4.8 4.8 4.9 4.9 5.0 5.0PAO 4.6 4.1 3.8 3.7 3.8 3.8 3.9 4.0 4.0EEU+FSU 4.0 3.9 3.9 3.9 3.9 3.9 4.0 4.0 4.1AFR 2.8 3.3 3.9 4.6 5.3 6.2 7.1 8.0 8.8LAM 1.6 1.8 2.1 2.3 2.4 2.6 2.7 2.8 2.9MEA 60.9 60.4 60.1 60.3 61.2 61.4 61.0 60.8 60.7CPA 15.0 15.5 15.9 15.5 15.3 15.1 14.9 14.8 14.6SAS 43.2 45.6 47.7 47.5 47.7 47.9 48.1 48.2 48.3PAS 5.2 5.5 5.8 5.9 6.1 6.3 6.4 6.5 6.7
Note: To better reflect water scarcity with regard to agricultural water demand, a weighted index has been calculated using theshare of each BLS sub-region's irrigated land in the regional total irrigated land as weights in aggregation.
1096 G. Fischer et al. / Technological Forecasting & Social Change 74 (2007) 1083–1107
GCM scenarios (Table 5), i.e., a +20% increase over the net water requirements of 1960Gm3 water ascomputed for the A2r reference case. Additional simulations showed that about 65% of such increases arefrom higher crop water demands under the changed climate, while the remainder, or 35%, result fromextended crop calendars. Importantly, unlike for agricultural production, for which the impacts of socio-economic scenarios are much more important than those of climate change in determining absolute valuesin 2080 [5,19]), in the case of WRQ the increases computed for 2080 are quite comparable, namely400Gm3 additional net irrigation water requirements from climate change and 600Gm3 water from socio-economic development.
Some important regional dynamics were also computed, with similar results among GCMs. First, in2080, net irrigation requirements from climate change increase, in relative terms, significantly more indeveloped (+45% under Hadley, +36% under CSIRO) than in developing regions (+17% under Hadley,+17% under CSIRO). Increases in net irrigation requirements are uniformly high in developed countries.In developing regions, largest increases were computed in East Asia (+35% under Hadley, +47% underCSIRO) because of a concurrence of both increased water requirements per hectare and extending cropcalendars.
The time evolution of net water requirements computed by BLS indicates a smooth transition(i.e., it followed the year 2000 regional patterns with gradual increases in each decade). Exceptionsare the Indian subcontinent (in Hadley) and the Southeast Asian region (in CSIRO), for which BLScomputed small decreases in net irrigation water requirements up to 2040. These dynamics can beexplained by two interacting factors: First, low levels of warming earlier in the century, combinedwith increased precipitation signals, may improve crop water balances before 2050. After 2050,temperature increases are likely strong enough to increase water deficits – and thus irrigationrequirements of crops – regardless of changes in precipitation patterns. Second, before 2050 CO2
concentrations may contribute to lower crop water demands over and above increases caused bywarmer temperatures; after 2050, the temperature signal would overcome these positive CO2
effects.

Table 5Changes in projected net irrigation water requirements (Gm3) under scenario A2r (without mitigation) compared with the A2rreference scenario (no climate change), for Hadley and CSIRO climates
2000 2010 2020 2030 2040 2050 2060 2070 2080
(a) Hadley climate changeWORLD 0 36 76 113 154 196 264 335 409MDC 0 15 32 45 59 73 93 113 133LDC 0 21 45 68 95 124 171 222 276NAM 0 1 2 3 4 5 6 7 8WEU 0 10 20 30 39 48 60 72 84PAO 0 6 11 15 20 25 32 41 49EEU+FSU 0 13 27 40 54 68 92 117 143AFR 0 8 18 28 41 55 79 105 132LAM 0 1 2 3 4 5 6 7 8MEA 0 7 14 22 29 37 45 53 61CPA 0 4 7 10 12 15 19 24 28SAS 0 1 1 2 2 3 4 5 7PAS 0 6 11 15 20 25 32 41 49
(b) CSIRO climate changeWORLD 0 42 89 125 164 203 264 328 395MDC 0 12 25 33 42 50 68 87 107LDC 0 30 64 92 122 153 196 241 288NAM 0 7 15 18 22 25 33 40 48WEU 0 2 3 5 8 10 13 16 19PAO 0 0 0 1 1 1 2 4 5EEU+FSU 0 4 8 12 15 18 27 36 46AFR 0 1 2 3 4 6 10 14 19LAM 0 2 5 8 11 14 18 22 27MEA 0 3 6 10 14 19 25 32 39CPA 0 18 38 49 60 71 88 105 122SAS 0 6 12 20 29 38 47 56 65PAS 0 0 −1 −1 0 0 1 1 1
1097G. Fischer et al. / Technological Forecasting & Social Change 74 (2007) 1083–1107
3.2.2. MitigationUnder the A2r-mit scenario, BLS computed, under both GCMs, smaller increases in net irrigation
requirements in 2080, compared with no mitigation (Tables 6 and 7). Specifically, changes in WRQ wereprojected to be in the range of 220–275Gm3 water, or +13% to +14% compared with the reference (noclimate change) case. Regional trends were similar to those discussed for the unmitigated case, in terms ofboth direction and magnitude of asymmetries between developed and developing regions. For eachregion, the magnitude of climate impacts was projected to be smaller than under A2r, but with roughly thesame groups of winners and losers as indicated previously. We computed the absolute differences betweenirrigation water demands under A2r-mit and A2r, for both GCMs.
Mitigation reduces by roughly 30–40% the additional net irrigation water requirements in 2080 ofthe unmitigated A2r scenario, quite similarly across developed and developing regions, with somewhatmore pronounced decreases under the Hadley climate. Additional to the differences discussed so far,climate mitigation created its own set of winners and losers (i.e., regions that become, in given decades,

Table 6Changes in net irrigation water requirements (Gm3) under the A2r-mit scenario (with mitigation) compared with the A2rreference scenario (no climate change), for Hadley and CSIRO climates
2000 2010 2020 2030 2040 2050 2060 2070 2080
(a) HadleyWORLD 0 27 58 86 117 148 181 215 251MDC 0 16 33 45 57 69 74 78 82LDC 0 11 25 41 59 78 107 137 169NAM 0 8 17 23 29 35 36 37 39WEU 0 3 6 9 11 14 15 16 17PAO 0 0 1 1 2 2 3 3 4EEU+FSU 0 6 12 15 19 23 25 27 29AFR 0 1 2 4 6 8 10 13 16LAM 0 3 6 10 15 19 25 31 37MEA 0 2 5 8 12 17 18 20 22CPA 0 2 5 15 25 35 42 50 57SAS 0 −1 −2 −7 −12 −17 −6 6 18PAS 0 2 5 6 8 9 9 9 9
(b) CSIROWORLD 0 58 124 143 164 184 212 240 269MDC 0 15 32 38 44 51 57 63 70LDC 0 43 92 105 119 133 155 177 199NAM 0 6 13 17 22 26 28 30 33WEU 0 3 6 7 8 9 10 11 12PAO 0 0 0 1 1 2 2 3 3EEU+FSU 0 7 15 16 17 19 22 25 29AFR 0 1 2 3 4 6 8 11 14LAM 0 2 5 7 9 11 13 15 17MEA 0 5 11 14 17 20 23 26 30CPA 0 19 41 47 54 60 70 79 89SAS 0 14 30 30 30 30 34 38 41PAS 0 0 −1 0 1 1 1 1 0
1098 G. Fischer et al. / Technological Forecasting & Social Change 74 (2007) 1083–1107
either better or worse off with mitigation, compared with the unmitigated climate change scenarioresults). Specifically, under both GCMs, BLS computed a small increase in aggregate net irrigationrequirements in developed countries under mitigation, compared with no mitigation, up to 2040.Individually, negative effects of mitigation (i.e., increases of water requirements compared with non-mitigated results) occur in both some developed and developing regions, by up to 2.5% under Hadleyand by up to 6.5% under CSIRO. Such results are related to some differences in temperature andprecipitation signals between the A2r and A2r-mit climate scenarios, as well as to differences in CO2
concentrations and their respective effect on potential evapotranspiration and subsequent water balancecalculations.
Mitigation becomes beneficial in all regions in the second half of the century only. Maximumbenefits were computed for 2080, with a reduction in estimated regional AWWs of up to −14.5%under Hadley and up to −10.5% under CSIRO. In relative terms, reductions of water withdrawalsthrough climate mitigation in 2080 are about twice as large in developed countries as in developingregions.

Table 7Effects of climate mitigation on irrigation water demand
2000 2010 2020 2030 2040 2050 2060 2070 2080
(a) Hadley climate changeWORLD 0.0 −0.8 −1.6 −1.8 −2.2 −2.5 −4.1 −5.5 −6.9MDC 0.0 0.0 0.1 −0.2 −0.6 −0.9 −5.1 −8.9 −12.3LDC 0.0 −1.1 −1.9 −2.2 −2.5 −2.9 −3.9 −4.8 −5.7NAM 0.0 1.1 2.0 0.8 −0.2 −1.2 −4.9 −8.4 −11.5WEU 0.0 −2.1 −3.9 −2.4 −1.1 0.1 −5.6 −10.4 −14.6PAO 0.0 −0.9 −1.7 −1.6 −1.4 −1.1 −5.3 −8.8 −11.8EEU+FSU 0.0 0.2 0.4 −0.1 −0.6 −1.1 −5.1 −8.7 −12.0AFR 0.0 0.9 1.9 1.6 1.3 1.0 −0.5 −1.9 −3.4LAM 0.0 −0.3 −0.3 −1.2 −2.3 −3.4 −5.1 −6.7 −8.1MEA 0.0 −0.4 −0.7 −0.3 0.1 0.5 −1.6 −3.5 −5.4CPA 0.0 −6.6 −12.2 −10.1 −8.1 −6.2 −7.2 −8.1 −9.0SAS 0.0 1.2 2.5 0.5 −1.5 −3.3 −3.2 −3.2 −3.1PAS 0.0 1.0 2.1 1.1 0.3 −0.5 −2.0 −3.3 −4.6
(b) CSIRO climate changeWORLD 0.0 1.1 2.0 1.0 0.0 −0.9 −2.6 −4.1 −5.6MDC 0.0 1.4 2.6 1.6 0.8 0.0 −3.5 −6.7 −9.5LDC 0.0 1.0 1.9 0.8 −0.2 −1.1 −2.4 −3.6 −4.7NAM 0.0 −0.6 −1.2 −0.7 −0.2 0.3 −2.9 −5.8 −8.5WEU 0.0 3.3 6.4 3.2 0.3 −2.3 −5.2 −7.9 −10.3PAO 0.0 −0.4 −0.8 0.3 1.4 2.6 −1.9 −5.8 −9.2EEU+FSU 0.0 3.2 6.1 4.1 2.2 0.3 −3.6 −7.0 −10.1AFR 0.0 −0.1 −0.2 −0.2 −0.2 −0.3 −1.3 −2.3 −3.2LAM 0.0 0.1 0.2 −0.4 −1.1 −1.8 −3.0 −4.2 −5.3MEA 0.0 1.4 2.8 2.0 1.3 0.6 −0.9 −2.3 −3.6CPA 0.0 0.6 1.2 −0.5 −1.9 −3.2 −5.2 −6.9 −8.6SAS 0.0 1.6 3.1 1.8 0.5 −0.8 −1.6 −2.5 −3.3PAS 0.0 −0.1 −0.3 0.2 0.8 1.3 0.6 −0.1 −0.9
Percentage changes in agricultural water withdrawals between scenarios A2r-mit and A2r, Hadley and CSIRO climate.
1099G. Fischer et al. / Technological Forecasting & Social Change 74 (2007) 1083–1107
3.2.3. Renewable water resources and security under climate changeWe estimated changes in renewable fresh water resources as a function of changes in
precipitation and potential evapotranspiration, based on a cross-country regression established undercurrent climate conditions. Table 8 shows results for 2080, with global renewable water resourcesbeing reduced by −10% under Hadley, but slightly increased (+2%) under CSIRO, compared withthe reference scenario. In particular, under the Hadley climate, significant reductions werecomputed for Europe (−19%), the Middle East (−20%), and most pronounced for Latin America(−42%), where rainfall volume under the A2r climate change decreases by −20%. At the sametime, internal renewable water resources under Hadley increase in some regions, for instance inChina (+14%) and the Indian subcontinent (+25%). These regional patterns of change aremaintained under the CSIRO climate change, although the magnitudes of the projected changes aresmaller and with fewer extremes – the largest deviation occurs for the Middle East region(−15%).

Table 8Projected changes in renewable internal water resources (WRI) under climate change scenarios A2r and A2r-mit in 2080compared with the A2r reference scenario (no climate change)
Hadley CSIRO
A2r A2r-mit A2r A2r-mit
WORLD −10.8 −6.0 1.5 2.0MDC −2.3 −0.1 0.0 0.9LDC −14.8 −8.8 2.2 2.5NAM −3.9 1.0 −4.2 −1.9WEU −19.4 −13.0 −5.2 −1.8PAO −1.7 −4.4 −2.8 −2.2EEU+FSU 7.1 5.7 7.8 6.2AFR −3.6 −3.9 −7.2 −3.4LAM −41.9 −28.2 −2.8 0.0MEA −20.3 −13.3 −14.6 −9.5CPA 13.8 13.6 4.9 3.2SAS 24.8 22.8 18.7 13.2PAS 5.3 6.7 15.7 10.2
1100 G. Fischer et al. / Technological Forecasting & Social Change 74 (2007) 1083–1107
The combined impacts of climate change on both irrigation water requirements and the availabilityof internal renewable water resources were captured by computing the weighted regional WSI underprojected climates, both for Hadley and CSIRO, for non-mitigated and mitigated conditions. In bothcases of non-mitigated climate change, the global WSI changes from 14% in the A2r referencescenario in the year 2080 to 17% (Table 9 for Hadley and Table 10 for CSIRO), and for thedeveloping countries from 19% (A2r reference in year 2080) to 22%. Changes of the WSI appearespecially dramatic under non-mitigated climate change for the MEA region, where the A2r referencevalue of 61% increases toward 90% and above. A large increase of WSI also occurs in East Asia, froma 2080 value of 15% in the A2r reference to 22% under the Hadley climate. However, non-mitigatedclimate change improved the WSI of 2080 in South Asia, compared with the value computed in theA2r reference scenario, caused by large precipitation increases (about +15%) in both Hadley andCSIRO projections.
Mitigation produced a clear improvement in water scarcity conditions in nearly all regions andscenarios (the exception being the SAS region because of the peculiarities in changing rainfall).
3.2.4. Economic costs of increased irrigation water requirementsTo quantify broadly the direct costs of the impacts of climate change on irrigation, cost estimates in the
range 0.03–0.05US$/m3, previously discussed, were applied to computed changes in water withdrawalsrelative to the A2r reference scenario. In accordance with available survey data, a unit cost of 40US$/km3
for increasing irrigation water use in existing irrigated land was used for developed countries and LatinAmerica. A lower rate of 30US$/km3 was applied for Asian regions, and somewhat higher costs −50US$/km3 – were used for irrigated land in the mostly semi-arid or arid countries of Africa and Middle East.In this way, global annual costs by 2080 of additional irrigation water withdrawals caused by climatechange were estimated at 24–27billionUS$ (Fig. 3a). Depending on climate scenario, the additionalannual cost for developed countries amounted to 8–10billionUS$, and for developing countries the rangewas 16–17billionUS$ annually. Comparing the results of (mitigated) scenario A2r-mit with the outcomes

Table 9Projections of weighted regional water scarcity index (WSI) under climate change impacts on both net crop water requirementsand renewable water resources
2000 2010 2020 2030 2040 2050 2060 2070 2080
(a) Projected WSI under non-mitigated A2r scenario (using Hadley A2 climate change)WORLD 13.6 14.8 16.0 15.9 16.0 16.2 16.5 16.8 17.1MDC 5.0 5.3 5.6 5.9 6.2 6.4 6.6 6.9 7.1LDC 19.6 20.9 22.2 21.7 21.6 21.5 21.7 22.0 22.4NAM 6.9 7.5 8.2 8.7 9.3 9.6 10.0 10.3 10.7WEU 4.6 5.2 5.9 6.3 6.8 7.3 8.2 9.1 10.1PAO 4.6 4.3 4.3 4.3 4.4 4.6 5.0 5.5 5.9EEU+FSU 4.0 4.1 4.2 4.4 4.5 4.7 4.9 5.2 5.4AFR 2.8 3.3 3.9 4.7 5.6 6.6 7.9 9.1 10.4LAM 1.6 2.0 2.6 3.0 3.6 4.1 4.8 5.6 6.6MEA 60.9 61.5 62.4 64.6 67.8 70.3 75.4 81.3 88.1CPA 15.0 17.1 19.3 18.4 17.8 17.3 17.3 17.3 17.4SAS 43.2 43.4 43.3 43.3 43.7 44.0 43.3 42.7 42.0PAS 5.2 5.5 5.9 6.3 6.7 7.1 7.2 7.2 7.2
(b) Projected WSI under mitigated A2r-mit scenario (using Hadley B1 climate change)WORLD 13.6 14.4 15.1 14.9 14.9 14.9 15.1 15.3 15.5MDC 5.0 5.3 5.7 5.9 6.2 6.3 6.3 6.2 6.2LDC 19.6 20.0 20.4 19.8 19.5 19.2 19.5 19.9 20.3NAM 6.9 7.6 8.5 8.8 9.3 9.5 9.3 9.1 9.0WEU 4.6 5.1 5.6 6.1 6.7 7.4 7.6 7.8 8.0PAO 4.6 4.3 4.2 4.3 4.4 4.6 4.9 5.1 5.4EEU+FSU 4.0 4.2 4.3 4.4 4.5 4.7 4.7 4.8 4.9AFR 2.8 3.4 4.1 4.9 5.8 6.8 7.9 9.0 9.9LAM 1.6 2.0 2.5 2.9 3.3 3.7 4.1 4.5 5.0MEA 60.9 62.2 63.8 68.5 74.5 80.1 78.6 77.4 76.5CPA 15.0 15.3 15.6 15.6 15.7 15.9 15.8 15.7 15.6SAS 43.2 43.2 42.9 40.3 38.4 36.6 37.8 39.0 40.1PAS 5.2 5.6 6.1 6.3 6.5 6.6 6.7 6.8 6.8
Note: To better reflect water scarcity with regard to agricultural water demand, a weighted index has been calculated using theshare of each BLS sub-region's irrigated land in the regional total irrigated land as weights in aggregation.
1101G. Fischer et al. / Technological Forecasting & Social Change 74 (2007) 1083–1107
of (non-mitigated) scenario A2r, the benefits of climate mitigation were estimated at 8–10billionUS$annually (Fig. 3b), quite uniformly spread over developed (3–4billionUS$) and developing countries (5–6billionUS$).
4. Discussion
Our results indicate that both socio-economic development and climate change may significantlyimpact global and regional net irrigation requirements, and thus AWWs. Against the current amount ofabout 1350Gm3 net water requirements, BLS computed by 2080 a 45% increase, to over 1960Gm3 waterworldwide. However, because irrigation efficiency was also assumed to increase by 20% until 2080, thesedynamics in net crop water requirements correspond to smaller increases of AWWs – globally +25% by
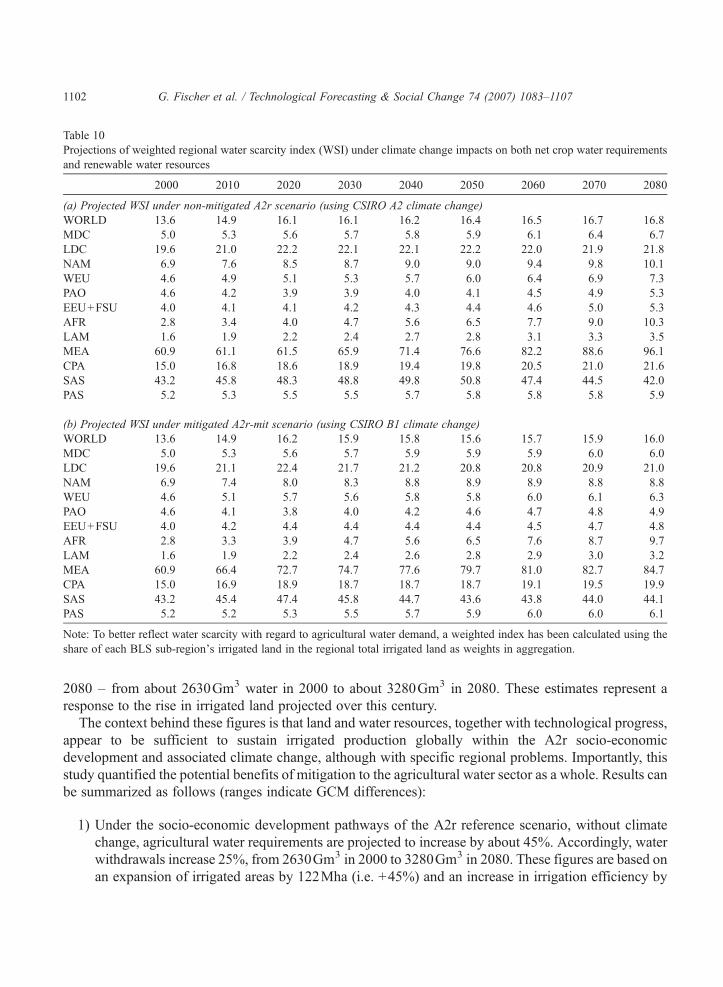
Table 10Projections of weighted regional water scarcity index (WSI) under climate change impacts on both net crop water requirementsand renewable water resources
2000 2010 2020 2030 2040 2050 2060 2070 2080
(a) Projected WSI under non-mitigated A2r scenario (using CSIRO A2 climate change)WORLD 13.6 14.9 16.1 16.1 16.2 16.4 16.5 16.7 16.8MDC 5.0 5.3 5.6 5.7 5.8 5.9 6.1 6.4 6.7LDC 19.6 21.0 22.2 22.1 22.1 22.2 22.0 21.9 21.8NAM 6.9 7.6 8.5 8.7 9.0 9.0 9.4 9.8 10.1WEU 4.6 4.9 5.1 5.3 5.7 6.0 6.4 6.9 7.3PAO 4.6 4.2 3.9 3.9 4.0 4.1 4.5 4.9 5.3EEU+FSU 4.0 4.1 4.1 4.2 4.3 4.4 4.6 5.0 5.3AFR 2.8 3.4 4.0 4.7 5.6 6.5 7.7 9.0 10.3LAM 1.6 1.9 2.2 2.4 2.7 2.8 3.1 3.3 3.5MEA 60.9 61.1 61.5 65.9 71.4 76.6 82.2 88.6 96.1CPA 15.0 16.8 18.6 18.9 19.4 19.8 20.5 21.0 21.6SAS 43.2 45.8 48.3 48.8 49.8 50.8 47.4 44.5 42.0PAS 5.2 5.3 5.5 5.5 5.7 5.8 5.8 5.8 5.9
(b) Projected WSI under mitigated A2r-mit scenario (using CSIRO B1 climate change)WORLD 13.6 14.9 16.2 15.9 15.8 15.6 15.7 15.9 16.0MDC 5.0 5.3 5.6 5.7 5.9 5.9 5.9 6.0 6.0LDC 19.6 21.1 22.4 21.7 21.2 20.8 20.8 20.9 21.0NAM 6.9 7.4 8.0 8.3 8.8 8.9 8.9 8.8 8.8WEU 4.6 5.1 5.7 5.6 5.8 5.8 6.0 6.1 6.3PAO 4.6 4.1 3.8 4.0 4.2 4.6 4.7 4.8 4.9EEU+FSU 4.0 4.2 4.4 4.4 4.4 4.4 4.5 4.7 4.8AFR 2.8 3.3 3.9 4.7 5.6 6.5 7.6 8.7 9.7LAM 1.6 1.9 2.2 2.4 2.6 2.8 2.9 3.0 3.2MEA 60.9 66.4 72.7 74.7 77.6 79.7 81.0 82.7 84.7CPA 15.0 16.9 18.9 18.7 18.7 18.7 19.1 19.5 19.9SAS 43.2 45.4 47.4 45.8 44.7 43.6 43.8 44.0 44.1PAS 5.2 5.2 5.3 5.5 5.7 5.9 6.0 6.0 6.1
Note: To better reflect water scarcity with regard to agricultural water demand, a weighted index has been calculated using theshare of each BLS sub-region's irrigated land in the regional total irrigated land as weights in aggregation.
1102 G. Fischer et al. / Technological Forecasting & Social Change 74 (2007) 1083–1107
2080 – from about 2630Gm3 water in 2000 to about 3280Gm3 in 2080. These estimates represent aresponse to the rise in irrigated land projected over this century.
The context behind these figures is that land and water resources, together with technological progress,appear to be sufficient to sustain irrigated production globally within the A2r socio-economicdevelopment and associated climate change, although with specific regional problems. Importantly, thisstudy quantified the potential benefits of mitigation to the agricultural water sector as a whole. Results canbe summarized as follows (ranges indicate GCM differences):
1) Under the socio-economic development pathways of the A2r reference scenario, without climatechange, agricultural water requirements are projected to increase by about 45%. Accordingly, waterwithdrawals increase 25%, from 2630Gm3 in 2000 to 3280Gm3 in 2080. These figures are based onan expansion of irrigated areas by 122Mha (i.e. +45%) and an increase in irrigation efficiency by

Fig. 3. Impacts of climate change and effects of mitigation on agricultural water withdrawals. Positive values indicate additionaannual costs, negative values correspond to benefits of mitigation (i.e., reduced irrigation costs with respect to the unmitigatedcase). (a) Global impact of climate change and (b) net global effect of mitigation, defined as A2r-mit minus A2r values.
1103G. Fischer et al. / Technological Forecasting & Social Change 74 (2007) 1083–1107
l
20%. While AWW is projected to modestly decrease in developed countries (20Gm3 or −4%), itincreases in developing countries by 540Gm3 (i.e., +32%).
2) Impacts of climate change on irrigation water requirements by 2080 are an additional 395–410Gm3 water in terms of net water requirements, which corresponds to an additional 670–725Gm3 in AWWs, compared with total agricultural withdrawals of 3280Gm3 in thereference case (without climate change). These figures mean an increase of about +20% inglobal irrigation water needs in 2080. Two-thirds of the increase (75–80% in developingcountries, but only 50–60% in developed countries) results from an increase in daily waterrequirements, and one-third occurs because of extended crop calendars in temperate and sub-tropical zones.
1104 G. Fischer et al. / Technological Forecasting & Social Change 74 (2007) 1083–1107
3) In terms of net water requirements, global water requirements in 2080, under climate change andwith mitigation, are 125–160Gm3 less than without mitigation. This projection corresponded tosavings of 220–275Gm3 in AWWs. These figures represent only 5–7% of the global irrigationwater needs under the non-mitigated A2r climate in 2080, yet in relative terms they mean a reductionof about 40% in additional water requirements from climate change. The distribution of these effectsis rather homogeneous across developed and developing regions.
4) By 2080, the global annual costs of additional irrigation water withdrawals for existing irrigatedland caused by climate change are estimated at 24–27billionUS$. Benefits of climate mitigationare small or even negative up to around 2040, but amount to some 8–10billionUS$ annually by2080.
5) The time evolution of irrigation water requirement was not constrained by the 2080 end results. Forinstance, aggregated water requirements in developed regions up to 2030 increased undermitigation with respect to no mitigation. Individually, negative effects of mitigation (i.e., increasesin water requirements compared to non-mitigated results) occur both in some developed and in somedeveloping regions, by up to 2.5% under Hadley and by up to 6.5% under CSIRO. Mitigationbecomes beneficial in all regions only in the second half of the century. Maximum benefits werecomputed for 2080, with a reduction in estimated regional AWWs of up to −14.5% under Hadleyand up to −10.5% under CSIRO.
6) The weighted WSI used to measure regional water scarcity in relation to agricultural water demandindicates that non-mitigated climate change could seriously affect the already water-critical MiddleEast region and may also aggravate scarcities in the Indian subcontinent. Even for South Asia, whereWSI improved with climate change through an increased monsoon precipitation, seasonal waterscarcity may intensify.
5. Conclusions
In summary, our simulation results suggest the following. First, globally the impacts of climatechange on increasing irrigation water requirements could be nearly as large as the changes projectedfrom socio-economic development in this century. Second, the effects of mitigation on irrigation waterrequirements can be significant in the coming decades, with large overall water savings, both globallyand regionally. Third, however, some regions may be negatively affected by mitigation actions (i.e.,become worse-off than under non-mitigated climate change) in the early decades, depending onspecific combinations of CO2 changes that affect crop water requirements and GCM-predictedprecipitation and temperature changes. Overall, this early ‘counter’ effect was less significant for waterresources than the simulated transient CO2 effects in the case of crop yields and agriculturalproduction [5].
As discussed, our projections of actual water withdrawals and associated costs are only rough estimatesthat represent a first attempt at quantification of these important variables. Future studies need to includedynamic interactions of land and water costs regionally and globally to provide more realistic projectionsof both irrigation water efficiency and cost as a function of water scarcity; they should also includecompetition from other sectors.
Finally, our analysis indicates that mitigation can and should play an important role in reducing theimpacts of climate change on agricultural water resources, globally and regionally. Countries that

1105G. Fischer et al. / Technological Forecasting & Social Change 74 (2007) 1083–1107
implement regional and global mitigation actions should also create additional resources to help thoseregions where the intended benefits do not materialize by enabling a range of adaptation options –particularly in those developing countries where food security is fragile and water resources are alreadyvulnerable today.
Acknowledgments
F.N. Tubiello was sponsored in part by IIASA–GGI, NOAA grant GC02-333, and NASA–NEESPI.The authors are grateful to FAO staff, in particular Jippe Hoogeveen and Jelle Bruinsma, for providinguseful comments and data. We thank two anonymous reviewers for additional comments and suggestionsthat significantly improved this work.
Appendix A. Table of abbreviations
AEZ
Agro-ecological zones AFR Africa Airr Total irrigated land extent AWW Gross agricultural water withdrawals for irrigation BLS Basic Linked System (world food system/economic model) CPA East Asia CRU Climate Research Unit of the University of East Anglia CSIRO Commonwealth Scientific and Industrial Research Organisation EEU Eastern Europe FAO Food and Agriculture Organization of the United Nations FSU Former Soviet Union GCM General Circulation Model IIASA International Institute for Applied Systems Analysis IPCC Intergovernmental Panel on Climate Change Irreff Irrigation efficiency LAM Latin America MEA Middle East and North Africa NAM North America P Precipitation PAO Pacific Asia PAS Southeast Asia PETref Reference evapotranspiration SAS South Asia SRES Special Report on Emissions Scenarios UN United Nations USDA United States Department of Agriculture WEU Other developed, mainly Europe, including Turkey WMO World Meteorological Organization WRI Internal renewable water resources WRQ Net crop irrigation water requirements WSI Water scarcity index WUEirr Crop irrigation water use efficiency
1106 G. Fischer et al. / Technological Forecasting & Social Change 74 (2007) 1083–1107
References
[1] F.N. Tubiello, Climate Variability and Agriculture: Perspectives on Current and Future Challenges. In: B. Knight (Ed.),Impact of Climate Change, Variability and Weather Fluctuations on Crops and Their Produce Markets. Impact Reports,Cambridge, UK, 2005, pp. 47–66.
[2] J. Diamond, Guns, Germs, and Steel: The Fates of Human Societies, Norton, New York, 1997.[3] J. Bruinsma (Ed.), World Agriculture: Towards 2015/1030, A FAO Perspective, Food and Agricultural Organization of the
United Nations, Rome, 2003, 432 pp.[4] G. Fischer, M. Shah, F.N. Tubiello, H. van Velthuizen, Socio-economic and climate change impacts on agriculture: an
integrated assessment, 1990–2080, Philos. Trans. R. Soc. B 360 (1463) (2005) 2067–2083, doi:10.1098/rstb.2005.1744.[5] F.N. Tubiello, G. Fischer, Reducing climate change impacts on agriculture: Global and regional effects of mitigation, 2000–
2080, Technol. Forecast. Soc. Change 74 (2007) 1030–1056, doi:10.1016/j.techfore.2006.05.027.[6] Millennium Ecosystem Assessment, Ecosystems and Human Well-being: Synthesis, Island Press, Washington DC, 2005.[7] R.T. Watson, I.R. Noble, B. Bolin, N.H. Ravindranath, D.J. Verardo, D.J. Dokken, IPCC special reports, Land Use, Land-
Use Change, and Forestry, Cambridge University Press, Cambridge, 2000, 324 pp.[8] Stockholm Environment Institute, UN Comprehensive Assessment of the Freshwater Resources of the World, 1997,
Stockholm Environment Institute/World Meteorological Organization, Stockholm, 1997.[9] C.R. Izaurralde, N.J Rosenberg, R.A. Brown, A.M. Thomson, Integrated Assessment of Hadley Center (HadCM2) Climate-
Change Impacts on Agricultural Productivity and Irrigation Water Supply in the Conterminous United States: Part II.Regional Agricultural Production in 2030 and 2095, Agricultural and Forest Meteorology, vol. 117, 2003, pp. 97–122.
[10] J. Reilly, F.N. Tubiello, B. McCarl, J. Melillo, Climate change and agriculture in the United States, in: J. Melillo, G. Janetos,T. Karl (Eds.), Climate Change Impacts on the United States: Foundation, USGCRP, Cambridge University Press,Cambridge, 2001, 612 pp.
[11] D.N. Yates, K.M. Strzepek, Modeling economy-wide climate change impacts on Egypt: a case for an integrated approach,Environ. Model. Assess. 1 (1996) 119–135.
[12] N. Arnell, Climate change and global water resources: SRES scenarios and socio-economic scenarios, Glob. Environ.Change 14 (2004) 31–52.
[13] J. Alcamo, P. Döll, T. Heinrichs, F. Kaspar, B. Lehner, T. Rösch, S. Siebert, Global estimates of water withdrawals andavailability under current and future business-as-usual conditions, Hydrol. Sci. J. 48 (2003) 339–348.
[14] C.J. Vorosmarty, P.J. Green, J. Salisbury, R.B. Lammers, Global water resources: vulnerability from climate change andpopulation growth, Science 289 (2000) 284–288.
[15] P. Döll, S. Siebert, Global modeling of irrigation water requirements, Water Resources Research 8 (4) (2001)1029–1035.
[16] P. Döll, Impact of climate change and variability on irrigation requirements: a global perspective, Clim. Change 54 (2002)269–293.
[17] M.L. Parry, C. Rosenzweig, A. Iglesias, M. Livermore, G. Fischer, Effects of climate change on global food productionunder SRES emissions and socio-economic scenarios, Glob. Environ. Change 14 (2004) 53–67.
[18] G. Fischer, M. Shah, H. van Velthuizen, Climate change and agricultural vulnerability, Special Report to the UN WorldSummit on Sustainable Development, Johannesburg 2002, IIASA, Laxenburg, 2002.
[19] G. Fischer, H. van Velthuizen, M. Shah, F.O. Nachtergaele, Global Agro-Ecological Assessment for Agriculture in the 21stCentury: Methodology and Results, IIASA RR-02-02, IIASA, Laxenburg, 2002.
[20] M.L. Parry, C. Rosenzweig, A. Iglesias, G. Fischer, M.T.J. Livermore, Climate change and world food security: a newassessment, Global Environmental Change 9 (1999) 51–67.
[21] K. Riahi, A. Gruebler, N. Nakicenovic, Scenarios of long-term socio-economic and environmental development underclimate stabilization, Technol. Forecast. Soc. Change 74 (2007) 887–935, doi:10.1016/j.techfore.2006.05.026.
[22] G. Fischer, K. Frohberg, M.A. Keyzer, K.S. Parikh, Linked National Models: A Tool for International Policy Analysis,Kluwer Academic Publishers, Amsterdam, 1988, 214 pp.
[23] USDA–NASS, Farm and Ranch Irrigation Survey (2003), Special Studies: Part 1, AC-02-SS-1, 2002 Census ofAgriculture, National Agricultural Statistics Service, vol. 3, US Department of Agriculture, Washington DC, 2004.
[24] IPCC, Climate Change 2001: The Scientific Basis. Contribution of Working Group I to the Third Assessment Report of theIntergovernmental Panel on Climate Change, Cambridge University Press, Cambridge, 2001.

1107G. Fischer et al. / Technological Forecasting & Social Change 74 (2007) 1083–1107
[25] IPCC, Climate Change 2001: Impacts, Adaptation, and Vulnerability. Contribution of Working Group II to the ThirdAssessment Report of the Intergovernmental Panel on Climate Change, Cambridge University Press, Cambridge, 2001.
[26] Ming Zhang, personal communication, Institute of Geographical Sciences and Natural Resources Research, ChineseAcademy of Sciences, Beijing, 2005.
[27] F. Chen, H. Tang, H. Zhang, C. Cai, Irrigation Water Use in China, CHINAGRO Working Paper, China AgriculturalUniversity, Beijing, China, 2005.
[28] K. Palanisami, Power pricing, groundwater extraction, use and management: comparison of Andhra Pradesh and TamilNadu States. Presentation for IWMI-TATA Water Policy Research Program, 2003 (online at http://www.iwmi.cgiar.org/iwmi-tata/index.asp?id=328).
[29] K. Palanisami, Economics of irrigation technology transfer and adoption, Irrigation Technology Transfer in Support of FoodSecurity, FAO, Water Reports, vol. 14, FAO, Rome, 1997.
[30] E. Perry, Low-cost irrigation technologies for food security in Sub-Saharan Africa, Irrigation Technology Transfer inSupport of Food Security, FAO, Water Reports, vol. 14, FAO, Rome, 1997.
[31] S. Postel, Pillar of Sand: Can the Irrigation Miracle Last? Norton, New York, 1999.
Günther Fischer leads the Land Use Change and Agriculture (LUC) Program at IIASA. His research focuses on global climatechange impacts, mitigation and adaptation, on regional analyses in Asia and Europe to support decision-making towardsustainable and efficient use of land and water resources, and on development of spatial analytical tools.
Francesco N. Tubiello is a research scientist at Columbia University, New York, and the International Institute for AppliedSystems Analysis in Laxenburg, Austria. His research focuses on the interactions between climate, agriculture, and the carboncycle.
Harrij van Velthuizen is a land resources ecologist at the International Institute for Applied Systems Analysis in Laxenburg,Austria. He joined IIASA's Land Use Change and Agriculture Program in 2001 and works on enhancement of the agro-ecological zones methodologies for various applications, including estimations of global and regional agricultural and bio-energyproduction potentials and impacts of climate variability and climate change on agricultural productivity.
DavidWiberg has been a research scholar in the Land Use Change Program at IIASA since 1997, where he has been developingmethodologies to assess the impact of land use and climate changes on basin water resource availability, demand, requiredstorage capacity, development costs and management options. He is involved in several international research projects at IIASAand has consulted for the Dialogue for Water and Climate and UNESCO's World Water Assessment Program.