climate change and lakes - globalnature.org
TRANSCRIPT

Climate change and lakes: effects on ecological status and status assessment
Peeter NõgesEstonian University of Life Sciences


NAO and water levelNAO and water level
0
100
200
300
400
500
60018
5918
6918
7918
8918
9919
0919
1919
2919
3919
4919
5919
6919
7919
8919
99
Year
WL
(cm
, arb
itrar
y)
-6
-4
-2
0
2
4
6
NA
Ow
L. Ladoga
NAOw
L. Peipsi
L. Võrtsjärv

Climate and Lake Impacts in Europe Climate and Lake Impacts in Europe
UKIRELAND
SWITZERLAND
AUSTRIA
GERMANY
FINLAND
SWEDEN
ESTONIA
HUNGARY

Eisenreich et al. 2005

Climate and Lake Impacts in Europe Climate and Lake Impacts in Europe
UKIRELAND
SWITZERLAND
AUSTRIA
GERMANY
FINLAND
SWEDEN
ESTONIA
HUNGARY
G. D. George
D. Straile M. Dokulil
T. Blenckner

Climate impact on Lakes in Europe
• Response of lakes to climate forcing is most coherent for physical parameters.
• Anticipated changes in the chemical regime of lakes are less coherent and depend strongly on lake type and local conditions.
• Because of complex interactions, biological changes induced by climate change are inherently unpredictable.

Outline
• Present status and trends in surface water quality in Europe
• Direct climatic impact on lakes• Climatic impact through catchment
processes• Climate change and water policy• Adaptation and mitigation measures

Present status and trends in surface water quality
Present status and trends in surface water quality

Trend in total ammonium (NH4 ) concentrations and BOD5 in selected WCE
rivers (1992–2004)
• Concentrations of organic matter (BOD5 ) and total ammonium (NH4 ) have generally decreased in rivers in the EEA member countries in the period 1992 to 2004, reflecting the general improvement in wastewater treatment over this period.
EEA 2007. EUROPE'S ENVIRONMENT | THE FOURTH ASSESSMENT

Phosphorus concentrations in selected WCE freshwater bodies
(1992–2004 )
EEA 2007. EUROPE'S ENVIRONMENT | THE FOURTH ASSESSMENT

Nitrate concentrations in selected WCE freshwater bodies
(1992–2004 )
EEA 2007. EUROPE'S ENVIRONMENT | THE FOURTH ASSESSMENT

Trends in nitrates 1992-2004
• Effect of EU measures (the Nitrates Directive)
• Decrease in agricultural activities
Percentage of river monitoring stations reporting trends
EEA 2007. EUROPE'S ENVIRONMENT | THE FOURTH ASSESSMENT

Compliance of EU bathing waters with Bathing Water Directive standards
EEA, 2009, http://www.eea.europa.eu
12 MS
15 MS
25 MS
21 MS
14 MS
27 MS

Direct climatic impactDirect climatic impact

http://www.climate-and-freshwater.info/

• Increase 1-3 °C• 2/3 of the increase
in R. Rhine is caused by the discharge of cooling waters
Water temperature in lakes and rivers
EEA – JRC – WHO, 2008, Indicator based assessment

-20 -15 -10 -5 0 5 10 15 20 25
Tartu Air temperature
-202468
101214161820222426
Võr
tsjä
rv, w
ater
tem
pera
ture
AT>0: r = 0.99, p < 0.00001
Water temperature depends on air temperature
Monthly mean values 1961-2004

Salmaso 2005
Deep water warming in perialpine lakes
T°
O2
TP

115
120
125
130
135
140
145
150
155
1832
1839
1846
1853
1860
1867
1874
1881
1888
1895
1902
1909
1916
1923
1930
1937
1944
1951
1958
1965
1972
1979
1986
1993
2000
Year
Day
num
ber f
rom
1st
of J
anua
ry
LEJ DA SAN MUREZZAN LAKE NÄSIJÄRVI LAKE KALLAVESI RIVER TORNIONJOKI
Ice break-up dates in Europe 1832-2006
EEA – JRC – WHO, 2008, Indicator based assessment
End of the Little Ice Age Strong effect of NAO

Mixing regimes
Nõges et al. 2009

Small and deep lakes
•Shift from being typically ice-covered in all winters to being ice-free in some winters.•Shift from being ice-free in some winters to being typically ice-free in all winters.•Shift from being typically ice-covered in all winters to being typically ice-free in all winters.
http://clime.tkk.fi/jrc/ Jolma & Kaitaranta, 2009

Ice breakupIce breakup
PeridiniumOchromonas
SynuraEuglena
Cyclotella

Ice breakupIce breakup

MüggelseeMüggelsee
• Between 1979 and 2003, the timing of the spring bloom advanced by 28.5 days.
• A switching point occurred in 1988
Julia
nda
y
Adrian et al. 2006

Duration of spring bloomDuration of spring bloom
Both the height and duration of the spring peak of diatoms depend on:
1. Nutrient availability
2. Duration of mixing period
Blenckner 2005

Duration of spring mixingDuration of spring mixing
Earlier ice breakup may result in
mixing stagnation
1. Longer mixing period

Duration of spring mixingDuration of spring mixingmixing stagnation
Earlier ice breakup may result in
1. Longer mixing period
2. Longer stratified period

Effects of longer stagnation period
Effects of longer stagnation period
Empoverishment of the epilimnion
Development of metalimnetic communities
Anoxia development and phosphorus release in the hypolimnion
O2
O2
O2
O2O2
O2
O2
O2
O2 O2 O2 O
PPP
PPP
PP
PP
P
P P
P

Sinivetikaõitsengud

Exotic or alien speciesExotic or alien species
Cylindrospermopsis raciborskii Cylindrospermopsis raciborskii

Spawning of bream and roach in Estonia
• Within forty years (1951-90), the spawning of bream shifted, on average, to a ten days earlier period but the range of spawning temperature remained unchanged
• There was no significant shift in the spawning time for roach, but the spawning temperature increased by about three degrees.W
ater
tem
pera
ture
, °C
Julia
n da
y

Effects through catchment processes

Towards European Harmonised Procedures for Quantification of Nutrient Losses from Diffuse Sources (2002-2005)
• 9 models tested in 17 catchments
• Eurajoki FI

EUROHARP: Major factors leading to losses of nutrients
(F. Bouraoui et al., J. Env. Monitoring, 2009)
• Climatic variables, in particular total rainfall explained most of the variance in the nutrient load at the catchments outlet.
• P concentration - mostly controlled by rain intensity (amount of rainfall during a rainy day) and by population density.
• N concentration - mainly controlled by the extent of the agricultural area.

• Replacement of winter snow by more erosive rain increases erosion from fields in agricultural areas
• Replacement of winter snow by more erosive rain increases erosion from fields in agricultural areas

• Observations and projections (2071-2100) of CC impacts on– hydrology – supply and re-cycling of N & P– flux of DOC from catchments– dynamics of phytoplankton
• Regional differences– Northern Europe– Western Europe (GB and Ireland)– Central Europe
2010. 450 pp. 24 Ch.Aquatic Ecology Series

Schneiderman et al.
Projected CC impacts on hydrology

Projected changes of P loads• Small changes in total annual P export• Changes in timing of P loadings• Higher T and lower O2
higher internal load
Pierson et al.

Projected changes in N loads
• Increase of total annual N loss from the catchments• Nordic catchments change most - high sensitivity to
small variations in rainfall and temperature
Nordic catchment Western catchment
DIN
flux
, kg/
km
2m
onth
Moore et al.

Nordic countries have experienced a doubling or even a tripling of water colour levels over the last decadesThe impact of climatic factors on DOC production and transport is complex and includes the combined effects of both temperature and precipitation on the decomposition, solubility and hydrological transport of these compounds (Jennings et al. 2010)
Water color changes in Lake Mälaren 1965-2003

• Mobility of DOC has increased due to increased soil water pH resulting from reduction of atmospheric sulphate deposition

Soil carbon and climate changeSchils et al., 2008
Soil carbonSoil carbon
50% in FI SE UK
N2 O CH4 CO2
DOC
Climate change
Land-usechange
296 2121 11

CC induced reacidification of surface waters
• In acid sulphate soils, climate-induced droughts may cause reacidification to the levels of late 1970s
– oxidation of previously stored reduced S- compounds in wetlands during drought low- flow periods
– subsequent efflux of sulphates upon re- wetting
(Aherne et al., 2007)

CC and water policyCC and water policy

Water bodies at risk not to meet the WFD objectives
• Number of water bodies meeting WFD objectives was low, sometimes only 1% and generally less than 40%.
• Significant pressures were diffuse pollution and physical degradation
• In southern Europe, over-exploitation of water resources.
1st WFD implementation report, 2007

CC sensitive aspects of ecological status assessment
• Typology of water bodies– Typology criteria
• Depth• Residence time• Mixing characteristics• Water level regime• Mean air temperature• Background nutrient status
• Ecological quality assessment– Type specific reference conditions– Quality class boundaries

Reference condition 2 mg/m3
2
8
14
H
G
M
P
B
Chl amg/m3
Eutrophication
Restoration measures
2015199019651940
Approach without considering CC
Restoration target8 mg/m3

Chl amg/m3
Eutrophication
Restoration measures
Climate change
2015199019651940
2
8
14
More bottom anoxia
More sediment P release
More algae production
Moving the targets (after having done the best with restoration measures)
H
G
M
P
B
Reference condition2 mg/m3
Restoration target8 mg/m3
( )
16 mg/m3
4 mg/m3
Strengthened restoration measures

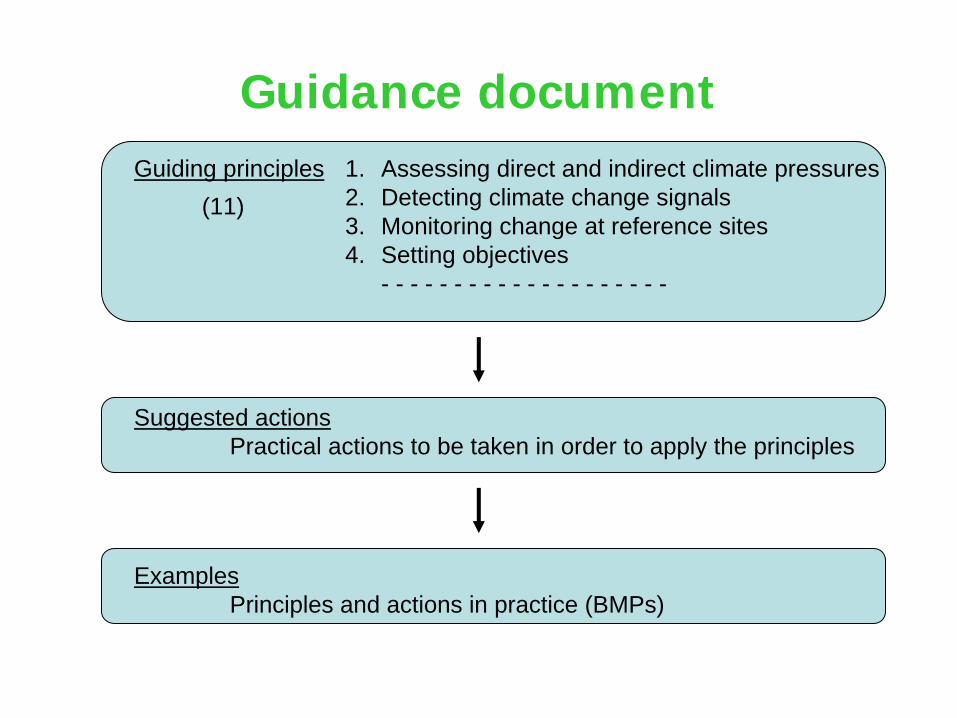
Guidance documentGuiding principles
ExamplesPrinciples and actions in practice (BMPs)
Suggested actionsPractical actions to be taken in order to apply the principles
1. Assessing direct and indirect climate pressures2. Detecting climate change signals3. Monitoring change at reference sites4. Setting objectives
- - - - - - - - - - - - - - - - - - - -
(11)

Examples of adaptation measures
• “Win-win” measures– Reduction of water use– Optimization of fertilizer use– Buffer strips
• “No regret” measures– Restoration of natural river beds and flood plains– Restoration of wetlands – Reforestation– Erosion control measures
• Potentially counter-productive measures– “Naturalisation” of rivers in densely populated areas – Dam construction– Modifications of land-use practices – Production of biofuels

Nutrient loads
Major CC related processes & concerns
Natural organic compounds
Hazardous substances
Oxygen depletion
Ecological status (effects on biota)Habitat fragmentationHabitat shiftLoss of biodiversityAlien species
Changed mobility of pollutants in soil andlake sediments
Changes in hydrology (river flow, lake levels, retention time, ice regime)
Increased thermal stability of lakes
Shifted timing of meteorological and biological processes

Thank you!

Pressure
Res
pons
e
+ CC
+ C
C
RC1
RC2
G/M 2G/M 1
EQR 1 = EQR 2

Pressure
Res
pons
e
+ CC
+ C
C
RC1 RC2
= GM 2G/M1
EQR 1 = EQR 2

Pressure
Res
pons
e
+ CC
+ C
C
RC1 = RC2
G/M 2 = G/M1
EQR 1 = EQR 2