climate change and disaster losses workshopre.indiaenvironmentportal.org.in/files/060525... ·...
TRANSCRIPT
25 - 26 May 2006
Hohenkammer
Germany
Climate Change and Disaster Losses Workshop
Understanding and Attributing Trends and Projections
We would like to thank the workshop sponsors:
Munich Reinsurance Company AG
GKSS Research Centre
Tyndall Centre for Climate Change Research
U.S. National Science Foundation
Partial support for this project is provided through the U.S. National Science Foundation under a grant to the University of Colorado titled “Science Policy Assessment and Research on Climate” (SPARC) .
- 1 -
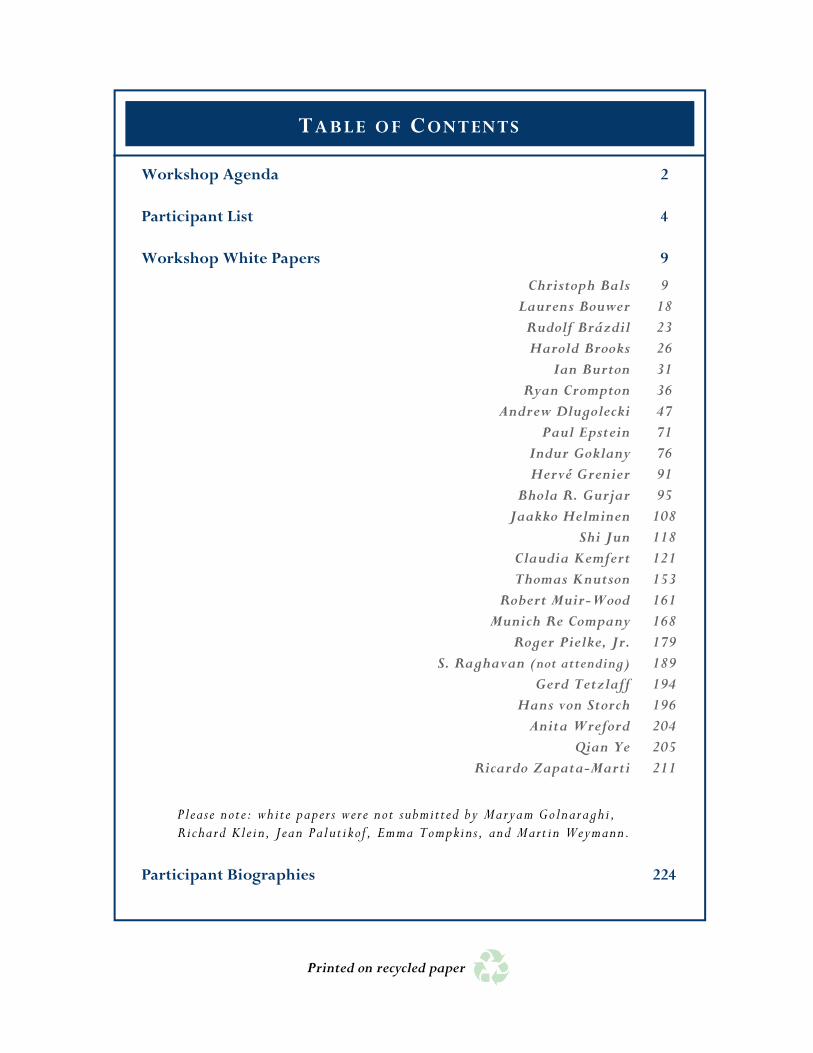
Workshop Agenda 2
Participant List 4
Workshop White Papers
Christoph Bals Laurens Bouwer
Rudolf Brázdil Harold Brooks
Ian Burton Ryan Crompton
Andrew Dlugolecki Paul Epstein
Indur Goklany Hervé Grenier
Bhola R. Gurjar Jaakko Helminen
Shi Jun Claudia Kemfert Thomas Knutson
Robert Muir-Wood Munich Re Company
Roger Pielke, Jr. S. Raghavan (not attending)
Gerd Tetzlaff Hans von Storch
Anita Wreford Qian Ye
Ricardo Zapata-Marti
9
9 18 23 26 31 36 47 71 76 91 95
108 118 121 153 161 168 179 189 194 196 204 205 211
Participant Biographies 224
T A BLE O F C ONTENTS
Please note: white papers were not submitted by Maryam Golnaraghi, Richard Klein, Jean Palutikof , Emma Tompkins, and Mart in Weymann.
Printed on recycled paper
- 2 -
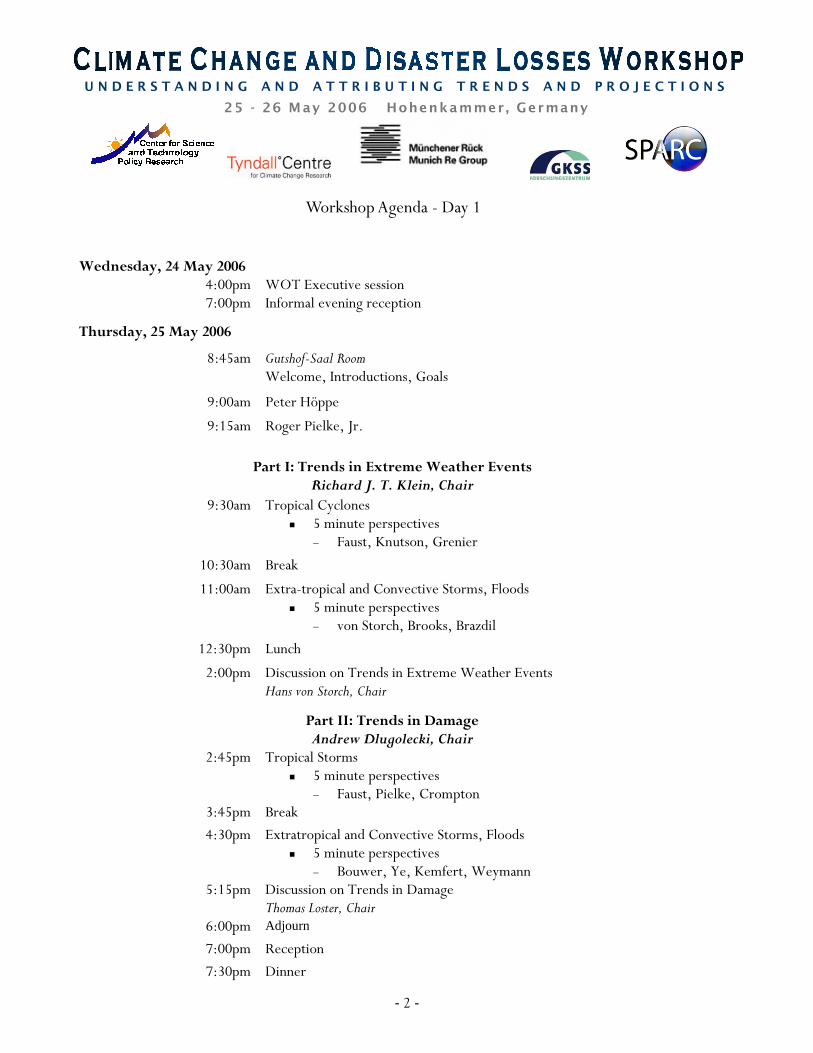
Workshop Agenda - Day 1
Wednesday, 24 May 2006 4:00pm 7:00pm
WOT Executive session Informal evening reception
Thursday, 25 May 2006
8:45am Gutshof-Saal Room Welcome, Introductions, Goals
9:00am Peter Höppe
9:15am Roger Pielke, Jr.
Part I: Trends in Extreme Weather Events
Richard J. T. Klein, Chair 9:30am Tropical Cyclones
5 minute perspectives − Faust, Knutson, Grenier
10:30am Break
11:00am Extra-tropical and Convective Storms, Floods 5 minute perspectives
− von Storch, Brooks, Brazdil
12:30pm Lunch
2:00pm Discussion on Trends in Extreme Weather Events Hans von Storch, Chair
2:45pm Tropical Storms 5 minute perspectives
− Faust, Pielke, Crompton 3:45pm Break
Part II: Trends in Damage Andrew Dlugolecki, Chair
4:30pm Extratropical and Convective Storms, Floods 5 minute perspectives
− Bouwer, Ye, Kemfert, Weymann 5:15pm Discussion on Trends in Damage
Thomas Loster, Chair 6:00pm Adjourn
7:00pm Reception
7:30pm Dinner
U N D E R S T A N D I N G A N D A T T R I B U T I N G T R E N D S A N D P R O J E C T I O N S 25 - 26 May 2006 Hohenkammer , Germany

- 3 -
Workshop Agenda - Day 2
Friday, 26 May 2006
Part III: Data Issues -- Extreme Weather Events and Damage Emma Tompkins, Chair
9:00am Event Data 5 minute perspectives
− Brazdil, Helminen, von Storch
9:45am Impacts Data 5 minute perspectives
− Wirtz, Schmidt, Gurjar 10:30am Break
11:00am Discussion on Data Issues Harold Brooks, Chair
Part IV: Synthesis Peter Höppe and Roger Pielke, Co-Chairs
11:30am Initial Remarks 5 minute perspectives
− Epstein, Burton, Goklany, Jun − Dlugolecki, Muir-Wood, Palutikof, Zapata-Marti
12:30pm Lunch
2:00pm Synthesis Forum Peter Höppe and Roger Pielke, Co-Chairs
5:00pm Closing remarks and Adjourn
Saturday, 27 May 2006
9:30am Workshop Organizing Team Executive Session
- 4 -
PARTICIPANT LIST
WOT = Workshop Organizing Team
1. Christoph Bals Germanwatch Bonn office Bonn, Germany [email protected] website: http://www.germanwatch.org/ 2. Laurens Bouwer ( WOT) Institute for Environmental Studies Vrije Universiteit Amsterdam, Netherlands [email protected] website: http://www.ivm.falw.vu.nl/go.cfm/linkID/F2F95626-96C7-4C7D-860DA0C7F18CFE27 3. Rudolf Brázdil Institute of Geography Masaryk University Brno, Czech Republic [email protected] website: http://is.muni.cz/lide/?uco=2755 4. Harold Brooks National Oceanic and Atmospheric Administration National Severe Storms Laboratory Norman, Oklahoma, United States [email protected] website: http://www.nssl.noaa.gov/~brooks 5. Ian Burton ( WOT) University of Toronto Meteorological Service of Canada Ontario, Canada [email protected] 6. Ryan Crompton Risk Frontiers Macquarie University Sydney, Australia [email protected] website: http://www.riskfrontiers.com/ 7. Andrew Dlugolecki Andlug Consulting Perth, United Kingdom [email protected]

- 5 -
8. Paul Epstein Center for Health and the Global Environment Harvard Medical School Boston, Massachusetts United States [email protected] website: http://www.med.harvard.edu/chge/epstein.html 9. Eberhard Faust ( WOT) Climate Risks, Department of Geo Risks Research/Environmental Management Munich Reinsurance Company Munich, Germany [email protected] website: http://www.munichre.com/ 10. Indur Goklany Science & Technology Policy Office of Policy Analysis Department of the Interior Washington, DC United States [email protected] 11. Maryam Golnaraghi Natural Disaster Prevention and Mitigation Programme World Meteorological Organization Genève, Suisse [email protected] 12. Hervé Grenier Risk modelling and weather derivatives Climate Scientist AXA Reinsurance Paris, France [email protected] 13. Bhola R. Gurjar ( WOT) Indian Institute of Technology Department of Civil Engineering Roorkee, INDIA [email protected] website: http://www.iitr.ernet.in/departments/CE/people/faculty/facthtml/bholafce.htm 14. Jaakko Helminen Climate Service Finnish Meteorological Institute Helsinki, Finland [email protected] website: http://www.fmi.fi
- 6 -
15. Peter Höppe (Workshop Co-Organizer, WOT) Department of Geo Risks Research/Environmental Management Munich Reinsurance Company AG Munich, Germany [email protected] website: http://www.munichre.com/ 16. Shi Jun Shanghai Climate Center Shanghai Meteorological Bureau Shanghai, P. R. China [email protected] 17. Claudia Kemfert DIW Berlin Department Energy, Transport and Environment Berlin, Germany [email protected] website: http://www.diw.de/programme/jsp/MA.jsp?language=en&uid=ckemfert 18. Richard J.T. Klein ( WOT) Global Change and Social Systems Potsdam Institute for Climate Impact Research Potsdam, Germany [email protected] website: http://www.pik-potsdam.de/~richardk/ 19. Thomas Knutson Climate Dynamics and Prediction Group Geophysical Fluid Dynamics Laboratory/NOAA Princeton, NJ United States [email protected] website: http://www.gfdl.noaa.gov/~tk/ 20. Thomas Loster ( WOT) Munich Re Foundation Munich, Germany [email protected] website: http://www.munichre-foundation.org/StiftungsWebsite/ 21. Robert Muir-Wood Risk Management Solutions London, England [email protected] website: http://www.rms.com/ 22. Jean Palutikof IPCC WGII TSU Exeter, United Kingdom [email protected]
- 7 -
23. Roger Pielke, Jr. (Workshop Co-Organizer, WOT) Center for Science and Technology Policy Research University of Colorado Boulder, Colorado United States [email protected] website: http://sciencepolicy.colorado.edu 24. Silvio Schmidt GeoRisks Research Department Munich Reinsurance Company German Institute for Economic Research (DIW) Berlin Munich, Germany [email protected] 25. Gerd Tetzlaff Meteorology, Universität Leipzig Institut für Meteorologie Leipzig, Germany [email protected] website: http://www.uni-leipzig.de/ 26. Emma Tompkins ( WOT) Oxford University Centre for the Environment Tyndall Centre for Climate Change Oxford, UK [email protected] website: http://www.21school.ox.ac.uk/index.shtml 27. Hans von Storch ( WOT) Institute for Coastal Research GKSS Research Center Geesthacht, Germany [email protected] website: http://coast.gkss.de/ 28. Martin Weymann Sustainability & Emerging Risk Management Swiss Reinsurance Company Mythenquai, Zurich [email protected] website: http://www.swissre.com/ 29. Angelika Wirtz ( WOT) Department of Geo Risks Research/Environmental Management Munich Reinsurance Company AG Munich, Germany [email protected] website: http://www.munichre.com/
- 8 -
30. Anita Wreford School of Environmental Sciences University of East Anglia Norwich, UK [email protected] 31. Qian Ye ( WOT) Center for Capacity Building National Center for Atmospheric Research Boulder, Colorado, United States [email protected] website: http://www.ccb.ucar.edu 32. Ricardo Zapata-Marti Focal Point for Disaster Evaluation, ECLAC CEPAL/México - Naciones Unidas México, D.F. [email protected] Logistics & Organizing Team Heidi Dümke Ami Nacu-Schmidt Geo Risks Research/Environmental Management Center for Science and Technology Policy Research Munich Reinsurance Company University of Colorado at Boulder Tel.: +49 89 3891 52 91 Tel: 001-303-735-3102 Fax.: +49 89 3891 752 91 Fax: 001-303-735-1576 [email protected] [email protected]
- 161 -
THE SEARCH FOR TRENDS IN A GLOBAL CATALOGUE OF NORMALIZED WEATHER-RELATED CATASTROPHE LOSSES
Robert-Muir Wood, Stuart Miller, Auguste Boissonade
Risk Management Solutions London, UK
Abstract
I n order to evaluate potential trends in global natural catastrophe losses it is important to compensate for changes in asset values and exposures over time. A study has been undertaken to create a Global Normalized Catastrophe Catalogue covering weather-related catastrophe losses in the principal developed (Australia, Canada, Europe, Japan, South Korea, US) and developing (Caribbean, Central America, China, India, the
Philippines) regions of the world. We have attempted to survey losses from 1950 to 2005 although data availability means that for many regions even for the largest events the record is incomplete before the 1970s. After 1970 when the global record becomes more comprehensive we find evidence of an annual upward trend for normalized losses of 2% per year) that corresponds with a period of rising global temperatures. However over this same period, in some regions, including Australia, India and the Philippines normalized losses have declined. The significance of the trend in global normalized losses is dominated by the affect of the 2004 and 2005 Atlantic hurricane seasons as well as by the bias in US wealth relative to other developing regions. What is presented here provides a short summary of the global results of this study. Full results are in course of publication also covering individual peril regions and the exploration of correlations with global temperatures.
Introduction
Economic losses attributed to natural disasters have increased from US $75.5 billion in the 1960s to $659.9 billion in the 1990s (a compound annual growth rate of 8%). Private sector data also shows rising insured losses over a similar period. Both reinsurers and some climate scientists have argued that these increases demonstrate a link between anthropogenically induced global warming and catastrophe losses. However, failing to adjust for time-variant economic factors yields loss amounts that are not directly comparable and a pronounced upward trend through time for purely economic reasons.
To allow for a comparison of losses over time many previous studies have adjusted past catastrophe losses to account for changes in monetary value in the form of inflation. However in most countries far larger changes have resulted from variations in wealth and the numbers and values of properties located in the path of the catastrophes. A full normalization of losses, which has been undertaken for the United States hurricane and flood, also includes the affect of changes in wealth and population to express losses in constant dollars. These previous national US assessments, as well as those for normalized Cuban hurricane losses, have failed to show an upward trend in losses over time, but this was before the remarkable hurricane losses of 2004 and 2005.
In order to assess global trends over time we set out to compile a database of normalized economic losses attributed to weather-related catastrophes from 1950 to 2005 from a large and representative sample of geographic regions. Regions were selected which had a reasonable centralization of catastrophe loss information as well as a broad range of peril types: tropical cyclone, extratropical cyclone, thunderstorm, hailstorm, wildfire and flood. The surveyed regions also span high and low latitude areas.
Although global in scope, this study does not cover all regions. We have, for example, not included losses from Africa
- 162 -
or South America; first because these continents are more affected by persistent climatological catastrophes (in particular drought) than sudden-onset weather-related catastrophes. Also the core economic loss data, in particular for much of Africa, is simply unavailable. However, the surveyed area includes the large majority of the world’s asset exposure (and the majority of the population).
Methodology
We normalize losses to 2005 USD by adjusting for changes in wealth (GDP per capita in USD), inflation and population. This methodology is consistent with that used by Pielke and Landsea (1998) and is given below:
NL2005 = Ly * (W2005/Wy) * (I2005)/Iy) * (P2005/Py),
where normalized losses in 2005 USD (NL2005) equal the product of losses in year y and the change ratios in wealth (W), inflation (I) and population (P). Where GDP per capita is expressed in nominal terms we omit the inflation multiplier.
Data
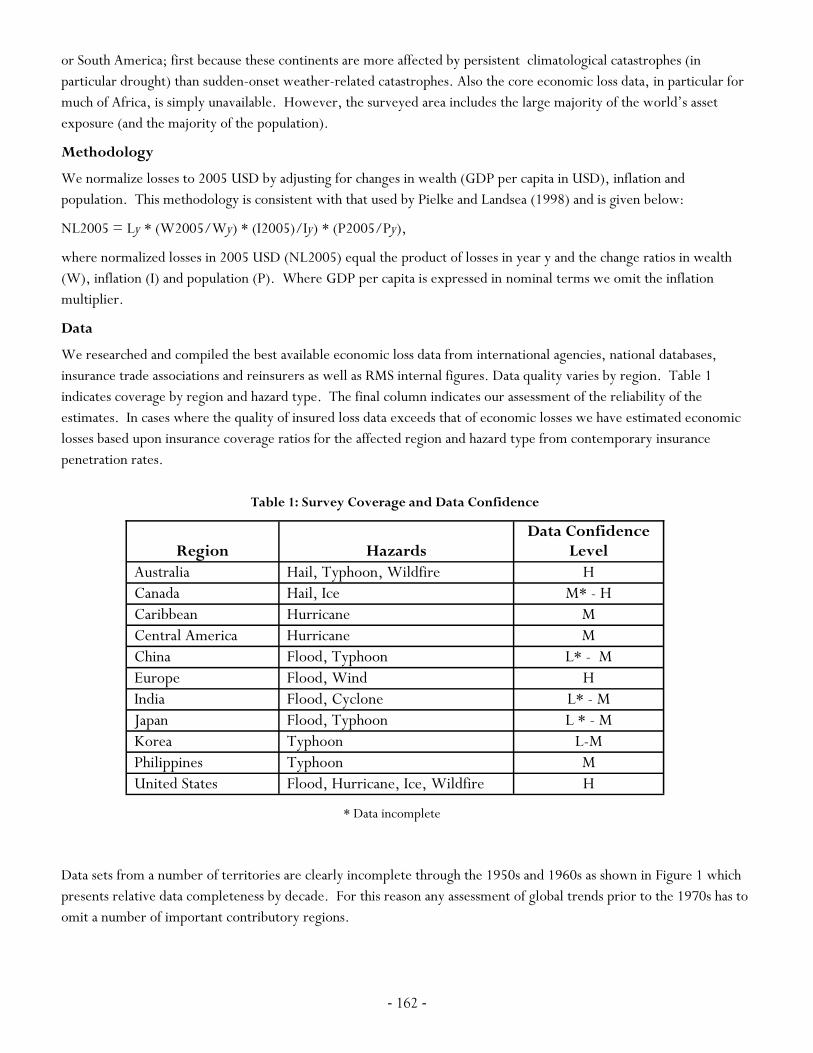
We researched and compiled the best available economic loss data from international agencies, national databases, insurance trade associations and reinsurers as well as RMS internal figures. Data quality varies by region. Table 1 indicates coverage by region and hazard type. The final column indicates our assessment of the reliability of the estimates. In cases where the quality of insured loss data exceeds that of economic losses we have estimated economic losses based upon insurance coverage ratios for the affected region and hazard type from contemporary insurance penetration rates.
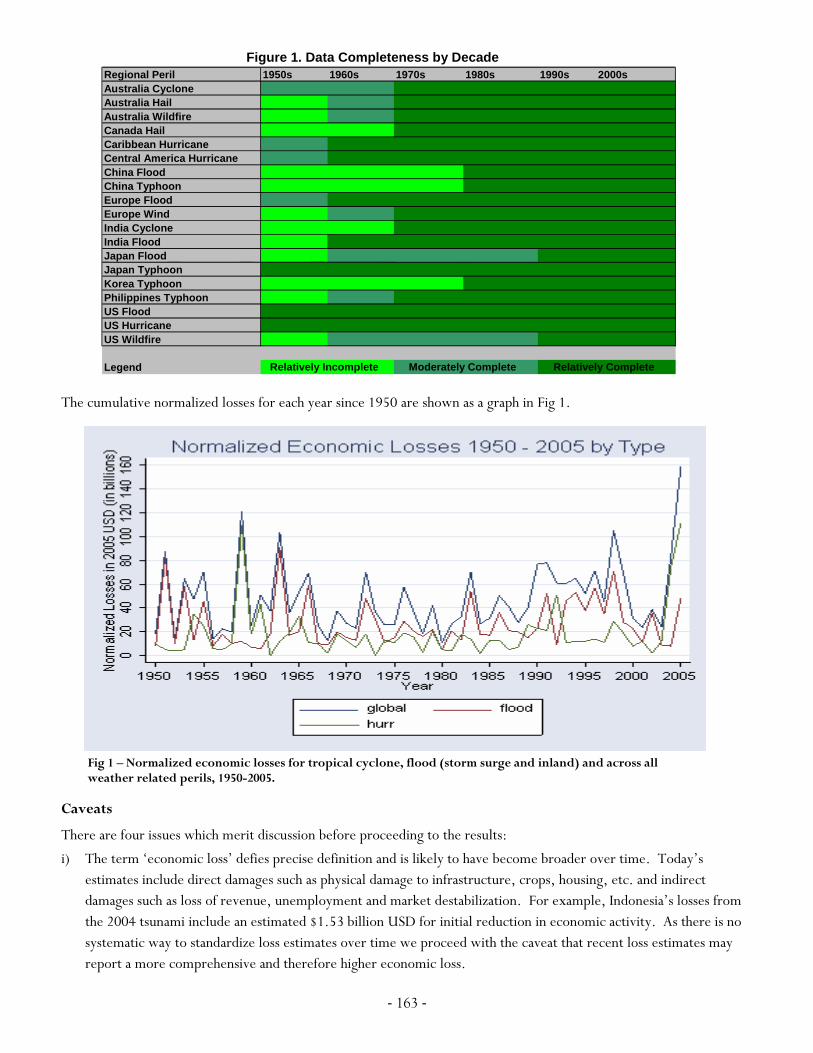
Data sets from a number of territories are clearly incomplete through the 1950s and 1960s as shown in Figure 1 which presents relative data completeness by decade. For this reason any assessment of global trends prior to the 1970s has to omit a number of important contributory regions.
Region Hazards Data Confidence
Level Australia Hail, Typhoon, Wildfire H Canada Hail, Ice M* - H Caribbean Hurricane M Central America Hurricane M China Flood, Typhoon L* - M Europe Flood, Wind H India Flood, Cyclone L* - M Japan Flood, Typhoon L * - M Korea Typhoon L-M Philippines Typhoon M United States Flood, Hurricane, Ice, Wildfire H
Table 1: Survey Coverage and Data Confidence
* Data incomplete
- 163 -
The cumulative normalized losses for each year since 1950 are shown as a graph in Fig 1.
Caveats
There are four issues which merit discussion before proceeding to the results:
i) The term ‘economic loss’ defies precise definition and is likely to have become broader over time. Today’s estimates include direct damages such as physical damage to infrastructure, crops, housing, etc. and indirect damages such as loss of revenue, unemployment and market destabilization. For example, Indonesia’s losses from the 2004 tsunami include an estimated $1.53 billion USD for initial reduction in economic activity. As there is no systematic way to standardize loss estimates over time we proceed with the caveat that recent loss estimates may report a more comprehensive and therefore higher economic loss.
Regional Peril 1950s 1960s 1970s 1980s 1990s 2000s Australia Cyclone Australia Hail Australia Wildfire Canada Hail Caribbean Hurricane Central America Hurricane China Flood China Typhoon Europe Flood Europe Wind India Cyclone India Flood Japan Flood Japan Typhoon Korea Typhoon Philippines Typhoon US Flood US Hurricane US Wildfire
Legend Relatively Complete Moderately Complete Relatively Incomplete
Figure 1. Data Completeness by Decade
Fig 1 – Normalized economic losses for tropical cyclone, flood (storm surge and inland) and across all weather related perils, 1950-2005.
- 164 -
ii) The reporting of economic loss estimates tends to improve with the size of the event and over time. Recent losses are almost everywhere better recorded due to improvements in communications, literacy, news coverage and insurance penetration. Failing to account for the summation of small to mid-size event losses below a certain monetary threshold (e.g. $1 billion USD) will certainly affect aggregated loss estimates for most countries in earlier decades, which is why the focus here has been the largest losses.
iii) The method of normalization employed here assumes a constant vulnerability through time. For wind and hail, vulnerability reflects the susceptibility of buildings to direct damage, while for flood and wildfire it is the degree to which communities have been protected from risk (with flood defenses and fire breaks). The bias of assuming constant vulnerability is strongest where substantial adaptation (mitigation) has occurred, as for normalizing 1950s and 1960s storm surge losses in northern Europe, 1950s and 1960s storm surge and river flood events in Japan or 1970s wind loss events in Australia. However for most perils and regions, such as US hurricane, real reductions in vulnerability have been modest. The question of testing the degree to which the affects of adaptation can be demonstrated from the normalized losses is considered further in the Discussion section.
iv) The normalization methodology employed uses national statistics to compute the multipliers. Previous US normalizations use State and County level data to normalize losses. With the benefit of county level resolution in the US we can see that the population growth rate between certain coastal, hazard-prone regions such as Florida is understated by using the national average. However, we consider the large-scale migration to hazardous coastal areas seen in the US to be the exception. In the developing countries we survey, industrialization has led to migration to urban areas, which generally have lower risk profiles than rural areas. In other countries there has been a greater balance between urban and coastal migration patterns.
Trend Analysis
To test for a trend in normalized losses over time we perform a linear regression of normalized economic losses on the year. The model is given below in equation 1.
(1) NLy = α + β1YEARy + εy
Normalized losses (NL) in year y are determined by the loss year (YEAR) y, where ε is the error term. If time is a significant determinant of loss level we would expect the year to be statistically significant. The coefficient sign will indicate the direction of the trend.
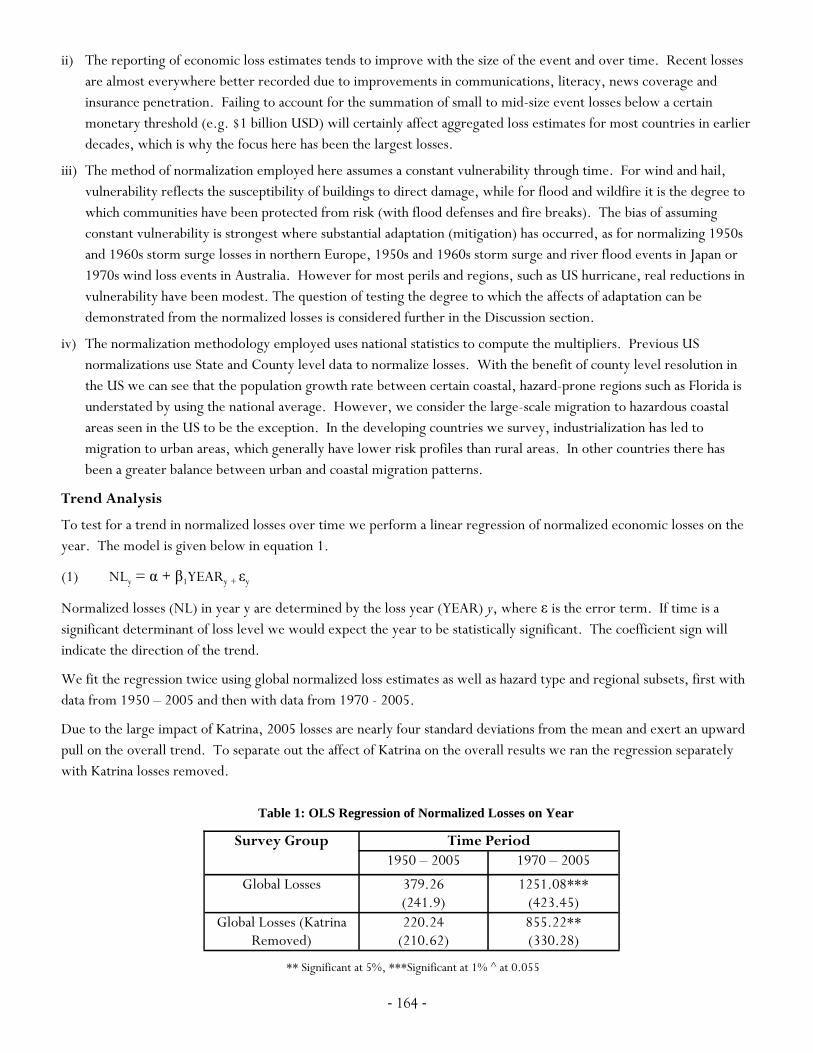
We fit the regression twice using global normalized loss estimates as well as hazard type and regional subsets, first with data from 1950 – 2005 and then with data from 1970 - 2005.
Due to the large impact of Katrina, 2005 losses are nearly four standard deviations from the mean and exert an upward pull on the overall trend. To separate out the affect of Katrina on the overall results we ran the regression separately with Katrina losses removed.
Survey Group Time Period 1950 – 2005 1970 – 2005
Global Losses 379.26 (241.9)
1251.08*** (423.45)
Global Losses (Katrina Removed)
220.24 (210.62)
855.22** (330.28)
Table 1: OLS Regression of Normalized Losses on Year
** Significant at 5%, ***Significant at 1% ^ at 0.055
- 165 -
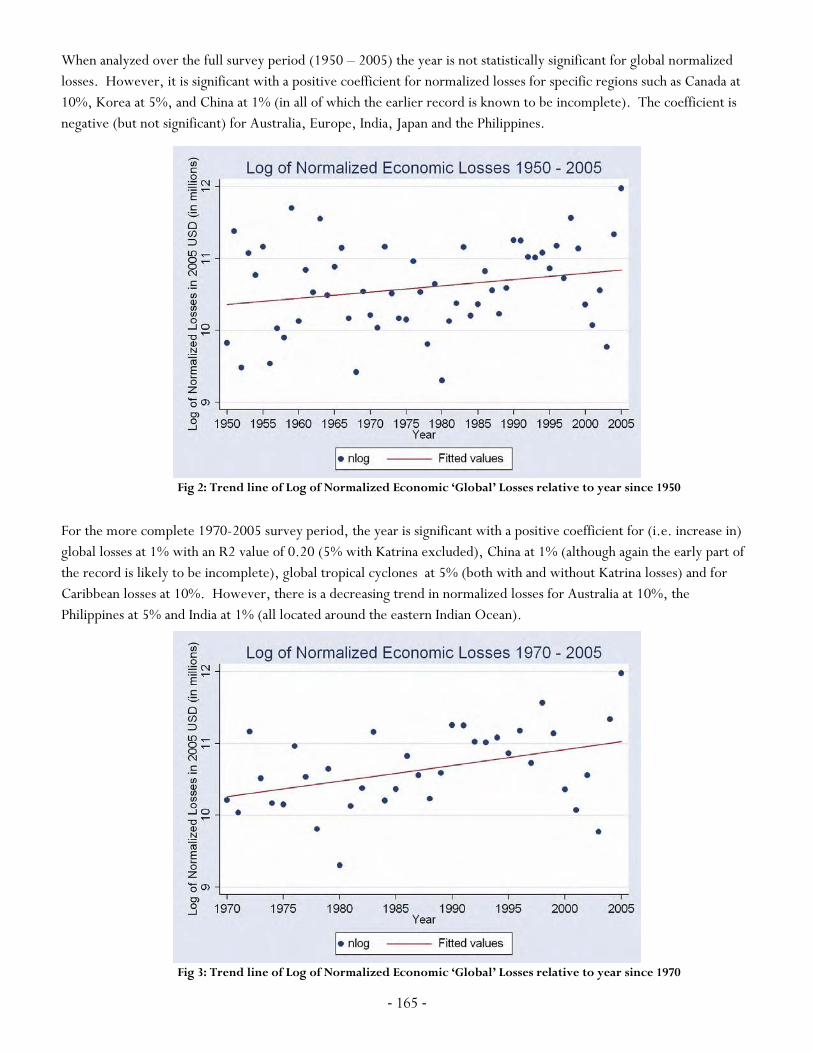
When analyzed over the full survey period (1950 – 2005) the year is not statistically significant for global normalized losses. However, it is significant with a positive coefficient for normalized losses for specific regions such as Canada at 10%, Korea at 5%, and China at 1% (in all of which the earlier record is known to be incomplete). The coefficient is negative (but not significant) for Australia, Europe, India, Japan and the Philippines.
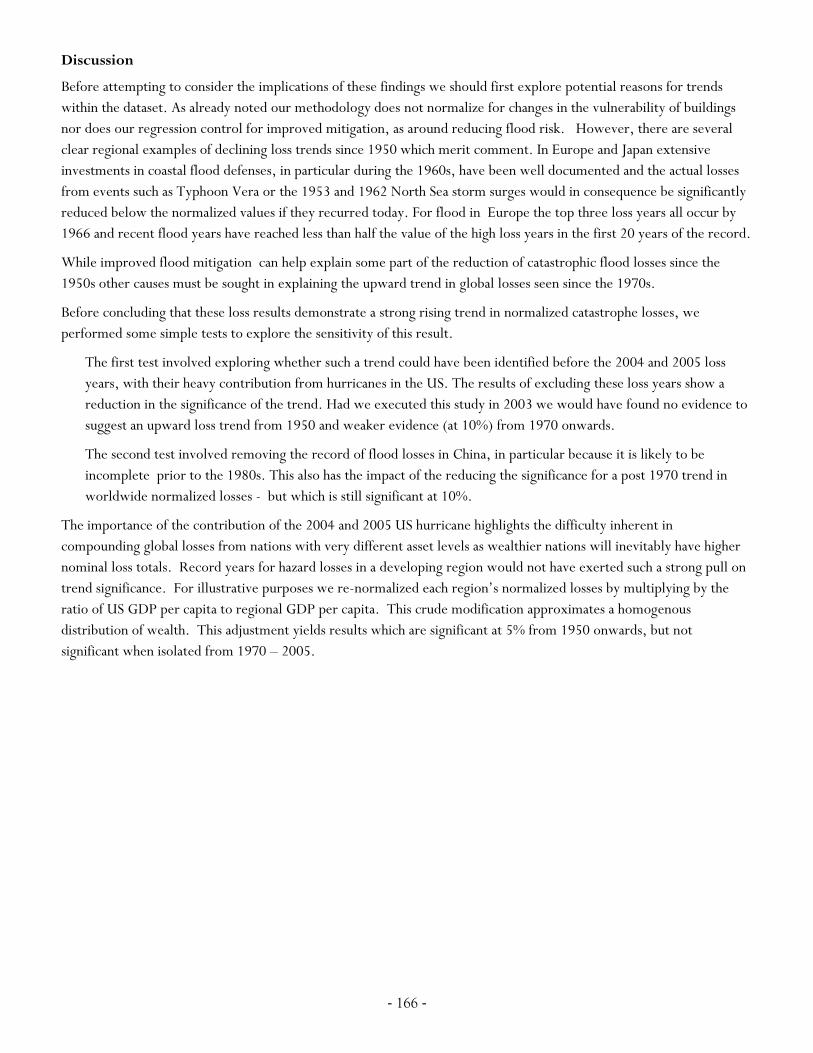
For the more complete 1970-2005 survey period, the year is significant with a positive coefficient for (i.e. increase in) global losses at 1% with an R2 value of 0.20 (5% with Katrina excluded), China at 1% (although again the early part of the record is likely to be incomplete), global tropical cyclones at 5% (both with and without Katrina losses) and for Caribbean losses at 10%. However, there is a decreasing trend in normalized losses for Australia at 10%, the Philippines at 5% and India at 1% (all located around the eastern Indian Ocean).
Fig 2: Trend line of Log of Normalized Economic ‘Global’ Losses relative to year since 1950
Fig 3: Trend line of Log of Normalized Economic ‘Global’ Losses relative to year since 1970
- 166 -
Discussion
Before attempting to consider the implications of these findings we should first explore potential reasons for trends within the dataset. As already noted our methodology does not normalize for changes in the vulnerability of buildings nor does our regression control for improved mitigation, as around reducing flood risk. However, there are several clear regional examples of declining loss trends since 1950 which merit comment. In Europe and Japan extensive investments in coastal flood defenses, in particular during the 1960s, have been well documented and the actual losses from events such as Typhoon Vera or the 1953 and 1962 North Sea storm surges would in consequence be significantly reduced below the normalized values if they recurred today. For flood in Europe the top three loss years all occur by 1966 and recent flood years have reached less than half the value of the high loss years in the first 20 years of the record.
While improved flood mitigation can help explain some part of the reduction of catastrophic flood losses since the 1950s other causes must be sought in explaining the upward trend in global losses seen since the 1970s.
Before concluding that these loss results demonstrate a strong rising trend in normalized catastrophe losses, we performed some simple tests to explore the sensitivity of this result.
The first test involved exploring whether such a trend could have been identified before the 2004 and 2005 loss years, with their heavy contribution from hurricanes in the US. The results of excluding these loss years show a reduction in the significance of the trend. Had we executed this study in 2003 we would have found no evidence to suggest an upward loss trend from 1950 and weaker evidence (at 10%) from 1970 onwards.
The second test involved removing the record of flood losses in China, in particular because it is likely to be incomplete prior to the 1980s. This also has the impact of the reducing the significance for a post 1970 trend in worldwide normalized losses - but which is still significant at 10%.
The importance of the contribution of the 2004 and 2005 US hurricane highlights the difficulty inherent in compounding global losses from nations with very different asset levels as wealthier nations will inevitably have higher nominal loss totals. Record years for hazard losses in a developing region would not have exerted such a strong pull on trend significance. For illustrative purposes we re-normalized each region’s normalized losses by multiplying by the ratio of US GDP per capita to regional GDP per capita. This crude modification approximates a homogenous distribution of wealth. This adjustment yields results which are significant at 5% from 1950 onwards, but not significant when isolated from 1970 – 2005.

- 167 -
References
1) United Nations Development Programme (UNDP). 2004. “Reducing Disaster Risk: A Challenge for Development.” http://www.undp.org/bcpr/disred/rdr.htm
2) Munich Re Group. 2005. “Annual Review: Natural Catastrophes 2004.” WKD Offsetdruck GmbH. Munich.
3) Swiss Reinsurance Company. 2005. Sigma: No.1 2005. “Natural Catastrophes and Man-made Disasters in 2004.” Swiss Reinsurance Company. Economic Research & Consulting. Zurich.
4) International Panel on Climate Change (IPCC). 2001. “IPCC Third Assessment Report – Climate Change 2001.” http://www.ipcc.ch/pub/reports.htm
5 Pielke, Roger A. Jr. and Christopher Landsea. 1998. “Normalized Hurricane Damage in the United States: 1925 – 95.” Weather and Forecasting. September 1998. pp. 621 - 631
6) Collins, Douglas J. and Stephen P. Lowe. 2001. “A Macro Validation Dataset for U.S. Hurricane Models.” http://www.casact.org/pubs/forum/01wforum/01wf217.pdf
7) National Oceanic & Atmospheric Administration (NOAA). 2005. “The Deadliest, Costliest, and Most Intense United States Tropical Cyclones From 1851 to 2004 (And Other Frequently Requested Hurricane Facts).” http://www.tpc.ncep.noaa.gov/pdf/NWS-TPC-4.pdf.
8) Pielke, Jr., R.A., M.W. Downton, and J.Z. Barnard Miller, 2002: Flood Damage in the United States, 1926-2000: A Reanalysis of National Weather Service Estimates. Boulder, CO: UCAR.
9) Pielke, R.A., Jr., and Jose Ribeira, Christopher Landsea, Mario L. Fernández, and Roberta Klein. 2003. “Hurricane Vulnerability in Latin America and the Caribbean: Normalized Damage and Loss Potentials.” Natural Hazards Review. August 2003. pp. 101 – 114