climate change and alpine vegetation shifts on … · lichens and bryophytes ... highly productive...
TRANSCRIPT

Faculty of Bioscience Engineering
Academic year 2015 – 2016
Climate Change and Alpine Vegetation Shifts on Mountaintop
Summits in Norway
Thomas Vanneste
Promotors: prof. dr. ir. Pieter De Frenne and prof. dr. ir. Kris Verheyen
Master thesis submitted in fulfilment of the requirements for the degree of
Master of Bioscience Engineering: Land and Water Management

I
Preface
The field work and data collection for this thesis was carried out within the framework of the third
vegetation sampling campaign of the Global Observation Research Initiative in Alpine Environments
(GLORIA). In 2015, the field work was financed by the Norwegian Environment Agency
(Miljødirektoratet), whereas the field work in 2001 and 2008 was financed by the GLORIA-Europe
project within the 5th RTD - Framework Program of the European Union and the Norwegian
Directorate for Nature Management, respectively. Moreover, with the help of their technician,
Manfred Bardy-Durchhalter, I was able to access the complete temperature and vegetation dataset
from 2001 and 2008.
I would like to thank my supervisors Pieter De Frenne and Kris Verheyen for their excellent guidance
and support during the writing process of this thesis. Not only did they provide me with some relevant
comments and corrections, but they also assisted with the statistical analysis.
In addition, I would like to express my gratitude to the people who assisted me during the field work,
in particular Magni Olsen Kyrkjeeide, Rozália Kapás, Sigrid Lindmo and Ottar Michelsen. With their
help, I acquired some valuable local plant knowledge and was able to schedule and carry out the field
work within the provided time period. Furthermore, I acknowledge Ottar Michelsen for helping me to
read out the temperature loggers and providing me with additional data for the malfunctioning loggers.
I also thank Håkon Holien and Kristian Hassel for determining the altitudinal ranks of the lichens and
bryophytes.
Finally, I would also like to thank Bente Jessen Graae for arranging the accommodation and Mia
Vedel and her team for keeping me alive and, above all, well-fed with the delicious vegetarian cooking
during my four-week stay at the Villreinsenter in Hjerkinn, Norway.
Thomas Vanneste
Ghent, June 2016
II
Table of Contents
Preface ...................................................................................................................................................... I
List of abbreviations .............................................................................................................................. IV
Abstract .................................................................................................................................................. V
Samenvatting ......................................................................................................................................... VI
Introduction ............................................................................................................................................. 1
Literature review ..................................................................................................................................... 3
Tundra ecosystems .............................................................................................................................. 3
Climate change: history, processes, causes and effects and future projections ................................... 6
Ecological and evolutionary responses of tundra ecosystems to climate change .............................. 11
General consensus ......................................................................................................................... 11
Phenology changes ........................................................................................................................ 11
Distribution shifts .......................................................................................................................... 12
Community reorganization and ecosystem responses ................................................................... 18
Feedbacks of biodiversity changes on ecosystem processes ......................................................... 21
Other possible drivers of ecological responses in tundra ecosystems ............................................... 22
Aims .................................................................................................................................................. 24
Materials and methods ........................................................................................................................... 25
Study area .......................................................................................................................................... 25
Geography ..................................................................................................................................... 26
Geology ......................................................................................................................................... 26
Macroclimate ................................................................................................................................. 27
Ecology .......................................................................................................................................... 30
Flora .......................................................................................................................................... 30
Fauna ......................................................................................................................................... 30
Management .................................................................................................................................. 31
The GLORIA project ......................................................................................................................... 31
Study design ...................................................................................................................................... 33
Climatic data...................................................................................................................................... 37
Statistical analyses ............................................................................................................................. 37
Results ................................................................................................................................................... 41
Microclimate ..................................................................................................................................... 41
Vegetation ......................................................................................................................................... 43
Vegetation status in 2015 .............................................................................................................. 43
III
Vascular plants in the quadrats and summit area sections ......................................................... 43
Lichens and bryophytes ............................................................................................................. 43
Changes over time ......................................................................................................................... 47
γ-diversity .................................................................................................................................. 47
α-diversity: vascular plants in quadrats and the summit area sections ...................................... 47
α-diversity: lichens and bryophytes ........................................................................................... 50
β-diversity: modified Gower dissimilarity indices for the quadrats .......................................... 53
β-diversity: Species composition ............................................................................................... 55
Thermophilization ..................................................................................................................... 57
Responses of individual species ................................................................................................ 60
Discussion ............................................................................................................................................. 62
Temporal changes in climate ............................................................................................................. 62
Vegetation analysis ............................................................................................................................ 65
Changes with elevation and aspect (2015) .................................................................................... 65
Vascular plants .......................................................................................................................... 65
Lichens and bryophytes ............................................................................................................. 67
Changes over time (2001-2015) .................................................................................................... 69
Vascular plants .......................................................................................................................... 69
Lichens and bryophytes ............................................................................................................. 69
Species composition .................................................................................................................. 71
Thermophilization ..................................................................................................................... 73
Other possible drivers of the observed vegetation changes ........................................................... 75
Conclusion ............................................................................................................................................. 80
Future perspectives ................................................................................................................................ 81
References ............................................................................................................................................. 82
Appendix ............................................................................................................................................. 103
Appendix A: fauna in the Dovrefjell National Park ........................................................................ 103
Appendix B: installation of the quadrat clusters ............................................................................. 105
Appendix C: installation of the summit area sections ..................................................................... 106
Appendix D: supplementary figures ................................................................................................ 107
Appendix E: species lists ................................................................................................................. 111
Appendix F: abbreviations of the names of vascular plant, lichen and bryophyte species ............. 114
Appendix G: temporal changes in percentage cover ....................................................................... 117
Appendix H: altitudinal ranks ......................................................................................................... 120
IV
List of abbreviations
a.s.l. above sea level
ACIA Arctic Climate Impact Assessment
ANOVA Analysis of Variance
E East
ENSO El Niño - Southern Oscillation
GCM General Circulation Model
GLORIA Global Observation Research Initiative in Alpine Environments
Gt Gigatons
HSP Highest Summit Point
IPCC Intergovernmental Panel on Climate Change
KOL Kolla (one of the mountains under study)
LAI Leaf Area Index
MATA Mean Annual Temperature Anomaly
N North
NAO North Atlantic Oscillation
NINA Norwegian Institute for Nature Research
NMDS Non-metric Multidimensional Scaling
PERMANOVA Permutational Multivariate Analysis of Variance
ppb parts per billion
ppm parts per million
RPC Representative Concentration Pathway
S South
S.D. Standard Deviation
S.E. Standard Error of the Mean
SAS Summit Area Sections
SKI Storkinn (one of the mountains under study)
SST Sea Surface Temperature
VAR Vesle Armodshøkollen (one of the mountains under study)
VKO Veslekolla (one of the mountains under study)
W West
V
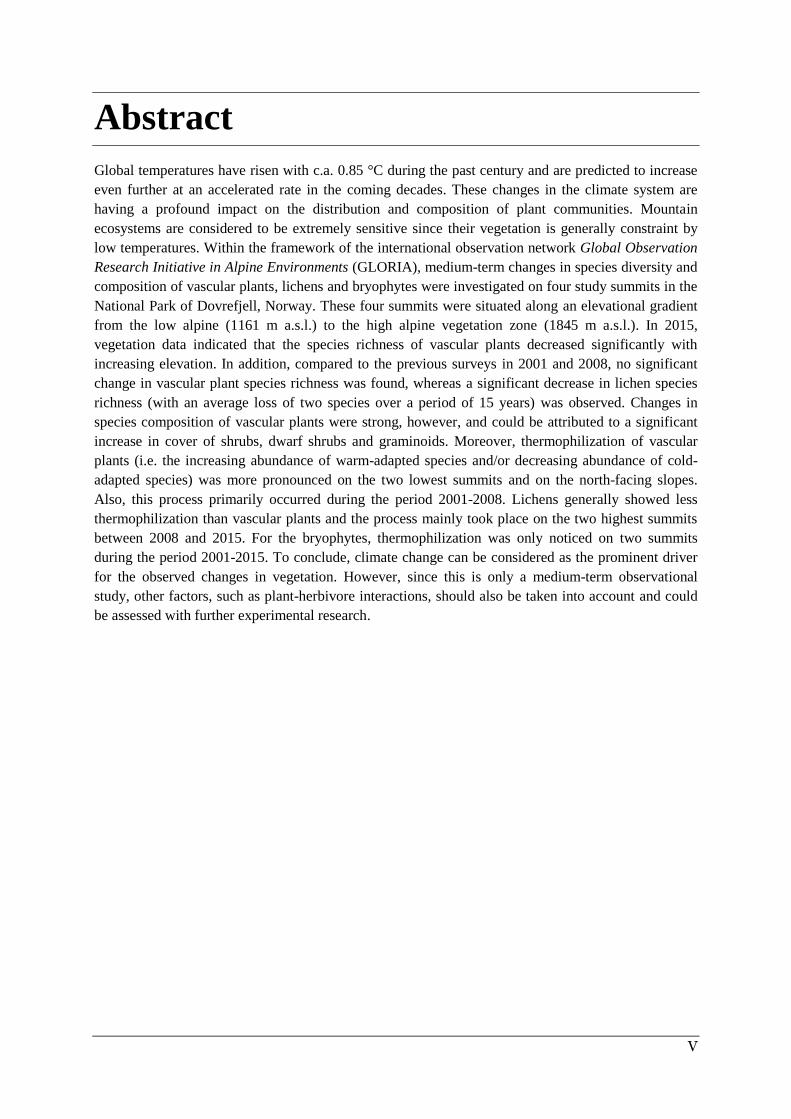
Abstract
Global temperatures have risen with c.a. 0.85 °C during the past century and are predicted to increase
even further at an accelerated rate in the coming decades. These changes in the climate system are
having a profound impact on the distribution and composition of plant communities. Mountain
ecosystems are considered to be extremely sensitive since their vegetation is generally constraint by
low temperatures. Within the framework of the international observation network Global Observation
Research Initiative in Alpine Environments (GLORIA), medium-term changes in species diversity and
composition of vascular plants, lichens and bryophytes were investigated on four study summits in the
National Park of Dovrefjell, Norway. These four summits were situated along an elevational gradient
from the low alpine (1161 m a.s.l.) to the high alpine vegetation zone (1845 m a.s.l.). In 2015,
vegetation data indicated that the species richness of vascular plants decreased significantly with
increasing elevation. In addition, compared to the previous surveys in 2001 and 2008, no significant
change in vascular plant species richness was found, whereas a significant decrease in lichen species
richness (with an average loss of two species over a period of 15 years) was observed. Changes in
species composition of vascular plants were strong, however, and could be attributed to a significant
increase in cover of shrubs, dwarf shrubs and graminoids. Moreover, thermophilization of vascular
plants (i.e. the increasing abundance of warm-adapted species and/or decreasing abundance of cold-
adapted species) was more pronounced on the two lowest summits and on the north-facing slopes.
Also, this process primarily occurred during the period 2001-2008. Lichens generally showed less
thermophilization than vascular plants and the process mainly took place on the two highest summits
between 2008 and 2015. For the bryophytes, thermophilization was only noticed on two summits
during the period 2001-2015. To conclude, climate change can be considered as the prominent driver
for the observed changes in vegetation. However, since this is only a medium-term observational
study, other factors, such as plant-herbivore interactions, should also be taken into account and could
be assessed with further experimental research.
VI
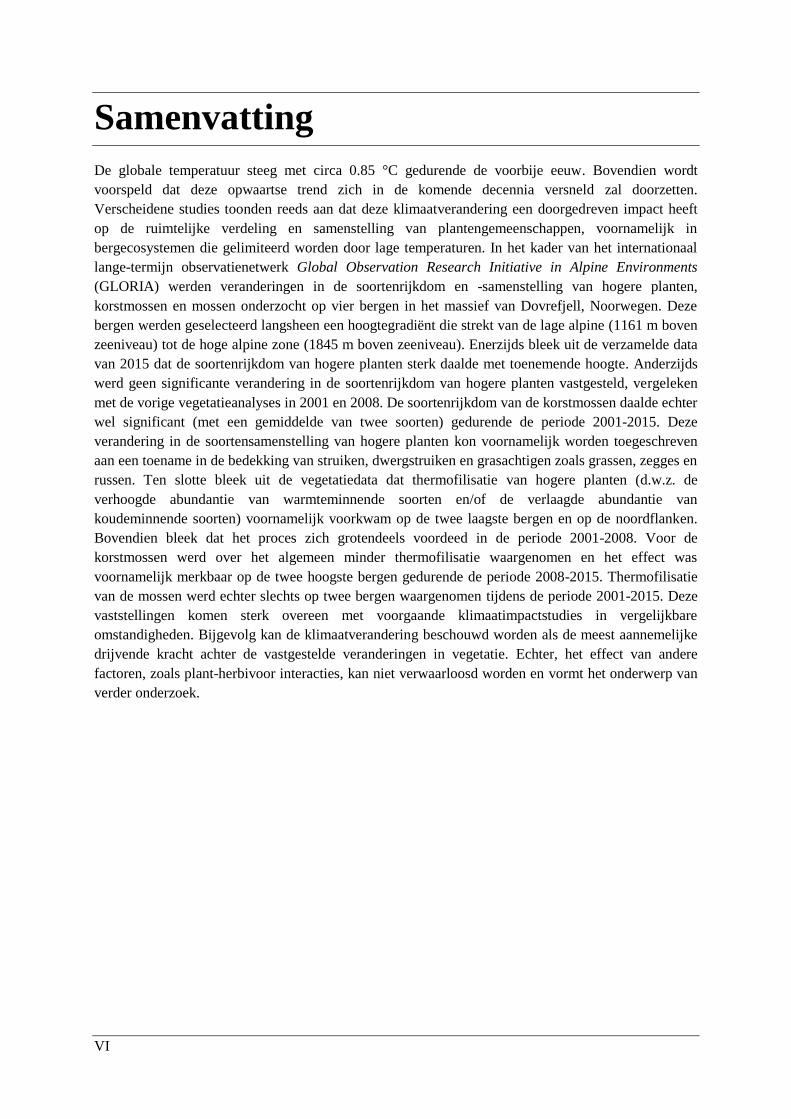
Samenvatting
De globale temperatuur steeg met circa 0.85 °C gedurende de voorbije eeuw. Bovendien wordt
voorspeld dat deze opwaartse trend zich in de komende decennia versneld zal doorzetten.
Verscheidene studies toonden reeds aan dat deze klimaatverandering een doorgedreven impact heeft
op de ruimtelijke verdeling en samenstelling van plantengemeenschappen, voornamelijk in
bergecosystemen die gelimiteerd worden door lage temperaturen. In het kader van het internationaal
lange-termijn observatienetwerk Global Observation Research Initiative in Alpine Environments
(GLORIA) werden veranderingen in de soortenrijkdom en -samenstelling van hogere planten,
korstmossen en mossen onderzocht op vier bergen in het massief van Dovrefjell, Noorwegen. Deze
bergen werden geselecteerd langsheen een hoogtegradiënt die strekt van de lage alpine (1161 m boven
zeeniveau) tot de hoge alpine zone (1845 m boven zeeniveau). Enerzijds bleek uit de verzamelde data
van 2015 dat de soortenrijkdom van hogere planten sterk daalde met toenemende hoogte. Anderzijds
werd geen significante verandering in de soortenrijkdom van hogere planten vastgesteld, vergeleken
met de vorige vegetatieanalyses in 2001 en 2008. De soortenrijkdom van de korstmossen daalde echter
wel significant (met een gemiddelde van twee soorten) gedurende de periode 2001-2015. Deze
verandering in de soortensamenstelling van hogere planten kon voornamelijk worden toegeschreven
aan een toename in de bedekking van struiken, dwergstruiken en grasachtigen zoals grassen, zegges en
russen. Ten slotte bleek uit de vegetatiedata dat thermofilisatie van hogere planten (d.w.z. de
verhoogde abundantie van warmteminnende soorten en/of de verlaagde abundantie van
koudeminnende soorten) voornamelijk voorkwam op de twee laagste bergen en op de noordflanken.
Bovendien bleek dat het proces zich grotendeels voordeed in de periode 2001-2008. Voor de
korstmossen werd over het algemeen minder thermofilisatie waargenomen en het effect was
voornamelijk merkbaar op de twee hoogste bergen gedurende de periode 2008-2015. Thermofilisatie
van de mossen werd echter slechts op twee bergen waargenomen tijdens de periode 2001-2015. Deze
vaststellingen komen sterk overeen met voorgaande klimaatimpactstudies in vergelijkbare
omstandigheden. Bijgevolg kan de klimaatverandering beschouwd worden als de meest aannemelijke
drijvende kracht achter de vastgestelde veranderingen in vegetatie. Echter, het effect van andere
factoren, zoals plant-herbivoor interacties, kan niet verwaarloosd worden en vormt het onderwerp van
verder onderzoek.
1
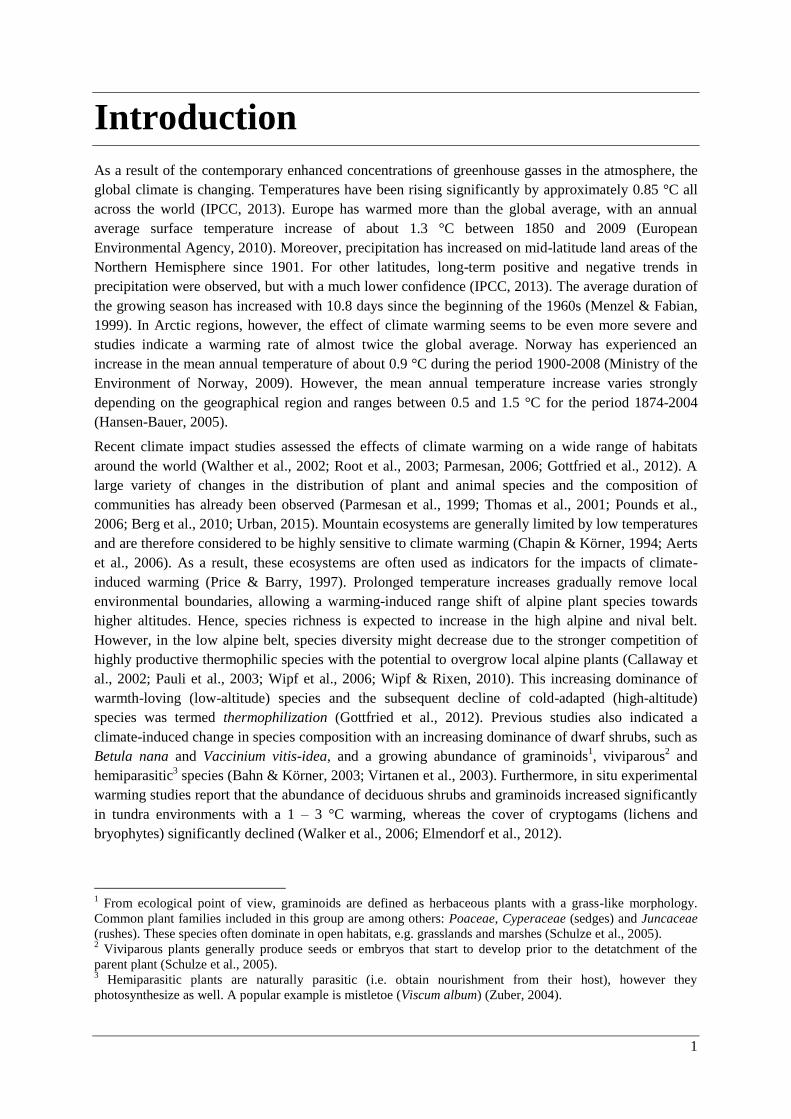
Introduction
As a result of the contemporary enhanced concentrations of greenhouse gasses in the atmosphere, the
global climate is changing. Temperatures have been rising significantly by approximately 0.85 °C all
across the world (IPCC, 2013). Europe has warmed more than the global average, with an annual
average surface temperature increase of about 1.3 °C between 1850 and 2009 (European
Environmental Agency, 2010). Moreover, precipitation has increased on mid-latitude land areas of the
Northern Hemisphere since 1901. For other latitudes, long-term positive and negative trends in
precipitation were observed, but with a much lower confidence (IPCC, 2013). The average duration of
the growing season has increased with 10.8 days since the beginning of the 1960s (Menzel & Fabian,
1999). In Arctic regions, however, the effect of climate warming seems to be even more severe and
studies indicate a warming rate of almost twice the global average. Norway has experienced an
increase in the mean annual temperature of about 0.9 °C during the period 1900-2008 (Ministry of the
Environment of Norway, 2009). However, the mean annual temperature increase varies strongly
depending on the geographical region and ranges between 0.5 and 1.5 °C for the period 1874-2004
(Hansen-Bauer, 2005).
Recent climate impact studies assessed the effects of climate warming on a wide range of habitats
around the world (Walther et al., 2002; Root et al., 2003; Parmesan, 2006; Gottfried et al., 2012). A
large variety of changes in the distribution of plant and animal species and the composition of
communities has already been observed (Parmesan et al., 1999; Thomas et al., 2001; Pounds et al.,
2006; Berg et al., 2010; Urban, 2015). Mountain ecosystems are generally limited by low temperatures
and are therefore considered to be highly sensitive to climate warming (Chapin & Körner, 1994; Aerts
et al., 2006). As a result, these ecosystems are often used as indicators for the impacts of climate-
induced warming (Price & Barry, 1997). Prolonged temperature increases gradually remove local
environmental boundaries, allowing a warming-induced range shift of alpine plant species towards
higher altitudes. Hence, species richness is expected to increase in the high alpine and nival belt.
However, in the low alpine belt, species diversity might decrease due to the stronger competition of
highly productive thermophilic species with the potential to overgrow local alpine plants (Callaway et
al., 2002; Pauli et al., 2003; Wipf et al., 2006; Wipf & Rixen, 2010). This increasing dominance of
warmth-loving (low-altitude) species and the subsequent decline of cold-adapted (high-altitude)
species was termed thermophilization (Gottfried et al., 2012). Previous studies also indicated a
climate-induced change in species composition with an increasing dominance of dwarf shrubs, such as
Betula nana and Vaccinium vitis-idea, and a growing abundance of graminoids1, viviparous
2 and
hemiparasitic3 species (Bahn & Körner, 2003; Virtanen et al., 2003). Furthermore, in situ experimental
warming studies report that the abundance of deciduous shrubs and graminoids increased significantly
in tundra environments with a 1 – 3 °C warming, whereas the cover of cryptogams (lichens and
bryophytes) significantly declined (Walker et al., 2006; Elmendorf et al., 2012).
1 From ecological point of view, graminoids are defined as herbaceous plants with a grass-like morphology.
Common plant families included in this group are among others: Poaceae, Cyperaceae (sedges) and Juncaceae
(rushes). These species often dominate in open habitats, e.g. grasslands and marshes (Schulze et al., 2005). 2 Viviparous plants generally produce seeds or embryos that start to develop prior to the detatchment of the
parent plant (Schulze et al., 2005). 3 Hemiparasitic plants are naturally parasitic (i.e. obtain nourishment from their host), however they
photosynthesize as well. A popular example is mistletoe (Viscum album) (Zuber, 2004).
2
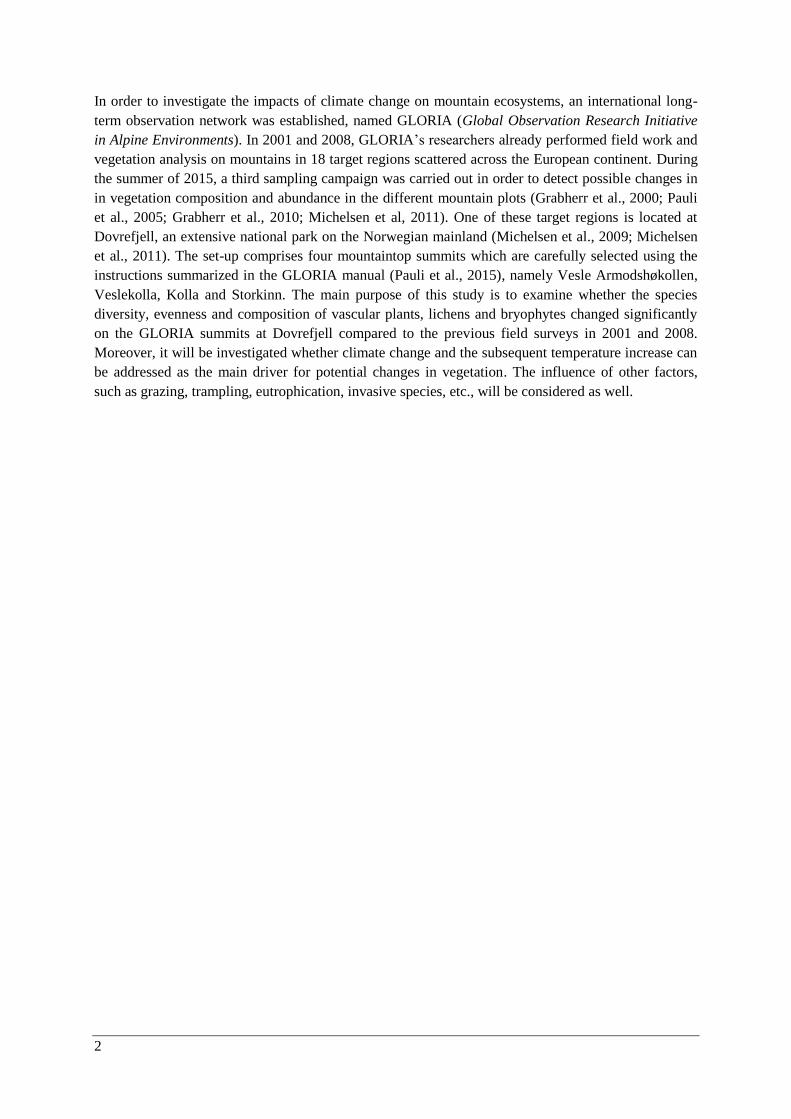
In order to investigate the impacts of climate change on mountain ecosystems, an international long-
term observation network was established, named GLORIA (Global Observation Research Initiative
in Alpine Environments). In 2001 and 2008, GLORIA’s researchers already performed field work and
vegetation analysis on mountains in 18 target regions scattered across the European continent. During
the summer of 2015, a third sampling campaign was carried out in order to detect possible changes in
in vegetation composition and abundance in the different mountain plots (Grabherr et al., 2000; Pauli
et al., 2005; Grabherr et al., 2010; Michelsen et al, 2011). One of these target regions is located at
Dovrefjell, an extensive national park on the Norwegian mainland (Michelsen et al., 2009; Michelsen
et al., 2011). The set-up comprises four mountaintop summits which are carefully selected using the
instructions summarized in the GLORIA manual (Pauli et al., 2015), namely Vesle Armodshøkollen,
Veslekolla, Kolla and Storkinn. The main purpose of this study is to examine whether the species
diversity, evenness and composition of vascular plants, lichens and bryophytes changed significantly
on the GLORIA summits at Dovrefjell compared to the previous field surveys in 2001 and 2008.
Moreover, it will be investigated whether climate change and the subsequent temperature increase can
be addressed as the main driver for potential changes in vegetation. The influence of other factors,
such as grazing, trampling, eutrophication, invasive species, etc., will be considered as well.
3
Literature review
Tundra ecosystems The name ‘tundra’ is closely related to the Lappish word tundar which was formally used to indicate
the treeless northern regions in Finland. The word literally means ‘marshy plains’. However, the name
‘tundra’ as such was introduced by the Russians in 1841 in order to describe a distinctive ecological
realm which is characterized by levelled or undulating treeless plains and primarily occurs in the
northern Arctic regions (Online Etymology Dictionary, 2015; Webster, 2015). The tundra biome can
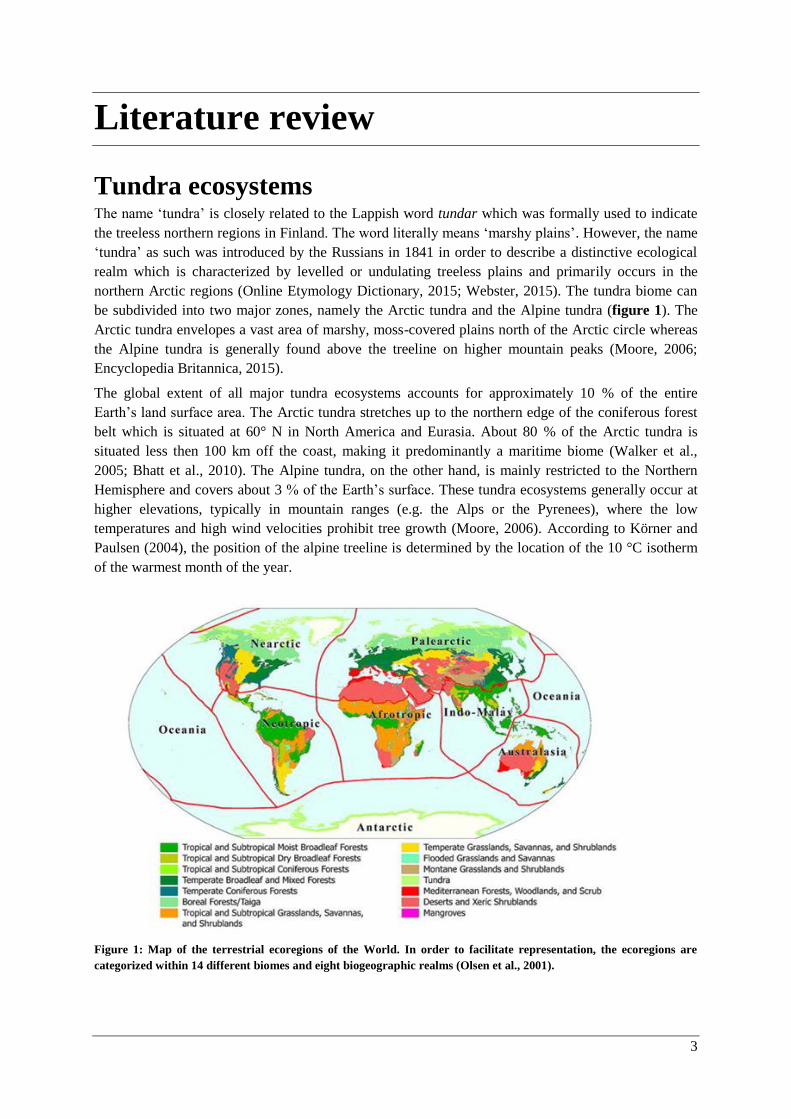
be subdivided into two major zones, namely the Arctic tundra and the Alpine tundra (figure 1). The
Arctic tundra envelopes a vast area of marshy, moss-covered plains north of the Arctic circle whereas
the Alpine tundra is generally found above the treeline on higher mountain peaks (Moore, 2006;
Encyclopedia Britannica, 2015).
The global extent of all major tundra ecosystems accounts for approximately 10 % of the entire
Earth’s land surface area. The Arctic tundra stretches up to the northern edge of the coniferous forest
belt which is situated at 60° N in North America and Eurasia. About 80 % of the Arctic tundra is
situated less then 100 km off the coast, making it predominantly a maritime biome (Walker et al.,
2005; Bhatt et al., 2010). The Alpine tundra, on the other hand, is mainly restricted to the Northern
Hemisphere and covers about 3 % of the Earth’s surface. These tundra ecosystems generally occur at
higher elevations, typically in mountain ranges (e.g. the Alps or the Pyrenees), where the low
temperatures and high wind velocities prohibit tree growth (Moore, 2006). According to Körner and
Paulsen (2004), the position of the alpine treeline is determined by the location of the 10 °C isotherm
of the warmest month of the year.
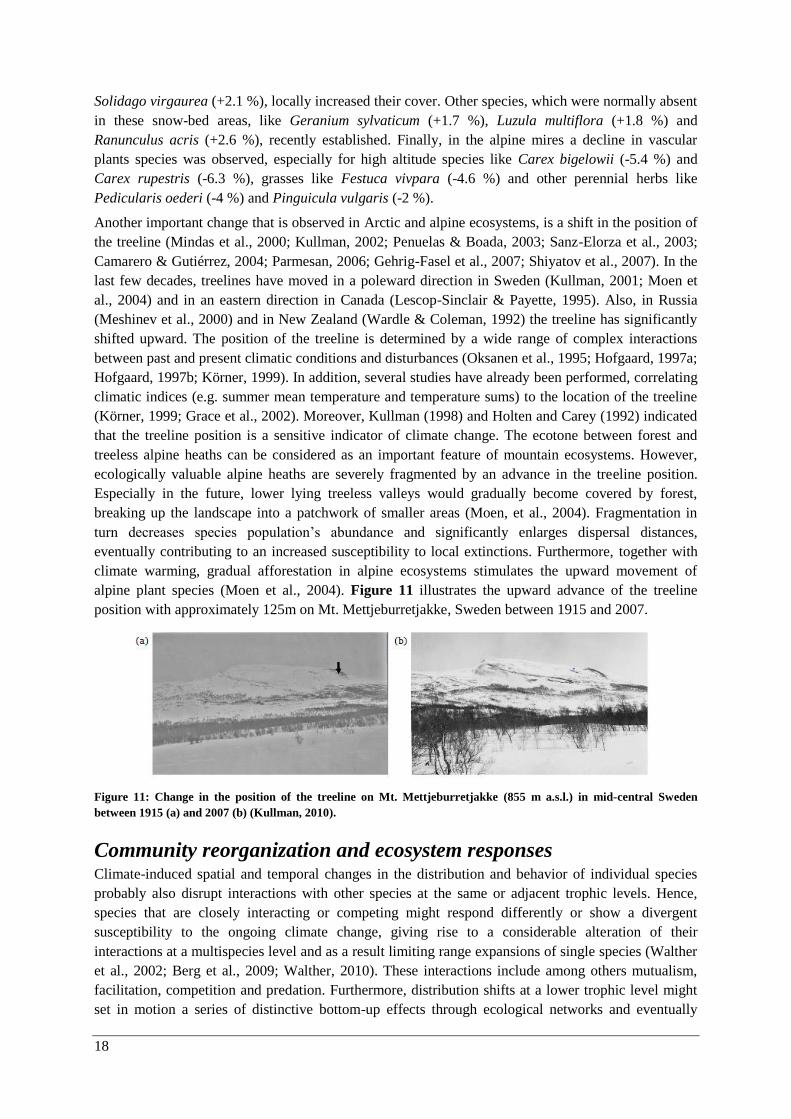
Figure 1: Map of the terrestrial ecoregions of the World. In order to facilitate representation, the ecoregions are
categorized within 14 different biomes and eight biogeographic realms (Olsen et al., 2001).
4
Tundra ecosystems are characterized by a large variety of (extreme) climatic conditions. In fact, the
tundra biome comprises a gradient of approximately 10 °C in average summer temperature and spans
over a moisture gradient from polar deserts to wetlands (Epstein et al., 2004; Elmendorf et al., 2012).
The most extreme conditions can be found in the Arctic regions, whereas the Alpine tundra is defined
by a more moderate climate with cool summers (3 – 12 °C) and temperate winters. Moreover, the
annual precipitation in the Arctic regions is, on average, higher than in the Alpine tundra, nonetheless
it only reaches up to 380 mm. Approximately, two-thirds of this amount can be attributed to summer
rains, while the remaining part falls as snow. Snowstorms, in combination with the characteristic
strong winds, cause distinctive snow-drift patterns which constantly scape the landscape during the
winter months. Furthermore, heavy precipitation events during the summer influence the landscape
through erosion (ACIA, 2001; Körner, 2003). The growing season is usually short, e.g. the average
length of the growing period ranges between 50 – 60 days in Arctic areas and corresponds to
approximately 180 days in Alpine tundra regions (University of California: Museum of Paleontology,
2015).
Soils in the Arctic tundra can be described by the presence of a permafrost layer (Muller, 2008) which
generally obstructs the downward movement of percolating precipitation or melt water (Moore, 2006).
As a result, the Arctic lowlands can easily become saturated and waterlogged during the summer thaw.
In addition, this phenomenon leads to solifluction or downward creep of the overlying active layer
(Kerfoot, 1972). Alpine tundra ecosystems, however, generally lack a continuous permafrost layer. In
combination with the inclination of alpine slopes, this contributes to a better drainage of melt water.
Subsequently, soils in alpine regions contain lower amounts of water despite the higher annual
amounts of snowfall (Moore, 2006). Depending on the classification system, most soils in the tundra
biome can be classified as Gelisols or Cryosols (Soil Survey Staff, 1999; FAO, 2014; Kimble, 2013).
These soil types are highly erodible and defined by the presence of an active surface layer which is
continuously shaped by freeze-thaw cycles (Kimble, 2013). These alternating periods of freezing and
thawing are caused by the seasonal variations in temperature and have a major influence on the
landscape of tundra ecosystems. Furthermore, soil pH, soil organic matter content and nutrient
availability varies significantly among tundra soils (Epstein et al., 2004; Elmendorf et al., 2012). For
example, pH values in a tundra environment range between 3 – 4 for moist acidic soils and between
6 – 7 for moist non-acidic soils (Hobbie et al., 2004). In addition, organic carbon contents in tundra
region range between 3.9 – 5.4 kg m-3
and 27.2 – 72.6 kg m-3
for turbic4 and non-cryoturbated
Cryosols respectively (Kimble et al., 2000; Tarnocai, 2005; Weintraub & Schimel, 2005; Beermann et
al., 2014).
The Arctic tundra biome is generally marked by a low plant and animal species diversity and shows a
decreasing vegetation productivity and complexity with increasing latitude. However, patterns of
species richness vary and local high diversity can be found in various old, topographically and
geologically complex regions. Arctic regions support a large variety of rare or endemic plant and
animal species which have adapted to the local, often extreme, climatic conditions (Arctic Biodiversity
Assessment, 2013; Munson & Sher, 2015). Therefore, mountain ranges can often be described as true
hotspots of diversity. This can be largely attributed to high rates of species turnover across substantial
4 Turbic Cryosols are mineral soils with permafrost within 2 m of the soil surface and with distinctive evidence
of cryoturbation (i.e. mixing of soil material from different horizons upon an alternating freeze-thaw cycle). Due
to the instability of active turbic sites and the exposure of parent material at the soil surface, vegetation is scarce
or even completely absent on this type of soils. The other great groups of the Cryosolic order are Organic and
Static Cryosols, which respectively consist of organic and mineral parent material and have a permafrost layer
within 1 m depth from the soil surface (Kimble et al., 2000).
5
climatic and edaphic5 gradients (Munson & Sher, 2015). Hence, the tundra biome can be considered as
an important contributor to global biodiversity (ACIA, 2001; Arctic Biodiversity Assessment, 2013).
Predator-prey and food-feeder relationships are seemingly simple in the tundra, making the
ecosystem’s stability susceptible to the extinction of critical species (Winner, 2003). With respect to
the vegetation, the spatial distribution of plant communities is controlled by local abiotic conditions
such as soil drainage, snow cover, time of melt and microclimates (Billings, 1973; Billings & Mooney,
1968). For example, coastal tundra plains are mainly dominated by cotton grass (Eriophorum sp.),
sedges (Carex sp.) and mosses (Bryophyta) while more elevated areas above wet, peaty soils contain
more willows (Salix sp.), grasses (Poaceae) and rush species (Juncus sp.). Gentle slopes with
sufficient soil development are covered with vast meadows and cushion plants occur predominantly on
ridges which are continuously exposed to desiccating winds. At higher elevations and on exposed
rocky slopes, vascular plants only occur in scattered patches. Finally, on top of high mountain peaks,
lichens and bryophytes generally grow on rocks and the vascular plant limit is situated close to the line
of permanent snow cover (Zwinger & Willard, 1996). A lot of plant species in tundra ecosystems have
adapted to the local climate (Bliss, 1962; Billings & Mooney, 1968). On the one hand, prolonged
periods of temperatures below freezing point have led to the evolutionary advantage of a rapid life
cycle completion. On the other hand, a lot of tundra plant species are perennial as a response to the
short growing season. Most plant species are short and group together in order to resist freezing
temperatures and protect against snow during winter months. Some species also photosynthesize at
lower temperatures and lower light intensities, e.g. some tundra grasses photosynthesize sugars at
temperatures below freezing point (-4 °C) due to the production of antifreeze keeping the cell liquid
sufficiently fluid (Griffith et al., 2005). Some plant species still continue to develop after being
exposed to freezing temperatures and even produce seeds upon thawing. Other plants largely depend
on budding and underground shoots or runners for reproduction, e.g. some members of the heath
family (Ericaceae). Furthermore, species like cotton grass (Eriophorum sp.), lousewort (Pedicularis
sp.) and some willows (Salix sp.) have hairy flower stalks with the capacity to retain warm air (Bliss,
1962; Billings & Mooney, 1968). Other species have the ability to raise their temperature by
generating heat in the mitochondria of their cells, e.g. thermogenic plants (Meeuse, 1966; Meeuse,
1975).
The extensive treeless plains of the tundra provide a living environment for some extraordinary birds
and mammals. Local fauna includes predators like the polar bear (Ursus maritimus), the Arctic fox
(Alopex lagopus), the Arctic wolf (Canis lupus) and snow owl (Nyctea scandiaca), but include some
characteristic large herbivores as well, e.g. the wild reindeer (Rangifer tarandus tarandus) and the
musk ox (Ovibus moschatus) (Winner, 2003; Dublin et al., 2001). Most of these animals have adapted
to the local environment and climatic conditions. For example, large mammals such as the musk ox
thrive in areas above the timberline during the growing season and descend to graze in the lowlands
during the colder winter months. Other animals, e.g. the Arctic ground squirrel (Spermophilus parryii),
hibernate during the cold winter period when a major food source is absent (Winner, 2003). Next to
fauna and flora, bacteria and fungi have a key role in the ecosystem functioning of the tundra biome as
well. Microbial communities contribute to a series of biochemical processes in the soil, e.g. nutrient
cycling and their composition largely depends on the local soil temperature, soil moisture availability
and carbon content of the soil (Wallenstein et al., 2007). However, almost all biological life in tundra
5 Edaphic factors are related to or caused by particular soil conditions, e.g. texture, drainage properties, chemical
characteristics, etc. Edaphology is, next to pedology, one of the main divisions of soil science and describes the
influence of soil characteristics on living organisms, especially plant indiviuduals and communities (Buckman &
Brady, 1960).
6
soils is restricted to the active surface layer which varies in thichness between 10 cm and a few meters,
depending on the maximum summer temperature (Margesin, 2008).
In conclusion, the species composition and distribution in tundra ecosystems is mainly controlled by
temperature (Klanderud & Birks, 2003; Pauli et al., 2004; Walker et al., 2005; Elmendorf et al., 2012).
However, other abiotic, biotic and anthropogenic factors such as precipitation and soil moisture, the
presence of predators or an essential food source, invasive species, grazing, trampling, land-use
changes, urbanization and industrialization, tourism, resource extractions, pollution, etc. play a
significant role too. Climate impact studies indicate that an increasing temperature, as a result of the
ongoing global climate change, can trigger a wide range of ecological and even evolutionary responses
among plant and animal species (Parmesan et al., 1999; Thomas et al, 2001; Whalter et al., 2002;
Parmesan & Yohe, 2003; Parmesan, 2006; Pounds et al., 2006). Consequently, local and regional
species compositions and distributions are expected to change through various processes such as
migration or adaptation (Parmesan, 2006; Berg et al., 2010). Generally, species tend to shift their
distributions towards higher latitudes in flat regions and higher altitudes in mountainous areas
(Klanderud & Birks, 2003; Parmesan & Yohe, 2003; Parmesan, 2006). In tundra regions, however,
some species already occur at the limits of their physiological capacities with relatively narrow
environmental tolerances. In addition, most high-latitude or high-altitude species are characterized by
their limited geographical ranges (Pauli et al., 1996; Thuiller et al., 2005; Munson & Sher, 2015).
Therefore, some of these species are unlikely to migrate and change biome, despite the fact that polar
as well as alpine ecosystems will contract as a result of global warming (Cox & Moore, 2010). Hence,
they are highly threatened with extinction (Parmesan, 2006). This global extinction risk is not only
predicted to increase, but will probably also accelerate as global temperatures rise in the coming
decades (Uban, 2015). Finally, climate-induced changes in tundra vegetation could have a wide range
of consequences in the future. For instance, plant composition highly influences other processes, like
nutrient cycling, productivity and decomposition, active layer depth above permafrost, forage quantity
and quality, snow distribution and land surface albedo (Chapin et al., 1996; Sturm et al., 2005;
Cornelissen et al. 2007; Blok et al., 2010). In addition, the net effect of climate warming on the
extensive carbon stocks contained in tundra soils highly depends on whether the warming-induced
increase in primary productivity counterbalances the increase in heterotrophic soil respiration and
methanogenesis and the subsequent carbon dioxide (CO2) and methane (CH4) release in thawing
permafrost soils (Euskirchen et al., 2009; McGuire et al, 2009; Tarnocai et al., 2009). These unique
ecosystem services provided by the tundra biome, in combination with the future climate predictions
and the subsequent ecological responses, increase the incentive of performing climate-warming studies
in tundra environments (Elmendorf et al., 2012).
Climate change: history, processes, causes and
effects and future projections Long-term observations of weather station, buoy, ship and satellite data indicate that global
temperatures are rising significantly. This significant warming trend is now visible in all archives of
datasets and using all statistical methods. The Fifth Assessment Report of the IPCC
(Intergovernmental Panel on Climate Change from the United Nations) reported that the globally
averaged combined land and ocean surface temperature increased with approximately 0.85 ± 0.2 °C
between 1880 and 2012 (IPCC, 2013) (figure 2).
7
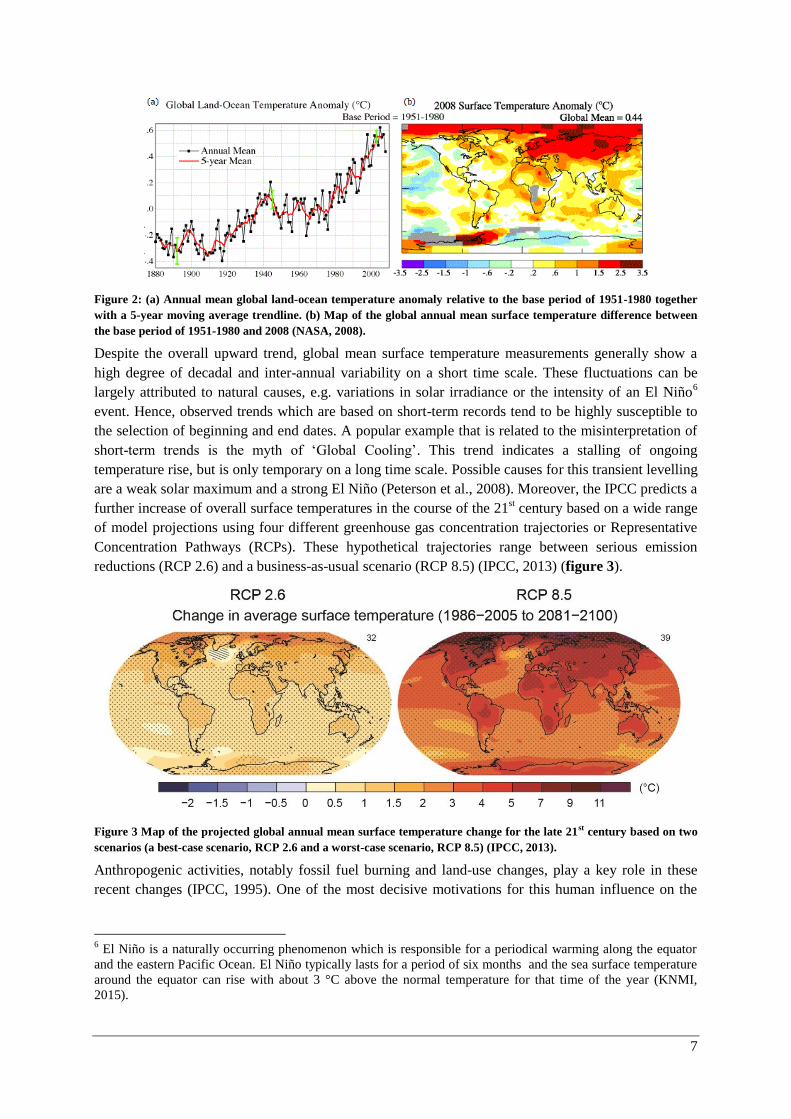
Figure 2: (a) Annual mean global land-ocean temperature anomaly relative to the base period of 1951-1980 together
with a 5-year moving average trendline. (b) Map of the global annual mean surface temperature difference between
the base period of 1951-1980 and 2008 (NASA, 2008).
Despite the overall upward trend, global mean surface temperature measurements generally show a
high degree of decadal and inter-annual variability on a short time scale. These fluctuations can be
largely attributed to natural causes, e.g. variations in solar irradiance or the intensity of an El Niño6
event. Hence, observed trends which are based on short-term records tend to be highly susceptible to
the selection of beginning and end dates. A popular example that is related to the misinterpretation of
short-term trends is the myth of ‘Global Cooling’. This trend indicates a stalling of ongoing
temperature rise, but is only temporary on a long time scale. Possible causes for this transient levelling
are a weak solar maximum and a strong El Niño (Peterson et al., 2008). Moreover, the IPCC predicts a
further increase of overall surface temperatures in the course of the 21st century based on a wide range
of model projections using four different greenhouse gas concentration trajectories or Representative
Concentration Pathways (RCPs). These hypothetical trajectories range between serious emission
reductions (RCP 2.6) and a business-as-usual scenario (RCP 8.5) (IPCC, 2013) (figure 3).
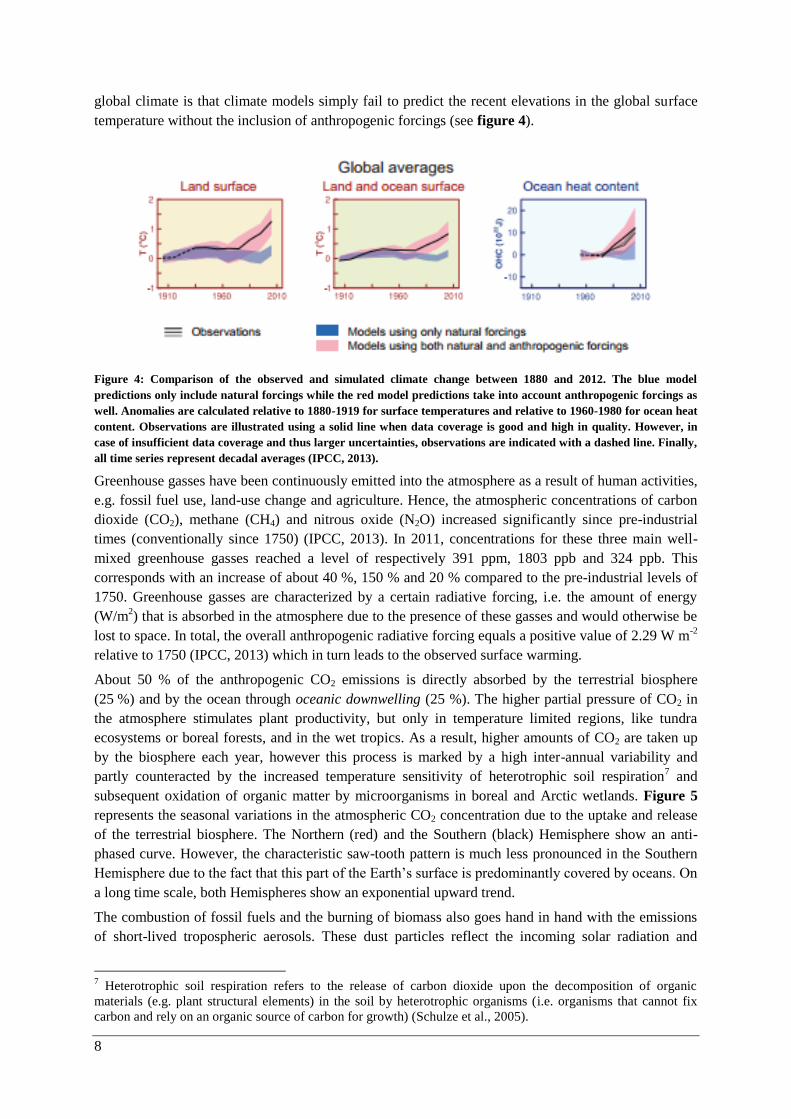
Figure 3 Map of the projected global annual mean surface temperature change for the late 21st century based on two
scenarios (a best-case scenario, RCP 2.6 and a worst-case scenario, RCP 8.5) (IPCC, 2013).
Anthropogenic activities, notably fossil fuel burning and land-use changes, play a key role in these
recent changes (IPCC, 1995). One of the most decisive motivations for this human influence on the
6 El Niño is a naturally occurring phenomenon which is responsible for a periodical warming along the equator
and the eastern Pacific Ocean. El Niño typically lasts for a period of six months and the sea surface temperature
around the equator can rise with about 3 °C above the normal temperature for that time of the year (KNMI,
2015).
8
global climate is that climate models simply fail to predict the recent elevations in the global surface
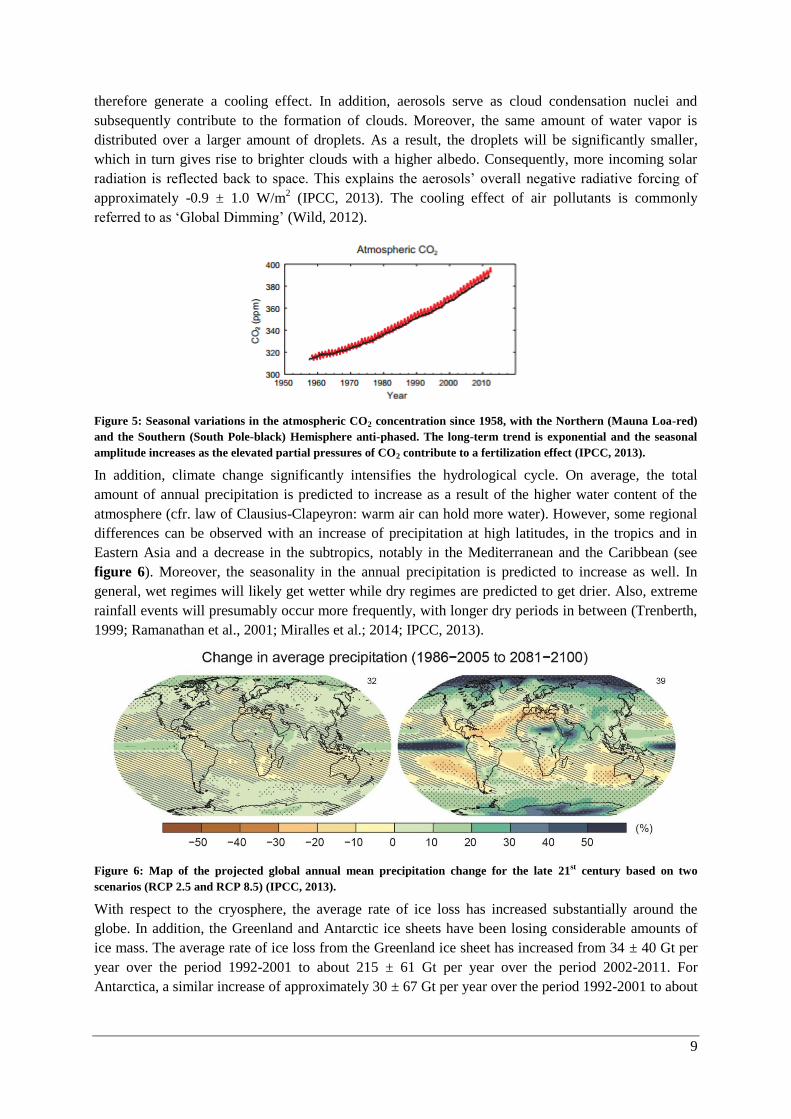
temperature without the inclusion of anthropogenic forcings (see figure 4).
Figure 4: Comparison of the observed and simulated climate change between 1880 and 2012. The blue model
predictions only include natural forcings while the red model predictions take into account anthropogenic forcings as
well. Anomalies are calculated relative to 1880-1919 for surface temperatures and relative to 1960-1980 for ocean heat
content. Observations are illustrated using a solid line when data coverage is good and high in quality. However, in
case of insufficient data coverage and thus larger uncertainties, observations are indicated with a dashed line. Finally,
all time series represent decadal averages (IPCC, 2013).
Greenhouse gasses have been continuously emitted into the atmosphere as a result of human activities,
e.g. fossil fuel use, land-use change and agriculture. Hence, the atmospheric concentrations of carbon
dioxide (CO2), methane (CH4) and nitrous oxide (N2O) increased significantly since pre-industrial
times (conventionally since 1750) (IPCC, 2013). In 2011, concentrations for these three main well-
mixed greenhouse gasses reached a level of respectively 391 ppm, 1803 ppb and 324 ppb. This
corresponds with an increase of about 40 %, 150 % and 20 % compared to the pre-industrial levels of
1750. Greenhouse gasses are characterized by a certain radiative forcing, i.e. the amount of energy
(W/m2) that is absorbed in the atmosphere due to the presence of these gasses and would otherwise be
lost to space. In total, the overall anthropogenic radiative forcing equals a positive value of 2.29 W m-2
relative to 1750 (IPCC, 2013) which in turn leads to the observed surface warming.
About 50 % of the anthropogenic CO2 emissions is directly absorbed by the terrestrial biosphere
(25 %) and by the ocean through oceanic downwelling (25 %). The higher partial pressure of CO2 in
the atmosphere stimulates plant productivity, but only in temperature limited regions, like tundra
ecosystems or boreal forests, and in the wet tropics. As a result, higher amounts of CO2 are taken up
by the biosphere each year, however this process is marked by a high inter-annual variability and
partly counteracted by the increased temperature sensitivity of heterotrophic soil respiration7 and
subsequent oxidation of organic matter by microorganisms in boreal and Arctic wetlands. Figure 5
represents the seasonal variations in the atmospheric CO2 concentration due to the uptake and release
of the terrestrial biosphere. The Northern (red) and the Southern (black) Hemisphere show an anti-
phased curve. However, the characteristic saw-tooth pattern is much less pronounced in the Southern
Hemisphere due to the fact that this part of the Earth’s surface is predominantly covered by oceans. On
a long time scale, both Hemispheres show an exponential upward trend.
The combustion of fossil fuels and the burning of biomass also goes hand in hand with the emissions
of short-lived tropospheric aerosols. These dust particles reflect the incoming solar radiation and
7 Heterotrophic soil respiration refers to the release of carbon dioxide upon the decomposition of organic
materials (e.g. plant structural elements) in the soil by heterotrophic organisms (i.e. organisms that cannot fix
carbon and rely on an organic source of carbon for growth) (Schulze et al., 2005).
9
therefore generate a cooling effect. In addition, aerosols serve as cloud condensation nuclei and
subsequently contribute to the formation of clouds. Moreover, the same amount of water vapor is
distributed over a larger amount of droplets. As a result, the droplets will be significantly smaller,
which in turn gives rise to brighter clouds with a higher albedo. Consequently, more incoming solar
radiation is reflected back to space. This explains the aerosols’ overall negative radiative forcing of
approximately -0.9 ± 1.0 W/m2 (IPCC, 2013). The cooling effect of air pollutants is commonly
referred to as ‘Global Dimming’ (Wild, 2012).
Figure 5: Seasonal variations in the atmospheric CO2 concentration since 1958, with the Northern (Mauna Loa-red)
and the Southern (South Pole-black) Hemisphere anti-phased. The long-term trend is exponential and the seasonal
amplitude increases as the elevated partial pressures of CO2 contribute to a fertilization effect (IPCC, 2013).
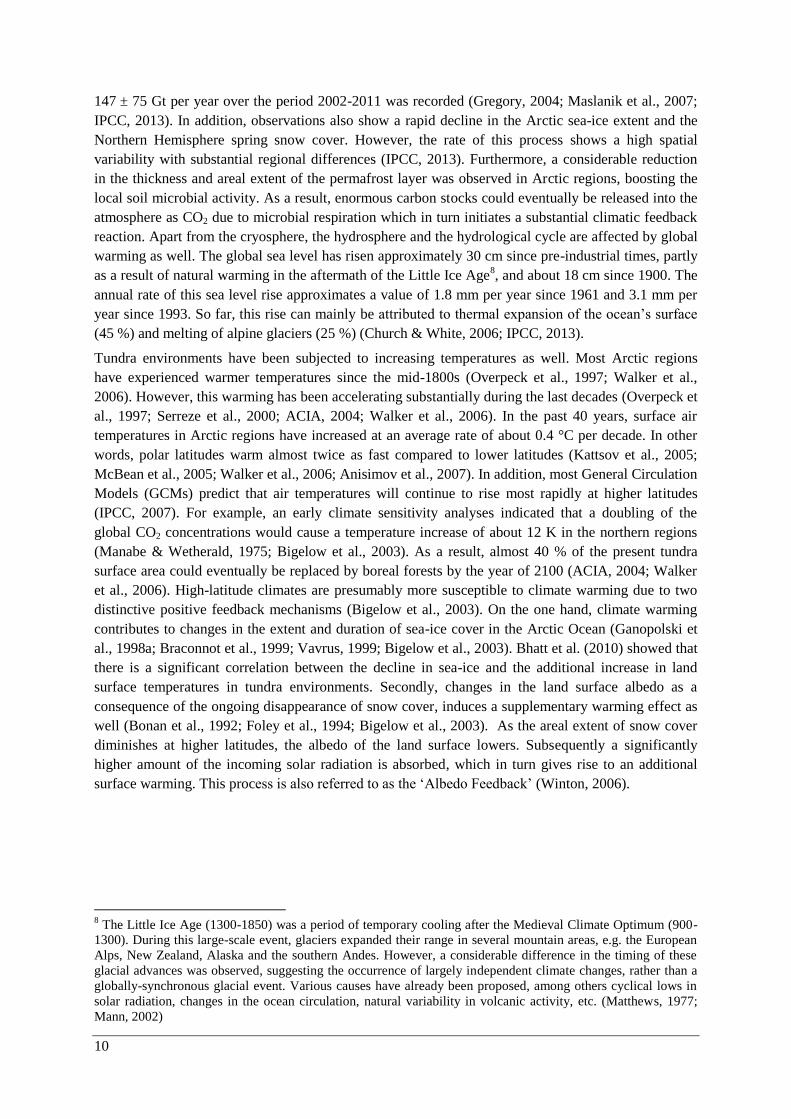
In addition, climate change significantly intensifies the hydrological cycle. On average, the total
amount of annual precipitation is predicted to increase as a result of the higher water content of the
atmosphere (cfr. law of Clausius-Clapeyron: warm air can hold more water). However, some regional
differences can be observed with an increase of precipitation at high latitudes, in the tropics and in
Eastern Asia and a decrease in the subtropics, notably in the Mediterranean and the Caribbean (see
figure 6). Moreover, the seasonality in the annual precipitation is predicted to increase as well. In
general, wet regimes will likely get wetter while dry regimes are predicted to get drier. Also, extreme
rainfall events will presumably occur more frequently, with longer dry periods in between (Trenberth,
1999; Ramanathan et al., 2001; Miralles et al.; 2014; IPCC, 2013).
Figure 6: Map of the projected global annual mean precipitation change for the late 21st century based on two
scenarios (RCP 2.5 and RCP 8.5) (IPCC, 2013).
With respect to the cryosphere, the average rate of ice loss has increased substantially around the
globe. In addition, the Greenland and Antarctic ice sheets have been losing considerable amounts of
ice mass. The average rate of ice loss from the Greenland ice sheet has increased from 34 ± 40 Gt per
year over the period 1992-2001 to about 215 ± 61 Gt per year over the period 2002-2011. For
Antarctica, a similar increase of approximately 30 ± 67 Gt per year over the period 1992-2001 to about
10
147 ± 75 Gt per year over the period 2002-2011 was recorded (Gregory, 2004; Maslanik et al., 2007;
IPCC, 2013). In addition, observations also show a rapid decline in the Arctic sea-ice extent and the
Northern Hemisphere spring snow cover. However, the rate of this process shows a high spatial
variability with substantial regional differences (IPCC, 2013). Furthermore, a considerable reduction
in the thickness and areal extent of the permafrost layer was observed in Arctic regions, boosting the
local soil microbial activity. As a result, enormous carbon stocks could eventually be released into the
atmosphere as CO2 due to microbial respiration which in turn initiates a substantial climatic feedback
reaction. Apart from the cryosphere, the hydrosphere and the hydrological cycle are affected by global
warming as well. The global sea level has risen approximately 30 cm since pre-industrial times, partly
as a result of natural warming in the aftermath of the Little Ice Age8, and about 18 cm since 1900. The
annual rate of this sea level rise approximates a value of 1.8 mm per year since 1961 and 3.1 mm per
year since 1993. So far, this rise can mainly be attributed to thermal expansion of the ocean’s surface
(45 %) and melting of alpine glaciers (25 %) (Church & White, 2006; IPCC, 2013).
Tundra environments have been subjected to increasing temperatures as well. Most Arctic regions
have experienced warmer temperatures since the mid-1800s (Overpeck et al., 1997; Walker et al.,
2006). However, this warming has been accelerating substantially during the last decades (Overpeck et
al., 1997; Serreze et al., 2000; ACIA, 2004; Walker et al., 2006). In the past 40 years, surface air
temperatures in Arctic regions have increased at an average rate of about 0.4 °C per decade. In other
words, polar latitudes warm almost twice as fast compared to lower latitudes (Kattsov et al., 2005;
McBean et al., 2005; Walker et al., 2006; Anisimov et al., 2007). In addition, most General Circulation
Models (GCMs) predict that air temperatures will continue to rise most rapidly at higher latitudes
(IPCC, 2007). For example, an early climate sensitivity analyses indicated that a doubling of the
global CO2 concentrations would cause a temperature increase of about 12 K in the northern regions
(Manabe & Wetherald, 1975; Bigelow et al., 2003). As a result, almost 40 % of the present tundra
surface area could eventually be replaced by boreal forests by the year of 2100 (ACIA, 2004; Walker
et al., 2006). High-latitude climates are presumably more susceptible to climate warming due to two
distinctive positive feedback mechanisms (Bigelow et al., 2003). On the one hand, climate warming
contributes to changes in the extent and duration of sea-ice cover in the Arctic Ocean (Ganopolski et
al., 1998a; Braconnot et al., 1999; Vavrus, 1999; Bigelow et al., 2003). Bhatt et al. (2010) showed that
there is a significant correlation between the decline in sea-ice and the additional increase in land
surface temperatures in tundra environments. Secondly, changes in the land surface albedo as a
consequence of the ongoing disappearance of snow cover, induces a supplementary warming effect as
well (Bonan et al., 1992; Foley et al., 1994; Bigelow et al., 2003). As the areal extent of snow cover
diminishes at higher latitudes, the albedo of the land surface lowers. Subsequently a significantly
higher amount of the incoming solar radiation is absorbed, which in turn gives rise to an additional
surface warming. This process is also referred to as the ‘Albedo Feedback’ (Winton, 2006).
8 The Little Ice Age (1300-1850) was a period of temporary cooling after the Medieval Climate Optimum (900-
1300). During this large-scale event, glaciers expanded their range in several mountain areas, e.g. the European
Alps, New Zealand, Alaska and the southern Andes. However, a considerable difference in the timing of these
glacial advances was observed, suggesting the occurrence of largely independent climate changes, rather than a
globally-synchronous glacial event. Various causes have already been proposed, among others cyclical lows in
solar radiation, changes in the ocean circulation, natural variability in volcanic activity, etc. (Matthews, 1977;
Mann, 2002)
11
Ecological and evolutionary responses of tundra
ecosystems to climate change
General consensus Recent climate impact studies quantified the overall effects of the ongoing climate change on a wide
range of habitats around the world (Walther et al., 2002; Root et al., 2003; Parmesan, 2006; Gottfried
et al., 2012). A large variety of changes in the distribution of species and the composition of
communities has already been observed (Parmesan et al., 1999; Thomas et al., 2001; Pounds et al.,
2006; Berg et al., 2010). Tundra ecosystems tend to be extremely susceptible to global warming as
they are largely controlled by climatic constraints (Klanderud & Birks, 2003; Walker et al., 2006;
Elmendorf et al., 2012). Most tundra plant species already occur close to their climatic limits of
survival and within a restricted geographical range (e.g. at high latitudes or altitudes) making them
more prone to eventual extinction (Parmesan, 2006; Crisp et al., 2009; Cox & Moore, 2010).
However, many recent climate-change experiments have indicated species-specific responses in plant
growth and reproduction (Chapin & Shaver, 1985; Arft et al., 1999; Walker, 2006; Elmendorf, 2011).
In addition, a wide range of predictive models forecast distinctive changes in species distribution as a
response to rising temperatures (Gottfried et al., 1999; Klanderud & Birks, 2003). During the last few
decades, substantial shifts in the distribution, composition, total biomass, diversity and homogenity of
Arctic and alpine plant communities have been observed (Grabherr et al., 1994; van Wijk et al., 2004;
Tape et al., 2006; Hudson & Henry, 2009; Post et al., 2009; Callaghan et al., 2011; Hill & Henry et al.,
2011). Many of these environmental change studies only focus on the response of single species and
do not take into account fundamental biotic interactions, such as competition, predation and
facilitation9 (Berg et al., 2010). Moreover, climate-induced changes in species distribution and
composition affect the entire structure and functioning of tundra ecosystems (Berg et al., 2010;
Elmendorf et al., 2012; Bellard et al., 2013). As a result, a more holistic approach is required in order
to study the ecological footprint of global warming. These ecological responses have to be
investigated at the level of plant communities, taking multispecies interactions on a long time scale
into consideration (Parmesan & Yohe, 2003; Berg et al., 2010).
Phenology changes Rapidly increasing temperatures can induce phenology changes of Arctic and alpine vegetation
(Walker et al., 1995; Oberbauer et al., 2015; Munson & Sher, 2015). In this case, species try to cope
with the changing climatic conditions by adjusting their life cycle, instead of tracking the shifting
isotherms as with distribution shifts. This thermal response is particularly important for rare and
endemic10
species, which can be abundantly found in mountain ecosystems and are marked by their
limited abundances, restricted spatial distributions and low capacity for long-distance dispersal
(Munson & Sher, 2015). In addition, the rate of phenology changes is expected to be significantly
higher in mountain ecosystems due to the fact that these regions are already characterized by extreme
environmental conditions, stronger temperature increases and the distinctive sensitivity of plant
growth initiation to cold temperatures and snowpack formation (Inouye, 2008). For example, alpine
9 Facilitation is defined as the interaction between species in which both participants benefit (mutualism) or in
which one species benefits and the other remains unaffected (commensalism) (Stachowicz, 2001). 10
Endemic species are unique to a distinctive geographical location and are not found outside that region
(Schulze et al., 2005)

12
shrub- and grassland ecosystems are constraint by the local extreme environmental conditions, e.g.
short growing period for vegetation and long-lasting snow cover, and are therefore expected to be
highly susceptible to climate change. Hence, the predicted future temperature increases, altered
precipitation regimes and prolonged growing seasons are likely to induce local changes in plant
phenology and growth. These climate-induced changes in the growth and development of plant species
also have the potential to alter species competition, productivity and consequently affect consumers of
plant resources, such as humans and herbivores (Munson & Sher, 2015). Moreover, phenological
responses to climate change strongly vary among species (Parmesan, 2006; Berg et al., 2009; Walther,
2010) and depend to a large extent on the habitat type (Munson & Sher, 2015). Some species show a
higher sensitivity to changing environmental conditions and respond faster, whereas other species
display only a minor response. Interactions between species with a different sensitivity might result in
a potential mismatch of temporal associations and subsequently affect their fitness. In some cases, this
disruption of biotic interactions might cascade down the food chain and influence the entire ecosystem
functioning (Berg et al., 2009).
Phenological changes in high-latitude and mountainous environments involve, for example, an earlier
onset of growth due to shorter winter periods (Keller et al., 2000) or a substantial response of
flowering phenology to earlier snowmelt in subalpine and alpine ecosystems (Dunne et al., 2003;
Wipf, 2006; Rixen et al., 2008; Wipf & Rixen, 2010). This results in an enhanced green-up, which has
already been observed in Arctic regions using remote sensing techniques and long-term satellite leaf
area index (LAI) records (Myneni et al., 1997; Zhu et al., 2016). Several studies have been performed
to investigate phenological responses of plant species in alpine ecosystems. For example, according to
Rammig et al. (2010), a significantly earlier melt out of the snow cover and start of the vegetation
period was observed on summits in the Swiss Alps. As a result, the onset of plant growth occurred
earlier in the year, giving rise to a longer growing season, considerably taller plant individuals (+77 %)
and a larger accumulation of aboveground biomass (+45 %). Munson and Sher (2015) demonstrated a
significant acceleration of the flowering date of several rare plant species in the Rocky Mountains by
approximately 42 days over the last 137 years, which corresponds with an average rate of change of
3.1 days per decade. In addition, they found that the growing season of all investigated plant species at
the highest elevations was restricted by the extreme environmental conditions, while less restrictive
climates at lower altitudes gave rise to more individualistic phenological responses. Species in lower
elevation habitats accelerated their flowering date as a response to increasing temperatures much
earlier in the year than at higher elevations. However, despite the fact that multiple studies have
already reported substantial phenological shifts of alpine plant species (CaraDonna et al., 2014),
further increases in temperatures and continued alterations of precipitation regimes might eventually
lead to a strong population decline of already vulnerable endemic species with severe ecological and
evolutionary constraints (Munson & Sher, 2015; Urban, 2015).
Distribution shifts Species are expected to shift their distribution towards higher latitudes in flat regions and towards
higher altitudes in mountainous areas in order to keep up with the shifting isotherms (Walther et al.,
2002; Parmesan & Yohe, 2003; Neilson et al., 2005). On average, species shift their ranges 6.1 ±
2.4 km per decade more towards the poles (or meters per decade upward in mountainous areas)
(Parmesan & Yohe, 2003). These directional range shifts can be largely attributed to the influence of
changing climatic regimes on species-specific physiological thresholds of temperature and
precipitation tolerance (Woodward & Williams, 1987; Hoffman & Parsons, 1997). Driven by warming
temperatures, these distinctive climatic envelopes are predicted to shift in a poleward or upward
direction, depending on local topographic characteristic of the landscape (Walther et al., 2002).
13
However, for some species (e.g. reef-building corals) the latitudinal distribution is predominantly
constraint by other climatic factors, such as light. As a result, a shift in distribution is unlikely to occur
despite the local temperature changes (Hoegh-Guldberg, 1999).
Climate-induced distribution shifts along latitudinal and altitudinal gradients have already occurred
during the 20th century across a wide range of taxonomic groups and geographical regions (Hughes,
2000; Easterling et al., 2000; McCarty, 2001; Walther et al., 2001; Walther, 2003). However,
ambiguous correlations with temperature changes were often not observed (Walther et al., 2002). Most
distribution shifts tend to be episodic rather than gradual or monotonic and are frequently affected by
the occurrence of local climate extremes (Easterling et al., 2000). In addition, rates of distribution
shifts can vary substantially among and within species depending on individual dispersal abilities and
local landscape conditions (Walther et al., 2002). For example, Lenoir et al. (2008) observed
significantly larger shifts in optimum elevation for mountainous species compared to ubiquitous11
species in French temperate and Mediterranean mountain forest ecosystems. On the other hand, Le
Roux and McGeoch (2008) reported a much faster response and upslope migration of habitat
generalists compared to habitat specialists on the sub-Antarctic Marion Island. Also, the magnitude of
the upslope distribution shifts of alpine vegetation generally lags behind the isothermal shift of about
8 – 10 m per decade (Grabherr et al., 1994), whereas most butterfly species tend to keep up with the
shifting isotherms (Karl et al., 1996).
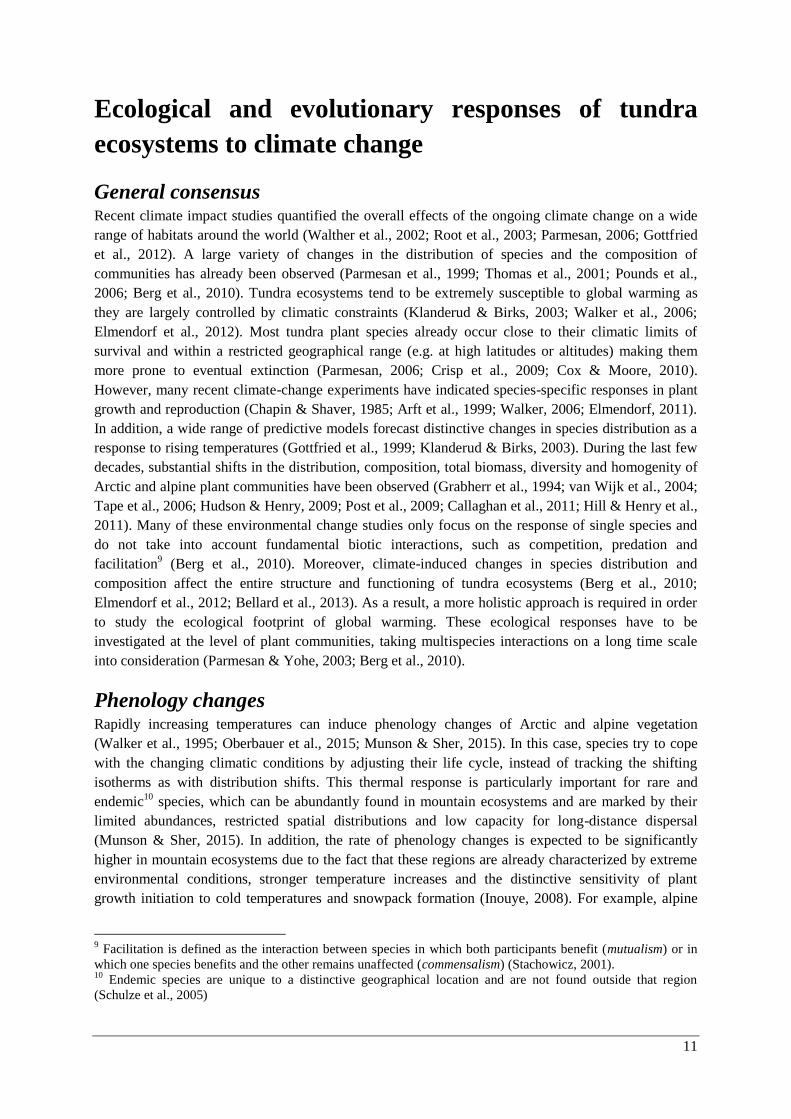
Figure 7: Types of species distribution shifts along an elevational gradient, resulting from changes in growth,
establishment, decline and mortality of plants (Breshaers et al., 2008).
Altitudinal, as well as latitudinal, range shifts can be subdivided into three main categories (figure 7).
(Breshaers et al., 2008). At first, lean range shifts can be described as a change in species distribution
where the outer edges remain constant, but the central tendency shifts significantly. Secondly, the
process of march can be distinguished, where the upper and lower boundary of species ranges
experiences a parallel shift and the species distribution as a whole moves in an upward (or poleward)
direction. Finally, if mortality appears to be widespread throughout the current species range, the
distribution change is referred to as a crash. On the one hand, species migration can occur as a rather
slow local process whereby a species shifts its distribution as a front in short steps. On the other hand,
range shifts can also take place as a rapid movement or jump which is mediated by long-distance
11
Ubiquitous species are species that typically thrive in a wide range of environments (Schulze et al., 2005).
14
dispersal events (Neilson et al., 2005). In addition, a sustained long-distance migration generally
consists of two distinctive processes: a long-distance jump which is immediately followed by the
establishment and sufficient local spread of local populations in order to provide a large seed source
and subsequently increase the odds of a later long-distance jump (Clark et al., 2001). A successful
local spread depends on four main components, namely the reproductive output or fecundity, the
dispersal ability, germination and seedling survival or establishment and growth to reproductive
maturity. Furthermore, a successful long-distance migration and local spread may take years or even
decades, depending on the species’ generation time. Another important regulating factor is the mode
of long-distance dispersion. Most terrestrial plant species generally migrate through wind dispersal
(anemochory) or dispersal by animals (zoochory) (Neilson et al., 2005).
Human activities affect plant migration patterns as well, mainly through the accidental or deliberate
introduction of exotic species and the alteration and fragmentation of the natural landscape and land
use. These influences dominate in densely populated areas and can be largely attributed to agricultural
and forestry activities (Hodkinson & Thompson, 1997). Recent anthropogenic activities have shaped
the landscape as well, giving rise to a highly fragmented environment with a large amount of isolated
forest patches. In turn, local plant population sizes, seed production and the amount of suitable habitats
might diminish substantially. Habitat fragmentation presents a severe limit for species dispersal and
highly increases the risk of local extinction (Walther et al., 2002; Fahrig, 2003 Hof et al., 2011). Many
regions that might become climatically suitable with future warming are often located beyond the
dispersal capacity of several plant and animal species. Hence, species with a lower dispersal capacity
might become caught by the dilemma of a warming-induced range shift and the low likelihood to find
a new suitable habitat with sufficient nutritional and reproductive resources. Finally, human activities
such as resource exploitation and the mismanagement of vast natural lands highly increase the
pressure on the local ecosystem, eventually pushing it beyond the tolerances of its limits (Walther et
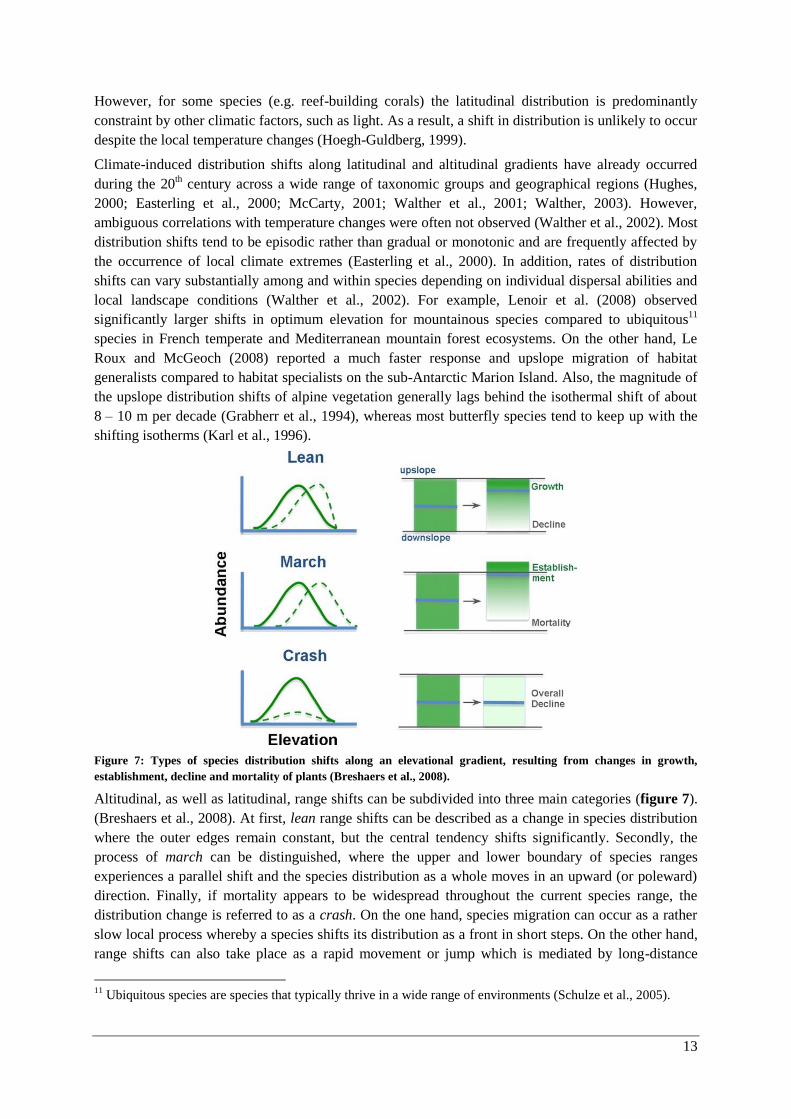
al., 2010). Figure 8 illustrates the potential changes in species ranges as a result of climate change and
the aggravating effect of human-induced habitat fragmentation.
Figure 8: Six scenarios of range shifts of species over time as a result of climate change and the interaction with
habitat fragmentation (time proceeds from left to right) (a) Gradual climate change without fragmentation: species
track shifting isotherms. (b) Rapid climate change: species survive by residing in small local areas with a suitable
microclimate or refugia and expand again when favorable climatic conditions return. (c) Species also endure in local
refugia, but subsequently track suitable climatic conditions. (d)-(f) Similar processes as in (a)-(c), but with habitat
destruction and fragmentation. This results in even smaller areas with a suitable microclimate and hence a reduced
probability of survival or successful range shifts (Hof et al., 2011).

15
In situ experimental warming studies indicated that the abundance of deciduous shrubs and graminoids
increased significantly in tundra environments as a result of a 1 – 3 °C warming, whereas the
population of cryptogams (lichens and bryophytes) significantly diminished (Walker et al., 2006;
Elmendorf et al., 2012). Considerable spatial and temporal differences were observed as well.
(figure 9) (Elmendorf et al., 2012). In areas that were already relatively warm, the total shrub
abundances showed the largest long-term positive effect on experimental warming, whereas in colder
regions the initial positive response of shrubs could not be sustained. Consequently, Elmendorf et al.
(2012) reports that in the next few decades cold tundra regions continue to show resistance against
shrub encroachment. In addition, the restricted amount of bioavailable nitrogen and slow species
turnover largely constrain shrub expansion in High Arctic regions (Epstein et al., 2000). Nonetheless,
long-distance migration and gene-flow could eventually overcome these genetic constraints, thereby
increasing shrub abundance in these colder environments in a long run (Alsos et al., 2007; Aitken et
al., 2008). Most initial positive responses of shrubs could be attributed to low-growing and deciduous
shrubs. Evergreen shrubs, on the other hand, showed no significant response to changing summer
temperatures, but were highly affected by local moisture conditions. Furthermore, tall shrubs
considerably increased their cover in a tundra environment after at least 10 years of additional
warming, while the abundance of dwarf shrubs substantially decreased. These differences can be
largely attributed to an increase in light competition with warming as the canopy of taller shrubs
gradually closes. According to the same study, forbs and total graminoids showed no consistent
temporal trend after being subjected to a 10 year period of experimental warming. However,
graminoid abundance increased most at colder sites, while neutral to negative responses were observed
at warmer sites. Among graminoids, grass, rush and sedge species, variable responses along a
distinctive moisture gradient were found. However, some changes in abundance also resulted from
opposing species responses, whereby the gains of one group of species counterbalance the losses of
another group. Grasses increased their abundance most in dry sites, whereas sedges showed the
greatest positive long-term response in wetter regions. Rush abundance showed no consistent response
to experimental warming, although a slight tendency for negative responses was observed in dry sites.
Figure 9: Total shrub response in dry (a), moist (b) and wet (c) conditions to experimental warming as well as the
warming-induced changes in evergreen (d), dwarf (e) and tall shrubs (Elmendorf et al., 2012).
16
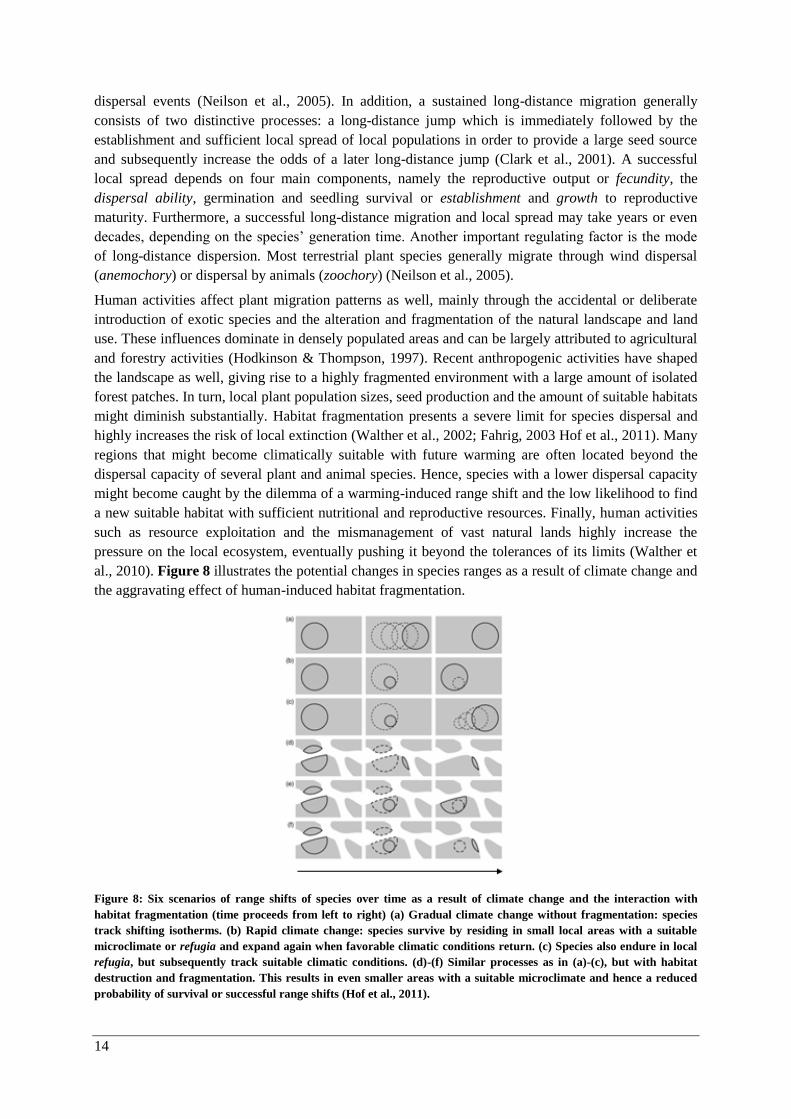
Non-vascular cryptogams such as lichens (especially foliose12
and fruticose13
lichens) considerably
declined in abundance irrespective of local moisture and temperature conditions. Moss abundance,
however, primarily decreased in moist areas. Recent studies indicated that not the ambient summer
temperature, but moisture availability explains the climate-induced changes in the abundance of
bryophytes (Lang et al., 2009). Bryophyte species are characterized by the absence of true roots, which
in turn makes them more vulnerable to water deficiency in warmer, drier environment (Potter et al.,
1995). Lang et al. (2012) performed a study on the responses of Arctic bryophyte diversity and
abundance to an increasing temperature, confirming the previous statement. Most bryophyte species,
except for Sphagnum and some pleurocarpous mosses14
, showed a significant decrease in abundance
upon warming in three separate environmental warming experiments and along a natural temperature
gradient. The susceptibility of lichen species to climate warming can be attributed to the increased
shade due to a higher biomass production of vascular plants in tundra ecosystems. Especially in lower
Arctic tundra and low-altitude environments, where shrub encroachment appears to be most
significant, severe reductions in lichen abundance could be observed after 10 years of warming
(Cornelissen et al. 2001; Elmendorf et al., 2012). However, on a shorter time scale lichens show a
larger degree of resistance against warming in the high Arctic regions (Walker et al., 2006). Other
components of the ecosystem are affected by a decline in lichen abundance as well due to the fact that
they serve as an important source of animal forage and nitrogen inputs (Elmendorf et al., 2012)
(figure 10).
Figure 10: Total graminoid (a), lichen (b) and moss (c) response to experimental warming, including variations with
summer temperature, soil moisture and time (Elmendorf et al., 2012).
In addition to moisture conditions, also altitude, migration corridors (e.g. roads) and the presence of a
favorable rooting substrate play a key role in the ability of plant species to expand their ranges and
colonize new ecosystems within Arctic and alpine regions (Klanderud & Birks, 2003; Lembrechts et
12
Foliose lichens are characterized by their flattened leafy thalli and upper and lower cortex with hyphae. These
hyphae are used to attach on various substrates (Nash, 2012). 13
Fruticose lichens have a shrubby or bushy growth structure and are marked by their relatively slow growth.
This type of lichens commonly occurs in extreme habitats, such as tundra ecosystems (Nash, 2012). 14
Pleurocarpous mosses are moss types in which the archegonia (i.e. sex organs) and capsules (i.e. spore-bearing
structures) are borne on short, lateral branches rather than at the tips of the stems or branches (Allaby, 1998).
17
al., 2016). Klanderud and Birks (2003) observed the distribution and frequency changes of vascular
plant species at several summits in Jotunheimen, central Norway. The aim of this long-term research
was to examine possible shifts in species distribution and changes in species richness along an
altitudinal gradient at a multi-decadal time scale. With respect to changes in species distribution, this
study concluded that snow-bed species and a collection of locally rare alpine species of open habitats
proved to be most vulnerable (Sætersdal & Birks, 1997; Holten, 1998). In addition, some regional
alpine taxa and vegetation types are severely threatened with extinction (Holten, 1990; Grahberr et al.,
1995) in absence of local refugial habitats (Gottfried et al., 1999). Moreover, Klanderud and Birks
(2003) reported that summits with a corresponding topography, geomorphology and geographic
situation are marked by similar patterns of change in vegetation distribution and species richness.
Also, species with comparable environmental demands appeared to respond similarly to climate-
induced changes. On average, an annual elevational advance of approximately 1.2 m was observed.
Furthermore, oligotrophic plant species, which generally thrive in a wide range of ecological
conditions and altitudes, showed the largest positive response. Local lee-slope species (e.g. Avenella
flexuosa, Vaccinium myrtillus, Vaccinium uliginosum, Phyllodoce caerulea and some Salix species)
enlarged their present range, not only at elevations where they already occurred, but also towards
higher elevations. Species that commonly thrive on more exposed ridges (e.g. Juncus trifidus, Luzula
spicata, Festuca vivipara and some Carex species) expanded their range as well during the 68-year
long sampling period. However, the dwarf shrub Empetrum nigrum showed the most significant
positive response with an upward movement of about 200 m. The increased abundance of dwarf
shrubs, such as Vaccinium myrtillus, Vaccinium uliginusum and Empetrum nigrum can be related to an
increase in both the length of the snow-free period and the length of the growing period. These species
mainly belong to mesophilous heaths15
and are expected to invade snow beds together with other lee-
slope species as the duration of snow cover gradually decreases. Species of less extreme snow-beds
(e.g. Omalotheca supina, Veronica alpina, Sibbalidia procumbens and Casiope hypnoides) have
increased their frequency as well, which could also be attributed to a longer growing season. On the
other hand, species that are characteristic for extreme late-melting snow beds (e.g. Oxyria digyna,
Cerastium cerastoides, Ranunculus pygmaeus and several Saxifraga species) showed a declining
frequency in most occupying sites due to the fact that an earlier snow melt contributed to a significant
decrease in soil moisture and nutrient availability during the summer months. Finally, high altitude
species (e.g. Ranunculus glacialis, Poa flexuosa and Trisetum spicatum) largely vanished from their
low altitude habitats, but substantially increased their abundance at the highest sites of the
Jotunheimen mountain range.
Virtanen et al. (2003) observed some similar changes in two alpine environments in Finland and
Norway between 1920 and 1999 and reported them quantitatively. With respect to the heath
vegetation, Empetrum nigrum (+8.1 %) and Salix herbacea (+1.7 %.) significantly increased their
cover, whereas other vascular plant species, such as Arctous alpinus (-7.4 %) and Loiseleuria
procumbens (-37.1 %) showed a diminishing cover percentage. Euphrasia frigida completely
disappeared during the sampling period. Also, some common lichen species considerably declined or
even vanished from the monitoring site: Cladonia sp. (-2.1 %), Flavocetraria nivalis (-12.8 %) and
Solorina crocea (-2.6 %). On the other hand, bryophyte species, such as Gymnomitrion sp. (+9.5 %)
and Racomitrium lanuginosum (+13 %) substantially increased their cover in the heath areas. In snow-
bed areas, vascular plant species, such as Carex bigelowii (-13.6 %), Carex vaginata (-2.2 %) and
Salix herbacea (-13.5 %), and lichen species, such as Cetraria islandica (-3.6 %) and Cladonia
gracilis (-9.7 %), significantly declined. Less extreme snowbed species, Bistorta vivipara (+3 %) and
15
Mesophilious species are organisms that grow best at moderate temperatures (Schulze, 2005).
18
Solidago virgaurea (+2.1 %), locally increased their cover. Other species, which were normally absent
in these snow-bed areas, like Geranium sylvaticum (+1.7 %), Luzula multiflora (+1.8 %) and
Ranunculus acris (+2.6 %), recently established. Finally, in the alpine mires a decline in vascular
plants species was observed, especially for high altitude species like Carex bigelowii (-5.4 %) and
Carex rupestris (-6.3 %), grasses like Festuca vivpara (-4.6 %) and other perennial herbs like
Pedicularis oederi (-4 %) and Pinguicula vulgaris (-2 %).
Another important change that is observed in Arctic and alpine ecosystems, is a shift in the position of
the treeline (Mindas et al., 2000; Kullman, 2002; Penuelas & Boada, 2003; Sanz-Elorza et al., 2003;
Camarero & Gutiérrez, 2004; Parmesan, 2006; Gehrig-Fasel et al., 2007; Shiyatov et al., 2007). In the
last few decades, treelines have moved in a poleward direction in Sweden (Kullman, 2001; Moen et
al., 2004) and in an eastern direction in Canada (Lescop-Sinclair & Payette, 1995). Also, in Russia
(Meshinev et al., 2000) and in New Zealand (Wardle & Coleman, 1992) the treeline has significantly
shifted upward. The position of the treeline is determined by a wide range of complex interactions
between past and present climatic conditions and disturbances (Oksanen et al., 1995; Hofgaard, 1997a;
Hofgaard, 1997b; Körner, 1999). In addition, several studies have already been performed, correlating
climatic indices (e.g. summer mean temperature and temperature sums) to the location of the treeline
(Körner, 1999; Grace et al., 2002). Moreover, Kullman (1998) and Holten and Carey (1992) indicated
that the treeline position is a sensitive indicator of climate change. The ecotone between forest and
treeless alpine heaths can be considered as an important feature of mountain ecosystems. However,
ecologically valuable alpine heaths are severely fragmented by an advance in the treeline position.
Especially in the future, lower lying treeless valleys would gradually become covered by forest,
breaking up the landscape into a patchwork of smaller areas (Moen, et al., 2004). Fragmentation in
turn decreases species population’s abundance and significantly enlarges dispersal distances,
eventually contributing to an increased susceptibility to local extinctions. Furthermore, together with
climate warming, gradual afforestation in alpine ecosystems stimulates the upward movement of
alpine plant species (Moen et al., 2004). Figure 11 illustrates the upward advance of the treeline
position with approximately 125m on Mt. Mettjeburretjakke, Sweden between 1915 and 2007.
Figure 11: Change in the position of the treeline on Mt. Mettjeburretjakke (855 m a.s.l.) in mid-central Sweden
between 1915 (a) and 2007 (b) (Kullman, 2010).
Community reorganization and ecosystem responses Climate-induced spatial and temporal changes in the distribution and behavior of individual species
probably also disrupt interactions with other species at the same or adjacent trophic levels. Hence,
species that are closely interacting or competing might respond differently or show a divergent
susceptibility to the ongoing climate change, giving rise to a considerable alteration of their
interactions at a multispecies level and as a result limiting range expansions of single species (Walther
et al., 2002; Berg et al., 2009; Walther, 2010). These interactions include among others mutualism,
facilitation, competition and predation. Furthermore, distribution shifts at a lower trophic level might
set in motion a series of distinctive bottom-up effects through ecological networks and eventually
19
induce possible feedback processes (Walther, 2010). The variability in the dispersal rate of interacting
species might disrupt spatial associations (Callaway et al., 2004) in a way that migrating species
become temporarily released from certain soil pathogens (van Grunsven et al., 2007). Subsequently,
this spatial mismatch gives rise to a less negative plant-soil feedback for migrants compared to native
species in the new locality (Berg et al., 2009). In addition, a lot of species with a specialist lifestyle
prove to be indirectly constraint by the distribution of prey or host plants (Kinlan & Gaines, 2003;
MacLachlan et al., 2005). For example, specialist herbivores (e.g. insects) generally show a larger
dispersal capacity and have the ability to keep up with the shifting isotherms. However, this expansion
will be largely constraint due to the fact that their plant resource moves at a slower rate and commonly
lags behind (Kinlan & Gaines, 2003; Berg et al., 2009).
Top-down effect in plant and animal communities have also been observed. Those effects proved to
have a considerable influence and the community responses as well (Walther, 2010). For example, the
susceptibility to climate warming seems to increase significantly along trophic levels with a
considerably larger thermal response of top trophic level organisms. As temperatures increase, this
asymmetry might eventually lead to a community destabilization with cascading effects down the food
web (Voigt et al., 2003). Post and Pedersen (2008) performed a warming experiment, indicating that
the response of plant communities was strongly depending on the presence or absence of herbivores.
The study showed that in absence of herbivores, the plant community changed from graminoid-
dominated to dwarf-birch dominated after being subjected to increased temperatures for a certain
amount of time. In this case, the primary productivity and plant community composition was
predominantly regulated by the changing climatic conditions. Nonetheless, if musk oxen and caribou
grazed on the experimentally warmed plots, no consistent alteration in the plant community
composition was observed.
Arctic plant communities show a climate-induced alteration in species composition with a
significantly diminishing macrolichen abundance and an increasing abundance of vascular plants
(Harte & Shaw, 1995; Cornelissen et al., 2001; Walther, 2003). Likewise, substantial population
increases of the two native vascular plant species (Colobanthus quitensis and Deschampsia antarctica)
have been observed on the Antarctic Peninsula (Fowbert & Smith, 1994). On the one hand, native
tundra species increase their abundance and distribution by claiming areas which have recently been
exposed by the retreat of ice, but on the other hand a large variety of vascular plant and bryophyte
species invade from lower latitudes and successfully establish a viable population in the warming
tundra biome and locally increasing species richness (Kennedy, 1995; Convey, 2001; Walther, 2003).
However, short-term warming experiments (e.g. Walker et al., 2006) in a wide variety of tundra
ecosystems report the opposite effect, with a strong local decline in biodiversity. These observations
are inconsistent with the broad patterns of increasing biodiversity along natural gradients of increasing
temperatures in response to climate change (Walker, 1995) and can be largely explained by differences
in short-term and long-term warming effects. On a short time scale, local extinctions and changes in
the dominance of certain species presumably occur before the introduction of new migrants (Sala et
al., 2000; Walker et al., 2006). Consequently, according to Walker et al. (2006) tundra ecosystems will
initially show a decline in biodiversity due to a distinctive species loss and shift of the vegetation
towards an increased shrub dominance.
In alpine ecosystems, a warming-induced range shift of species towards higher altitudes is observed
(Gottfried et al., 1999; Engler et al., 2011), gradually transforming mountain plant communities
(Gottfried et al., 2012). In general, cold-adapted species, with an optimal performance at lower
temperatures, show a decreasing trend, whereas warm-adapted species tend to flourish in response to
the warming climate. Gottfried et al. (2012) referred to this process as thermophilization. Observations

20
of these trends have been recorded during the last decade, with a significant increase of thermophilic
species between 2001 and 2008 on several mountain summits all across Europe. Thermophilization of
mountain plant communities proved to be more pronounced with an increasing degree of climate
warming. As a result, prolonged temperature increases might cause stronger competition in the lower
alpine belt by highly productive species, which accumulate a lot of biomass in a short period of time
and potentially overgrow other species (Callaway et al., 2002; Wipf et al., 2006; Wipf & Rixen, 2010).
However, in the high alpine belt and the nival belt, species richness is expected to increase as a
consequence of thermophilization (Walther et al., 2005; Gottfried et al., 2012). The concept of
thermophilization was only recently introduced and has been applied for vascular plants (e.g. Gottfried
et al., 2012; De Frenne et al., 2013) and butterfly, fish and bird species (e.g. Devictor et al., 2012). For
cryptogams such as lichens and bryophytes, however, this concept has not yet been studied.
Next to species richness, species evenness is also affected by climate warming (Walker et al., 2006)
with some important consequences for the ecosystem as well (Chapin et al., 2000). Walker et al.
(2006) reported a decrease in evenness for tundra ecosystems after a certain period of experimental
warming. In other words, the dominance structure of tundra plant communities is predicted to change
significantly with a shift towards fewer species producing a greater fraction of the cover. Climate-
induced changes in the interactions between species at a plant community level can also show more
complex patterns, for example along an altitudinal gradient (Callaway et al., 2002). Callaway et al.
(2002) focused on positive interactions (i.e. facilitation) between plant species and their importance
relative to competition. Such positive effects include among others the accumulation of nutrients, the
protection against grazing and tramping by herbivores, the provision of shade, etc., each enhancing the
performance of neighboring species. The report published two main conclusions. Firstly, they found
that biomass, growth and reproduction of alpine plants significantly increased when other plants were
growing in the direct vicinity. Secondly, negative species interactions (such as competition) primarily
occurred at lower elevations where abiotic conditions proved to be physically less stressful. At these
lower elevations, an invasion of competitively stronger species could lead to a diminished abbundance
of less competitive snow-bed species and high-altitude species growing at their lower-elevation limits
(Klanderud & Birks, 2003). However, at higher altitudes, where abiotic stress prevails, mostly positive
effects (such as facilitation) were observed. Likewise, positive species interactions dominated at sites
with a lower temperature, whereas competition prevailed in warmer areas. In conclusion, general
interactions will shift along an altitudinal gradient from competition to facilitation with an increasing
degree of abiotic stress. This shift can be mainly attributed to fundamental physiological limitations: at
lower elevations resource availability limits growth and reproduction of plants, while at higher
elevations non-resource factors such as temperature, wind scouring and soil instability appear to be the
greatest constraints. In this case, neighboring species contribute to an enhancement of abiotic stresses,
thereby favoring plant growth to a larger extent than the competition with the neighboring plants
(Grime, 1979).
Climate change not only influences the community structure and ecosystem process through an
increase in temperature alone (Dukes & Mooney, 1999; Travis, 2003; Walther et al., 2009; Walther,
2010). For example, Bhatt et al. (2010) observed that vegetation shifts in the Arctic tundra were
significantly correlated with the recent decline of near-coastal sea-ice. Summer sea-ice considerably
declined in cover (Stroeve et al., 2007) and thickness (Rothrock et al., 2008; Kwok & Rothrock, 2009)
during the last few decades. As a result, the land surface temperatures increased even more, leading to
an increase in tundra productivity (Bhatt et al., 2010). Other important determinants of the community
composition are soil moisture and nutrient availability (Walker et al., 2006). In general, areas with a

21
mesic regime16
are characterized by the most significant response to climate warming and in turn the
largest impact on species biodiversity (Grime, 2001). Walker et al. (2006) indicated that Low Arctic
mesic sites showed the largest increase in canopy height after experimental warming. However, also
the cover density of tundra plant communities plays a substantial role. Higher canopy densities limit
lateral expansion and therefore stimulate growth in a vertical direction. High Arctic ecosystems
showed little response to climate warming, which can most likely be attributed to the fact that these
regions are characterized by a low nutrient availability (Robinson et al., 1995).
In conclusion, warming-induced community reorganization not only gives rise to a reshuffling of the
existing species, but also leads to the introduction of new species. Those species tend to mix with the
present communities and eventually compose new assemblages (Walther et al., 2004; Williams &
Jackson, 2007; Hobbs et al., 2009). As a result, the entire ecological network and ecosystem
functioning might be modified on a long time scale (Dukes & Mooney, 2004). Furthermore, species
dynamics at range boundaries are more prone to climate-induced changes compared to the dynamics
within the interior of a species range (Parmesan & Yohe, 2003). Finally, the effect of global warming
on plant communities can be both direct, as a result of higher temperatures or a decrease in water
availability (Van Mantgem & Schwilk, 2009), or indirect, for example through an insect outbreak and
subsequent tree mortality (Kurz et al., 2008).
Feedbacks of biodiversity changes on ecosystem processes Shifts in the local composition and frequency of plant species affect ecosystem processes as well,
triggering a wide range of feedbacks (Walker et al., 2006; Walther, 2010; Elmendorf et al., 2012). For
example, the gradual transition of a herb-dominated to a woody tundra will lead to a significant
alteration of the ecosystem functioning (e.g. shrub invasion in water-limited ecosystems disturbs the
ecosystem water balance with potential implications for the area’s hydrological cycle) and causes a
positive climate feedback (Caldeira et al., 2015). As shrub height and cover increases in tundra
regions, the surface albedo and roughness changes as well, which in turn alters the entire surface
energy budget (Chapin et al., 2000; Sturm et al., 2001). Generally, shrub-dominated canopy covers
tend to go hand in hand with a greater leaf density and a lower surface albedo. As a result, more
incoming solar radiation will be absorbed by the land surface, amplifying local atmospheric warming
(Foley et al., 1994; Sturm et al., 2001). Likewise, Thomson et al. (2004) proved that shrub expansions
in tundra environments contribute to an increase of the summer sensible heat flux and a decrease in the
winter surface albedo. In addition, due to the modification of surface energy fluxes, shrub
establishment gives rise to the creation of microclimatic conditions with a significant increase in
nighttime air temperature, especially during the winter months. These microclimatic conditions
effectively reduce the exposure of other plant species to minimum air temperatures and subsequently
affect the community composition through facilitation (D’Odorico et al., 2010; Myers-Smith et al.,
2011). Finally, shrub encroachment and the shift towards a woody tundra affect the ecosystem carbon
balance (e.g. by increasing the plant and soil carbon stocks and decreasing the atmospheric CO2 levels)
and nutrient dynamics (e.g. through a change in the amount of litter that is added to tundra soils) (King
& Neilson, 1992; Smith & Shugard, 1993; Sturm et al., 2001; Jackson et al., 2002; Walker et al., 2004;
Neilson et al., 2005). Elmendorf et al. (2012) also recently reported that the amount of dead plant
material significantly increased in plots which were subjected to experimental warming. Along with an
increased shading effect, the additional production of recalcitrant leaf litter with a slow turnover may
16
A mesic soil moisture regime is characterized by a mean annual soil temperature ranging between 8 – 15 °C
and a difference between the mean summer and winter temperature larger than 5 °C at 50 cm below the soil
surface (USDA, 1999).
22
have a buffering effect on climate warming due to the reduced soil heterotrophic respiration
(Cornelissen et al., 2007; Blok et al., 2010). In addition, water supply and quality seemed to be
affected by terrestrial vegetation shifts (Gitay et al., 2001; Neilson et al., 2005). Finally, indirect
climate feedbacks have also been observed. For example, warmer temperatures can stimulate insect
outbreaks and in turn cause a widespread tree mortality. Consequently, ecosystem functioning of
entire forests was altered, converting this carbon sink into a massive net carbon source (Kurz et al.,
2008).
Other possible drivers of ecological responses in
tundra ecosystems Next to climate warming, other factors might be responsible for vegetation distribution shifts and
biodiversity changes in the tundra biome, e.g. atmospheric nitrogen (N) deposition, grazing, land-use
changes, invasive species and natural succession (Klanderud & Birks, 2003; Parmesan & Yohe, 2003).
At first, Klanderud and Birks (2003) considered the effect of N deposition on local species diversity.
N deposition through precipitation significantly increased to about 2000 mg m-2
year-1
(or 20 kg ha-1
year-1
) in the Jotunheimen mountain range during the last century (Tørseth & Semb, 1997). These
depositions are expected to fertilize alpine heath ecosystems, largely influencing regional plant
communities (Chapin & Shaver, 1985) and stimulating species diversity in otherwise low productive
areas (Teodose & Bowman, 1997). However, N deposition reaches significantly higher values at low
elevation areas, close to industrial and agricultural activities, and are therefore often considered as a
lowland problem. Nonetheless, mountain vegetation shows a much larger response due to its selection
for survival in a nutrient poor environment (Körner, 2013). This was also observed by Hiltbrunner et
al. (2005) in the Central Swiss Alps, where alpine plants already responded sensitively to an annual N
deposition rate of 5 – 10 kg per hectare.
Secondly, the effect of grazing on plant communities and their responses to climate change has been
widely demonstrated. Austrheim and Eriksson (2001) concluded that the ongoing grazing activities on
low-productive snow-beds and alpine heath ecosystems within the Scandinavian mountains
substantially decreased local species richness. On more productive lands, however, moderate grazing
showed the opposite effect with an increase in species diversity (Chapin & Körner, 1995; Körner,
1999; Austrheim & Eriksson, 2001). Extreme snow-bed plant species are highly susceptible to an
increase in grazing as well, since they are extremely attractive to reindeer at higher altitudes (Gaare &
Skogland, 1970). Moreover, according to Gaare and Skogland (1970), alpine grazers such as reindeer
and sheep are rather selective and generally prefer grasses to shrubs. Hence, moderate grazing might
contribute to shrub encroachment and the consequent transition of grassland to shrub-dominated
vegetation (Jefferies & Bryant, 1995). Subsequently, keeping the effect of herbivores into account,
Klanderud and Birks (2006) concluded that the increased abundance of dwarf shrubs at lower
elevations in the Jotunheimen mountain range resulted either from grazing activities or a synergy
between grazing and climate change. Herbivores also have the ability to modify and slow down (or
even halt) the upward movement of the treeline (Moen et al., 2004). Climate-driven treelines show a
gradual transition with progressively smaller tree individuals as the climatic conditions become less
and less favorable, whereas treelines in grazed areas appear to be more abrupt (Ellenberg, 1988). The
browsing activity of herbivores leads to a depletion of resources from individuals, that are already
occurring at the limits of their survival, and increases mortality near the border of the treeline. In
addition, browsing is expected to prevent regeneration, which in turn reduces the amount of saplings
and young trees. Hence, the upward movement of the treeline might be stalled, or even completely
stopped, due to the fact that herbivores feed on seedlings that are already severely weakened by
23
unfavorable climatic conditions and increased competition from field layer plant species (Moen et al.,
2004).
The herd density also plays a key role in the alteration of vegetation composition and ecosystem
productivity (McNaughton et al., 1989; Bråthen et al., 2007). Studies indicate that the aboveground
primary productivity can be both positively or negatively affected by an increase in herbivore stock
density, depending on how the species composition shifts under the present grazing regime
(McNaughton et al., 1989; Hobbs, 1996; Augustine & McNaughton, 1998). In some cases, the
composition of plant communities showed clear resistance against changes in the grazing regime,
whereas in other cases plant communities shifted towards an increased dominance of persistent growth
forms with a substantially lower productivity (Bestelmeyer et al., 2004). Bråthen et al. (2007)
demonstrated that high-density reindeer herds have the ability to homogenize the biomass and
abundance of palatable plants across environmental productivity gradients. They observed that a
persistent high reindeer grazing pressure eventually led to a reduction of plants with facilitating or
neutral effect on ecosystem productivity. For example, in high-density districts the abundance of
palatable plants (e.g. grasses, tall dicotyledons and N-facilitators) on resource-rich sites decreased to
that of less fertile areas. Along with grazing, tourism contributes to the creation of microsites where
the germination and survival of seedlings is highly promoted (Eriksson & Ehrlen, 1992). For example,
near hiking trails in mountain areas species richness might increase due to increased shelter
possibilities and the presence of a suitable rooting substrate. On the other hand, hiking activity tends to
go hand in hand with extensive trampling, increasing the probability of a local drop in species richness
along the trails.
Another possible driver of plant community shifts in tundra ecosystems is the effect of natural
succession. This process seems to be delayed in most extreme environments, such as Arctic and alpine
regions, but can be substantially accelerated as a response to climate warming, increased N deposition
and higher grazing- or tourism-related pressures (Klanderud & Birks, 2003). Presently, vegetation in
tundra ecosystems is still recovering from the Little Ice Age. Hence, many tundra plant species have
not reached a distribution that corresponds with the current climate forcings. For instance, in
Jotunheimen, most of the species that showed a decreasing abundance in the last few decades (e.g.
Oxyria digyna, Trisetum spicatum and some Cerastium and Saxifraga species) can be categorized as
pioneers and are characteristic for early successional stages. As succession gradually proceeds towards
a more mature plant community, these species will be easily substituted by species that are more
characteristic for a later successional stage (e.g. Avenella flexuosa, Empetrum nigrum and some
Vaccinium and Salix species) (Matthews & Whittaker, 1987; Matthews, 1992). However, at higher
altitudes (above 1500 m) an invasion of lowland shrubs as a result of natural succession is prevented
by the shorter growing season (Matthews, 1992).
Finally, a wide range of human activities constantly modifies the structure of plant communities and
therefore considerably influences biodiversity and the entire ecosystem functioning. Thuiller (2007)
concluded that vast land-use changes and climate warming have presumably been the most important
drivers of 20th century ecological responses of plants and animals. In addition, habitat fragmentation as
a result of extensive resource extractions, agricultural activities and urbanization significantly altered
plant and animal communities as well, sometimes even up to the point of local species extinctions
(Walther et al., 2002). Moreover, the introduction of non-native, exotic species in a new area and the
subsequent spread is often mediated by human activities. After crossing the geographical boundaries
of a new habitat, these exotic species have to overcome local abiotic and biotic restrictions in order to
grow and reproduce. Subsequently, they will gradually expand their distribution and become invasive.
Exotic species generally lack a certain enemy and outcompete native species within the new locality,

24
thereby reducing species richness (Walther et al., 2002). Common examples of alien species in tundra
ecosystems are among others Himalayan balsam (Impatiens glandulifera) and the garden lupine
(Lupinus polyphyllus) (Norwegian Biodiversity Information Centre, 2012; Global Invasive Species
Database, 2015).
Aims In the light of these climate-induced vegetation responses, several monitoring initiatives and networks
were established all across the globe. Among others, the Global Observation Research Initiative in
Alpine Environments (GLORIA) was founded in order to assess long-term climate change impacts on
plant communities in high-mountain ecosystems (Pauli et al., 2015). Within the scope of this
international research initiative, comparable data are collected in different mountain areas around the
world. One of these target regions is situated in the Dovrefjell National Park, Norway, and the set-up
consists of four summits representing an elevational gradient. These summits were previously
monitored in 2001 and 2008 and some substantial spatial and temporal changes in vegetation were
observed (Michelsen et al., 2011). This study reported a significant increase in species richness and a
considerable change in cover and abundance of certain vascular plant species, especially an increase of
woody plants and graminoids. In 2015, local plant species were re-inventoried in order to determine
whether these trends continued throughout the years and whether these changes in vegetation can be
attributed to the ongoing changes in climate conditions during the same period. The practical part of
this master thesis summarizes the results of the most recent monitoring campaign at Dovrefjell and
assesses the impact of climate change, as well as the influence of other possible drivers. In particular,
the following research questions will be addressed:
[1] Is there a significant positive change in soil temperature between 2001 and 2015?
[2] Is there a significant effect of the summit characteristics (altitude and/or aspect) on the change in
soil temperature?
[3] Did a significant change in plant, lichen and bryophyte species richness and community
composition occur between 2001 and 2015? Which species have disappeared and which species
are new? Can we related species’ functional traits to their change in frequency over time?
[4] Is it possible to relate the observed changes in local vegetation patterns to the observed changes in
temperature? Which other drivers might have an influence?

25
Materials and methods
Study area The study area is located in the Dovrefjell-Sunndalsfjella National Park (Norwegian: Dovrefjell-
Sunndalsfjella nasjonalpark), one of the largest continuously protected nature reserves on the
Norwegian mainland. Together with the surrounding protected areas, the National Park covers about
4367 km2, including a large part of the Dovrefjell mountain range (Nasjonalparkene, 2015). In this
region, four mountain summits were selected in order to study possible vegetation shifts as a result of
climate change along an elevational gradient: Vesle Armodshøkollen (62°15’40.5’’ N, 9°39’55.4’’ E,
1161 m a.s.l.), Veslekolla (62°18’23.6’’ N, 9°27’25.2’’ E, 1418 m a.s.l.), Kolla (62°17’30.5’’ N,
9°29’12.7’’ E, 1651 m a.s.l.) and Storkinn (62°20’48.2’’ N, 9°26’27.1’’ E, 1845 m a.s.l.). The
summits are situated in two Norwegian municipalities, namely the Oppdal (Sør-Trødelag county) and
Dovre municipality (Oppdal county), and are chosen to represent an altitudinal gradient from the low
alpine zone up to the high alpine zone in the Dovrefjell mountain region. Figure 12 shows a map of
the study area, together with the exact location of the four selected summits.
Figure 12: Topographic map of Dovrefjell with the location of the four selected GLORIA summits and the nearby
weather station of Gammel-Fokstugu; basemap: N500 Raster, UTM 33, Norway-country, MrSID; coordinate system:
WGS 84 / UTM zone 33N (Kartverket, 2015) (Edited in QGIS 2.6.0-Brighton).
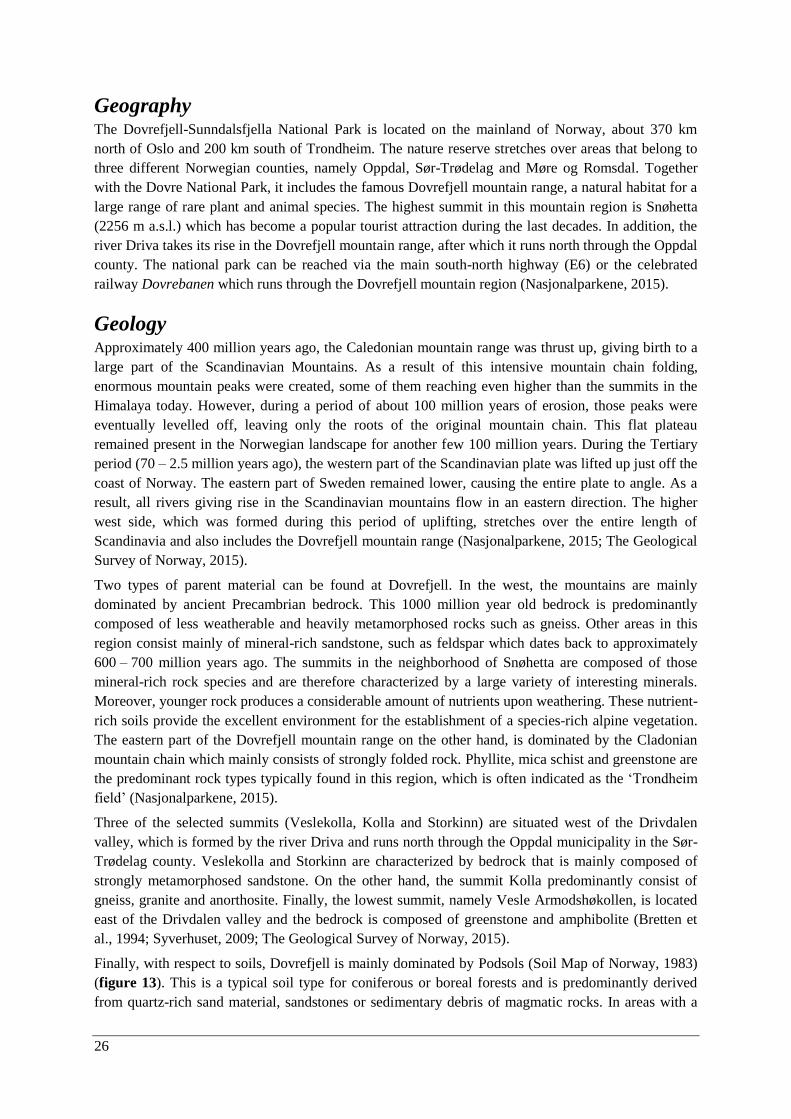
26
Geography The Dovrefjell-Sunndalsfjella National Park is located on the mainland of Norway, about 370 km
north of Oslo and 200 km south of Trondheim. The nature reserve stretches over areas that belong to
three different Norwegian counties, namely Oppdal, Sør-Trødelag and Møre og Romsdal. Together
with the Dovre National Park, it includes the famous Dovrefjell mountain range, a natural habitat for a
large range of rare plant and animal species. The highest summit in this mountain region is Snøhetta
(2256 m a.s.l.) which has become a popular tourist attraction during the last decades. In addition, the
river Driva takes its rise in the Dovrefjell mountain range, after which it runs north through the Oppdal
county. The national park can be reached via the main south-north highway (E6) or the celebrated
railway Dovrebanen which runs through the Dovrefjell mountain region (Nasjonalparkene, 2015).
Geology Approximately 400 million years ago, the Caledonian mountain range was thrust up, giving birth to a
large part of the Scandinavian Mountains. As a result of this intensive mountain chain folding,
enormous mountain peaks were created, some of them reaching even higher than the summits in the
Himalaya today. However, during a period of about 100 million years of erosion, those peaks were
eventually levelled off, leaving only the roots of the original mountain chain. This flat plateau
remained present in the Norwegian landscape for another few 100 million years. During the Tertiary
period (70 – 2.5 million years ago), the western part of the Scandinavian plate was lifted up just off the
coast of Norway. The eastern part of Sweden remained lower, causing the entire plate to angle. As a
result, all rivers giving rise in the Scandinavian mountains flow in an eastern direction. The higher
west side, which was formed during this period of uplifting, stretches over the entire length of
Scandinavia and also includes the Dovrefjell mountain range (Nasjonalparkene, 2015; The Geological
Survey of Norway, 2015).
Two types of parent material can be found at Dovrefjell. In the west, the mountains are mainly
dominated by ancient Precambrian bedrock. This 1000 million year old bedrock is predominantly
composed of less weatherable and heavily metamorphosed rocks such as gneiss. Other areas in this
region consist mainly of mineral-rich sandstone, such as feldspar which dates back to approximately
600 – 700 million years ago. The summits in the neighborhood of Snøhetta are composed of those
mineral-rich rock species and are therefore characterized by a large variety of interesting minerals.
Moreover, younger rock produces a considerable amount of nutrients upon weathering. These nutrient-
rich soils provide the excellent environment for the establishment of a species-rich alpine vegetation.
The eastern part of the Dovrefjell mountain range on the other hand, is dominated by the Cladonian
mountain chain which mainly consists of strongly folded rock. Phyllite, mica schist and greenstone are
the predominant rock types typically found in this region, which is often indicated as the ‘Trondheim
field’ (Nasjonalparkene, 2015).
Three of the selected summits (Veslekolla, Kolla and Storkinn) are situated west of the Drivdalen
valley, which is formed by the river Driva and runs north through the Oppdal municipality in the Sør-
Trødelag county. Veslekolla and Storkinn are characterized by bedrock that is mainly composed of
strongly metamorphosed sandstone. On the other hand, the summit Kolla predominantly consist of
gneiss, granite and anorthosite. Finally, the lowest summit, namely Vesle Armodshøkollen, is located
east of the Drivdalen valley and the bedrock is composed of greenstone and amphibolite (Bretten et
al., 1994; Syverhuset, 2009; The Geological Survey of Norway, 2015).
Finally, with respect to soils, Dovrefjell is mainly dominated by Podsols (Soil Map of Norway, 1983)
(figure 13). This is a typical soil type for coniferous or boreal forests and is predominantly derived
from quartz-rich sand material, sandstones or sedimentary debris of magmatic rocks. In areas with a
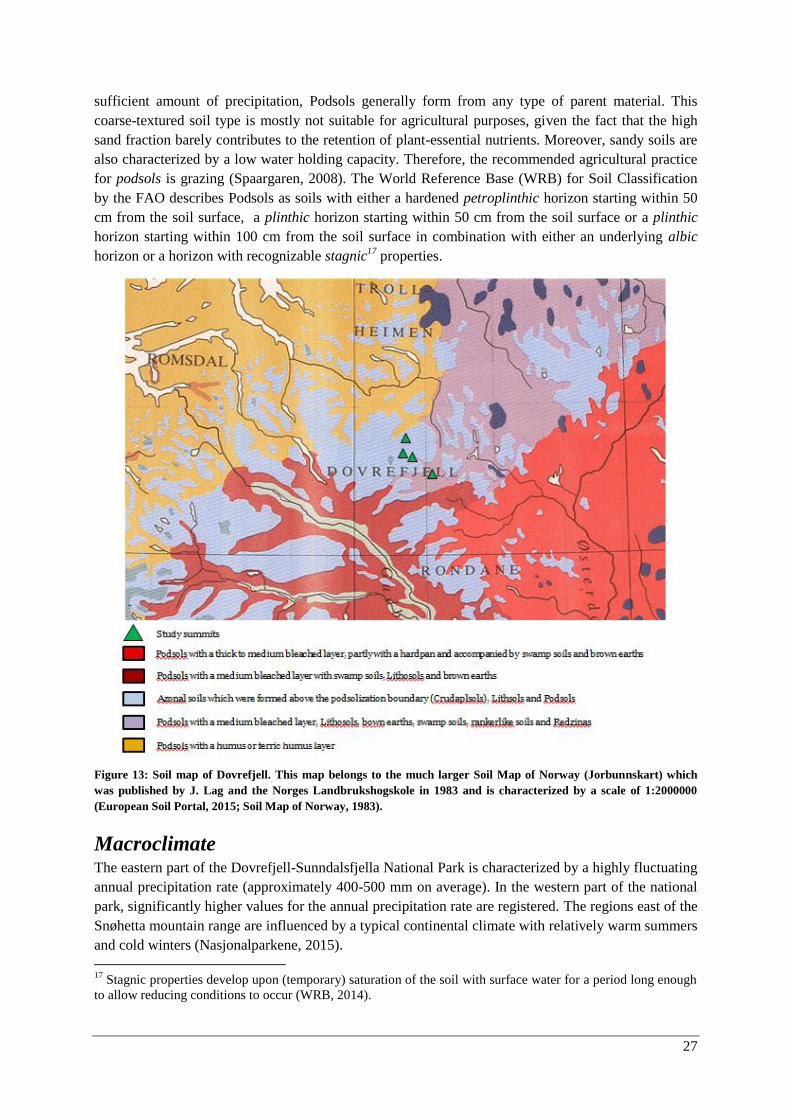
27
sufficient amount of precipitation, Podsols generally form from any type of parent material. This
coarse-textured soil type is mostly not suitable for agricultural purposes, given the fact that the high
sand fraction barely contributes to the retention of plant-essential nutrients. Moreover, sandy soils are
also characterized by a low water holding capacity. Therefore, the recommended agricultural practice
for podsols is grazing (Spaargaren, 2008). The World Reference Base (WRB) for Soil Classification
by the FAO describes Podsols as soils with either a hardened petroplinthic horizon starting within 50
cm from the soil surface, a plinthic horizon starting within 50 cm from the soil surface or a plinthic
horizon starting within 100 cm from the soil surface in combination with either an underlying albic
horizon or a horizon with recognizable stagnic17
properties.
Figure 13: Soil map of Dovrefjell. This map belongs to the much larger Soil Map of Norway (Jorbunnskart) which
was published by J. Lag and the Norges Landbrukshogskole in 1983 and is characterized by a scale of 1:2000000
(European Soil Portal, 2015; Soil Map of Norway, 1983).
Macroclimate The eastern part of the Dovrefjell-Sunndalsfjella National Park is characterized by a highly fluctuating
annual precipitation rate (approximately 400-500 mm on average). In the western part of the national
park, significantly higher values for the annual precipitation rate are registered. The regions east of the
Snøhetta mountain range are influenced by a typical continental climate with relatively warm summers
and cold winters (Nasjonalparkene, 2015).
17
Stagnic properties develop upon (temporary) saturation of the soil with surface water for a period long enough
to allow reducing conditions to occur (WRB, 2014).
28
Weather stations in Dovrefjell are located at Snøheim (1505 m a.s.l.), Kongsvoll (930 m a.s.l.) and
Gammel-Fokstugu (972 m a.s.l.). Data gathered at the weather station of Gammel-Fokstugu,
approximately 25 km from the study area, indicated a long-term mean annual temperature of
approximately -0.1 °C between the period of 1961-1990. Generally, the highest temperatures were
measured in the month of July with a mean monthly temperature of 9.8 °C, while the coldest
temperatures were registered in January with a mean monthly temperature of -8.8 °C. In addition, the
average annual precipitation at the weather station of Gammel-Fokstugu approached a value of about
435 mm (Syverhuset, 2009; Norwegian Meteorological Institute, 2015). Figure 14 shows the mean
annual temperature anomaly relative to the normal period of 1961-1990 for this weather station. On an
annual basis, the long-term average temperature between 1961-1990 approximated a value of 0.8 °C.
Figure 14: Anomaly of the mean annual temperature relative to the baseline period of 1961-1990 at the weather
station of Gammel-Fokstugu. The dashed line shows the long-term linear trend, whereas the red line represents a 10-
year running average.
The mean annual temperature measurements at Gammel-Fokstugu showed a visible upward trend
throughout the period of 1900-2014. A statistical analysis (ANOVA) confirmed the fitted linear
trendline to be significantly increasing over time (F = 8.96, n = 114, P = 0.00338) (table 1).
Table 1: ANOVA results for fitting a linear trendline to the mean annual temperature anomaly (MATA)
measurements. The code (**) corresponds with a significance level of 0.01 or 1 %.
Effect Df SSR MSR F-value p-value
MATA 1 9315 9315.2 8.96 0.00338 **
Residuals 113 117415 1039.1
Figure 15 represents the change of the mean seasonal temperature anomaly relative to the normal
period of 1961-1990 at Gammel-Fokstugu. The long-term average seasonal temperatures for the
spring, summer, autumn and winter were respectively -0.1 °C, 10.2 °C, 1.6 °C and -8.4 °C.
Based on these seasonal temperature graphs, it could be concluded that winter temperatures clearly
showed the largest inter-annual variability in the study area. These results are consistent with the
assessment report of the European Environmental Agency (2013) which also observed a significantly
higher inter-annual temperature variability in Europe during the winter months. According to Hurrell
(1995), this phenomenon is mainly caused by the inter-annual variability in the atmospheric

29
circulation, associated with the North Atlantic Oscillation18
(NAO) and the subsequent fluctuations in
the surface westerlies across the North Atlantic Ocean onto the European continent.
Figure 15: Mean seasonal temperature anomaly at Gammel-Fokstugu weather station relative to the baseline period
of 1961-1990. For each season, the red line represents a 10-year running average.
The annual amount of precipitation at the weather station of Gammel-Fokstugu showed a large
variation throughout the measuring period. Some years proved to be rather wet, whereas other years
were marked by a particularly lower amount of rainfall. Nonetheless, Dovrefjell is considered as one
of the drier regions on the Norwegian mainland (Norwegian Meteorological Institute, 2015).
Figure 16 illustrates the percentage anomaly of the mean annual precipitation. The blue bars indicate
the relative deviation of the annual amount a precipitation in comparison to the long-term average
annual precipitation for the normal period of 1961-1990.
Figure 16: Percentage anomaly of the mean annual precipitation relative to the normal period of 1961-1990 at the
weather station of Gammel-Fokstugu. The red line represents a 10-year running average.
The explicit inter-annual variability in the amount of precipitation was also represented in the four
seasonal graphs. However, no clear long-term trend could be distinguished during the measuring
18
The North Atlantic Oscillation is one of the most prominent teleconnection patterns in the Northern
Hemisphere and is driven by changes in the atmospheric sea level pressure between the Artic and the subtropical
Atlantic. Climate anomalies associated with this event are largest during boreal winter months (Hurrel, 1995).

30
period. This is illustrated by figure 17 showing the percentage anomaly for the mean seasonal
precipitation with respect to the normal period of 1961-1990 at Gammel-Fokstugu.
Figure 17: Percentage anomaly of the mean seasonal amount of precipitation relative to the normal period of 1961-
1990. The red line indicates a 10-year running average for each season.
Ecology
Flora
The Dovrefjell area is characterized by a large variety of climatic conditions and geological features
which provides a wide range of abiotic conditions and possible habitats. As a result, the area is
covered with a highly species-rich alpine vegetation. The vegetation zones range from the northern
boreal zone to the high alpine zone within the study area (Moen et al., 1999; Syverhuset, 2009). The
four GLORIA summits are selected in a way that each mountain is located within a different
vegetation zone: Vesle Armodshøkollen is situated in the low alpine zone, while the summit of
Veslekolla can be found in the transition between the low and middle alpine zone. The two highest
summits, Kolla and Storkinn, are respectively located in the transition between the low and the high
alpine zone and the high alpine zone (Syverhuset, 2009). Moreover, many different vegetation
alliances or characteristic plant communities are found within the study area. The exposed ridges with
only small amounts of snow cover are predominantly covered with plant communities belonging to the
Loiseleurio-Arctostaphylio alliance. In addition, the vegetation cover on the lee sides of the summits
mainly consists of Phyllodoco-Vaccinion and Nardo-Carcion bigelowii alliances. The late-melting
snow beds are generally covered with plants from the Cassiopo-Salicion herbaceae alliance
(Syverhuset, 2009; Elven et al., 1996). Finally, it should be noted that Vesle Armodshøkollen is
characterized by a rather species-rich alpine flora, while the GLORIA summits located to the west of
the Drivdalen valley have a remarkably lower species richness (Michelsen et al., 2011; Syverhuset,
2009).
Fauna
The areas around the mountain range of Dovrefjell are characterized by a varying vegetation cover and
therefore provide an excellent habitat for numerous bird species, e.g. the golden eagle (Aquila
chrysaetos), the gyrfalcon (Falco rusticolus) and the rough-legged buzzard (Buteo lagopus). In
addition, some larger mammals thrive within the borders of the national park. Wolverines (Gulo gulo),
31
for example, were able to establish a viable population, but they are rarely seen by humans in the wild
(Norway’s National Parks, 2015). The Arctic fox (Vulpes lagopus) is also native to the Dovrefjell area,
however its population has been declining dramatically during the last decades.
Another unique mammal housing in the Dovrefjell area, is the musk ox (Ovibos moschatus). In 1931,
it was reintroduced to the region from Greenland and according to most recent survey it has increased
its population up to approximately 300 animals (Bretten, 1990; Syerhuset, 2009). Most of these musk
oxen stay to the west of the Drivdalen valley (Syverhuset, 2009; Michelsen et al., 2011). The wild
reindeer (Rangifer tarandus tarandus), commonly known as the Snøhetta reindeer, occur both to the
west (Snøhetta area) and to the east (Knutshø area) of the Drivdalen valley (Syverhuset, 2009).
Finally, also sheep are typically herded in the Dovrefjell area. Multiple farmers in the municipality of
Oppdal let their sheep graze to the east of the Driva river, mainly in the Knutshø area. In total, over
6000 animals presently occur in this region. Sheep herds from the Folldal municipality are grazing in
the area around the summit Vesle Armodshøkollen. These herds generally move in the direction of
Kongsvoll at the end of the summer (Syverhuset, 2009; Michelsen et al., 2011). More information on
fauna in the Dovrefjell National Park can be found in Appendix A.
In conclusion, a wide variety of animals presently occur within the study area, each with different food
preferences. As a result, every one of these animals has a particular influence on the occurrence and
distribution of the vegetation. Also trampling of grazers has a distinctive impact on the soil and
vegetation (e.g. resulting in soil compaction). Wild reindeer, for example, generally feed on lichen-
covered ridges which are commonly found at Vesle Armodshøkollen. Sheep on the other hand prefer
grasses such as the Wavy hair-grass (Avenella flexuosa) and do not graze on these lichen patches.
Nonetheless, sheep herds use those lichen-covered areas as a resting place, thereby influencing the
present vegetation due to trampling activity (Syverhuset, 2009; Michelsen et al., 2011).
Management Dovrefjell was the first region on the Norwegian mainland to receive the status of a ‘Charter Park’,
meaning that it currently has an internationally recognized plan for a sustainable tourism development.
Europe counts about 45 different charter parks, which are all bound to a general certification of
national parks and protected areas. The certification criteria are set out by an overarching federation
called EUROPARC (Midnorsknatur, 2015; Den Norske Turistforening, 2015; EUROPARC
Conference, 2015). The current management objective for the Dovrefjell National Park is to preserve
an extensive, continuous and predominantly untouched mountain area together with its cultural
heritage. In addition, the preservation of the local alpine ecosystem along with its natural diversity,
landscape morphology and remarkable geological deposits forms a main concern for regional policy
makers. This challenge includes among others a large-scale cleaning of the former local military
domain. Finally, with respect to fauna and flora, local authorities attempt to safeguard the regional
variation in habitats and ensure the long-term preservation of wild reindeer stocks on the west
(Snøhetta area) and the east side (Knutshø area) of the Drivdalen valley (Midnorsknatur, 2015).
The GLORIA project The Global Observation Research Initiative in Alpine Environments, otherwise known as the
GLORIA project, was first presented to an international auditorium in September 2000 during the First
International Conference on Mountain Biodiversity in Rigi/Kaltbad, Switserland (Grahberr et al.,
2000a; GLORIA, 2015). The global monitoring program was founded in order to establish an
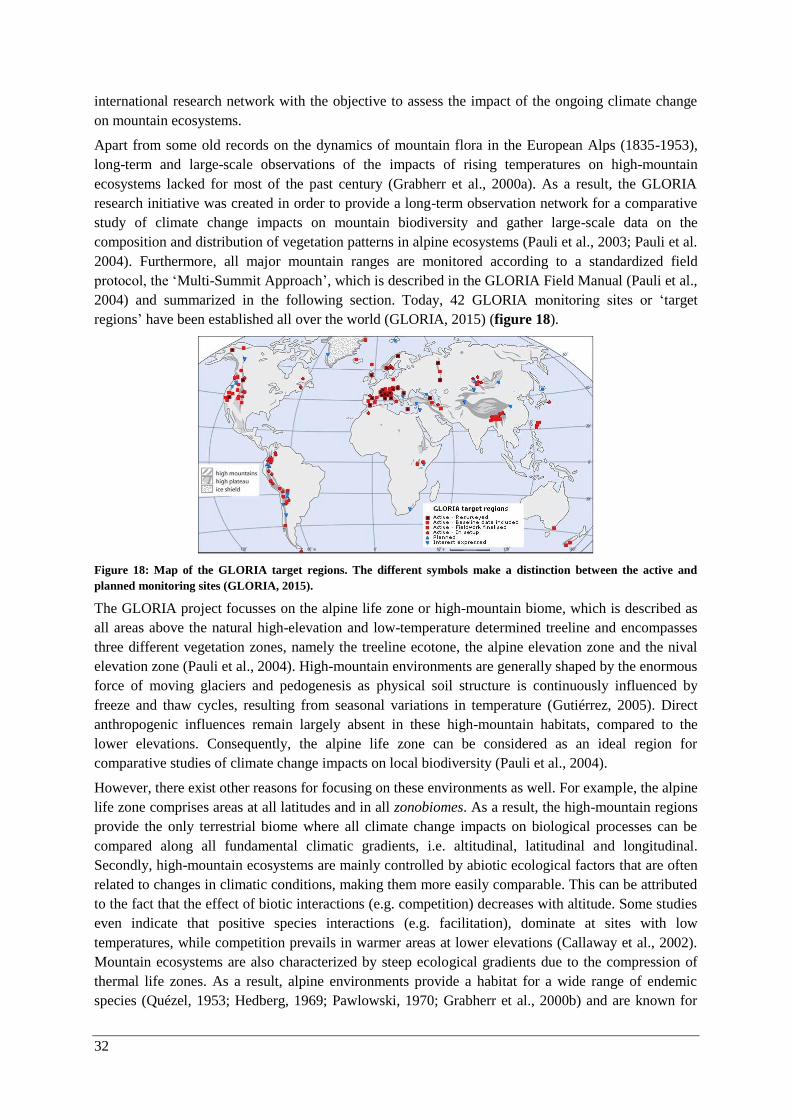
32
international research network with the objective to assess the impact of the ongoing climate change
on mountain ecosystems.
Apart from some old records on the dynamics of mountain flora in the European Alps (1835-1953),
long-term and large-scale observations of the impacts of rising temperatures on high-mountain
ecosystems lacked for most of the past century (Grabherr et al., 2000a). As a result, the GLORIA
research initiative was created in order to provide a long-term observation network for a comparative
study of climate change impacts on mountain biodiversity and gather large-scale data on the
composition and distribution of vegetation patterns in alpine ecosystems (Pauli et al., 2003; Pauli et al.
2004). Furthermore, all major mountain ranges are monitored according to a standardized field
protocol, the ‘Multi-Summit Approach’, which is described in the GLORIA Field Manual (Pauli et al.,
2004) and summarized in the following section. Today, 42 GLORIA monitoring sites or ‘target
regions’ have been established all over the world (GLORIA, 2015) (figure 18).
Figure 18: Map of the GLORIA target regions. The different symbols make a distinction between the active and
planned monitoring sites (GLORIA, 2015).
The GLORIA project focusses on the alpine life zone or high-mountain biome, which is described as
all areas above the natural high-elevation and low-temperature determined treeline and encompasses
three different vegetation zones, namely the treeline ecotone, the alpine elevation zone and the nival
elevation zone (Pauli et al., 2004). High-mountain environments are generally shaped by the enormous
force of moving glaciers and pedogenesis as physical soil structure is continuously influenced by
freeze and thaw cycles, resulting from seasonal variations in temperature (Gutiérrez, 2005). Direct
anthropogenic influences remain largely absent in these high-mountain habitats, compared to the
lower elevations. Consequently, the alpine life zone can be considered as an ideal region for
comparative studies of climate change impacts on local biodiversity (Pauli et al., 2004).
However, there exist other reasons for focusing on these environments as well. For example, the alpine
life zone comprises areas at all latitudes and in all zonobiomes. As a result, the high-mountain regions
provide the only terrestrial biome where all climate change impacts on biological processes can be
compared along all fundamental climatic gradients, i.e. altitudinal, latitudinal and longitudinal.
Secondly, high-mountain ecosystems are mainly controlled by abiotic ecological factors that are often
related to changes in climatic conditions, making them more easily comparable. This can be attributed
to the fact that the effect of biotic interactions (e.g. competition) decreases with altitude. Some studies
even indicate that positive species interactions (e.g. facilitation), dominate at sites with low
temperatures, while competition prevails in warmer areas at lower elevations (Callaway et al., 2002).
Mountain ecosystems are also characterized by steep ecological gradients due to the compression of
thermal life zones. As a result, alpine environments provide a habitat for a wide range of endemic
species (Quézel, 1953; Hedberg, 1969; Pawlowski, 1970; Grabherr et al., 2000b) and are known for

33
their high degree of organismic diversity (Barthlott et al., 1996). Hence, these areas prove to be much
more prone to potential losses as a result of climate changes. Finally, vegetation boundary shifts in
mountain areas can be easily recognized due to the presence of narrow ecotones. Most alpine
vegetation generally consists of long-lived perennial plant species. Subsequently, most species will be
visible within the same growing season, making multiple monitoring events within one season
unnecessary. Long-lived species also tend to be more suitable for monitoring the impacts of climate
change as they are generally less susceptible to short-term climate fluctuations. Prolonged changes in
climatic conditions, however, trigger plant distribution shifts and in the long run threaten certain
species with extinction (Pauli et al., 2004).
In order to study the effect of climate change on this alpine life zone and assess the risk of local
biodiversity losses, in situ observations at a species level are required. This is due to the fact that
single species do not respond separately to a changing environment, but the entire structure and
functioning of the ecosystem is affected (Ammann, 1995; Grahberr et al., 1995; Gottfried et al., 1998;
Berg et al., 2009). A lot of the previous studies regarding environmental changes only focused on the
response of individual species and therefore neglected the fundamental biotic interactions at a species
level such as predation and competition, but also positive species interaction such as mutualism.
Individual species can have a contrasting sensitivity to increasing temperatures causing an entire
disruption of community interactions and ecosystem functioning. Possible examples are mismatches in
phenology or dispersal patterns and the disruption of predator-prey and flower-pollinator interactions
(Whalter et al., 2002; Berg et al., 2009). Within the context of previous conclusions, the GLORIA
project aims to (Pauli et al., 2004):
Provide a standardized data set on the altitudinal differences in species richness and
composition, vegetation cover, soil temperature and length of the snow-cover period in
mountain ranges all over the world;
Quantify temporal changes in alpine biodiversity and ongoing shifts in vegetation patterns;
Contribute to a baseline for the long-term observation of plant communities in order to reveal
climate-induced changes in vegetation cover, species composition and distribution, migration
patterns, etc. (observation intervals range between 5 to 10 years);
Provide a detailed risk assessment for biodiversity losses as a result of global warming by
comparing the present-day distribution patterns of alpine plant species along latitudinal and
altitudinal gradients.
Study design During the fieldwork at Dovrefjell, a standardized method and study design was applied which is
referred to as the ‘Multi-Summit Approach’ and published in the GLORIA Field Manual of 2004
(Pauli et al., 2004) and the revised version of 2015 (Pauli et al., 2015). This combination of guidelines
for a standardized field application forms the basis of the GLORIA monitoring network and was
designed to be universally applicable in numerous alpine ecosystems all over the world, ranging from
polar to tropical latitudes. Presently, already 18 different mountain areas have been selected as ‘Multi-
Summit Sites’ on the European mainland. In order to qualify for a target region, the mountain area has
to contain at least four different summits, representing an altitudinal gradient of vegetation patterns
from the natural treeline ecotone up to the vascular plant limit or, when this limit is not reached, up to
the uppermost vegetation zone (figure 19). Ideally, the arrangement of summits is selected in the
following way:
Summit 1: treeline ecotone
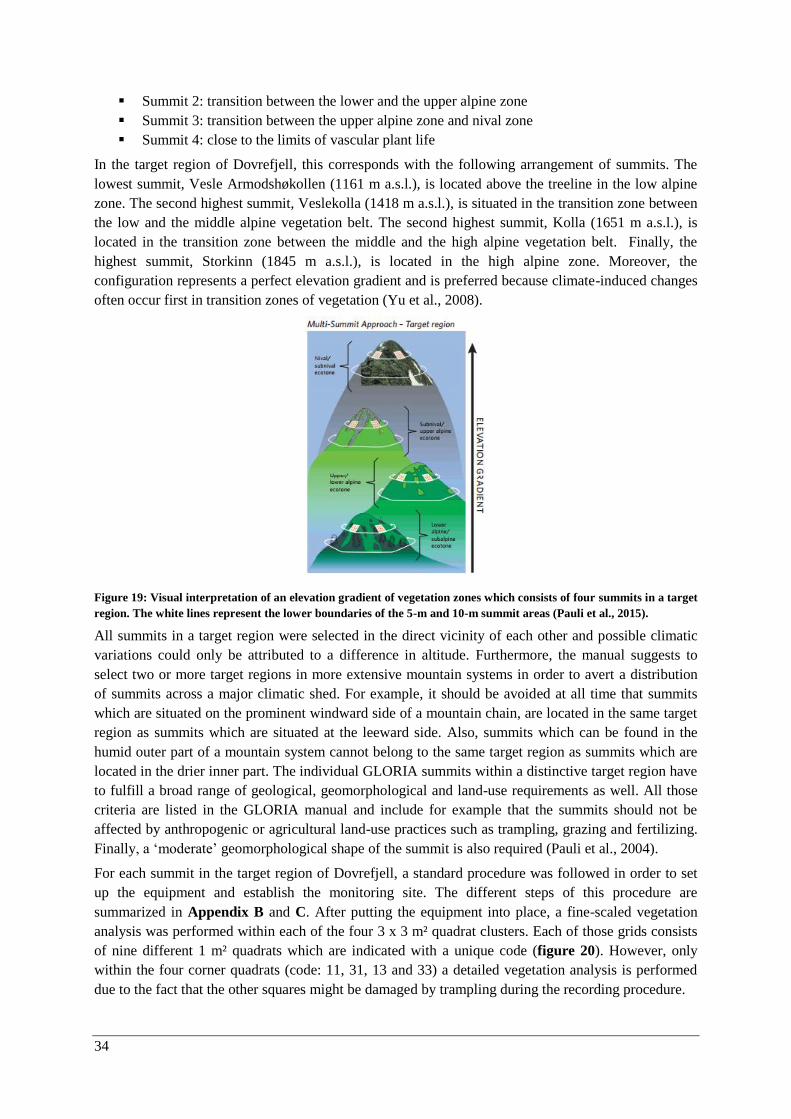
34
Summit 2: transition between the lower and the upper alpine zone
Summit 3: transition between the upper alpine zone and nival zone
Summit 4: close to the limits of vascular plant life
In the target region of Dovrefjell, this corresponds with the following arrangement of summits. The
lowest summit, Vesle Armodshøkollen (1161 m a.s.l.), is located above the treeline in the low alpine
zone. The second highest summit, Veslekolla (1418 m a.s.l.), is situated in the transition zone between
the low and the middle alpine vegetation belt. The second highest summit, Kolla (1651 m a.s.l.), is
located in the transition zone between the middle and the high alpine vegetation belt. Finally, the
highest summit, Storkinn (1845 m a.s.l.), is located in the high alpine zone. Moreover, the
configuration represents a perfect elevation gradient and is preferred because climate-induced changes
often occur first in transition zones of vegetation (Yu et al., 2008).
Figure 19: Visual interpretation of an elevation gradient of vegetation zones which consists of four summits in a target
region. The white lines represent the lower boundaries of the 5-m and 10-m summit areas (Pauli et al., 2015).
All summits in a target region were selected in the direct vicinity of each other and possible climatic
variations could only be attributed to a difference in altitude. Furthermore, the manual suggests to
select two or more target regions in more extensive mountain systems in order to avert a distribution
of summits across a major climatic shed. For example, it should be avoided at all time that summits
which are situated on the prominent windward side of a mountain chain, are located in the same target
region as summits which are situated at the leeward side. Also, summits which can be found in the
humid outer part of a mountain system cannot belong to the same target region as summits which are
located in the drier inner part. The individual GLORIA summits within a distinctive target region have
to fulfill a broad range of geological, geomorphological and land-use requirements as well. All those
criteria are listed in the GLORIA manual and include for example that the summits should not be
affected by anthropogenic or agricultural land-use practices such as trampling, grazing and fertilizing.
Finally, a ‘moderate’ geomorphological shape of the summit is also required (Pauli et al., 2004).
For each summit in the target region of Dovrefjell, a standard procedure was followed in order to set
up the equipment and establish the monitoring site. The different steps of this procedure are
summarized in Appendix B and C. After putting the equipment into place, a fine-scaled vegetation
analysis was performed within each of the four 3 x 3 m² quadrat clusters. Each of those grids consists
of nine different 1 m² quadrats which are indicated with a unique code (figure 20). However, only
within the four corner quadrats (code: 11, 31, 13 and 33) a detailed vegetation analysis is performed
due to the fact that the other squares might be damaged by trampling during the recording procedure.
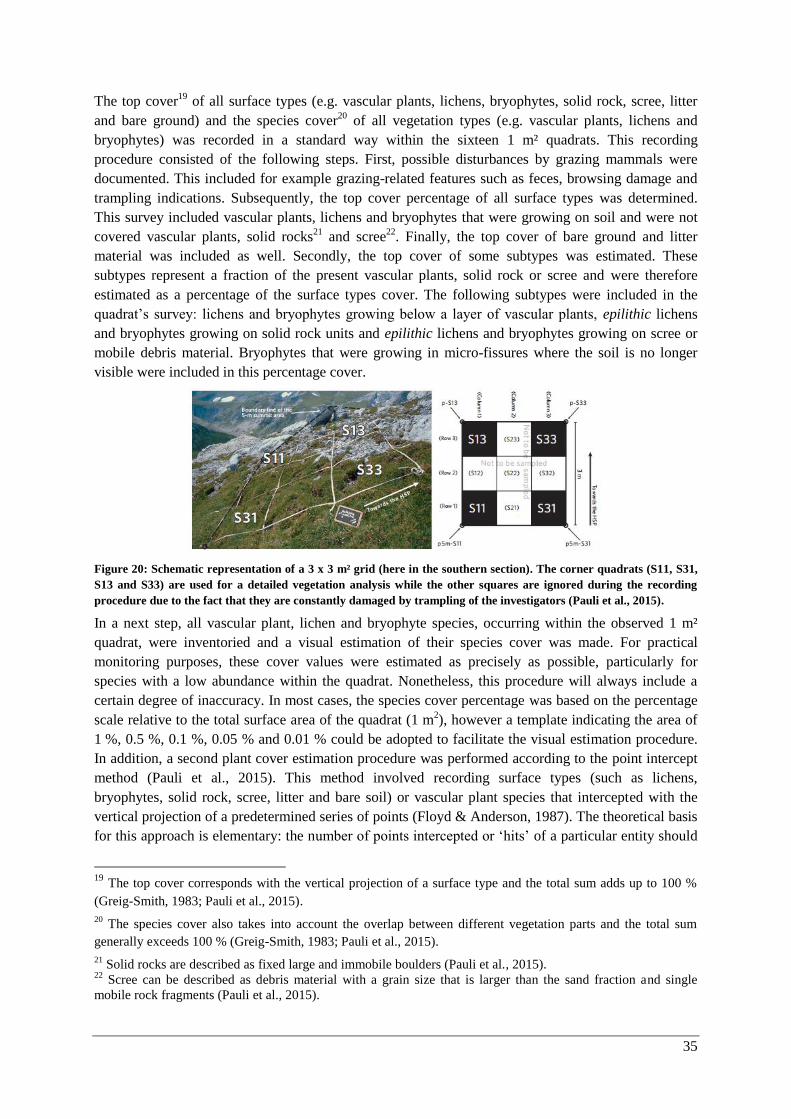
35
The top cover19
of all surface types (e.g. vascular plants, lichens, bryophytes, solid rock, scree, litter
and bare ground) and the species cover20
of all vegetation types (e.g. vascular plants, lichens and
bryophytes) was recorded in a standard way within the sixteen 1 m² quadrats. This recording
procedure consisted of the following steps. First, possible disturbances by grazing mammals were
documented. This included for example grazing-related features such as feces, browsing damage and
trampling indications. Subsequently, the top cover percentage of all surface types was determined.
This survey included vascular plants, lichens and bryophytes that were growing on soil and were not
covered vascular plants, solid rocks21
and scree22
. Finally, the top cover of bare ground and litter
material was included as well. Secondly, the top cover of some subtypes was estimated. These
subtypes represent a fraction of the present vascular plants, solid rock or scree and were therefore
estimated as a percentage of the surface types cover. The following subtypes were included in the
quadrat’s survey: lichens and bryophytes growing below a layer of vascular plants, epilithic lichens
and bryophytes growing on solid rock units and epilithic lichens and bryophytes growing on scree or
mobile debris material. Bryophytes that were growing in micro-fissures where the soil is no longer
visible were included in this percentage cover.
Figure 20: Schematic representation of a 3 x 3 m² grid (here in the southern section). The corner quadrats (S11, S31,
S13 and S33) are used for a detailed vegetation analysis while the other squares are ignored during the recording
procedure due to the fact that they are constantly damaged by trampling of the investigators (Pauli et al., 2015).
In a next step, all vascular plant, lichen and bryophyte species, occurring within the observed 1 m²
quadrat, were inventoried and a visual estimation of their species cover was made. For practical
monitoring purposes, these cover values were estimated as precisely as possible, particularly for
species with a low abundance within the quadrat. Nonetheless, this procedure will always include a
certain degree of inaccuracy. In most cases, the species cover percentage was based on the percentage
scale relative to the total surface area of the quadrat (1 m2), however a template indicating the area of
1 %, 0.5 %, 0.1 %, 0.05 % and 0.01 % could be adopted to facilitate the visual estimation procedure.
In addition, a second plant cover estimation procedure was performed according to the point intercept
method (Pauli et al., 2015). This method involved recording surface types (such as lichens,
bryophytes, solid rock, scree, litter and bare soil) or vascular plant species that intercepted with the
vertical projection of a predetermined series of points (Floyd & Anderson, 1987). The theoretical basis
for this approach is elementary: the number of points intercepted or ‘hits’ of a particular entity should
19
The top cover corresponds with the vertical projection of a surface type and the total sum adds up to 100 %
(Greig-Smith, 1983; Pauli et al., 2015).
20 The species cover also takes into account the overlap between different vegetation parts and the total sum
generally exceeds 100 % (Greig-Smith, 1983; Pauli et al., 2015).
21 Solid rocks are described as fixed large and immobile boulders (Pauli et al., 2015).
22 Scree can be described as debris material with a grain size that is larger than the sand fraction and single
mobile rock fragments (Pauli et al., 2015).
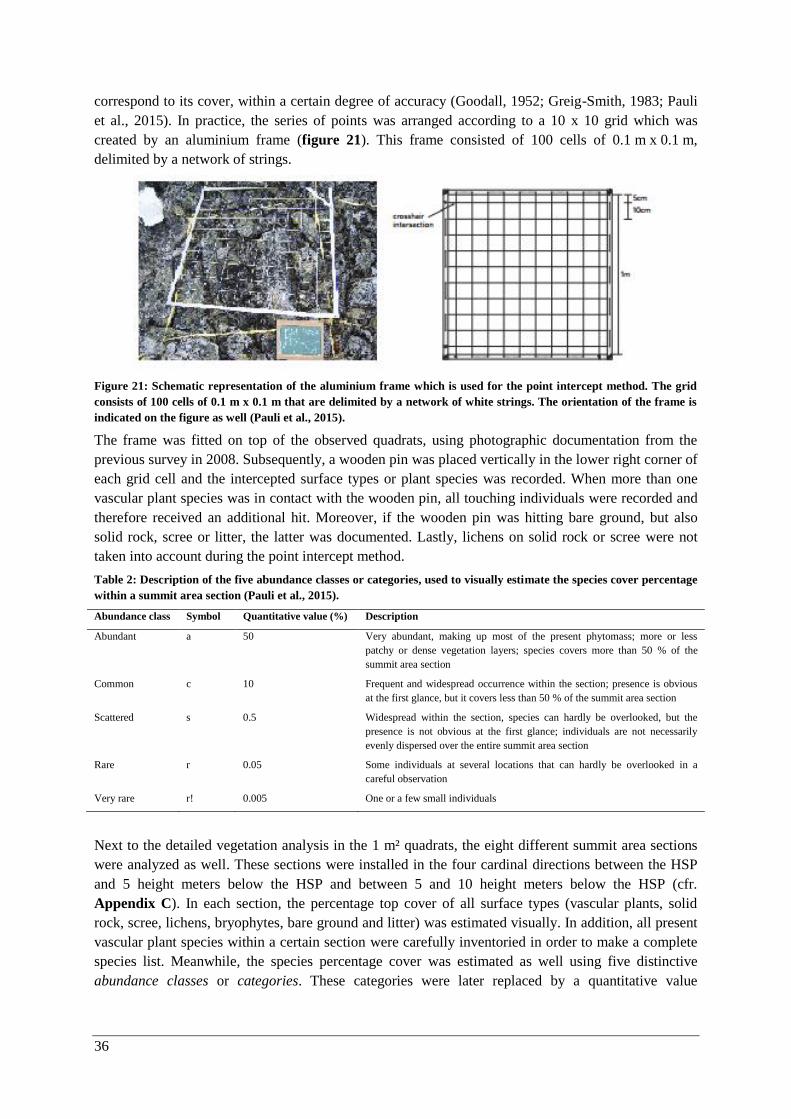
36
correspond to its cover, within a certain degree of accuracy (Goodall, 1952; Greig-Smith, 1983; Pauli
et al., 2015). In practice, the series of points was arranged according to a 10 x 10 grid which was
created by an aluminium frame (figure 21). This frame consisted of 100 cells of 0.1 m x 0.1 m,
delimited by a network of strings.
Figure 21: Schematic representation of the aluminium frame which is used for the point intercept method. The grid
consists of 100 cells of 0.1 m x 0.1 m that are delimited by a network of white strings. The orientation of the frame is
indicated on the figure as well (Pauli et al., 2015).
The frame was fitted on top of the observed quadrats, using photographic documentation from the
previous survey in 2008. Subsequently, a wooden pin was placed vertically in the lower right corner of
each grid cell and the intercepted surface types or plant species was recorded. When more than one
vascular plant species was in contact with the wooden pin, all touching individuals were recorded and
therefore received an additional hit. Moreover, if the wooden pin was hitting bare ground, but also
solid rock, scree or litter, the latter was documented. Lastly, lichens on solid rock or scree were not
taken into account during the point intercept method.
Table 2: Description of the five abundance classes or categories, used to visually estimate the species cover percentage
within a summit area section (Pauli et al., 2015).
Abundance class Symbol Quantitative value (%) Description
Abundant a 50 Very abundant, making up most of the present phytomass; more or less
patchy or dense vegetation layers; species covers more than 50 % of the
summit area section
Common c 10 Frequent and widespread occurrence within the section; presence is obvious
at the first glance, but it covers less than 50 % of the summit area section
Scattered s 0.5 Widespread within the section, species can hardly be overlooked, but the
presence is not obvious at the first glance; individuals are not necessarily
evenly dispersed over the entire summit area section
Rare r 0.05 Some individuals at several locations that can hardly be overlooked in a
careful observation
Very rare r! 0.005 One or a few small individuals
Next to the detailed vegetation analysis in the 1 m² quadrats, the eight different summit area sections
were analyzed as well. These sections were installed in the four cardinal directions between the HSP
and 5 height meters below the HSP and between 5 and 10 height meters below the HSP (cfr.
Appendix C). In each section, the percentage top cover of all surface types (vascular plants, solid
rock, scree, lichens, bryophytes, bare ground and litter) was estimated visually. In addition, all present
vascular plant species within a certain section were carefully inventoried in order to make a complete
species list. Meanwhile, the species percentage cover was estimated as well using five distinctive
abundance classes or categories. These categories were later replaced by a quantitative value

37
(table 2). The main purpose of this survey was to detect potential changes in species richness and
species migrations on the investigated mountain top (Pauli et al., 2004).
Climatic data In addition to the vegetation sampling, soil temperature was continuously recorded on the study
summits using a miniature data logger. These measurement devices were buried in the substrate at a
depth of approximately 10 cm below the soil surface. The mountaintop summits at Dovrefjell were
equipped with the GEO-Precision M-Log5W logger. Each summit contained four of these temperature
loggers, one in every 3 x 3 m² quadrat cluster of each cardinal direction (N, E, S and W). Normally,
the loggers were buried in the middle quadrat, specified with the code 22 (see figure 20). However,
when the substrate in the middle quadrat was unsuitable (e.g. due to the presence of massive solid rock
fragments), the temperature logger was installed in a neighboring square. The temperature data could
be easily read out on a laptop after installing the proper software (GP5W-Shell) and plugging in a
wireless USB dongle with build-in antenna. Using this antenna, a certain nearby logger could be
traced and subsequently identified by the software. After a correct identification, some dynamic logger
parameters, such as the ‘deviation to PC’s clock’, were displayed. If the time deviation of the selected
logger were too large (i.e. within the range of a few minutes), the time settings were corrected using
the ‘Synchronize Clock’-button which was available on the software interface.
Statistical analyses All statistical analyses were performed in R version 3.2.2 (R Core Team, 2015). For the temperature
data from the loggers in each of the quadrat clusters, annual and seasonal (summer vs. winter) average
values were calculated. In this case, the summer months corresponded with June, July and August,
whereas the winter months corresponded with the December, January and February. In addition, a
locally-weighed polynomial regression (lowess) was determined, representing a long-term trend.
Furthermore, a linear mixed effect model was fit to the temperature data, specifying the summit or
aspect (nested within summit) as a fixed effect and the temperature logger’s code as a random effect to
account for the hierarchical nature of the data and repeated measurements. Secondly, the factor year
was added to this model and a χ2-test was performed to check whether the temperature change was
significant over time. In order to detect any significant differences, the change of the soil temperature
throughout the period 2001-2015 (for every summit and for each aspect) was compared in a paired-
wise way using a Tukey Multiple Comparison test. This procedure was repeated for the annual mean
summer and winter temperatures.
The second part of the statistical analysis focussed on the vegetation data of 2015. Based on the cover
data of vascular plants, lichens and bryophytes, the corresponding species richness (𝑆), Shannon
diversity index (𝐻) and species evenness (𝐽) were calculated and the effect of altitude and aspect on
these three parameters was examined using an ANOVA test. Therefore, both variables, summit and
aspect (nested within the variable summit), were included in the linear model. Main effect were tested
using a significance level of 5 %, while for interaction effects a significance level of 1 % was used.
The Shannon index was calculated using equation 1:
𝐻 = − ∑ 𝑝𝑖 ln 𝑝𝑖
𝑆
𝑖
(1)

38
Where 𝑝𝑖 is the proportion (n/N) of all individuals (n) of a particular species 𝑖 divided by the total
number of indivuals (N) and 𝑆 is the total number of species. The species evenness was determined
using equation 2:
𝐽 =𝐻
ln 𝑆 (2)
Where 𝐻 corresponds with the Shannon diversity index and 𝑆 with total number of species in the
community.
To test how the vegetation changed over time between 2001 and 2015, an ANOVA test was performed
with summit, aspect (nested within summit), year and their interaction as fixed effects and the number
of species, Shannon diversity index and species evenness for vascular plants, lichens and bryophytes
as response variables. Next, dissimilarity indices were calculated for vascular plants, lichens and
bryophytes and evaluated for the periods 2001-2008, 2008-2015 and 2001-2015 in order to quantify
the corresponding β diversity. Whittaker (1960) defined β diversity as the variation of species between
different sites along a spatial or temporal gradient. Moreover, this parameter is directly linked to the
biodiversity at a local scale (α diversity) as well as at a wider regional scale (γ diversity). Vellend
(2001) distinguished two main types of β diversity, namely turnover and variation (figure 22). First,
turnover provides a measure of the change in community structure (i.e. identity, relative abundance,
biomass and/or cover) between two sampling units along a distinctive spatial, temporal or
environmental gradient. This measure gives an idea of the number of new species that are encountered
along a previously defined gradient, the number of initial species that were lost and the proportion of
unshared species when moving from one sampling unit to another along that gradient. Secondly,
variation refers to the variation of species identity among sampling units within a certain spatial or
temporal extent and provides an answer to questions as: “By how much does the total number of
species in a geographical region exceed the average number of species in the sampling units?” and
“Do we repeatedly encounter the same species in different sampling units?” (Anderson et al., 2006).
Figure 22: Schematic representation of the two main types of β diversity, namely the turnover in community structure
along a previously defined gradient (a) and the variation in community structure between different sampling units (b)
(Anderson et al., 2010).
A wide range of indices for β diversity have been proposed for ecological analysis (e.g. Vellend, 2001;
Koleff et al., 2003; Jost, 2007). The Euclidean distance function depends to a large extent on the
abundance of species in two sites and not just the species that are shared. However, in this case, more
emphasis needed to be given to the extent to which certain species are shared and the alterations in
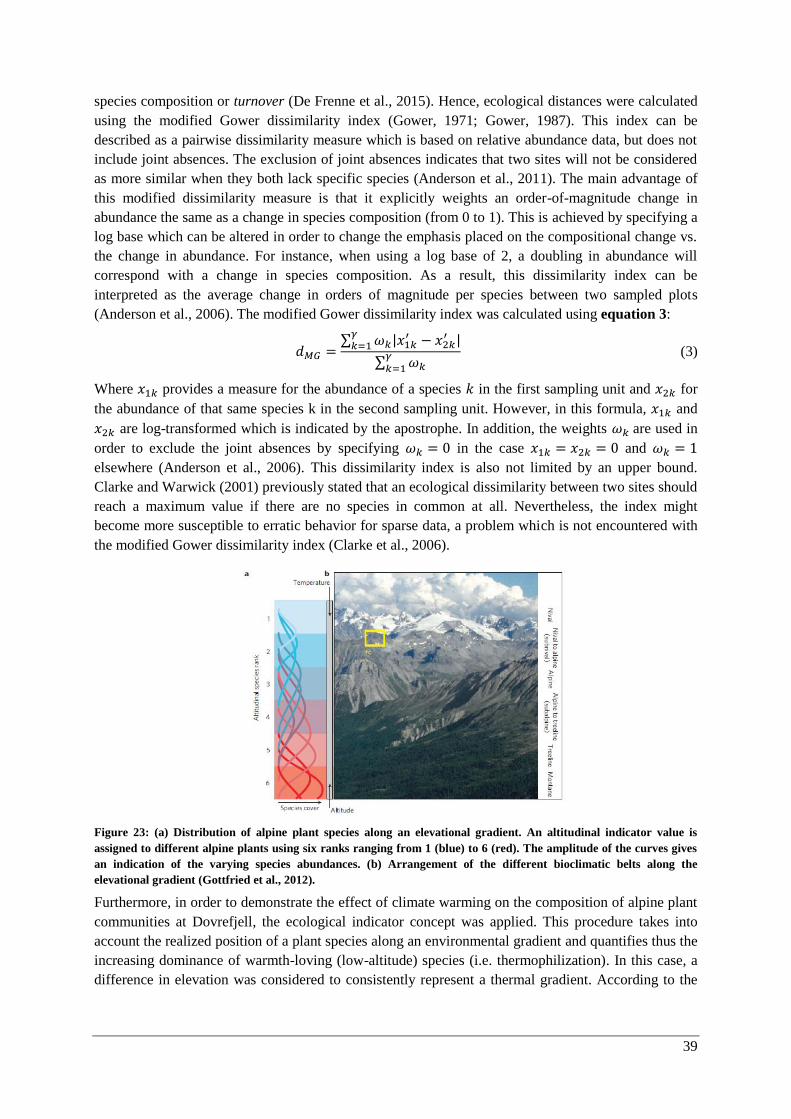
39
species composition or turnover (De Frenne et al., 2015). Hence, ecological distances were calculated
using the modified Gower dissimilarity index (Gower, 1971; Gower, 1987). This index can be
described as a pairwise dissimilarity measure which is based on relative abundance data, but does not
include joint absences. The exclusion of joint absences indicates that two sites will not be considered
as more similar when they both lack specific species (Anderson et al., 2011). The main advantage of
this modified dissimilarity measure is that it explicitly weights an order-of-magnitude change in
abundance the same as a change in species composition (from 0 to 1). This is achieved by specifying a
log base which can be altered in order to change the emphasis placed on the compositional change vs.
the change in abundance. For instance, when using a log base of 2, a doubling in abundance will
correspond with a change in species composition. As a result, this dissimilarity index can be
interpreted as the average change in orders of magnitude per species between two sampled plots
(Anderson et al., 2006). The modified Gower dissimilarity index was calculated using equation 3:
𝑑𝑀𝐺 =∑ 𝜔𝑘|𝑥1𝑘
′ − 𝑥2𝑘′ |𝛾
𝑘=1
∑ 𝜔𝑘𝛾𝑘=1
(3)
Where 𝑥1𝑘 provides a measure for the abundance of a species 𝑘 in the first sampling unit and 𝑥2𝑘 for
the abundance of that same species k in the second sampling unit. However, in this formula, 𝑥1𝑘 and
𝑥2𝑘 are log-transformed which is indicated by the apostrophe. In addition, the weights 𝜔𝑘 are used in
order to exclude the joint absences by specifying 𝜔𝑘 = 0 in the case 𝑥1𝑘 = 𝑥2𝑘 = 0 and 𝜔𝑘 = 1
elsewhere (Anderson et al., 2006). This dissimilarity index is also not limited by an upper bound.
Clarke and Warwick (2001) previously stated that an ecological dissimilarity between two sites should
reach a maximum value if there are no species in common at all. Nevertheless, the index might
become more susceptible to erratic behavior for sparse data, a problem which is not encountered with
the modified Gower dissimilarity index (Clarke et al., 2006).
Figure 23: (a) Distribution of alpine plant species along an elevational gradient. An altitudinal indicator value is
assigned to different alpine plants using six ranks ranging from 1 (blue) to 6 (red). The amplitude of the curves gives
an indication of the varying species abundances. (b) Arrangement of the different bioclimatic belts along the
elevational gradient (Gottfried et al., 2012).
Furthermore, in order to demonstrate the effect of climate warming on the composition of alpine plant
communities at Dovrefjell, the ecological indicator concept was applied. This procedure takes into
account the realized position of a plant species along an environmental gradient and quantifies thus the
increasing dominance of warmth-loving (low-altitude) species (i.e. thermophilization). In this case, a
difference in elevation was considered to consistently represent a thermal gradient. According to the
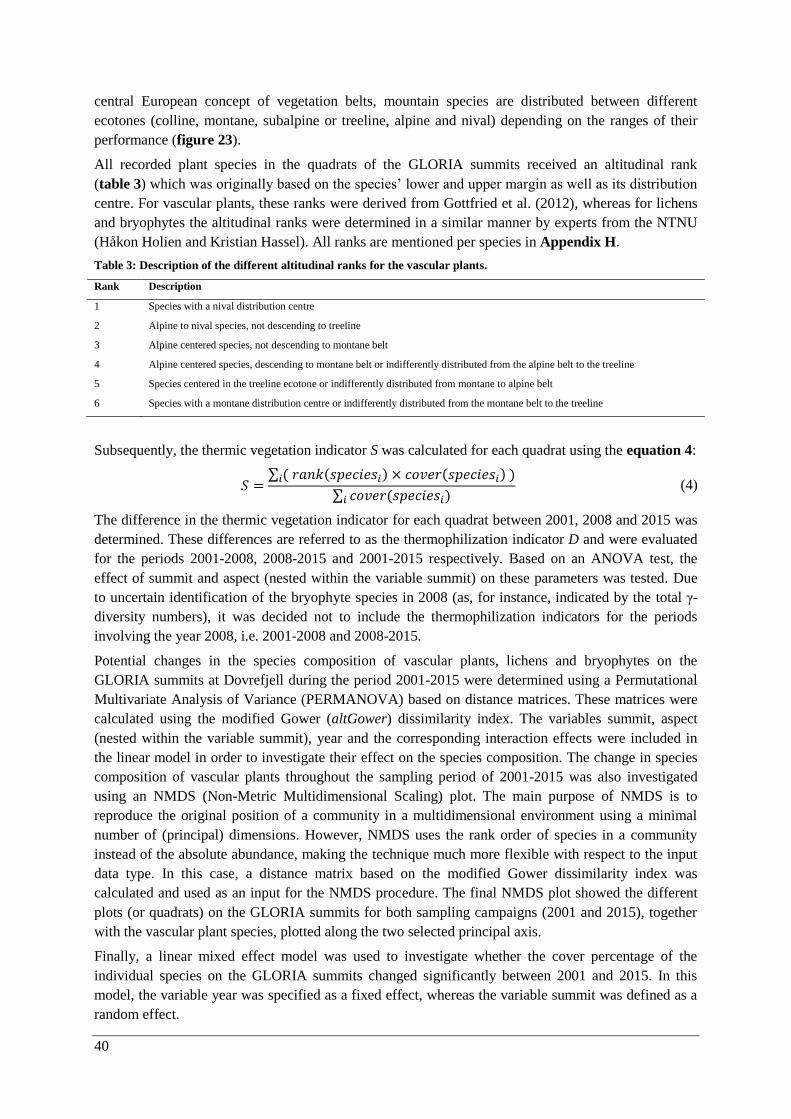
40
central European concept of vegetation belts, mountain species are distributed between different
ecotones (colline, montane, subalpine or treeline, alpine and nival) depending on the ranges of their
performance (figure 23).
All recorded plant species in the quadrats of the GLORIA summits received an altitudinal rank
(table 3) which was originally based on the species’ lower and upper margin as well as its distribution
centre. For vascular plants, these ranks were derived from Gottfried et al. (2012), whereas for lichens
and bryophytes the altitudinal ranks were determined in a similar manner by experts from the NTNU
(Håkon Holien and Kristian Hassel). All ranks are mentioned per species in Appendix H.
Table 3: Description of the different altitudinal ranks for the vascular plants.
Rank Description
1 Species with a nival distribution centre
2 Alpine to nival species, not descending to treeline
3 Alpine centered species, not descending to montane belt
4 Alpine centered species, descending to montane belt or indifferently distributed from the alpine belt to the treeline
5 Species centered in the treeline ecotone or indifferently distributed from montane to alpine belt
6 Species with a montane distribution centre or indifferently distributed from the montane belt to the treeline
Subsequently, the thermic vegetation indicator S was calculated for each quadrat using the equation 4:
𝑆 =∑ ( 𝑟𝑎𝑛𝑘(𝑠𝑝𝑒𝑐𝑖𝑒𝑠𝑖) × 𝑐𝑜𝑣𝑒𝑟(𝑠𝑝𝑒𝑐𝑖𝑒𝑠𝑖) )𝑖
∑ 𝑐𝑜𝑣𝑒𝑟(𝑠𝑝𝑒𝑐𝑖𝑒𝑠𝑖)𝑖 (4)
The difference in the thermic vegetation indicator for each quadrat between 2001, 2008 and 2015 was
determined. These differences are referred to as the thermophilization indicator D and were evaluated
for the periods 2001-2008, 2008-2015 and 2001-2015 respectively. Based on an ANOVA test, the
effect of summit and aspect (nested within the variable summit) on these parameters was tested. Due
to uncertain identification of the bryophyte species in 2008 (as, for instance, indicated by the total γ-
diversity numbers), it was decided not to include the thermophilization indicators for the periods
involving the year 2008, i.e. 2001-2008 and 2008-2015.
Potential changes in the species composition of vascular plants, lichens and bryophytes on the
GLORIA summits at Dovrefjell during the period 2001-2015 were determined using a Permutational
Multivariate Analysis of Variance (PERMANOVA) based on distance matrices. These matrices were
calculated using the modified Gower (altGower) dissimilarity index. The variables summit, aspect
(nested within the variable summit), year and the corresponding interaction effects were included in
the linear model in order to investigate their effect on the species composition. The change in species
composition of vascular plants throughout the sampling period of 2001-2015 was also investigated
using an NMDS (Non-Metric Multidimensional Scaling) plot. The main purpose of NMDS is to
reproduce the original position of a community in a multidimensional environment using a minimal
number of (principal) dimensions. However, NMDS uses the rank order of species in a community
instead of the absolute abundance, making the technique much more flexible with respect to the input
data type. In this case, a distance matrix based on the modified Gower dissimilarity index was
calculated and used as an input for the NMDS procedure. The final NMDS plot showed the different
plots (or quadrats) on the GLORIA summits for both sampling campaigns (2001 and 2015), together
with the vascular plant species, plotted along the two selected principal axis.
Finally, a linear mixed effect model was used to investigate whether the cover percentage of the
individual species on the GLORIA summits changed significantly between 2001 and 2015. In this
model, the variable year was specified as a fixed effect, whereas the variable summit was defined as a
random effect.
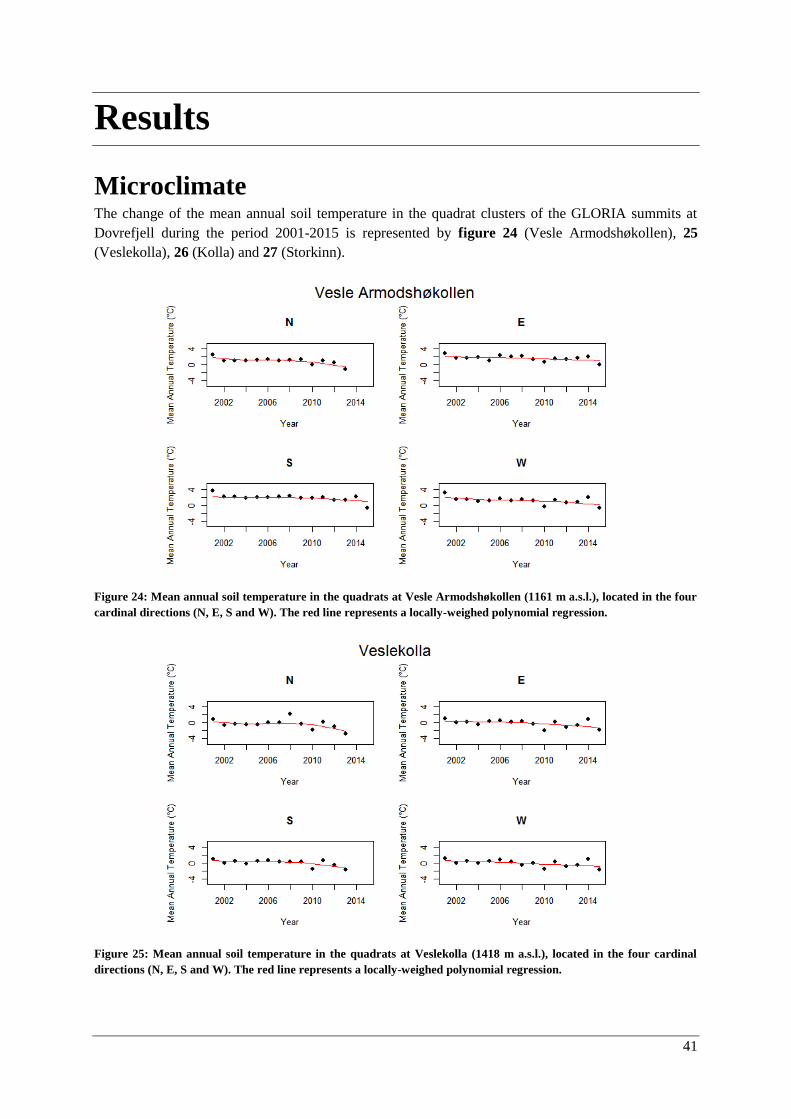
41
Results
Microclimate The change of the mean annual soil temperature in the quadrat clusters of the GLORIA summits at
Dovrefjell during the period 2001-2015 is represented by figure 24 (Vesle Armodshøkollen), 25
(Veslekolla), 26 (Kolla) and 27 (Storkinn).
Figure 24: Mean annual soil temperature in the quadrats at Vesle Armodshøkollen (1161 m a.s.l.), located in the four
cardinal directions (N, E, S and W). The red line represents a locally-weighed polynomial regression.
Figure 25: Mean annual soil temperature in the quadrats at Veslekolla (1418 m a.s.l.), located in the four cardinal
directions (N, E, S and W). The red line represents a locally-weighed polynomial regression.
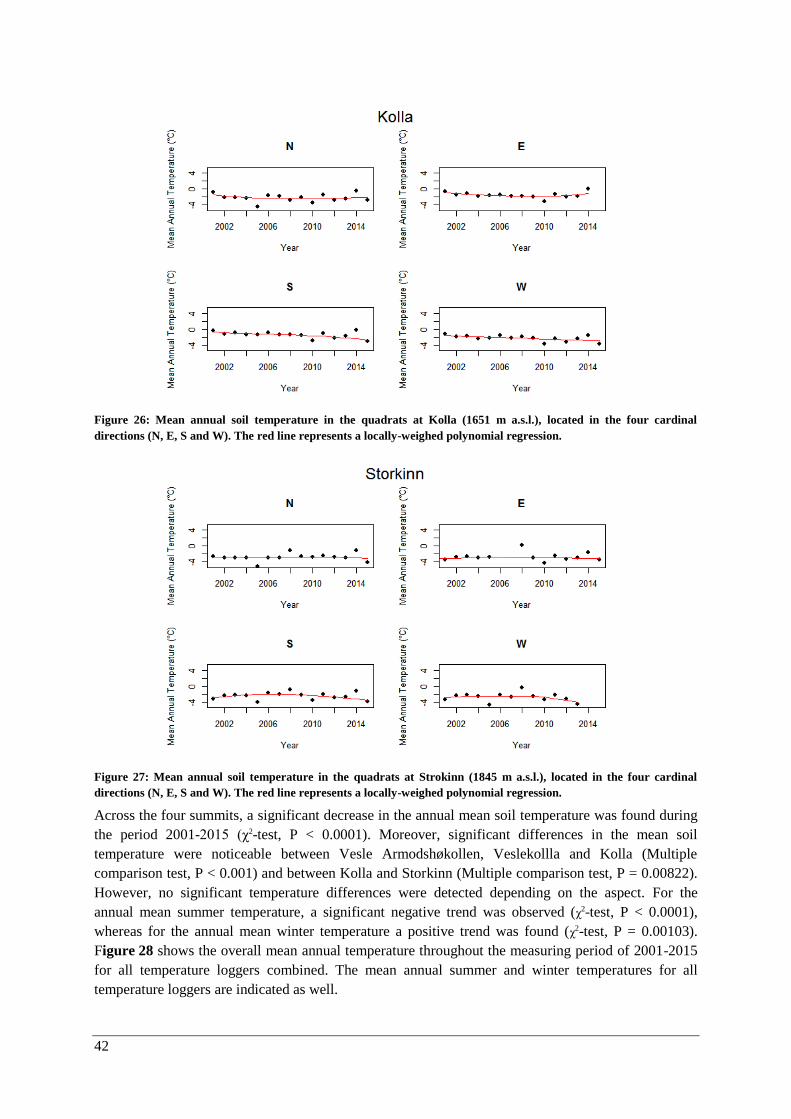
42
Figure 26: Mean annual soil temperature in the quadrats at Kolla (1651 m a.s.l.), located in the four cardinal
directions (N, E, S and W). The red line represents a locally-weighed polynomial regression.
Figure 27: Mean annual soil temperature in the quadrats at Strokinn (1845 m a.s.l.), located in the four cardinal
directions (N, E, S and W). The red line represents a locally-weighed polynomial regression.
Across the four summits, a significant decrease in the annual mean soil temperature was found during
the period 2001-2015 (χ2-test, P < 0.0001). Moreover, significant differences in the mean soil
temperature were noticeable between Vesle Armodshøkollen, Veslekollla and Kolla (Multiple
comparison test, P < 0.001) and between Kolla and Storkinn (Multiple comparison test, P = 0.00822).
However, no significant temperature differences were detected depending on the aspect. For the
annual mean summer temperature, a significant negative trend was observed (χ2-test, P < 0.0001),
whereas for the annual mean winter temperature a positive trend was found (χ2-test, P = 0.00103).
Figure 28 shows the overall mean annual temperature throughout the measuring period of 2001-2015
for all temperature loggers combined. The mean annual summer and winter temperatures for all
temperature loggers are indicated as well.
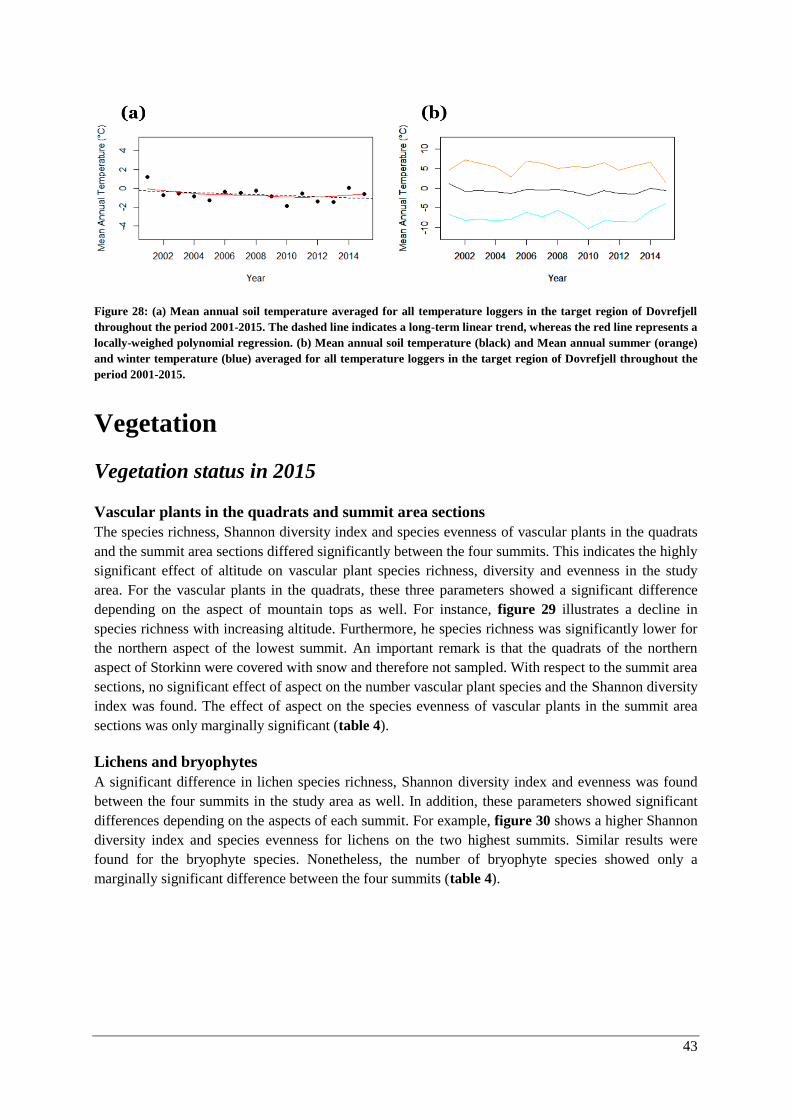
43
Figure 28: (a) Mean annual soil temperature averaged for all temperature loggers in the target region of Dovrefjell
throughout the period 2001-2015. The dashed line indicates a long-term linear trend, whereas the red line represents a
locally-weighed polynomial regression. (b) Mean annual soil temperature (black) and Mean annual summer (orange)
and winter temperature (blue) averaged for all temperature loggers in the target region of Dovrefjell throughout the
period 2001-2015.
Vegetation
Vegetation status in 2015
Vascular plants in the quadrats and summit area sections
The species richness, Shannon diversity index and species evenness of vascular plants in the quadrats
and the summit area sections differed significantly between the four summits. This indicates the highly
significant effect of altitude on vascular plant species richness, diversity and evenness in the study
area. For the vascular plants in the quadrats, these three parameters showed a significant difference
depending on the aspect of mountain tops as well. For instance, figure 29 illustrates a decline in
species richness with increasing altitude. Furthermore, he species richness was significantly lower for
the northern aspect of the lowest summit. An important remark is that the quadrats of the northern
aspect of Storkinn were covered with snow and therefore not sampled. With respect to the summit area
sections, no significant effect of aspect on the number vascular plant species and the Shannon diversity
index was found. The effect of aspect on the species evenness of vascular plants in the summit area
sections was only marginally significant (table 4).
Lichens and bryophytes
A significant difference in lichen species richness, Shannon diversity index and evenness was found
between the four summits in the study area as well. In addition, these parameters showed significant
differences depending on the aspects of each summit. For example, figure 30 shows a higher Shannon
diversity index and species evenness for lichens on the two highest summits. Similar results were
found for the bryophyte species. Nonetheless, the number of bryophyte species showed only a
marginally significant difference between the four summits (table 4).
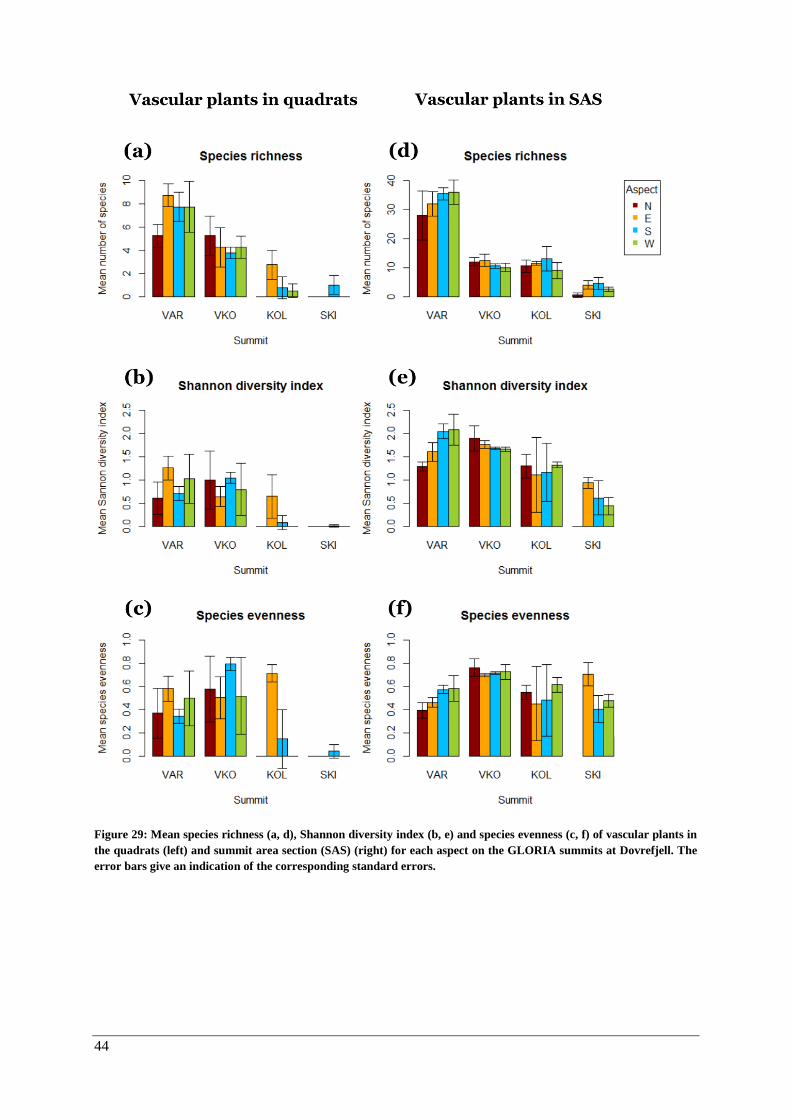
44
Figure 29: Mean species richness (a, d), Shannon diversity index (b, e) and species evenness (c, f) of vascular plants in
the quadrats (left) and summit area section (SAS) (right) for each aspect on the GLORIA summits at Dovrefjell. The
error bars give an indication of the corresponding standard errors.
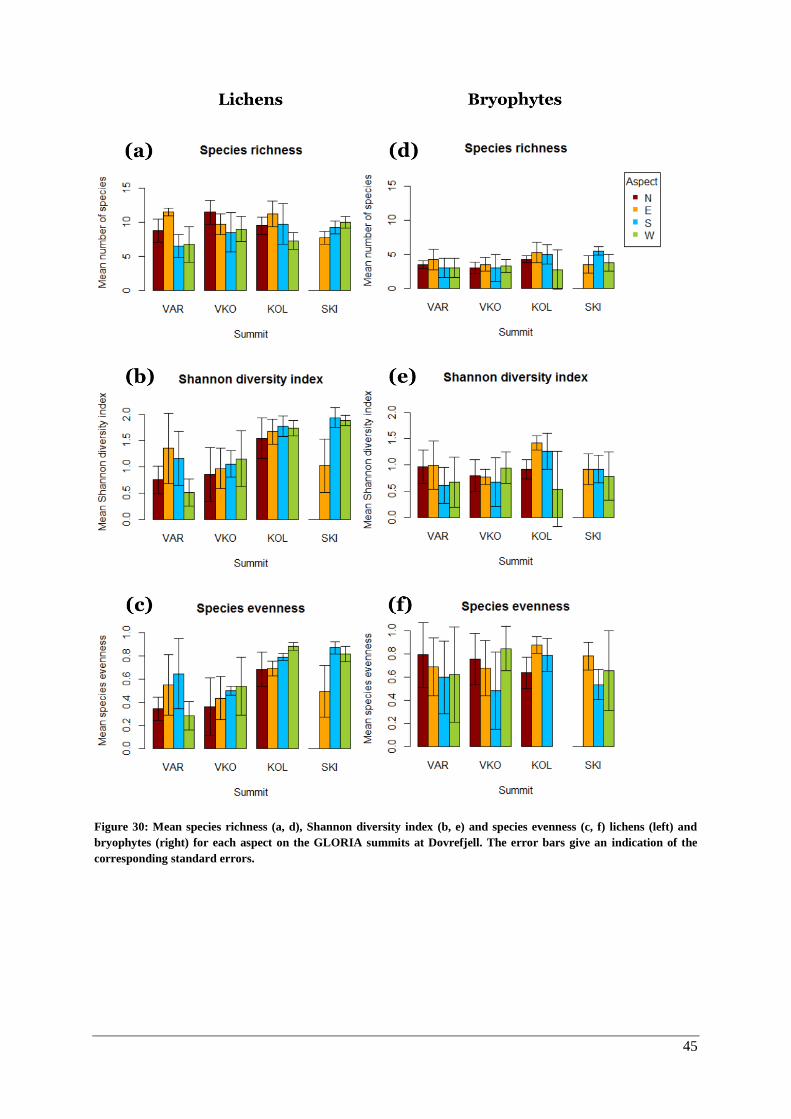
45
Figure 30: Mean species richness (a, d), Shannon diversity index (b, e) and species evenness (c, f) lichens (left) and
bryophytes (right) for each aspect on the GLORIA summits at Dovrefjell. The error bars give an indication of the
corresponding standard errors.

46
Table 4: ANOVA results for the effect of the variables summit and aspect (nested within summit) on the species
richness, Shannon diversity index and species evenness of vascular plants, lichens and bryophytes on the GLORIA
summits at Dovrefjell. . With respect to the significance codes, the following symbols were used: (***) for P < 0.001,
(**) for P < 0.01, (*) for P < 0.05 and (.) for P < 0.1.
Effect Df SSR MSR F-value P-value
Vascular plant species in the quadrats
Species richness
Effect of summit 3 518 173 147 < 2e-16 ***
Effect of aspect, nested within summit 12 52 4.33 3.68 <0.001 ***
Residuals 48 56.5 1.18
Shannon diversity index
Effect of summit 3 10.3 3.43 36.7 1.8e-12 ***
Effect of aspect, nested within summit 12 2.69 0.222 2.38 0.017 *
Residuals 48 4.49 0.094
Species evenness
Effect of summit 3 3 1 35.7 1.24e-11 ***
Effect of aspect, nested within summit 12 1.41 0.117 4.19 < 0.001 ***
Residuals 42 1.18 0.028
Vascular plant species in the summit area sections
Species richness
Effect of summit 3 3965 13212 132.2 1.68e-11 ***
Effect of aspect, nested within summit 12 127 10.6 1.06 0.447
Residuals 16 160 10
Shannon diversity index
Effect of summit 3 8.51 2.84 28.8 1.1e-06 ***
Effect of aspect, nested within summit 12 1.92 0.16 1.63 0.180
Residuals 16 1.58 0.099
Species evenness
Effect of summit 3 0.336 0.112 6.38 0.005 **
Effect of aspect, nested within summit 12 0.426 0.036 2.027 0.099 .
Residuals 15 0.263 0.018
Lichen species
Species richness
Effect of summit 3 85.6 28.5 9.45 5.14e-05 ***
Effect of aspect, nested within summit 12 371.1 30.9 10.2 1.44e-09 ***
Residuals 48 145 3.021
Shannon diversity index
Effect of summit 3 5.36 1.786 13.1 2.17e-06 ***
Effect of aspect, nested within summit 12 11.9 0.996 7.33 2.12e-07 ***
Residuals 48 6.5 0.136
Species evenness
Effect of summit 3 1 0.334 12.4 3.97e-06 ***
Effect of aspect, nested within summit 12 2.45 0.204 7.60 1.29e-07 ***
Residuals 48 1.29 0.027
Bryophyte species
Species richness
Effect of summit 3 13.7 4.56 2.48 0.073 .
Effect of aspect, nested within summit 12 83.8 6.98 3.79 < 0.001 ***
Residuals 48 88.5 1.84
Shannon diversity index
Effect of summit 3 1.17 0.391 2.95 0.042 *
Effect of aspect, nested within summit 12 4.79 0.399 3 0.003 **
Residuals 48 6.37 0.133
Species evenness
Effect of summit 3 0.667 0.222 3.96 0.014 *
Effect of aspect, nested within summit 12 1.93 0.161 2.87 0.005 **
Residuals 46 2.58 0.056

47
Changes over time
γ-diversity
The total number of vascular plant species in the study area (γ-diversity) increased during the period
2001-2015. For the lichens, a decrease in the total number of species was found, whereas for the
bryophytes, a steady-state situation was observed between 2001 and 2015. However, a significantly
lower total amount of bryophyte species was noticed for 2008 (table 5).
Table 5: Total number of vascular plant species for each of the GLORIA summits at Dovrefjell. The last column
shows the total number of species in the entire study area for each year. In addition, the last row for each taxonomic
group indicates the total number of unique species for each summit that were recorded during the period 2001-2015.
VAR VKO KOL SKI Total (γ)
Vascular plants
2001 56 14 21 6 67
2008 58 18 22 6 68
2015 61 16 20 8 73
Total species 75 20 26 8 85
Lichens
2001 20 22 28 15 39
2008 18 19 19 16 28
2015 20 22 20 15 33
Total species 24 27 36 24 49
Bryophytes
2001 13 9 9 9 20
2008 6 6 8 8 13
2015 13 8 13 10 21
Total species 19 12 17 16 28
α-diversity: vascular plants in quadrats and the summit area sections
For the vascular plants in the quadrats, no interaction effect between summit and year on the number
of species was found. This indicates that there was no significant change in species richness on the
summits separately throughout the sampling period. Furthermore, no significant change over time in
the number of species was found. However, considering the entire data set, the species richness of
vascular plants differed significantly between the summits and the aspects of each summit. In other
words, altitude as well as aspect have a significant effect on the species richness. For instance,
figure 31 shows that the mean number of species decreased with altitude, ranging from about 7.86 ±
2.24 (S.E.) species per 1 m² quadrat on the lowest summit to only 1.11 ± 0.19 species per 1 m² quadrat
on the highest summit.
The change in Shannon diversity index over time was only marginally significant. However, the effect
of altitude and aspect on this parameter appeared to be highly significant. In this case, the Shannon
diversity index decreased with altitude and ranged between approximately 0.85 ± 0.43 per 1 m²
quadrat on the lowest summit and 0.07 ± 0.01 per 1 m² quadrat on the highest summit. Finally, the
species evenness of vascular plants showed a significant increase in the quadrats during the period
2001-2015. Also, a significant effect of altitude and aspect on the species evenness was found
(table 6).

48
Figure 31: Mean species richness (a, d), Shannon diversity index (b, e) and species evenness (c, f) of vascular plants in
the quadrats of the GLORIA summits (left) and the aspects of each summit (right) at Dovrefjell in 2001, 2008 and
2015. The error bars give an indication of the corresponding standard error.
With respect to the vascular plants in the summit area sections, a marginally significant interaction
effect between summit and year on the number of species was found. Furthermore, vascular plant
species richness in the sections showed a marginally significant increase over time. However, it could
be concluded that the number of vascular plant species in these sections differed significantly between
the four summits, again indicating a significant effect of altitude on species richness. Figure 32 shows
that the mean number of species ranged between 28.38 ± 7.95 species per section in 2001 and 32.88 ±
5.28 species per section in 2015 on the lowest summit and was therefore much higher compared to the
other three summits. For instance, on the highest summit, the number of vascular plant species only
ranged between 3.66 ± 1.21 species per section in 2001 and 3.28 ± 1.70 species per section in 2015. In
addition, species richness differed between the aspects of the summits as well, with a somewhat higher
average amount of species on southern side (about 15.92 ± 12.64 species per section) compared
northern side (about 14.63 ± 8.94 species per section) of each mountain.
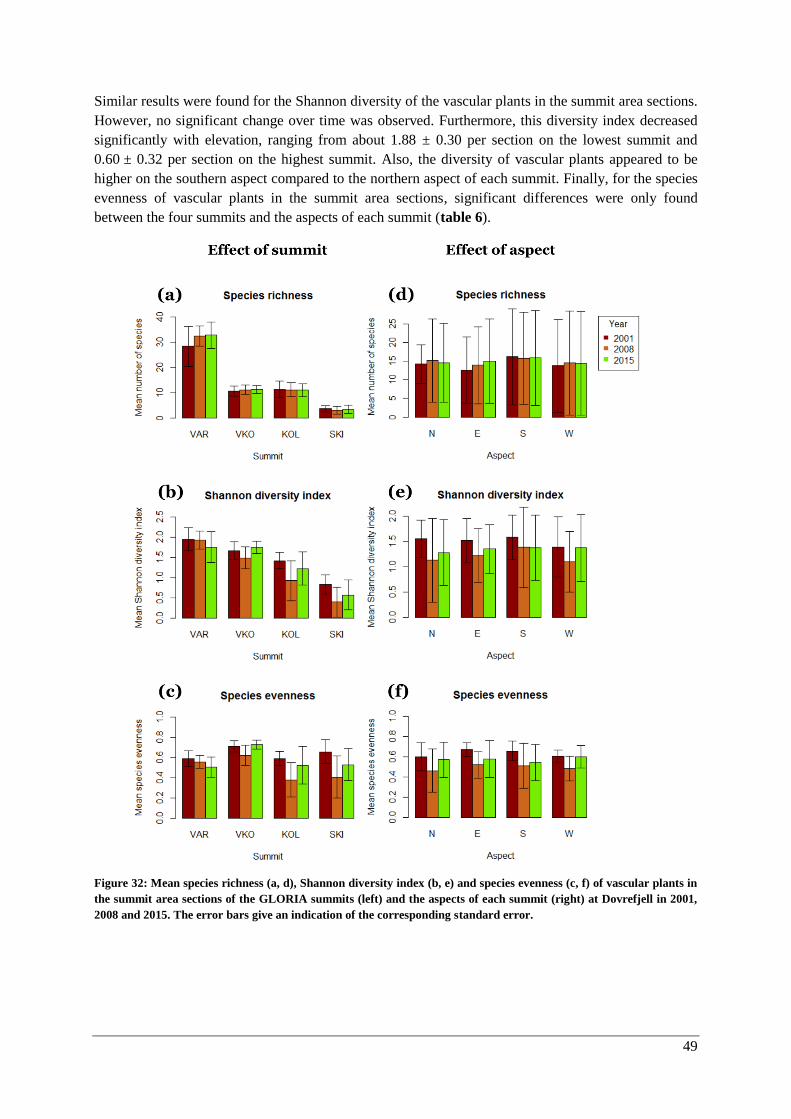
49
Similar results were found for the Shannon diversity of the vascular plants in the summit area sections.
However, no significant change over time was observed. Furthermore, this diversity index decreased
significantly with elevation, ranging from about 1.88 ± 0.30 per section on the lowest summit and
0.60 ± 0.32 per section on the highest summit. Also, the diversity of vascular plants appeared to be
higher on the southern aspect compared to the northern aspect of each summit. Finally, for the species
evenness of vascular plants in the summit area sections, significant differences were only found
between the four summits and the aspects of each summit (table 6).
Figure 32: Mean species richness (a, d), Shannon diversity index (b, e) and species evenness (c, f) of vascular plants in
the summit area sections of the GLORIA summits (left) and the aspects of each summit (right) at Dovrefjell in 2001,
2008 and 2015. The error bars give an indication of the corresponding standard error.

50
Table 6: ANOVA results for the effect of the variables summit, aspect (nested within summit), year and the
interaction effect between summit and year on the species richness, Shannon diversity index and species evenness of
vascular plants in the quadrats and the summit area sections on the GLORIA summits at Dovrefjell. With respect to
the significance codes, the following symbols were used: (***) for P < 0.001, (**) for P < 0.01, (*) for P < 0.05 and (.)
for P < 0.1.
Effect Df SSR MSR F-value P-value
Vascular plant species in the quadrats
Species richness
Effect of summit 3 790 263 147 < 2e-16 ***
Effect of Year 1 0.1 0.1 0.058 0.810
Effect of aspect, nested within summit 8 153 19.1 10.6 7.47e-11 ***
Interaction effect between summit and year 3 0.3 0.09 0.052 0.984
Interaction effect between summit, aspect and year 8 5.2 0.64 0.359 0.939
Residuals 105 188 1.79
Shannon diversity index
Effect of summit 3 9.36 3.12 24.1 5.81e-12 ***
Effect of Year 1 0.455 0.455 3.52 0.063 .
Effect of aspect, nested within summit 8 6.135 0.767 5.94 2.87e-06 ***
Interaction effect between summit and year 3 0.133 0.044 0.344 0.794
Interaction effect between summit, aspect and year 8 0.176 0.022 0.171 0.994
Residuals 105 13.6 0.129
Species evenness
Effect of summit 3 0.643 0.214 5.20 0.002 **
Effect of Year 1 0.234 0.234 5.69 0.019 *
Effect of aspect, nested within summit 8 1.28 0.160 3.90 < 0.001 ***
Interaction effect between summit and year 2 0.062 0.031 0.758 0.472
Interaction effect between summit, aspect and year 7 0.151 0.022 0.525 0.813
Residuals 87 3.58 0.041
Vascular plant species in the summit area sections
Species richness
Effect of summit 3 9801 3267 380 < 2e-16 ***
Effect of Year 1 21 21 2.43 0.124
Effect of aspect, nested within summit 12 499 42 4.84 1.7e-05 ***
Interaction effect between summit and year 3 59 20 2.30 0.088 .
Interaction effect between summit, aspect and year 12 45 4 0.435 0.943
Residuals 60 516 9
Shannon diversity index
Effect of summit 3 21 7.01 67.7 <2e-16 ***
Effect of Year 1 0.269 0.269 2.60 0.112
Effect of aspect, nested within summit 12 3.07 0.256 2.47 0.011 *
Interaction effect between summit and year 3 0.204 0.068 0.657 0.582
Interaction effect between summit, aspect and year 12 0.379 0.032 0.305 0.986
Residuals 60 6.22 0.104
Species evenness
Effect of summit 3 0.485 0.162 8.89 5.79e-05 ***
Effect of Year 1 0.059 0.059 3.22 0.078 .
Effect of aspect, nested within summit 11 0.321 0.029 1.60 0.121
Interaction effect between summit and year 3 0.040 0.013 0.73 0.540
Interaction effect between summit, aspect and year 11 0.094 0.009 0.47 0.916
Residuals 60 1.091 0.019
α-diversity: lichens and bryophytes
No significant interaction effect between summit and year on the number of lichen species was found.
When looking at the main effects, a significant decrease over time in lichen species richness was
observed. In addition, the species richness showed significant differences depending on the altitude
and the aspect of the study summits (table 7). For instance, a higher number of lichen species was
found on Veslekolla and Kolla (figure 33).
However, for the Shannon diversity index and species evenness of lichens, a significant interaction
effect between summit and year was observed (table 7). This indicates that these parameters changed
significantly on each of the four summits separately. Lichen species diversity did not change
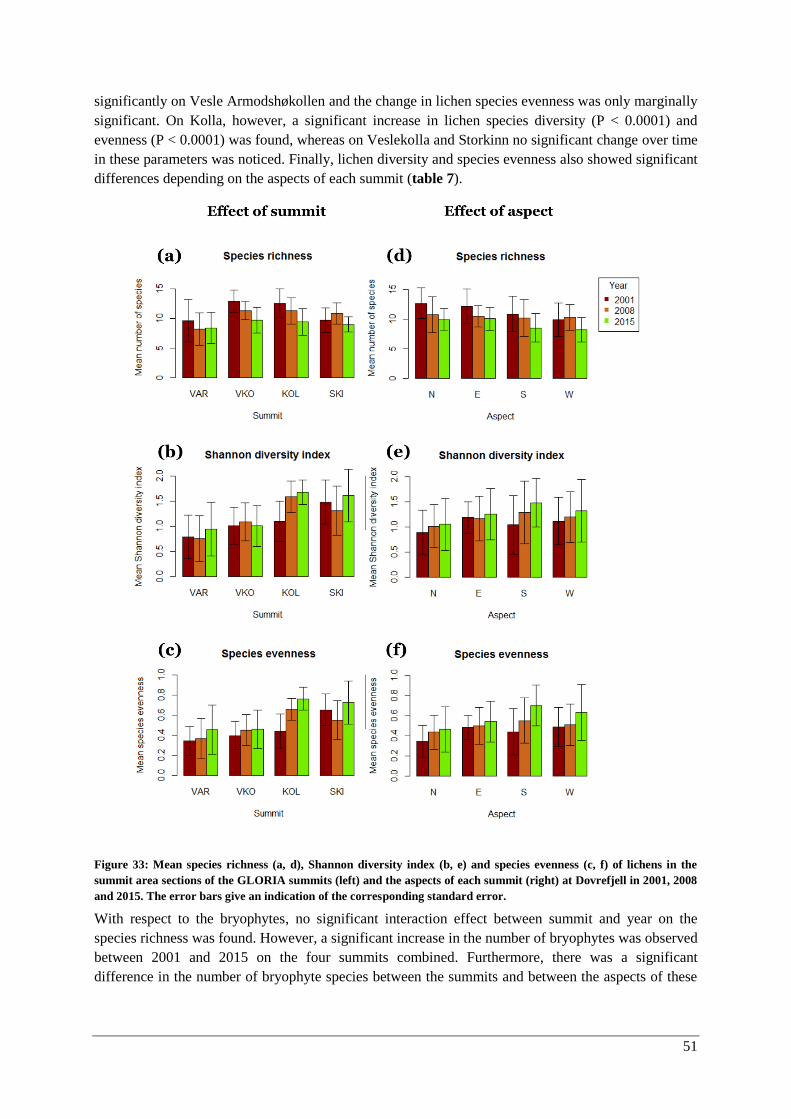
51
significantly on Vesle Armodshøkollen and the change in lichen species evenness was only marginally
significant. On Kolla, however, a significant increase in lichen species diversity (P < 0.0001) and
evenness (P < 0.0001) was found, whereas on Veslekolla and Storkinn no significant change over time
in these parameters was noticed. Finally, lichen diversity and species evenness also showed significant
differences depending on the aspects of each summit (table 7).
Figure 33: Mean species richness (a, d), Shannon diversity index (b, e) and species evenness (c, f) of lichens in the
summit area sections of the GLORIA summits (left) and the aspects of each summit (right) at Dovrefjell in 2001, 2008
and 2015. The error bars give an indication of the corresponding standard error.
With respect to the bryophytes, no significant interaction effect between summit and year on the
species richness was found. However, a significant increase in the number of bryophytes was observed
between 2001 and 2015 on the four summits combined. Furthermore, there was a significant
difference in the number of bryophyte species between the summits and between the aspects of these
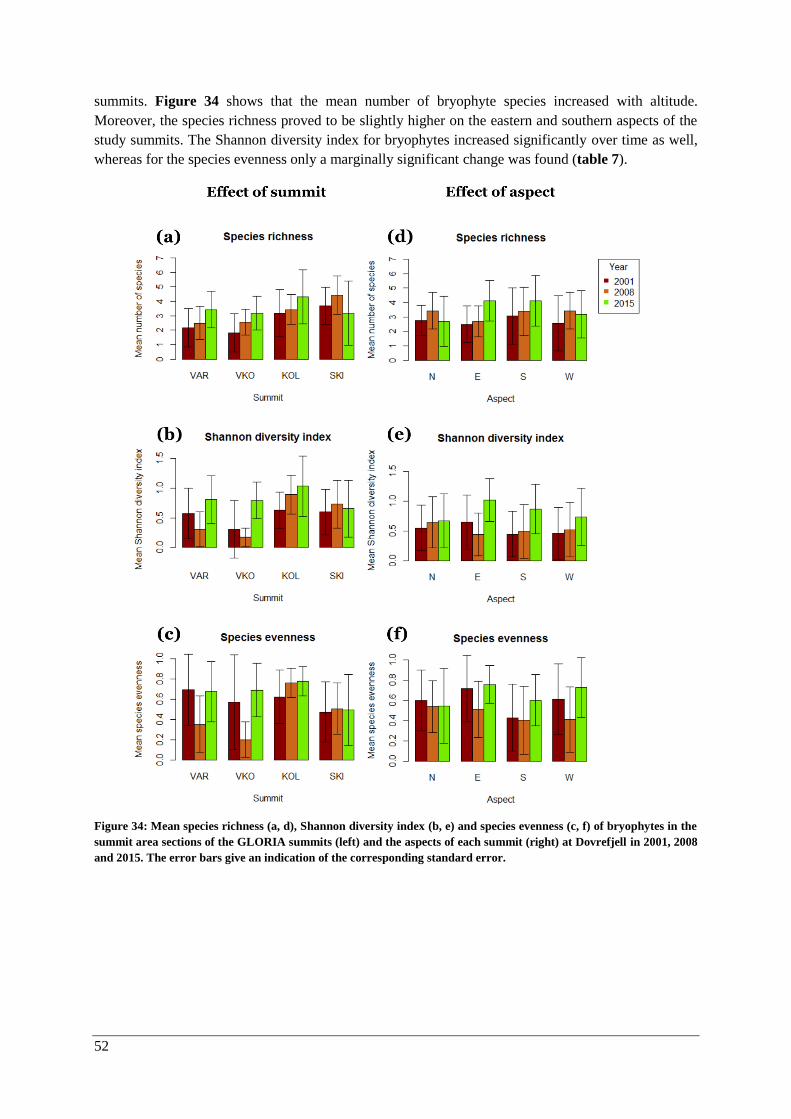
52
summits. Figure 34 shows that the mean number of bryophyte species increased with altitude.
Moreover, the species richness proved to be slightly higher on the eastern and southern aspects of the
study summits. The Shannon diversity index for bryophytes increased significantly over time as well,
whereas for the species evenness only a marginally significant change was found (table 7).
Figure 34: Mean species richness (a, d), Shannon diversity index (b, e) and species evenness (c, f) of bryophytes in the
summit area sections of the GLORIA summits (left) and the aspects of each summit (right) at Dovrefjell in 2001, 2008
and 2015. The error bars give an indication of the corresponding standard error.
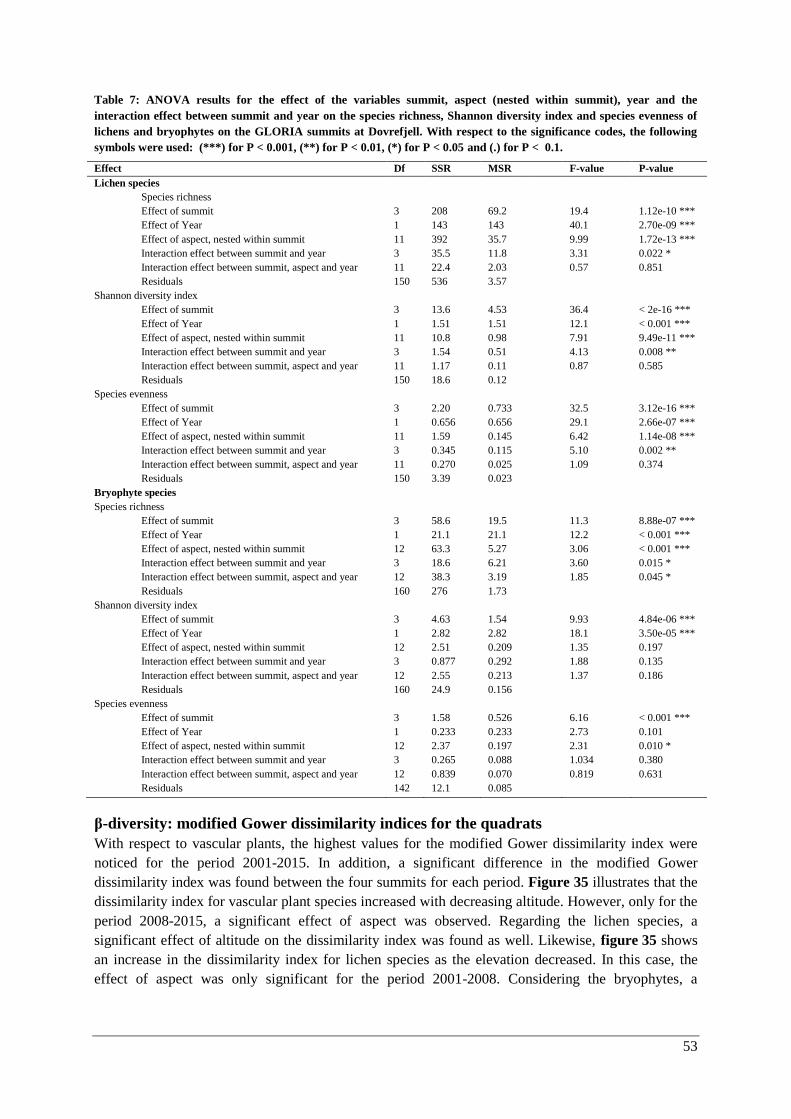
53
Table 7: ANOVA results for the effect of the variables summit, aspect (nested within summit), year and the
interaction effect between summit and year on the species richness, Shannon diversity index and species evenness of
lichens and bryophytes on the GLORIA summits at Dovrefjell. With respect to the significance codes, the following
symbols were used: (***) for P < 0.001, (**) for P < 0.01, (*) for P < 0.05 and (.) for P < 0.1.
Effect Df SSR MSR F-value P-value
Lichen species
Species richness
Effect of summit 3 208 69.2 19.4 1.12e-10 ***
Effect of Year 1 143 143 40.1 2.70e-09 ***
Effect of aspect, nested within summit 11 392 35.7 9.99 1.72e-13 ***
Interaction effect between summit and year 3 35.5 11.8 3.31 0.022 *
Interaction effect between summit, aspect and year 11 22.4 2.03 0.57 0.851
Residuals 150 536 3.57
Shannon diversity index
Effect of summit 3 13.6 4.53 36.4 < 2e-16 ***
Effect of Year 1 1.51 1.51 12.1 < 0.001 ***
Effect of aspect, nested within summit 11 10.8 0.98 7.91 9.49e-11 ***
Interaction effect between summit and year 3 1.54 0.51 4.13 0.008 **
Interaction effect between summit, aspect and year 11 1.17 0.11 0.87 0.585
Residuals 150 18.6 0.12
Species evenness
Effect of summit 3 2.20 0.733 32.5 3.12e-16 ***
Effect of Year 1 0.656 0.656 29.1 2.66e-07 ***
Effect of aspect, nested within summit 11 1.59 0.145 6.42 1.14e-08 ***
Interaction effect between summit and year 3 0.345 0.115 5.10 0.002 **
Interaction effect between summit, aspect and year 11 0.270 0.025 1.09 0.374
Residuals 150 3.39 0.023
Bryophyte species
Species richness
Effect of summit 3 58.6 19.5 11.3 8.88e-07 ***
Effect of Year 1 21.1 21.1 12.2 < 0.001 ***
Effect of aspect, nested within summit 12 63.3 5.27 3.06 < 0.001 ***
Interaction effect between summit and year 3 18.6 6.21 3.60 0.015 *
Interaction effect between summit, aspect and year 12 38.3 3.19 1.85 0.045 *
Residuals 160 276 1.73
Shannon diversity index
Effect of summit 3 4.63 1.54 9.93 4.84e-06 ***
Effect of Year 1 2.82 2.82 18.1 3.50e-05 ***
Effect of aspect, nested within summit 12 2.51 0.209 1.35 0.197
Interaction effect between summit and year 3 0.877 0.292 1.88 0.135
Interaction effect between summit, aspect and year 12 2.55 0.213 1.37 0.186
Residuals 160 24.9 0.156
Species evenness
Effect of summit 3 1.58 0.526 6.16 < 0.001 ***
Effect of Year 1 0.233 0.233 2.73 0.101
Effect of aspect, nested within summit 12 2.37 0.197 2.31 0.010 *
Interaction effect between summit and year 3 0.265 0.088 1.034 0.380
Interaction effect between summit, aspect and year 12 0.839 0.070 0.819 0.631
Residuals 142 12.1 0.085
β-diversity: modified Gower dissimilarity indices for the quadrats
With respect to vascular plants, the highest values for the modified Gower dissimilarity index were
noticed for the period 2001-2015. In addition, a significant difference in the modified Gower
dissimilarity index was found between the four summits for each period. Figure 35 illustrates that the
dissimilarity index for vascular plant species increased with decreasing altitude. However, only for the
period 2008-2015, a significant effect of aspect was observed. Regarding the lichen species, a
significant effect of altitude on the dissimilarity index was found as well. Likewise, figure 35 shows
an increase in the dissimilarity index for lichen species as the elevation decreased. In this case, the
effect of aspect was only significant for the period 2001-2008. Considering the bryophytes, a
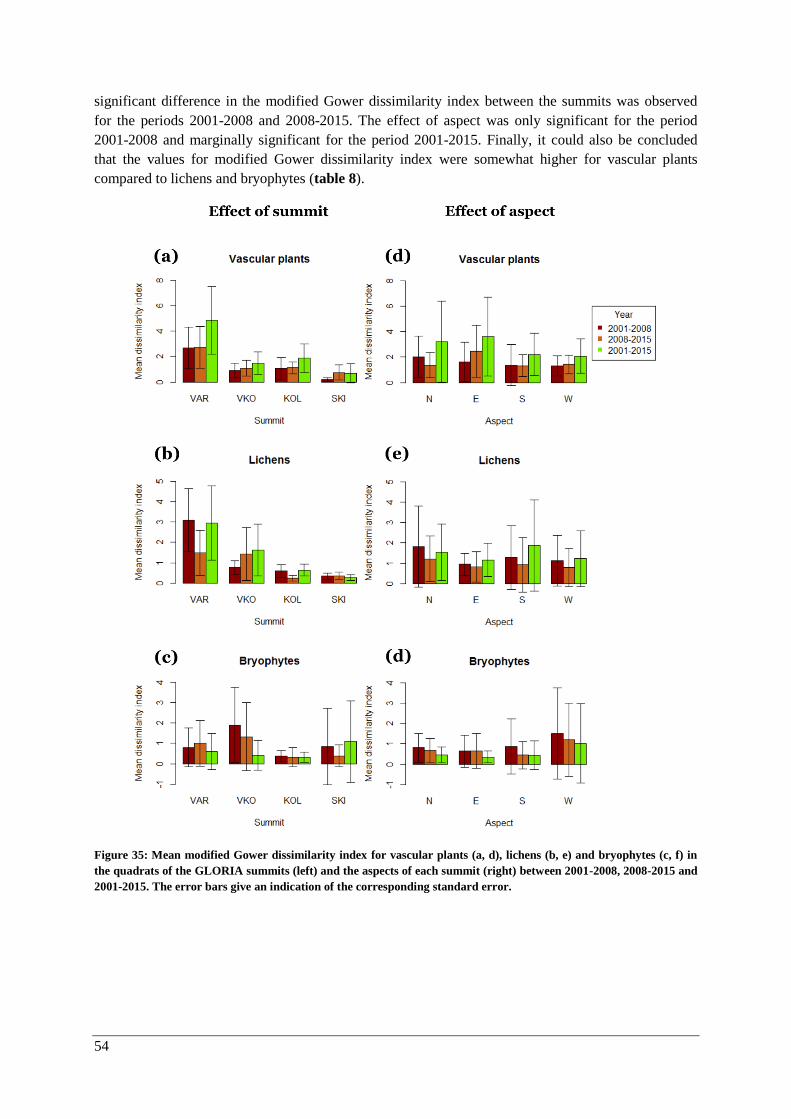
54
significant difference in the modified Gower dissimilarity index between the summits was observed
for the periods 2001-2008 and 2008-2015. The effect of aspect was only significant for the period
2001-2008 and marginally significant for the period 2001-2015. Finally, it could also be concluded
that the values for modified Gower dissimilarity index were somewhat higher for vascular plants
compared to lichens and bryophytes (table 8).
Figure 35: Mean modified Gower dissimilarity index for vascular plants (a, d), lichens (b, e) and bryophytes (c, f) in
the quadrats of the GLORIA summits (left) and the aspects of each summit (right) between 2001-2008, 2008-2015 and
2001-2015. The error bars give an indication of the corresponding standard error.
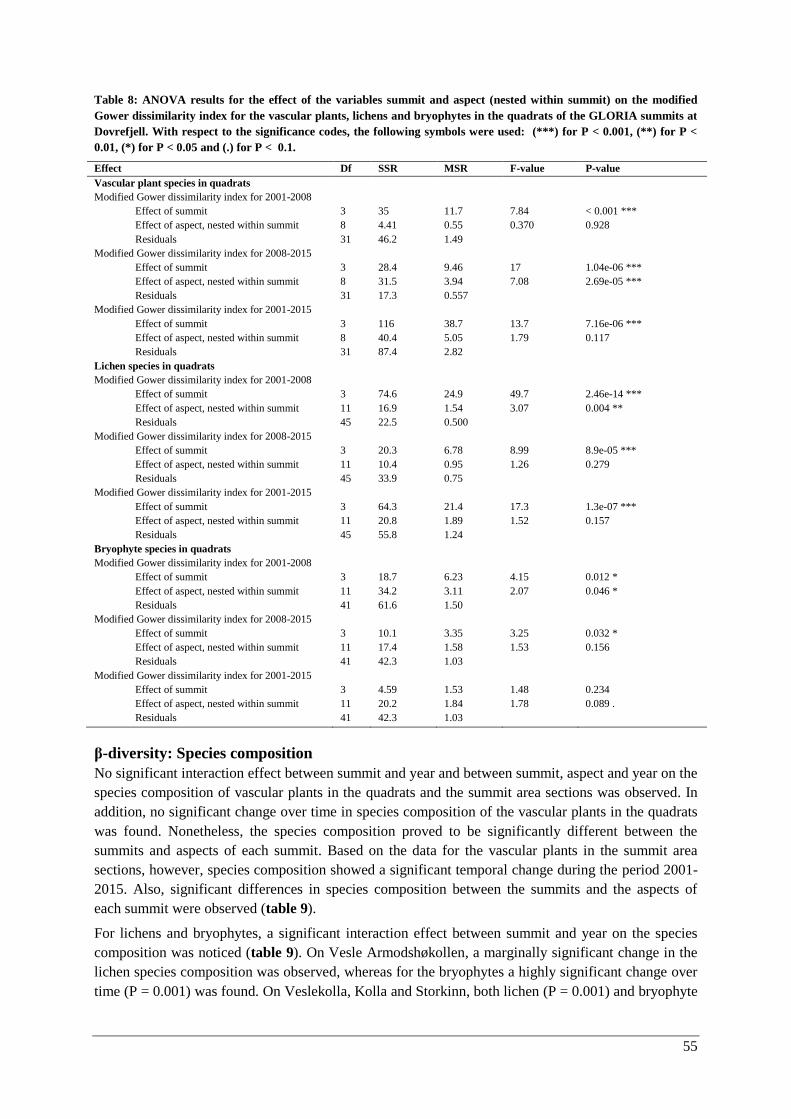
55
Table 8: ANOVA results for the effect of the variables summit and aspect (nested within summit) on the modified
Gower dissimilarity index for the vascular plants, lichens and bryophytes in the quadrats of the GLORIA summits at
Dovrefjell. With respect to the significance codes, the following symbols were used: (***) for P < 0.001, (**) for P <
0.01, (*) for P < 0.05 and (.) for P < 0.1.
Effect Df SSR MSR F-value P-value
Vascular plant species in quadrats
Modified Gower dissimilarity index for 2001-2008
Effect of summit 3 35 11.7 7.84 < 0.001 ***
Effect of aspect, nested within summit 8 4.41 0.55 0.370 0.928
Residuals 31 46.2 1.49
Modified Gower dissimilarity index for 2008-2015
Effect of summit 3 28.4 9.46 17 1.04e-06 ***
Effect of aspect, nested within summit 8 31.5 3.94 7.08 2.69e-05 ***
Residuals 31 17.3 0.557
Modified Gower dissimilarity index for 2001-2015
Effect of summit 3 116 38.7 13.7 7.16e-06 ***
Effect of aspect, nested within summit 8 40.4 5.05 1.79 0.117
Residuals 31 87.4 2.82
Lichen species in quadrats
Modified Gower dissimilarity index for 2001-2008
Effect of summit 3 74.6 24.9 49.7 2.46e-14 ***
Effect of aspect, nested within summit 11 16.9 1.54 3.07 0.004 **
Residuals 45 22.5 0.500
Modified Gower dissimilarity index for 2008-2015
Effect of summit 3 20.3 6.78 8.99 8.9e-05 ***
Effect of aspect, nested within summit 11 10.4 0.95 1.26 0.279
Residuals 45 33.9 0.75
Modified Gower dissimilarity index for 2001-2015
Effect of summit 3 64.3 21.4 17.3 1.3e-07 ***
Effect of aspect, nested within summit 11 20.8 1.89 1.52 0.157
Residuals 45 55.8 1.24
Bryophyte species in quadrats
Modified Gower dissimilarity index for 2001-2008
Effect of summit 3 18.7 6.23 4.15 0.012 *
Effect of aspect, nested within summit 11 34.2 3.11 2.07 0.046 *
Residuals 41 61.6 1.50
Modified Gower dissimilarity index for 2008-2015
Effect of summit 3 10.1 3.35 3.25 0.032 *
Effect of aspect, nested within summit 11 17.4 1.58 1.53 0.156
Residuals 41 42.3 1.03
Modified Gower dissimilarity index for 2001-2015
Effect of summit 3 4.59 1.53 1.48 0.234
Effect of aspect, nested within summit 11 20.2 1.84 1.78 0.089 .
Residuals 41 42.3 1.03
β-diversity: Species composition
No significant interaction effect between summit and year and between summit, aspect and year on the
species composition of vascular plants in the quadrats and the summit area sections was observed. In
addition, no significant change over time in species composition of the vascular plants in the quadrats
was found. Nonetheless, the species composition proved to be significantly different between the
summits and aspects of each summit. Based on the data for the vascular plants in the summit area
sections, however, species composition showed a significant temporal change during the period 2001-
2015. Also, significant differences in species composition between the summits and the aspects of
each summit were observed (table 9).
For lichens and bryophytes, a significant interaction effect between summit and year on the species
composition was noticed (table 9). On Vesle Armodshøkollen, a marginally significant change in the
lichen species composition was observed, whereas for the bryophytes a highly significant change over
time (P = 0.001) was found. On Veslekolla, Kolla and Storkinn, both lichen (P = 0.001) and bryophyte

56
(P= 0.001) species composition changed significantly over time. Finally, species composition of
lichens and bryophytes showed significant differences depending on the aspects of the study summits
as well (table 9).
Table 9: Result from the PERMANOVA analysis with the individual effects of summit, aspect, year and interactions
on the species composition of vascular plants, lichens and bryophytes on the GLORIA summits at Dovrefjell during
the period 2001-2015. With respect to the significance codes, the following symbols were used: (***) for P < 0.001,
(**) for P < 0.01, (*) for P < 0.05 and (.) for P < 0.1.
Effect Df SSR MSR F-value R2-value P-value
Vascular plant species in quadrats
Species composition
Effect of summit 3 21 6.99 64.5 0.481 0.001 ***
Effect of Year 1 0.058 0.058 0.531 0.001 0.825
Effect of aspect, nested within summit 8 10.8 1.350 12.5 0.248 0.001 ***
Interaction effect between summit and year 3 0.115 0.038 0.354 0.003 1.000
Interaction effect between summit, aspect and year 8 0.242 0.030 0.280 0.006 1.000
Residuals 105 11.4 0.108
0.261
Total 128 43.6
1
Vascular plant species in summit area sections
Species composition
Effect of summit 3 18.4 6.13 92.1 0.697 0.001 ***
Effect of Year 1 0.189 0.189 2.83 0.007 0.022 *
Effect of aspect, nested within summit 12 3.09 0.257 3.86 0.117 0.001 ***
Interaction effect between summit and year 3 0.398 0.133 1.99 0.015 0.019 *
Interaction effect between summit, aspect and year 12 0.322 0.027 0.402 0.012 1.000
Residuals 60 4 0.067
0.151
Total 91 26.4
1
Lichen species
Species composition
Effect of summit 3 9.48 3.16 42 0.304 0.001 ***
Effect of Year 1 2.03 2.04 27.1 0.065 0.001 ***
Effect of aspect, nested within summit 11 6.33 0.575 7.64 0.203 0.001 ***
Interaction effect between summit and year 3 1.26 0.420 5.58 0.040 0.001 ***
Interaction effect between summit, aspect and year 11 0.819 0.074 0.99 0.026 0.517
Residuals 150 11.3 0.075
0.362
Total 179 31.2
1
Bryophyte species
Species composition
Effect of summit 3 18.9 6.30 29.5 0.29297 0.001 ***
Effect of Year 1 3.38 3.38 15.8 0.05238 0.001 ***
Effect of aspect, nested within summit 11 6.32 0.57 2.69 0.09807 0.001 ***
Interaction effect between summit and year 3 3.07 1.02 4.79 0.0476 0.001 ***
Interaction effect between summit, aspect and year 11 2.92 0.266 1.24 0.04534 0.052 .
Residuals 140 29.9 0.214
0.46363
Total 169 64.5
1
Secondly, the change in species composition of vascular plants throughout the sampling period of
2001-2015 could also be investigated using an NMDS plot (figure 36). For lichens and bryophytes,
the corresponding NMDS plots can be found in Appendix D.
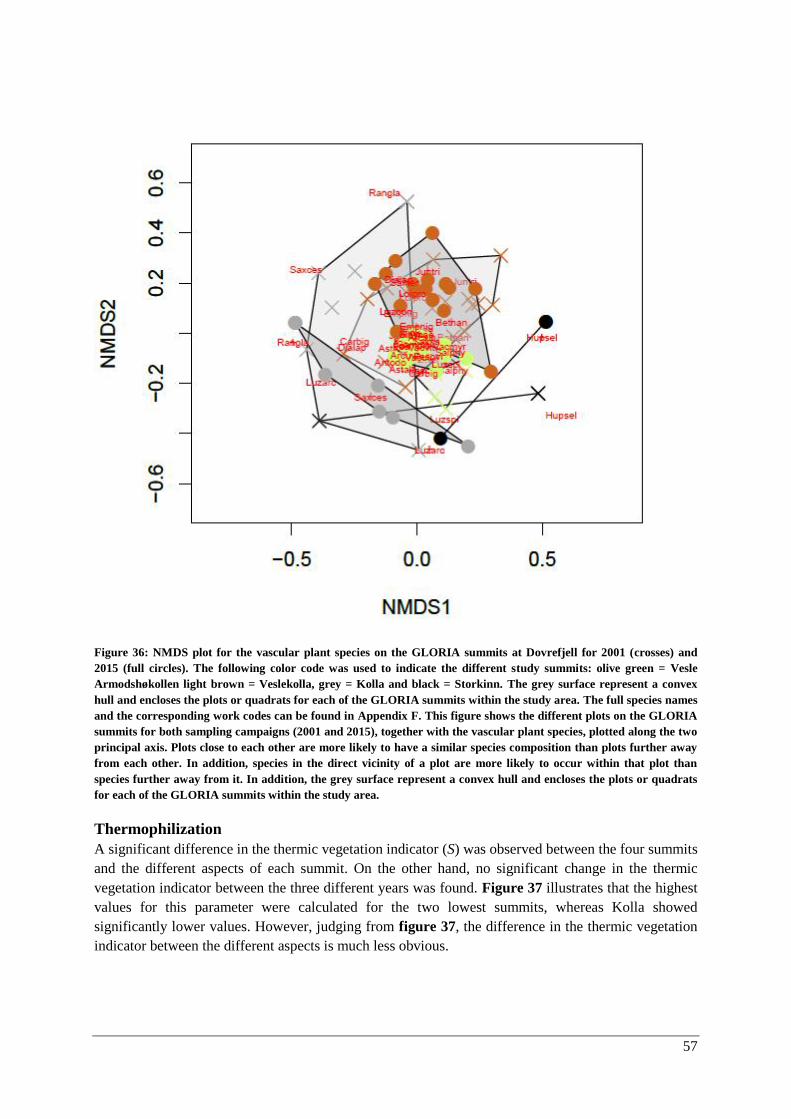
57
Figure 36: NMDS plot for the vascular plant species on the GLORIA summits at Dovrefjell for 2001 (crosses) and
2015 (full circles). The following color code was used to indicate the different study summits: olive green = Vesle
Armodshøkollen light brown = Veslekolla, grey = Kolla and black = Storkinn. The grey surface represent a convex
hull and encloses the plots or quadrats for each of the GLORIA summits within the study area. The full species names
and the corresponding work codes can be found in Appendix F. This figure shows the different plots on the GLORIA
summits for both sampling campaigns (2001 and 2015), together with the vascular plant species, plotted along the two
principal axis. Plots close to each other are more likely to have a similar species composition than plots further away
from each other. In addition, species in the direct vicinity of a plot are more likely to occur within that plot than
species further away from it. In addition, the grey surface represent a convex hull and encloses the plots or quadrats
for each of the GLORIA summits within the study area.
Thermophilization
A significant difference in the thermic vegetation indicator (S) was observed between the four summits
and the different aspects of each summit. On the other hand, no significant change in the thermic
vegetation indicator between the three different years was found. Figure 37 illustrates that the highest
values for this parameter were calculated for the two lowest summits, whereas Kolla showed
significantly lower values. However, judging from figure 37, the difference in the thermic vegetation
indicator between the different aspects is much less obvious.
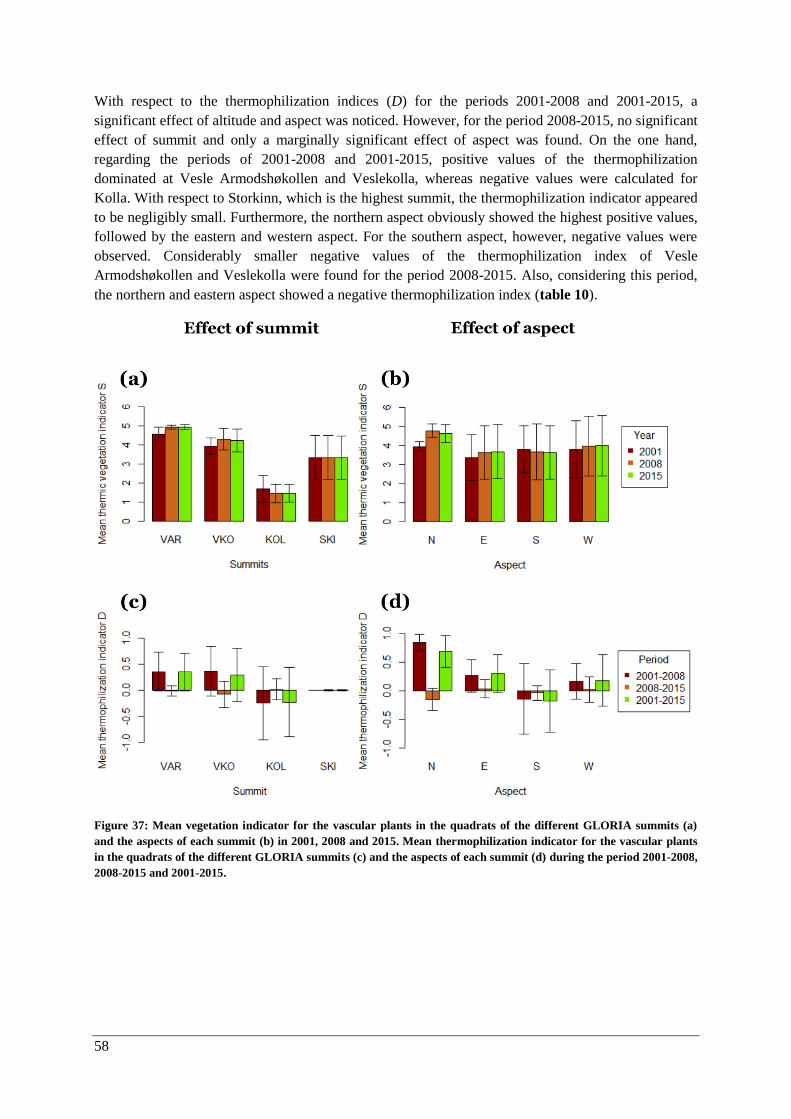
58
With respect to the thermophilization indices (D) for the periods 2001-2008 and 2001-2015, a
significant effect of altitude and aspect was noticed. However, for the period 2008-2015, no significant
effect of summit and only a marginally significant effect of aspect was found. On the one hand,
regarding the periods of 2001-2008 and 2001-2015, positive values of the thermophilization
dominated at Vesle Armodshøkollen and Veslekolla, whereas negative values were calculated for
Kolla. With respect to Storkinn, which is the highest summit, the thermophilization indicator appeared
to be negligibly small. Furthermore, the northern aspect obviously showed the highest positive values,
followed by the eastern and western aspect. For the southern aspect, however, negative values were
observed. Considerably smaller negative values of the thermophilization index of Vesle
Armodshøkollen and Veslekolla were found for the period 2008-2015. Also, considering this period,
the northern and eastern aspect showed a negative thermophilization index (table 10).
Figure 37: Mean vegetation indicator for the vascular plants in the quadrats of the different GLORIA summits (a)
and the aspects of each summit (b) in 2001, 2008 and 2015. Mean thermophilization indicator for the vascular plants
in the quadrats of the different GLORIA summits (c) and the aspects of each summit (d) during the period 2001-2008,
2008-2015 and 2001-2015.
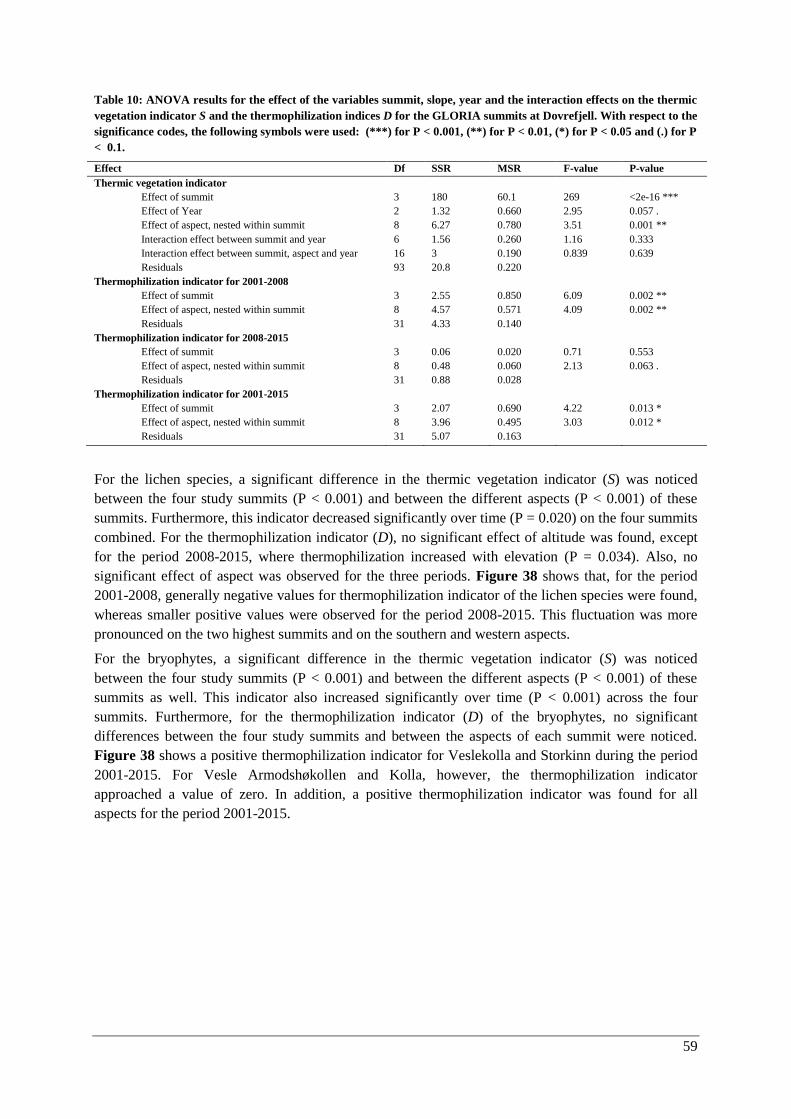
59
Table 10: ANOVA results for the effect of the variables summit, slope, year and the interaction effects on the thermic
vegetation indicator S and the thermophilization indices D for the GLORIA summits at Dovrefjell. With respect to the
significance codes, the following symbols were used: (***) for P < 0.001, (**) for P < 0.01, (*) for P < 0.05 and (.) for P
< 0.1.
Effect Df SSR MSR F-value P-value
Thermic vegetation indicator
Effect of summit 3 180 60.1 269 <2e-16 ***
Effect of Year 2 1.32 0.660 2.95 0.057 .
Effect of aspect, nested within summit 8 6.27 0.780 3.51 0.001 **
Interaction effect between summit and year 6 1.56 0.260 1.16 0.333
Interaction effect between summit, aspect and year 16 3 0.190 0.839 0.639
Residuals 93 20.8 0.220
Thermophilization indicator for 2001-2008
Effect of summit 3 2.55 0.850 6.09 0.002 **
Effect of aspect, nested within summit 8 4.57 0.571 4.09 0.002 **
Residuals 31 4.33 0.140
Thermophilization indicator for 2008-2015
Effect of summit 3 0.06 0.020 0.71 0.553
Effect of aspect, nested within summit 8 0.48 0.060 2.13 0.063 .
Residuals 31 0.88 0.028
Thermophilization indicator for 2001-2015
Effect of summit 3 2.07 0.690 4.22 0.013 *
Effect of aspect, nested within summit 8 3.96 0.495 3.03 0.012 *
Residuals 31 5.07 0.163
For the lichen species, a significant difference in the thermic vegetation indicator (S) was noticed
between the four study summits (P < 0.001) and between the different aspects (P < 0.001) of these
summits. Furthermore, this indicator decreased significantly over time (P = 0.020) on the four summits
combined. For the thermophilization indicator (D), no significant effect of altitude was found, except
for the period 2008-2015, where thermophilization increased with elevation (P = 0.034). Also, no
significant effect of aspect was observed for the three periods. Figure 38 shows that, for the period
2001-2008, generally negative values for thermophilization indicator of the lichen species were found,
whereas smaller positive values were observed for the period 2008-2015. This fluctuation was more
pronounced on the two highest summits and on the southern and western aspects.
For the bryophytes, a significant difference in the thermic vegetation indicator (S) was noticed
between the four study summits (P < 0.001) and between the different aspects (P < 0.001) of these
summits as well. This indicator also increased significantly over time (P < 0.001) across the four
summits. Furthermore, for the thermophilization indicator (D) of the bryophytes, no significant
differences between the four study summits and between the aspects of each summit were noticed.
Figure 38 shows a positive thermophilization indicator for Veslekolla and Storkinn during the period
2001-2015. For Vesle Armodshøkollen and Kolla, however, the thermophilization indicator
approached a value of zero. In addition, a positive thermophilization indicator was found for all
aspects for the period 2001-2015.
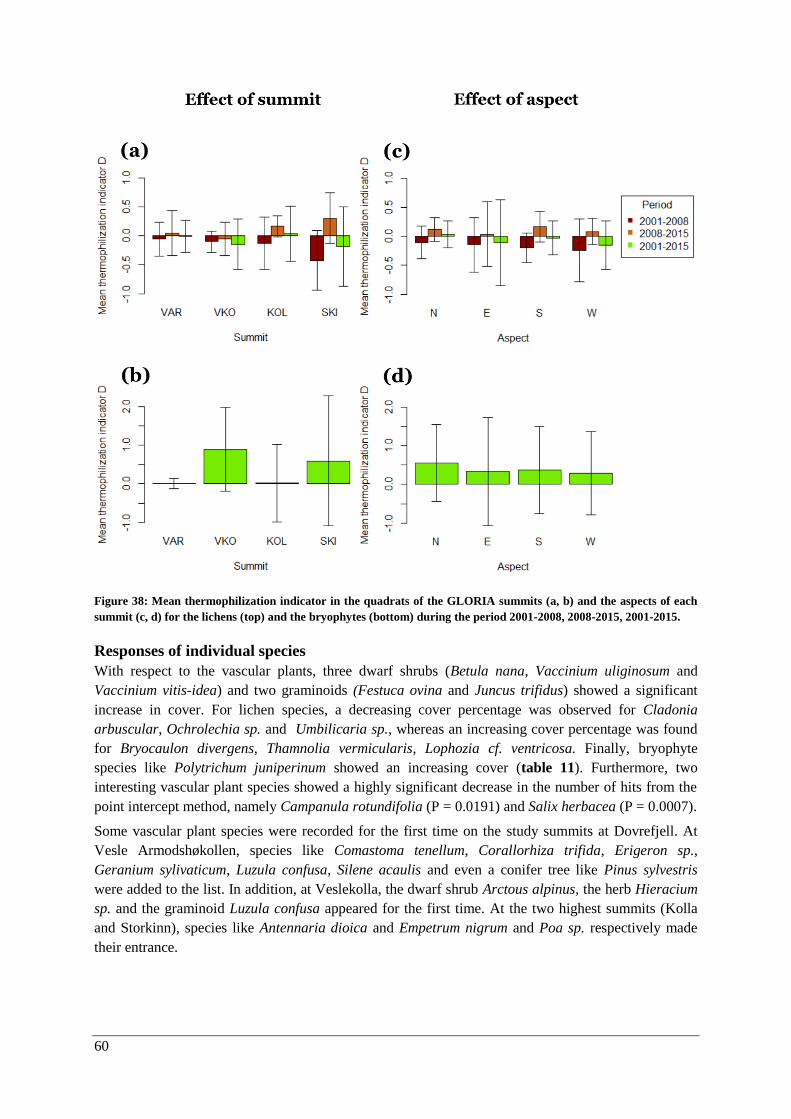
60
Figure 38: Mean thermophilization indicator in the quadrats of the GLORIA summits (a, b) and the aspects of each
summit (c, d) for the lichens (top) and the bryophytes (bottom) during the period 2001-2008, 2008-2015, 2001-2015.
Responses of individual species
With respect to the vascular plants, three dwarf shrubs (Betula nana, Vaccinium uliginosum and
Vaccinium vitis-idea) and two graminoids (Festuca ovina and Juncus trifidus) showed a significant
increase in cover. For lichen species, a decreasing cover percentage was observed for Cladonia
arbuscular, Ochrolechia sp. and Umbilicaria sp., whereas an increasing cover percentage was found
for Bryocaulon divergens, Thamnolia vermicularis, Lophozia cf. ventricosa. Finally, bryophyte
species like Polytrichum juniperinum showed an increasing cover (table 11). Furthermore, two
interesting vascular plant species showed a highly significant decrease in the number of hits from the
point intercept method, namely Campanula rotundifolia (P = 0.0191) and Salix herbacea (P = 0.0007).
Some vascular plant species were recorded for the first time on the study summits at Dovrefjell. At
Vesle Armodshøkollen, species like Comastoma tenellum, Corallorhiza trifida, Erigeron sp.,
Geranium sylivaticum, Luzula confusa, Silene acaulis and even a conifer tree like Pinus sylvestris
were added to the list. In addition, at Veslekolla, the dwarf shrub Arctous alpinus, the herb Hieracium
sp. and the graminoid Luzula confusa appeared for the first time. At the two highest summits (Kolla
and Storkinn), species like Antennaria dioica and Empetrum nigrum and Poa sp. respectively made
their entrance.
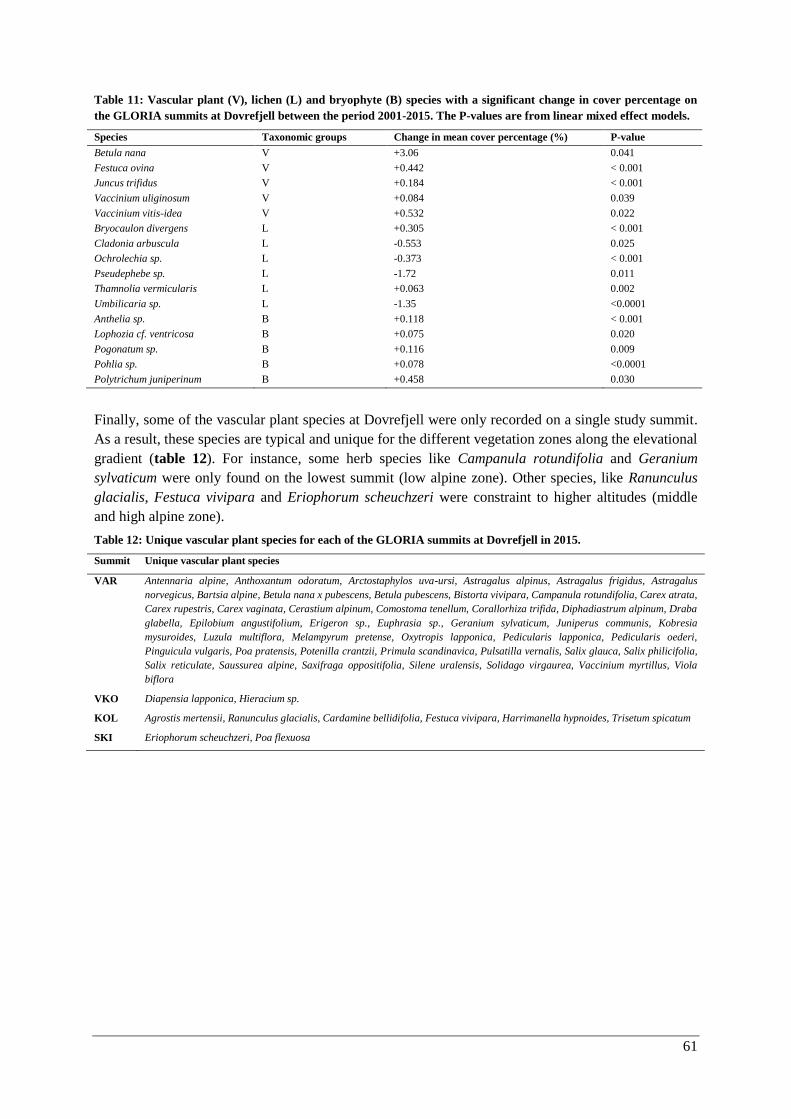
61
Table 11: Vascular plant (V), lichen (L) and bryophyte (B) species with a significant change in cover percentage on
the GLORIA summits at Dovrefjell between the period 2001-2015. The P-values are from linear mixed effect models.
Species Taxonomic groups Change in mean cover percentage (%) P-value
Betula nana V +3.06 0.041
Festuca ovina V +0.442 < 0.001
Juncus trifidus V +0.184 < 0.001
Vaccinium uliginosum V +0.084 0.039
Vaccinium vitis-idea V +0.532 0.022
Bryocaulon divergens L +0.305 < 0.001
Cladonia arbuscula L -0.553 0.025
Ochrolechia sp. L -0.373 < 0.001
Pseudephebe sp. L -1.72 0.011
Thamnolia vermicularis L +0.063 0.002
Umbilicaria sp. L -1.35 <0.0001
Anthelia sp. B +0.118 < 0.001
Lophozia cf. ventricosa B +0.075 0.020
Pogonatum sp. B +0.116 0.009
Pohlia sp. B +0.078 <0.0001
Polytrichum juniperinum B +0.458 0.030
Finally, some of the vascular plant species at Dovrefjell were only recorded on a single study summit.
As a result, these species are typical and unique for the different vegetation zones along the elevational
gradient (table 12). For instance, some herb species like Campanula rotundifolia and Geranium
sylvaticum were only found on the lowest summit (low alpine zone). Other species, like Ranunculus
glacialis, Festuca vivipara and Eriophorum scheuchzeri were constraint to higher altitudes (middle
and high alpine zone).
Table 12: Unique vascular plant species for each of the GLORIA summits at Dovrefjell in 2015.
Summit Unique vascular plant species
VAR Antennaria alpine, Anthoxantum odoratum, Arctostaphylos uva-ursi, Astragalus alpinus, Astragalus frigidus, Astragalus
norvegicus, Bartsia alpine, Betula nana x pubescens, Betula pubescens, Bistorta vivipara, Campanula rotundifolia, Carex atrata,
Carex rupestris, Carex vaginata, Cerastium alpinum, Comostoma tenellum, Corallorhiza trifida, Diphadiastrum alpinum, Draba
glabella, Epilobium angustifolium, Erigeron sp., Euphrasia sp., Geranium sylvaticum, Juniperus communis, Kobresia
mysuroides, Luzula multiflora, Melampyrum pretense, Oxytropis lapponica, Pedicularis lapponica, Pedicularis oederi,
Pinguicula vulgaris, Poa pratensis, Potenilla crantzii, Primula scandinavica, Pulsatilla vernalis, Salix glauca, Salix philicifolia,
Salix reticulate, Saussurea alpine, Saxifraga oppositifolia, Silene uralensis, Solidago virgaurea, Vaccinium myrtillus, Viola
biflora
VKO Diapensia lapponica, Hieracium sp.
KOL Agrostis mertensii, Ranunculus glacialis, Cardamine bellidifolia, Festuca vivipara, Harrimanella hypnoides, Trisetum spicatum
SKI Eriophorum scheuchzeri, Poa flexuosa

62
Discussion
Temporal changes in climate A significant decrease in the mean annual soil temperature was found for the temperature loggers on
the summits at Dovrefjell during the period 2001-2015. This negative trend was even more obvious
during the period 2008-2015. Similar results were found for the minimum and maximum soil
temperature on the study summits. However, the sampling period of 15 years is still quite short and
temperature measurements on a long time scale are required in order to get the broader picture.
Nonetheless, this downward trend in temperature was also observed during the last ten years of the
long-term temperature record (1900-2014) for the weather station of Gammel-Fokstugu. Furthermore,
at a global scale, an apparent slowdown or hiatus in global warming has been observed since the start
of the 21st century (Easterling & Wehner, 2009; Foster & Rahmstorf, 2011; Kosaka & Xie, 2013; Karl
et al., 2015) (figure 39).
Figure 39: Globally averaged surface air temperature for land and ocean based data sets during the period 1975-2008.
Note the apparent hiatus in global warming between 2000 and 2010 (Easterling & Wehner, 2009).
The global mean surface temperature experienced a significantly smaller increasing trend during the
period 1998-2012 compared to the past 30 or 60 years (IPCC, 2013). A wide range of mechanisms
were proposed for causing this phenomenon, but most of these theories are still being debated
(Solomon et al., 2011; Kaufmann et al., 2011; Meelh et al., 2011; Kosaka & Xie, 2013). Easterling and
Wehner (2009) concluded that several short periods of no warming or even cooling occurred
superimposed on the long-term warming trend throughout the last century. These temperature
plateaus, also referred to as cooling spells, are mainly caused by naturally-occurring fluctuations in the
global climate and generally last for a few decades. Next to variations in the solar activity (Lean &
Rind, 2009) and fluctuations in stratospheric water vapor content (Solomon et al., 2010) and
tropospheric aerosols (Kaufmann et al., 2011), the El Niño - Southern Oscillation23
(ENSO) can be
addressed as one of the possible drivers for these natural fluctuations (Easterling & Wehner, 2009). In
the aftermath of an El Niño event, an unusual increase in the sea surface temperature can be observed
23
ENSO is a naturally occurring phenomenon with a profound influence on winds and sea surface temperatures
over the tropical Pacific Ocean. The warming phase (El Niño) is periodically alternated by a cooler period (La
Niña). This process drives global rainfall patterns, surface air temperature, river discharge, agricultural
production, ecosystems, tropical cyclones, etc. (Holbrook et al., 2012).
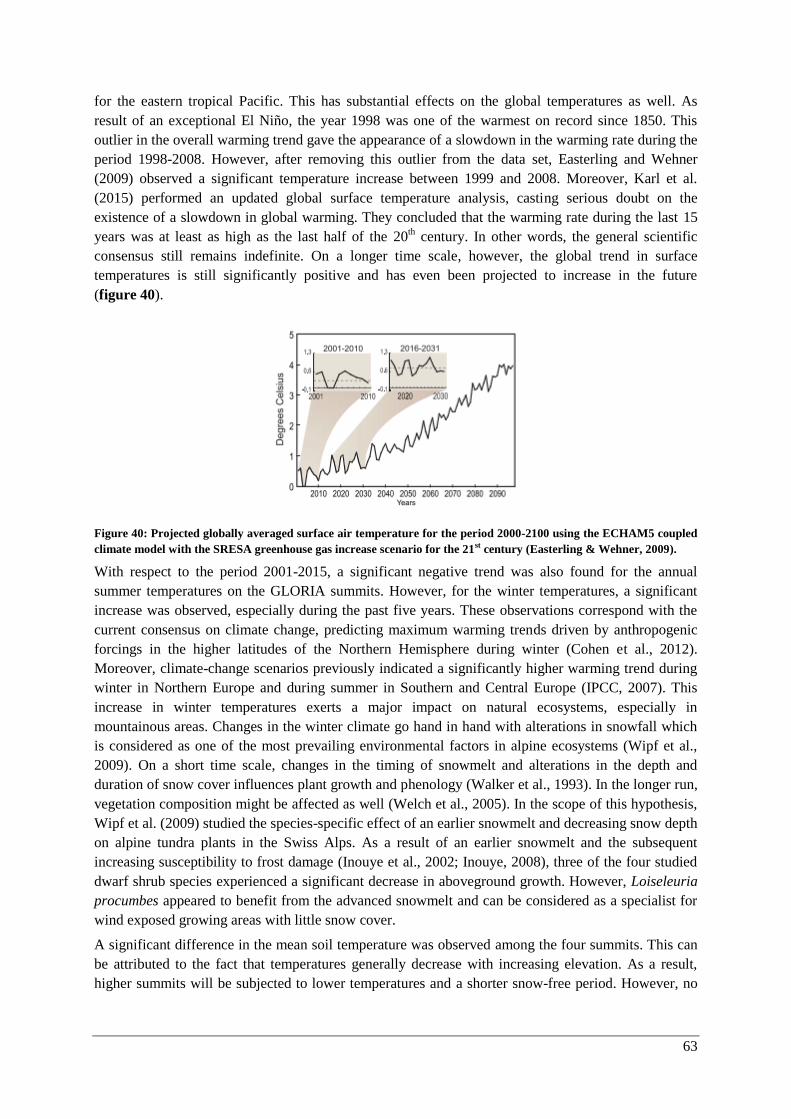
63
for the eastern tropical Pacific. This has substantial effects on the global temperatures as well. As
result of an exceptional El Niño, the year 1998 was one of the warmest on record since 1850. This
outlier in the overall warming trend gave the appearance of a slowdown in the warming rate during the
period 1998-2008. However, after removing this outlier from the data set, Easterling and Wehner
(2009) observed a significant temperature increase between 1999 and 2008. Moreover, Karl et al.
(2015) performed an updated global surface temperature analysis, casting serious doubt on the
existence of a slowdown in global warming. They concluded that the warming rate during the last 15
years was at least as high as the last half of the 20th century. In other words, the general scientific
consensus still remains indefinite. On a longer time scale, however, the global trend in surface
temperatures is still significantly positive and has even been projected to increase in the future
(figure 40).
Figure 40: Projected globally averaged surface air temperature for the period 2000-2100 using the ECHAM5 coupled
climate model with the SRESA greenhouse gas increase scenario for the 21st century (Easterling & Wehner, 2009).
With respect to the period 2001-2015, a significant negative trend was also found for the annual
summer temperatures on the GLORIA summits. However, for the winter temperatures, a significant
increase was observed, especially during the past five years. These observations correspond with the
current consensus on climate change, predicting maximum warming trends driven by anthropogenic
forcings in the higher latitudes of the Northern Hemisphere during winter (Cohen et al., 2012).
Moreover, climate-change scenarios previously indicated a significantly higher warming trend during
winter in Northern Europe and during summer in Southern and Central Europe (IPCC, 2007). This
increase in winter temperatures exerts a major impact on natural ecosystems, especially in
mountainous areas. Changes in the winter climate go hand in hand with alterations in snowfall which
is considered as one of the most prevailing environmental factors in alpine ecosystems (Wipf et al.,
2009). On a short time scale, changes in the timing of snowmelt and alterations in the depth and
duration of snow cover influences plant growth and phenology (Walker et al., 1993). In the longer run,
vegetation composition might be affected as well (Welch et al., 2005). In the scope of this hypothesis,
Wipf et al. (2009) studied the species-specific effect of an earlier snowmelt and decreasing snow depth
on alpine tundra plants in the Swiss Alps. As a result of an earlier snowmelt and the subsequent
increasing susceptibility to frost damage (Inouye et al., 2002; Inouye, 2008), three of the four studied
dwarf shrub species experienced a significant decrease in aboveground growth. However, Loiseleuria
procumbes appeared to benefit from the advanced snowmelt and can be considered as a specialist for
wind exposed growing areas with little snow cover.
A significant difference in the mean soil temperature was observed among the four summits. This can
be attributed to the fact that temperatures generally decrease with increasing elevation. As a result,
higher summits will be subjected to lower temperatures and a shorter snow-free period. However, no
64
significant temperature differences were found depending on the aspect. Nonetheless, it can be
assumed that the temperatures on the northern mountainside will be somewhat lower compared to the
other mountain aspects since this side receives considerably lower inputs of solar radiation on a daily
basis.
Despite the apparent slowdown in the temperature increase at Dovrefjell, lag effect of past changes in
climatic conditions on vegetation should be taken into account when attempting to explain the
observed changes in vegetation. Various studies have already indicated a lag between the
contemporary climate change and subsequent biotic responses of plants and animals (e. g. Doak &
Morris, 2010; Lenoir et al., 2008). For instance, Doak and Morris (2010) found that two North
American tundra species (Silene acaulis and Polygonum viviparum; both also occurring at Dovrefjell)
showed compensatory changes in demographic rates (e.g. higher individual growth rates), buffering
southern populations against the negative impact of climate warming and slowing their northward
range shifts. Alpine and Arctic plants are mostly long-lived (de Witte & Stoecklin, 2010) and the
internal processes in plant communities occur at a slow rate (Körner, 2003). Therefore, changes in the
distribution of alpine plants will show a distinct trend over time rather than inter-annual variability. In
addition, a wide variety of alpine plants (e.g. Salix herbacea, Empetrum nigrum, Carex bigelowii, etc.)
are characterized by slow-responding traits such as clonal growth. Clonal reproduction enhances
longevity of these plant species and thus affects community stability and vegetation responses to
present and future climate warming (de Witte & Stoecklin, 2010). Therefore, possible changes in plant
species richness and composition that are presently recorded in mountain areas, might be a delayed
effect of climate warming during the last decades of 20th century. Long life spans and clonal
reproduction strategies also enable mountain plant species to retard extinction and persist in local
climate conditions that are already unsuitable for their long-term survival. Hence, a fairly modest
future loss in the distribution area of alpine high-mountain flora (on average 44 to 50 % by the end of
the 21st century) is predicted. These results, however, warn against drawing over-optimistic
conclusions since the final impact of climate change on mountain plants is delayed by a number of
decades (Dullinger et al., 2012).
Nonetheless, other studies found contrasting results. For example, Kelley and Goulden (2008)
observed rapid shifts in the distribution of mountain vegetation in Southern California, USA, as a
response to climate warming, at least in areas where the dispersal of species is not a major constraint.
These findings are also supported by Cannone et al. (2007) for alpine and nival belts in the European
Alps. Furthermore, the magnitude of the lag effects also depends on the intensity of climate warming,
which differs strongly between lowland and highland areas. Bertrand et al. (2011) compared
temperature trends to temperature records reconstructed from plant assemblages during a 44-year
period in France. In this study, both floristically (i.e. temperature trends reconstructed from observed
alterations in plant assemblages) and climatically (i.e. temperature trends reconstructed from
instrumental records and climatic models) reconstructed temperatures were determined. In the period
before contemporary climate warming (1965-1986), only small differences between the floristically
and climatically reconstructed temperatures were observed, indicating changes in plant community
composition close to the magnitude of climate change. However, larger differences were found during
the current climate warming period (1987-2008), suggesting that the warming-induced reshuffling in
plant communities lags behind climate change and providing evidence for a rather slow recovery of
the climate-flora equilibrium. This difference was observed for both lowland and highland areas.
However, in lowland forests temperature lags between climate and plant community composition were
much more obvious (figure 41). This could be attributed to the greater velocity of climate change in
lowland areas (Loarie et al., 2009), the higher proportion of species with a greater ability for local

65
persistence (Thuiller et al., 2005), a lower opportunity for short-distance range shifts (Jump et al.,
2009) and a greater habitat fragmentation.
In order to create more certainty on the existence of lag effects in the response of vegetation to climate
change at Dovrefjell, more long-term observation data are required. Moreover, other climatic
parameters such as relative air humidity, the amount of snowfall and atmospheric CO2 concentrations
have a substantial effect on plant productivity and species composition as well and are believed to
shape the overall response of species to changes in the mean climate. However, the effects of these
parameters were not quantified for this research as local data, with the desired spatial and temporal
resolution, were not available.
Figure 41: Comparison of the floristically (green) and climatically (red) reconstructed temperature trends during the
period 1965-2008 for lowland (a) and highland (b) forest plant communities. The dashed line indicates the start of the
present-day climate warming period (1987-2008) (Bertrand et al., 2011).
Vegetation analysis
Changes with elevation and aspect (2015)
Vascular plants
A significant decrease in species richness and diversity of vascular plants was observed with
increasing altitude. The highest species richness was noticed on the lowest summit, located in the
lower alpine belt, and declined considerably towards the middle and high alpine belt. Many theories
have already been proposed in order to explain the variation in species distribution and species
richness with elevation (Whittaker, 1972; Palmer, 1994; Nagy et al., 2003). Particularly gradients in
biotic and abiotic conditions in mountainous areas are considered to have a substantial potential to
explain species distributions and species richness patterns (McCain & Grytnes, 2010). In addition,
space availability, species interactions and productivity play a significant role as well.
At a broad scale, the relationship between species richness and productivity is often monotonically
positive (Mittelbach et al., 2001) (figure 42). In mountain ecosystems, the linear decrease in
temperature with increasing elevation (approximately 0.6 °C for every 100 m) exerts a considerable
influence on the pool of potential species that are able to thrive in the increasingly extreme conditions.
As elevation increases, the species pool size and species richness commonly declines. Hence, local
species communities at a higher elevation consist of small samples of the regional species pool (Bruun
et al., 2006). This theory is known as Huston’s productivity or temperature-physiography hypothesis
(Huston, 1999). Microrelief is expected to play a significant role as well, as it affects habitat-type
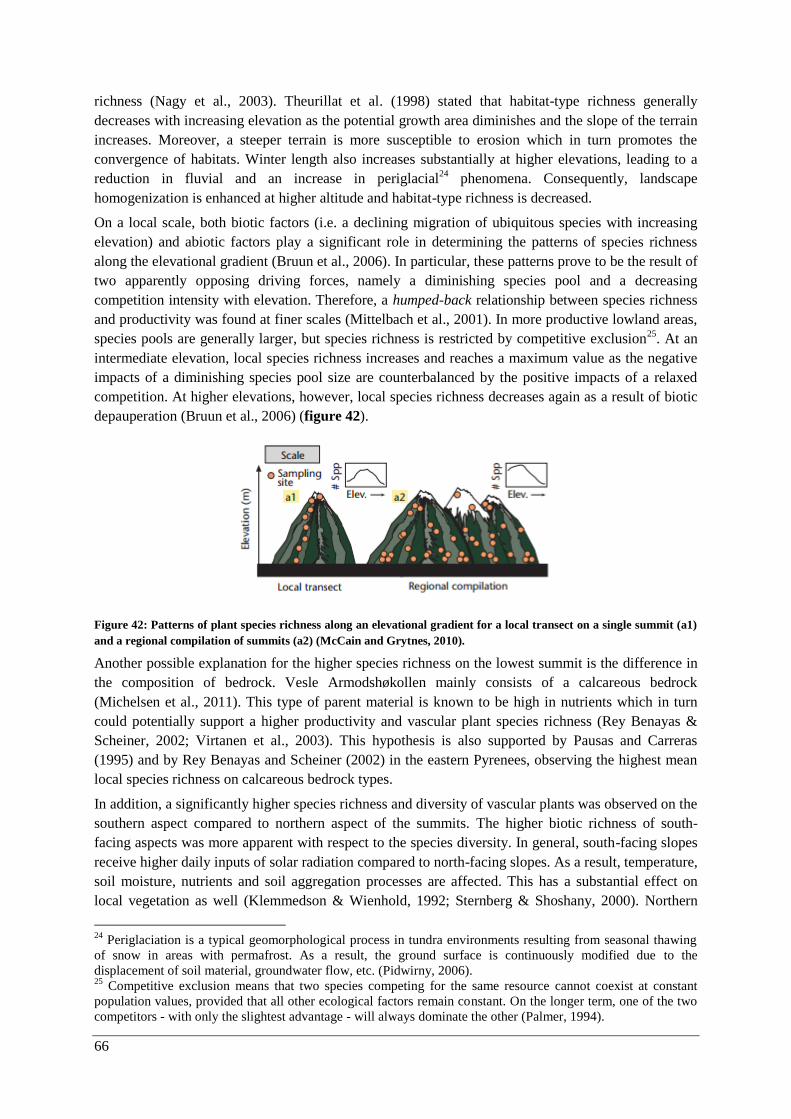
66
richness (Nagy et al., 2003). Theurillat et al. (1998) stated that habitat-type richness generally
decreases with increasing elevation as the potential growth area diminishes and the slope of the terrain
increases. Moreover, a steeper terrain is more susceptible to erosion which in turn promotes the
convergence of habitats. Winter length also increases substantially at higher elevations, leading to a
reduction in fluvial and an increase in periglacial24
phenomena. Consequently, landscape
homogenization is enhanced at higher altitude and habitat-type richness is decreased.
On a local scale, both biotic factors (i.e. a declining migration of ubiquitous species with increasing
elevation) and abiotic factors play a significant role in determining the patterns of species richness
along the elevational gradient (Bruun et al., 2006). In particular, these patterns prove to be the result of
two apparently opposing driving forces, namely a diminishing species pool and a decreasing
competition intensity with elevation. Therefore, a humped-back relationship between species richness
and productivity was found at finer scales (Mittelbach et al., 2001). In more productive lowland areas,
species pools are generally larger, but species richness is restricted by competitive exclusion25
. At an
intermediate elevation, local species richness increases and reaches a maximum value as the negative
impacts of a diminishing species pool size are counterbalanced by the positive impacts of a relaxed
competition. At higher elevations, however, local species richness decreases again as a result of biotic
depauperation (Bruun et al., 2006) (figure 42).
Figure 42: Patterns of plant species richness along an elevational gradient for a local transect on a single summit (a1)
and a regional compilation of summits (a2) (McCain and Grytnes, 2010).
Another possible explanation for the higher species richness on the lowest summit is the difference in
the composition of bedrock. Vesle Armodshøkollen mainly consists of a calcareous bedrock
(Michelsen et al., 2011). This type of parent material is known to be high in nutrients which in turn
could potentially support a higher productivity and vascular plant species richness (Rey Benayas &
Scheiner, 2002; Virtanen et al., 2003). This hypothesis is also supported by Pausas and Carreras
(1995) and by Rey Benayas and Scheiner (2002) in the eastern Pyrenees, observing the highest mean
local species richness on calcareous bedrock types.
In addition, a significantly higher species richness and diversity of vascular plants was observed on the
southern aspect compared to northern aspect of the summits. The higher biotic richness of south-
facing aspects was more apparent with respect to the species diversity. In general, south-facing slopes
receive higher daily inputs of solar radiation compared to north-facing slopes. As a result, temperature,
soil moisture, nutrients and soil aggregation processes are affected. This has a substantial effect on
local vegetation as well (Klemmedson & Wienhold, 1992; Sternberg & Shoshany, 2000). Northern
24
Periglaciation is a typical geomorphological process in tundra environments resulting from seasonal thawing
of snow in areas with permafrost. As a result, the ground surface is continuously modified due to the
displacement of soil material, groundwater flow, etc. (Pidwirny, 2006). 25
Competitive exclusion means that two species competing for the same resource cannot coexist at constant
population values, provided that all other ecological factors remain constant. On the longer term, one of the two
competitors - with only the slightest advantage - will always dominate the other (Palmer, 1994).
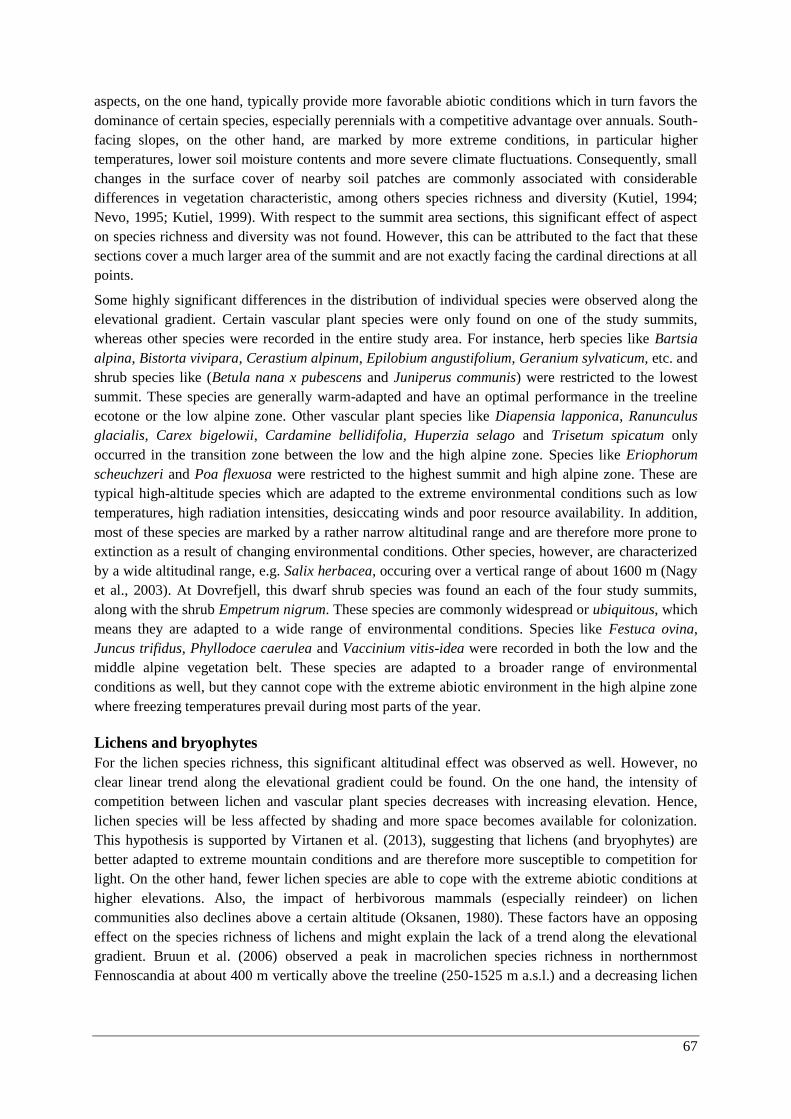
67
aspects, on the one hand, typically provide more favorable abiotic conditions which in turn favors the
dominance of certain species, especially perennials with a competitive advantage over annuals. South-
facing slopes, on the other hand, are marked by more extreme conditions, in particular higher
temperatures, lower soil moisture contents and more severe climate fluctuations. Consequently, small
changes in the surface cover of nearby soil patches are commonly associated with considerable
differences in vegetation characteristic, among others species richness and diversity (Kutiel, 1994;
Nevo, 1995; Kutiel, 1999). With respect to the summit area sections, this significant effect of aspect
on species richness and diversity was not found. However, this can be attributed to the fact that these
sections cover a much larger area of the summit and are not exactly facing the cardinal directions at all
points.
Some highly significant differences in the distribution of individual species were observed along the
elevational gradient. Certain vascular plant species were only found on one of the study summits,
whereas other species were recorded in the entire study area. For instance, herb species like Bartsia
alpina, Bistorta vivipara, Cerastium alpinum, Epilobium angustifolium, Geranium sylvaticum, etc. and
shrub species like (Betula nana x pubescens and Juniperus communis) were restricted to the lowest
summit. These species are generally warm-adapted and have an optimal performance in the treeline
ecotone or the low alpine zone. Other vascular plant species like Diapensia lapponica, Ranunculus
glacialis, Carex bigelowii, Cardamine bellidifolia, Huperzia selago and Trisetum spicatum only
occurred in the transition zone between the low and the high alpine zone. Species like Eriophorum
scheuchzeri and Poa flexuosa were restricted to the highest summit and high alpine zone. These are
typical high-altitude species which are adapted to the extreme environmental conditions such as low
temperatures, high radiation intensities, desiccating winds and poor resource availability. In addition,
most of these species are marked by a rather narrow altitudinal range and are therefore more prone to
extinction as a result of changing environmental conditions. Other species, however, are characterized
by a wide altitudinal range, e.g. Salix herbacea, occuring over a vertical range of about 1600 m (Nagy
et al., 2003). At Dovrefjell, this dwarf shrub species was found an each of the four study summits,
along with the shrub Empetrum nigrum. These species are commonly widespread or ubiquitous, which
means they are adapted to a wide range of environmental conditions. Species like Festuca ovina,
Juncus trifidus, Phyllodoce caerulea and Vaccinium vitis-idea were recorded in both the low and the
middle alpine vegetation belt. These species are adapted to a broader range of environmental
conditions as well, but they cannot cope with the extreme abiotic environment in the high alpine zone
where freezing temperatures prevail during most parts of the year.
Lichens and bryophytes
For the lichen species richness, this significant altitudinal effect was observed as well. However, no
clear linear trend along the elevational gradient could be found. On the one hand, the intensity of
competition between lichen and vascular plant species decreases with increasing elevation. Hence,
lichen species will be less affected by shading and more space becomes available for colonization.
This hypothesis is supported by Virtanen et al. (2013), suggesting that lichens (and bryophytes) are
better adapted to extreme mountain conditions and are therefore more susceptible to competition for
light. On the other hand, fewer lichen species are able to cope with the extreme abiotic conditions at
higher elevations. Also, the impact of herbivorous mammals (especially reindeer) on lichen
communities also declines above a certain altitude (Oksanen, 1980). These factors have an opposing
effect on the species richness of lichens and might explain the lack of a trend along the elevational
gradient. Bruun et al. (2006) observed a peak in macrolichen species richness in northernmost
Fennoscandia at about 400 m vertically above the treeline (250-1525 m a.s.l.) and a decreasing lichen
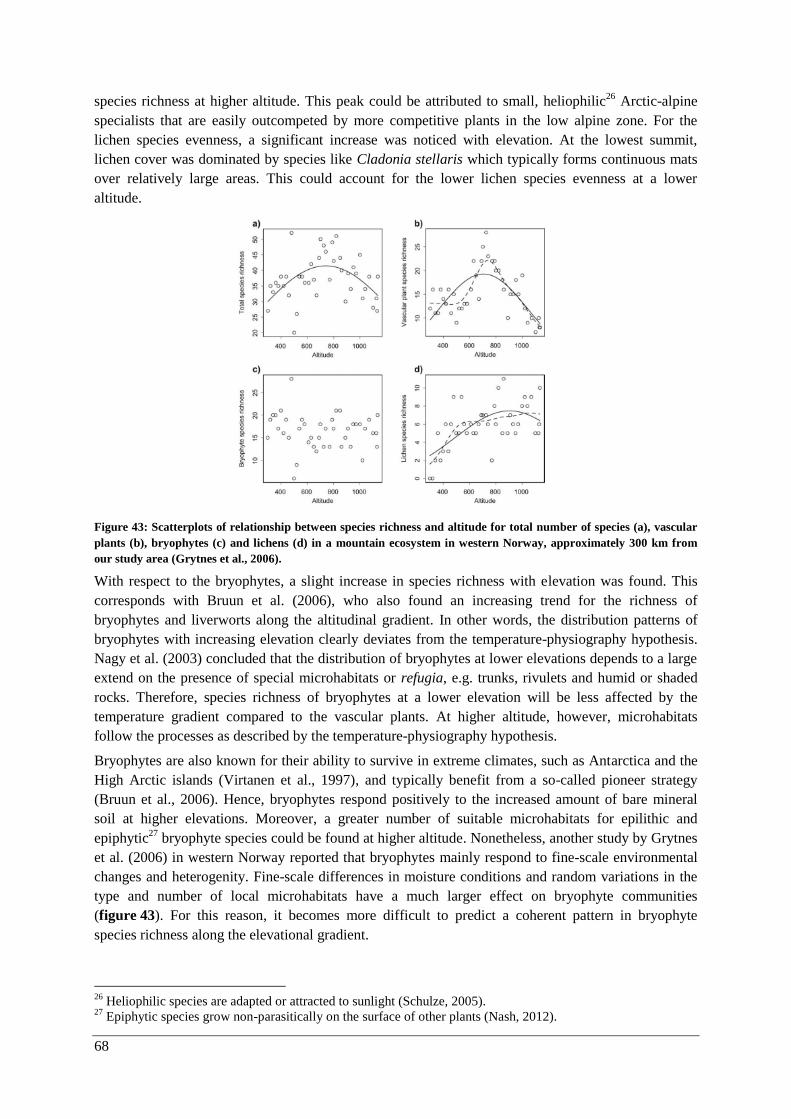
68
species richness at higher altitude. This peak could be attributed to small, heliophilic26
Arctic-alpine
specialists that are easily outcompeted by more competitive plants in the low alpine zone. For the
lichen species evenness, a significant increase was noticed with elevation. At the lowest summit,
lichen cover was dominated by species like Cladonia stellaris which typically forms continuous mats
over relatively large areas. This could account for the lower lichen species evenness at a lower
altitude.
Figure 43: Scatterplots of relationship between species richness and altitude for total number of species (a), vascular
plants (b), bryophytes (c) and lichens (d) in a mountain ecosystem in western Norway, approximately 300 km from
our study area (Grytnes et al., 2006).
With respect to the bryophytes, a slight increase in species richness with elevation was found. This
corresponds with Bruun et al. (2006), who also found an increasing trend for the richness of
bryophytes and liverworts along the altitudinal gradient. In other words, the distribution patterns of
bryophytes with increasing elevation clearly deviates from the temperature-physiography hypothesis.
Nagy et al. (2003) concluded that the distribution of bryophytes at lower elevations depends to a large
extend on the presence of special microhabitats or refugia, e.g. trunks, rivulets and humid or shaded
rocks. Therefore, species richness of bryophytes at a lower elevation will be less affected by the
temperature gradient compared to the vascular plants. At higher altitude, however, microhabitats
follow the processes as described by the temperature-physiography hypothesis.
Bryophytes are also known for their ability to survive in extreme climates, such as Antarctica and the
High Arctic islands (Virtanen et al., 1997), and typically benefit from a so-called pioneer strategy
(Bruun et al., 2006). Hence, bryophytes respond positively to the increased amount of bare mineral
soil at higher elevations. Moreover, a greater number of suitable microhabitats for epilithic and
epiphytic27
bryophyte species could be found at higher altitude. Nonetheless, another study by Grytnes
et al. (2006) in western Norway reported that bryophytes mainly respond to fine-scale environmental
changes and heterogenity. Fine-scale differences in moisture conditions and random variations in the
type and number of local microhabitats have a much larger effect on bryophyte communities
(figure 43). For this reason, it becomes more difficult to predict a coherent pattern in bryophyte
species richness along the elevational gradient.
26
Heliophilic species are adapted or attracted to sunlight (Schulze, 2005). 27
Epiphytic species grow non-parasitically on the surface of other plants (Nash, 2012).
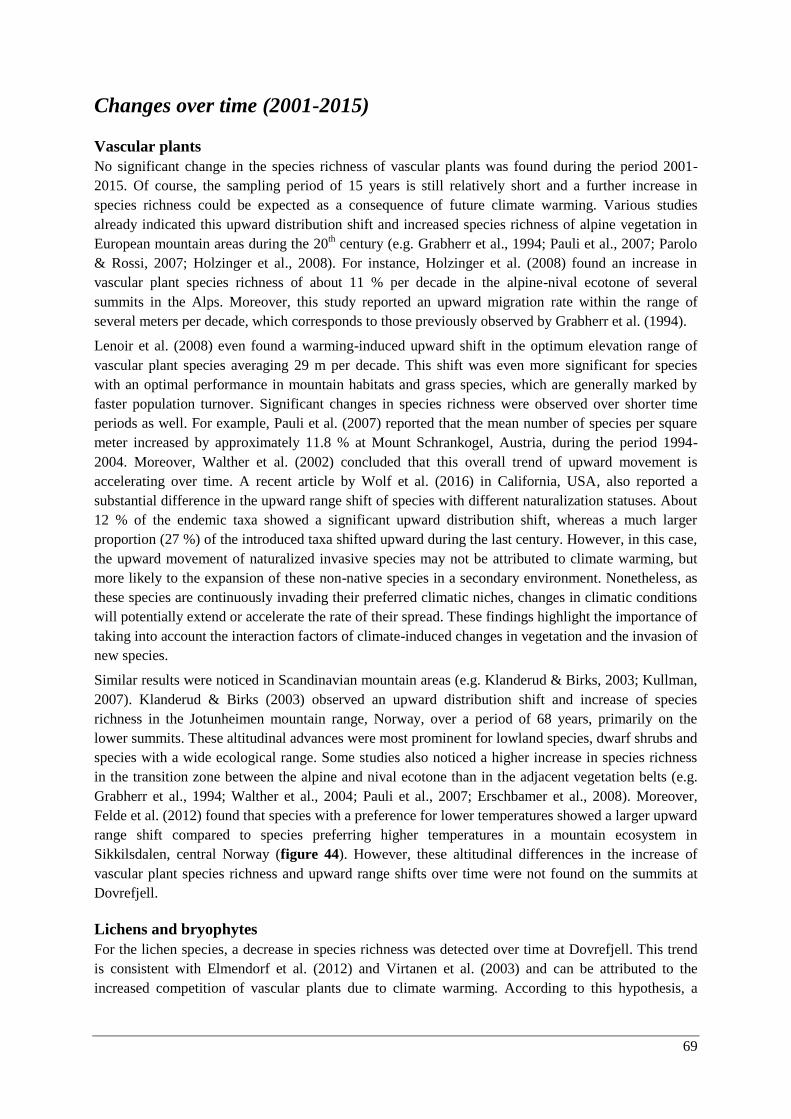
69
Changes over time (2001-2015)
Vascular plants
No significant change in the species richness of vascular plants was found during the period 2001-
2015. Of course, the sampling period of 15 years is still relatively short and a further increase in
species richness could be expected as a consequence of future climate warming. Various studies
already indicated this upward distribution shift and increased species richness of alpine vegetation in
European mountain areas during the 20th century (e.g. Grabherr et al., 1994; Pauli et al., 2007; Parolo
& Rossi, 2007; Holzinger et al., 2008). For instance, Holzinger et al. (2008) found an increase in
vascular plant species richness of about 11 % per decade in the alpine-nival ecotone of several
summits in the Alps. Moreover, this study reported an upward migration rate within the range of
several meters per decade, which corresponds to those previously observed by Grabherr et al. (1994).
Lenoir et al. (2008) even found a warming-induced upward shift in the optimum elevation range of
vascular plant species averaging 29 m per decade. This shift was even more significant for species
with an optimal performance in mountain habitats and grass species, which are generally marked by
faster population turnover. Significant changes in species richness were observed over shorter time
periods as well. For example, Pauli et al. (2007) reported that the mean number of species per square
meter increased by approximately 11.8 % at Mount Schrankogel, Austria, during the period 1994-
2004. Moreover, Walther et al. (2002) concluded that this overall trend of upward movement is
accelerating over time. A recent article by Wolf et al. (2016) in California, USA, also reported a
substantial difference in the upward range shift of species with different naturalization statuses. About
12 % of the endemic taxa showed a significant upward distribution shift, whereas a much larger
proportion (27 %) of the introduced taxa shifted upward during the last century. However, in this case,
the upward movement of naturalized invasive species may not be attributed to climate warming, but
more likely to the expansion of these non-native species in a secondary environment. Nonetheless, as
these species are continuously invading their preferred climatic niches, changes in climatic conditions
will potentially extend or accelerate the rate of their spread. These findings highlight the importance of
taking into account the interaction factors of climate-induced changes in vegetation and the invasion of
new species.
Similar results were noticed in Scandinavian mountain areas (e.g. Klanderud & Birks, 2003; Kullman,
2007). Klanderud & Birks (2003) observed an upward distribution shift and increase of species
richness in the Jotunheimen mountain range, Norway, over a period of 68 years, primarily on the
lower summits. These altitudinal advances were most prominent for lowland species, dwarf shrubs and
species with a wide ecological range. Some studies also noticed a higher increase in species richness
in the transition zone between the alpine and nival ecotone than in the adjacent vegetation belts (e.g.
Grabherr et al., 1994; Walther et al., 2004; Pauli et al., 2007; Erschbamer et al., 2008). Moreover,
Felde et al. (2012) found that species with a preference for lower temperatures showed a larger upward
range shift compared to species preferring higher temperatures in a mountain ecosystem in
Sikkilsdalen, central Norway (figure 44). However, these altitudinal differences in the increase of
vascular plant species richness and upward range shifts over time were not found on the summits at
Dovrefjell.
Lichens and bryophytes
For the lichen species, a decrease in species richness was detected over time at Dovrefjell. This trend
is consistent with Elmendorf et al. (2012) and Virtanen et al. (2003) and can be attributed to the
increased competition of vascular plants due to climate warming. According to this hypothesis, a
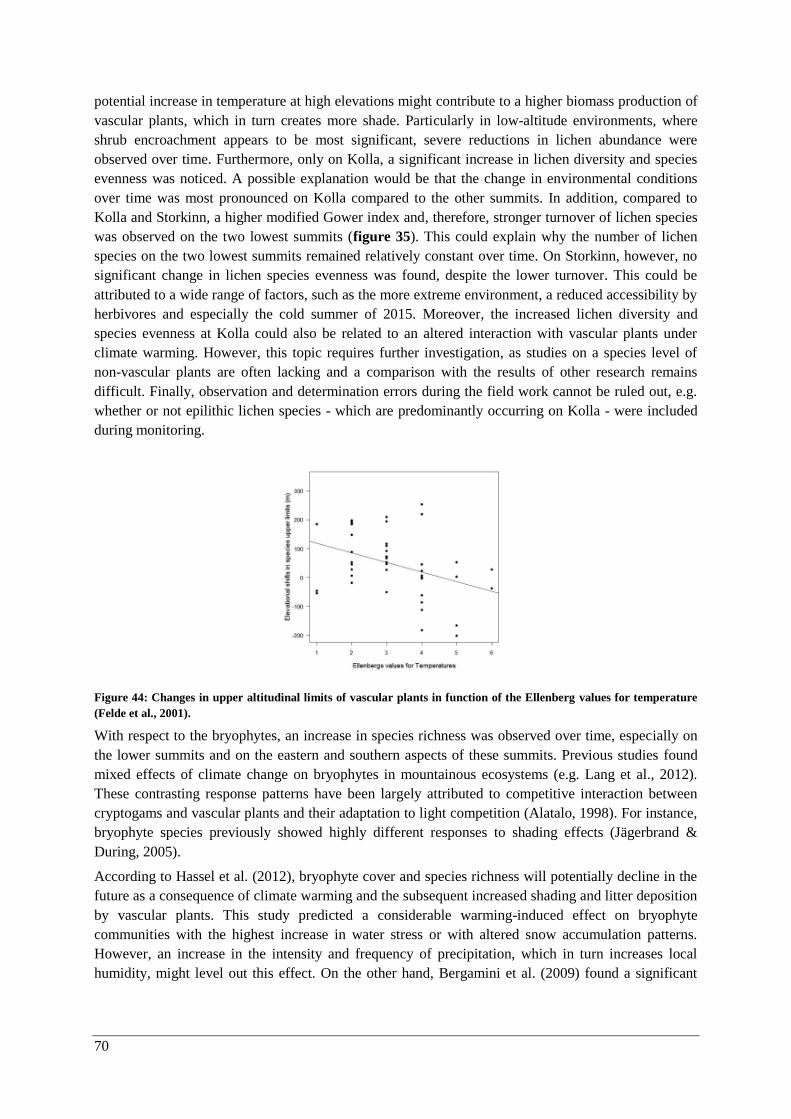
70
potential increase in temperature at high elevations might contribute to a higher biomass production of
vascular plants, which in turn creates more shade. Particularly in low-altitude environments, where
shrub encroachment appears to be most significant, severe reductions in lichen abundance were
observed over time. Furthermore, only on Kolla, a significant increase in lichen diversity and species
evenness was noticed. A possible explanation would be that the change in environmental conditions
over time was most pronounced on Kolla compared to the other summits. In addition, compared to
Kolla and Storkinn, a higher modified Gower index and, therefore, stronger turnover of lichen species
was observed on the two lowest summits (figure 35). This could explain why the number of lichen
species on the two lowest summits remained relatively constant over time. On Storkinn, however, no
significant change in lichen species evenness was found, despite the lower turnover. This could be
attributed to a wide range of factors, such as the more extreme environment, a reduced accessibility by
herbivores and especially the cold summer of 2015. Moreover, the increased lichen diversity and
species evenness at Kolla could also be related to an altered interaction with vascular plants under
climate warming. However, this topic requires further investigation, as studies on a species level of
non-vascular plants are often lacking and a comparison with the results of other research remains
difficult. Finally, observation and determination errors during the field work cannot be ruled out, e.g.
whether or not epilithic lichen species - which are predominantly occurring on Kolla - were included
during monitoring.
Figure 44: Changes in upper altitudinal limits of vascular plants in function of the Ellenberg values for temperature
(Felde et al., 2001).
With respect to the bryophytes, an increase in species richness was observed over time, especially on
the lower summits and on the eastern and southern aspects of these summits. Previous studies found
mixed effects of climate change on bryophytes in mountainous ecosystems (e.g. Lang et al., 2012).
These contrasting response patterns have been largely attributed to competitive interaction between
cryptogams and vascular plants and their adaptation to light competition (Alatalo, 1998). For instance,
bryophyte species previously showed highly different responses to shading effects (Jägerbrand &
During, 2005).
According to Hassel et al. (2012), bryophyte cover and species richness will potentially decline in the
future as a consequence of climate warming and the subsequent increased shading and litter deposition
by vascular plants. This study predicted a considerable warming-induced effect on bryophyte
communities with the highest increase in water stress or with altered snow accumulation patterns.
However, an increase in the intensity and frequency of precipitation, which in turn increases local
humidity, might level out this effect. On the other hand, Bergamini et al. (2009) found a significant
71
mean increase in altitude of cryophilous28
bryophyte species with approximately 24 m per decade in
the Swiss Alps. On a longer term, this upward distribution shift might lead to an increased species
diversity at higher elevations.
Species composition
Species composition of vascular plants in the quadrats and the summit area sections also differed
significantly between the four summits. This can be attributed to the fact that each summit was
selected within a different vegetation zone along the elevational gradient. Each vegetation zone is
marked by different environmental conditions (e.g. temperature, humidity, soil composition, solar
radiation, etc.) with a distinctive effect on the pool of species with an optimal performance in that
specific zone. Vascular plant communities in the treeline ecotone and low alpine belt are commonly
covered by a close vegetation carpet which is dominated by alpine meadows, heaths and dwarf shrubs.
At a higher elevation, vegetation becomes more subjected to frost and desiccating winds. In the alpine
vegetation belt, vascular plants generally occur in patches and at locations which provide sufficient
shelter from heavy winds. This zone is typically, occupied by patchy grassland, sedges and rush heats.
In the nival belt and close to the limits of plant survival, snow cover occurs during a large part of the
year and vegetation is strictly limited to a few rare alpine species that are adapted to the extreme
environmental conditions (Nagy & Grabherr, 2009).
A significant effect of aspect on species composition of vascular plants in the quadrats and the summit
area sections was noticed as well. On the one hand, south-facing slopes typically contained more light-
loving species which are resistant to the lower soil moisture supply. On the other hand, northern
aspects are characterized by lower inputs of solar radiation and a higher resource availability. This
effect was previously demonstrated by Kutiel (1993) in Mediterranean mountain ecosystems, reporting
a higher abundance of annual herbaceous plants on south-facing slopes.
In addition, species composition of vascular plants changed significantly over time in the summit area
sections of all four summits. This change can be attributed to the increased cover of shrubs like Betula
nana (3.06 %), dwarf shrubs like Vaccinium uliginosum (0.084 %) and Vaccinium vitis-idea (0.532 %)
and graminoids like Festuca ovina (0.442 %) and Juncus trifidus (0.184 %), especially at lower
elevations. These findings are consistent with Klanderud and Birks (2003), also indicating an
increasing cover of local lee-slope species (e.g. Avenella flexuosa, Vaccinium myrtillus, Vaccinium
uliginosum, Phyllodoce caerulea and some Salix species) in Jotunheimen, Norway, not only at
elevations where they already occurred, but also towards a higher altitude. Furthermore, typical
species of exposed ridges (e.g. Juncus trifidus, Luzula spicata, Festuca vivipara and some Carex
species) expanded their range within the study area. Also, shrubs like Empetrum nigrum and dwarf
shrubs like Vaccinium uliginosum and Vaccinium myrtillus showed the largest response over time.
Their upward range shift could be largely attributed to an increase in both the length of the snow-free
period and the length of the growing period due to the ongoing climate change. Moreover, these
species mainly belong to mesophilous heaths and are expected to invade snow beds together with
other lee-slope species as the duration of snow cover gradually decreases. These observation were also
made by Bahn and Körner (2003), reporting that graminoids, dwarf shrubs and viviparous and
hemiparasitic species showed the largest increase in cover in the Austrian Alps over a period of about
13 years. In addition, they made notice of a distinctive shrub invasion of grasslands by Vaccinium
uliginosum in the alpine vegetation belt.
28
Cryophilous species generally prefer and thrive in cold envirnoments (Schulze, 2005).
72
At Dovrefjell, the shrub species Betula nana showed the most substantial change in cover percentage
with an increase of about 3 % over a period of 15 years. This rate is similar to the one reported by
Cannone et al. (2007), who found an average increase in the cover of shrubs and dwarf shrubs of
approximately 1.9 % per decade, with the highest expansion rates in the alpine vegetation belt.
According to this study, dwarf shrubs which are typical for windswept areas (e.g. Loiseleuria
procumbens, Vaccinium uliginusum and Vaccinium vitis-idea) showed an increase in cover as a
response to a shorter snow cover season. Alpine grassland experienced an upward migration as well,
replacing the gradually disappearing snow beds (figure 45). However, on the study summits at
Dovrefjell, this increase was only found for the two Vaccinium species.
Finally, lichens and bryophytes also showed a significant change in species composition over time.
According to a climate-warming experiment by Elmendorf et al. (2012) and a field study in Alaska by
Chapin et al. (1995), lichen species generally respond with a decrease in cover to warming
temperatures. Most probably, this could be mainly attributed to the expansion and eventual
overgrowth of lichen species by vascular plants, especially dwarf shrubs. However, the interaction
with other abiotic and biotic factors such as reindeer grazing could not be ruled out (Cornelissen et al.,
2001). This decrease in cover was also observed at Dovrefjell for Cladonia arbusculata and
Umbilicaria, Ochrolechia and Pseudephebe species. Moreover, another study by Trivedi et al. (2008a)
confirmed that lichens associated with montane heaths (e.g. Cladonia arbuscula and Cladonia
uncialis) are expected to lose suitable bioclimatic change as a result of climate warming. For the
bryophytes, Jägerbrand et al. (2012) found a negative effect of the increasing abundance of deciduous
and evergreen shrubs in heath areas. Moreover, bryophyte species are characterized by the absence of
true roots, which makes them more susceptible to a water deficiency in a warmer, drier environment
(Potter et al., 1995). These factors might explain the change in bryophyte species composition over
time.
Figure 45: Shrub distribution on the Stelvio Pass, central Italian Alps in 1953 (a) and 2003 (b). Color codes: brown =
dwarf shrub association (Loiseleurietum-Cetrarietum), green= mosaic between dwarf shrubs and alpine grassland,
blue = mosaic between dwarf shrubs and snowbeds, magenta = alpine shrub association (Rhodoreto-Vaccinietum)
(Cannone et al., 2007).
The highest values for the modified Gower dissimilarity index of vascular plants were noticed for the
period 2001-2015. For the periods 2001-2008 and 2008-2015, relatively similar values for the
dissimilarity index for vascular plants were found on all summits, except Storkinn. In other words,
species composition of vascular plants in the quadrats experienced a much larger change over the
entire sampling period of 15 years compared to the two sub-periods. This is in line with Gottfried et al.
73
(2012), stating that alpine plants are long-lived (de Witte & Stoecklin, 2010) and the internal processes
in plant communities occur at a slow rate (Körner, 2003). Hence, species cover will show a distinct
trend over time rather than inter-annual variability. This statement supports the hypothesis of a lag-
effect in the response of vegetation to climate warming and might also explain why changes in species
richness and distribution are still being observed at Dovrefjell despite the current absence of a clear
upward trend in temperature.
In addition, the modified Gower dissimilarity index for vascular plants and lichens decreased with
increasing elevation. This indicates that the species composition altered to a much larger extent at a
lower elevation, namely in the treeline ecotone and low alpine zone. At higher altitude, especially near
the limits of plant life, species composition largely remained unchanged over time. This could also be
attributed to the prominent invasion of shrubs and dwarf shrubs at lower elevations which was
previously observed in other mountain areas by Bahn and Körner (2003) in Austria and Cannone et al.
(2007) in Italy. As a result of this increased cover of shrubs, lichens are gradually overgrown which in
turn also explains the highest change in lichen species composition at a lower altitude. Moreover,
Michelsen et al. (2011) concluded that the lowest study summit at Dovrefjell contained more potential
invaders and a larger number of species with the ability to respond to environmental changes over time
by expanding or diminishing their cover. This study also showed that temperature changes and the
subsequent warming-induced effect on vegetation were more pronounced at the two lowest summits
during the period 2001-2008.
Thermophilization
The significant effect of altitude on the thermic vegetation indicator of vascular plants can be
attributed to the fact that each summit was selected in a different vegetation zone along the elevational
gradient. As a result, these summits each contain typical species with an optimum performance in that
specific vegetation zone. For instance, the lower summits generally contain warm-adapted species
with an optimum performance in lower positions along the altitudinal gradient, especially in the
treeline ecotone or alpine zone, and are marked with a higher altitudinal rank. Consequently, lower
summits generally have a significantly higher thermic vegetation indicator. However, the lowest
values were found for Kolla, which is only the second highest summit. In the quadrats of Kolla,
generally cold-adapted species with a low altitudinal rank were found, namely Carex bigelowii (2),
Luzula arcuata (2), Ranunculus glacialis (1), Salix herbacea (3) and Saxifraga cespitiosa (2), whereas
in the quadrats of Storkinn, only two vascular plant species were recorded, including Huperzia selago
with a high altitudinal rank (4). Furthermore, a higher amount of warm-adapted species and higher
thermic vegetation indicator is expected for the southern aspect since this side of the mountain
receives substantially higher inputs of solar radiation on a daily basis and has therefore a higher
temperature. On the other hand, quadrats on the northern aspects are expected to contain more cold-
adapted species which results in a lower higher thermic vegetation indicator. This hypothesis is only
confirmed for the lowest summit.
With respect to the thermophilization indicator of the vascular plants, positive values were found for
the two lowest summits during the period 2001-2008. These results indicate the occurrence of
thermophilization (i.e. the decline in the abundance of cold-adapted species and the increase in the
abundance of thermophilic species in mountain ecosystems) and might result from an increased cover
and/or migration of species with a higher rank and a lower elevational range (thermophilic species)
and/or the decline of species with a lower rank and a higher elevational range (cryophilic species).
These results are in line with Gottfried et al. (2012), reporting an upward shift in the distribution of
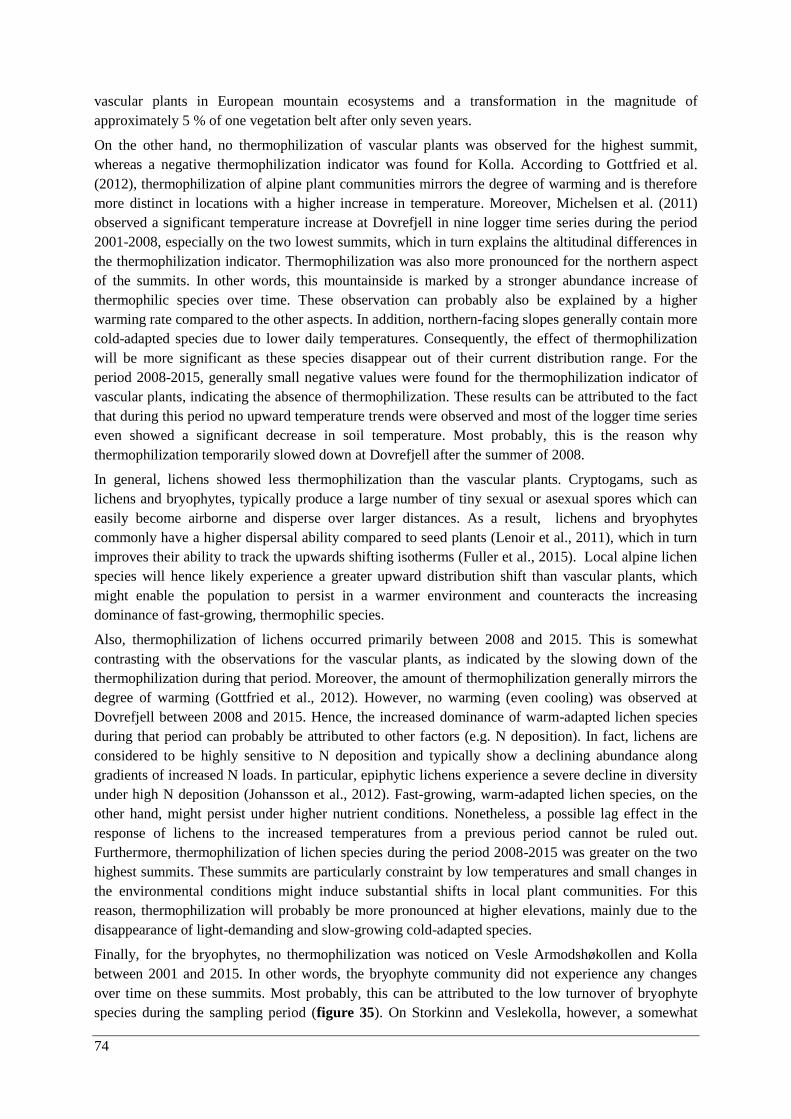
74
vascular plants in European mountain ecosystems and a transformation in the magnitude of
approximately 5 % of one vegetation belt after only seven years.
On the other hand, no thermophilization of vascular plants was observed for the highest summit,
whereas a negative thermophilization indicator was found for Kolla. According to Gottfried et al.
(2012), thermophilization of alpine plant communities mirrors the degree of warming and is therefore
more distinct in locations with a higher increase in temperature. Moreover, Michelsen et al. (2011)
observed a significant temperature increase at Dovrefjell in nine logger time series during the period
2001-2008, especially on the two lowest summits, which in turn explains the altitudinal differences in
the thermophilization indicator. Thermophilization was also more pronounced for the northern aspect
of the summits. In other words, this mountainside is marked by a stronger abundance increase of
thermophilic species over time. These observation can probably also be explained by a higher
warming rate compared to the other aspects. In addition, northern-facing slopes generally contain more
cold-adapted species due to lower daily temperatures. Consequently, the effect of thermophilization
will be more significant as these species disappear out of their current distribution range. For the
period 2008-2015, generally small negative values were found for the thermophilization indicator of
vascular plants, indicating the absence of thermophilization. These results can be attributed to the fact
that during this period no upward temperature trends were observed and most of the logger time series
even showed a significant decrease in soil temperature. Most probably, this is the reason why
thermophilization temporarily slowed down at Dovrefjell after the summer of 2008.
In general, lichens showed less thermophilization than the vascular plants. Cryptogams, such as
lichens and bryophytes, typically produce a large number of tiny sexual or asexual spores which can
easily become airborne and disperse over larger distances. As a result, lichens and bryophytes
commonly have a higher dispersal ability compared to seed plants (Lenoir et al., 2011), which in turn
improves their ability to track the upwards shifting isotherms (Fuller et al., 2015). Local alpine lichen
species will hence likely experience a greater upward distribution shift than vascular plants, which
might enable the population to persist in a warmer environment and counteracts the increasing
dominance of fast-growing, thermophilic species.
Also, thermophilization of lichens occurred primarily between 2008 and 2015. This is somewhat
contrasting with the observations for the vascular plants, as indicated by the slowing down of the
thermophilization during that period. Moreover, the amount of thermophilization generally mirrors the
degree of warming (Gottfried et al., 2012). However, no warming (even cooling) was observed at
Dovrefjell between 2008 and 2015. Hence, the increased dominance of warm-adapted lichen species
during that period can probably be attributed to other factors (e.g. N deposition). In fact, lichens are
considered to be highly sensitive to N deposition and typically show a declining abundance along
gradients of increased N loads. In particular, epiphytic lichens experience a severe decline in diversity
under high N deposition (Johansson et al., 2012). Fast-growing, warm-adapted lichen species, on the
other hand, might persist under higher nutrient conditions. Nonetheless, a possible lag effect in the
response of lichens to the increased temperatures from a previous period cannot be ruled out.
Furthermore, thermophilization of lichen species during the period 2008-2015 was greater on the two
highest summits. These summits are particularly constraint by low temperatures and small changes in
the environmental conditions might induce substantial shifts in local plant communities. For this
reason, thermophilization will probably be more pronounced at higher elevations, mainly due to the
disappearance of light-demanding and slow-growing cold-adapted species.
Finally, for the bryophytes, no thermophilization was noticed on Vesle Armodshøkollen and Kolla
between 2001 and 2015. In other words, the bryophyte community did not experience any changes
over time on these summits. Most probably, this can be attributed to the low turnover of bryophyte
species during the sampling period (figure 35). On Storkinn and Veslekolla, however, a somewhat
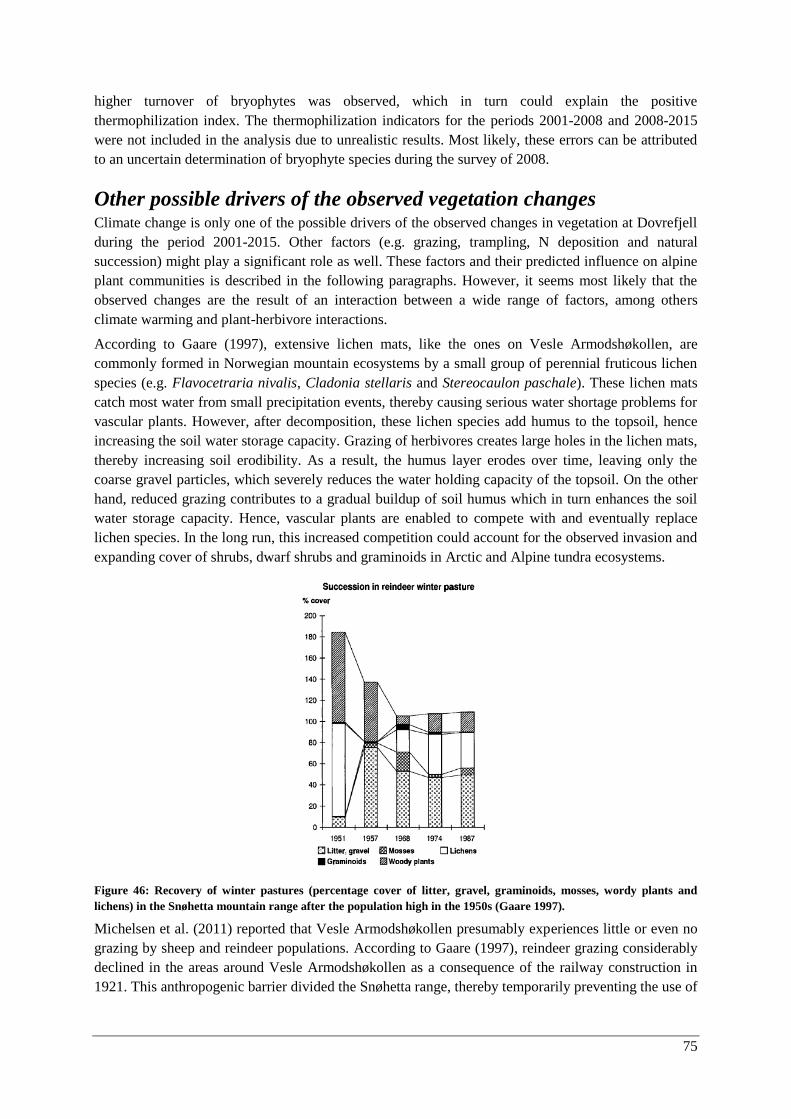
75
higher turnover of bryophytes was observed, which in turn could explain the positive
thermophilization index. The thermophilization indicators for the periods 2001-2008 and 2008-2015
were not included in the analysis due to unrealistic results. Most likely, these errors can be attributed
to an uncertain determination of bryophyte species during the survey of 2008.
Other possible drivers of the observed vegetation changes Climate change is only one of the possible drivers of the observed changes in vegetation at Dovrefjell
during the period 2001-2015. Other factors (e.g. grazing, trampling, N deposition and natural
succession) might play a significant role as well. These factors and their predicted influence on alpine
plant communities is described in the following paragraphs. However, it seems most likely that the
observed changes are the result of an interaction between a wide range of factors, among others
climate warming and plant-herbivore interactions.
According to Gaare (1997), extensive lichen mats, like the ones on Vesle Armodshøkollen, are
commonly formed in Norwegian mountain ecosystems by a small group of perennial fruticous lichen
species (e.g. Flavocetraria nivalis, Cladonia stellaris and Stereocaulon paschale). These lichen mats
catch most water from small precipitation events, thereby causing serious water shortage problems for
vascular plants. However, after decomposition, these lichen species add humus to the topsoil, hence
increasing the soil water storage capacity. Grazing of herbivores creates large holes in the lichen mats,
thereby increasing soil erodibility. As a result, the humus layer erodes over time, leaving only the
coarse gravel particles, which severely reduces the water holding capacity of the topsoil. On the other
hand, reduced grazing contributes to a gradual buildup of soil humus which in turn enhances the soil
water storage capacity. Hence, vascular plants are enabled to compete with and eventually replace
lichen species. In the long run, this increased competition could account for the observed invasion and
expanding cover of shrubs, dwarf shrubs and graminoids in Arctic and Alpine tundra ecosystems.
Figure 46: Recovery of winter pastures (percentage cover of litter, gravel, graminoids, mosses, wordy plants and
lichens) in the Snøhetta mountain range after the population high in the 1950s (Gaare 1997).
Michelsen et al. (2011) reported that Vesle Armodshøkollen presumably experiences little or even no
grazing by sheep and reindeer populations. According to Gaare (1997), reindeer grazing considerably
declined in the areas around Vesle Armodshøkollen as a consequence of the railway construction in
1921. This anthropogenic barrier divided the Snøhetta range, thereby temporarily preventing the use of

76
the natural east-west migration route by the small reindeer population. Despite the presence of this
railway and a parallel highway, former migration routes were re-established when the local reindeer
population started to grow again (Skogland & Mølmen, 1980; Skogland, 1986). According to the local
residents, these routes were frequently used for spring and autumn migration during the period 1957-
1983. However, the use of the eastern winter ranges subsequently declined and has not been reported
ever since 1985. As a result, grazing pressure from reindeer was restricted in that area before the first
analysis in 2001 which could have created excellent conditions for the establishment of a soil humus
layer and the predicted increase in cover of vascular plants at the expense of lichens (Michelsen et al.,
2011) (figure 46).
Michelsen et al. (2011) also proposed that the difference in the tolerance to grazing between coexisting
shrub species can be addressed as a possible indicator for the observed changes in a plant community
over time. For instance, according to a study by Pajunen et al. (2008) in a forest-tundra ecotonal area
in northwestern Finnish Lapland, the total cover of vegetation, along with the cover and height of
shrubs, dwarf shrubs, forbs and grasses, increased significantly after an 8-year exclusion of grazing
reindeer (figure 47). More specifically, willow shrubs that are commonly preferred by reindeer (e.g.
Salix glauca and Salix phylicifolia) experienced a substantial increase in cover. This was consistent
with previous studies in Arctic-alpine ecosystems (e.g. Quellet et al., 1994; Manseau et al., 2004). In
addition, the cover of Betula nana increased in the absence of reindeer grazing, primarily in low-
productive tundra heaths. In more productive habitats, the effect of exclosures on Betula nana seemed
much less obvious and depended to a large extent on small-scale habitat heterogeneity. Furthermore,
Austrheim et al. (2008) showed that Betula nana increases its cover under moderate grazing, whereas
its cover decreases under a higher grazing pressure. The exclusion of reindeer grazing also contributed
to an increase in cover of dwarf shrubs, however, opposed to willows and Betula nana, the effect of
reduced grazing was independent of the habitat type. Dwarf shrubs like Vaccinium vitis-idea and
Empetrum nigrum are commonly not preferred by reindeer as a forage plant (Warenberg et al., 1997),
however, on a long time scale, reindeer grazing is expected to reduce their abundance. Moreover,
Vaccinium vitis-idea is a slow-growing evergreen plant that cannot compensate biomass losses under a
high grazing pressure and frequent trampling. Finally, Austrheim and Eriksson (2001) observed an
increase in vascular plant species richness in the most productive areas and a decline in the low-
productive habitats.
In addition, trampling is held responsible for the extirpation of rare species, the creation of more bare
ground surfaces and a gradual speed up of local erosion processes (Zika, 1991). A trampling
experiment by Cole and Monz (2002) in five high-elevation plant communities in the Wind River
Mountains (Wyoming, USA) showed that low levels of trampling leaded to a strong reduction in
vegetation cover and height, whereas a higher trampling intensity was associated with a much lower
rate of change. Moreover, different plant communities were characterized by a varying ability to
tolerate the disturbance from trampling, suggesting that the use of more tolerant plant communities
could be adopted as an appropriate mitigation strategy to reduce the impacts of trampling. In
particular, plant communities dominated by a woody, chamaephytic groundcover were much less
resilient than plant communities dominated by turf-forming, caespitose graminoids or forbs with a
matted or rosette growth form.
Grazing and trampling pressure by reindeer has not yet been quantified for this study area, leaving a
considerable uncertainty about what response to expect from vegetation. Nonetheless, observations
from Syverhuset (2009) indicated that the number of herbivores increased in the Dovrefjell mountain
range during the last years (Syherhuset, 2009). Consequently, a potential increase of the grazing
pressure might also be addressed as one of the possible drivers of the increased vascular plant species
richness, especially on the lowest summit. However, this hypothesis is not supported by the observed
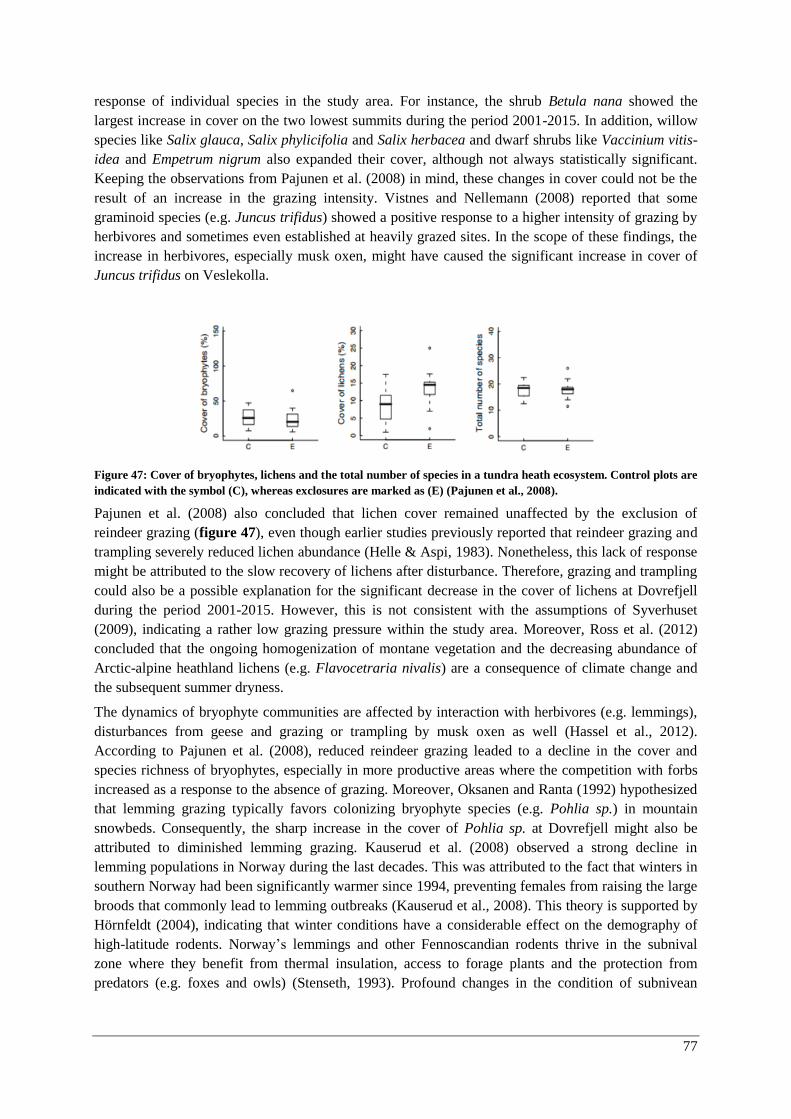
77
response of individual species in the study area. For instance, the shrub Betula nana showed the
largest increase in cover on the two lowest summits during the period 2001-2015. In addition, willow
species like Salix glauca, Salix phylicifolia and Salix herbacea and dwarf shrubs like Vaccinium vitis-
idea and Empetrum nigrum also expanded their cover, although not always statistically significant.
Keeping the observations from Pajunen et al. (2008) in mind, these changes in cover could not be the
result of an increase in the grazing intensity. Vistnes and Nellemann (2008) reported that some
graminoid species (e.g. Juncus trifidus) showed a positive response to a higher intensity of grazing by
herbivores and sometimes even established at heavily grazed sites. In the scope of these findings, the
increase in herbivores, especially musk oxen, might have caused the significant increase in cover of
Juncus trifidus on Veslekolla.
Figure 47: Cover of bryophytes, lichens and the total number of species in a tundra heath ecosystem. Control plots are
indicated with the symbol (C), whereas exclosures are marked as (E) (Pajunen et al., 2008).
Pajunen et al. (2008) also concluded that lichen cover remained unaffected by the exclusion of
reindeer grazing (figure 47), even though earlier studies previously reported that reindeer grazing and
trampling severely reduced lichen abundance (Helle & Aspi, 1983). Nonetheless, this lack of response
might be attributed to the slow recovery of lichens after disturbance. Therefore, grazing and trampling
could also be a possible explanation for the significant decrease in the cover of lichens at Dovrefjell
during the period 2001-2015. However, this is not consistent with the assumptions of Syverhuset
(2009), indicating a rather low grazing pressure within the study area. Moreover, Ross et al. (2012)
concluded that the ongoing homogenization of montane vegetation and the decreasing abundance of
Arctic-alpine heathland lichens (e.g. Flavocetraria nivalis) are a consequence of climate change and
the subsequent summer dryness.
The dynamics of bryophyte communities are affected by interaction with herbivores (e.g. lemmings),
disturbances from geese and grazing or trampling by musk oxen as well (Hassel et al., 2012).
According to Pajunen et al. (2008), reduced reindeer grazing leaded to a decline in the cover and
species richness of bryophytes, especially in more productive areas where the competition with forbs
increased as a response to the absence of grazing. Moreover, Oksanen and Ranta (1992) hypothesized
that lemming grazing typically favors colonizing bryophyte species (e.g. Pohlia sp.) in mountain
snowbeds. Consequently, the sharp increase in the cover of Pohlia sp. at Dovrefjell might also be
attributed to diminished lemming grazing. Kauserud et al. (2008) observed a strong decline in
lemming populations in Norway during the last decades. This was attributed to the fact that winters in
southern Norway had been significantly warmer since 1994, preventing females from raising the large
broods that commonly lead to lemming outbreaks (Kauserud et al., 2008). This theory is supported by
Hörnfeldt (2004), indicating that winter conditions have a considerable effect on the demography of
high-latitude rodents. Norway’s lemmings and other Fennoscandian rodents thrive in the subnival
zone where they benefit from thermal insulation, access to forage plants and the protection from
predators (e.g. foxes and owls) (Stenseth, 1993). Profound changes in the condition of subnivean
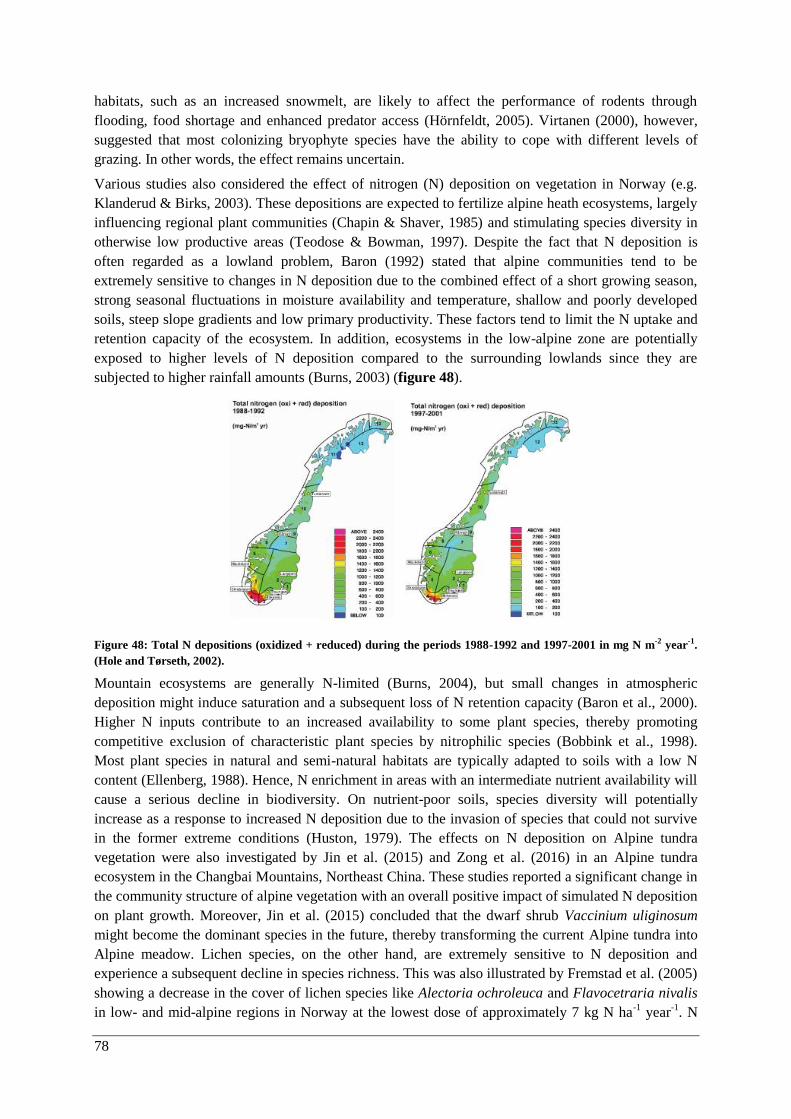
78
habitats, such as an increased snowmelt, are likely to affect the performance of rodents through
flooding, food shortage and enhanced predator access (Hörnfeldt, 2005). Virtanen (2000), however,
suggested that most colonizing bryophyte species have the ability to cope with different levels of
grazing. In other words, the effect remains uncertain.
Various studies also considered the effect of nitrogen (N) deposition on vegetation in Norway (e.g.
Klanderud & Birks, 2003). These depositions are expected to fertilize alpine heath ecosystems, largely
influencing regional plant communities (Chapin & Shaver, 1985) and stimulating species diversity in
otherwise low productive areas (Teodose & Bowman, 1997). Despite the fact that N deposition is
often regarded as a lowland problem, Baron (1992) stated that alpine communities tend to be
extremely sensitive to changes in N deposition due to the combined effect of a short growing season,
strong seasonal fluctuations in moisture availability and temperature, shallow and poorly developed
soils, steep slope gradients and low primary productivity. These factors tend to limit the N uptake and
retention capacity of the ecosystem. In addition, ecosystems in the low-alpine zone are potentially
exposed to higher levels of N deposition compared to the surrounding lowlands since they are
subjected to higher rainfall amounts (Burns, 2003) (figure 48).
Figure 48: Total N depositions (oxidized + reduced) during the periods 1988-1992 and 1997-2001 in mg N m-2 year-1.
(Hole and Tørseth, 2002).
Mountain ecosystems are generally N-limited (Burns, 2004), but small changes in atmospheric
deposition might induce saturation and a subsequent loss of N retention capacity (Baron et al., 2000).
Higher N inputs contribute to an increased availability to some plant species, thereby promoting
competitive exclusion of characteristic plant species by nitrophilic species (Bobbink et al., 1998).
Most plant species in natural and semi-natural habitats are typically adapted to soils with a low N
content (Ellenberg, 1988). Hence, N enrichment in areas with an intermediate nutrient availability will
cause a serious decline in biodiversity. On nutrient-poor soils, species diversity will potentially
increase as a response to increased N deposition due to the invasion of species that could not survive
in the former extreme conditions (Huston, 1979). The effects on N deposition on Alpine tundra
vegetation were also investigated by Jin et al. (2015) and Zong et al. (2016) in an Alpine tundra
ecosystem in the Changbai Mountains, Northeast China. These studies reported a significant change in
the community structure of alpine vegetation with an overall positive impact of simulated N deposition
on plant growth. Moreover, Jin et al. (2015) concluded that the dwarf shrub Vaccinium uliginosum
might become the dominant species in the future, thereby transforming the current Alpine tundra into
Alpine meadow. Lichen species, on the other hand, are extremely sensitive to N deposition and
experience a subsequent decline in species richness. This was also illustrated by Fremstad et al. (2005)
showing a decrease in the cover of lichen species like Alectoria ochroleuca and Flavocetraria nivalis
in low- and mid-alpine regions in Norway at the lowest dose of approximately 7 kg N ha-1
year-1
. N

79
deposition should also be taken into account when trying to explain the changes in species richness
and composition at Dovrefjell. However, the annual N deposition rate at Dovrefjell is only estimated
at about 2 to 4 kg N ha-1
year-1
(Paal et al., 1997). Also, total N deposition decreased in Norway from
about 154856 tons per year to 140321 tons per year between 2002 and 2011 (Aas et al., 2012).
Therefore, it seems less plausible that aerial fertilization was responsible for the observed changes in
vegetation in the study area.
Finally, the ongoing changes in vegetation at Dovrefjell might also be considered as a long-term lag-
response to postglacial warming. Svenning and Skov (2007) investigated the probability of Ice Age
legacies in the geographical distribution of tree species richness on the European continent. They
concluded that many tree species (e.g. Querus robur and Fagus sylvatica) have probably not reached
an equilibrium with the prevailing climatic conditions in Central and Northern Europe since the Last
Glacial Maximum (21.000 years ago). Hence, tree species distribution in these regions has not yet
reached its potential range under the current climate and tree migration rates are therefore
experiencing an impact of the previous glacial climate conditions (figure 49).
Figure 49: Current native distribution of temperate tree species (dots) and their climatic potential range (shading)
estimated using a bioclimatic envelope model (Svenning & Skov, 2007).
Moreover, vegetation in tundra ecosystems is still recovering from the Little Ice Age. Many tundra
plant species still have not reached a distribution that corresponds with the current climate forcings.
Hence, plant community shifts in tundra ecosystems and shrub encroachment can also be considered
as a delayed effect of natural succession. Klanderud and Birks (2003) reported that most of the species
that showed a decreasing abundance in the last few decades at Jotunheimen (e.g. Oxyria digyna,
Trisetum spicatum and some Cerastium and Saxifraga species) can be categorized as pioneers and are
characteristic for early successional stages. However, as succession gradually proceeds towards a more
mature plant community, these species will be easily substituted by species which are more
characteristic for a later successional stage (e.g. Avenella flexuosa, Empetrum nigrum and some
Vaccinium and Salix species). This is also in line with the observations at Dovrefjell where willow
species as well as dwarf shrubs experienced an increase in cover and abundance throughout the last
decade. Therefore, natural succession cannot be ruled out as a possible driver for the observed
vegetation changes.
80
Conclusion
The long-term temperature record from the weather station of Gammel-Fokstugu showed a strong and
significant upward trend throughout the period 1900-2014. However, during the last decade, the rate
of warming air temperatures slowed down. These observations are consistent with the current hiatus in
global warming. This was also reflected in the soil temperature data from the GLORIA summits from
the Dovrefjell target region, indicating a significantly declining soil temperature during the measuring
period 2001-2015. The cause of this phenomenon has been previously discussed in scientific literature
and might be attributed to natural fluctuations in the global climate which are related to ENSO and
variations in the sea surface temperature. Precipitation data from Gammel-Fokstugu showed a large
inter-annual variation. However, during the last 15 years, significantly higher precipitation amounts
were recorded compared to the long-term average from the period 1961-1990.
Species richness of vascular plants at Dovrefjell decreased significantly with elevation from the low
alpine to the high alpine belt. Higher levels of species richness were found on south-facing slopes as
compared to north-facing slopes. Over time species richness of vascular plants did not change during
the period 2001-2015. On the other hand, lichen species richness experienced a significant decline
over time in the study area. These observations are in line with other studies in similar conditions and
might be attributed to global warming. However, for the bryophytes, an increase in species richness
was observed which is somewhat contrasting to our expectations. Nonetheless, responses of
bryophytes to a changing environment depend to a large extent on the available microhabitats. In
addition, the species composition of vascular plants on the study summits changed significantly as
well. Most likely, this change is the result of a significantly increased cover and abundance of shrubs,
dwarf shrubs and graminoids, especially at higher elevations. The invasion of shrubs in Alpine tundra
ecosystems has been previously reported and is often referred to as ‘shrub encroachment’.
Furthermore, three lichen species (Ochrolechia sp., Pseudephebe sp. and Umbilicaria sp.) showed a
substantial decline in cover which, according to previous studies, can be attributed to an increased
competition with vascular plants. Finally, thermophilization of vascular plants (i.e. the increasing
dominance of thermophilic species) was more pronounced on the two lowest summits and on the
northern aspects of these summits. The migration of thermophilic vascular plant species occurred
primarily during the period 2001-2008, which was marked by a higher warming rate. During the
following years, thermophilization of vascular plants slowed down, most likely as a result of the
observed short-term negative trend in temperature since 2008. Lichens showed less thermophilization
than vascular plants, probably due to their higher dispersal ability. Also, in contrast to the vascular
plants, the process mainly took place on the two highest summits between 2008 and 2015. For the
bryophytes, thermophilization was only noticed on Veslekolla and Storkinn for the period 2001-2015.
On Vesle Armodshøkollen and Kolla, turnover of bryophyte species was much lower during that
period and the community experienced almost no changes over time.
In conclusion, most of the observed changes in vegetation at Dovrefjell are consistent with climate
warming and confirm previous experimental and/or field studies. Consequently, climate warming is
probably the main driver for these changes. However, this is an observational study which has only
been carried out over 15 years. Other possible driving factors (e.g. grazing, trampling and
eutrophication) might have a substantial influence on vegetation as well and cannot be ruled out. Most
likely, the recorded changes in species richness and composition are a combined effect of climate
change and plant-herbivore interactions.
81
Future perspectives
Since this is an observational field study, the effect of extern factors like grazing and trampling from
herbivores, atmospheric N deposition, invasive species and land-use changes cannot be ruled out. This
emphasizes the need for more experimental studies, enabling researchers to distinguish between the
different drivers of changes in plant communities and capturing possible lag-effects in the response of
vegetation.
In addition, more research is required, not only within the study area, but also in other mountain
regions, in order to investigate whether changes in vegetation propagate through time and space and
whether they can be related to a long-term trend in climate change. Also, comparing the observed
changes of lichen and bryophyte species at Dovrefjell with the results of other studies remains difficult
due to the fact that there are relatively few studies on species level of non-vascular plants. Hence,
further investigation is required with respect to the interaction between different taxonomic groups
(i.e. vascular plants, lichens and bryophytes) and their overall response to climate warming.
Finally, field observations at Dovrefjell could also be completed with experimental research, e.g.
experiments with open-top chambers and infrared heaters, in order to study the interactive effects of
elevated CO2 levels and increased air temperature on local vegetation. Furthermore, temporaly
replicated observations, such as vegetation resurveys, are indispensable for an accurate calibration and
validation of environmental niche or species distribution models. In turn, these models could provide
more insight into the impacts of climate warming on plant communities across space and time.
82
References
ACIA. (2004). Impacts of a Warming Arctic: Arctic Climate Impact Assessment. Cambridge
University Press, 1046.
Aitken, S. N., Yeaman, S., Holliday, J. A., Wang, T., & Curtis-McLane, S. (2008). Adaptation,
migration or extirpation: climate change outcomes for tree populations. Evolutionary Applications, 1,
95-111.
Allaby, M. (1998). A Dictionary of Plant Sciences. Consulted on 30.04.2016 via
http://www.encyclopedia.com/.
Allen, M. R., Barros, V. R., Broome, J., Cramer, W., Christ, R., Church, J. A., et al. (2014). IPCC
Fifth Assessment Synthesis Report-Climate Change 2014 Synthesis Report.
Alsos, I. G., Eidesen, P. B., Ehrich, D., Skrede, I., Westergaard, K., Jacobsen, G. H., et al. (2007).
Frequent long-distance plant colonization in the changing Arctic.
Altalo, J. (1998). Climate Change: Impacts on Structure and Biodiversity of Subarctic Plant
Communities.
Ammann, B. (1995). Paleorecords of plant biodiversity in the Alps. Arctic and Alpine Biodiversity:
Patterns, Causes and Ecosystem Consequences, 113, 137-149.
Anderson, M. J., Crist, T. O., Chase, J. M., Vellend, M., Inouye, B. D., Freestone, A. L., et al. (2011).
Navigating the multiple meanings of beta diversity: A roadmap for the practicing ecologist. Ecology
Letters, 14, 19-28.
Anderson, M. J., Ellingsen, K. E., & McArdle, B. H. (2006). Multivariate dispersion as a measure of
beta diversity. Ecology Letters, 9, 683-693.
Arft, A. M., Walker, M. D., Gurevitch, J. et a., Alatalo, J. M., Bret-Harte, M. S., Dale, M., et al.
(1999). Responses of tundra plants to experimental warming: meta-analysis of the international tundra
experiment. Ecological monographs, 69, 491-511.
Augustine, D. J., & McNaughton, S. J. (1898). Ungulate effects on the functional species composition
of plant communities: herbivore selectivity and plant tolerance. J Wildl Manage, 62, 1165-1182.
Austrheim, G., & Eriksson, O. (2001). Plant Species Diversity and Grazing in the Scandinavian
Mountains: Patterns and Processes at Different Spatial Scales. Ecography, 24, 683-695.
Austrheim, G., Mysterud, A., Pedersen, B., Halvorsen, R., Hassel, K., & Evju, M. (2008). Large scale
experimental effects of three levels of sheep densities on an alpine ecosystem. Oikos, 117, 837-846.
Baeten, L., Vangansbeke, P., Hermy, M., Peterken, G., Vanhuyse, K., & Verheyen, K. (2012).
Distinguishing between turnover and nestedness in the quantification of biotic homogenization.
Biodiversity and Conservation, 21, 1399-1409.
Bahn, M., & Körner, C. (2005). Recent increase in summit flora caused by warming in the Alps.
Alpine biodiversity in Europe, 167.
Baron, J. S. (1992). Biogeochemical fluxes. Biogeochemistry of a subalpine ecosystem, 218-231.
Baron, J. S., Rueth, H. M., Wolfe, A. M., Nydick, K. R., Allstott, E. J., Minear, J. T., et al. (2000).
Ecosystem responses to nitrogen deposition in the Colorado Front Range. Ecosystems, 3, 352-368.
Barthlott, W., Lauer, W., & Placke, A. (1996). Global distribution of species diversity in vascular
plants: towards a world map of phytodiversity. Erdkunde, 50, 317-328.
83
Bayfield, N. G. (1971). Some effects of walking and skiing on vegetation at Cairngorm. The Scientific
Management of Animal and Plant Communities for Conservation. 469-485.
Beermann, F., Teltewskoi, A., Fiencke, C., Pfeiffer, E. M., & Kutzbach, L. (2015). Stoichiometric
analysis of nutrient availability (N, P, K) within soils of polygonal tundra. Biogeochemistry, 122, 211-
227.
Bellard, C., Thuiller, W., Leroy, B., Genovesi, P., Bakkenes, M., & Courchamp, F. (2014). Europe
PMC Funders Group: Will climate change promote future invasions?, 19, 3740-3748.
Berg, M. P., Toby Kiers, E., Driessen, G., van der Heijden, M., Kooi, B. W., Kuenen, F., et al. (2010).
Adapt or disperse: Understanding species persistence in a changing world. Global Change Biology,
16, 587-598.
Bergamini, A., Ungricht, S., & Hofmann, H. (2009). An elevational shift of cryophilous bryophytes in
the last century - An effect of climate warming? Diversity and Distributions, 15, 871-879.
Bertrand, R., Lenoir, J., Piedallu, C., Riofrio-Dillon, G., de Ruffray, P., Vidal, C., et al. (2011).
Changes in plant community composition lag behind climate warming in lowland forests. Nature, 479,
215-520.
Bestelmeyer, B. T., Herrick, J. E., Brown, J. R., Trujillo, D. A., & Havstad, K. M. (2004). Land
management in the American Southwest: a state and transition approach to ecosystem complexity.
Environ Manage, 34, 38-51.
Bhatt, U. S., Walker, D. A., Raynolds, M. K., Comiso, J. C., Epstein, H. E., Jia, G., et al. (2010).
Circumpolar Arctic tundra vegetation change is linked to sea ice decline. Earth Interactions, 14.
Bigelow, N. H., Brubaker, L. B., Edwards, M. E., Harrison, S. P., Prentice, I. C., Anderson, P. M., et
al. (2003). Climate change and Arctic ecosystems: 1. Vegetation changes north of 55°N between the
last glacial maximum, mid-Holocene, and present. Journal of Geophysical Research, 108, 1-25.
Billings, W. D. (1973). Arctic and Alpine Vegetations: Similarities, Differences, and Susceptibility to
Disturbance. BioScience, 23, 697-704.
Billings, W. D., & Mooney, H. A. (1968). The ecology. Biological Reviews: Cambdrige
Philopsophical Society, 481-529.
Bliss, L. C. (1962). Adaptations of arctic and alpine plants to environmental conditions. Arctic, 15,
117-144.
Bliss, L. C. (2015). Ecyclopedia Brittanica: Tundra biome.Consulted on 29.09.2015 via
http://www.britannica.com/.
Blok, D., Heijmans, M. M. P. D., Schaepman-Strub, G., Kononov, A. V., Maximov, T. C., &
Berendse, F. (2010). Shrub expansion may reduce summer permafrost thaw in Siberian tundra. Global
Change Biology, 16, 1296-1305.
Bobbink, R., Hornung, M., Roelofs, J. G. M., Hornungt, M., & Roelofst, J. G. M. (1998). The Effects
of Air-Borne Nitrogen Pollutants on Species Diversity in Natural and Semi- Natural European
Vegetation The effects of air-borne nitrogen pollutants on species diversity in natural and semi-natural
European vegetation. Source: Journal of Ecology Journal of Ecology Journal of Ecology, 86, 717-738.
Bonan, G. B., Pollard, D., & Thompson, S. L. (1992). Effects of boreal forest vegetation on global
climate. Nature, 359, 716-178.

84
Boucher, O., Randall, D., Artaxo, P., Bretherton, C., Feingold, G., Forster, P., et al. (2013). Clouds
and Aerosols. Climate Change 2013: The Physical Science Basis. Contribution of Working Group I to
the Fifth Assessment Report of the Intergovernmental Panel on Climate Change, 571-657.
Braconnot, P., Joussaume, S., Marti, O., & de Noblet, N. (1999). Synergistic feedbacks from ocean
and vegetation on the African Monsoon response to Mid‐Holocene insolation. Geophysical Research
Letters, 26, 2481.
Brathen, K. A., Ims, R. A., Yoccoz, N. G., Fauchald, P., Tveraa, T., & Hausner, V. H. (2007). Induced
shift in ecosystem productivity? Extensive scale effects of abundant large herbivores. Ecosystems, 10,
773-789.
Bray, J. R., & Curtis, J. T. (1957). An Ordination of the Upland Forest Communities of Southern
Wisconsin. Ecological Monographs, 27, 325.
Breshears, D. D., Huxman, T. E., Adams, H. D., Zou, C. B., & Davison, J. E. (2008). Vegetation
synchronously leans upslope as climate warms. Proceedings of the National Academy of Sciences of
the United States of America, 105, 11591-11592.
Bretten, S. (1990). Moskusfeet. Oslo: Cappelen.
Bretten, S., Gjershaug, J. O., Gjærevoll, O., Haugland, K., Sande, J., Skogland, T., et al. (1994).
Dovrefjell.
Buckman, H. O. & Brady, N. C. (1960). The Nature and Property of Soils - A College Tekst of
Edaphology (6th ed.). New York: The MacMillan Company.
Bruun, H. H., Moen, J., Virtanen, R., Grytnes, J. A., Oksanen, L., & Angerbjörn, A. (2006). Effects of
altitude and topography on species richness of vascular plants, bryophytes and lichens in alpine
communities. Journal of Vegetation Science, 17(1), 37-46.
Burns, D. a. (2003). Atmospheric nitrogen deposition in the Rocky Mountains of Colorado and
southern Wyoming—a review and new analysis of past study results. Atmospheric Environment, 37,
921-932.
Burns, D. a. (2004). The effects of atmospheric nitrogen deposition in the Rocky Mountains of
Colorado and southern Wyoming, USA - a critical review. Environmental Pollution, 127, 257-269.
Caldeira, M. C., Lecomte, X., David, T. S., Pinto, J. G., Bugalho, M. N. & Werner, C. (2015). Synergy
of extreme drought and shrub invasion reduce ecosystem functioning and resilience im water-limited
climates. Scientific Reports, 5, 1-9.
Callaghan, T. V., Tweedie, C. E., Åkerman, J., Andrews, C., Bergstedt, J., Butler, M. G., et al. (2011).
Multi-Decadal Changes in Tundra Environments and Ecosystems: Synthesis of the International Polar
Year-Back to the Future Project (IPY-BTF). AMBIO - A Journal of the Human Environment, 40, 705-
716.
Callaway, R. M., Brooker, R. W., Choler, P., Kikvidze, Z., Lortiek, C. J., Michalet, R., et al. (2002).
Positive interactions among alpine plants increase with stress. Nature, 417, 844-848.
Callaway, R. M., Thelen, G., Rodriguez, A., & Holben, W. E. (2004). Release from inhibitory soil
biota in Europe and positive plant-soil feedbacks in North America promote invasion. Nature, 427,
731-733.
Camarero, J. J., & Gutierrez, E. (2004). Pace and pattern of recent tree-line dynamics response of
ecotones to climatic variability in the Spanish Pyrenees. Climatic Change, 63, 181-200.
Cannone, N., Sgorbati, S., & Guglielmin, M. (2007). Unexpected impacts of climate change on alpine
vegetation. Frontiers in Ecology and the Environment, 5, 360-364.
85
CaraDonna, P. J., Iler, A. M., & Inouye, D. W. (2014). Shifts in flowering phenology reshape a
subalpine plant community. Proceedings of the National Academy of Sciences of the United States of
America, 111, 4916-4921.
Carboni, M., Carranza, M. L., Acosta, A., Coastal, T., Community, S., State, B., et al. (2009).
Management of Mediterranean coastal dunes. Ocean & Coastal Management, 30, 177-195.
Chapin, F. S., Bret-Harte, M. S., Hobbie, S. E., & Zhong, H. (1996). Plant functional types as
predictors of transient responses of arctic vegetation to global change. Journal of Vegetation Science,
7, 347-358.
Chapin, F. S., & Körner, C. (1994). Arctic and alpine biodiversity—Patterns, causes and ecosystem
consequences. Trends Ecol. Evol., 9, 45-47.
Chapin, F. S., & Shaver, G. R. (1985). Individualistic growth response of tundra plant species to
environmental manipulations in the field. Ecology, 66, 564.
Chapin, F. S., Shaver, G. R., Giblin, A. E., Nadelhoffer, K. J., & Laundre, J. A. (1995). Responses of
Arctic tundra to experimental and observed changes in climate. Ecology, 76, 694-711.
Chapin, F. S., Zavaleta, E. S., Eviner, V. T., Naylor, R. L., Vitousek, P. M., Reynolds, H. L., et al.
(2000). Consequences of changing biodiversity. Nature, 405, 234-242.
Chew, R. M. (1974). Consumers as regulators of ecosystems: An alternative to energetics. Ohio J.
Sci., 74, 359-370.
Church, J. A., Clark, P. U., Cazenave, a., Gregory, J. M., Jevrejeva, S., Levermann, a., et al. (2013).
Sea level change. Climate Change 2013: The Physical Science Basis. Contribution of Working Group
I to the Fifth Assessment Report of the Intergovernmental Panel on Climate Change, 1137-1216.
Church, J. A., & White, N. J. (2006). A 20th century acceleration in global sea-level rise. Geophysical
Research Letters, 33, 94-97.
Clark, J. S., Lewis, M., & Horvath, L. (2001). Invasion by extremes: population spread with variation
in dispersal and reproduction. The American naturalist, 157, 537-554.
Clarke, K. R., Somerfield, P. J., & Chapman, M. G. (2006). On resemblance measures for ecological
studies, including taxonomic dissimilarities and a zero-adjusted Bray–Curtis coefficient for denuded
assemblages. J. Exp. Mar. Biol. Ecol., 330, 55-80.
Clarke, K. R., & Warwick, R. M. (2001). Change in Marine Communities: An Approach to Statistical
Analysis and Interpretation. Plymouth, UK: Plymouth Marine Laboratory.
Cohen, J. L., Furtado, J. C., Barlow, M., Alexeev, V. A., & Cherry, J. E. (2012). Asymmetric seasonal
temperature trends. Geophys. Res. Lett., 39, L04705.
Cole, D. N., & Monz, C. A. (2002). Trampling disturbance of high-elevation vegetation, Wind River
Mountains, Wyoming, USA. Arctic Antarctic and Alpine Research, 34, 365-376.
Convey, P. (2001). Terrestrial ecosystem responses to climate changes in the Antarctic. ‘Fingerprints’
of Climate Change – Adapted Behaviour and Shifting Species Ranges. 17-42.
Cornelissen, J. H. C., Callaghan, T. V., Alatalo, J. M., Michelsen, A., Graglia, E., Hartley, A. E., et al.
(2001). Global change and arctic ecosystems: Is lichen decline a function of increases in vascular plant
biomass? Journal of Ecology, 89, 984-994.
Cornelissen, J. H. C., Lang, S. I., Soudzilovskaia, N. A., & During, H. J. (2007). Comparative
cryptogam ecology: A review of bryophyte and lichen traits that drive biogeochemistry. Annals of
Botany, 99, 987-1001.
86
Cornelissen, J. H. C., Van Bodegom, P. M., Aerts, R., Callaghan, T. V., Van Logtestijn, R. S. P.,
Alatalo, J., et al. (2007). Global negative vegetation feedback to climate warming responses of leaf
litter decomposition rates in cold biomes. Ecology Letters, 10, 619-627.
Cox, C., & Moore, P. (2010). Biogeography.
Davidson, O., Gitay, H., Griggs, D., Halsnaes, K., Houghton, J., House, J., et al. (2001). Climate
Change 2001: Synthesis Report. Assessment, 24-29.
De Frenne, P., Rodríguez-Sánchez, F., Coomes, D. A., Baeten, L., Verstraeten, G., Vellend, M., et al.
(2013). Microclimate moderates plant responses to macroclimate warming. Proc Natl Acad Sci,
110(46, 18561-18565.
De Frenne, P., Rodríguez-Sánchez, F., De Schrijver, A., Coomes, D. a., Hermy, M., Vangansbeke, P.,
et al. (2015). Light accelerates plant responses to warming. Nature Plants, 1, 15110.
De Witte, L. C., & Stocklin, J. R. (2010). Longevity of clonal plants: Why it matters and how to
measure it. Annals of Botany, 106, 859-870.
Devictor, V., van Swaay, C., Brereton, T., Brotons, L., Chaimberlain, D., Heliölä, J., et al. (2012).
Differences in climatic debts of birds and butterflies at a continental scale. Nature Climate Change, 2,
121-124.
Divine, D., Isaksson, E., Martma, T., Meijer, H. A. J., Moore, J., Pohjola, V., et al. (2011). Thousand
years of winter surface air temperature variations in Svalbard and northern norway reconstructed from
ice-core data. Polar Research, 30, 1-12.
DNT. (2015). Den Norske Turistforening.Consulted on 30.09.2015 via https://www.dnt.no/.
Doak, D. F., & Morris, W. F. (2010). Demographic compensation and tipping points in climate-
induced range shifts. Nature, 467, 959-962.
D'Odorico, P., Fuentes, J. D., Pockman, W. T., Collins, S. L., He, Y., Medeiros, J. S., et al. (2010).
Positive feedback between microclimate and shrub encroachment in the northern Chihuahuan desert.
Ecosphere, 1, art17.
Dublin, R., Slemons, J., Lew, K. L., & Field, C. J. (2001). Scarcity of food in winter prompts a range
of adaptations: Alaska Department of Fish and Game, Division of Wildlife Conservation.
Dukes, J. S., & Mooney, H. A. (1999). Does global change increase the success of biological
invaders? Trends Ecol. Evol., 14, 135-139.
Dukes, J. S., & Mooney, H. A. (2004). Disruption of ecosystem processes in western North America
by invasive species. Revista Chilena de Historia Natural, 77, 411-437.
Dullinger, S., Gattringer, A., Thuiller, W., Moser, D., Zimmermann, N. E., Guisan, A., et al. (2012).
Extiction depth of high-mountain plants under twenty-first-century climate change. Nature Climate
Change, 2, 619-622.
Dunne, J. A., Harte, J., & Taylor, K. J. (2003). Subalpine meadow flowering phenology responses to
climate change: Integrating experimental and gradient methods. Ecological Monographs, 73, 69-86.
Easterling, D. R., Evans, J. L., Groisman, P. Y., Karl, T. R., Kunkel, K. E., & Ambenje, P. (2000).
Observed variability and trends in extreme climate events: A brief review. Bulletin of the American
Meteorological Society, 81, 417-425.
Easterling, D. R., & Wehner, M. F. (2009). Is the climate warming or cooling? Geophysical Research
Letters, 36, 4-6.
Ellenberg, H. (1988). Vegetation Ecology of Central Europe (4 ed.). New York, USA: Cambridge
University Press: New Rochelle.

87
Ellis, C. J., Eaton, S., Theodoropoulos, M., Coppins, B. J., Seaward, M. R. D., & Simkin, S. (2015).
Lichen Epiphyte Scenarios. A Toolkit of Climate and Woodland Change for the 21st Century.
Elmendorf, S. C., Henry, G. H. R., Hollister, R. D., Björk, R. G., Bjorkman, A. D., Callaghan, T. V., et
al. (2012). Global assessment of experimental climate warming on tundra vegetation: Heterogeneity
over space and time. Ecology Letters, 15, 164-175.
Elorza-Gutiérrez. (2005). Climatic Geomorphology.
Elven, R., Fremstad, E., Hegre, H., Nilsen, L., & Solstad, H. (1996). Botanical values in the Dovrefjell
area.
Engler, R., & Randin, C. F. (2011). 21st century climate change threatens mountain flora unequally
across Europe. Global Change Biology, 17, 2330-2341.
Epstein, H. E., Beringer, J., Gould, W. A., Lloyd, A. H., Thompson, C. D., Chapin, F. S., et al. (2004).
The nature of spatial transitions in the Arctic. Journal of Biogeography, 31, 1917-1933.
Epstein, H. E., Walker, M. D., Chapin, F. S., & Starfield, A. M. (2000). A transient, nutrient-based
model of arctic plant community response to climatic warming. Ecological Applications, 10, 824-841.
Eriksson, O., & Ehrlen, J. (1992). Seed and microsite limitation of recruitment in plant populations.
Oecologia, 91, 360-364.
Erschbamer, B., Niederfriniger Schlag, R., & Winkler, E. (2008). Colonization processes on a central
Alpine glacier foreland. Journal of Vegetation Science, 19, 855-862.
ESDAC. (2015). Joint Research centre - European Soil Data Centre (ESDAC).
EUROPARC. (2015). Europarc Conference 2015.Consulted on 05.10.2015 via
http://www.europarc.org/.
European Environmental Agency. (2010) Global and European temperature. Consuslted on
28.04.2016 via http://www.eea.europa.eu/.
European Environmental Agency. (2014). Annual report 2013 and Environmental statement 2014.
Consulted on 20.10.2015 via http://www.eea.europa.eu/.
Euskirchen, E. S., McGuire, A. D., Rupp, T. S., Chapin, F. S., & Walsh, J. E. (2009). Projected
changes in atmospheric heating due to changes in fire disturbance and the snow season in the western
Arctic, 2003-2100. Journal of Geophysical Research: Biogeosciences, 114, 1-15.
Fahrig, L. (2003). Effects of habitat fragmentation on biodiversity. Anual review of Ecology,
Evolution and Systematics, 34, 487-515.
Felde, V. A., Kapfer, J., & Grytnes, J. A. (2012). Upward shift in elevational plant species ranges in
Sikkilsdalen, Central Norway. Ecography, 35(10).
Floyd, D. A., & Anderson, J. E. (1987). A comparison of three methods for estimating plant cover.
Journal of Ecology, 75, 221-228.
Fois, S., Schlichting, L., Marchylo, B., Dexter, J., Motzo, R., & Giunta, F. (2011). Environmental
conditions affect semolina quality in durum wheat (Triticum turgidum ssp. durum L.) cultivars with
different gluten strength and gluten protein composition. Journal of the Science of Food and
Agriculture, 91, 2664-2673.
Foley, J. A., Kutzbach, J. E., Coe, M. T., & Levis, S. (1994). Feedbacks between climate and boreal
forests during the Holocene epoch. Nature, 371, 52-54.
88
Fowbert, J. A., & Smith, R. I. L. (1994). Rapid population increases in native vascular plants in the
Argentine Islands. Arctic and Alpine Research, 26, 290-296.
Fremstad, E., Paal, J., & Möls, T. (2005). Impact of increased nitrogen supply on Norwegian lichen-
rich alpine communities: a ten-year experiment. Journal of Ecology, 93, 471-481.
Fuller, E., Brush, E., Pinsky, M. L. (2015). The persistence of populations facing climate shifts and
harvest. Ecosphere, 6(9), 1-16.
Gaare, E. (1997). A hypothesis to explain lichen-Rangzfer dynamic relationships Eldar Gaare words.
Rangifer, 17, 13-17.
Gaare, E., & Skogland, T. (1970). Villreinens næringsvaner. Hardangervidda, Trondheim.
Ganopolski, A. (1998). The Influence of Vegetation-Atmosphere-Ocean Interaction on Climate
During the Mid-Holocene. Science, 280, 1916-1919.
Gederaas, L., Moen, T. L., Skjelseth, S., & Larsen, L.-K. (2012). Alien species in Norway– with the
Norwegian Black List 2012. 214.
Gehrig-Fasel, J. A. G., Guisan, A., & Zimmermann, N. E. (2007). Tree line shifts in the Swiss Alps:
Climate change or land abandonment? J. Veg. Sci., 18, 571-582.
GISD. (2015). Global Invasive Species Database. Consulted on 10.10.2015 via
http://www.iucngisd.org/gisd/.
Gitay, H., Brown, S., Easterling, W., & Jallow, B. (2001). Ecosystems and their goods and services.
Camebridge and New York: Cambridge University Press.
GLORIA. (2015). Global Observation Research Initiative in Alpine Environments. Consuled on
10.10.2015 via http://www.gloria.ac.at/.
Goodall, D. W. (1952). Quantitative aspects of plant distribution. Biol. Rev., 27, 194-245.
Gottfried, M., Pauli, H., Futschik, A., Akhalkatsi, M., Barančok, P., Alonso, B., et al. (2012).
Continent-wide response of mountain vegetation to climate change. Nature Climate Change, 2, 5.
Gottfried, M., Pauli, H., & Grabherr, G. (1998). Prediction of vegetation patterns at the limits of plant
life: A new view of the alpine-nival ecotone. Arctic and Alpine Research, 30, 207.
Gottfried, M., Pauli, H., Reiter, K., & Grabherr, G. (1999). A fine-scaled predictive model for changes
in species distribution patterns of high mountain plants induced by climate warming. Diversity
Distributions, 5, 241-251.
Gottfried, M., Pauli, H., Reiter, K., & Grabherr, G. (1999). Potential effects of climate change on
alpine and nival plants in the Alps. Mountain Biodiversity – A Global Assessment.
Gottfried, M., Pauli, H., Reiter, K., & Grabherr, G. (1999). An unescaled predictive model for changes
in species distribution patterns of high mountain plants induced by climate warming. Diversity and
Distributions, 5, 241-251.
Gower, J. C. (1971). A general coefficient of similarity and some of its properties. Biometrics, 27,
857-871.
Gower, J. C. (1987). Introduction to ordination techniques. In Developments in Numerical Ecology
(Eds. P. Legendre & L. Legendre). Berlin: Springer-Verlag.
Grabherr, G., Gottfried, M., Gruber, A., & Pauli, H. (1995). Patterns and Current Changes in Alpine
Plant Diversity. Berlin: Springer.
Grabherr, G., Gottfried, M., & Pauli, H. (1994). Climate effect on mountain plants. Nature, 369, 448.
89
Grabherr, G., Gottfried, M., & Pauli, H. (2000). Hochgebirge als "hot spots" der Biodiversität –
dargestellt am Beispiel der Phytodiversität. Ber. d. Reinh.-Tüxen-Ges., 12, 101-112.
Grabherr, G., Gottfried, M., & Pauli, H. (2000). Long-term monitoring of mountain peaks in the Alps.
Biomonitoring: General an Applied Aspects on Regional and Global Scales, 35, 153-177.
Grace, J., Berninger, F., & Nagy, L. (2002). Impacts of climate change on the tree line. Annals of
Botany, 90, 537-544.
Gregory, J. M., Huybrechts, P., & Raper, S. C. B. (2004). Threatened loss of the Greenland ice-sheet.
Nature, 428, 2513-2513.
Greigh-Smith, P. (1983). Quantitative plant ecology.
Grime, J. P. (1979). Plant Strategies and Vegetation Processes.
Grime, J. P. (2001). Plant strategies, vegetation processes, and ecosystem properties.
Grytnes, J. A., Heegaard, E., & Ihlen, P. G. (2006). Species richness of vascular plants, bryophytes,
and lichens along an altitudinal gradient in western Norway. Acta Oecologica, 29, 241-246.
Haeberli, W., & Beniston, M. (1998). Climate change and its impacts on glaciers and permafrost in the
Alps. Ambio, 27, 258-265.
Harte, J., & Shaw, R. (1995). Shifting dominance within a montane vegetation community: results of a
climate-warming experiment. Science, 267, 876-880.
Hartmann, D. J., Klein Tank, A. M. G., Rusticucci, M., Alexander, L. V., Brönnimann, S., Charabi, Y.
A.-R., et al. (2013). Observations: Atmosphere and Surface. Climate Change 2013: The Physical
Science Basis. Contribution of Working Group I to the Fifth Assessment Report of the
Intergovernmental Panel on Climate Change, 159-254.
Haslett, J. R. (2005). Alpine Biodiversity in Europe. Biological Conservation, 121, 643-644.
Hassel, K., Presto, T., & Schmidt, N. (2012). Bryophyte Diversity in high and low arctic Greenland.
Establishment of permanent monitoring transects and bryophyte mapping in Zackenberg and
Kobbefjord 2009-2010. 42.
Hedberg, O. (1969). Evolution and speciation in a tropical high mountain flora. Biological Journal of
the Linnean Society, 1, 135-148.
Helle, T., Helle, T., Aspi, J., & Aspi, J. (1983). Effects of Winter Grazing by Reindeer on Vegetation.
Oikos, 40, 337-343.
Hill, G. B., & Henry, G. H. R. (2011). Responses of High Arctic wet sedge tundra to climate warming
since 1980. Global Change Biology, 17, 276-287.
Hiltbrunner, E., Schwikowski, M., & Körner, C. (2005). Inorganic nitrogen storage in alpine snow
pack in the Central Alps (Switzerland). Atmospheric Environment, 39, 2249-2259.
Hobbie, S. E., & Gough, L. (2004). Litter decomposition in moist acidic and non-acidic tundra with
different glacial histories. Oecologia, 140, 113-124.
Hobbs, N. T. (1996). Modification of ecosystems by ungulates. J Wildl Manage, 60, 695-713.
Hobbs, R. J., Higgs, E., & Harris, J. A. (2009). Novel ecosystems: implications for conservation and
restoration. Trends in Ecology and Evolution, 24, 599-605.
Hodkinson, D. J., & Thompson, K. (1997). Plant dispersal: the role of man. Journal of Applied
Ecology, 34, 1484-1496.

90
Hoegh-Guldberg, O. (1999). Climate Change, coral bleaching and the future of the world’ s coral
reefs. Symbiosis, 48.
Hof, C., Levinsky, I., Araújo, M. B., & Rahbek, C. (2011). Rethinking species' ability to cope with
rapid climate change. Global Change Biology, 17, 2987-2990.
Hoffmann, A. A., & Parsons, P. A. (1997). Extreme Environmental Change and Evolution. 259.
Hofgaard, A. (1997). Inter-relationships between treeline position, species diversity, land use and
climate change in the central Scandes mountains of Norway. Global Ecology and Biogeography
Letters, 6, 419-429.
Hofgaard, A. (1997). Structural changes in the forest-tundra ecotone: a dynamic process. Past and
future rapid environmental changes, 47, 255-263.
Holbrook, N. J., Brown, J. N., Davidson, J., Feng, M., Hobday, A. J., Lough, J. M., et al. (2012). El
Niño-Southern Oscillation. In A Marine Climate Change Impacts Adaptation report Card of Australia
2012 (Eds. E. S. Poloczanska, A. J. Hobday and A. J. Richardson).
Hole, L. R., & Tørseth, K. (2002). Deposition of major inorganic compounds in Norway 1978–1982
and 1997–2001: status and trends. Naturens talegrenser, Norwegian Pollution Control Authority
Report, 115.
Holten, J. I. (1990). Predicted floristic change and shift of vegetation zones in a coast-inland transect
in central Norway: NINA notat.
Holten, J. I. (1998). Vertical distribution patterns of vascular plants in the Fennoscandian mountains
range. Ecologie, 29, 129-138.
Holten, J. I., & Carey, P. D. (1992). Responses of climate change on natural terrestrial ecosystems in
Norway.
Holzinger, B., Hülber, K., Camenisch, M., & Grabherr, G. (2008). Changes in plant species richness
over the last century in the eastern Swiss Alps: Elevational gradient, bedrock effects and migration
rates. Plant Ecology, 195, 179-196.
Hörnfeldt, B. (2004). Long-term decline in numbers of cyclic voles in boreal Sweden: Analysis and
presentation of hypotheses. Oikos, 107, 376-392.
Hörnfeldt, B., Hipkiss, T., & Eklund, U. (2005). Fading out of vole and predator cycles? Proceedings.
Biological sciences / The Royal Society, 272, 2045-2049.
Hudson, J. M. G., & Henry, G. H. R. (2009). Increased plant biomass in a high arctic heath community
from 1981 to 2008. Ecology, 90, 2657-2663.
Hughes, L. (2000). Biological consequences of global warming: is the signal already apparent? Trends
in Ecology & Evolution, 15, 56-61.
Hurrell, J. W. (1995). Decadal trends in the north atlantic oscillation: regional temperatures and
precipitation. Science (New York, N.Y.), 269, 676-679.
Huston, M. (1979). A General Hypothesis of Species Diversity. The American Naturalist, 113, 81.
Huston, M. a. (1999). Local Processes and Regional Patterns: Appropriate Scales for Understanding
Variation in the Diversity of Plants and Animals. Oikos, 86, 393-401.
Ims Vistnes, I., & Nellemann, C. (2008). Reindeer Winter Grazing in Alpine Tundra: Impacts on
Ridge Community Composition in Norway. Arctic, Antarctic, and Alpine Research, 40, 215-224.
Inouye, D. W., Morales, M. A., & Dodge, G. J. (2002). Variation in timing and abundance of
flowering by Delphinium barbeyi Huth (Ranunculaceae): The roles of snowpack, frost, and La Ni??a,
in the context of climate change. Oecologia, 130, 543-550.
91
IPCC. (1995). Climate Change 1995: A report of the Intergovernmental Panel on Climate Change.
Change, 63.
IPCC. (2001). Climate Change 2001: impacts , adaptation and vulnerability. Impacts adaptation and
vulnerability, 10.
IPCC. (2007). Climate Change 2007: impacts, adaptation and vulnerability: contribution of Working
Group II to the fourth assessment report of the Intergovernmental Panel. Genebra, Suíça, 976pp.
IPCC. (2007). IPCC Fourth Assessment Report (AR4). IPCC, 1, 976.
IPCC. (2013). IPCC Fifth Assessment Report (AR5) -The physical science basis. IPCC.
IPCC. (2013). Summary for Policymakers. Climate Change 2013: The Physical Science Basis.
Contribution of Working Group I to the Fifth Assessment Report of the Intergovernmental Panel on
Climate Change, 33.
Jackson, R. B., Banner, J. L., Jobbagy, E. G., Pockman, W. T., & Wall, D. H. (2002). Ecosystem
carbon loss with woody plant invasion of grasslands. Nature, 418, 623-626.
Jägerbrand, A., & During, H. J. (2005). Effects of Simulated Shade on Growth, Number of Branches
and Biomass in Hylocomium splendens and Racomitrium lanuginosum. Lindbergia, 30, 117-124.
Jägerbrand, A. K., Kudo, G., Alatalo, J. M., & Molau, U. (2012). Effects of neighboring vascular
plants on the abundance of bryophytes in different vegetation types. Polar Science, 6, 200-208.
Jefferies, R. L., & Bryant, J. P. (1995). The plant-vertebrate herbivore interface in arctic ecosystems.
Arctic and Alpine Biodiversity: Patterns, Causes and Ecosystem Consequences, 113, 271-279.
Jeffries, M. O., Overland, J. E., Brown, R., Mudryk, L., & Luojus, K. (2015). Arctic Report Card. 1-
93.
Jin, Y., Xu, J., Wang, Y., Wang, S., Chen, Z., Huang, X., et al. (2015). Effects of nitrogen deposition
on tundra vegetation undergoing invasion by Deyeuxia angustifolia in Changbai Mountains. Chinese.
Geogr. Sci. doi.
Johansson, O., Palmqvist, K. & Olofsson, J. (2012). Nitrogen deposition drives lichen community
changes through differential species response. Global Change Biology, 18(8), 2626-2635.
Jost, L. (2007). Partitioning diversity into independent alpha and beta component. Ecology, 88, 2427-
2439.
Jump, A. S., Matyas, C. & Penuelas, J. (2009). The altitude-for-latitude disparity in the range
retractions of woody species. Trends Ecol. Evol., 24, 694-701.
Kaltenborn, B. P., Hongslo, E., Gundersen, V., & Andersen, O. (2014). Public perceptions of planning
objectives for regional level management of wild reindeer in Norway. Journal of Environmental
Planning and Management, 1-18.
Karl, T. R., Arguez, A., Huang, B., Lawrimore, J. H., McMahon, J. R., Menne, M. J., et al. (2015).
Climate change. Possible artifacts of data biases in the recent global surface warming hiatus. Science,
348, 1469-1472.
Karl, T. R., Knight, R. W., Easterling, D. R., & Quayle, R. G. (1996). Indices of climate change for
the United States. Bulletin of the American Meteorological Society, 77, 279-292.
Kattsov, V. M., Källén, E., Cattle, H., Christensen, J., Drange, H., Hanssen-bauer, I., et al. (2005).
Future Climate Change : Modeling and Scenarios for the Arctic Lead Authors. Arctic Climate Impact
Assessment, 99-150.
92
Kausrud, K. L., Mysterud, A., Steen, H., Vik, J. O., Østbye, E., Cazelles, B., et al. (2008). Linking
climate change to lemming cycles. Nature, 456, 93-97.
Keller, K., Tan, K., Morel, F. M. M., & Bradford, D. F. (2000). Preserving the Ocean Circulation:
Implications for Climate Policy. Climatic Change, 47, 17-43.
Kelly, A. E., & Goulden, M. L. (2008). Rapid shifts in plant distribution with recent climate change.
PNAS, 105(33), 11823-11826.
Kennedy, A. D. (1995). Antarctic terrestrial ecosystem response to global environmental change.
Annual Review of Ecology and Systematics, 26, 683-704.
Kerfoot, D. E. (1972). Thermal contraction cracks in an arctic tundra environment. Arctic, 25, 142-
150.
Kimble, J. (2004). Crysols.
Kimble, J., Tarnocai, C., Orozco-Chavez, F., Jakobsen, B., Lacelle, B., Waltman, S., et al. (2000). Soil
Organic Carbon of North America database.
King, G. A., & Neilson, R. P. (1992). The transient response of vegetation to climate change: A
potential source of CO2 to the atmosphere. Water, Air, and Soil Pollution, 64, 365-383.
Kinlan, B. P., Gaines, S. D., Kinlan, B. P., & Gaines, S. D. (2016). Propagule Dispersal in Marine and
Terrestrial Environments : a Community Perspective. 84, 2007-2020.
Klanderud, K., & Birks, H. (2003). Recent increases in species richness and shifts in altitudinal
distributions of Norwegian mountain plants. Holocene, 13, 1-6.
Klemmedson, J. O., & Wienhold, B. J. (1992). Nitrogen Mineralization in Soils of a Chaparral
Watershed in Arizona. Soil Science Society of America Journal, 56, 1629.
KNMI. (2015). Uitleg over El Niño. Consulted on 24.04.2016 via https://www.knmi.nl/.
Koleff, P., Gaston, K. J., & Lennon, J. J. (2003). Measuring beta diversity for presence-absence data.
J. Anim. Ecol., 72, 367–382.
Körner, C. (1999). Alpine plant life: Functional plant ecology of high mountain ecosystems. Berlin,
Heidelber: Springer-Verlag.
Körner, C. (2003). Alpine Plant Life: Functional Plant Ecology of High Mountain. Berlin, Heidelber:
Springer-Verlag.
Körner, C. (2014). Mountain ecosystems in a changing environment. Eco.mont, 6, 71-77.
Körner, C., & Paulsen, J. (2004). A world-wide study of high altitude treeline temperatures. Journal of
Biogeography, 31, 713-732.
Kosaka, Y., & Xie, S.-P. (2013). Recent global-warming hiatus tied to equatorial Pacific surface
cooling. Nature, 501, 403-407.
Kullman, L. (1998). Tree-limits and montane forests in the Swedish Scandes: sensitive biomonitors of
climate change and variability. Ambio, 27, 312-321.
Kullman, L. (2001). Immigration of Picea abies into North-Central Sweden. New evidence of regional
expansion and tree-limit evolution. Nordic Journal of Botany, 21, 39-54.
Kullman, L. (2002). Rapid recent range-margin rise of tree and shrub species in the Swedish Scandes.
J. Ecol., 90, 68-77.
Kullman, L. (2007). Tree line population monitoring of Pinus sylvestris in the Swedish Scandes, 1973-
2005: Implications for tree line theory and climate change ecology. Journal of Ecology, 95, 41-52.
93
Kullman, L. (2010). One century of treeline change and stability - experiences from the Swedish
scandes. Landscape Online, 17, 1-31.
Kutiel, P. (1992). Slope Aspect Effect on Soil and Vegetation in a Mediterranean Ecosystem. Israel
Journal of Botany, 41, 243-250.
Kutiel, P. (1994). Fire and ecosystem heterogeneity: A Mediterranean case study. Earth Surface
Processes and Landforms, 19, 187-194.
Kutiel, P., Noch, H., & Vee, L. (1999). Effect of slope aspect on soil and vegetation properties along
an aridity transect. Israel Journal of Plant Sciences, 473, 169-178.
Kwok, R., & Rothrock, D. A. (2009). Decline in Arctic sea ice thickness from submarine and ICESat
records: 1958-2008. Geophysical Research Letters, 36.
Lag, J. (1983). Soil Map of Norway.
Landa, A., Eide, N. E., Flagstad, Ø., van Dijk, J., Strand, O., & Linnell, J. D. C. (2008). The
Norwegian Arctic Fox captive breeding programme.
Lang, S. I., Cornelissen, J. H. C., Klahn, T., van Logtestijn, R. S. P., Broekman, R., Schweikert, W., et
al. (2009). An experimental comparison of chemical traits and litter decomposition rates in a diverse
range of subarctic bryophyte, lichen and vascular plant species. J. Ecol., 97, 886-900.
Lang, S. I., Cornelissen, J. H. C., Shaver, G. R., Ahrens, M., Callaghan, T. V., Molau, U., et al. (2012).
Arctic warming on two continents has consistent negative effects on lichen diversity and mixed effects
on bryophyte diversity. Global Change Biology, 18, 1096-1107.
Le Roux, P. C., & McGeoch, M. A. (2008). Changes in climate extremes, variability and signature on
sub-Antarctic Marion Island. Climatic Change, 86, 309-329.
Lembrechts, J., Jake, A., Lohengrin, C., Haider, S., Lenoir, J., Kueffer, C., et al. (2016). Mountain
roads shift native and non-native plant species ranges. Ecography.
Lenoir, J., Gégout, J. C., Marquet, P. a., de Ruffray, P., & Brisse, H. (2008). A significant upward shift
in plant species optimum elevation during the 20th century. Science (New York, N.Y.), 320, 1768-
1771.
Lenoir, J., Virtanen, R., Oksanen, J., Oksanen, L., Luoto, M., Grytnes, J-A., et al. (2011). Dispersal
ability links to cross-scale species diversity patterns across the Eurasian Arctic tundra. Global Ecology
Biogeography, 21(8), 851-860.
Lescop-Sinclair, K., & Payette, S. (1995). Recent advance of the arctic treeline along the eastern coast
of Hudson Bay. Journal of Ecology, 83, 929-936.
Loarie, S.R., Duffy, P.B., Hamilton, H., Asner, G. P., Field, C. B. & Ackerly, D. D. (2009). The
velocity of climate change. Nature, 462, 1052-1055.
Manabe, S., & Wetherald, R. (1975). The effects of doubling the CO2 concentration on the climate of
a general circulation model. Journal of Atmospheric Sciences, 32, 3-15.
Mann, M. E. (2002). Little Ice Age. In The Earth system: physical and chemical dimensions of global
environmental change (Eds. M.C MacCracken & J. S. Perry). Chichester: John Wiley & Sons.
Manseau, M., Huot, J., & Crête, M. (1996). Effects of summer grazing by caribou on composition and
productivity of vegetation: community and landscape level. J Ecol, 84, 503-513.
Margesin, R., Jud, M., Tscherko, D., & Schinner, F. (2009). Microbial communities and activities in
alpine and subalpine soils. FEMS Microbiology Ecology, 67, 208-218.
94
Maslanik, J. A., Fowler, C., Stroeve, J., Drobot, S., Zwally, J., Yi, D., et al. (2007). A younger, thinner
Arctic ice cover: Increased potential for rapid, extensive sea-ice loss. Geophysical Research Letters,
34, 2004-2008.
Matthews, J. A. (1977). Glacier and climatic •fluctuations inferred from tree growth variations over
the last 250 years, central southern Norway. Boreas, 6, 1-24.
Matthews, J. A. (1992). The ecology of recently deglaciated terrain: a geoecological approach to
glacier forelands and primary succession.
Matthews, J. A. (2005). 'Little Ice Age' glacier variations in Jotunheimen, southern Norway: a study in
regionally controlled lichenometric dating of recessional moraines with implications for climate an
lichen growth rates. The Holocene, 15, 1-19.
Matthews, J. A., & Whittaker, R. J. (1987). Vegetation succession on the Storbreen glacier foreland,
Jotunheimen, Norway: a review. Arctic and Alpine Research, 19, 285-395.
Mcbean, G., Alekseev, G., Chen, D., Førland, E., Fyfe, J., Groisman, P. Y. P., et al. (2005). Arctic
climate: past and present. Arctic Climate Impact Assessment. Cambridge, UK: Cambridge University
Press, 21-60.
McCain, C. M., & Grytnes, J.-A. (2010). Elevational Gradients in Species Richness. Encylcopedia of
Life Sciences, 15, 1--10.
McGuire, A. D., Christensen, T. R., Hayes, D., Heroult, A., Euskirchen, E., Kimball, J. S., et al.
(2012). An assessment of the carbon balance of Arctic tundra: Comparisons among observations,
process models, and atmospheric inversions. Biogeosciences, 9, 3185-3204.
McKendrick, J. D., Batzli, G. O., Everett, K. R., & Swans, J. C. (1980). Some effects of mammalian
herbivores and fertilization on tundra soils and vegetation. Arctic and Alpine Research, 12(4), 565-
578.
McLachlan, J. S., Clark, J. S., & Manos, P. S. (2005). Molecular indicators of tree migration capacity
under rapid climate change. Ecology, 86, 2088-2098.
McNaughton, S. J., Oesterheld, M., Frank, D. A., & Williams, K. J. (1989). Ecosystem-level patterns
of primary productivity and herbivory in terrestrial habitats. Nature, 341, 142-144.
Meehl, G. a., Arblaster, J. M., Fasullo, J. T., Hu, A., & Trenberth, K. E. (2011). Model-based evidence
of deep-ocean heat uptake during surface-temperature hiatus periods. Nature Climate Change, 1, 360-
364.
Meeuse, J. D. (1975). Thermogenic respiration in aroids. Ann. Rev. Pl. Physiol., 26, 117-126.
Meltofte, H. (2013). Arctic biodiversity assessment. Status and trends in Arctic biodiversity. 678.
Meshinev, T., Apostolova, I., & Koleva, E. S. (2000). Influence of warming on timberline rising: a
case study on Pinus peuce Griseb. in Bulgaria. Bulgaria. Phytocoenologia, 30, 431-438.
Michelsen, O., Syverhuset, A. O., Pedersen, B., & Holten, J. I. (2011). The impact of climate change
on recent vegetation changes on Dovrefjell, Norway. Diversity, 3, 91-111.
Midnorsknatur. (2015). Dovrefjell. Consulted on 25.10.20015 via midtnorsknatur.no/.
Miljodirektoratet. (2012). Deposition of major inorganic compounds in Norway 2007-2011. 44.
Mindas, J., Skvarenia, J., Strelkova, J., & Priwitzer, T. (2000). Influence of climatic changes on
Norway spruce occurrence in the West Carpathians. J. Forest Sci., 46, 249-259.
Miralles, D., van den berg, M., Gash, J. H., Parinussa, R. M., de Jeu, R. A. M., Beck, H. E., et al.
(2014). El Niño–La Niña cycle and recent trends in continental evaporation. Nature Climate Change,
4, 122-126.
95
Mittelbach, G. G., Steiner, C. F., Scheiner, S. M., Gross, K. L., Reynolds, H. L., Waide, R. B., et al.
(2001). What is the observed relationship between species richness and productivity? Ecology, 82 (9),
2381-2396.
Moen, A., Lillethun, A., & Odland, A. (1999). Vegetation.
Moen, J., Aune, K., Edenius, L., & Angerbjörn, A. (2004). Potential effects of climate change on
treeline position in the Swedish mountains. Ecology and Society, 9.
Molovcakova, I. Effects Of Climate Change On Alpine Plant Species at Finse , Southern Norway.
Moore, P., & Garratt, R. (2006). Tundra.
Mountain, R., & Butte, C. (2008). and Floral Abundance of Montane Wildflowers. America, 89, 353-
362.
Muller, S. W. (2008). Frozen in Time - Permafrost and Engineering Problems - Knovel. American
Society of Civil Engineers, 190-196.
Munson, S. M., & Sher, A. A. (2015). Long-term shifts in the phenology of rare and endemic rocky
mountain plants. American Journal of Botany, 102, 1268-1276.
Myers-Smith, I. H., Forbes, B. C., Wilmking, M., Hallinger, M., Lantz, T., Blok, D., et al. (2011).
Shrub expansion in tundra ecosystems: dynamics, impacts and research priorities. Environmental
Research Letters, 6, 045509.
Myneni, R. B. (1997). Estimation of global leaf area index and absorbed par using radiative transfer
models. IEEE Transactions on Geoscience and Remote Sensing, 35, 1380-1393.
Nash, T. H. (2012). Lichen Biology. Cambridge: Cambridge University Press.
Nagy, L., & Grabherr, G. (2009). The Biology of Alpine Habitats.
Nasjonalparkene. (2015). Dovrefjell-Sunndalsfjella: Enige og tro til Dovre faller.
Neilson, R. P., Pitelka, L. F., Solomon, A. M., Nathan, R., Midgley, G. F., Fragoso, J. M. V., et al.
(2005). Forecasting Regional to Global Plant Migration in Response to Climate Change. BioScience,
55, 749.
NGU. (2015). The Geological Survey of Norway. Consulted on 05.10.2015 via
https://www.ngu.no/en/.
NINA. (2015). Norwegian Institute for Nature Research. Consulted on 07.10.2015 via
http://www.nina.no/.
NMI. (2015). Climate in Norway. Consulted on 05.10.2015 via http://met.no/English/.
Oberbauer, S. F., Elmendorf, S. C., Troxler, T. G., Hollister, R. D., Rocha, a. V., Bret-Harte, M. S., et
al. (2013). Phenological response of tundra plants to background climate variation tested using the
International Tundra Experiment. Philosophical transactions of the Royal Society of London. Series B,
Biological sciences, 368, 20120481.
OED. (2015). Online Etymology Dictionary: Tundra. Consulted on 28.09.2015 via
http://www.etymonline.com/.
Oksanen, L. (1980). Abundance relationships between competitive and grazing-tolerant plants in
productivity gradients on Fennoscandian mountains. Ann. Bot. Fenn., 17, 410-429.
Oksanen, L., Moen, J., & Helle, T. (1995). Timberline patterns in northernmost Fennoscandia.
Relative importance of climate and grazing. Acta Botanica Fennica, 153, 93-105.
96
Oksanen, L., & Ranta, E. (1992). Plant Strategies along Mountain Vegetation Gradients: A Test of
Two Theories. Journal of Vegetation Science, 3, 175-186.
Oksanen, L. a. R., E. (1992). Plant strategies along vegetational gradients on the mountains of
Iddonjarga - a test of two theories. J. Veg. Sci., 3, 175-186.
Olson, D. M., Dinerstein, E., Wikramanayake, E. D., Burgess, N. D., Powell, G. V. N., Underwood, E.
C., et al. (2001). Terrestrial Ecoregions of the World: A New Map of Life on Earth. BioScience, 51,
933.
Ouellet, J.-P., Boutin, S., & Heard, D. C. (1994). Responses to simulated grazing and browsing of
vegetation available to caribou in the Arctic. Canadian Journal of Zoology, 72, 1426-1435.
Overpeck, J., Hughen, K., Hardy, D., Bradley, R., Douglas, M., Finney, B., et al. (1997). Arctic
Environmental Changes of the Last Four Centuries. The American Association for the Advancement
of Science, 278, 1251-1256.
Paal, J., Fremstad, E., & Möls, T. (1997). Responses of the Norwegian alpine Betula nana community
to nitrogen fertilisation. Canadian Journal of Botany, 75, 108-120.
Pajunen, A., Virtanen, R., & Roininen, H. (2008). The effects of reindeer grazing on the composition
and species richness of vegetation in forest-tundra ecotone. Polar Biology, 31, 1232-1244.
Palmer, M. W. (1994). Variation in species richness: Towards a unification of hypotheses. Folia
Geobotanica et Phytotaxonomica, 29, 511-530.
Parmesan, C., Ryrholm, N., Stefanescu, C., Hill, J. K., Thomas, C. D., Descimon, H., et al. (1999).
Poleward shifts in geographical ranges of butterfly species associated with regional warming. Nature,
399, 579-583.
Parmesan, C., & Yohe, G. (2003). A globally coherent fingerprint of climate change impacts across
natural systems. Nature (London), 421, 37-42.
Parmesan, C. N. (2006). Ecological and evolutionary responses to recent climate change. Annual
Review of Ecology, Evolution and Systematics, 37, 636-637.
Parolo, G., & Rossi, G. (2008). Upward migration of vascular plants following a climate warming
trend in the Alps. Basic and Applied Ecology, 9, 100-107.
Pauli, H., Gottfried, M., Dullinger, S., Abdaladze, O., Akhalkatsi, M., Alonso, J. L. B., et al. (2012).
Recent Plant Diversity Changes on Europe's Mountain Summits. Science, 336, 353-355.
Pauli, H., Gottfried, M., & Grabherr, G. (1996). Effects of climate change on mountain ecosystems -
upward shifting of alpine plants. World Resource Review, 8, 382-390.
Pauli, H., Gottfried, M., & Grabherr, G. (2003). Effects of climate change on the alpine and nival
vegetation of the Alps. Journal of mountain ecology, 7, 9-12.
Pauli, H., Gottfried, M., Hohenwallner, D., Reiter, K., Casale, R., & Grabherr, G. (2004). The
GLORIA Field Manual – Multi-Summit Approach (*Global Observation Research Initiative in Alpine
Environments). Paper presented at the Global Terrestrial Observing System (GTOS), Luxembourg:.
Pauli, H., Gottfried, M., Lamprecht, A., Niessner, S., Rumpf, S., Winkler, M., et al. (2015). The
GLORIA field manual – standard Multi-Summit approach, supplementary methods and extra
approaches. GlLbal Observation Research Initiative in Alpine environments.
Pauli, H., Gottfried, M., Reiter, K., Klettner, C., & Grabherr, G. (2007). Signals of range expansions
and contractions of vascular plants in the high Alps: Observations (1994-2004) at the GLORIA
*master site Schrankogel, Tyrol, Austria. Global Change Biology, 13, 147-156.

97
Pausas, J. G., & Carreras, J. (1995). The effects of bedrock type, temperature and moisture on species
richness of Pyrenean Scots pine (Pinus sylvestris L.) forests. Vegetatio, 116, 85-92.
Pawlowski, B. (1970). Remarques sur l’endemisme dans la flore des Alpes et des Carpates. Vegetatio,
21, 181-243.
Pearson, R. G., & Dawson, T. P. (2003). Predicting the impacts of climate change on the distribution
of speces: are bioclimate envelope models useful? Global Ecology and Biogeography, 12, 361-371.
Penuelas, J., & Boada, M. (2003). A global change-induced biome shift in the Montseny mountains
(NE Spain). Global Change Biol., 9, 131-140.
Peterson, T. C., Connolley, W. M., & Fleck, J. (2008). The myth of the 1970s global cooling scientific
consensus. Bulletin of the American Meteorological Society, 89, 1325-1337.
Pidwirny, M. (2006). Periglacial Processes and Landforms. Fundamentals of Physical Geography.
Post, E., Forchhammer, M. C., Bret-Harte, M. S., Callaghan, T. V., Christensen, T. R., Elberling, B., et
al. (2009). Ecological dynamics across the Arctic associated with recent climate change. Science (New
York, N.Y.), 325, 1355-1358.
Post, E., & Pedersen, C. (2008). Opposing plant community responses to warming with and without
herbivores. Proceedings of the National Academy of Sciences, 105, 12353-12358.
Potter, J. A., Press, M. C., Callaghan, T. V., & Lee, J. A. (1995). Growth responses of Polytrichum
commune and Hylocomium splendens to simulated environmental change in the sub-arctic. New
Phytologist, 131, 533-541.
Pounds, J. A., Bustamante, M. R., Coloma, L. a., Consuegra, J. a., Fogden, M. P. L., Foster, P. N., et
al. (2006). Widespread amphibian extinctions from epidemic disease driven by global warming.
Nature, 439, 161-167.
Price, M. F., & Barry, R. G. (1997). Climate change. In Mountains of the World. A Global Priority.
409-450.
Quezel, P. (1953). Contribution a l'etude phytosociologique et geobotanique de la Sierra Nevada.
Mem. Soc. Broter., 9, 1-77.
R Core Team (2015). R: A language and environment for computing. R Foundation for Statistical
Computing, Vienna, Austria. URL https://www.R-project.org/.
Ramanathan, V. (2001). Aerosols, Climate, and the Hydrological Cycle. Science, 294, 2119-2124.
Ramanathan, V., Crutzen, P. J., Kiehl, J. T., & Rosenfeld, D. (2001). Aerosols, climate, and the
hydrological cycle. Science (New York, N.Y.), 294, 2119-2124.
Rammig, A., Jonas, T., Zimmermann, N. E., & Rixen, C. (2010). Changes in alpine plant growth
under future climate conditions. Biogeosciences, 7, 2013-2024.
Rey Benayas, J. M., & Scheiner, S. M. (2002). Plant diversity, biogeography and environment in
Iberia: Patterns and possible causal factors. Journal of Vegetation Science, 13, 245-258.
Rixen, C., Freppaz, M., Stoeckli, V., Huovinen, C., Huovinen, K., & Wipf, S. (2008). Altered Snow
Density and Chemistry Change Soil Nitrogen Mineralization and Plant Growth. Arctic, Antarctic, and
Alpine Research, 40, 568-575.
Robinson, C. H. (1995). Responses of Plant Litter Decomposition and Nitrogen Mineralisation to
Simulated Environmental Change in a High Arctic Polar Semi-desert and a Subarctic Dwarf Shrub
Heath. Oikos, 74.3, 503-512.
98
Root, T., Price, J., Hall, K., & Schneider, S. (2003). Fingerprints of global warming on wild animals
and plants. Nature, 421, 57-60.
Ross, L. C., Woodin, S. J., Hester, A. J., Thompson, D. B. A., & Birks, H. J. B. (2012). Biotic
homogenization of upland vegetation: Patterns and drivers at multiple spatial scales over five decades.
Journal of Vegetation Science, 23, 755-770.
Rothrock, D. A., Percival, D. B., & Wensnahan, M. (2008). The decline in arctic sea-ice thickness:
Separating the spatial, annual, and interannual variability in a quarter century of submarine data. J.
Geophys. Res., 113.
Sætersdal, M., & Birks, H. J. B. (1997). A comparative ecological study of Norwegian mountain
plants in relation to possible future climatic change. Journal of Biogeography, 24, 127-152.
Sala, O. E., & Sala, O. E. (2009). Global Biodiversity Scenarios for the Year 2100 . Science,
287, 1770-1774.
Sanchez, P. A. (1977). Properties and Management of Soils in the Tropics. Soil Science, 124, 187.
Sanz-Elorza, M., Dana, E. D., Gonzalez, A., & Sobrino, E. (2003). Changes in the high-mountain
vegetation of the central Iberian peninsula as a probable sign of global warming. Ann. Bot., 92, 273-
280.
Schulze, E-D., Beck, E. & Müller-Hohenstein, K. (2005). Plant Ecology. Springer.
Serreze, M. C., Walsh, J. E., Chapin, F. S. I., Osterkamp, T., Dyurgerov, M., Romanovsky, V., et al.
(2000). Observational evidence of recent change in the northern high- latitude environment. Climatic
Change, 46, 159-207.
Shaver, G. R., & Jonasson, S. (1999). Response of arctic ecosystems to climate change: results of
long-term field experiements in Sweden and Alaska. Polar Research, 18, 245-252.
Shiyatov, S. G., Terent’ev, M. M., Fomin, V. V., & Zimmermann, N. E. (2007). Altitudinal and
horizontal shifts of the upper boundaries of open and closed forests in the Polar Urals in the 20th
century. Russ. J. Ecol., 38, 223-227.
Simon, C., Arris, L., & Heal, B. (2005). Arctic Climate Impact Assessment. 12-13.
Skogland, T. (1956). Movements of tagged and radio-instrumented wild reindeer in relation to habitat
alteration in the Snøhetta region , Norway.
Skogland, T., & Mølmen. (1980). Alpine Plant Life: Functional Plant Ecology of High Mountain.
Trondheim: Direktoratet for vilt og ferskvannsfisk.
Smith, T. M., & Shugart, H. H. (1993). The transient response of terrestrial carbon storage to a
perturbed climate. Nature, 361, 523-526.
Sørensen, L. I., Mikola, J., Kytöviita, M. M., & Olofsson, J. (2009). Trampling and Spatial
Heterogeneity Explain Decomposer Abundances in a Sub-Arctic Grassland Subjected to Simulated
Reindeer Grazing. Ecosystems, 12, 830-842.
Spaargaren, O. (2008). Podzols. In W. Chesworth (Ed.), In Encyclopedia of Soil Science (pp. 522-
525). Dordrecht, The Netherlands: Springer.
Stachowicz. (2001). Mutualism, facilitation and the structure of ecological communities. Bioscience,
51, 235-246.
Staff, S. S. (1999). Soil Taxonomy, A Basic System of Soil Classification for Making and Interpreting
Soil Surveys. Soil Science, 436, 871.
Stenseth, N. C., Ims, R. A. (1993). The Biology of Lemmings.
99
Sternberg, M., & Shoshany, M. (2001). Influence of slope aspect on Mediterranean woody formations:
Comparison of a semiarid and an arid site in Israel. Ecological Research, 16, 335-345.
Stroeve, J., Holland, M. M., Meier, W., Scambos, T., & Serreze, M. (2007). Arctic sea ice decline:
Faster than forecast. Geophysical Research Letters, 34, 1-5.
Sturm, M., Douglas, T., Racine, C., & Liston, G. E. (2005). Changing snow and shrub conditions
affect albedo with global implications. Journal of Geophysical Research, 110, 1-13.
Sturm, M., McFadden, J. P., Liston, G. E., Chapin, F. S. I., Racine, C. H., & Holmgren, J. (2001).
Snow-shrub interactions in Arctic tundra: a hypothesis with climatic implications. J. Clim., 14, 336-
383.
Svenning, J.-C., & Skov, F. (2007). Could the tree diversity pattern in Europe be generated by
postglacial dispersal limitation? Ecology Letters, 10, 453-460.
Syverhuset, A. O. (2009). Recent changes in temperature and vegetation on Dovrefjell. NTNU -
Norwegian University of Science and Technology, Trondheim.
Tape, K., Sturm, M., & Racine, C. (2006). The evidence for shrub expansion in Northern Alaska and
the Pan-Arctic. Global Change Biology, 12, 686-702.
Tarnocai, C., Canadell, J. G., Schuur, E. A. G., Kuhry, P., Mazhitova, G., & Zimov, S. (2009). Soil
organic carbon pools in the northern circumpolar permafrost region. Global Biogeochemical Cycles,
23, 1-11.
Tarnocai, C., & Kimble, J. (2003). Determining carbon stocks in Cryosols using the Northern and Mid
Latitudes Soil Database. Physical Geography.
Theodose, T. A., & Bowman, W. D. (1997a). The Influence of Interspecific Competition on the
Distribution of an Alpine Graminoid: Evidence for the Importance of Plant Competition in an Extreme
Environment. Oikos, 79, 101.
Theodose, T. A., & Bowman, W. D. (1997b). Nutrient availability, plant abundance and species
diversity in two alpine tundra communities. Ecology, 78, 1861-1872.
Theurillat, J. P., Felber, F., Geissler, P., Gobat, J. M., Fierz, M., Fischlin, A., et al. (1998). Sensitivity
of plant and soil ecosystems of the Alps to climate change. Views from the Alps. Regional
Perspectives on Climate Change, 711, 225-308.
Thomas, C. D., Bodsworth, E. J., Wilson, R. J., Simmons, A. D., Davies, Z. G., Musche, M., et al.
(2001). Processes At Expanding. Nature, 411, 577-581.
Thompson, C., Beringer, J., Chapin, F. S., & McGuire, a. D. (2004). Structural complexity and land-
surface energy exchange along a gradient from arctic tundra to boreal forest. Journal of Vegetation
Science, 15, 397-406.
Thuiller, W., Lavorel, S., Araujo, M. B., Sykes, M. T., & Prentice, I. C. (2005). Climate change threats
to plant diversity in Europe. Proceedings of the National Academy of Sciences, 102, 8245-8250.
Thuiller, W. (2007). Biodiversity: climate change and the ecologist. Nature, 488 (7153), 550-552.
Tørseth, K., & Semb, A. (1997). Atmospheric deposition of nitrogen, sulfur and chloride in two
watersheds located in southern {Norway}. AMBIO - A Journal of the Human Environment, 26, 564-
576.
Travis, J. M. J. (2003). Climate change and habitat destruction: a deadly anthropogenic cocktail. Proc.
R. Soc. Lond. B, 270.
100
Trenberth, K. E. (1999). Conceptual framework for changes of extremes of the hydrological cycle with
climate change. Climatic Change, 42, 327-339.
Trivedi, M. R., Morecroft, M. D., Berry, P. M., & Dawson, T. P. (2008). Potential effects of climate
change on plant communities in three montane nature reserves in Scotland, UK. Biological
Conservation, 141, 1665-1675.
UCMP. (2015). University of California: Museum of Paleontology. Consulted on 0.510.2015 via
http://www.ucmp.berkeley.edu/.
Urban, M. C. (2015) Accelerating extinction risk from climate change. Science, 348, 571-573.
USDA. (1999). Soil Taxonomy. Soil Taxonomy A Basic System of Soil Classification for Making and
Interpreting Soil Surveys, 870.
van Grunsven, R. H. A., Bezemer, H. M., van der Putten, T. M., Tamis, W. L. M., Berendse, F., &
Veenendaal, E. M. (2007). Reduced plant-soil feedback of plant species expanding their range as
compared to natives. J. Ecol., 95, 1050-1057.
van Mantgem, P. J., & Schwilk, D. W. (2009). Negligible influence of spatial autocorrelation in the
assessment of fire effects in a mixed conifer forest. Fire Ecology, 5, 116-125.
Van Wijk, M. T., Clemmensen, K. E., Shaver, G. R., Williams, M., Callaghan, T. V., Chapin, F. S., et
al. (2004). Long-term ecosystem level experiments at Toolik Lake, Alaska, and at Abisko, Northern
Sweden: Generalizations and differences in ecosystem and plant type responses to global change.
Global Change Biology, 10, 105-123.
Vaughan, D. G., Callaghan, T., Furgal, C., & Prowse, T. D. (2007). Polar regions ( Arctic and
Antarctic ) Coordinating Lead Authors : Lead Authors : Contributing Authors : Review Editors.
Changes, 59, 653-685.
Vaughan, D. G., Comiso, J. C., Allison, I., Carrasco, J., Kaser, G., Kwok, R., et al. (2013).
Observations: Cryosphere. Climate Change 2013: The Physical Sci- ence Basis. Contribution of
Working Group I to the Fifth Assessment Report of the Intergovernmental Panel on Climate Change,
317-382.
Vavrus, S. J. (1999). The response of the coupled arctic sea ice-atmosphere system to orbital forcing
and ice motion at 6 kyr and 115 kyr BP. Journal of Climate, 12, 873-896.
Vellend, M. (2001). Do commonly used indices of b-diversity measure species turnover? J. Veg. Sci.,
12, 545-552.
Virtanen, R. (2000). Effects of grazing on above-ground biomass on a mountain snowbed, NW
Finland. Oikos, 90, 295-300.
Virtanen, R., Eskelinen, A., & Gaare, E. (2003). Long-term Changes in Alpine Plant Communities in
Norway and Finland. Ecological Studies, 167, 411-422.
Virtanen, R., Henttonen, H., & Laine, K. (1997). Lemming grazing and structure of a snowbed plant
community: A long-term experiment at Kilpisjarvi, Finnish Lapland. Oikos, 79, 155-166.
Virtanen, R., Grytnes, J-A., Lenoir, J., Luoto, M., Oksanen, J., Oksanen, L., et al. (2013).
Productivity-diversity patterns in arctic tundra vegetation. Ecography, 36, 331-341.
Voigt, W., Perner, J., Davis, A. J., Eggers, T., Schumacher, J., Bährmann, R., et al. (2003). Trophic
levels are differentially sensitive to climate. Ecology, 84, 2444-2453.
Walker, B. (1995). Conserving biological diversity through ecosystem resilience. Conserv Biol, 9,
747-752.
101
Walker, D. A., Halfpenny, J. C., Walker, M. D., & Wessman, C. A. (1993). Long-term studies of
snow-vegetation interactions. BioScience, 43, 287-301.
Walker, M., & Wahren, C. (2006). Plant community responses to experimental warming across the
tundra biome. Proceedings of the …, 103, 1342-1346.
Walker, M. D., Ingersoll, R. C., & Webber, P. J. (1995). Effects of interannual climate variation on
phenology and growth of two alpine forbs. Ecology, 76, 1067-1083.
Wallenstein, M. D., McMahon, S., & Schimel, J. (2007). Bacterial and fungal community structure in
Arctic tundra tussock and shrub soils. FEMS Microbiology Ecology, 59, 428-435.
Walther, G.-R. (2001). Laurophyllisation – a sign of a changing climate? . Biomonitoring: General and
Applied Aspects on Regional and Global Scales, 207-223.
Walther, G.-R. (2004). Plants in a warmer world. Perspectives in Plant Ecology Evolution and
Systematics, 6, 169-185.
Walther, G.-R. (2009). Alien species in a warmer world: risks and opportunities. Trends Ecol. Evol.,
24, 686-693.
Walther, G.-R. (2010). Community and ecosystem responses to recent climate change. Philosophical
transactions of the Royal Society of London. Series B, Biological sciences, 365, 2019-2024.
Walther, G.-R. (2010). Community and ecosystem responses to recent climate change. Philosophical
transactions of the Royal Society of London. Series B, Biological sciences, 365, 2019-2024.
Walther, G.-R., Beiÿner, S., & Burga, C. A. (2005). Trends in upward shift of alpine plants. J. Veg.
Sci, 16, 541-548.
Walther, G.-R., Post, E., Convey, P., Menzel, A., Parmesan, C., Beebee, T. J. C., et al. (2002).
Ecological responses to recent climate change. Nature, 416, 389-395.
Walther, G.-R., Pott, R., & Beissner, S. (2004). Climate change and high mountain vegetation.
Münster: Westfälische Wilhelms-Universität.
Walther, J. B., DeAndrea, D., Kim, J., & Anthony, J. C. (2010). The Influence of Online Comments
on Perceptions of Antimarijuana Public Service Announcements on YouTube. Human
Communication Research, 36, 469-492.
Wardle, P., & Coleman, M. C. (1992). Evidence for rising upper limits of four native New Zealand
forest trees. N. Z. J. Bot, 30, 303-314.
Warenberg, K., Danell, Ö., Gaare, E., & Nieminen, M. (1997). Flora i Reinbeteland (In Norwegian).
Oslo: Landbruksforlaget.
Webster, M. (Ed.) (2015). Consulted on 28.09.2015 via http://www.merriam-webster.com/.
Weintraub, M. N. (2011). Phosphorus in Action. Soil Biology, 26, 295-316.
Weintraub, M. N., & Schimel, J. P. (2005). Nitrogen Cycling and the Spread of Shrubs Control
Changes in the Carbon Balance of Arctic Tundra Ecosystems. BioScience, 55, 408.
Welch, D., Scott, D., & Thompson, D. B. A. (2015). Persistence of Carex bigelowii – Racomitrium
lanuginosum moss heath under sheep grazing in the Grampian Mountains, Scotland. Journal of
Bryology, 37, 96-103.
Whittaker, R. H. (1972). Evolution and Measurement of Species Diversity. Taxon, 21, 213-251.
Whittaker, R. J. (1960). Vegetation of the Siskiyou Mountains, Oregon and California. Ecol. Monogr.,
30, 279-338.
102
Wild, M. (2012). Enlightening global dimming and brightening. Bulletin of the American
Meteorological Society, 93, 27-37.
Williams, J. W., & Jackson, S. T. (2007). Novel climates, no-analog communities, and ecological
surprises. Front. Ecol. Environ, 5, 336-344.
Winner, C. (2003). Life in the Tundra.
Winton, M. (2006). Amplified Arctic climate change: What does surface albedo feedback have to do
with it? Geophysical Research Letters, 33, 1-4.
Wipf, S. (2006). Winter climate change in tundra ecosystems: the importance of snow cover.
Universität Zürich, Zürich.
Wipf, S., & Rixen, C. (2010). A review of snow manipulation experiments in Arctic and alpine tundra
ecosystems. Polar Research, 29, 95-109.
Wipf, S., Rixen, C., & Mulder, C. P. H. (2006). Advanced snowmelt causes shift towards positive
neighbour interactions in a subarctic tundra community. Global Change Biology, 12, 1496-1506.
Wipf, S., Stoeckli, V., & Bebi, P. (2009). Winter climate change in alpine tundra: Plant responses to
changes in snow depth and snowmelt timing. Climatic Change, 94, 105-121.
Wolf, A., Zimmermann, N. E., Anderegg, W. R. L., Busby, P. E., & Christensen, J. (2016). Altitudinal
shifts of the native and introduced flora of California in the context of 20th-century warming. Global
Ecology Biogeography, 25, 418-429.
Woodward, F. I., & Williams, B. G. (1987). Climate and plant distribution at global and local scales.
Vegetatio, 69, 189-197.
WRB. (2014). World reference base for soil resources 2014. International soil classification system for
naming soils and creating legends for soil maps. World Soil Resources Reports No. 106, 1-191.
Yu, X., Hyyppä, J., Kaartinen, H., Maltamo, M., & Hyyppä, H. (2008). Obtaining plotwise mean
height and volume growth in boreal forests using multi‐temporal laser surveys and various change
detection techniques. International Journal of Remote Sensing, 29, 1367-1386.
Zhu, Z., Piao, S., Myneni, R. B., Huang, M., Zeng, Z., Canadell, J. C., et al. (2016). Greening of the
Earth and its drivers. Nature Climate Change.
Zika, P. F. (1991). Discovery of Juncus vaseyi (Juncaceae) in Vermont. Rhodora, 93, 395-397.
Zong, S., Jin, Y., Xu, J., Wu, Z., He, H., Du, H., et al. (2016). Nitrogen deposition but not climate
warming promotes Deyeuxia angustifolia encroachment in alpine tundra of the Changbai Mountains,
Northeast China. Science of The Total Environment, 544, 85-93.
Zuber, D. (2004). Biological Flora of Central Europe: Viscum album L. Flora 199, 181-203.
103
Appendix
Appendix A: fauna in the Dovrefjell National Park The areas around the mountain range of Dovrefjell are characterized by a varying vegetation cover and
therefore provide an excellent habitat for numerous bird species. Next to some ptarmigans and small
birds, also larger raptors such as the celebrated golden eagle (Aquila chrysaetos), the gyrfalcon (Falco
rusticolus) and the rough-legged buzzard (Buteo lagopus) are commonly spotted in this region. In
addition, some larger mammals thrive within the borders of the national park. Wolverines (Gulo gulo),
for example, were able to establish a viable population, however they are rarely seen by humans in the
wild (Norway’s National Parks, 2015). They generally feed on small rodents, hares and grouse,
however sheep commonly occur on their daily menu as well (Midnorsknatur, 2015).
Along with the wolverine, the Arctic fox (Vulpes lagopus) is also native to the Dovrefjell area, but its
population has been declining dramatically during the last decades. Apparently, the mortality rate has
been remarkably higher than the reproduction rate, notwithstanding the fact that this species has been
continuously preserved since the 1950s. The reason for this rapid drop in the Arctic fox’s abundance
remains still a mystery, however two main probable causes have been recently suggested. On the one
hand, environmental changes such as human-induced climate change, an expansion of the red fox
population, the absence of large predators and variations in the dynamics of small rodents could be at
the basis of the decline. On the other hand, some researchers also suggest the changes in the Arctic
fox’s demographics (e.g. negative effects of inbreeding) might cause this dramatic ecological
response. Numerous monitoring projects have been established in order to protect the Arctic fox from
being extinct in Scandinavia. The Norwegian Institute for Nature Research (NINA), for example, has
recently founded a project, namely the ‘Arctic Fox Conservation Ecology’, which is responsible for
the preservation of a viable Arctic fox population in the wild. This project not only involves
monitoring and assessing the number and spatial distribution of individuals, but also sustainable
management decisions have to be made (Midnorsknatur, 2015; Norwegian Institute for Nature
Research, 2015; Landa et al., 2008).
Another unique mammal housing in the Dovrefjell area, is the musk ox (Ovibos moschatus). During
the last glacial period, this animal established a natural habitat which covered the entire northern part
of the Eurasian continent. Nonetheless, after the Last Glacial Maximum (11700 years ago), the musk
ox completely disappeared from the Dovrefjell area (Midnorsknatur, 2015). In 1931, it was
reintroduced to the region from Greenland. Yet, this limited population was extinct by 1945. Between
1947 and 1953, 21 individuals were again released in the Dovrefjell mountains. By 2006, the
population had grown up to 213 individuals, but a large fraction was extirpated during the summer of
that same year as a result of a pasteurellosis outbreak. In 2008, only 190 individuals were registered,
however the most recent survey already indicates an increase up to approximately 300 animals in the
area (Bretten, 1990; Syerhuset, 2009). Most of these musk oxen stay to the west of the Drivdalen
valley (Syverhuset, 2009; Michelsen et al., 2011).
The wild reindeer (Rangifer tarandus tarandus), commonly known as the Snøhetta reindeer, occur
both to the west (Snøhetta area) and to the east (Knutshø area) of the Drivdalen valley (Syverhuset,
2009). From a genetic point of view, this reindeer species is closely related to the original
Scandinavian wild reindeer (Midnorsknatur, 2015; Kaltenborn et al., 2014). Therefore, its preservation
is of major importance to conservation ecologists. Despite the fact that this species constantly migrates
104
over large distances through the landscape in search of food, the Snøhetta area forms its main natural
habitat. In this area two principal wild reindeer stocks can be distinguished, which are managed in a
different way. At first, the Snøhetta east population thrives in the valley of Eikesdalen to the east of
Lake Aursjøen. Along with the nearby road between Jore and Eikesdalen, this lake forms a natural
barrier which restricts the wild reindeer of migrating between both stocks. In order to preserve this
stock, the target winter stock size is set at a population of 1800 individuals. Nonetheless, the
population only contained half this number in 2003. As a result, hunting the wild reindeer was
prohibited in this area in the autumn of 2003. Secondly, the smaller Snøhetta west population houses
west of lake Aursjøen. For this herd, a winter stock size of approximately 500 animals is targeted
(Midnorsknatur, 2015; Kaltenborn et al., 2014). In total, the Snøhetta wild reindeer herd counted
around 8000-12000 animals in the 1950s. However, this number rapidly decreased to approximately
2000 as a result of frequent hunting activities in the following decades. By 2003, the lowest number of
individuals, only 653, was registered which seriously stimulated some preservation measures. In 2006,
the Snøhetta herd reached up to 1849 individuals, while in 2008 the population size dropped again to
1741 animals (Sørensen et al., 2009; Syverhuset, 2009). To the east of the Driva river, the Knutshø
herd expanded from a population of 1164 animals in 2001 up to 1526 individuals in 2008 (Sørensen et
al., 2009; Syverhuset, 2009).
Finally, also sheep are typically herded in the Dovrefjell area. For example, multiple farmers in the
municipality of Oppdal let their sheep graze to the east of the Driva river, mainly in the Knutshø area.
In total, over 6000 animals presently occur in this region. Furthermore, sheep herds from the Folldal
municipality are grazing in the area around the summit Vesle Armodshøkollen. These herds generally
move in the direction of Kongsvoll at the end of the summer (Syverhuset, 2009; Michelsen et al.,
2011).
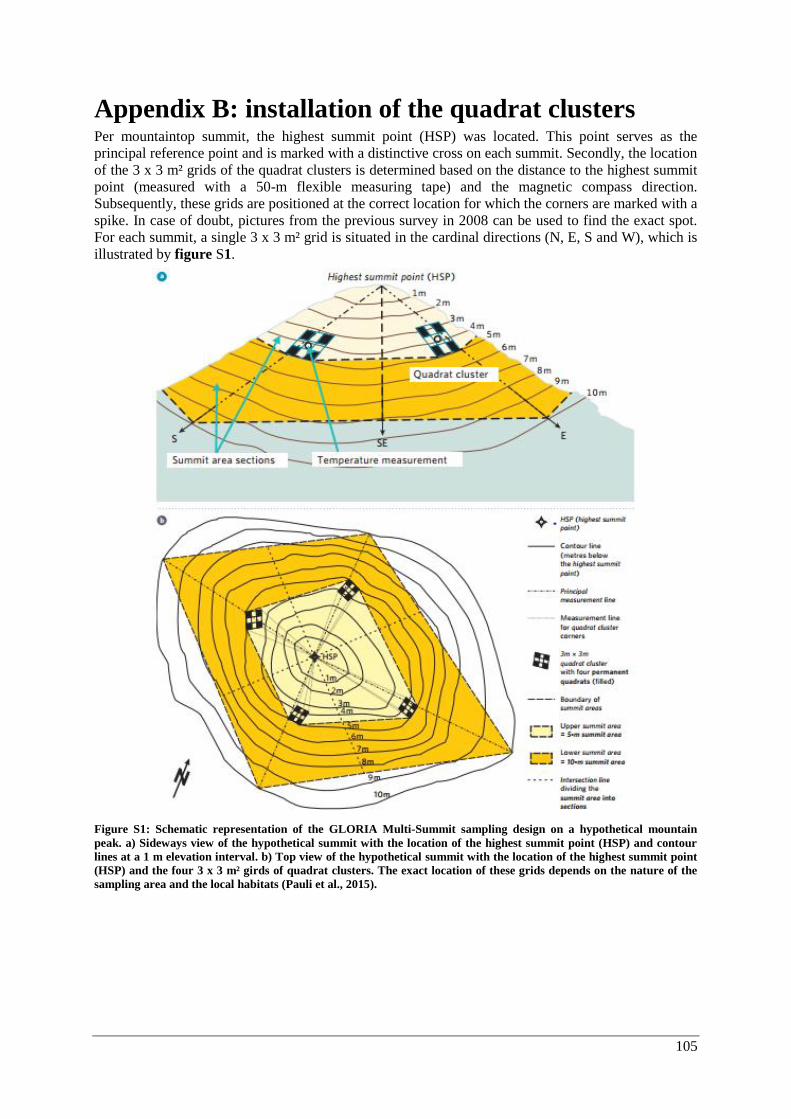
105
Appendix B: installation of the quadrat clusters Per mountaintop summit, the highest summit point (HSP) was located. This point serves as the
principal reference point and is marked with a distinctive cross on each summit. Secondly, the location
of the 3 x 3 m² grids of the quadrat clusters is determined based on the distance to the highest summit
point (measured with a 50-m flexible measuring tape) and the magnetic compass direction.
Subsequently, these grids are positioned at the correct location for which the corners are marked with a
spike. In case of doubt, pictures from the previous survey in 2008 can be used to find the exact spot.
For each summit, a single 3 x 3 m² grid is situated in the cardinal directions (N, E, S and W), which is
illustrated by figure S1.
Figure S1: Schematic representation of the GLORIA Multi-Summit sampling design on a hypothetical mountain
peak. a) Sideways view of the hypothetical summit with the location of the highest summit point (HSP) and contour
lines at a 1 m elevation interval. b) Top view of the hypothetical summit with the location of the highest summit point
(HSP) and the four 3 x 3 m² girds of quadrat clusters. The exact location of these grids depends on the nature of the
sampling area and the local habitats (Pauli et al., 2015).
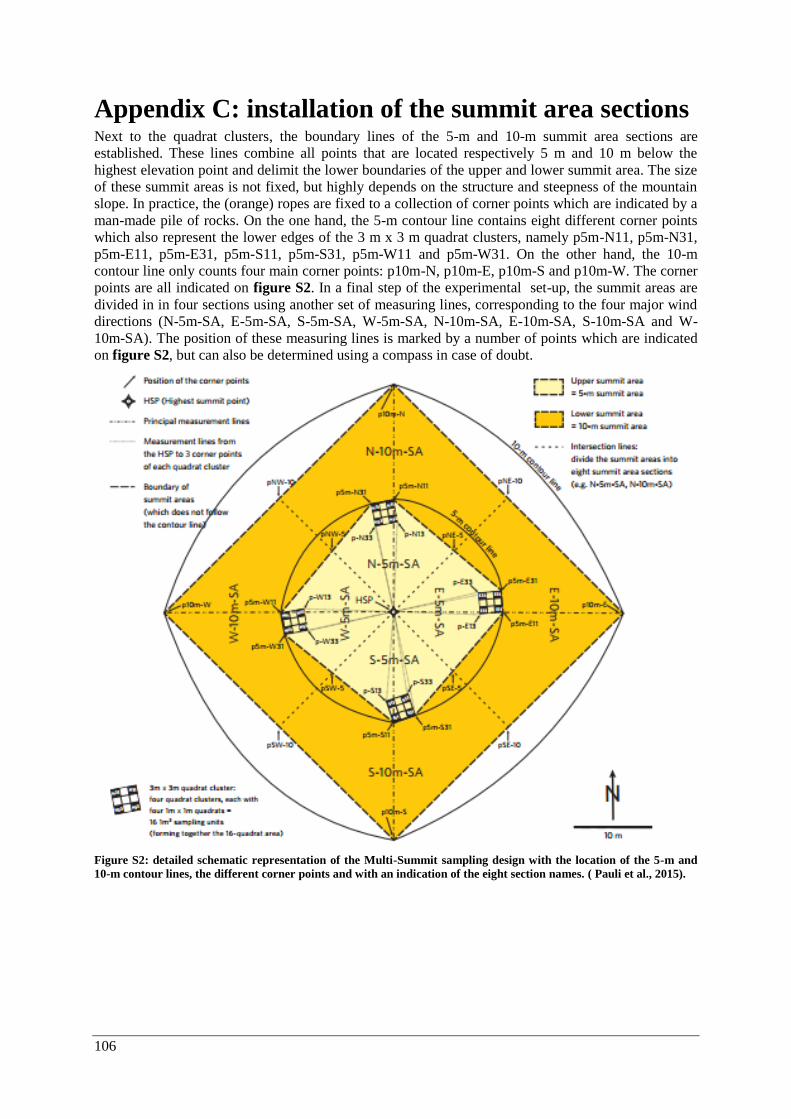
106
Appendix C: installation of the summit area sections Next to the quadrat clusters, the boundary lines of the 5-m and 10-m summit area sections are
established. These lines combine all points that are located respectively 5 m and 10 m below the
highest elevation point and delimit the lower boundaries of the upper and lower summit area. The size
of these summit areas is not fixed, but highly depends on the structure and steepness of the mountain
slope. In practice, the (orange) ropes are fixed to a collection of corner points which are indicated by a
man-made pile of rocks. On the one hand, the 5-m contour line contains eight different corner points
which also represent the lower edges of the 3 m x 3 m quadrat clusters, namely p5m-N11, p5m-N31,
p5m-E11, p5m-E31, p5m-S11, p5m-S31, p5m-W11 and p5m-W31. On the other hand, the 10-m
contour line only counts four main corner points: p10m-N, p10m-E, p10m-S and p10m-W. The corner
points are all indicated on figure S2. In a final step of the experimental set-up, the summit areas are
divided in in four sections using another set of measuring lines, corresponding to the four major wind
directions (N-5m-SA, E-5m-SA, S-5m-SA, W-5m-SA, N-10m-SA, E-10m-SA, S-10m-SA and W-
10m-SA). The position of these measuring lines is marked by a number of points which are indicated
on figure S2, but can also be determined using a compass in case of doubt.
Figure S2: detailed schematic representation of the Multi-Summit sampling design with the location of the 5-m and
10-m contour lines, the different corner points and with an indication of the eight section names. ( Pauli et al., 2015).

107
Appendix D: supplementary figures The Euclidean and Jaccard dissimilarity indices for vascular plants, lichens and bryophytes in the
quadrats of GLORIA summits at Dovrefjell were calculated and are displayed in figure S3 and S4.
Figure S3: : Mean Euclidean dissimilarity index for vascular plants (a, d), lichens (b, e) and bryophytes (c, f) in the
quadrats of the GLORIA summits (left) and the aspects of each summit (right) between 2001-2008, 2008-2015 and
2001-2015. The error bars give an indication of the corresponding standard error.
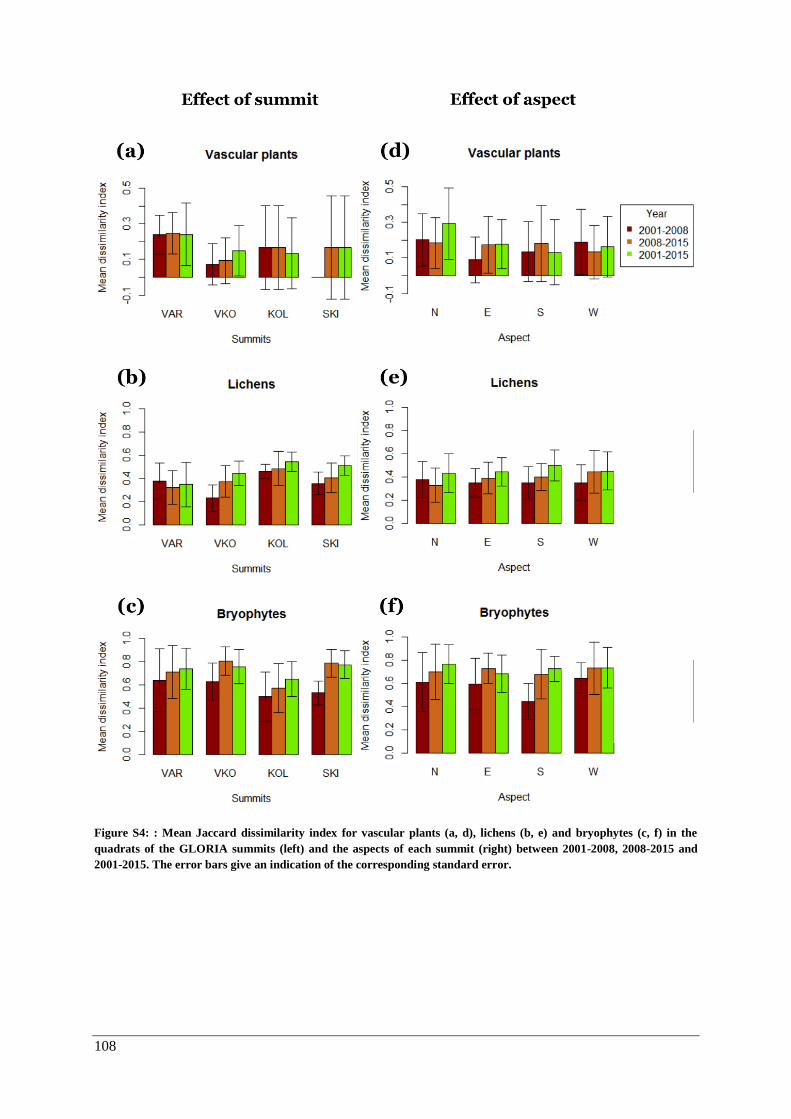
108
Figure S4: : Mean Jaccard dissimilarity index for vascular plants (a, d), lichens (b, e) and bryophytes (c, f) in the
quadrats of the GLORIA summits (left) and the aspects of each summit (right) between 2001-2008, 2008-2015 and
2001-2015. The error bars give an indication of the corresponding standard error.
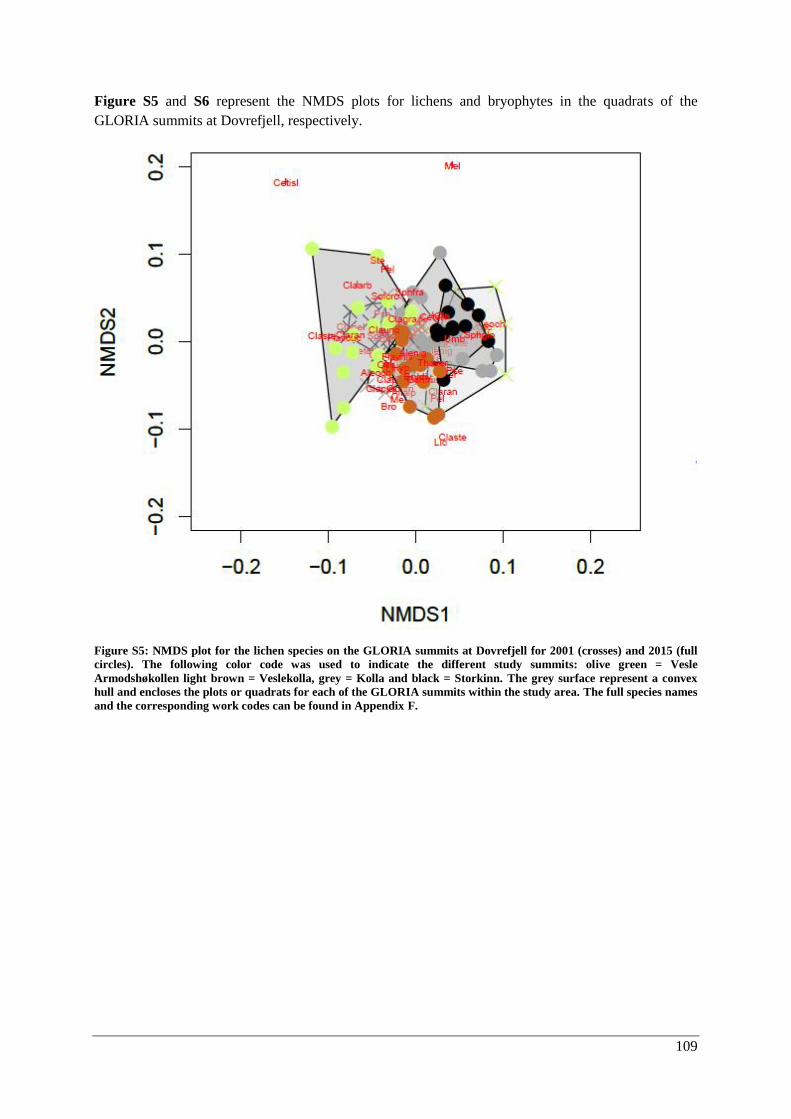
109
Figure S5 and S6 represent the NMDS plots for lichens and bryophytes in the quadrats of the
GLORIA summits at Dovrefjell, respectively.
Figure S5: NMDS plot for the lichen species on the GLORIA summits at Dovrefjell for 2001 (crosses) and 2015 (full
circles). The following color code was used to indicate the different study summits: olive green = Vesle
Armodshøkollen light brown = Veslekolla, grey = Kolla and black = Storkinn. The grey surface represent a convex
hull and encloses the plots or quadrats for each of the GLORIA summits within the study area. The full species names
and the corresponding work codes can be found in Appendix F.
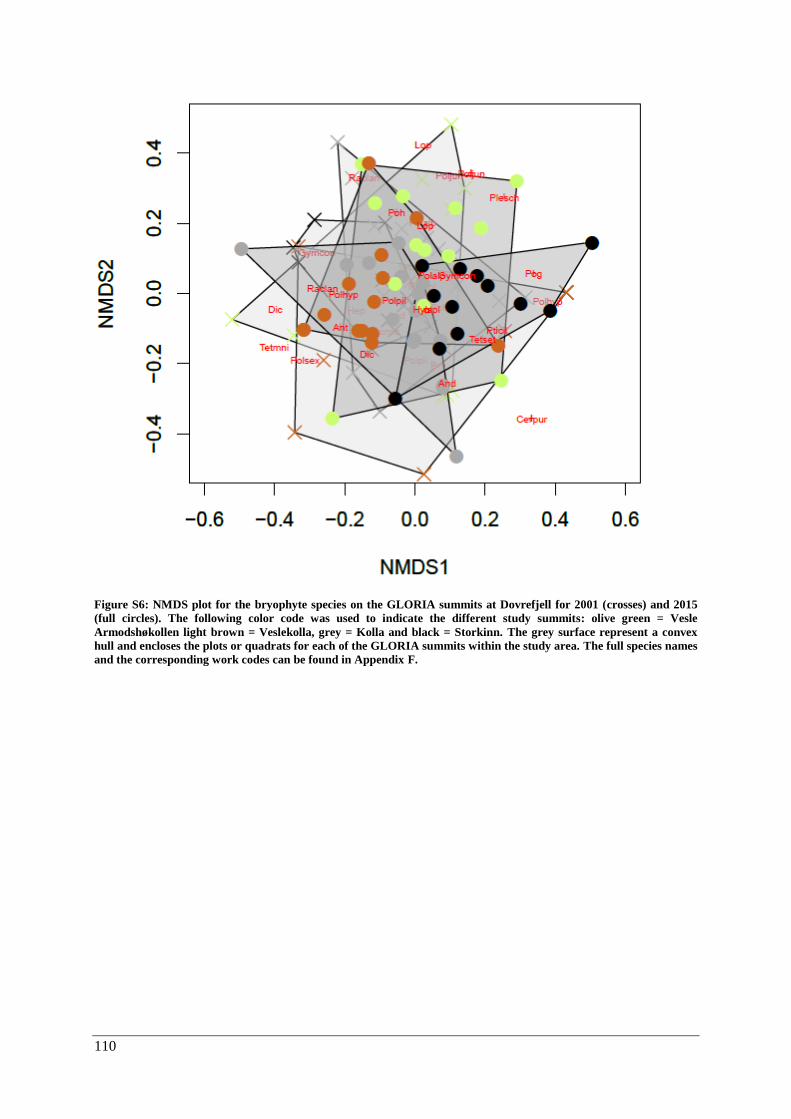
110
Figure S6: NMDS plot for the bryophyte species on the GLORIA summits at Dovrefjell for 2001 (crosses) and 2015
(full circles). The following color code was used to indicate the different study summits: olive green = Vesle
Armodshøkollen light brown = Veslekolla, grey = Kolla and black = Storkinn. The grey surface represent a convex
hull and encloses the plots or quadrats for each of the GLORIA summits within the study area. The full species names
and the corresponding work codes can be found in Appendix F.

111
Appendix E: species lists All vascular plant, lichen and bryophyte species - recorded on the GLORIA summits at Dovrefjell in
2001, 2008 and 2015 - are listed in table S1, S2, and S3, respectively. For every study summit, the
year in which the species was found, is specified. Years between brackets indicate that only dead
individuals of this specific species were recorded.
Table S1: List of vascular plant species recorded in 2001, 2008 and 2015 on the four study summits at Dovrefjell.
Species VAK VKO KOL STI
Agrostis mertensii
2001-2008
Antennaria alpina 2001-2008-2015
2001-2008
Antennaria dioica 2001-2008-2015
2015
Anthoxantum odoratum 2001-2008-2015
Arctostaphylos uva-ursi 2001-2008-2015 2008
Arctous alpinus 2001-2008-2015 2015
Artismesia norvegica 2001
Astragalus alpinus 2001-2008-2015
Astragalus frigidus 2001-2008-2015
Astragalus norvegicus 2001-2008-2015
Avenella flexuosa 2001-2008-2015 2001-2008-2015
Bartsia alpina 2001-2008-2015 2008
Beckwithia glacialis
2001-2008-2015
Betula nana 2001-2008-2015 2001-2008-2015
Betula nana x pubescens 2008-2015
Betula pubescens 2001-2008-2015
Bistorta vivpara 2001-2008-2015
Campanula rotundifolia 2001-2008-2015
Cardamine bellidifolia
2001-2015
Carex atrata 2008-2015
Carex bigelowii 2001-2008 2001-2008-2015 2001-2008-2015 2001-2008-2015
Carex rupestris 2001-2008-2015
2008
Carex vaginata 2001-2008-2015
Cerastium alpinum 2001-2008-2015
2001-2008
Comastoma tenellum 2015
Corallorhiza trifida 2015
Diapensia lapponica 2008 2001-2008-2015
Diphasiastrum alpinum 2001-2008-2015
Draba fladnizensis 2001-2008
2001
Draba glabella 2001-2008-2015
Empetrum nigrum 2001-2008-2015 2001-2008-2015 2001-2008-2015 2015
Epilobium angustifoilium 2001-2008-2015
Erigeron sp. 2015
Eriophorum scheuchzeri
2001-2008-2015
Euphrasia sp. 2008-(2015)
Festuca ovina 2001-2008-2015 2001-2008-2015 2001-2008-2015
Festuca vivipara
2001-2008-2015
Geranium sylvaticum 2015
Harrimanella hypnoides
2001-2008-2015
Hieracium alpinum 2001-2008-2015 2001-2008
Hieracium sp.
2015
Huperzia selago 2001
2001-2008-2015 2001-2008-2015
Juncus trifidus 2001-2008-2015 2001-2008-2015 2001-2008-2015
Juniperus communis 2001-2008-2015
Kobresia Mysuroides 2001-2008-2015
Loiseleuria procumbens 2001-2008-2015 2001-2008-2015
Luzula arcuata
2001-2008 2001-2008-2015 2001-2008-2015
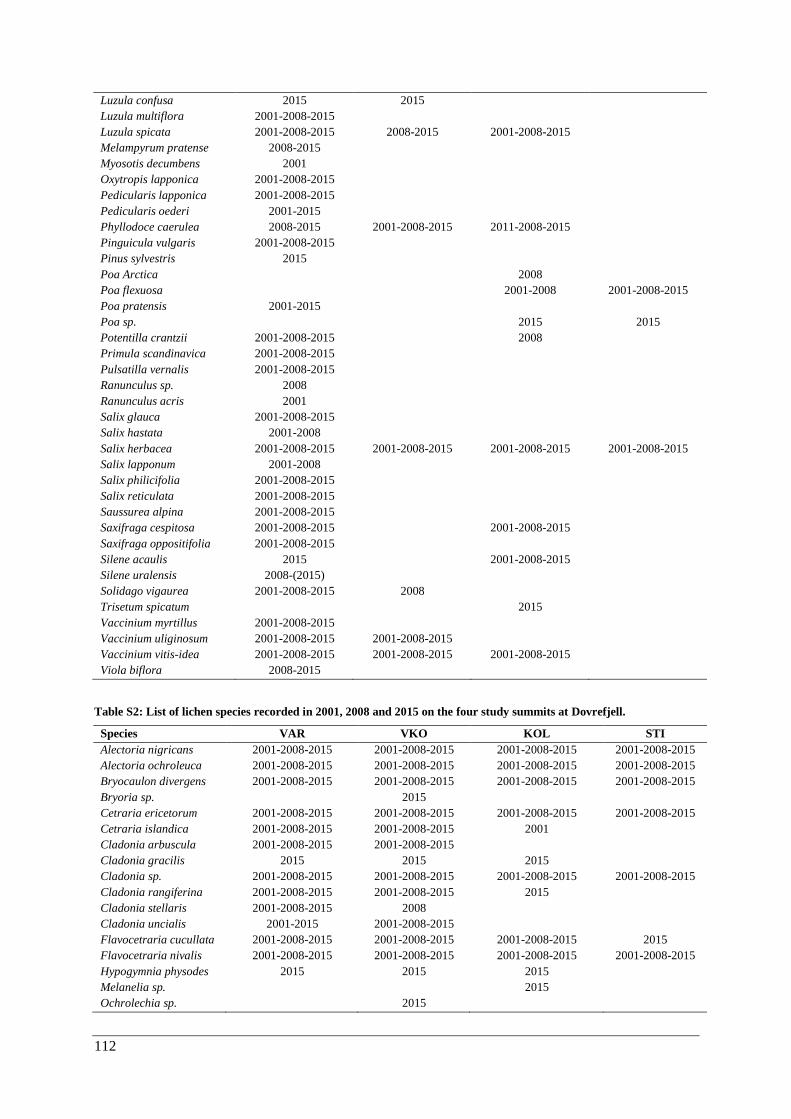
112
Luzula confusa 2015 2015
Luzula multiflora 2001-2008-2015
Luzula spicata 2001-2008-2015 2008-2015 2001-2008-2015
Melampyrum pratense 2008-2015
Myosotis decumbens 2001
Oxytropis lapponica 2001-2008-2015
Pedicularis lapponica 2001-2008-2015
Pedicularis oederi 2001-2015
Phyllodoce caerulea 2008-2015 2001-2008-2015 2011-2008-2015
Pinguicula vulgaris 2001-2008-2015
Pinus sylvestris 2015
Poa Arctica
2008
Poa flexuosa
2001-2008 2001-2008-2015
Poa pratensis 2001-2015
Poa sp.
2015 2015
Potentilla crantzii 2001-2008-2015
2008
Primula scandinavica 2001-2008-2015
Pulsatilla vernalis 2001-2008-2015
Ranunculus sp. 2008
Ranunculus acris 2001
Salix glauca 2001-2008-2015
Salix hastata 2001-2008
Salix herbacea 2001-2008-2015 2001-2008-2015 2001-2008-2015 2001-2008-2015
Salix lapponum 2001-2008
Salix philicifolia 2001-2008-2015
Salix reticulata 2001-2008-2015
Saussurea alpina 2001-2008-2015
Saxifraga cespitosa 2001-2008-2015
2001-2008-2015
Saxifraga oppositifolia 2001-2008-2015
Silene acaulis 2015
2001-2008-2015
Silene uralensis 2008-(2015)
Solidago vigaurea 2001-2008-2015 2008
Trisetum spicatum
2015
Vaccinium myrtillus 2001-2008-2015
Vaccinium uliginosum 2001-2008-2015 2001-2008-2015
Vaccinium vitis-idea 2001-2008-2015 2001-2008-2015 2001-2008-2015
Viola biflora 2008-2015
Table S2: List of lichen species recorded in 2001, 2008 and 2015 on the four study summits at Dovrefjell.
Species VAR VKO KOL STI
Alectoria nigricans 2001-2008-2015 2001-2008-2015 2001-2008-2015 2001-2008-2015
Alectoria ochroleuca 2001-2008-2015 2001-2008-2015 2001-2008-2015 2001-2008-2015
Bryocaulon divergens 2001-2008-2015 2001-2008-2015 2001-2008-2015 2001-2008-2015
Bryoria sp.
2015
Cetraria ericetorum 2001-2008-2015 2001-2008-2015 2001-2008-2015 2001-2008-2015
Cetraria islandica 2001-2008-2015 2001-2008-2015 2001
Cladonia arbuscula 2001-2008-2015 2001-2008-2015
Cladonia gracilis 2015 2015 2015
Cladonia sp. 2001-2008-2015 2001-2008-2015 2001-2008-2015 2001-2008-2015
Cladonia rangiferina 2001-2008-2015 2001-2008-2015 2015
Cladonia stellaris 2001-2008-2015 2008
Cladonia uncialis 2001-2015 2001-2008-2015
Flavocetraria cucullata 2001-2008-2015 2001-2008-2015 2001-2008-2015 2015
Flavocetraria nivalis 2001-2008-2015 2001-2008-2015 2001-2008-2015 2001-2008-2015
Hypogymnia physodes 2015 2015 2015
Melanelia sp.
2015
Ochrolechia sp.
2015
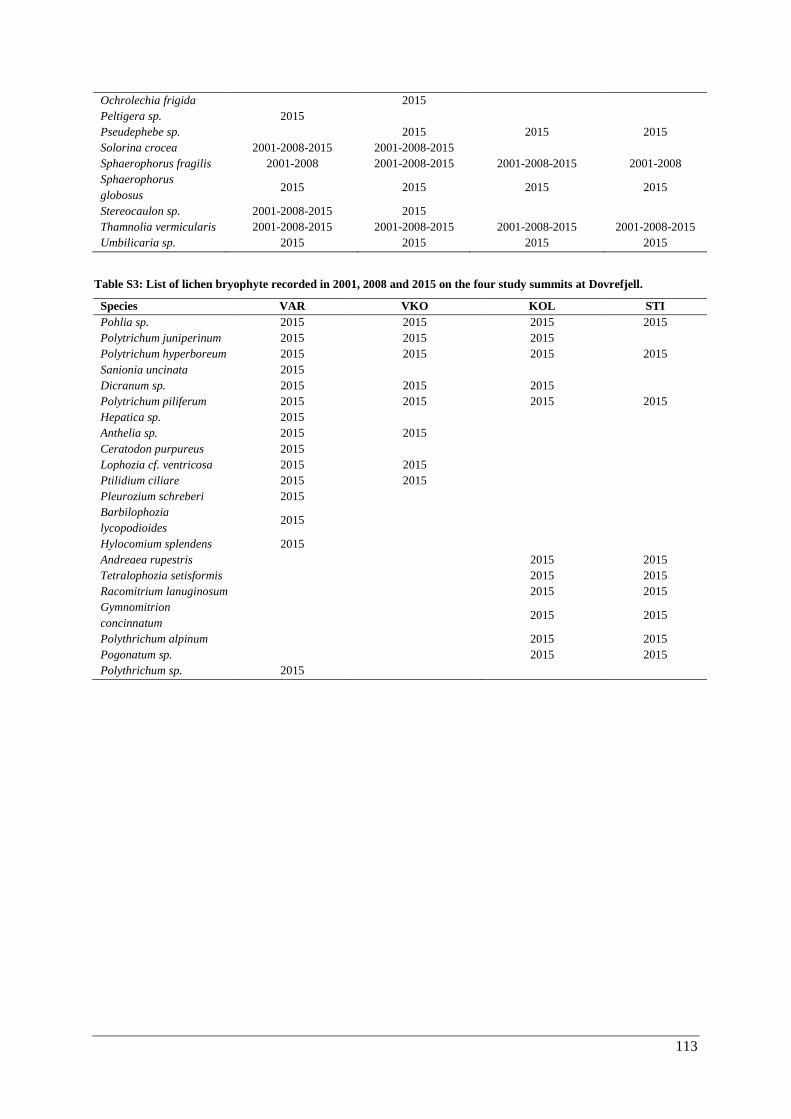
113
Ochrolechia frigida
2015
Peltigera sp. 2015
Pseudephebe sp.
2015 2015 2015
Solorina crocea 2001-2008-2015 2001-2008-2015
Sphaerophorus fragilis 2001-2008 2001-2008-2015 2001-2008-2015 2001-2008
Sphaerophorus
globosus 2015 2015 2015 2015
Stereocaulon sp. 2001-2008-2015 2015
Thamnolia vermicularis 2001-2008-2015 2001-2008-2015 2001-2008-2015 2001-2008-2015
Umbilicaria sp. 2015 2015 2015 2015
Table S3: List of lichen bryophyte recorded in 2001, 2008 and 2015 on the four study summits at Dovrefjell.
Species VAR VKO KOL STI
Pohlia sp. 2015 2015 2015 2015
Polytrichum juniperinum 2015 2015 2015
Polytrichum hyperboreum 2015 2015 2015 2015
Sanionia uncinata 2015
Dicranum sp. 2015 2015 2015
Polytrichum piliferum 2015 2015 2015 2015
Hepatica sp. 2015
Anthelia sp. 2015 2015
Ceratodon purpureus 2015
Lophozia cf. ventricosa 2015 2015
Ptilidium ciliare 2015 2015
Pleurozium schreberi 2015
Barbilophozia
lycopodioides 2015
Hylocomium splendens 2015
Andreaea rupestris
2015 2015
Tetralophozia setisformis
2015 2015
Racomitrium lanuginosum
2015 2015
Gymnomitrion
concinnatum 2015 2015
Polythrichum alpinum
2015 2015
Pogonatum sp.
2015 2015
Polythrichum sp. 2015
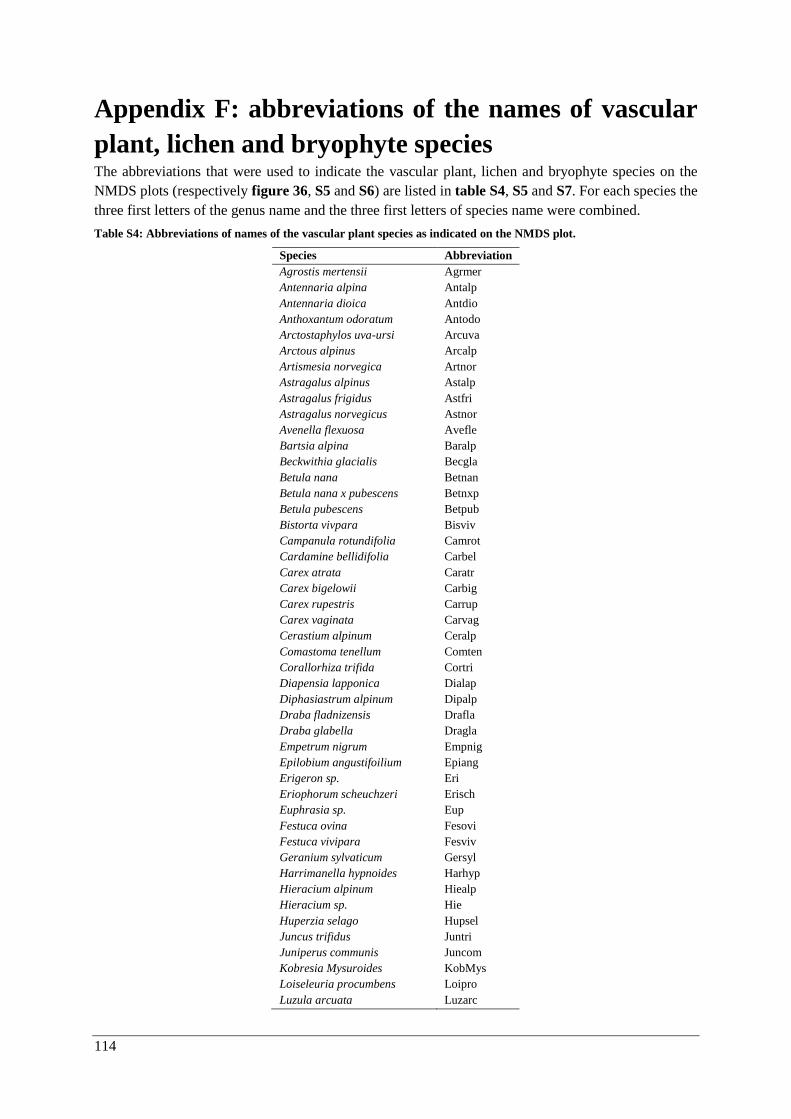
114
Appendix F: abbreviations of the names of vascular
plant, lichen and bryophyte species The abbreviations that were used to indicate the vascular plant, lichen and bryophyte species on the
NMDS plots (respectively figure 36, S5 and S6) are listed in table S4, S5 and S7. For each species the
three first letters of the genus name and the three first letters of species name were combined.
Table S4: Abbreviations of names of the vascular plant species as indicated on the NMDS plot.
Species Abbreviation
Agrostis mertensii Agrmer
Antennaria alpina Antalp
Antennaria dioica Antdio
Anthoxantum odoratum Antodo
Arctostaphylos uva-ursi Arcuva
Arctous alpinus Arcalp
Artismesia norvegica Artnor
Astragalus alpinus Astalp
Astragalus frigidus Astfri
Astragalus norvegicus Astnor
Avenella flexuosa Avefle
Bartsia alpina Baralp
Beckwithia glacialis Becgla
Betula nana Betnan
Betula nana x pubescens Betnxp
Betula pubescens Betpub
Bistorta vivpara Bisviv
Campanula rotundifolia Camrot
Cardamine bellidifolia Carbel
Carex atrata Caratr
Carex bigelowii Carbig
Carex rupestris Carrup
Carex vaginata Carvag
Cerastium alpinum Ceralp
Comastoma tenellum Comten
Corallorhiza trifida Cortri
Diapensia lapponica Dialap
Diphasiastrum alpinum Dipalp
Draba fladnizensis Drafla
Draba glabella Dragla
Empetrum nigrum Empnig
Epilobium angustifoilium Epiang
Erigeron sp. Eri
Eriophorum scheuchzeri Erisch
Euphrasia sp. Eup
Festuca ovina Fesovi
Festuca vivipara Fesviv
Geranium sylvaticum Gersyl
Harrimanella hypnoides Harhyp
Hieracium alpinum Hiealp
Hieracium sp. Hie
Huperzia selago Hupsel
Juncus trifidus Juntri
Juniperus communis Juncom
Kobresia Mysuroides KobMys
Loiseleuria procumbens Loipro
Luzula arcuata Luzarc
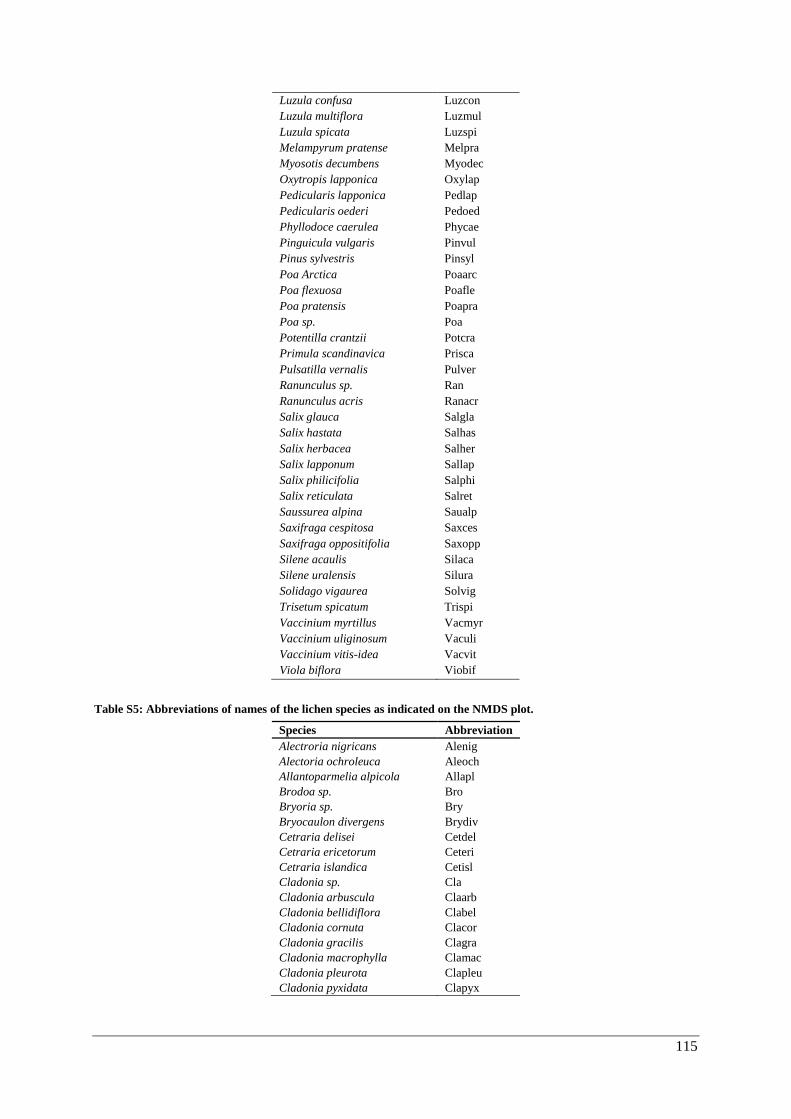
115
Luzula confusa Luzcon
Luzula multiflora Luzmul
Luzula spicata Luzspi
Melampyrum pratense Melpra
Myosotis decumbens Myodec
Oxytropis lapponica Oxylap
Pedicularis lapponica Pedlap
Pedicularis oederi Pedoed
Phyllodoce caerulea Phycae
Pinguicula vulgaris Pinvul
Pinus sylvestris Pinsyl
Poa Arctica Poaarc
Poa flexuosa Poafle
Poa pratensis Poapra
Poa sp. Poa
Potentilla crantzii Potcra
Primula scandinavica Prisca
Pulsatilla vernalis Pulver
Ranunculus sp. Ran
Ranunculus acris Ranacr
Salix glauca Salgla
Salix hastata Salhas
Salix herbacea Salher
Salix lapponum Sallap
Salix philicifolia Salphi
Salix reticulata Salret
Saussurea alpina Saualp
Saxifraga cespitosa Saxces
Saxifraga oppositifolia Saxopp
Silene acaulis Silaca
Silene uralensis Silura
Solidago vigaurea Solvig
Trisetum spicatum Trispi
Vaccinium myrtillus Vacmyr
Vaccinium uliginosum Vaculi
Vaccinium vitis-idea Vacvit
Viola biflora Viobif
Table S5: Abbreviations of names of the lichen species as indicated on the NMDS plot.
Species Abbreviation
Alectroria nigricans Alenig
Alectoria ochroleuca Aleoch
Allantoparmelia alpicola Allapl
Brodoa sp. Bro
Bryoria sp. Bry
Bryocaulon divergens Brydiv
Cetraria delisei Cetdel
Cetraria ericetorum Ceteri
Cetraria islandica Cetisl
Cladonia sp. Cla
Cladonia arbuscula Claarb
Cladonia bellidiflora Clabel
Cladonia cornuta Clacor
Cladonia gracilis Clagra
Cladonia macrophylla Clamac
Cladonia pleurota Clapleu
Cladonia pyxidata Clapyx
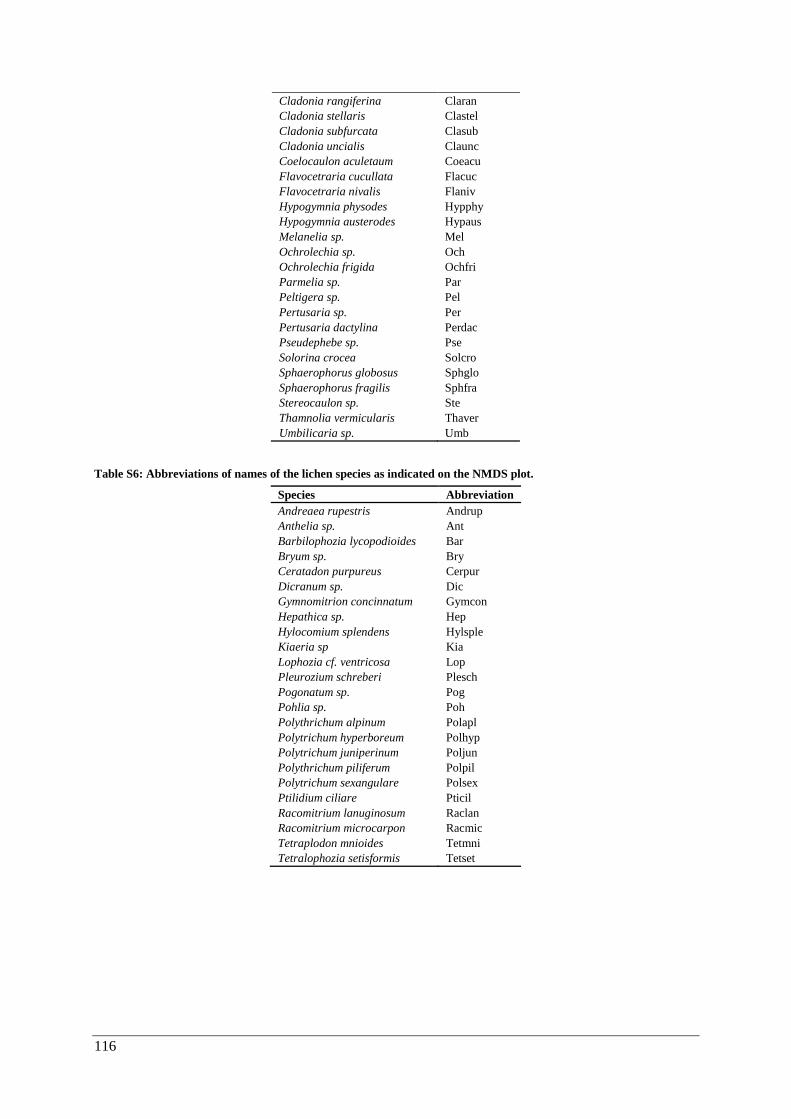
116
Cladonia rangiferina Claran
Cladonia stellaris Clastel
Cladonia subfurcata Clasub
Cladonia uncialis Claunc
Coelocaulon aculetaum Coeacu
Flavocetraria cucullata Flacuc
Flavocetraria nivalis Flaniv
Hypogymnia physodes Hypphy
Hypogymnia austerodes Hypaus
Melanelia sp. Mel
Ochrolechia sp. Och
Ochrolechia frigida Ochfri
Parmelia sp. Par
Peltigera sp. Pel
Pertusaria sp. Per
Pertusaria dactylina Perdac
Pseudephebe sp. Pse
Solorina crocea Solcro
Sphaerophorus globosus Sphglo
Sphaerophorus fragilis Sphfra
Stereocaulon sp. Ste
Thamnolia vermicularis Thaver
Umbilicaria sp. Umb
Table S6: Abbreviations of names of the lichen species as indicated on the NMDS plot.
Species Abbreviation
Andreaea rupestris Andrup
Anthelia sp. Ant
Barbilophozia lycopodioides Bar
Bryum sp. Bry
Ceratadon purpureus Cerpur
Dicranum sp. Dic
Gymnomitrion concinnatum Gymcon
Hepathica sp. Hep
Hylocomium splendens Hylsple
Kiaeria sp Kia
Lophozia cf. ventricosa Lop
Pleurozium schreberi Plesch
Pogonatum sp. Pog
Pohlia sp. Poh
Polythrichum alpinum Polapl
Polytrichum hyperboreum Polhyp
Polytrichum juniperinum Poljun
Polythrichum piliferum Polpil
Polytrichum sexangulare Polsex
Ptilidium ciliare Pticil
Racomitrium lanuginosum Raclan
Racomitrium microcarpon Racmic
Tetraplodon mnioides Tetmni
Tetralophozia setisformis Tetset
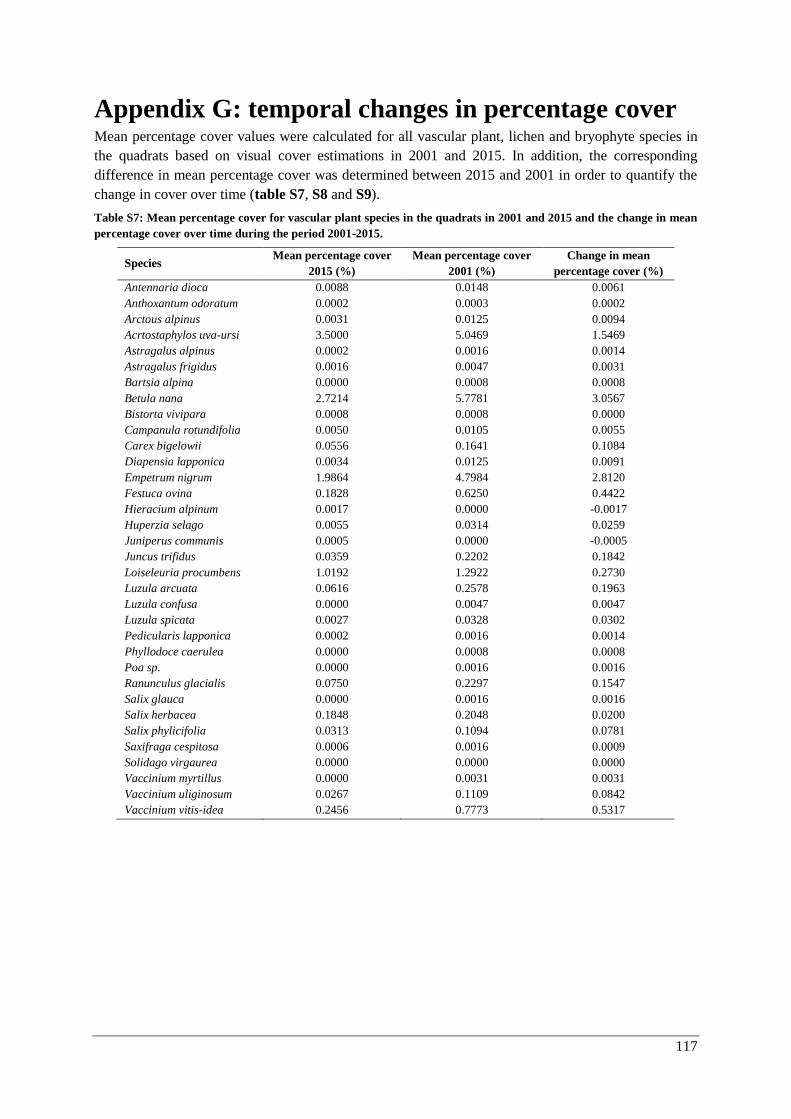
117
Appendix G: temporal changes in percentage cover Mean percentage cover values were calculated for all vascular plant, lichen and bryophyte species in
the quadrats based on visual cover estimations in 2001 and 2015. In addition, the corresponding
difference in mean percentage cover was determined between 2015 and 2001 in order to quantify the
change in cover over time (table S7, S8 and S9).
Table S7: Mean percentage cover for vascular plant species in the quadrats in 2001 and 2015 and the change in mean
percentage cover over time during the period 2001-2015.
Species Mean percentage cover
2015 (%)
Mean percentage cover
2001 (%)
Change in mean
percentage cover (%)
Antennaria dioca 0.0088 0.0148 0.0061
Anthoxantum odoratum 0.0002 0.0003 0.0002
Arctous alpinus 0.0031 0.0125 0.0094
Acrtostaphylos uva-ursi 3.5000 5.0469 1.5469
Astragalus alpinus 0.0002 0.0016 0.0014
Astragalus frigidus 0.0016 0.0047 0.0031
Bartsia alpina 0.0000 0.0008 0.0008
Betula nana 2.7214 5.7781 3.0567
Bistorta vivipara 0.0008 0.0008 0.0000
Campanula rotundifolia 0.0050 0.0105 0.0055
Carex bigelowii 0.0556 0.1641 0.1084
Diapensia lapponica 0.0034 0.0125 0.0091
Empetrum nigrum 1.9864 4.7984 2.8120
Festuca ovina 0.1828 0.6250 0.4422
Hieracium alpinum 0.0017 0.0000 -0.0017
Huperzia selago 0.0055 0.0314 0.0259
Juniperus communis 0.0005 0.0000 -0.0005
Juncus trifidus 0.0359 0.2202 0.1842
Loiseleuria procumbens 1.0192 1.2922 0.2730
Luzula arcuata 0.0616 0.2578 0.1963
Luzula confusa 0.0000 0.0047 0.0047
Luzula spicata 0.0027 0.0328 0.0302
Pedicularis lapponica 0.0002 0.0016 0.0014
Phyllodoce caerulea 0.0000 0.0008 0.0008
Poa sp. 0.0000 0.0016 0.0016
Ranunculus glacialis 0.0750 0.2297 0.1547
Salix glauca 0.0000 0.0016 0.0016
Salix herbacea 0.1848 0.2048 0.0200
Salix phylicifolia 0.0313 0.1094 0.0781
Saxifraga cespitosa 0.0006 0.0016 0.0009
Solidago virgaurea 0.0000 0.0000 0.0000
Vaccinium myrtillus 0.0000 0.0031 0.0031
Vaccinium uliginosum 0.0267 0.1109 0.0842
Vaccinium vitis-idea 0.2456 0.7773 0.5317
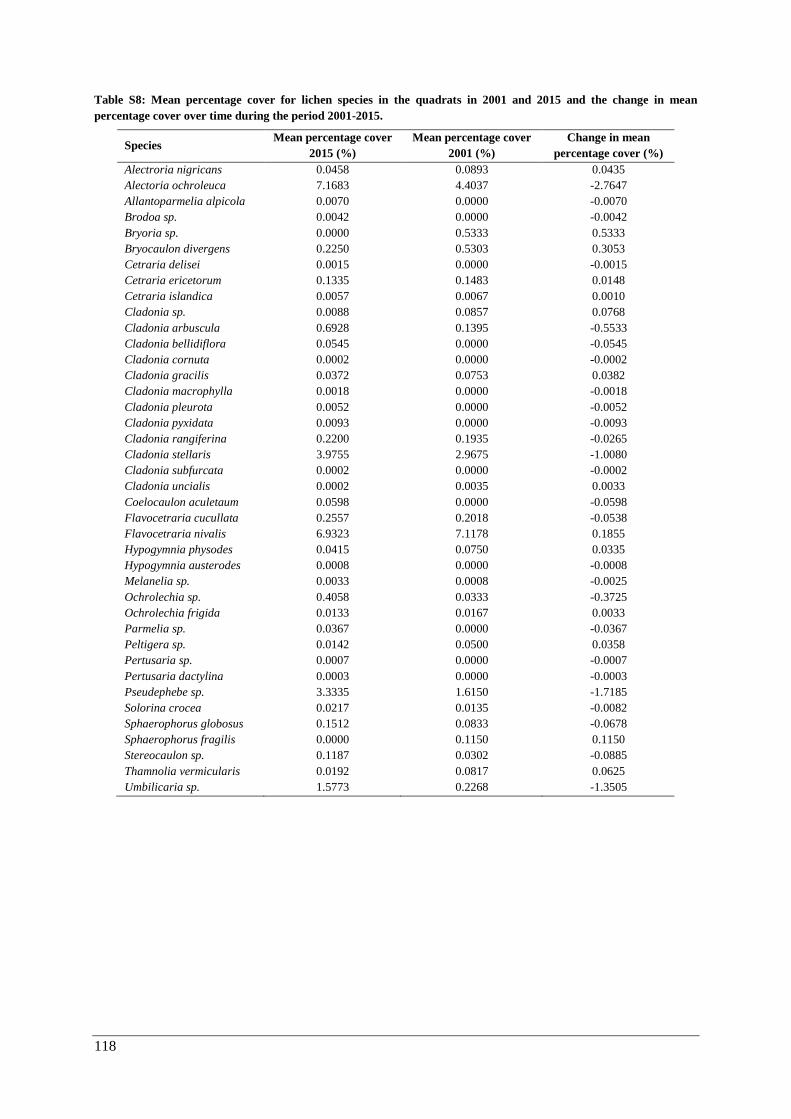
118
Table S8: Mean percentage cover for lichen species in the quadrats in 2001 and 2015 and the change in mean
percentage cover over time during the period 2001-2015.
Species Mean percentage cover
2015 (%)
Mean percentage cover
2001 (%)
Change in mean
percentage cover (%)
Alectroria nigricans 0.0458 0.0893 0.0435
Alectoria ochroleuca 7.1683 4.4037 -2.7647
Allantoparmelia alpicola 0.0070 0.0000 -0.0070
Brodoa sp. 0.0042 0.0000 -0.0042
Bryoria sp. 0.0000 0.5333 0.5333
Bryocaulon divergens 0.2250 0.5303 0.3053
Cetraria delisei 0.0015 0.0000 -0.0015
Cetraria ericetorum 0.1335 0.1483 0.0148
Cetraria islandica 0.0057 0.0067 0.0010
Cladonia sp. 0.0088 0.0857 0.0768
Cladonia arbuscula 0.6928 0.1395 -0.5533
Cladonia bellidiflora 0.0545 0.0000 -0.0545
Cladonia cornuta 0.0002 0.0000 -0.0002
Cladonia gracilis 0.0372 0.0753 0.0382
Cladonia macrophylla 0.0018 0.0000 -0.0018
Cladonia pleurota 0.0052 0.0000 -0.0052
Cladonia pyxidata 0.0093 0.0000 -0.0093
Cladonia rangiferina 0.2200 0.1935 -0.0265
Cladonia stellaris 3.9755 2.9675 -1.0080
Cladonia subfurcata 0.0002 0.0000 -0.0002
Cladonia uncialis 0.0002 0.0035 0.0033
Coelocaulon aculetaum 0.0598 0.0000 -0.0598
Flavocetraria cucullata 0.2557 0.2018 -0.0538
Flavocetraria nivalis 6.9323 7.1178 0.1855
Hypogymnia physodes 0.0415 0.0750 0.0335
Hypogymnia austerodes 0.0008 0.0000 -0.0008
Melanelia sp. 0.0033 0.0008 -0.0025
Ochrolechia sp. 0.4058 0.0333 -0.3725
Ochrolechia frigida 0.0133 0.0167 0.0033
Parmelia sp. 0.0367 0.0000 -0.0367
Peltigera sp. 0.0142 0.0500 0.0358
Pertusaria sp. 0.0007 0.0000 -0.0007
Pertusaria dactylina 0.0003 0.0000 -0.0003
Pseudephebe sp. 3.3335 1.6150 -1.7185
Solorina crocea 0.0217 0.0135 -0.0082
Sphaerophorus globosus 0.1512 0.0833 -0.0678
Sphaerophorus fragilis 0.0000 0.1150 0.1150
Stereocaulon sp. 0.1187 0.0302 -0.0885
Thamnolia vermicularis 0.0192 0.0817 0.0625
Umbilicaria sp. 1.5773 0.2268 -1.3505
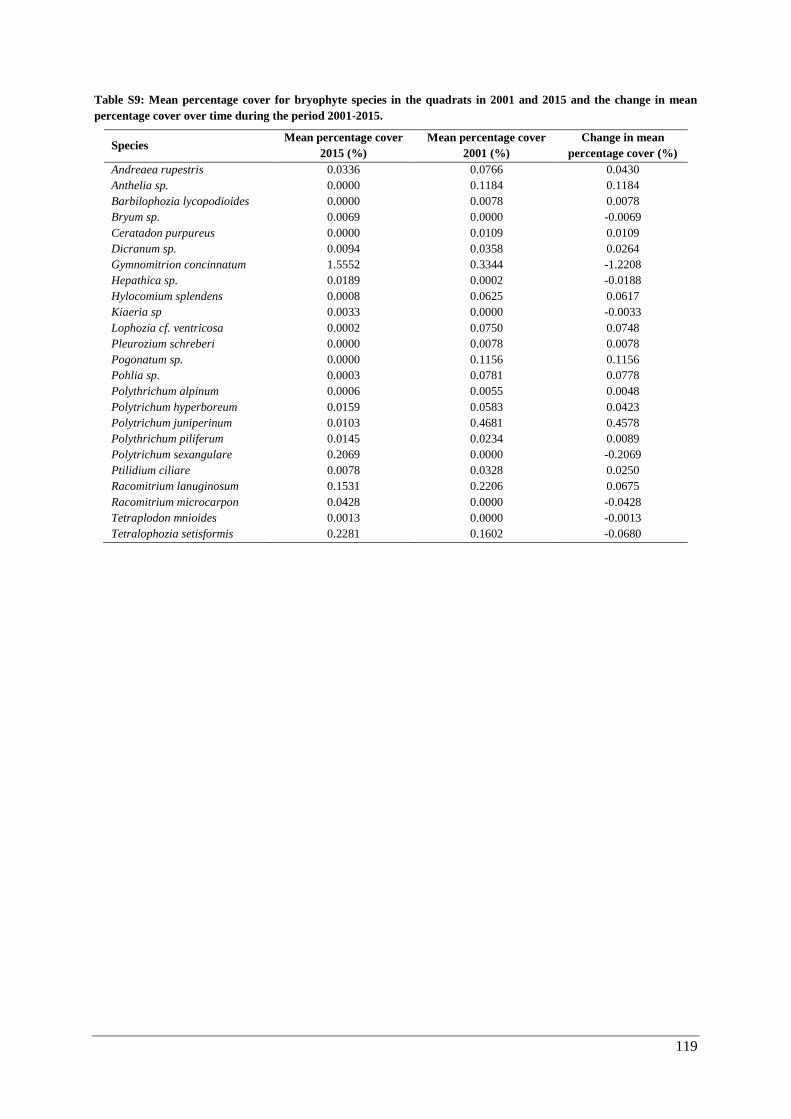
119
Table S9: Mean percentage cover for bryophyte species in the quadrats in 2001 and 2015 and the change in mean
percentage cover over time during the period 2001-2015.
Species Mean percentage cover
2015 (%)
Mean percentage cover
2001 (%)
Change in mean
percentage cover (%)
Andreaea rupestris 0.0336 0.0766 0.0430
Anthelia sp. 0.0000 0.1184 0.1184
Barbilophozia lycopodioides 0.0000 0.0078 0.0078
Bryum sp. 0.0069 0.0000 -0.0069
Ceratadon purpureus 0.0000 0.0109 0.0109
Dicranum sp. 0.0094 0.0358 0.0264
Gymnomitrion concinnatum 1.5552 0.3344 -1.2208
Hepathica sp. 0.0189 0.0002 -0.0188
Hylocomium splendens 0.0008 0.0625 0.0617
Kiaeria sp 0.0033 0.0000 -0.0033
Lophozia cf. ventricosa 0.0002 0.0750 0.0748
Pleurozium schreberi 0.0000 0.0078 0.0078
Pogonatum sp. 0.0000 0.1156 0.1156
Pohlia sp. 0.0003 0.0781 0.0778
Polythrichum alpinum 0.0006 0.0055 0.0048
Polytrichum hyperboreum 0.0159 0.0583 0.0423
Polytrichum juniperinum 0.0103 0.4681 0.4578
Polythrichum piliferum 0.0145 0.0234 0.0089
Polytrichum sexangulare 0.2069 0.0000 -0.2069
Ptilidium ciliare 0.0078 0.0328 0.0250
Racomitrium lanuginosum 0.1531 0.2206 0.0675
Racomitrium microcarpon 0.0428 0.0000 -0.0428
Tetraplodon mnioides 0.0013 0.0000 -0.0013
Tetralophozia setisformis 0.2281 0.1602 -0.0680
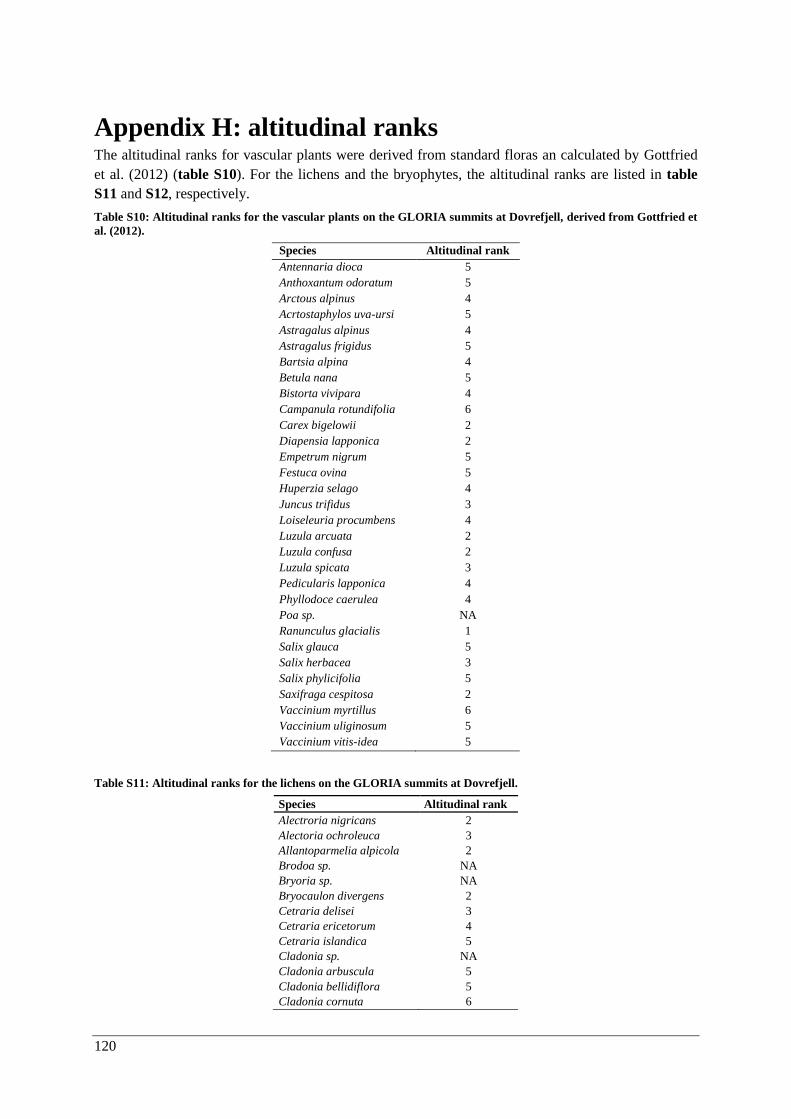
120
Appendix H: altitudinal ranks The altitudinal ranks for vascular plants were derived from standard floras an calculated by Gottfried
et al. (2012) (table S10). For the lichens and the bryophytes, the altitudinal ranks are listed in table
S11 and S12, respectively.
Table S10: Altitudinal ranks for the vascular plants on the GLORIA summits at Dovrefjell, derived from Gottfried et
al. (2012).
Species Altitudinal rank
Antennaria dioca 5
Anthoxantum odoratum 5
Arctous alpinus 4
Acrtostaphylos uva-ursi 5
Astragalus alpinus 4
Astragalus frigidus 5
Bartsia alpina 4
Betula nana 5
Bistorta vivipara 4
Campanula rotundifolia 6
Carex bigelowii 2
Diapensia lapponica 2
Empetrum nigrum 5
Festuca ovina 5
Huperzia selago 4
Juncus trifidus 3
Loiseleuria procumbens 4
Luzula arcuata 2
Luzula confusa 2
Luzula spicata 3
Pedicularis lapponica 4
Phyllodoce caerulea 4
Poa sp. NA
Ranunculus glacialis 1
Salix glauca 5
Salix herbacea 3
Salix phylicifolia 5
Saxifraga cespitosa 2
Vaccinium myrtillus 6
Vaccinium uliginosum 5
Vaccinium vitis-idea 5
Table S11: Altitudinal ranks for the lichens on the GLORIA summits at Dovrefjell.
Species Altitudinal rank
Alectroria nigricans 2
Alectoria ochroleuca 3
Allantoparmelia alpicola 2
Brodoa sp. NA
Bryoria sp. NA
Bryocaulon divergens 2
Cetraria delisei 3
Cetraria ericetorum 4
Cetraria islandica 5
Cladonia sp. NA
Cladonia arbuscula 5
Cladonia bellidiflora 5
Cladonia cornuta 6
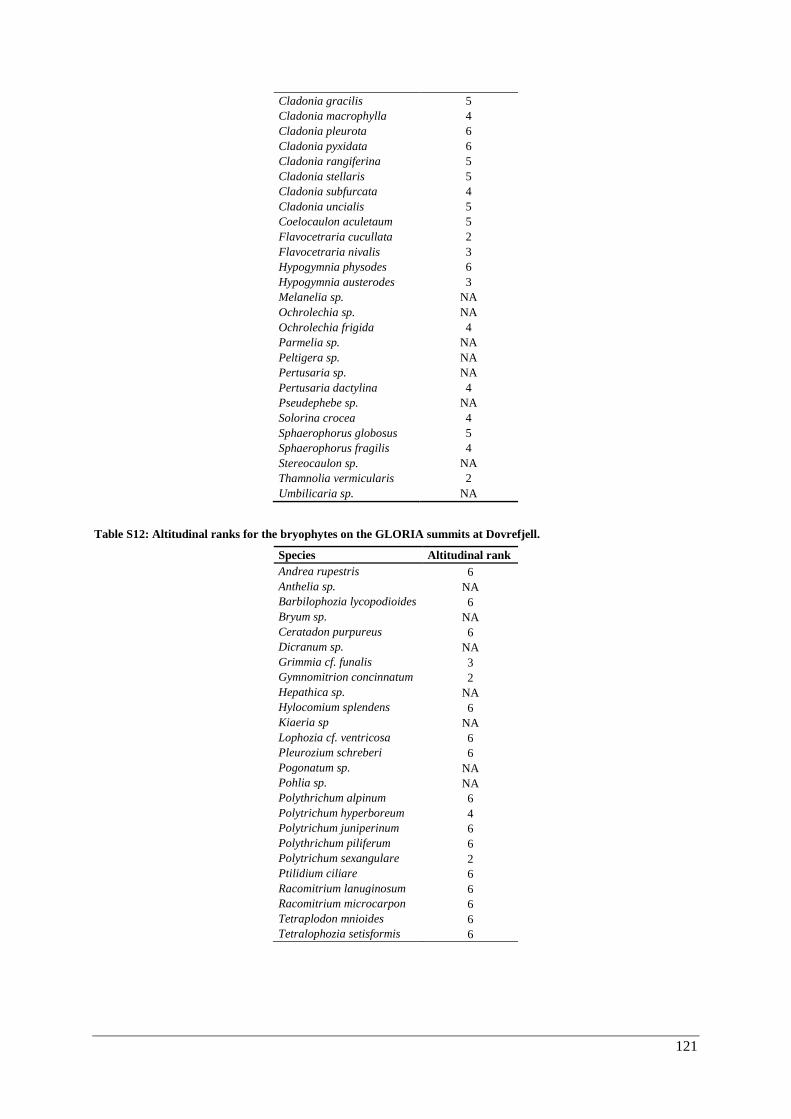
121
Cladonia gracilis 5
Cladonia macrophylla 4
Cladonia pleurota 6
Cladonia pyxidata 6
Cladonia rangiferina 5
Cladonia stellaris 5
Cladonia subfurcata 4
Cladonia uncialis 5
Coelocaulon aculetaum 5
Flavocetraria cucullata 2
Flavocetraria nivalis 3
Hypogymnia physodes 6
Hypogymnia austerodes 3
Melanelia sp. NA
Ochrolechia sp. NA
Ochrolechia frigida 4
Parmelia sp. NA
Peltigera sp. NA
Pertusaria sp. NA
Pertusaria dactylina 4
Pseudephebe sp. NA
Solorina crocea 4
Sphaerophorus globosus 5
Sphaerophorus fragilis 4
Stereocaulon sp. NA
Thamnolia vermicularis 2
Umbilicaria sp. NA
Table S12: Altitudinal ranks for the bryophytes on the GLORIA summits at Dovrefjell.
Species Altitudinal rank
Andrea rupestris 6
Anthelia sp. NA
Barbilophozia lycopodioides 6
Bryum sp. NA
Ceratadon purpureus 6
Dicranum sp. NA
Grimmia cf. funalis 3
Gymnomitrion concinnatum 2
Hepathica sp. NA
Hylocomium splendens 6
Kiaeria sp NA
Lophozia cf. ventricosa 6
Pleurozium schreberi 6
Pogonatum sp. NA
Pohlia sp. NA
Polythrichum alpinum 6
Polytrichum hyperboreum 4
Polytrichum juniperinum 6
Polythrichum piliferum 6
Polytrichum sexangulare 2
Ptilidium ciliare 6
Racomitrium lanuginosum 6
Racomitrium microcarpon 6
Tetraplodon mnioides 6
Tetralophozia setisformis 6