climate change, agriculture and food security: overview and key tools
Upload: ccafs-cgiar-program-climate-change-agriculture-and-food-security
Post on 21-Feb-2017
2.794 views
TRANSCRIPT
1
Led by
Climate Change, Agriculture and Food Security Program: activities & outputs
Sonja VermeulenHead of ResearchVanessa MeaduCommunications Manager
11 July 2013

2
Led by
Outline
• What is CCAFS and how does it operate?
• We work on climate-smart agriculture – what is that?
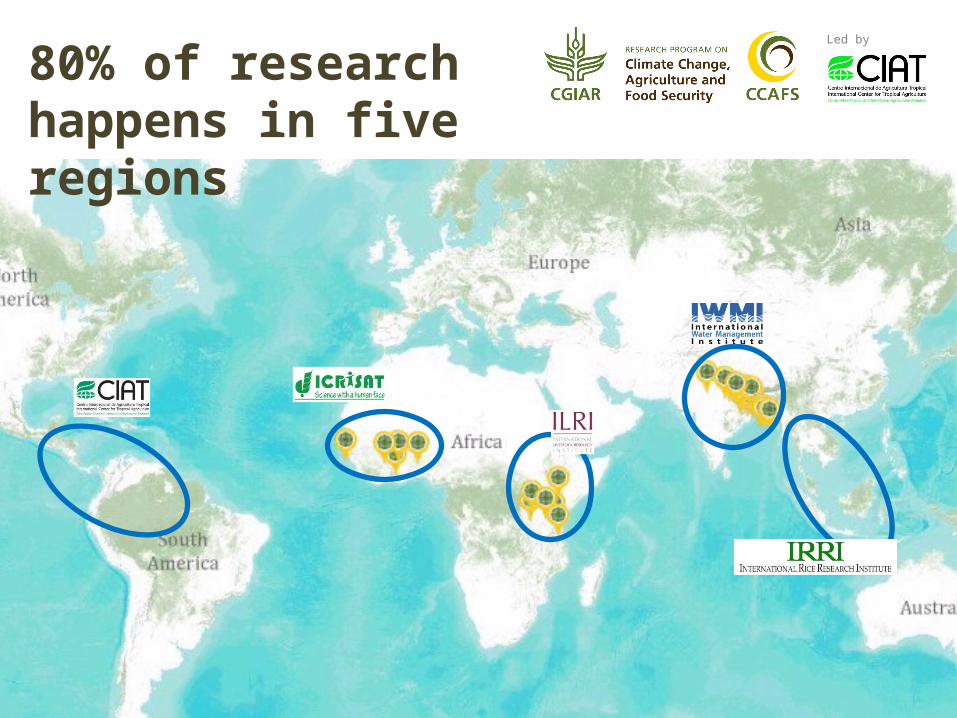
• What and where are our key activities?
• What outputs, tools and resources do we offer?

3
Led byCCAFS is a global research partnership of over 500 organisations
4
Led by
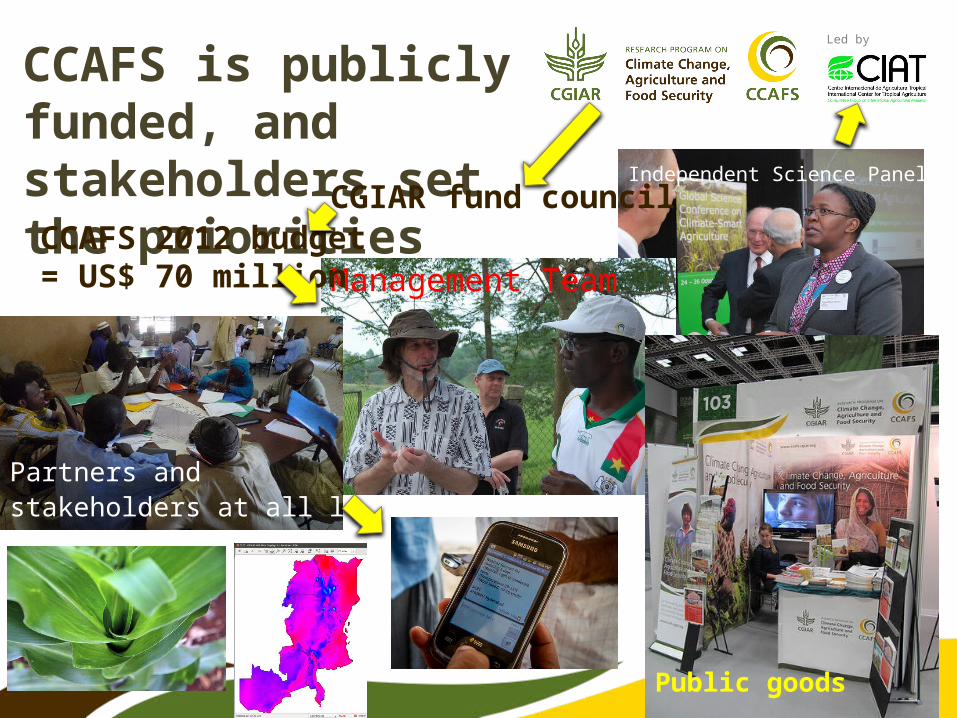
Independent Science Panel
Management Team
CCAFS is publicly funded, and stakeholders set the priorities
Partners and stakeholders at all levels
Public goods
CGIAR fund councilCCAFS 2012 budget = US$ 70 million

5
Led by
1. Identify and develop pro-poor adaptation and mitigation practices, technologies and policies for agriculture and food systems.
2. Support the inclusion of agricultural issues in climate change policies, and of climate issues in agricultural policies, at all levels.
CCAFS objectives2011-2020

6
Led by
Food security
Adaptation Environmental footprint
US Malawi0
5
10
15
20
25
GHG CO2-eq tonne per capita
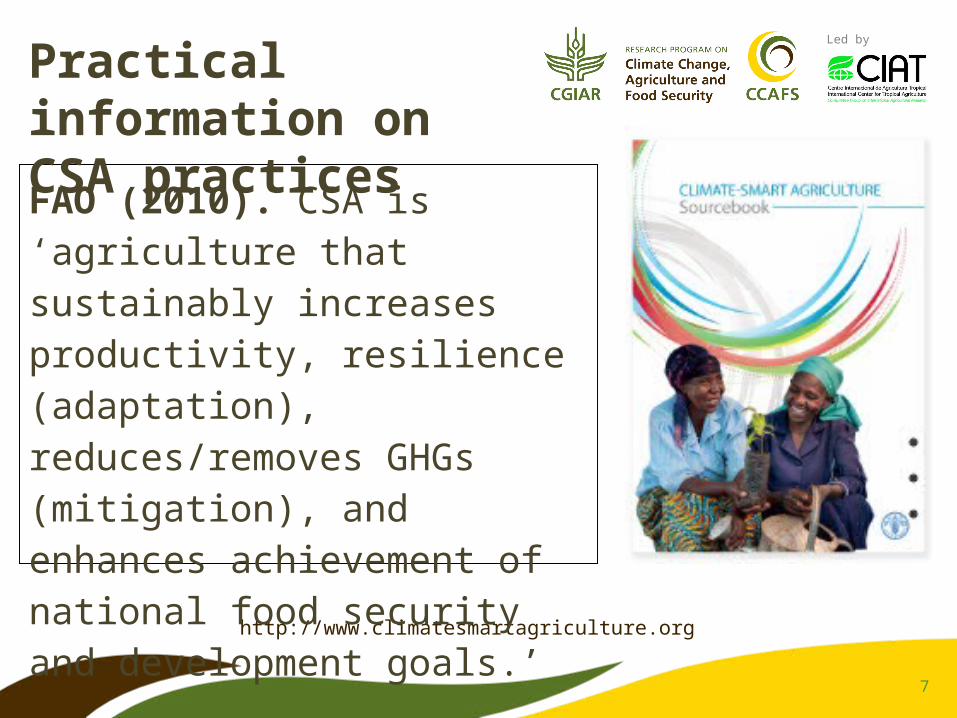
What is “climate-smart agriculture”?
7
Led by
http://www.climatesmartagriculture.org
FAO (2010). CSA is ‘agriculture that sustainably increases productivity, resilience (adaptation), reduces/removes GHGs (mitigation), and enhances achievement of national food security and development goals.’
Practical information on CSA practices

8
Led by
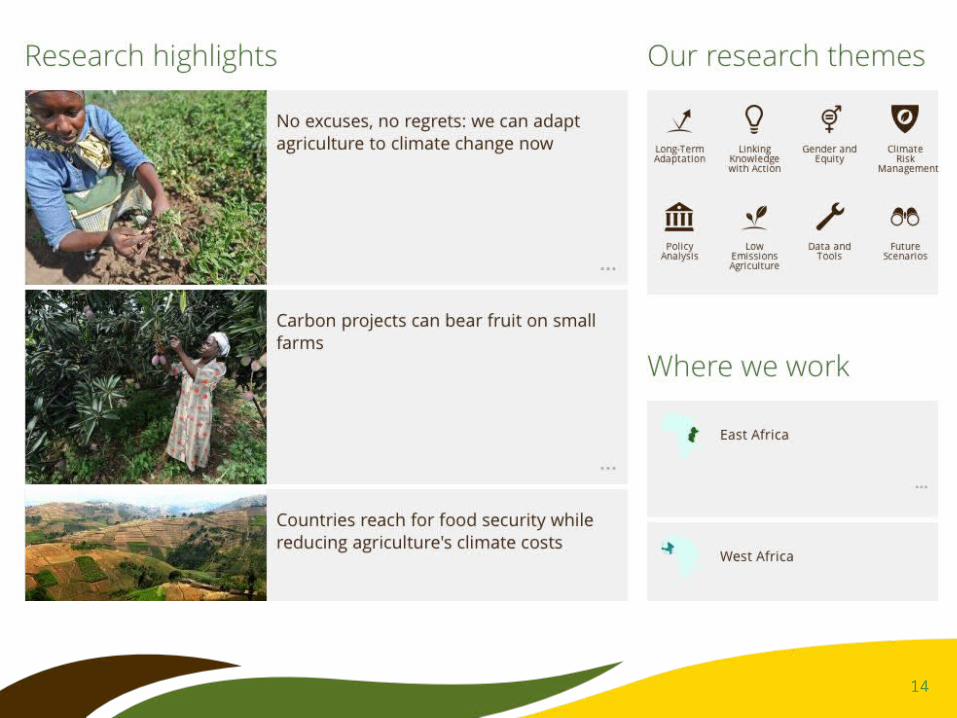
CCAFS tackles multiple“climate-smart” themesClimate & impact modelsFuture farming regionsNew farming systemsPublic policy
Seasonal forecastsDiversificationEarly warning systemsWeather insurance
Low-carbon development pathwaysSolutions for mitigation in smallholder systems
10
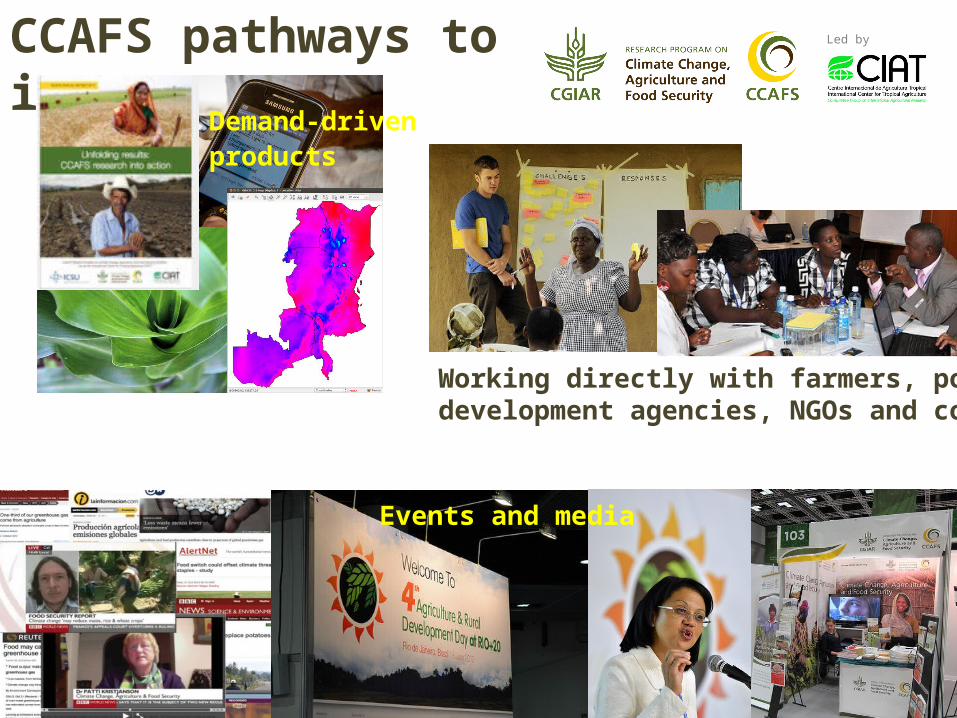
Led byCCAFS pathways to impact
Demand-drivenproducts
Working directly with farmers, policy makers,development agencies, NGOs and companies
Events and media

11
Led by
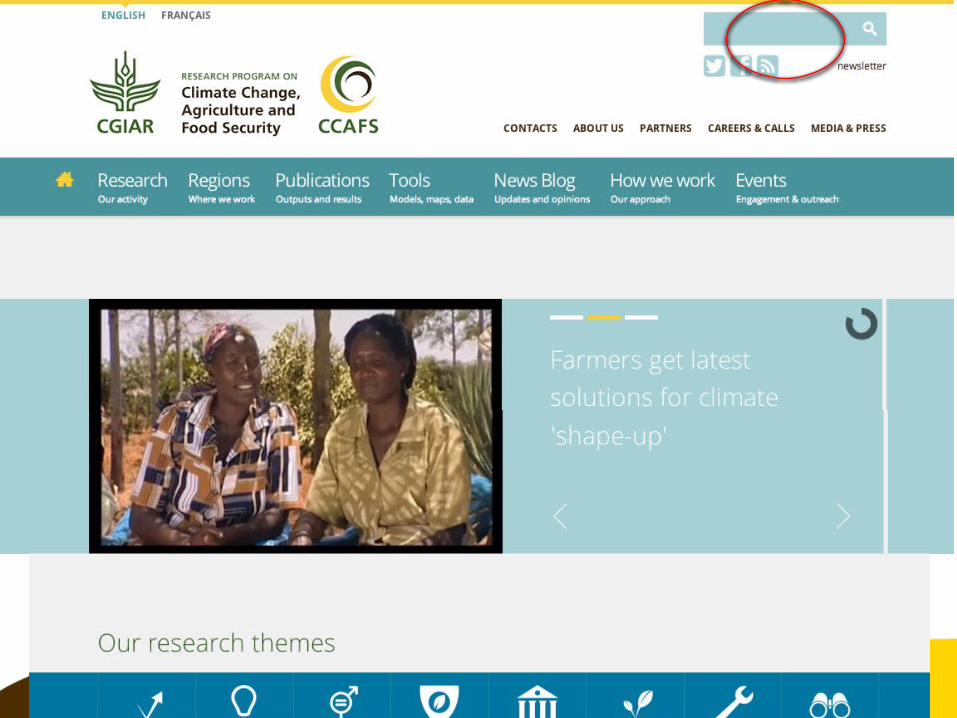
Tour of CCAFS website,resources & tools


26
Led by
Get our latest research
@cgiarclimate
/cgiarclimate
ccafs.cgiar.org/feeds
ccafs.cgiar.org


29
Led by
The Analogue tool
http://analogues.ciat.cgiar.org/climate/(NB this is a new version of the platform,
currently under development)
30
Led by
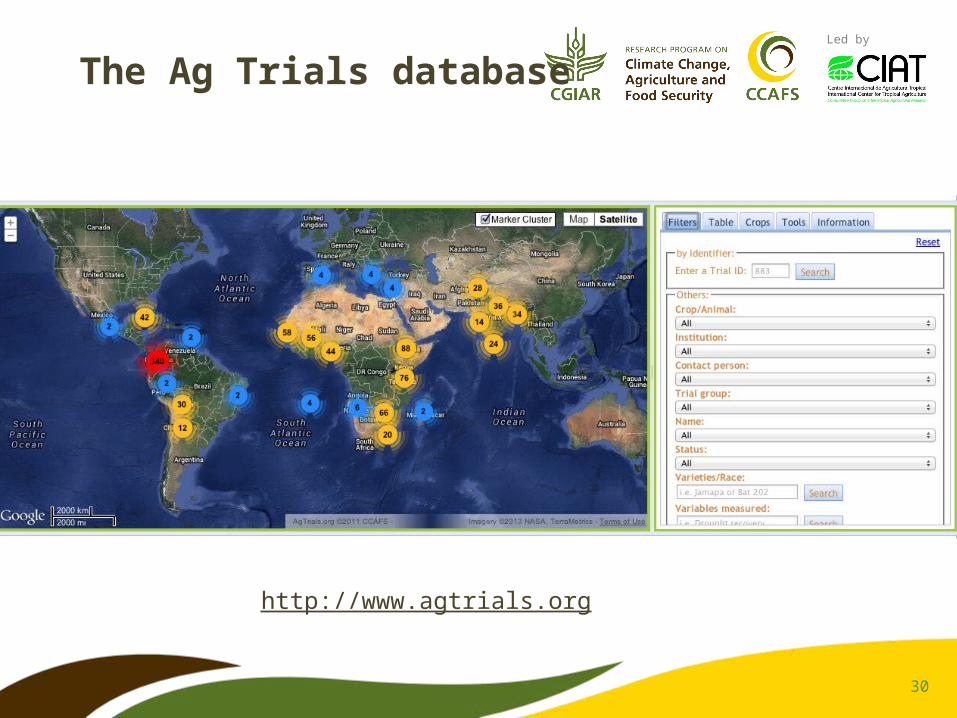
The Ag Trials database
http://www.agtrials.org
31
Led by
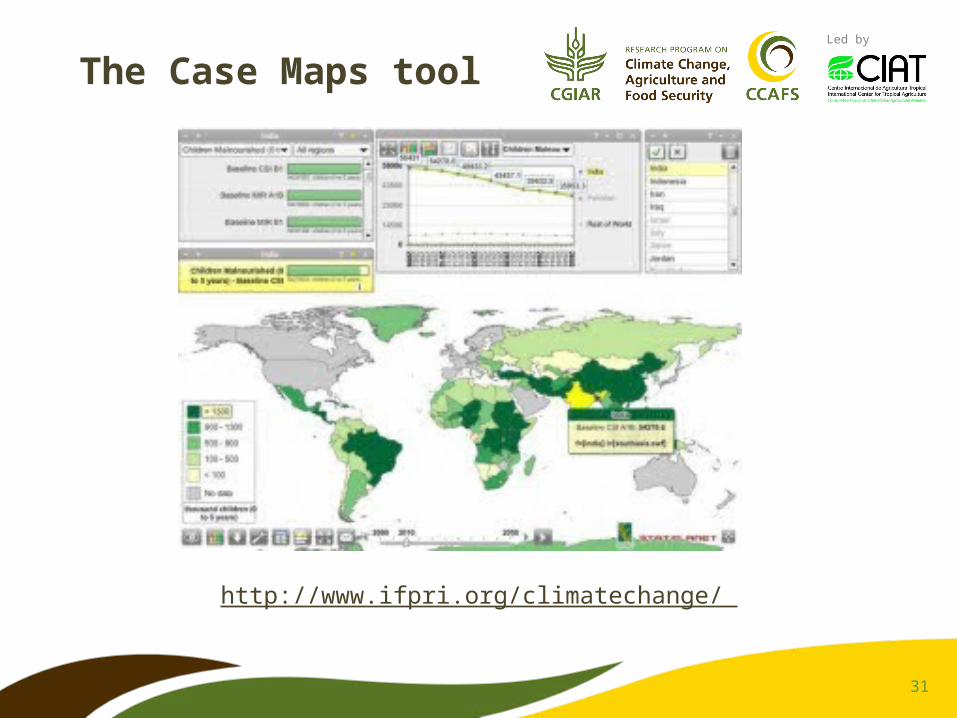
The Case Maps tool
http://www.ifpri.org/climatechange/
32
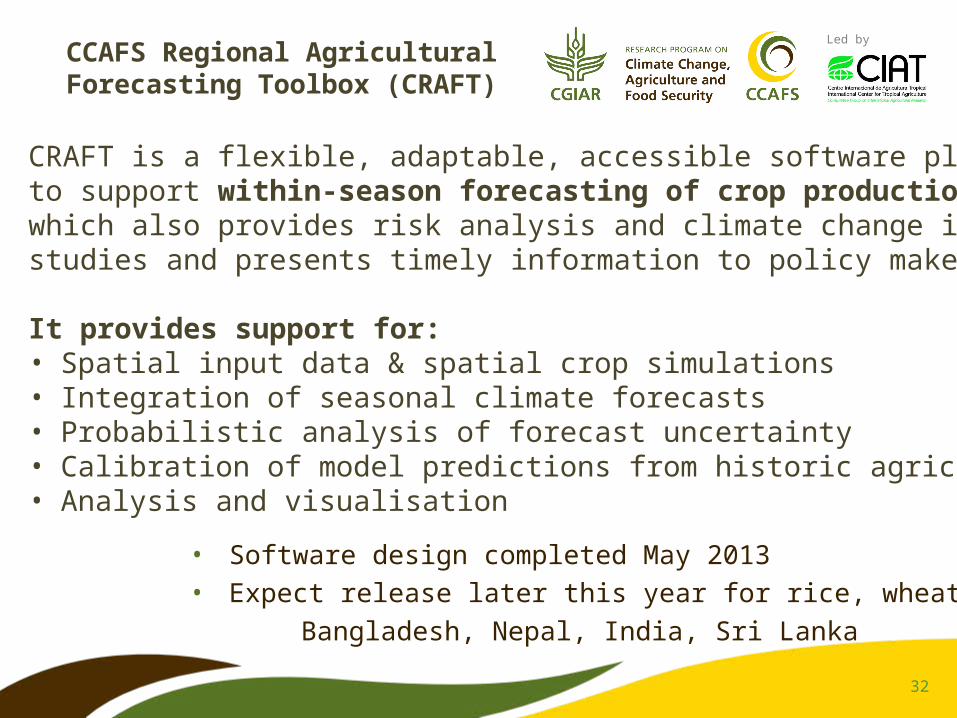
Led byCCAFS Regional Agricultural Forecasting Toolbox (CRAFT)
CRAFT is a flexible, adaptable, accessible software platform to support within-season forecasting of crop production, which also provides risk analysis and climate change impact studies and presents timely information to policy makers.
It provides support for:• Spatial input data & spatial crop simulations• Integration of seasonal climate forecasts• Probabilistic analysis of forecast uncertainty• Calibration of model predictions from historic agricultural statistics• Analysis and visualisation
• Software design completed May 2013• Expect release later this year for rice, wheat, maize Bangladesh, Nepal, India, Sri Lanka


34
Led by
Food system emissions
Food system emissions—from production to consumption—contribute
9,800 to 16,900 million metric tonnes of carbon dioxide equivalent (MtCO2e)
per year, or 19 to 29 percent of total greenhouse gas emissions. Vermeulen et al., 2012
4,382.5MtCO2e/year
6,111MtCO2e/year
560MtCO2e/year
1,534MtCO2e/year
Indirect emissions (deforestation)
Direct emissions Preproduction Postproduction
35%49% 4% 12%
PERCENT AND AMOUNT OF FOOD SYSTEM EMISSIONS Data from Vermeulen et al. 2012; US-EPA, 2011; and Blaser and Robledo, 2007

35
Led by
Agricultural mitigation potential
The mitigation potential of a suite of agricultural practices that reduce emissions associated with
farming and increase carbon storage is estimated to be 1,500 to 1,600 million tonnes of carbon
dioxide equivalent (MtCO2e) per year at a carbon price of USD 20 per tCO2e. The mitigation potential
through land use change is estimated to be a further 1,550 MtCO2e per year. Smith et al., 2008
Restoredegraded lands~135 MtCO2e/year
Grazing land management~160 MtCO2e/year
Restore cultivated soils~248 MtCO2e/year
Rice management~168 MtCO2e/year
Setaside, land use change, and agroforestry~7 MtCO2e/year
Livestock management
~127 MtCO2e/year
Manuremanagement
~8 MtCO2e/year
Cropland management~767 MtCO2e/year

36
Led by
Get our latest research
@cgiarclimate
/cgiarclimate
ccafs.cgiar.org/feeds
ccafs.cgiar.org

37
Led by
Key links
• CCAFS homepage http://ccafs.cgiar.org
• Big Facts http://ccafs.cgiar.org/bigfacts
• Blog http://ccafs.cgiar.org/blog
• Publications http://ccafs.cgiar.org/publications
• Tools, maps, models, data http://ccafs.cgiar.org/tools
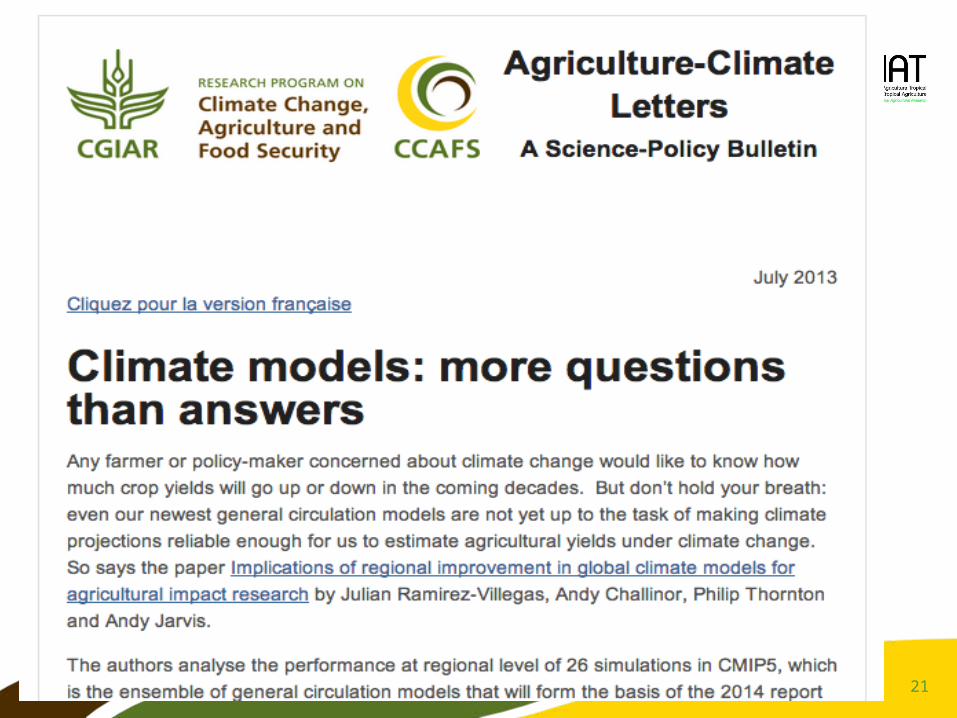
• AgClim Letters science- policy bulletin http://ccafs.cgiar.org
/resources/agclim-letters-policy-bulletin
• Climate Analogues tool http://analogues.ciat.cgiar.org/climate
• Agricultural Trials Database http://www.agtrials.org
• Climate Change Case maps http://www.ifpri.org/climatechange