climate change, adaptation and china's grain production
TRANSCRIPT

China Economic Review 28 (2014) 72–89
Contents lists available at ScienceDirect
China Economic Review
Climate change, adaptation and China's grain production
Li ZHOU a,⁎, Calum G. TURVEY b,1
a College of Economics and Management, Nanjing Agricultural University, Room 5026, Yifu Building, Nanjing, Jiangsu 210095, Chinab Dyson School of Applied Economics and Management, Cornell University, 237 Warren Hall, Ithaca, NY 14853, USA
a r t i c l e i n f o
⁎ Corresponding author at: College of Economics and13851731053 (mobile in China).
E-mail addresses: [email protected] (L. Zhou), cg1 Tel.: +1 6072555230, +1 6075926337 (Mobile);
1043-951X/$ – see front matter © 2014 Elsevier Inc. Ahttp://dx.doi.org/10.1016/j.chieco.2014.01.001
a b s t r a c t
Article history:Received 20 November 2012Received in revised form 1 January 2014Accepted 1 January 2014Available online 8 January 2014
This paper measures the economic impacts of climate change on China's grain production byusing provincial time series data over a 32-year period. The panel data model and time seriesregion model with/without adaptation are applied at the same time to assess the effectivenessof a common production function. To capture the effects of weather variables we employ arandom coefficients model where the production elasticities are the logarithmic function ontemperature and rainfall. A Cobb–Douglas production function with additional interactionbetween inputs and climate variables is applied. We find that the economic impacts of climatechange are mixed, that is, some regions are winners and others are losers, and the effectis crop-specific, not general. With adaptation, the economic impacts of warming on grainproduction are always positive; less precipitation will benefit rice production, but will harmwheat and maize production. Most of the central, western and northern China, which havealready been adapted, are less sensitive to climate variables, but some eastern provinces,such as Shandong and Hebei, are very vulnerable. However, this study finds that the adaptationby irrigation is not sensitive to climate change. In summary, the analysis indicates that policymakersshould recognize that the climate changewould change the productivity of factors, so a regional andcrop-specific total-factor-adaptation model is recommended.
© 2014 Elsevier Inc. All rights reserved.
JEL classification:Q18Q51Q54
Keywords:AgricultureClimate changeAdaptationChinaProduction function
1. Introduction
Adaptation to global climate change refers to “adjustments in ecological, social, or economic systems in response to actual orexpected climatic stimuli and their effects or impacts. It refers to changes in processes, practices, and structures to moderatepotential damages or to benefit from opportunities associated with climate change.” (IPCC, 2001, p. 879; cf Burton & Lim, 2005).The importance of climate change to China's agricultural and rural economies cannot be understated. With some 750 millionindividuals and 250 million households directly or indirectly engaged in primary agricultural production in China the issue ofglobal climate change and how climate change affects agricultural productivity is of major political and economic importance(IPCC, 2007; Lobell, Cahill, & Field, 2007; Peng et al., 2004; Sheehy, Mitchell, & Ferrer, 2006; Xiong et al., 2008). As the fourthlargest country in the world, China has a complex and diverse terrain and a large cross-latitude which touches the tropical belt inthe south and cold temperate zone in the north. Over the past decades, China has already experienced a strong warming trendand some devastating climate extremes. Hence, the assessment of China's agriculture vulnerability to climate change has becomeincreasingly important for such a populous country. We suspect that like the rest of the world, China would be sensitive to theimpacts of climate change, but whether this sensitivity will have positive or negative effects on agriculture and agriculturalproductivity remains an open question. Even at the most basic level, understanding how farmers might adapt to climate changeis a significant step towards understanding the uncertainties regarding technology adoption, market competition, trade
Management, Nanjing Agricultural University, Room 5026, Yifu Building, Nanjing, Jiangsu 210095, China, +86
[email protected] (C.G. Turvey).fax: +1 6072551589.
ll rights reserved.

73L. Zhou, C.G. Turvey / China Economic Review 28 (2014) 72–89
negotiations and regulation, economic and relative efficiency and comparative advantage, aggregate demand, and consumerdemand, population growth and income inequality, environmental externalities, and the minutiae of seemingly unrelatedactivities that individually might have no apparent consequence but can collectively have substantial effects (Burton & Lim, 2005;Mount, 1994). The broader question, as put by Reilly (1999) is how will society be affected by global climate change throughits effect on agriculture? This requires answering the question of ‘what effects would climate change have in agriculturalproduction?’
This paper measures the economic impacts of climate change on China's grain gross revenue by using provincial panel dataover a 32-year period. To capture the effects of weather variables we employ a random coefficients model where the productionelasticities are the logarithmic function on temperature and rainfall. A Cobb–Douglas production function with additionalinteraction between inputs and climate variables is assumed. Our results bring good and bad news. The heat elasticities for EarlyIndica rice, Indica rice, Late Indica rice, Japonica rice, wheat and maize are 0.801, 0.265, −1.060, 0.068, 0.142, and 0.018respectively. Only Late Indica rice has a negative and nearly perfectly elastic response. These results suggest that if temperaturesrise by 1% Early Indica rice will benefit most with an increase in value of 0.801% but Late Indica rice will fall in gross value by1.060%. The rainfall elasticities for Early Indica rice (−0.023), Indica rice (−0.032), Late Indica rice (−0.024) and Japonica rice(−0.033) will have a generally inelastic response to decreased rainfall, but wheat (0.022) and maize (0.004) may see reductionsin production but by a small amount. A 1% decrease in rainfall will result in a 0.022% reduction in gross value of wheat and only0.004% reduction in maize.
This paper reports results of a new study that measures the sensitivity and adaptation of China's grain production to climatechange. Compared to previous studies, this paper focuses on the climatic impact on the elasticity of the factors of production,rather than on the factors themselves. Matching the input and output data to climate data (temperature and precipitation) is amore effective method to analyze the economic effect of climate change and we do this in a unique way: Rather than treatingweather variables as ordinary inputs to the production inputs with their own production elasticities, we argue that the real effectsare through their impact on the physical/economic production elasticities themselves. In other words, rather than determining(for example) the input elasticity and precipitation elasticity separately, our approach asks how the input elasticity changesendogenously and simultaneously with precipitation. Thus, in terms of adaptation strategies we show how the input elasticity,and hence its marginal productivity, increases or decreases with changes in precipitation while simultaneously creating ameasure of precipitation elasticity that is conditional on input use or expenditures. The analysis employs provincial data from1979 to 2010 (which includes all of the data available to us), including six crop varieties (Early Indica rice, Indica rice, Late Indicarice, Japonica rice, wheat, maize). The data contains the information on each crop's provincial average economic cost data, such aslabor, fixed assets, fertilizer, pesticide, machine, irrigation and operating cost. We use a hedonic approach which is a blend ofRicardian analysis which focuses on land as the unit of output and the whole farm production function approach which uses croprevenue as the unit of measure.
The paper proceeds as follows: In the next section we develop our theoretical model which shows how weather variables andinput variables interact. Our focus is on the structure and form of the production and weather elasticities. The following sectionreviews various approaches used to capture adaptation to climate change including growth and climate models, dynamicstatistical approaches, and our preferred hedonic method which blends the Ricardian and whole farm production functionapproaches. This is followed by the specification of our econometric models, discussion of results and conclusions.
2. Theory and methods
2.1. Theory
There are two main approaches to estimating adaptation strategies to climate change. The first approach is to use historicalweather and output relationships and the second is to use climate forecasts and crop simulation models. We combine theseapproaches by first estimating the historical relationships over the past 32 years to capture yearly variables and trends, and thenwe use long-run predictions from climate models to evaluate what the likely impact will be under global climate change.
To place our results in perspective, agronomic studies have shown that grains have the greatest potential to be adverselyaffected by climate change due to the low responsiveness of C4 crops2 to increased CO2 concentrations (Ainsworth, Leakey, Ort, &Long, 2008; Long, Ainsworth, Leakey, Nosberger, & Ort, 2006), and their relatively high sensitivity to extreme heat (Schlenker &Lobell, 2010; Schlenker & Roberts, 2006). Several studies investigating the impact on China's grain yield (e.g., rice, maize, andwheat) in response to climate change have been conducted (Tao, Hayashi, Zhang, Sakamoto, & Yokozawa, 2008; Xiong, Lin, Ju, &Xu, 2007; Zhang, Zhu, & Wassmann, 2010) but with conflicting results that are highly dependent on climate scenarios,socio-economic development and the effects of CO2 fertilization on crop yields (Xiong et al., 2009). Xiong et al. (2009) projectclimate-induced yield reductions of 4–14% for rice, 2–20% for wheat, and 0–23% for maize by the year 2050 with some scenarioswithout adaptation showing a decrease in cereal production up to 40%. Tao et al. (2008) project that a one-degree rise intemperature may decrease rice yield; You, Rosegrant, Wood, and Sun (2009) found a 4.5% reduction in wheat yields attributableto rising temperature recorded from 1979 to 2000. Maize yields may also have been sensitive to recent warming, with data fromeight Chinese provinces showing a negative response to the rising temperature during the period 1979–2002 (Tao et al., 2008).
2 A C4 plant in which the CO2 is first fixed into a compound containing four carbon atoms before entering the Calvin cycle of photosynthesis. A C4 plant is betteradapted than a C3 plant in an environment with high daytime temperatures, intense sunlight, drought, or nitrogen or CO2 limitation.

74 L. Zhou, C.G. Turvey / China Economic Review 28 (2014) 72–89
Yao, Xu, Lin, Yokozawa, and Zhang (2007) report a warming-induced yield reduction of rice, wheat and maize in China (Yao et al.,2007). Lower precipitation projected by global climate models for China has also shown to adversely affect future national grainproduction (Fischer, Shah, Tubiello, & van Velhuizen, 2005).
On the other hand, some studies have found that the impact of higher temperature on grain production is indistinguishablefrom current climactic conditions (Parry, Rosenzweig, & Livermore, 2005) or even positive (Zhang et al., 2010). Lin et al. (2005)found average increases in yield of 13% for rice, 18% for maize, and 28% for wheat. Zhang et al. (2010) found a positive correlationbetween rice yield and temperature. Xiong et al. (2008) modeled cereal production through 2050 using IPCC scenarios B2 and A2and projected an increase from 13% to 22% relative to the 1961–1990 mean, with the most significant cereal production increasesprojected for the northeast, northwest and southeast coastal provinces. Piao et al. (2010) argue that regional warming hasextended the length of the potential growing season for crops, allowing both earlier planting and later harvesting, and northwardexpansion of rice planting in the temperate climate zones of north China due to climate warming.
Economic impacts from climate change on Chinese farm net revenue has shown both negative (Wang et al., 2009) and positiveeffects (Liu, Li, Fischer, & Sun, 2004). Using county-level cross-sectional data on agricultural net revenue, climate, and othereconomic and geographical data for 1275 agriculture dominated counties, Liu et al. (2004) found that under most climate changescenarios both higher temperature and increased precipitation will have an overall positive impact on China's agriculture butwith seasonal and regional variation. Wang et al. (2009) using survey data from 8405 households across 28 provinces concludedthat global warming is likely to be harmful to rain fed farms but beneficial to irrigated farms, again varying by region. With thecurrent state of climate research on Chinese agriculture being so mixed,3 further investigation is required.
In terms of climate change in China, farmers can initiate a variety of adaptation measures, such as the control and regulation ofinput factors, timing of planting and harvesting, choice of crop varieties or species, development of new varieties including GMOs,improved water supply and irrigation systems including efficiency in use, tillage practices, crop diversification, technologicaldevelopments, or crop insurance to deal with changing climate conditions, (Bradshaw, Dolan, & Smit, 2004; Bryant et al., 2000;Burton & Lim, 2005; Kandulu, Bryan, King, & Connor, 2012; Mendelsohn, Nordhaus, & Shaw, 1994; Seo &Mendelsohn, 2008). Howadaptation evolves depends on many factors ranging from access to factor markets, government policies, soil quality and terrainand irrigation (Connor, Schwabe, King, & Knapp, 2012; Mendelsohn & Dinar, 2003; Seo, 2011; Simelton, Fraser, Termansen,Forster, & Dougill, 2009). From the farmer's perspective, climate change in temperature and precipitation can be seen as a directtechnology shock affecting possibly both the deterministic and the stochastic components of the production function. In onerepresentative study, Bryan, Deressa, Gbetibouo, and Ringler (2009) capture farm-level adaptation to long-term changes intemperature and rainfall versus short-term climate variability. The farmers were asked “what adjustments in your farming haveyou made to these long-term shifts in temperature/rainfall?” This study shows that despite having perceived changes intemperature and rainfall, a large share of farmers in both countries did not take any adaptive measures. In Ethiopia, among thosefarmers who did adapt to climatic changes, the most common adaptation strategies included use of different crops or cropvarieties, planting trees, soil conservation, changing planting dates, and irrigation. Other less frequent responses included seekingoff-farm activities, migrating to urban areas, changing farming type, using new technologies, and water conservation (Bryan et al.,2009). The point is that to manage the severity of climate variability on net returns, agriculturalists routinely believe that farmerswould behave even more cautiously and adaptively when climate risk is unknown or ambiguous (Alpizar, Carlsson, & Naranjo,2011).
In our theoretical development we assume that farmers seek to maximize profit under different climate conditions. The farmprofits are represented by π(X|ω) where ω is climate condition and X is a vector of inputs such as labor, capital and irrigation foreach crop:
3 Forresult.
4 Eq.manage
Maxπ X ωj Þ ¼ P � Y X ωj Þ‐C X ωj Þððð ð1Þ
Profits, π, are determined by revenue P * Y(X|ω) and the cost function C(X|ω). In the traditional approach heat (H) and rainfall(R) elasticities can be estimated by using a Cobb–Douglas production function of the form:
Y ¼ A � Lα1 � Kα2 �Wα3 � Hα4 � Rα5 � ε ð2ÞY is gross revenue and the L, K, W, H, R are labor, capital, irrigation, heat and rainfall respectively, A is a constant which
wherecaptures such factors as technological progress and other policy influences, ε is residuals, and α1~α5 represent the productionelasticities of input variables.4 Under this approach the Cobb–Douglas exponents provide the production elasticity of rainfalland heat and the marginal rate of substitution between irrigation (W) and H and R can be computed in the usual way as∂W∂H ¼ ∂Y=∂H
∂Y=∂W ¼ α4α3
� WH and ∂W∂R ¼ ∂Y=∂R
∂Y=∂W ¼ α5α3
� WR which illustrates the dependency between input efficacy and weather as a function ofthe factor and weather production elasticities.
However, in our view Eq. (2) only tells part of the story. It does not acknowledge the productivity variation among climaticzones nor does it recognize that climate conditions are not only a factor endowment for agriculture production, but also a driverfor the other production factors (Cline, 2007; Fleischer, Lichtman, & Mendelsohn, 2008; Kato, Ringler, Yesuf, & Bryan, 2011; Parry
example, Liu et al. (2004) use the irrigation data, but Wang et al. (2009) do not. The Cole adaptation behavior considered or not would cause the varied
2 is representative. In our empirical model we include labor, fixed assets depreciation, machinery rent per area; operational cost including farmment and crop insurance, chemical fertilizer, pesticide, and irrigation/water.

75L. Zhou, C.G. Turvey / China Economic Review 28 (2014) 72–89
et al., 2005; Rosenzweig & Parry, 1994; Yang et al., 2007). To capture the effects of weather variables (precipitation (R) and heat(H)) we employ a random coefficients model where the production elasticities identified in Eq. (2) are postulated as beingdetermined by:
αi ¼ f H;Rð Þ ¼ Ci þ βilog Hð Þ þ γilog Rð Þ þ μ i; i ¼ 1∼3 ð3Þ
By specifying the production coefficients in this way we remove that part of the standard error of the estimates due to climatechange, while in reduced form we are able to fully capture the elasticities of the weather variables (see also Turvey & Norton,2008). Substituting Eq. (3) into Eq. (2) provides Eq. (4), which can be referred to as a total-factor-adaptation productionfunction:
Y ¼ A � L C1þβ1log Hð Þþγ1log Rð Þþμ1ð Þ � K C2þβ2log Hð Þþγ2log Rð Þþμ2ð Þ �W C3þβ3log Hð Þþγ3log Rð Þþμ3ð Þ � Hα4 � Rα5 � ε ð4Þ
Themarginal productivities of heat and rainfall are given by ∂Y∂H ¼ β1log Lð Þþβ2log Kð Þþβ3log Wð Þþα4ð Þ�Y
H and ∂Y∂R ¼
γ1log Lð Þþγ2log Kð Þþγ3log Wð Þþα5ð Þ�YR .
This formulation explicitly recognizes that the effects of weather on output cannot be considered direct as a matter of course,but is conditional on the levels of inputs used in production. The relationship suggests that farmers can adapt to climate change bymodifying input use. Likewise, the production elasticity on direct inputs is of the form (Ci + βilog(H) + γilog(R) + μi) whichcaptures the random effect that weather variables can have on the short-run efficacy of inputs. Importantly, the elasticity ofproduction can either increase or decrease as heat and/or rainfall increases or decreases with climate change. Our econometricspecification which is discussed next is based upon this reasoning.
2.2. Methods
A variety of approaches have been used to investigate how global climate change can impact agricultural productivity. Thesecan generally be grouped into three categories: crop growth simulation models, statistical studies, and Ricardian approaches(Hertel & Rosch, 2010). Growth simulation models include Adams, Fleming, Chang, McCarl, and Rosenzweig (1995), Nelson et al.(2009), Ackerman and Munitz (2012), Chang (2002), Deryng, Sacks, and Ramankutty (2009), Mestre-Sanchís and Feijóo-Bello(2009). One of the drawbacks of crop growth models is that the parameters are generally fixed and the outputs arealgorithmically determined by how the relationship between inputs (including climate) and outputs are specified. Examples ofstatistical models include Barrios, Ouattara, and Strobl (2008), and Schlenker and Lobell (2010). Statistical models requirerelatively less data, tend not to be process-based, and predict future responses based on the past relationships (Hertel & Rosch,2010).
The third alternative, and the one which we use, is often referred to as the Ricardian model. A Ricardian model focuses on theeconomic rents derived from land but there are variants on this which have caused Hertel and Rosch (2010) to use a broader termcalled Hedonic modeling. This is probably more closely aligned with our approach which is more closely aligned with whole farmproduction functions (e.g. Turvey & Lowenberg-DeBoer, 1988). The hedonic approach recognizes that farmers will vary the mix ofactivities to choose the one yielding the highest return on any given parcel of land. The economic relationships betweenindependent and dependent variables in hedonic models are quite flexible with dependent variables ranging from total valueproduct (as we use in this study), crop yields, agricultural production, farm incomes or land values (e.g. Mendelsohn et al., 1994)and can be modified by associating climatic variation using cross-section data with variation in the dependent variables (e.g.,Bryan et al., 2009; Connor, Schwabe, King, Kaczan, & Kirby, 2009; Deressa & Hassan, 2010; Di Falco, Veronesi, & Yesuf, 2011;Kurukulasuriya & Rosenthal, 2003; Seo, 2011; Seo & Mendelsohn, 2008). Hertel & Rosch (2010), cf Rowhani & Ramankutty (2009)characterize the hedonic model as requiring medium data requirements, as having regional scalability, can capture adaptationand can be validated. However, the Ricardian/hedonic approach is also subject to a number of shortcomings (see Fleischer et al.,2008; Hertel & Rosch, 2010; Schlenker, Hanemann, & Fischer, 2005) including the utilization of cross-sectional data to estimatelong-run relationships and may be sensitive to omitted variables (e.g. failing to account for irrigation as in Schlenker et al. (2005)or Fleischer et al. (2008); or credit, land quality and information as in Bryan et al. (2009)). In addition, general criticisms of allapproaches are that productivity and adaptation of factors would differ greatly between regions with different social andeconomic circumstances, differing perceptions of climate change, farming experience, socioeconomic position, socialnetworks, social capital, credit and extension services (Bryan et al., 2009; Fraser, 2007; Knowler & Bradshaw, 2007; Sen,1981). Many of these factors are, of course, immeasurable and are endogenous to the specification of the model. However, asindicated above our approach allows us to separate out direct weather effects from unobservable endogenous characteristics.To capture the regional differences, we develop a regional and crop-specific total-factor-adaptation production functionto the national whole-farm production function and instrument across regions and crop types to capture some of theseimmeasurable issues.
2.3. Data
This study focuses on grain production in China, and rice, wheat and maize are the three major crops in China accounting for35.82%, 21.08% and 32.43% of the total China's grain yield in 2010. The input and output panel data from 1979 to 2010 was

76 L. Zhou, C.G. Turvey / China Economic Review 28 (2014) 72–89
collected from China Price Department of the National Development and Reform Commission (NDRC).5 This data set containsinformation such as revenue, labor, land, assets, seeds, fertilizers, pesticides, machinery and irrigation cost. All the economicdata are converted to 2010 Yuan using provincial Retail Price Index (RPI).
It is important to recognize that adaptation to climate change and weather variability is as much an economic response as itis a biological response. According to classical production economics farmers are as likely to adapt to short-run market signalsas they are to short-run weather signals by altering acres planted, crops grown and inputs. Here the physical response tomaximizing output by altering the quantities of physical inputs is different than the economic concept of profit maximizationthat balances the expected marginal value product to input costs. Thus, in terms of economic adaptation, as weather patternsresult in lower output, prices might rise, or in the case of regulated processes that we observe in China, input use will change inone form or another. Documenting these endogenous relationships is beyond the scope of this paper and left for further study,however our approach captures these effects. For example, if we use only the physical input–output relationships we riskexcluding important endogenous economic relationships, that if not considered would bias the true nature of economicresponse and economic adaptation.
The data covers six grain varieties (Early Indica rice, Indica rice, Late Indica rice, Japonica rice, wheat, maize) across 31provinces. However, it is an unbalanced data.6 In order to compare the time series model to panel data model, we deleted theregions with unbalanced data. Consequently, the data set contains 8 provinces for Early Indica rice (Zhejiang, Anhui, Fujian,Jiangxi, Hubei, Hunan, Guangdong, Guangxi), 8 provinces for Indica rice (Jiangsu, Anhui, Fujian, Henan, Hubei, Sichuan, Guizhou,Shaanxi), 5 provinces for Late Indica rice (Fujian, Jiangxi, Hunan, Guangdong, Guangxi), 10 provinces for Japonica rice (Hebei,Liaoning, Jilin, Heilongjiang, Jiangsu, Zhejiang, Anhui, Shandong, Yunnan, Ningxia), 15 provinces for wheat (Hebei, Shanxi,Neimenggu, Heilongjiang, Jiangsu, Anhui, Shandong, Henan, Hubei, Sichuan, Yunnan, Shaanxi, Gansu, Ningxia, Xinjiang), and 18provinces for maize (Hebei, Neimenggu, Liaoning, Jilin, Heilongjiang, Jiangsu, Anhui, Shandong, Henan, Hubei, Guangxi, Sichuan,Guizhou, Yunnan, Shaanxi, Gansu, Ningxia, Xinjiang).7 The climate data (annual temperature and precipitation) wasgathered from the China Statistical Yearbook and National Meteorological Information Center in China.8 Descriptive statisticsof the key variables provided in Table 1 are self-evident to the variation in revenue, cost, temperature and precipitationbetween each crop.
2.4. Econometric specification
In order to capture the expected relationship between total value product (gross revenue) and climate change, a Cobb–Douglas production function is assumed:
5 Chinsurveyincludesurvey
6 In acomplemight s
7 Mosthan 10possibiltransferselected(coverinwhich athe mai
8 Fororder toincludeacross mmodels
y ¼ A � lα1 � kα2 �mα3 � oα4 � f α5 � pα6 �wα7 � hα8 � rα9 � ε ð5Þ
Where y is the total value product per area; l is the labor cost per area; k is the fixed assets depreciation per area;m is themachineryrent per area; o is the operational cost per area including farmmanagement, crop insurance fees and agricultural taxes; f is the chemicalfertilizer cost per area; p is the pesticide cost per area;w is the irrigation and water cost per area. The prices of all the cost and revenuevariables are indexed to 2010 Yuan per mu using output and input price indices (“mu” is a Chinese unit of area which is equal to0.0667 ha). Thus, we remove intertemporal price variability by casting all variables in constant 2010 currency. The variable h capturesaverage annual temperature (°C) while r is the average annual precipitation (millimeter). C is a constant, ε is the residual, and α1~α9
represent the production elasticities of the input variables.Double fixed effects controlling for both regional and time effects are applied in the panel data model. Period fixed effects are
set to capture factors, such as technological progress and agricultural policy influences, and cross fixed effects are set to captureany unobserved provincial specific factors.
a's agricultural cost survey began in 1953. In the present day, the agricultural production cost investigation team has around 4000 professional staff. Thecovers more than 60,000 farming households located in 1553 counties across 31 provinces, autonomous regions and municipalities in China. The surveys 68 kinds of major agricultural products such as grain, oilseeds, cotton, tobacco, sugar, fruit, pigs, eggs, milk, vegetables, herbs and forest products. Theidentified detailed information for single product. Also, different types of farmers are included.panel data set, there are observations across cross-section units (e.g. individuals or firms), and across time periods. Often such a data set can be
tely filled in matrix of N units and T periods. In the unbalanced data case, however, the number of observations per time period varies. Equivalently oneay that the number of observations per unit is not always the same.t of the excluded provinces do not report grain production data because of very small amounts of related crop planting. As long as the province has moreyears' available, it is included in the regression, and the omitted data is assigned as zero. From a statistical point of view using both removes the
ity of sample attrition over time; as production shifts away from a particular crop the province would jump down the data list in the course of origin. Moreover, attrition may be endogenous to a variety of economic and ecological (including climate) shocks (Jalan and Ravallion, 2004) The provincesin our panel data are the main grain producing areas which can represent the whole China. In 2011, the rice production of our selected 19 provincesg 8 provinces for Early Indica rice, 8 provinces for Indica rice, 5 provinces for Late Indica rice and 10 provinces for Japonica rice) was 191.18 million tonsccount for 95.1% in China; In 2011, the wheat production of our selected 15 provinces was 114.35 million tons which accounts for 97.4% in China; In 2011,ze production of our selected 18 provinces was 176.42 million tons which accounts for 91.5% in China.a variety of reasons our approach was to investigate adaptation strategies using available data on aggregate yields at the provincial levels. We do this incapture the macro impacts of weather–crop relationships. Climate change is concerned with broad-scaled changes in temperature and rainfall and canhigher or lower temperatures, more or less rainfall, and/or extended or reduced seasons. These trends cannot generally be captured by aggregatingicro regions because the year to year variability in their weather patterns usually surpass the extremes predicted by long-run climate change forecast
.
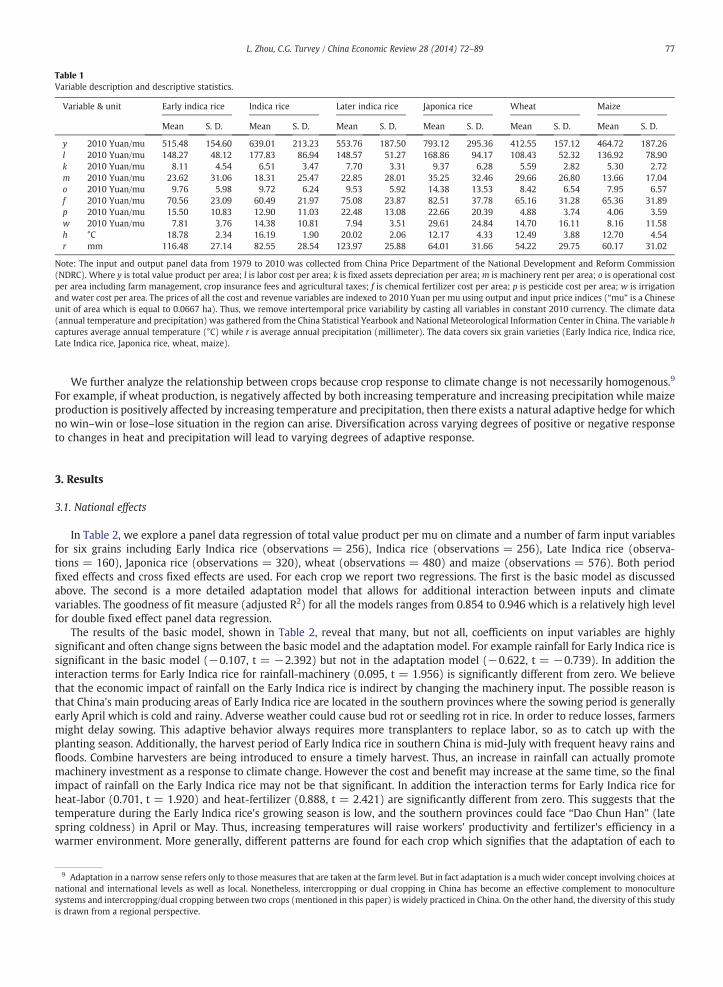
Table 1Variable description and descriptive statistics.
Variable & unit Early indica rice Indica rice Later indica rice Japonica rice Wheat Maize
Mean S. D. Mean S. D. Mean S. D. Mean S. D. Mean S. D. Mean S. D.
y 2010 Yuan/mu 515.48 154.60 639.01 213.23 553.76 187.50 793.12 295.36 412.55 157.12 464.72 187.26l 2010 Yuan/mu 148.27 48.12 177.83 86.94 148.57 51.27 168.86 94.17 108.43 52.32 136.92 78.90k 2010 Yuan/mu 8.11 4.54 6.51 3.47 7.70 3.31 9.37 6.28 5.59 2.82 5.30 2.72m 2010 Yuan/mu 23.62 31.06 18.31 25.47 22.85 28.01 35.25 32.46 29.66 26.80 13.66 17.04o 2010 Yuan/mu 9.76 5.98 9.72 6.24 9.53 5.92 14.38 13.53 8.42 6.54 7.95 6.57f 2010 Yuan/mu 70.56 23.09 60.49 21.97 75.08 23.87 82.51 37.78 65.16 31.28 65.36 31.89p 2010 Yuan/mu 15.50 10.83 12.90 11.03 22.48 13.08 22.66 20.39 4.88 3.74 4.06 3.59w 2010 Yuan/mu 7.81 3.76 14.38 10.81 7.94 3.51 29.61 24.84 14.70 16.11 8.16 11.58h °C 18.78 2.34 16.19 1.90 20.02 2.06 12.17 4.33 12.49 3.88 12.70 4.54r mm 116.48 27.14 82.55 28.54 123.97 25.88 64.01 31.66 54.22 29.75 60.17 31.02
Note: The input and output panel data from 1979 to 2010 was collected from China Price Department of the National Development and Reform Commission(NDRC). Where y is total value product per area; l is labor cost per area; k is fixed assets depreciation per area; m is machinery rent per area; o is operational costper area including farm management, crop insurance fees and agricultural taxes; f is chemical fertilizer cost per area; p is pesticide cost per area; w is irrigationand water cost per area. The prices of all the cost and revenue variables are indexed to 2010 Yuan per mu using output and input price indices (“mu” is a Chineseunit of area which is equal to 0.0667 ha). Thus, we remove intertemporal price variability by casting all variables in constant 2010 currency. The climate data(annual temperature and precipitation) was gathered from the China Statistical Yearbook and National Meteorological Information Center in China. The variable hcaptures average annual temperature (°C) while r is average annual precipitation (millimeter). The data covers six grain varieties (Early Indica rice, Indica rice,Late Indica rice, Japonica rice, wheat, maize).
77L. Zhou, C.G. Turvey / China Economic Review 28 (2014) 72–89
We further analyze the relationship between crops because crop response to climate change is not necessarily homogenous.9
For example, if wheat production, is negatively affected by both increasing temperature and increasing precipitation while maizeproduction is positively affected by increasing temperature and precipitation, then there exists a natural adaptive hedge for whichno win–win or lose–lose situation in the region can arise. Diversification across varying degrees of positive or negative responseto changes in heat and precipitation will lead to varying degrees of adaptive response.
3. Results
3.1. National effects
In Table 2, we explore a panel data regression of total value product per mu on climate and a number of farm input variablesfor six grains including Early Indica rice (observations = 256), Indica rice (observations = 256), Late Indica rice (observa-tions = 160), Japonica rice (observations = 320), wheat (observations = 480) and maize (observations = 576). Both periodfixed effects and cross fixed effects are used. For each crop we report two regressions. The first is the basic model as discussedabove. The second is a more detailed adaptation model that allows for additional interaction between inputs and climatevariables. The goodness of fit measure (adjusted R2) for all the models ranges from 0.854 to 0.946 which is a relatively high levelfor double fixed effect panel data regression.
The results of the basic model, shown in Table 2, reveal that many, but not all, coefficients on input variables are highlysignificant and often change signs between the basic model and the adaptation model. For example rainfall for Early Indica rice issignificant in the basic model (−0.107, t = −2.392) but not in the adaptation model (−0.622, t = −0.739). In addition theinteraction terms for Early Indica rice for rainfall-machinery (0.095, t = 1.956) is significantly different from zero. We believethat the economic impact of rainfall on the Early Indica rice is indirect by changing the machinery input. The possible reason isthat China's main producing areas of Early Indica rice are located in the southern provinces where the sowing period is generallyearly April which is cold and rainy. Adverse weather could cause bud rot or seedling rot in rice. In order to reduce losses, farmersmight delay sowing. This adaptive behavior always requires more transplanters to replace labor, so as to catch up with theplanting season. Additionally, the harvest period of Early Indica rice in southern China is mid-July with frequent heavy rains andfloods. Combine harvesters are being introduced to ensure a timely harvest. Thus, an increase in rainfall can actually promotemachinery investment as a response to climate change. However the cost and benefit may increase at the same time, so the finalimpact of rainfall on the Early Indica rice may not be that significant. In addition the interaction terms for Early Indica rice forheat-labor (0.701, t = 1.920) and heat-fertilizer (0.888, t = 2.421) are significantly different from zero. This suggests that thetemperature during the Early Indica rice's growing season is low, and the southern provinces could face “Dao Chun Han” (latespring coldness) in April or May. Thus, increasing temperatures will raise workers' productivity and fertilizer's efficiency in awarmer environment. More generally, different patterns are found for each crop which signifies that the adaptation of each to
9 Adaptation in a narrow sense refers only to those measures that are taken at the farm level. But in fact adaptation is a much wider concept involving choices atnational and international levels as well as local. Nonetheless, intercropping or dual cropping in China has become an effective complement to monoculturesystems and intercropping/dual cropping between two crops (mentioned in this paper) is widely practiced in China. On the other hand, the diversity of this studyis drawn from a regional perspective.

Table 2Regression models with panel data and double fixed effects.
Early indica rice Indica rice Later indica rice Japonica rice Wheat Maize
Basic Adapt Basic Adapt Basic Adapt Basic Adapt Basic Adapt Basic Adapt
Constant 7.086*** 27.878*** 4.346*** 5.711 7.785*** −1.495 5.867*** 7.774*** 3.214*** 2.485** 4.861*** 4.700***(5.663) (4.184) (4.263) (1.250) (5.031) (−0.179) (14.237) (6.812) (8.520) (2.473) (16.415) (6.942)
log(l) 0.084 −2.597* 0.197*** −1.678** 0.027 −1.851 0.146*** −0.258 0.168*** 0.380* 0.038* 0.018(1.428) (−1.812) (4.579) (−2.119) (0.302) (−0.964) (3.587) (−1.181) (4.291) (1.887) (1.705) (0.156)
log(k) 0.008 −0.577* 0.008 −0.158 −0.015 −1.213 0.001 −0.083 −0.006 0.054 0.003 0.001(0.552) (−1.677) (0.438) (−0.399) (−0.670) (−1.348) (0.102) (−0.675) (−0.732) (0.661) (0.334) (0.009)
log(m) −0.020 −0.800** 0.023** −0.291 −0.032 −1.184** 0.033 0.034 0.099*** −0.120 0.013** 0.128**(−1.159) (−2.297) (2.194) (−1.314) (−1.432) (−2.400) (1.385) (0.233) (4.773) ()−0.870 (2.230) (2.124)
log(o) 0.003 −0.263 0.003 −0.566 0.023 1.691*** 0.013 0.088 0.023*** 0.039 0.020* 0.123*(0.243) (−1.138) (0.333) (−1.466) (1.552) (4.610) (1.300) (0.894) (2.720) (0.569) (1.959) (1.793)
log(f) 0.055 −2.459* 0.119*** 2.488** 0.111*** 0.161 0.160*** 0.381 0.299*** 0.331 0.197*** 0.134(1.154) (−1.922) (2.926) (2.483) (2.968) (0.088) (3.652) (1.483) (8.980) (1.634) (8.362) (1.114)
log(p) 0.005 1.008 0.047** 0.356 0.053 6.616*** 0.050** −0.262 −0.020 0.119 0.032*** 0.004(0.177) (1.526) (2.505) (0.676) (0.988) (4.353) (2.518) (−1.546) (−1.049) (0.970) (3.360) (0.054)
log(w) 0.041*** 0.545 −0.011 0.069 0.038 0.660 −0.041* −0.256* 0.010 0.023 −0.002 0.055(2.790) (1.033) (−1.095) (0.232) (1.216) (0.571) (−1.699) (−1.810) (1.021) (0.304) (−0.354) (1.244)
log(h) −0.374 −6.747*** 0.159 1.056 −0.827* 1.495 −0.234** −0.666* 0.182 0.858** −0.0001 0.302(−0.988) (−3.928) (0.514) (0.591) (−1.700) (0.752) (−2.085) (−1.962) (1.532) (1.966) (−0.001) (1.151)
log(r) −0.107** −0.622 −0.002 −0.839* 0.036 0.599 −0.067** −0.268 0.002 −0.217 0.035 −0.118(−2.392) (−0.739) (−0.057) (−1.688) (0.632) (0.576) (−1.980) (−0.983) (0.055) (−0.700) (1.257) (−0.617)
log(h) log(l) – 0.701* – 0.620* – 0.427 – −0.012 – −0.212** – −0.016(1.920) (1.940) (0.797) (−0.151) (−2.433) (−0.341)
log(h) log(k) – 0.220* – 0.217 – 0.119 – −0.014 – −0.027 – −0.012(1.683) (1.265) (0.568) (−0.429) (−0.821) (−0.418)
log(h) log(m) – 0.120 – 0.166* – 0.271* – −0.055 – 0.005 – −0.035(1.216) (1.863) (1.941) (−0.896) (0.087) (−1.544)
log(h) log(o) – 0.035 – 0.211 – −0.450*** – −0.011 – −0.037 – 0.009(0.383) (1.384) (−3.600) (−0.416) (−1.233) (0.312)
log(h) log(f) – 0.888** – −1.244*** – 0.255 – 0.102 – 0.083 – −0.044(2.421) (−2.877) (0.492) (1.461) (0.932) (−1.069)
78L.Zhou,C.G
.Turvey/China
Economic
Review28
(2014)72
–89
Early indica rice Indica rice Later indica rice Japonica rice Wheat Maize
Basic Adapt Basic Adapt Basic Adapt Basic Adapt Basic Adapt Basic Adapt
log(h) log(p) – −0.243 – −0.105 – −1.621*** – 0.108* – 0.014 – 0.054**(−1.190) (−0.492) (−4.124) (1.746) (0.303) (2.473)
log(h) log(w) – 0.005 – −0.0001 – −0.395 – 0.077 – 0.007 – 0.0002(0.040) (−0.001) (−1.278) (1.302) (0.320) (0.017)
log(r) log(l) – 0.123 – 0.030 – 0.107 – 0.108 – 0.074 – 0.015(0.734) (0.366) (0.534) (2.115) (1.241) (0.439)
log(r) log(k) – −0.013 – −0.102* – 0.181 – 0.030 – 0.003 – 0.009(−0.255) (−1.705) (1.438) (0.911) (0.098) (0.411)
log(r) log(m) – 0.095* – −0.031 – 0.074 – 0.024 – 0.051 – −0.004(1.956) (−1.048) (1.080) (0.743) (1.642) (−0.283)
log(r) log(o) – 0.034 – −0.004 – −0.059 – −0.010 – 0.021 – −0.032*(0.820) (−0.132) (−1.111) (−0.383) (1.075) (−1.700)
log(r) log(f) – 0.002 – 0.242** – −0.166 – −0.125* – −0.058 – 0.042(0.010) (2.063) (−0.748) (−1.935) (−0.885) (1.210)
log(r) log(p) – −0.053 – −0.004 – −0.371** – 0.008 – −0.044 – −0.025(−0.682) (−0.105) (−2.024) (0.244) (−1.395) (−1.307)
log(r) log(w) – −0.111 – −0.015 – 0.120 – 0.023 – −0.006 – −0.014(−1.333) (−0.379) (1.132) (0.690) (−0.280) (−1.133)
Observations 256 256 256 256 160 160 320 320 480 480 576 576Provinces 8 8 8 8 5 5 10 10 15 15 18 18Adjusted R2 0.854 0.880 0.904 0.906 0.923 0.946 0.901 0.915 0.859 0.858 0.882 0.883F-statistic 32.680*** 31.706*** 52.039*** 41.147*** 44.170*** 49.108*** 60.119*** 55.373*** 54.986*** 43.551*** 76.461*** 61.872***
Note: We explore a panel data regression of total value product per mu on climate and a number of farm input variables for six grains including Early Indica rice (observations = 256), Indica rice (observations = 256), LateIndica rice (observations = 160), Japonica rice (observations = 320), wheat (observations = 480) and maize (observations = 576). Both period fixed effects and cross fixed effects are used. For each crop we report tworegressions. The first is the basic model which is utilizing the Cobb–Douglas production function. The second is a more detailed adaptation model that allows for additional interaction between inputs and climate variables.We include the logarithmic form of variables in each model. Besides, log(r) log(w), for example, is an interaction term. Values of t-statistics in parentheses; * Significant at 10%; ** significant at 5% level; *** significant at 1%level; the results of period fixed effect and cross fixed effect are omitted.
79L.Zhou,C.G
.Turvey/China
Economic
Review28
(2014)72
–89

Table 3Elasticity estimated by panel data model.
Crop Model el ek em eo ef ep ew eh er
Early indica rice Basic 0.084 0.008 −0.020 0.003 0.055 0.005 0.041 −0.374 −0.107Adapt 0.043 0.006 0.004 −0.001 0.156 0.041 0.031 0.801 −0.023
Indica rice Basic 0.197 0.008 0.023 0.003 0.119 0.047 −0.011 0.159 −0.002Adapt 0.180 −0.002 0.032 0.004 0.093 0.045 0.003 0.265 −0.032
Later indica rice Basic 0.027 −0.015 −0.032 0.023 0.111 0.053 0.038 −0.827 0.036Adapt −0.056 0.015 −0.017 0.056 0.125 −0.033 0.053 −1.060 −0.024
Japonica rice Basic 0.146 0.001 0.033 0.013 0.160 0.050 −0.041 −0.234 −0.067Adapt 0.161 0.008 −0.003 0.021 0.118 0.043 0.033 0.068 −0.033
Wheat Basic 0.168 −0.006 0.099 0.023 0.299 −0.020 0.010 0.182 0.002Adapt 0.140 −0.004 0.096 0.029 0.307 −0.024 0.018 0.142 0.022
Maize Basic 0.038 0.003 0.013 0.020 0.197 0.032 −0.002 −0.0001 0.035Adapt 0.040 0.005 0.021 0.014 0.192 0.037 −0.002 0.018 0.004
Note: For each crop we report two regressions. The first is the basic model which is utilizing the Cobb–Douglas production function. The second is a more detailedadaptation model that allows for additional interaction between inputs and climate variables. This table reports the computed production elasticities for the 6crops between the basic and adaptive models, with all values evaluated at the mean. Where ei is the production elasticity, and the subscript i is the specificproduction factor such as labor (l).
80 L. Zhou, C.G. Turvey / China Economic Review 28 (2014) 72–89
weather variables differ, which in turn suggests from a policy point of view that adaptation policies should not be aggregated butevaluated on a crop by crop (and region by region) basis.
Our main interest is on the climate variables and the interactions of climate and input. In the basic model, the coefficients oflog temperature are significantly negative in the Late Indica rice and Japonica rice regression, and the coefficients of logprecipitation are significantly negative in the Early Indica rice and Japonica rice regressions. The results imply that, withoutadaptation, warming and wetting may be harmful to rice in China, but there may be no significant impact of climate on wheat andmaize.
In the adaptation model, we allow the various output and production elasticities to vary with the climatic variables. We findthat heat has a positive impact on the elasticity of labor, capital and machinery, and a negative impact on the elasticity ofoperating cost in several rice models. The impact of heat on the elasticity of fertilizer shows a positive effect in the Early Indica riceregression, but a negative effect in the Indica rice regression. Similarly, the impact of heat on the elasticity of pesticide shows apositive effect in Japonica rice and maize regressions, but a negative effect in the Late Indica rice regression.
The effect of temperature on planting Indica rice and Late Indica rice is higher than for maize, Japonica rice and Early Indicarice, so the elasticity of fertilizer and pesticide might increase should colder regions warm, but decrease should warmer region getwarmer. With regard to rainfall, decreasing precipitation could have a positive impact on the elasticity of capital, management,pesticide and fertilizer in Indica rice, maize, Late Indica rice and Japonica rice.
Interestingly, neither temperature nor precipitation has significant impacts on the elasticity of irrigation. Until recently, tens ofthousands of Water User Association (WUA) have been established across China. Although the WUA promotes irrigation to someextent, many problems remain unresolved. The weak conservation irrigation problem in China is likely caused by the low cost ofwater, unreasonable charge methods, backward facilities and inefficient organization. Simply put, there are not enough incentivesfor farmers to avoid rent-seeking and participate in Participatory Irrigation Management (PIM) programs to deal with climatechange. The current irrigation system may lead to a deterioration of the production environment.
The results indicate that the adaptive behaviors to warming are more likely to occur in rice production, rather than wheat ormaize production. Also, as temperatures rise, labor, capital and machinery inputs will likely increase, but management will likelydecrease. Irrigated regions may require little adaptation to warming so long as irrigation waters remain available. Theseobservations are further explored in Table 3 which compares the computed production elasticities for the 6 crops between thebasic and adaptive models, with all values evaluated at the mean.
The basic observation in Table 3 is that the production elasticities are generally positive. Of the 108 elasticities (12 × 9) only29 are negative. For the most part the basic-adaptation pairs are of the same sign although some switching is observed in 13 (of 54cases). Of the remaining 41 cases 25 (16) had more elastic (inelastic) production elasticities although some differences are slightand differ by crop and input. Again we read into these results a warning that adaptation strategies should not be universallyapplied as a matter of course across all crops and that the interaction between climate, inputs and outputs do have a crop-specificendogeneity complex that must be considered.
Having said this we focus now on the heat and rainfall elasticities for the adaptation model in the last two columns of Table 3.For Early Indica rice, for example, the elasticity for heat is interpreted as follows; a 1% increase in annual temperature will lead toabout 1% increase in productivity of Early Indica rice conditional on input production elasticities. Likewise, for rainfall, a 1%decrease in rainfall will result in a 0.023% reduction in early India rice production. The heat elasticities for Indica rice, Late Indicarice, Japonica rice, wheat and maize are 0.265, −1.060, 0.068, 0.142, and 0.018. Only Late Indica rice has a negative and nearlyperfectly elastic response. These results suggest that if temperatures rise, Early Indica rice will benefit most and Late Indica ricewill benefit least. The possible reason is that the main producing areas of Late Indica rice are located in southern China (such asGuangdong, Guangxi, Fujian and Jiangxi). The temperature of Late Indica rice's growing season (generally from July to November)in southern China is already very high. Further elevated temperature might cause more increases in plant diseases and insect

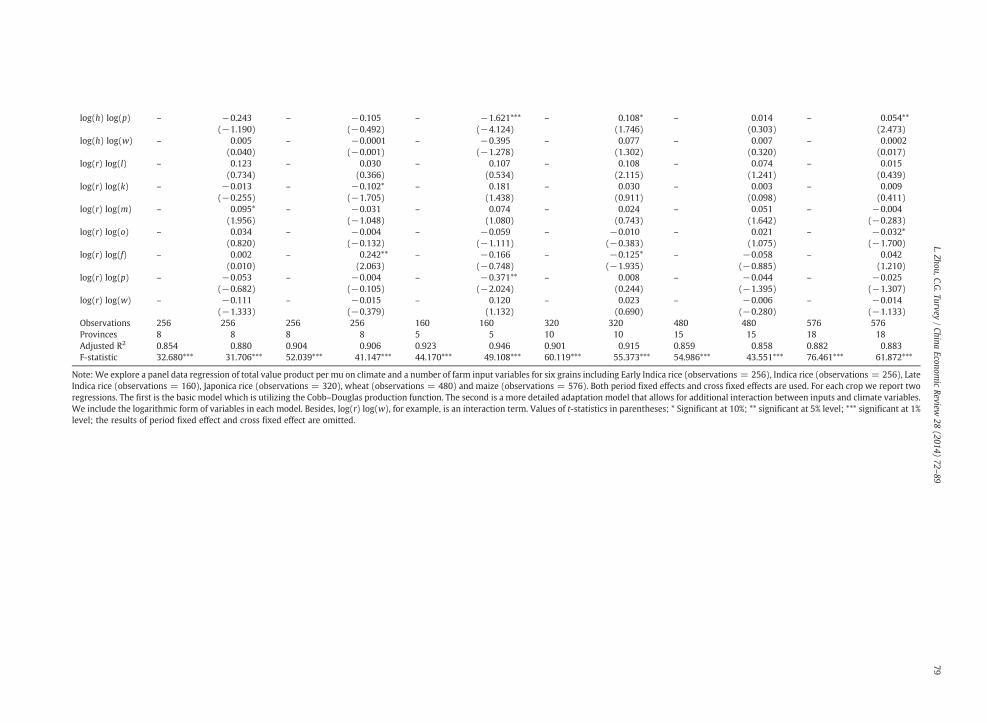
Table 4Elasticity estimated by time series model for each region.
Crop Region el ek em eo ef ep ew eh er
Early indica rice Zhejiang 0.221 −0.032 0.070 −0.022 0.032 0.179 0.211 −0.040 −0.097Anhui −0.295 −0.069 −0.086 −0.030 0.043 0.152 0.127 1.695 −0.074Fujian 0.022 0.086 0.151 0.205 0.185 0.158 −0.002 2.806 0.097Jiangxi −0.055 0.251 0.061 0.004 0.023 −0.032 −0.147 0.685 0.106Hubei −0.563 0.316 0.311 0.128 0.463 0.255 0.037 2.430 0.859Hunan −0.308 −0.174 0.016 0.043 0.032 0.179 0.107 −2.111 0.055Guangdong −0.195 0.035 −0.013 −0.006 0.689 0.018 0.073 0.821 −0.136Guangxi 0.160 0.048 0.061 −0.005 0.937 −0.252 −0.101 6.085 −0.858
Indica rice Jiangsu −0.875 −0.092 −0.227 0.025 0.996 0.256 0.261 1.749 1.238Anhui 0.272 −0.073 −0.125 −0.022 0.380 0.027 −0.013 1.447 0.101Fujian 0.217 0.025 0.043 0.004 0.134 0.028 −0.015 0.034 0.080Henan 0.011 0.044 −0.006 −0.002 0.178 0.046 −0.031 1.866 0.027Hubei −0.376 0.078 −0.048 0.063 0.281 0.229 −0.009 0.330 −0.047Sichuan 0.312 −0.145 0.007 0.038 0.042 0.037 −0.034 0.802 0.024Guizhou 0.643 −0.085 0.023 0.029 0.220 −0.080 −0.214 −1.214 −0.331Shaanxi 0.182 0.124 0.049 −0.050 0.121 0.228 0.096 −2.008 −0.051
Later indica rice Fujian −0.228 −0.045 0.120 0.116 0.384 −0.212 0.057 −0.286 −0.005Jiangxi 0.108 0.029 −0.004 0.104 0.027 0.073 0.080 0.472 0.053Hunan −0.314 −0.007 −0.080 0.132 0.118 0.342 0.080 −4.057 −0.054Guangdong 0.022 0.361 −0.247 −0.173 −0.081 −0.045 0.194 1.263 −0.760Guangxi 0.079 0.043 0.012 −0.021 0.043 −0.181 0.027 0.500 0.081
Japonica rice Hebei 0.078 0.076 −0.050 0.026 0.372 −0.126 0.128 0.850 0.054Liaoning 0.355 0.030 −0.043 −0.025 0.148 0.048 −0.061 −0.667 0.013Jilin 0.046 0.131 −0.097 −0.111 0.854 −0.073 −0.235 −0.290 0.045Heilongjiang 0.013 −0.028 −0.074 −0.062 −0.006 0.113 0.247 0.007 −0.117Jiangsu 0.278 −0.029 −0.058 0.040 −0.153 0.104 0.331 −0.925 −0.131Zhejiang −0.183 0.219 0.234 0.305 0.293 0.118 −0.172 1.037 0.291Anhui 0.206 −0.048 −0.030 0.030 −0.054 0.099 0.031 0.563 0.011Shandong −0.003 −0.049 0.588 −0.058 −0.941 −0.052 −0.134 −5.909 −1.057Yunnan 0.867 −0.011 −0.026 −0.059 0.063 −0.321 0.048 0.874 0.251Ningxia 0.046 0.084 −0.010 0.022 0.110 −0.101 −0.024 0.361 −0.089
Wheat Hebei −0.041 0.025 0.073 0.038 0.492 −0.005 0.180 0.252 0.077Shanxi −0.143 0.003 0.172 0.065 0.419 −0.021 0.149 −1.144 0.260Neimenggu 0.076 0.045 0.048 −0.014 0.253 −0.024 0.149 0.398 0.139Heilongjiang 0.166 −0.082 0.043 0.208 0.310 −0.079 −0.014 0.186 0.114Jiangsu 0.069 0.178 −0.108 −0.158 1.206 −0.142 0.116 −3.512 −0.217Anhui 0.760 −0.112 −0.103 −0.018 0.040 0.163 −0.060 −0.040 −0.600Shandong 0.440 −0.058 0.036 −0.009 −0.172 0.159 0.192 −2.680 −0.037Henan 0.474 0.047 0.175 −0.108 0.027 −0.160 0.073 −1.768 0.078Hubei −1.006 −0.116 −0.219 −0.045 0.382 0.587 −0.093 −4.342 −0.465Sichuan −0.011 −0.049 0.000 0.005 0.047 0.142 −0.006 0.372 −0.223Yunnan 0.649 −0.039 0.066 0.282 0.083 0.005 0.158 −1.111 0.594Shaanxi 0.080 −0.379 0.147 0.035 0.036 −0.128 0.116 1.215 −0.006Gansu 0.513 0.455 0.161 −0.033 −0.139 −0.045 −0.177 0.569 0.019Ningxia 0.145 0.021 0.167 0.160 −0.058 0.213 −0.038 −0.724 −0.103Xinjiang 0.100 −0.008 0.115 −0.092 0.287 −0.056 0.139 0.157 0.082
(continued on next page) 81L.Zhou,C.G
.Turvey/China
Economic
Review28
(2014)72
–89
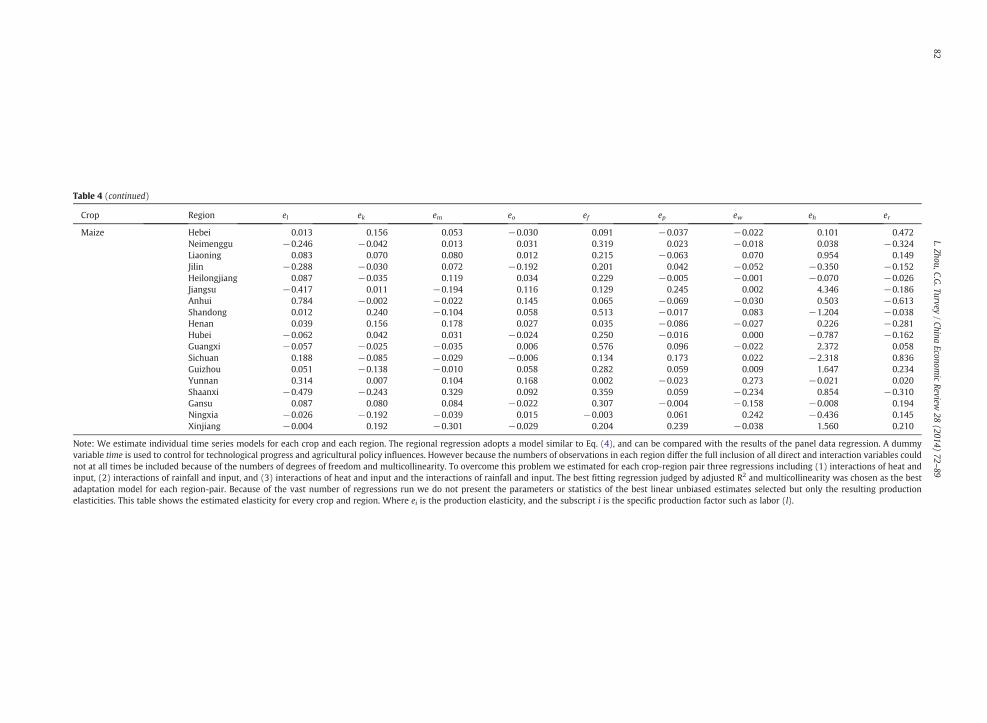
Table 4 (continued)
Crop Region el ek em eo ef ep ew eh er
Maize Hebei 0.013 0.156 0.053 −0.030 0.091 −0.037 −0.022 0.101 0.472Neimenggu −0.246 −0.042 0.013 0.031 0.319 0.023 −0.018 0.038 −0.324Liaoning 0.083 0.070 0.080 0.012 0.215 −0.063 0.070 0.954 0.149Jilin −0.288 −0.030 0.072 −0.192 0.201 0.042 −0.052 −0.350 −0.152Heilongjiang 0.087 −0.035 0.119 0.034 0.229 −0.005 −0.001 −0.070 −0.026Jiangsu −0.417 0.011 −0.194 0.116 0.129 0.245 0.002 4.346 −0.186Anhui 0.784 −0.002 −0.022 0.145 0.065 −0.069 −0.030 0.503 −0.613Shandong 0.012 0.240 −0.104 0.058 0.513 −0.017 0.083 −1.204 −0.038Henan 0.039 0.156 0.178 0.027 0.035 −0.086 −0.027 0.226 −0.281Hubei −0.062 0.042 0.031 −0.024 0.250 −0.016 0.000 −0.787 −0.162Guangxi −0.057 −0.025 −0.035 0.006 0.576 0.096 −0.022 2.372 0.058Sichuan 0.188 −0.085 −0.029 −0.006 0.134 0.173 0.022 −2.318 0.836Guizhou 0.051 −0.138 −0.010 0.058 0.282 0.059 0.009 1.647 0.234Yunnan 0.314 0.007 0.104 0.168 0.002 −0.023 0.273 −0.021 0.020Shaanxi −0.479 −0.243 0.329 0.092 0.359 0.059 −0.234 0.854 −0.310Gansu 0.087 0.080 0.084 −0.022 0.307 −0.004 −0.158 −0.008 0.194Ningxia −0.026 −0.192 −0.039 0.015 −0.003 0.061 0.242 −0.436 0.145Xinjiang −0.004 0.192 −0.301 −0.029 0.204 0.239 −0.038 1.560 0.210
Note: We estimate individual time series models for each crop and each region. The regional regression adopts a model similar to Eq. (4), and can be compared with the results of the panel data regression. A dummyvariable time is used to control for technological progress and agricultural policy influences. However because the numbers of observations in each region differ the full inclusion of all direct and interaction variables couldnot at all times be included because of the numbers of degrees of freedom and multicollinearity. To overcome this problem we estimated for each crop-region pair three regressions including (1) interactions of heat andinput, (2) interactions of rainfall and input, and (3) interactions of heat and input and the interactions of rainfall and input. The best fitting regression judged by adjusted R2 and multicollinearity was chosen as the bestadaptation model for each region-pair. Because of the vast number of regressions run we do not present the parameters or statistics of the best linear unbiased estimates selected but only the resulting productionelasticities. This table shows the estimated elasticity for every crop and region. Where ei is the production elasticity, and the subscript i is the specific production factor such as labor (l).
82L.Zhou,C.G
.Turvey/China
Economic
Review28
(2014)72
–89
Table 5Estimated elasticity of climate for early indica rice.
Early indica rice er
Positive Negative
eh Positive 3 regions: Fujian (eh = 2.806, er = 0.097) 3 regions: Guangxi (eh = 6.085, er = −0.858)Hubei (eh = 2.430, er = 0.859) Anhui (eh = 1.695, er = −0.074)Jiangxi (eh = 0.685, er = 0.106) Guangdong (eh = 0.821, er = −0.136)
Negative 1 region: Hunan (eh = −2.111, er = 0.055) 1 region: Zhejiang (eh = −0.040, er = −0.097)
Note: To synthesize results of Table 4 and make them simpler to interpret we break down each crop into separate table of four quadrants comprised of positiveand negative heat and precipitation elasticity pairings. Assuming that climate change occurs with increasing temperature and decreasing precipitation it isassumed under the four quadrants that climate change would be 1) beneficial to the region with positive eh and negative er; 2) harmful to the region withnegative eh and positiveer; uncertain for the region with 3) positive eh and positiveer, or 4) negative eh and negative er. Results in this table show that, withadaptation, the economic impacts of warming on Early Indica rice are mostly positive, however, the economic impact of drying is mixed.
83L. Zhou, C.G. Turvey / China Economic Review 28 (2014) 72–89
pests (e.g. plant hoppers). This may require increased pesticides, labor and machinery. Hence the input cost rises, and the netincome per area may fall.
For rainfall, Early Indica rice (−0.023), Indica rice (−0.032), Late Indica rice (−0.024) and Japonica rice (−0.033) will have agenerally inelastic response to decreased rainfall. However wheat (0.022) and maize (0.004) may see reductions in production,but again the elasticities are small. With adaptation, these results suggest that moderate warmingwould benefit grain production,while lower precipitation suggests to wheat and maize, but beneficial to rice.
3.2. Regional effects
The results presented above are aggregated across regions and do not show sensitivities that might otherwise occur. In this setof final regressions we estimate individual time series models for each crop and each region. The regional regression adopts amodel similar to Eq. (4), and can be compared with the results of the panel data regression. A dummy variable time is used to
Table 7Estimated elasticity of climate for later indica rice.
Later Indica rice er
Positive Negative
eh Positive 2 regions: Guangxi (eh = 0.500, er = 0.081) 1 region: Guangdong (eh = 1.263, er = −0.760)Jiangxi (eh = 0.472, er = 0.053)
Negative – 1 region: Hunan (eh = −4.057, er = −0.054)Fujian (eh = −0.286, er = −0.005)
Note: To synthesize results of Table 4 and make them simpler to interpret we break down each crop into separate table of four quadrants comprised of positiveand negative heat and precipitation elasticity pairings. Assuming that climate change occurs with increasing temperature and decreasing precipitation it isassumed under the four quadrants that climate change would be 1) beneficial to the region with positive eh and negative er; 2) harmful to the region withnegative eh and positiveer; uncertain for the region with 3) positive eh and positiveer, or 4) negative eh and negative er. Results in this table show that, withadaptation, economic impacts of warming and drying on Late Indica rice are mixed. Only one region (Guangdong) would benefit from climate change while noregion would be harmed. Most regions are impacted only partially by climate change (e.g. Fujian, Hunan, Jiangxi and Guangxi).
Table 6Estimated elasticity of climate for indica rice.
Indica rice er
Positive Negative
eh Positive 5 regions: Henan (eh = 1.886, er = 0.027) 1 region: Hubei (eh = 0.330, er = −0.047)Jiangsu (eh = 1.749, er = 1.238)Anhui (eh = 1.447, er = 0.101)Sichuan (eh = 0.802, er = 0.024)Fujian (eh = 0.034, er = 0.080)
Negative – 2 regions: Shaanxi (eh = −2.008, er = −0.051)Guizhou (eh = −1.214, er = −0.331)
Note: To synthesize results of Table 4 and make them simpler to interpret we break down each crop into separate table of four quadrants comprised of positiveand negative heat and precipitation elasticity pairings. Assuming that climate change occurs with increasing temperature and decreasing precipitation it isassumed under the four quadrants that climate change would be 1) beneficial to the region with positive eh and negative er; 2) harmful to the region withnegative eh and positiveer; uncertain for the region with 3) positive eh and positiveer, or 4) negative eh and negative er. Results in this table show that, withadaptation, the economic impacts of increasing temperature are mostly positive (six eighths), and the economic impacts of decreasing precipitation on Indica riceare mostly negative (five eighths).

Table 8Estimated elasticity of climate for Japonica rice.
Japonica rice er
Positive Negative
eh Positive 4 regions: Zhejiang (eh = 1.037, er = 0.291) 2 regions: Ningxia (eh = 0.361, er = −0.089)Yunnan (eh = 0.874, er = 0.251) Heilongjiang (eh = 0.007, er = −0.117)Hebei (eh = 0.850, er = 0.054)Anhui (eh = 0.563, er = 0.011)
Negative 2 regions: Liaoning (eh = −0.667, er = 0.013) 2 regions: Shandong (eh = −5.909, er = −1.057)Jilin (eh = −0.290, er = 0.045) Jiangsu (eh = −0.925, er = −0.131)
Note: To synthesize results of Table 4 and make them simpler to interpret we break down each crop into separate table of four quadrants comprised of positiveand negative heat and precipitation elasticity pairings. Assuming that climate change occurs with increasing temperature and decreasing precipitation it isassumed under the four quadrants that climate change would be 1) beneficial to the region with positive eh and negative er; 2) harmful to the region withnegative eh and positiveer; uncertain for the region with 3) positive eh and positiveer, or 4) negative eh and negative er. The economic impacts of climate change onJaponica rice are shown in this table. We can find that, for Japonica rice, the impacts across the Three Northeastern Provinces' differ. Heilongjiang would likelybenefit from the warming and drying, while Liaoning and Jilin could be harmed by climate change.
84 L. Zhou, C.G. Turvey / China Economic Review 28 (2014) 72–89
control for technological progress and agricultural policy influences. However because the numbers of observations in each regiondiffer the full inclusion of all direct and interaction variables could not at all times be included because of the numbers of degreesof freedom and multicollinearity. To overcome this problem we estimated for each crop-region pair three regressions including(1) interactions of heat and input, (2) interactions of rainfall and input, and (3) interactions of heat and input and the interactionsof rainfall and input. The best fitting regression judged by adjusted R2 and multicollinearity was chosen as the best adaptationmodel for each region-pair. Because of the vast number of regressions run we do not present the parameters or statistics of thebest linear unbiased estimates selected but only the resulting production elasticities in Table 4.
Table 4, shows the estimated elasticity for every crop and region. As before we find that the productivities of every factor varygreatly from crop to crop and with these regressions region to region also. To synthesize these results and make them simpler tointerpret we break down each crop into separate tables (Tables 5–10) of four quadrants comprised of positive and negativeheat and precipitation elasticity pairings. Assuming that climate change occurs with increasing temperature and decreasingprecipitation it is assumed under the four quadrants that climate change would be 1) beneficial to the region with positive eh andnegative er; 2) harmful to the region with negative eh and positive er; uncertain for the region with 3) positive eh and positive er, or4) negative eh and negative er.
Results in Table 5 show that, with adaptation, the economic impacts of warming on Early Indica rice are mostly positive,however, the economic impact of drying is mixed. Three regions (Guangxi, Anhui and Guangdong) would benefit from theclimate change; one region (Hunan) would be harmed by climate change. In Table 6, the economic impacts of increasingtemperature are mostly positive (six eighths), and the economic impacts of decreasing precipitation on Indica rice are mostlynegative (five eighths). If we assume that the climate scenario is warming and drying, only one region (Hubei) would benefitfrom the climate change and no region would be harmed by climate change. Most regions are partially impacted by climatechange, such as Guizhou, Shaanxi, Jiangsu, Anhui, Fujian, Henan and Sichuan. In Table 7, economic impacts of warming and dryingon Late Indica rice are mixed. Only one region (Guangdong) would benefit from climate change while no region would beharmed. Most regions are impacted only partially by climate change (e.g. Fujian, Hunan, Jiangxi and Guangxi).
Table 9Estimated elasticity of climate for wheat.
Wheat er
Positive Negative
eh Positive 5 regions: Gansu (eh = 0.569, er = 0.019) 2 regions: Shaanxi (eh = 1.215, er = −0.006)Neimenggu (eh = 0.398, er = 0.139) Sichuan (eh = 0.372, er = −0.223)Hebei (eh = 0.252, er = 0.077)Heilongjiang (eh = 0.186, er = 0.114)Xinjiang (eh = 0.157, er = 0.082)
Negative 3 regions: Henan (eh = −1.768, er = 0.078) 5 regions: Hubei (eh = −4.342, er = −0.465)Shanxi (eh = −1.144, er = 0.260) Jiangsu (eh = −3.152, er = −0.217)Yunnan (eh = −1.111, er = 0.594) Shandong (eh = −2.680, er = −0.037)
Ningxia (eh = −0.724, er = −0.103)Anhui (eh = −0.040, er = −0.600)
Note: To synthesize results of Table 4 and make them simpler to interpret we break down each crop into separate table of four quadrants comprised of positiveand negative heat and precipitation elasticity pairings. Assuming that climate change occurs with increasing temperature and decreasing precipitation it isassumed under the four quadrants that climate change would be 1) beneficial to the region with positive eh and negative er; 2) harmful to the region withnegative eh and positiveer; uncertain for the region with 3) positive eh and positiveer, or 4) negative eh and negative er. This table shows the economic impact ofclimate change on wheat. Two regions (Sichuan and Shaanxi) would benefit from the warming and drying, and three regions (Henan, Shanxi and Yunnan) wouldbe harmed by climate change. Most of regions are partially impacted by climate change.

Table 10Estimated elasticity of climate for maize.
Maize er
Positive Negative
eh Positive 5 regions: Guangxi (eh = 2.372, er = 0.058) 5 regions: Jiangsu (eh = 4.346, er = −0.186)Guizhou (eh = 1.647, er = 0.234) Shaanxi (eh = 0.854, er = −0.310)Xinjiang (eh = 1.560, er = 0.210) Anhui (eh = 0.503, er = −0.613)Liaoning (eh = 0.954, er = 0.149) Henan (eh = 0.226, er = −0.281)Hebei (eh = 0.101, er = 0.472) Neimenggu (eh = 0.038, er = −0.324)
Negative 4 regions: Sichuan (eh = −2.318, er = 0.836) 4 regions: Shandong (eh = −1.204, er = −0.038)Ningxia (eh = −0.436, er = 0.145) Hubei (eh = −0.787, er = −0.162)Yunnan (eh = −0.021, er = 0.020) Jilin (eh = −0.350, er = −0.152)Gansu (eh = −0.008, er = 0.194) Heilongjiang (eh = −0.070, er = −0.026)
Note: To synthesize results of Table 4 and make them simpler to interpret we break down each crop into separate table of four quadrants comprised of positiveand negative heat and precipitation elasticity pairings. Assuming that climate change occurs with increasing temperature and decreasing precipitation it isassumed under the four quadrants that climate change would be 1) beneficial to the region with positive eh and negative er; 2) harmful to the region withnegative eh and positiveer; uncertain for the region with 3) positive eh and positiveer, or 4) negative eh and negative er. The economic impact of climate change onmaize is provided in this table. Results suggest that five regions (Jiangsu, Shaanxi, Anhui, Henan and Neimenggu) might benefit from warming and drying, whilefour regions (Sichuan, Ningxia, Yunnan and Gansu) could be harmed.
85L. Zhou, C.G. Turvey / China Economic Review 28 (2014) 72–89
The economic impacts of climate change on Japonica rice are shown in Table 8. For Japonica rice the impacts across the ThreeNortheastern Provinces' differ. Heilongjiang would likely benefit from the warming and drying, while Liaoning and Jilin could beharmed by climate change. The Three Northeastern Provinces have the lowest annual average temperature in China, but growingrice generally requires relatively high temperatures, thus, only one crop of Japonica rice is found in the northeast and this mightbe sensitive to climate warming. Even so, Heilongjiang (the northernmost region of China) has in recent years not only expandedits rice planting northward significantly, but also planted new rice varieties which adapt to warmer climate. For example, theproportions of land sown to rice in 2000 for Heilongjiang, Liaoning and Jilin were 17.21%, 13.52% and 12.87% respectively; by2011, the corresponding proportions were 24.10%, 15.91%, and 13.24%. This might suggest that, at least in Heilongjiang, farmershave already adapted to warming by planting more Japonica rice. We can deduce that, with the climate warming, the expectednet income for planting Japonica rice in Heilongjiang increased significantly.
Table 9 shows the economic impact of climate change on wheat. Two regions (Sichuan and Shaanxi) would benefit from thewarming and drying, and three regions (Henan, Shanxi and Yunnan) would be harmed by climate change. Most of the regionsare partially impacted by climate change. We find that increasing temperatures in autumn and winter does not necessarily helpwheat production (e.g. for Henan). A warmer winter would cause the over growth of wheat before winter. To adapt to warmer
Table 11Estimated elasticity of climate and risk management.
Choice of wheat and maize Choice of wheat and japonica rice Choice of maize and japonica rice
Wheat Maize Risk Type Wheat Japonica rice Risk Type Maize Japonica rice Risk Type
Hebei eh + er+ eh + er+ Non-div. eh + er+ eh + er+ Non-div. eh + er+ eh + er+ Non-div.Shandong eh − er− eh − er− Non-div. eh − er− eh − er− Non-div. eh − er− eh − er− Non-div.Xinjiang eh + er+ eh + er+ Non-div. – – – – – –
Shaanxi eh + er− eh + er− Non-div. – – – – – –
Hubei eh − er− eh − er− Non-div. – – – – – –
Jiangsu eh − er− eh + er− Part-div. eh − er− eh − er− Non-div. eh + er− eh − er− Part-div.Yunnan eh − er+ eh − er+ Non-div. eh − er+ eh + er+ Part-div. eh − er+ eh + er+ Part-div.Liaoning – – – – – – eh + er+ eh − er+ Part-div.Jilin – – – – – – eh − er− eh − er+ Part-div.Neimenggu eh + er+ eh + er− Part-div. – – – – – –
Gansu eh + er+ eh − er+ Part-div. – – – – – –
Heilongjiang eh + er+ eh − er− Div. eh + er+ eh + er− Part-div. eh − er− eh + er− Part-div.Ningxia eh − er− eh − er+ Part-div. eh − er− eh + er− Part-div. eh − er+ eh + er− Div.Anhui eh − er− eh + er− Part-div. eh − er− eh + er+ Div. eh + er− eh + er+ Part-div.Henan eh − er+ eh + er− Div. – – – – – –
Sichuan eh + er− eh − er+ Div. – – – – – –
Note: This table shows the pairwise comparisons of three widely distributed grain crops (wheat, maize and Japonica rice) by region to determine the degree bywhich each region would be diversified according to covariate risk. In this context covariate risk is positive if the heat-precipitation elasticity pairs are thesame (non-diversified), opposite (diversified) or mixed (partly diversified). Crops that are non-diversified would likely respond similarly with climate change(i.e. what is good or bad for one, is also good or bad for the other.) With crops that are diversified we would have asymmetric responses. We assess sixteenregions' climate risk management. For the combination of wheat and maize, non-diversified regions include Heibei, Xinjiang, Shaanxi, Yunnan, Shandong, Hubei;diversified regions include Henan, Sichuan and Heilongjiang; partly-diversified areas include Neimenggu, Gansu, Jiangsu, Anhui and Ningxia. For the combinationof wheat and Japonica rice, non-diversified regions include Hebei, Jiangsu and Shandong; diversified regions include Anhui; part-diversified include Heilongjiang,Yunnan and Ningxia. For the combination of maize and Japonica rice, non-diversified regions include Hebei and Shandong; diversified regions include Ningxia;part-diversified include Anhui, Yunnan, Liaoning and Jiangsu. Where ei is the production elasticity, and the subscript i is the specific climate condition (such asheat (h) and rain (r)). “+” indicates that estimated elasticity is positive, and “−” indicates that estimated elasticity is negative.
86 L. Zhou, C.G. Turvey / China Economic Review 28 (2014) 72–89
weather, the sowing date of wheat should be delayed. However, in reality a typical farming system is “two crops-one year” (oneseason wheat and one season summer maize growing in one year). The delayed sowing date will cause decreased accumulatedtemperature before winter (from summer maize harvesting to winter wheat planting), affecting thermal utilization, which maylower wheat yields.
The economic impact of climate change on maize is provided in Table 10. Results suggest that five regions (Jiangsu, Shaanxi,Anhui, Henan and Neimenggu) might benefit fromwarming and drying, while four regions (Sichuan, Ningxia, Yunnan and Gansu)could be harmed. However, it should be noted that some provinces had small areas allocated to the vulnerable crop. For example,Ningxia, which had high vulnerability in maize, allocated less than 5% of cultivated land to this crop (Simelton et al., 2009).
We also find that wheat planted in Sichuan could benefit from climate change, but the maize could be harmed by increasingtemperatures and decreasing rainfall. Sichuan mainly plants winter wheat which may benefit from warming; however Sichuan is alsothe most southerly province in the main maize producing areas, therefore the further increases in temperature during the growingperiod of maize (fromMay to September) might lead to higher pesticide costs especially in summer. Because of the different economicsat play different crops planted in the same region can feasibly exhibit different responses to climate change.
3.3. Adaptation and covariate risk
As a final set of observations we include in Table 11 pairwise comparisons of three widely distributed grain crops (wheat,maize and Japonica rice) by region to determine the degree by which each region would be diversified according to covariate risk.In this context covariate risk is positive if the heat-precipitation elasticity pairs are the same (non-diversified), opposite(diversified) or mixed (partly diversified). Crops that are non-diversified would likely respond similarly with climate change(i.e. what is good or bad for one, is also good or bad for the other.) With crops that are diversified we would have asymmetricresponses.
We assess sixteen regions' climate risk management. For the combination of wheat and maize, non-diversified regionsinclude Heibei, Xinjiang, Shaanxi, Yunnan, Shandong, Hubei; diversified regions include Henan, Sichuan and Heilongjiang;partly-diversified areas include Neimenggu, Gansu, Jiangsu, Anhui and Ningxia. For the combination of wheat and Japonica rice,non-diversified regions include Hebei, Jiangsu and Shandong; diversified regions include Anhui; part-diversified includeHeilongjiang, Yunnan and Ningxia. For the combination of maize and Japonica rice, non-diversified regions include Hebei andShandong; diversified regions include Ningxia; part-diversified include Anhui, Yunnan, Liaoning and Jiangsu.
Four levels of climate risk are identified for policy action: 1st risk level regions, including Hebei and Shandong, are largelyundiversified or susceptible and should be encouraged by policymakers to seek out greater diversification and adaptation; the2nd degree risk regions, including Jiangsu, Xinjiang, Shaanxi, Yunnan and Hubei, are non-diversified region for at least one pair ofcrops; economic losses in one crop would be offset by gains in another so revenue variance across the regions should be morestable; the 3rd degree risk regions, including Liaoning, Jilin, Neimenggu and Gansu, are part-diversified regions; the 4th risk levelregions, including Henan, Sichuan, Heilongjiang, Ningxia, and Anhui, are diversified for at least one pair of crops and could adjustthe crop choices to counteract the climate risks.
But we also observe that much of the central, northern and western regions might have already adapted to climate change, orare at least poised to confront climate change through already established adaptation strategies. The basic results are similar toprevious studies (e.g. Simelton et al., 2009). In fact, a warming and drying climate has already caused the northern boundary ofareas with winter wheat to move further north and west. In the Northeast China, two-crop per year systems have been replacedwith one-crop systems with the result of higher crop yields. New varieties have been adopted and the timing of crop maturity haschanged from early to mid and late maturity (Yang et al., 2007).
For the 1st degree risk regions, we found that, Shandong and Hebei are indeed short of water resources. In 2010, theaverage water resources per arable land in China is 1692.82 m3/mu, whereas, the amount available in Hebei and Shandong is146.60 m3/mu and 274.22 m3/mu, ranking as the 3rd and 5th lowest provinces. However, many regions with even more scarcewater resources and severe droughts, such as Ningxia, Neimenggu and Gansu, have adapted more or less to climate change. Forcentral, western and northern China, farmers' livelihood highly depends on grain production, and the low opportunity cost ofgrain production provides the flexibility needed by farmers to adapt accordingly. In contrast, in the eastern and coastal regionsthe high opportunity cost of food production may result in a move gradual adaptation to less vulnerable, more profitable crops.For example, in 2010 vegetable and fruit production in Shandong and Hebei was 118.24 and 86.86 million tons, ranking 1st and3rd in China. Due to water resources constraints and the high opportunity cost of grain production, Shandong and Hebei havemade great efforts to develop modern agricultural practices for cash crops. Consequently, these regions have more adaptivechoices beyond the boundary of grain varieties.
4. Conclusion and policy implications
In this paper we investigated how climate change might affect China's agricultural economy and how China might best adaptto climate change. Using a novel hedonic, whole farm production function model with weather contingent production elasticities,we compute elasticities for heat and rainfall alongside production elasticities for factor inputs. The model is essentially a randomcoefficients model which in reduced form was used to regress gross revenues on climate and a series of control variables usingcross-sectional time series data from 24 provinces over a 32-year period for Early Indica rice, Indica rice, Late Indica rice, Japonicarice, wheat and maize.
87L. Zhou, C.G. Turvey / China Economic Review 28 (2014) 72–89
Overall, the economic impacts of climate change are mixed, that is, some regions are winners and the others are losers, and theeffect is crop-specific, not general. Our basic results are consistent with studies on other countries (Mendelsohn & Dinar, 2003;Mendelsohn et al., 1994; Seo&Mendelsohn, 2008). First, climate has an economic effect on grain production in every country. Second,higher temperatures are beneficial when cold regions are getting warm, but harmful whenwarm regions are getting hot. Third, moreprecipitation is beneficial unless there is an excessive amount of rain. Fourth, the adaptations vary greatly from region to region.
Our empirical results indicate that with adaptation, the economic impacts of climate could be reversed; the economic impactsof increasing temperature are always positive except for Late Indica rice; less precipitation will benefit rice production in general,but will harm wheat and maize production. Furthermore, our results suggest that for many crops the process of adaptation hasalready begun and particularly for rice crops conditions of more heat and less rainfall may in fact be beneficial in most cases. Thisis not true of wheat or maize production. Crops with access to irrigation, and this would be most rice crops, are not sensitive toclimate change. However one caveat is in order. Since we use panel data the availability of water is endogenous to the productionprocesses generated through the model we estimate. Should climate change start to intrude on the supply of water for irrigationthese results will not hold and policies targeted towards greater diversification will be necessary (see Fleischer et al., 2008; Seo,2011). Because water supply is endogenous to the model we cannot speak directly to this point but every indicationnotwithstanding, the policy direction in the present is not so much to focus on switching cropping regimes but in managing waterresources. The Method of Managing Water Price for Water Conservancy Project of 2004 increased the price of irrigation watergradually but the amount paid by farmers was still much lower than the true cost of irrigation water. To avoid wasting irrigationwater, which will likely limit the long-term efficacy of irrigation as an ecologically stable approach to climate change, thegovernment should intervene immediately through moral suasion to encourage conservation and if that fails to revisit the lowprice regime. So long as water resources can be managed in the long run switching crop regimes may not be necessary at all. Ourresults suggest that broad policy designs that assume that climate change will be harmful in every region and across crops aremisguided. One very clear result from this study is that growers of different crops in different regions will respond differently, if atall. Any attempt to implement a one-policy-fits-all design should be resisted if at all possible. Targeted policies will be moreeffective. For example, most of the central, western and northern regions of China are less sensitive to climate change and havealready adapted to the increasing temperature and decreasing precipitation, whereas some eastern and coastal regions, such asShandong and Hebei, would be more vulnerable and open to targeted policies; warming and drying will threaten eastern andcoastal regions but may be beneficial to central, western and northern regions, and the vulnerability of grain production in eastChina may be caused by a switch to the low opportunity cost cash crops and a deteriorated irrigation system allocated to grainproduction. Simelton et al. (2009) found that across all three grain crops (rice, wheat and maize), provinces with a high meanvulnerability index were predominantly located in southern and coastal regions. However, Wang et al. (2009) found thatwarming would help the southeast region but hurt the west and far north. We believe that this difference may lie in theadaptation of total factors and the regional and crop-specific model. Any evaluation of the impact of climate change on grainproduction in China will remain rough unless it incorporates scenarios of total-factor-adaptation.
Like other developing countries, adaptation to climate change especially through irrigation is crucial for China due to its hugepopulation and diverse ecosystems. The adverse effects of climate change might be overcome by increased use of fertilizers,machine, and new crop varieties. In fact, the positive effects of climate change do not generally arise automatically, but require thegovernment to support extension services, new crop varieties, and improved machinery applications, irrigation systems, credit,industrial organization, and from time-to-time stabilizing crop prices. As climate changes, China's major grain production areasmight gradually transfer to central and north China for the sake of the comparative advantage. There is no indication that thiswould adversely impact China's food security in the near future. However, it would not be imprudent for China to promote adomestic grain purchasing market, eliminate trans-regional food trade barriers, and optimize the allocation of resources acrossthe country. In terms of direct and precautionary action, the Chinese government should strengthen irrigation system, improvethe accuracy of weather forecast, and accelerate the construction of high standard farmland to address future climate change.
Acknowledgments
The work was supported by the National Natural Sciences Foundation (71203094), the National Social Science Foundation(11&ZD155), the National Social Science Foundation (10zd&031) and the National Social Science Foundation (13&ZD160) inChina, as well as the W.I. Meyers Endowment funds at Cornell University.
References
Ackerman, F., & Munitz, C. (2012). Climate damages in the FUND model: A disaggregated analysis. Ecological Economics, 77, 219–224.Adams, R. M., Fleming, R. A., Chang, C., McCarl, B. A., & Rosenzweig, C. (1995). A reassessment of the economic effects of global climate change on U.S. agriculture.
Climatic Change, 30(2), 147–167.Ainsworth, E. A., Leakey, A. D. B., Ort, D. R., & Long, S. P. (2008). FACE-ing the facts: Inconsistencies and interdependence among field, chamber and modeling
studies of elevated CO2 impacts on crop yield and food supply. New Phytologist, 179(1), 5–9.Alpizar, F., Carlsson, F., & Naranjo, M. A. (2011). The effect of ambiguous risk, and coordination on farmers' adaptation to climate change — A framed field
experiment. Ecological Economics, 70, 2317–2326.Barrios, S., Ouattara, B., & Strobl, E. (2008). The impact of climatic change on agricultural production: Is it different for Africa? Food Policy, 33, 287–298.Bradshaw, B., Dolan, H., & Smit, B. (2004). Farm-level adaptation to climatic variability and change: Crop diversification in the Canadian Prairies. Climatic Change,
67, 119–141.

88 L. Zhou, C.G. Turvey / China Economic Review 28 (2014) 72–89
Bryan, E., Deressa, T. T., Gbetibouo, G. A., & Ringler, C. (2009). Adaptation to climate change in Ethiopia and South Africa: Options and constraints. EnvironmentalScience & Policy, 12, 413–426.
Bryant, C. R., Smit, B., Brklacich, M., Johnston, T. R., Smithers, J., Chiotti, Q., et al. (2000). Adaptation in Canadian agriculture to climatic variability and change.Climate Change, 45, 181–201.
Burton, I., & Lim, B. (2005). Achieving adequate adaptation in agriculture. Climatic Change, 70, 191–200.Chang, C. (2002). The potential impact of climate change on Taiwan's agriculture. Agricultural Economics, 27, 51–64.Cline, W. R. (2007). Global warming and agriculture. Impact estimates by country.Washington DC: Center for Global Development and Peter G. Peterson Institute for
International Economics.Connor, J., Schwabe, K., King, Kaczan, D., & Kirby, M. (2009). Impacts of climate change on lower Murray irrigation. The Australian Journal of Agricultural and
Resource Economics, 53, 437–456.Connor, J. D., Schwabe, K., King, D., & Knapp, K. (2012). Irrigated agriculture and climate change: The influence of water supply variability and salinity on
adaptation. Ecological Economics, 77, 149–157.Deressa, T. T., & Hassan, R. H. (2010). Economic impact of climate change on crop production in Ethiopia: Evidence from cross-section measures. Journal of African
Economies, 18(4), 529–554.Deryng, D., Sacks, W. J., & Ramankutty, N. (2009). Simulating the effects of climate and agricultural management practices on global crop yield. Working paper.
Montreal, Canada: McGill University.Di Falco, S., Veronesi, M., & Yesuf, M. (2011). Does adaptation to climate change provide food security? A micro-perspective from Ethiopia. American Journal of
Agricultural Economics, 93(3), 825–842.Fischer, G., Shah, M., Tubiello, F. N., & van Velhuizen, H. (2005). Socio-economic and climate change impacts on agriculture: An integrated assessment, 1990–2080.
Philosophical Transactions of the Royal Society of London, Series B, 360, 2061–2083.Fleischer, A., Lichtman, I., & Mendelsohn, R. (2008). Climate change, irrigation, and Israeli agriculture: Will warming be harmful? Ecological Economics, 65, 508–515.Fraser, E. (2007). Travelling in antique lands: Studying past famines to understand present vulnerabilities to climate change. Climate Change, 83, 495–514.Hertel, T. W., & Rosch, S. D. (2010). Climate change, agriculture, and poverty. Applied Economic Perspectives and Policy, 32(3), 355–385.IPCC (2001). Climate Change 2001: Impacts, Adaptation and Vulnerability. Report of Working Group II. Cambridge, UK: Cambridge University Press.IPCC (2007). Climate change 2007: Impacts, adaptation and vulnerability. In M. L. Parry, O. F. Canziani, J. P. Palutikof, P. J. van der Linden, & C. E. Hanson (Eds.),
Contribution of Working Group II to the 4th Assessment Report of the Intergovernmental Panel on Climate Change. Cambridge: Cambridge University Press.Jalan, J., & Ravallion, M. (2004). Household income dynamics in rural China. In S. Dercon (Ed.), Insurance Against Poverty. Oxford: Oxford Univ. Press.Kandulu, J. M., Bryan, B. A., King, D., & Connor, J. D. (2012). Mitigating economic risk from climate variability in rain-fed agriculture through enterprise mix
diversification. Ecological Economics, 79, 105–112.Kato, E., Ringler, C., Yesuf, M., & Bryan, E. (2011). Soil and water conservation technologies: A buffer against production risk in the face of climate change? Insights
from the Nile basin in Ethiopia. Agricultural Economics, 42, 593–604.Knowler, D., & Bradshaw, B. (2007). Farmers' adoption of conservation agriculture: A review and synthesis of recent research. Food Policy, 32, 25–48.Kurukulasuriya, P., & Rosenthal, S. (2003). Climate change and agriculture: A review of impacts and adaptations, climate change series 91. Environment
Department Papers. Washington, DC: The World Bank.Lin, E., Xiong, W., Ju, H., Xu, Y. L., Li, Y., Guo, L. P., et al. (2005). Climate change impacts on crop yield and quality with CO2 fertilization in China. Philosophical
Transactions of the Royal Society of London, Series B, 360, 2149–2154.Liu, H., Li, X., Fischer, G., & Sun, L. (2004). Study on the impacts of climate change on China's agriculture. Climatic Change, 65, 125–148.Lobell, D. B., Cahill, K. N., & Field, C. B. (2007). Historical effects of temperature and precipitation on California crop yields. Climatic Change, 81, 187–203.Long, S. P., Ainsworth, E. A., Leakey, A. D. B., Nosberger, J., & Ort, D. R. (2006). Food for thought: Lower-than-expected crop yield stimulation with rising CO2
concentrations. Science, 312, 1918–1921.Mendelsohn, R., & Dinar, A. (2003). Climate, water, and agriculture. Land Economics, 79, 328–341.Mendelsohn, R., Nordhaus, W. D., & Shaw, D. (1994). The impact of global warming on agriculture: A Ricardian analysis. The American Economic Review, 84,
753–771.Mestre-Sanchís, F., & Feijóo-Bello, M. L. (2009). Climate change and its marginalizing effect on agriculture. Ecological Economics, 68(3), 896–904.Mount, T. D. (1994). Climate change and agriculture: A perspective on priorities for economic policy. Climatic Change, 27, 121–138.Nelson, G. C., Rosegrant, M. W., Koo, J., Robertson, R., Sulser, T., Zhu, T., et al. (2009, September). Climate change: Impact on agriculture and costs of adaptation. Food
Policy Report. Washington, DC: International Food Policy Research Institute.Parry, M., Rosenzweig, C., & Livermore, M. (2005). Climate change, global food supply and risk of hunger. Philosophical Transactions of the Royal Society of London,
Series B, 360, 2125–2138.Peng, S., Huang, J., Sheehy, J. E., Laza, R. C., Visperas, R. M., Zhong, X., et al. (2004). Rice yields decline with higher night temperature from global warming.
Proceedings of the National Academy of Sciences of the United States of America, 101, 9971–9975.Piao, S., Ciais, P., Huang, Y., Shen, Z., Peng, S., Li, J., et al. (2010). The impacts of climate change on water resources and agriculture in China. Nature, 467,
43–51.Reilly, J. M. (1999). Climate change and agriculture: The state of the scientific knowledge. Climatic Change, 43, 645–650.Rosenzweig, C., & Parry, M. (1994). Potential impacts of climate change on world agriculture. Nature, 367, 133–138.Rowhani, P., & Ramankutty, N. (2009). Crop modeling. Paper presented at the Workshop on Climate Change, Agricultural Variability and Poverty Vulnerability,
October. Washington, DC: The World Bank (http://go.worldbank.org/HHBFKLDG40)Schlenker, W., Hanemann, M., & Fischer, A. (2005). Will U.S. agriculture really benefit from global warming? Accounting for irrigation in the hedonic approach.
American Economic Review, 95(1), 395–406.Schlenker, W., & Lobell, D. B. (2010). Robust negative impacts of climate change on African agriculture. Environmental Research Letters, 5(1), 014010.Schlenker, W., & Roberts, M. J. (2006). Nonlinear effects of weather on corn yields. Review of Agricultural Economics, 28(3), 391–398.Sen, A. (1981). Poverty and famines. Oxford: Claredon Press.Seo, S. N. (2011). An analysis of public adaptation to climate change using agricultural water schemes in South America. Ecological Economics, 70, 825–834.Seo, S. N., & Mendelsohn, R. (2008). Measuring impacts and adaptations to climate change: A structural Ricardian model of African livestock management.
Agricultural Economics, 38, 151–165.Sheehy, J. E., Mitchell, P. L., & Ferrer, A. B. (2006). Decline in rice grain yields with temperature: Models and correlations can give different estimates. Field Crops
Research, 98, 151–156.Simelton, E., Fraser, E. D. G., Termansen, M., Forster, P. M., & Dougill, A. J. (2009). Typologies of crop-drought vulnerability: An empirical analysis of the
socio-economic factors that influence the sensitivity and resilience to drought of three major food crops in China (1961–2001). Environmental Science &Policy, 12, 438–452.
Tao, F., Hayashi, Y., Zhang, Z., Sakamoto, T., & Yokozawa, M. (2008). Global warming, rice production, and water use in China: Developing a probabilisticassessment. Agricultural and Forest Meteorology, 148, 94–110.
Turvey, C. G., & Lowenberg-DeBoer, J. (1988). Farm-to-firm productivity differences and whole-farm production functions. Canadian Journal of AgriculturalEconomics, 36, 295–312.
Turvey, C. G., & Norton, M. (2008). An indexed based tool for weather risk management. Agricultural and Resource Economics Review, 37(1), 63–78.Wang, J., Mendelsohn, R., Dinar, A., Huang, J., Rozelle, S., & Zhang, L. (2009). The impact of climate change on China's agriculture. Agricultural Economics, 40,
323–337.Xiong, W., Conway, D., Lin, E., Xu, Y., Ju, H., Jiang, J., et al. (2009). Future cereal production in China: The interaction of climate change, water availability and
socio-economic scenarios. Global Environmental Change, 19, 34–44.Xiong, W., Lin, E., Ju, H., & Xu, Y. (2007). Climate change and critical thresholds in China's food security. Climatic Change, 81, 205–221.

89L. Zhou, C.G. Turvey / China Economic Review 28 (2014) 72–89
Xiong, W., et al. (2008). Future cereal production in China: Modelling the interaction of climate change, water availability and socio-economic scenarios. Theimpacts of climate change on Chinese agriculture—Phase II final report. AEA Group.
Yang, X., Lin, E., Ma, S., Ju, H., Guo, L., Xiong, W., et al. (2007). Adaptation of agriculture to warming in Northeast China. Climatic Change, 84, 45–58.Yao, F., Xu, Y., Lin, E., Yokozawa, M., & Zhang, J. (2007). Assessing the impacts of climate change on rice yields in the main rice areas of China. Climatic Change, 80, 395–409.You, L., Rosegrant, M. W., Wood, S., & Sun, D. (2009). Impact of growing season temperature on wheat productivity in China. Agricultural and Forest Meteorology,
149, 1009–1014.Zhang, T., Zhu, J., & Wassmann, R. (2010). Responses of rice yields to recent climate change in China: An empirical assessment based on long-term observations at
different spatial scales (1981–2005). Agricultural and Forest Meteorology, 150, 1128–1137.