climate change 2009 - australian local government … · 1 climate change 2009: ... human change to...
TRANSCRIPT

1
Climate Change 2009:Faster Change and More Serious Risks
Prof Will Steffen
Executive DirectorThe ANU Climate Change InstituteThe Australian National University
andScience Adviser
Department of Climate ChangeAustralian Government

2
Petit et al. 1999; Keeling and Whorf 2000
Human change to the carbon cycle:A long-term perspective
Source: IPCC AR4
Human modification of the energy balanceat the Earth’s surface

3
Northern hemisphere surface temperature
Source: Mann et al. 2003 (EOS)

4
Understanding and attributing climate change
Continental warming likely shows a significant anthropogenic contribution over the past 50 years
IPCC AR4 2007
Source: IPCC AR4
Sinks for the excess energyat the Earth’s surface
Blue bars: 1961-2003 periodPurple bars: 1993-2003 period

5
Change in Ocean Heat Content(relative to 1961)
Sea-level rise from 1970, relative to 1990
Climate Change Science: IPCC AR4
…very high confidence that the globally averaged net effectof human activities since 1750 has been one of warming…
Warming of the climate system is unequivocal, as is nowevident from increases in global average air and oceantemperatures, melting of snow and ice, and rising sea level.
Numerous changes in climate have been observed at the scalesof continents or ocean basins - wind patterns, precipitation,ocean salinity, sea ice, ice sheets, and aspects of extremeweather.
It is very likely that anthropogenic greenhouse gas increasescaused most of the observed increase in globally averagedtemperatures since the mid-20th century.
6
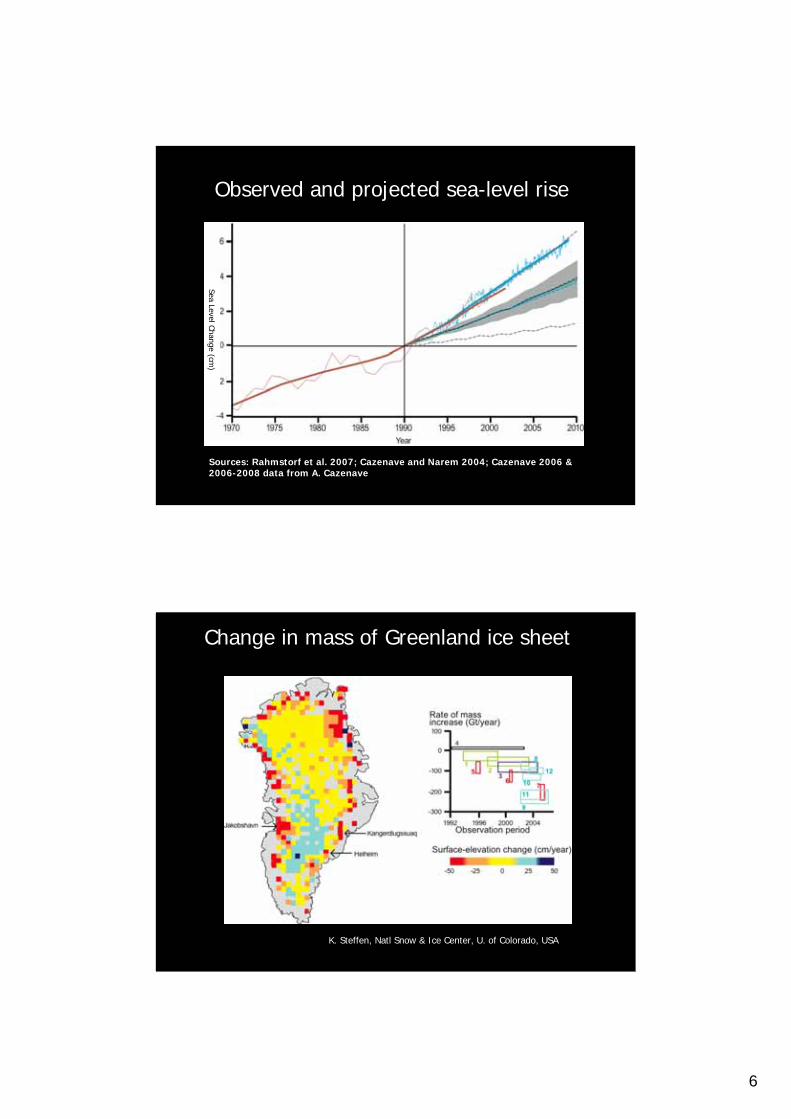
Observed and projected sea-level rise
Sources: Rahmstorf et al. 2007; Cazenave and Narem 2004; Cazenave 2006 &2006-2008 data from A. Cazenave
Sea
Leve
l Cha
nge
(cm
) Sea Level Change (cm
)
Change in mass of Greenland ice sheet
K. Steffen, Natl Snow & Ice Center, U. of Colorado, USA

7
Future projections of sea-level rise
Future sea level (rel. to 1990) basedon IPCC AR4 global temperature projections
Full range: 75 – 190 cm by 2100
constant rate 3.2 mm/year
Source: S. Rahmstorf
ACE CRC 2008
The multiplying effect of sea-level riseon high sea-level events

8
High sea-level events: Torres Strait Islands
Source: David HanslowTorres Strait Regional Authority
Water Availability
Perth Melbourne

9
Monthly inflows into the Murray-Darling system
Murray-Darling Basin Commission
Timbal et al. 2009
Rainfall in SW eastern Australia, the intensityof the Sub-Tropical Ridge and climate change

10
Climate change and regional drying trends
Strong evidence of a climate change signal
Source: Steffen 2009
Possible climate changesignal, but evidence is notyet conclusive
We don’t know;no convincingevidence yet forclimate changesignal
Atmospheric CO2 and ocean acidification
Hoegh-Guldberg et al. 2007

11
Change in ocean acidity through time
Turley et al. 2006
CO2, temperature and the future of coral reefs
Hoegh-Guldberg et al. 2007

12
Sea surface temperature (SST)and rainfall extremes
Allan and Soden 2008

13
Average inter-fire interval from 500 year simulation –Current climate
Figure 25a
Projected change inACT bushfire regime(inter-fire interval, years)
Cary 2002
(a) Current climate
(b) Mid-range IPCC climatescenario for 2100
Steffen 2009
The Climate Change Challenge

14