climate and services: informing risk management across ... · informing risk management across...
TRANSCRIPT

Roger S. Pulwarty � National Integrated Drought Information System Senior Advisor for Climate (Acting) Climate Program Office and Earth System Research Lab. National Oceanic and Atmospheric Administration
Climate and Services: Informing risk management across climate
timescales

Sea-Surface Temperature
Sea-ice
Sea Level
Glaciers (Glacier Mass Balance)
Snow Cover (March-April, Northern Hemisphere)
Land Surface Air
Temperature Over Land Ocean Heat Content
Specific
Humidity
2 Updated from BAMS State of the Climate 2009
4 Datasets
2 Datasets
5 Datasets
7 Datasets 3 Datasets
7 Datasets 7 Datasets
5 Datasets
Temperature Over Oceans
7 Datasets
Air Temperature Near Surface
(Troposphere)
3 Datasets

3
Climate- a continuum and an adaptation deficit
30 DAYS
1
SEASON
Heat Waves
Floods
Storm Track Variations
Madden-Julian Oscillation El Niño-Southern
Oscillation++++++
3 YEARS
10
YEARS
Decadal Variability
Solar Variability
Deep Ocean Circulation
Greenhouse Gases
30 YEARS
100
YEARS
SHORT-TERM INTERANNUAL DECADE-TO-
CENTURY

Water footprint
Model agreement (2050)
Ground water depletion
4
Many potential futures: Adaptation requires science that analyzes decisions, identifies vulnerabilities, improves foresight, and develops options

Effective early warning systems and emergency preparedness
Vulnerability reducing measures such as pro-poor economic and human development, through improved social services and protection
Anticipation Resilience

Demand for Climate Information is Increasing Across Space and Time Scales
A suite of products from near term forecasts to long term projections, tailored to stakeholders’ needs.

Linking Preparedness and Adaptation
• Information systems
• Infrastructure/technology
• Insurance
• Integrated systems
• Institutional capacity
the Solution Space

Climate Services: “The timely production and delivery of useful climate data, information and knowledge to decision makers” (NRC, 2001) More specifically: “Network of activities that maintain well-structured paths from observations, modeling, and research to the development of relevant place-based knowledge and usable information
- Sustained administrative framework. No single structure is optimal – Requires flexibility, alignment and permeable boundaries- -How good have we been at doing that?

If it’s so easy…why is it so difficult? • The cumulative nature of hazards, extremes and
disasters
• Difficulties of proactive decision-making: Learning and policy windows
• The socialization of lessons learned by particular individuals and organizations
• Information services to support adaptation in changing environments: practical confusion of over what constitutes adaptation

10
Average physical exposure (1970, 2030) a. Tropical cyclones b. Flooding (IPCC, 2012)
a.
b.
1970
2030

World grain trade depends on exports from a few countries
World Development Report 2010
Source: FAO 2009c.
Note: Annual exports and imports are based on the average over four years (2002–2006) Caribbean annual food import $3.5b.

Crafting climate information systems- Better information is the answer but what is the
question?
• Heterogeneous contexts for impacts management-regional scales of projections frustrate local decision makers.
• Financial resources • Lack of national and regional policy frameworks
• Limited coordination among institutions that provide different types of early warning and adaptation interventions
• How often should criteria for “robustness” be reconsidered?

Climate Risk Management - Current Issues and Challenges

Assessing International Drought Information Systems: Cases (Pulwarty and Sivakumar, 2014 HMNDP Special Issue-Weather and Climate Extremes)

Regional Integrated Sciences and Assessments
National Integrated Drought Information System
5Cs/CIMH/UWI-Capacity and Outlooks
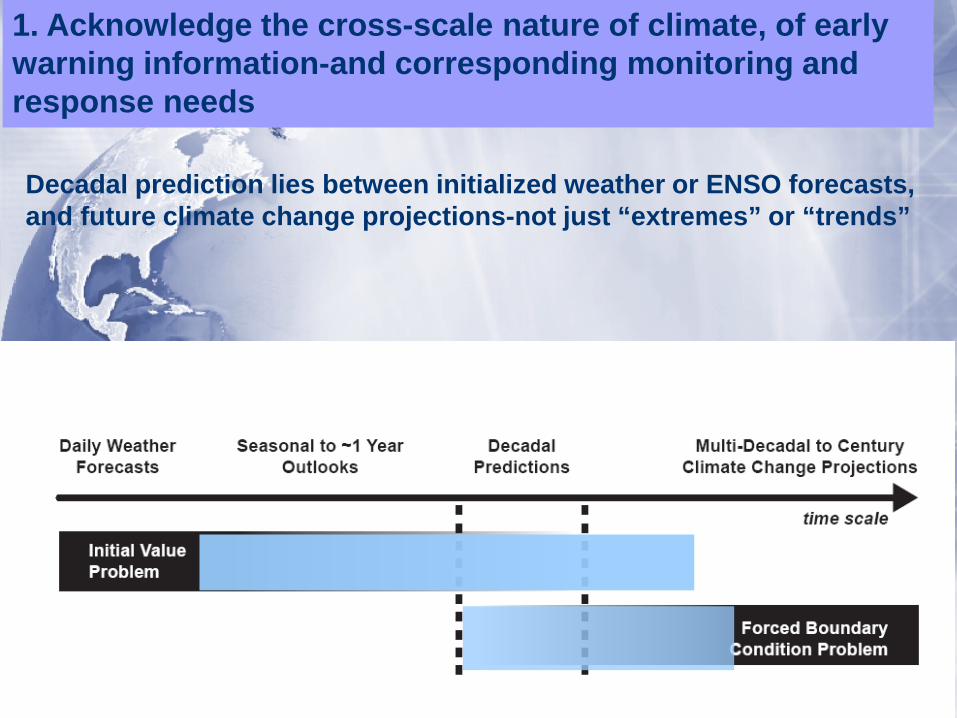
Decadal prediction lies between initialized weather or ENSO forecasts, and future climate change projections-not just “extremes” or “trends”
1. Acknowledge the cross-scale nature of climate, of early warning information-and corresponding monitoring and response needs

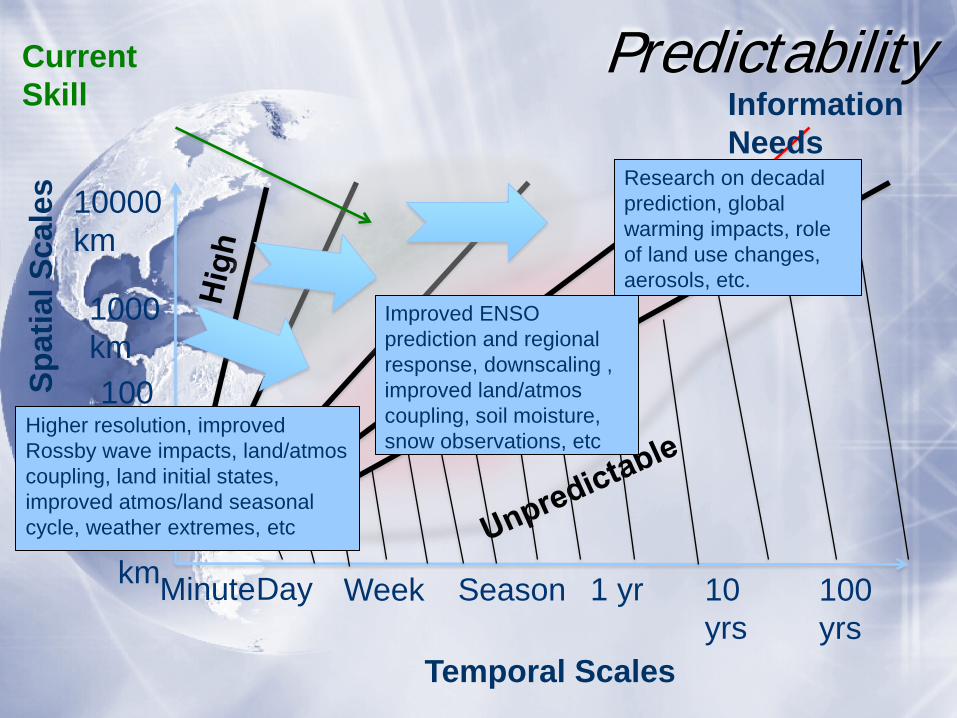
Predictability Sp
atia
l Sca
les
Weather-Climate Time Scales
Minute Day Week Season 1 yr 10 yrs
100 yrs
1 km
10 km
100 km
1000 km
10000 km
User Needs
Current Skill
Predictability Sp
atia
l Sca
les
Temporal Scales
Minute Day Week Season 1 yr 10 yrs
100 yrs
1 km
10 km
100 km
1000 km
10000 km
Information Needs
Current Skill
Higher resolution, improved Rossby wave impacts, land/atmos coupling, land initial states, improved atmos/land seasonal cycle, weather extremes, etc
Improved ENSO prediction and regional response, downscaling , improved land/atmos coupling, soil moisture, snow observations, etc
Research on decadal prediction, global warming impacts, role of land use changes, aerosols, etc.

19
•A complete explanation of these droughts must invoke not just the ocean forcing but also the particular sequence of internal atmospheric variability - weather - during the event (Hoerling et al, 2013)
•The percent of the U.S. experiencing moderate to severe drought suddenly increased and remained at elevated levels during the first decade of the 21st Century
•Even a perfect SST prediction would “likely” capture much less than half the total variance in annual precipitation over North America

Monitoring & Prediction Drought and Flood Impacts Assessments and Scenarios
Communication and Outreach
Integrated Information Systems Preparedness and Adaptation
Engaging Preparedness & Adaptation Communities
2. Understand and communicate the economic value of early warning information systems and the relative contributions of system components

Globally The total benefits of improved early warning systems would reach between $4b and 3$6 billion USD per year-with co-benefits (World Bank, 2011)

Broad societal processes that create dynamic pressures and unsafe conditions are not easy to change, yet are fundamental to human vulnerability • Social process(es) of risk communication are more than
“one-way” AND more than “two-way”
• The “push” supply of new information by would-be providers of information/technology , and the “pull” demand for new information from would-be learners is never linear
3. Recognize “communication” as necessary but not sufficient

Data: the current availability and quality of climate observations and impacts data to support adaptation are inadequate for large parts of the globe Approach climate model output far more critically than at present, especially for impact assessment and scenario development at the local level-No substitute for monitoring and understanding local climates
Most estimates of disaster losses exclude indirect losses – livelihoods, informal economies, intangible losses including ecosystem services, quality of life and cultural impacts

24 24
Are Transitions to Semi-Permanent Drought Imminent?

www.drought.gov/gdm

Overcoming the “adaptation” deficit- the role of NMH Services (several sources) in climate information systems •Lead in climate risk analysis; minimum standards for building codes and understanding external risks •Promote climate risk awareness among community and customers e.g. risk-based pricing of insurance;

Overcoming the “adaptation” deficit- investment in crucial infrastructure-
• Characterize the minimum data requirements needs for resource stewardship
• Link relief/recovery assistance to climate resiliency planning and investment in water, energy, food …securities and capitals
• Inform the use of resilience approaches- of soft paths to mitigate damage and protect lives and property; Promote sound land use and management practices;
•Lead in climate risk analysis; •Promote climate risk awareness

Need more than just translators but “policy entrepreneurs” to manage this process-
overcome impediments to the flow of information and of the parts working as a system
Managing risks in a changing climate
28
Innovation Evaluation
Learning
Monitoring

• The number of countries, communities, and institutions with improved capacity to inform climate risk management: ….regional drought information coordinator
• The number of staff in or working with institutions trained to develop and communicate local climate information and help reduce impacts
• The number of applied research projects that conduct and update climate drivers, impacts and risk assessments in at-risk regions
• The percentage of the regional population covered by adequate climate risk and early warning information systems
User needs assessments and toolk its: Are we better off?
29


Let’s Not Wait too long!
photo courtesy K. Dixon, NOAA GFDL

THANK YOU!

Backups
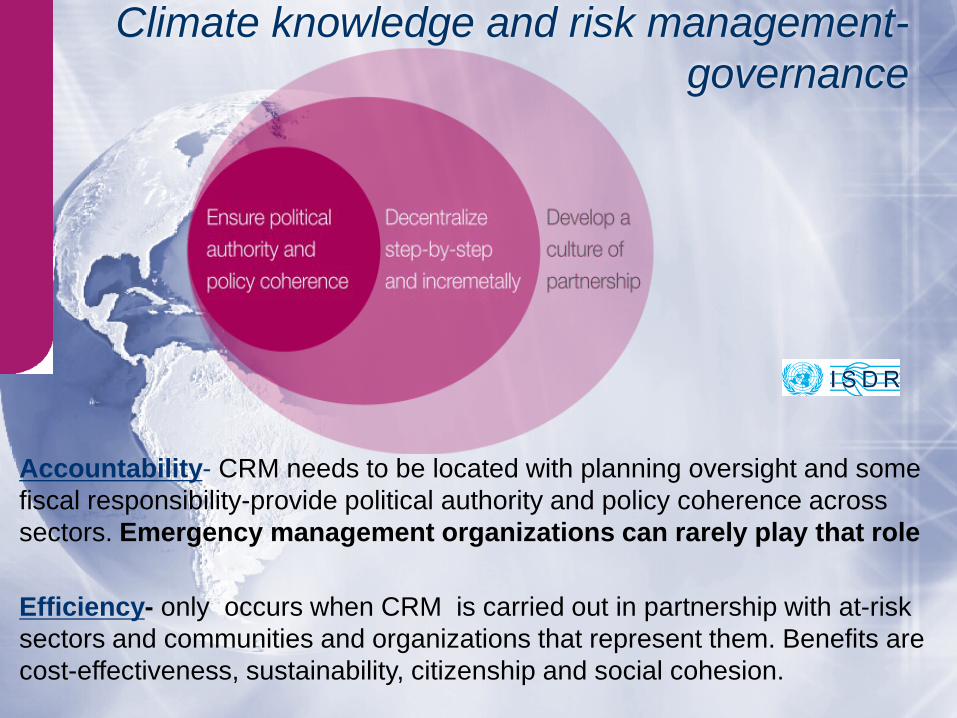
Climate knowledge and risk management-governance
Accountability- CRM needs to be located with planning oversight and some fiscal responsibility-provide political authority and policy coherence across sectors. Emergency management organizations can rarely play that role Efficiency- only occurs when CRM is carried out in partnership with at-risk sectors and communities and organizations that represent them. Benefits are cost-effectiveness, sustainability, citizenship and social cohesion.

(World Economic Forum, 2013)

(World Economic Forum, 2013)
How is the capability of societies to respond to climate change enabled or constrained by other social, ecological and political dynamics? How can improved climate services help to deal with these interconnected dynamics?

Four dimensions of improvement desired by most public and private resource managers—(i) model agreement, (ii) narrowing the projection range, (iii) higher-resolution spatial and temporal scales, and (iv) improved shorter time-horizon projections

38
Global Framework for Climate Services
WORLD CLIMATE CONFERENCE - 3 Geneva, Switzerland 31 August–4 September 2009
• Goal: • Enable better management of the risks
of climate variability and change and adaptation to climate change at all levels, through development and incorporation of science-based climate information and prediction into planning, policy and practice.