cleaner production - world banksiteresources.worldbank.org/intbangladesh/resource… · ·...
TRANSCRIPT

CLEANER PRODUCTIONPresent & Future
in DBL Group

About us
DBL Group is among the largestvertically integrated knit garmentsmanufacturing and exporting industryin Bangladesh. It has facilities for:
cotton spinning, fabric-knitting-dyeing-printing-
finishing and garments-cutting-sewing-printing-
washing-finishing.

Export destination
42 countries in 5 continents
Europe, 39%
Asia, 26%
North America, 21%
South America, 12%
Africa, 2%

Buyers
H&M Walmart-George Puma Esprit G-Star Decathlon VF Asia

FABRIC DYEING & FINISHING

Dye House
Mymun Textiles Ltd. – 2002Hamza Textiles Ltd. – 2006
Process: Dyeing & Finishing of knit fabrics
Total capacity: 40,000 Kg per day

Utilities
2 Gas based Generators, Waukesha-USA – 2,300 kWh
1 Standby Diesel Generator, Caterpillar-USA – 1,056 kWh
2 Gas fired Boilers, Cochran-UK – 19,050 kg/hr steam
Water Treatment Plant – 265 m3/hr
Effluent Treatment Plant (Biological) – 4,000 m3/day

Resource Total
Gas (M3) 8,717,792
Electricity (kWh) 10,042,902
Water (M3) 1,295,597
Steam (Kg) 58,941,132
Compressed Air (M3)
11,550,000
Dyes & Chemicals(Kg)
5,431,919
Resource Consumed - 2010
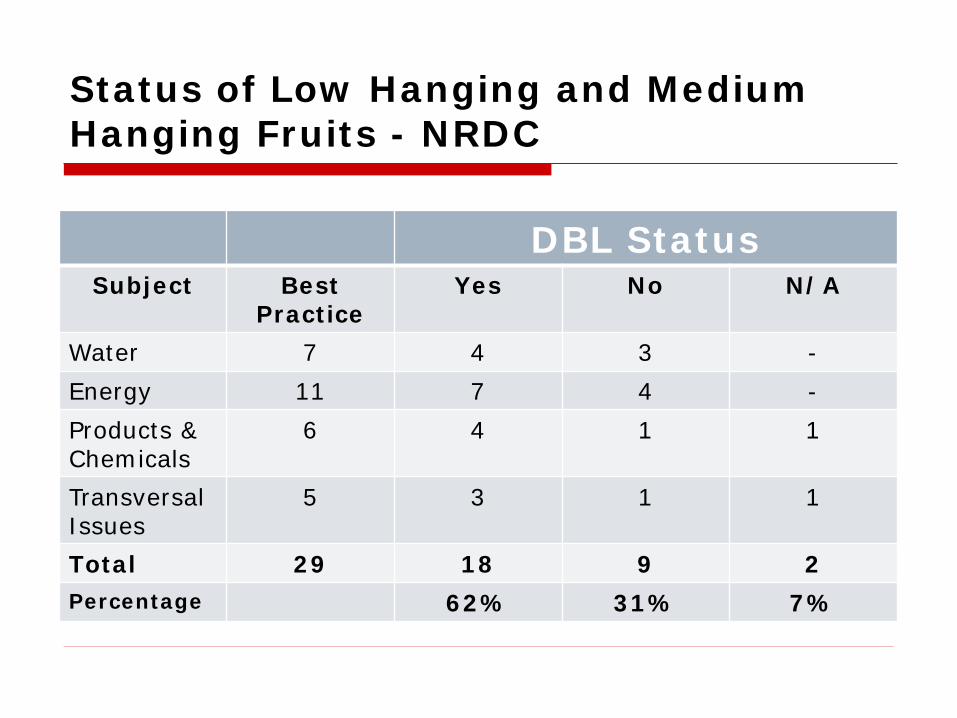
Status of Low Hanging and Medium Hanging Fruits - NRDC
DBL StatusSubject Best
PracticeYes No N/A
Water 7 4 3 -Energy 11 7 4 -Products & Chemicals
6 4 1 1
Transversal Issues
5 3 1 1
Total 29 18 9 2Percentage 62% 31% 7%

Process Improvement having impact on Water & Energy

Minimize washing and rinsing operations
DBL is using 3 effective rinses While average industry practice is 4-5 washes/rinses.
The water used per rinse by DBL is 6 ltr/kg while average industry practice is 21 ltr/kg.
WATER

Water ratio For DBL water ratio is 1:6 while for average industry it is 1:8. We are using SCLAVOS dyeing machines which combines the advantages of airflow and jet processes.
WATER

WATER
Use of Water Trigger Nozzles
For preventing water wastage in washing of process vessels, machines, chemical drums, floors, etc.

Utilization of Humidity Analyzer inside Continuous Dryer & Stenter
Fig: PLEVA Humidity Analyzer
PLEVA humidity analyzer is used
in stenters and driers
ENERGY

Moisture Controller atStenter & Dryer
Used in driers & stenters
Has sensors to determine themoisture content of fabrics andtemperature required to dry thefabrics.
Thus optimum use of gas andelectricity is ensured. Fig: PLEVA Moisture Controller
ENERGY

ENERGY
Dyeing process time of average todark color has been reduced to 6 to 8hours per batch which was previouslybetween 9 to 10 hours

Use of magnetic device for water softening
Cost of the “Eneflow” Magnetdevice is TK 150,000.
Scaling reduction 0.5 mm/yearcan save TK 300,000/year.
Payback period - 6 months only.
ENERGY

ParameterBefore
ENEFLOW (ppm)
After ENEFLOW
(ppm)Performance
TDS 101.5 96.5 5% TDS removed
Hardness 2.175 1.875 13% Hardness removed
PH 6.7675 7.015 PH Neutral
ENERGY
Water Hardness Removal

Automatic boiler blow down mechanism
DBL has automatic blow down system in boilerwhen TDS reaches above 2,700 mg/l.
This procedure contributes to increased boilerefficiency.
ENERGY

Use of air Nozzles Placed at compressed
air pipe line.
1 hour load on compressor has been reduced.
Figure: Air guns
ENERGY

Insulation & Leak-Repair
Insulation: Steam line
Leakage monitoring: steamtraps, steam line, compressed airline, water line
Thus energy & water loss isreduced.
ENERGY

Production & Resource Consumption 2010-11
Production and Consumption
PeriodFabric
Production - kg Gas m3 Electricity kWh Water m3 Steam Kg
2010 Jan - Dec 10,763,974.30 8,717,792.00 10,042,902.00 1,295,597.00 58,941,132.88
2011 Jan - Mar 2,565,371.49 2,027,220.00 2,030,331.00 245,003.40 13,326,458.91

Comparison 2010-11
Production and Consumption Comparison 2010 & 2011
Period Production Gas m3 Electricity kWh Water m3 Steam Kg
2010Monthly Average 896,997.86 726,482.67 836,908.50 107,966.42 4,911,761.07
2011Monthly Average 855,123.83 675,740.00 676,777.00 81,667.80 4,442,152.97

Environmental Benefit
Resource Consumption Comparison 2010 & 2011
Gas m3Electricity
kWh Water m3 Steam Kg
2010Per kg of
fabric 0.81 0.93 0.12 5.48
2011Per kg of
fabric 0.79 0.79 0.10 5.19 Change
Percentage 2.43% 15.17% 20.65% 5.13%
NoteWater & Steam consumption calculation is based on machine capacity in the absence of meters.

CO2 Emission Reduction
CO2 Emission per kg of fabric
Source UnitJan-Dec
2010Jan-Mar
2011Emission
ReductionReduction
%
Gas Kg 1.832 1.750 0.075 4.10%
Electricity Kg 0.093 0.080 0.013 14.08%

Resource Unit
Savings per kg of
fabricYearly
savings Cost/unit in (BDT)
Yearly Savings in
BDT
Yearly Savings in
USD
Gas M3 0.02 211,833 3.75 794,375 11,033
Electricity kWh 0.14 1,523,890 2.50 3,809,725 52,913
Total 4,604,100 63,946
Financial Savings
Fabric Production in 2010 : 10,763,974 kg
Savings will be around USD 175,000/year if savings of water, steam and compressed air is also taken into account.
Future Plan for Cleaner Production
A new project “Color City Limited” is under
construction. This project has capacity for 60,000
kg/day of fabric dyeing and finishing. The following
energy saving options are being included…….
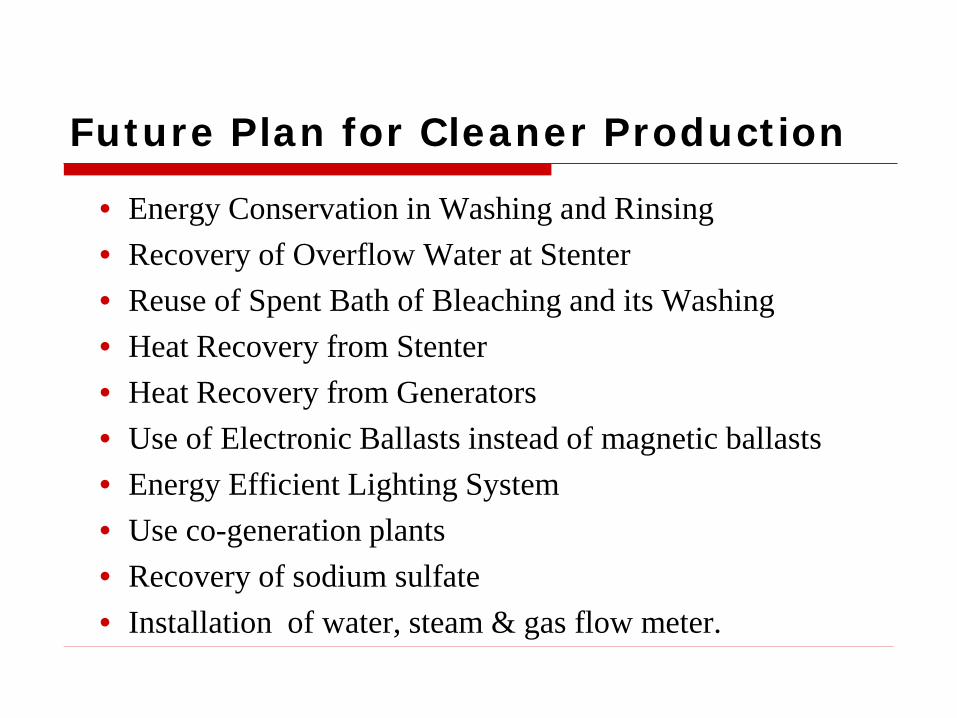
• Energy Conservation in Washing and Rinsing• Recovery of Overflow Water at Stenter• Reuse of Spent Bath of Bleaching and its Washing• Heat Recovery from Stenter• Heat Recovery from Generators• Use of Electronic Ballasts instead of magnetic ballasts• Energy Efficient Lighting System• Use co-generation plants• Recovery of sodium sulfate• Installation of water, steam & gas flow meter.
Future Plan for Cleaner Production

Four member team has been formed foroptimizing energy and water usage.
Reduce carbon dioxide emission by 15% in thenext 3 years.
Benchmark and regulate energy consumption. Reduce diesel consumption in stand-by generators
by 10%. Train employees on energy and environmental
aspects within the industry.
Energy Management Centre

Thank You