clean water works 2013
DESCRIPTION
A technical journal of the Northeast Ohio Regional Sewer District. SUMMER 2013 VOL1 / ISSUE 1. In this issue: Nowcasts, dirty birds, beach management, and qPCR.TRANSCRIPT
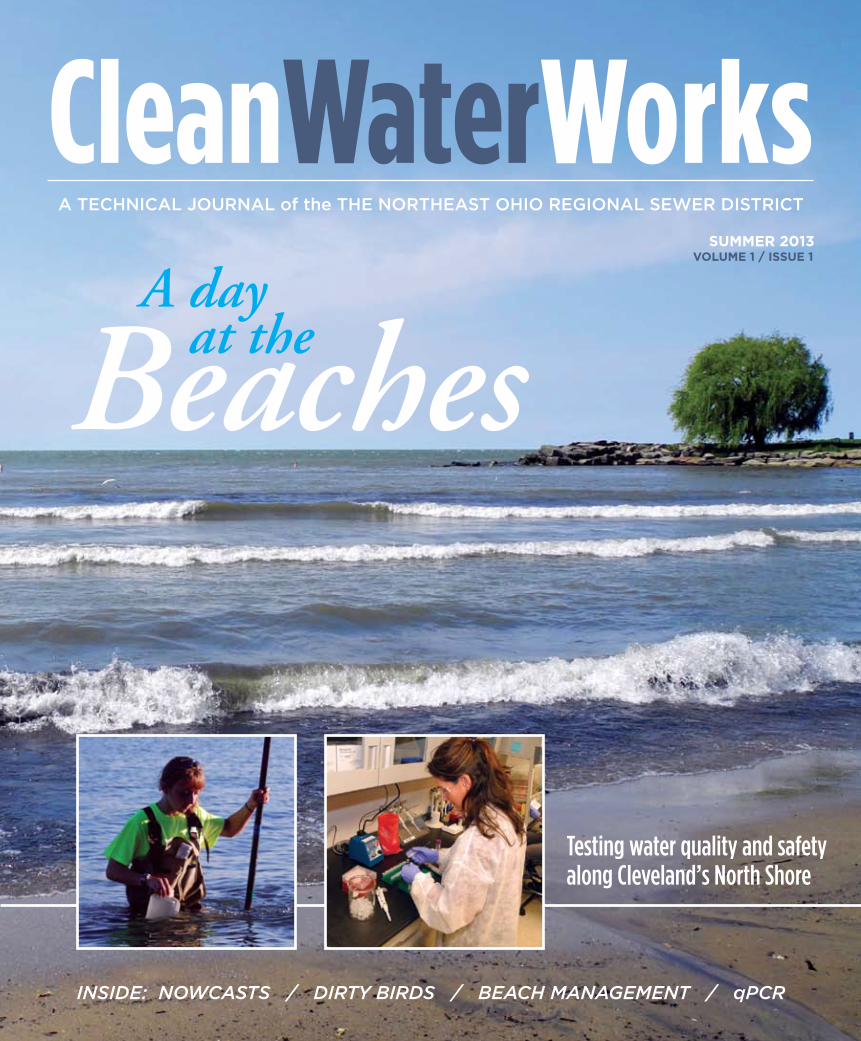
CleanWaterWorksA TECHNICAL JOURNAL of the THE NORTHEAsT OHIO REgIONAL sEwER dIsTRICT
A day
Beaches
Testing water quality and safety along Cleveland’s North Shore
at the
INSIDE: NOWCASTS / DIRTY BIRDS / BEACH MANAGEMENT / qPCR
SUMMER 2013VOLUME 1 / ISSUE 1

� CleanWaterWorks / Northeast Ohio Regional Sewer District
Welcome!Dear Reader,
You are holding the inaugural edition of CleanWaterWorks, a new technical magazine published by the Northeast Ohio Regional Sewer District. This premiere issue focuses on the Sewer District’s dedication to Cleveland’s beaches and steadfast commitment to preserving the environment and public health in Northeast Ohio.
As Executive Director, I am incredibly proud of our environmental leadership and the technical expertise of our staff. Without fail, our knowledgeable team collects and tests water samples every day throughout the beach season, and our substantial investment in this area demonstrates our purpose in protecting our waterways.
The District is not alone in this important task, and featured in these pages are representatives from several local and regional organizations working to protect and improve our freshwater resources.
Lake Erie is the most valuable asset to Northeast Ohio, and access to this natural resource is a large part of what makes us unique. Our regional economy is tied to Lake Erie, the lakefront, and the entire Lake Erie watershed. We all have a role—an obligation, if you will—to keep our Great Lake great.
We would very much enjoy hearing your feedback on CleanWaterWorks, as well as topics for future consideration. Please let us know what you think at [email protected].
Julius Ciaccia
Julius Ciaccia has served as the Sewer District’s Executive Director since 2007. Previously he was Cleveland’s Director of Public Utilities (2004-07) and Commissioner of Water (1988-2004).
FROM THE EXECUTIVE DIRECTOR
The mission of the northeast ohio Regional sewer District is to provide progressive sewage and stormwater management through innovation, fiscal responsibility and community partnerships.
our vision is to be the environmental leader in enhancing quality of life in the region and protecting its water resources.
This annual magazine gives subject-matter experts the opportunity to explain in greater detail our work and that of our partner agencies.
EDiToR & ART DiRECToRmichael Uva
ConTRiBUToRsmark CitrigliaRachel DannemillerJennifer EltingFrank FoleyKristen GreenwoodLindsey KoplowCarrie millwardKyle Dreyfuss-Wells nichole schaferRobert schermaPaul skerlCheryl soltis-muth
PHoToGRAPHYJohn Gonzalezmichael Uva
3900 Euclid AvenueCleveland, ohio 44115
© 2013 northeast ohio Regional sewer District
Testing the waters
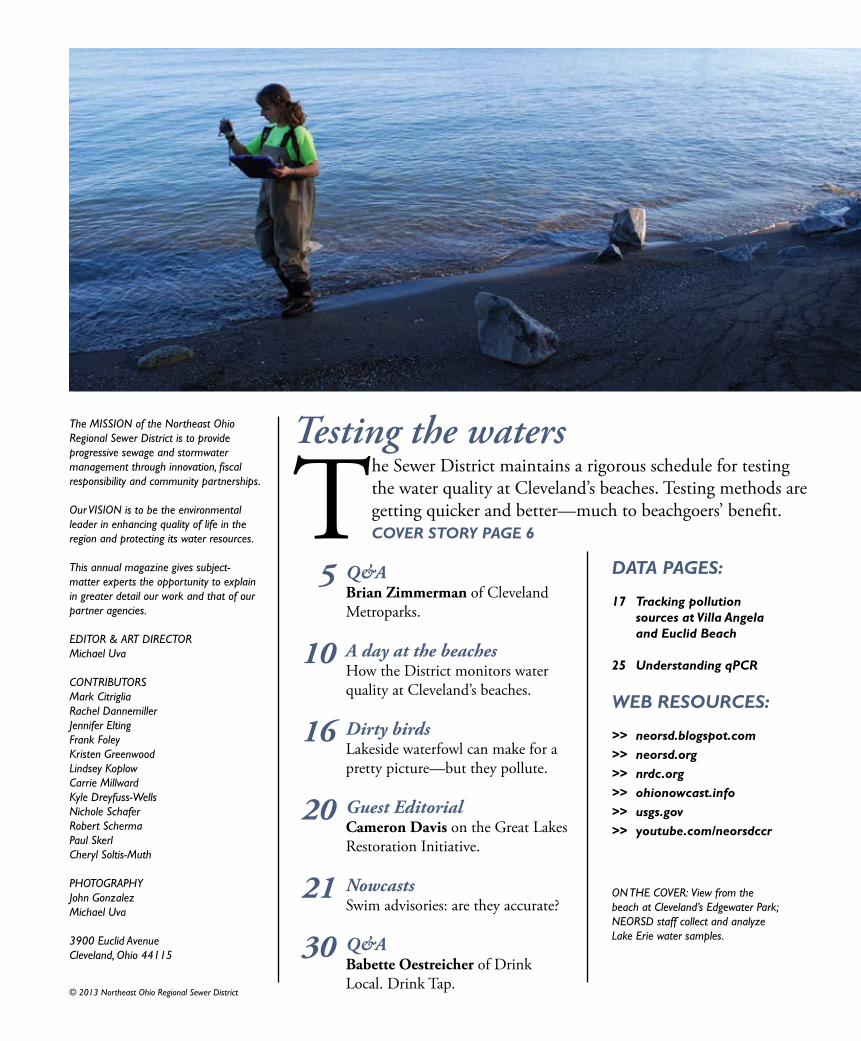
The Sewer District maintains a rigorous schedule for testing the water quality at Cleveland’s beaches. Testing methods are getting quicker and better—much to beachgoers’ benefit. COVER STORY PAGE 6
5 Q&A Brian Zimmerman of Cleveland
Metroparks.
10 Adayatthebeaches How the District monitors water
quality at Cleveland’s beaches.
16 Dirtybirds Lakeside waterfowl can make for a
pretty picture—but they pollute.
20GuestEditorial Cameron Davis on the Great Lakes
Restoration Initiative.
21 Nowcasts Swim advisories: are they accurate?
30Q&A Babette Oestreicher of Drink
Local. Drink Tap.
DATA PAGES:
17 Tracking pollution sources at Villa Angela and Euclid Beach
25 Understanding qPCR
WEB RESOURCES:
>> neorsd.blogspot.com>> neorsd.org>> nrdc.org>> ohionowcast.info>> usgs.gov>> youtube.com/neorsdccr
on THE CovER: view from the beach at Cleveland’s Edgewater Park; nEoRsD staff collect and analyze Lake Erie water samples.

Your Sewer District ...Keeping our Great Lake great.
neorsd.org/stormwater facebook.com/yoursewerdistrict
REGIONALSTORMWATERMANAGEMENTPROGRAM

Northeast Ohio Regional Sewer District / CleanWaterWorks �
The State of Ohio recently transferred control of Cleveland’s lakefront parks to Cleveland Metroparks. But your organization isn’t new to beach management.
Cleveland Metroparks has long-standing beach management experience with Huntington Reservation [in Bay Village, Ohio] and the challenges with rainfall producing poor water quality along Porter Creek. In 2011, Huntington Beach earned its Blue Wave Certifica-tion, a national environmental certification for clean beaches, which sets the bar very high in terms of accountability, signage, beach nutrition, and all the components that provide a high-quality beach experience.
Do Cleveland’s beaches present unique challenges?
The true challenge is changing the culture so people come down and use Lake Erie, one of Northeast Ohio’s greatest assets. We’re working on water quality and amenities and get-ting the beach clean. All of those have end solutions, but we have to make sure the public knows that we have welcoming assets on our lakefront. Our core focus now is getting the beaches clean and safe, while considering the right programming and special events that will bring people to the lakefront.
The Northeast Ohio Regional Sewer District purchased beach cleaning ma-chines for the lakefronts. Can you talk about the Cleveland Metroparks’s part-nership with the Sewer District?
In Milwaukee, I learned the value of partnering with a regional sewer agency. With the transfer of the lakefront parks to Cleveland Metroparks, we really wanted to show the public what our standard of care was by partnering with the Sewer District to address problems at our beaches. Certainly, the District’s handling of upstream pollution before it even gets to Lake Erie is extremely important. And the beach cleaners are important for the overall quality and visitor experience. The equipment runs almost every day at Euclid Beach and Edgewater Park. What the Sewer District brings to the table is vital to the overall health of our water quality in Northeast Ohio. It’s a really nice partnership to move things forward for the community.
clevelandmetroparks.org
Brian Zimmerman is the Chief Executive Officer of Cleveland Metroparks. He previously served as Operations Chief for the Milwaukee County Department of Parks, Recreation, and Culture.
Q&Aby Michael Uva
An interview with BrianZimmerman, Chief Executive Officer of ClevelandMetroparks.
CLE
VE
LAN
D M
ET
RO
PAR
KS
� CleanWaterWorks / Northeast Ohio Regional Sewer District
The Natural Resources Defense Council (NRDC) conducts an annual analy-sis of both water quality monitoring and public notification data at coastal
beaches in the United States. The findings are pre-sented in a report titled Testing the Waters. Each year, the organization selects one U.S. city for a press conference and releases the report. In 2012, the NRDC held their press conference and re-leased the Testing the Waters report in Cleveland’s Great Lakes Science Center. Although the beaches monitored by the Northeast Ohio Regional Sew-er District (Edgewater, Euclid, and Villa Angela Beaches) have typically received low rankings, the NRDC expressed their support for the Sewer Dis-trict’s beach monitoring program and progressive
stormwater and green infrastructure initiatives, and invited the Sewer District to participate in their 2012 press conference. While many coastal beaches are monitored by local public health agencies, the NEORSD con-ducts daily monitoring at Edgewater, Euclid, and Villa Angela Beaches each year between Memorial Day and Labor Day. The District also monitors beach water quality approximately four days per week from the beginning of May until Memorial Day and from Labor Day until the end of Oc-tober. In 2012, for example, the Sewer District sampled each of the three beaches that it regularly monitors more than 140 times. The Sewer District staff monitors beach water quality for E. coli bacteria and several field param-
Testing the watersby Frank Foley
The Sewer District maintains a rigorous schedule for testing the water quality at Cleveland’s beaches.
Testing methods are getting quicker and better—much to beachgoers’ benefit.
COVER STORy
Northeast Ohio Regional Sewer District / CleanWaterWorks �
eters, including pH, dissolved oxygen concentra-tion, and temperature. E. coli bacteria is an indi-cator organism for the presence of pathogens, or disease causing organisms, in water. The frequen-cy of monitoring conducted by the Sewer District is an indication of the organization’s commitment to protecting public health.
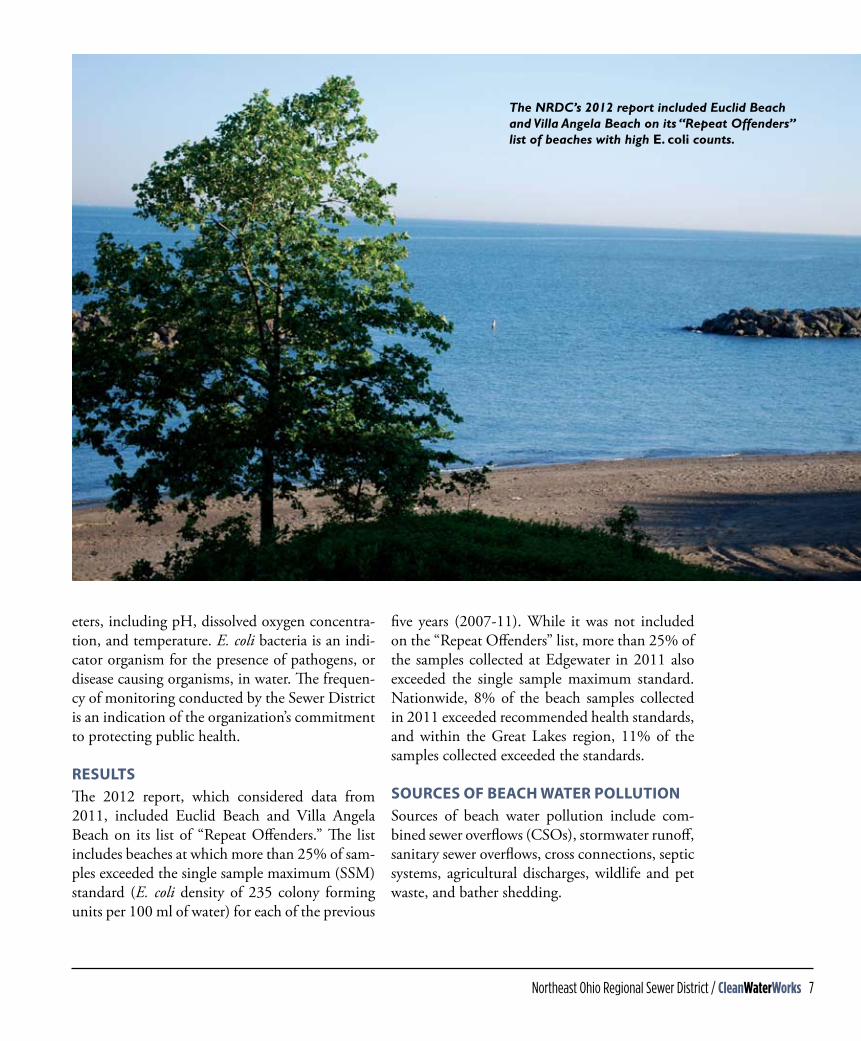
ResultsThe 2012 report, which considered data from 2011, included Euclid Beach and Villa Angela Beach on its list of “Repeat Offenders.” The list includes beaches at which more than 25% of sam-ples exceeded the single sample maximum (SSM) standard (E. coli density of 235 colony forming units per 100 ml of water) for each of the previous
five years (2007-11). While it was not included on the “Repeat Offenders” list, more than 25% of the samples collected at Edgewater in 2011 also exceeded the single sample maximum standard. Nationwide, 8% of the beach samples collected in 2011 exceeded recommended health standards, and within the Great Lakes region, 11% of the samples collected exceeded the standards.
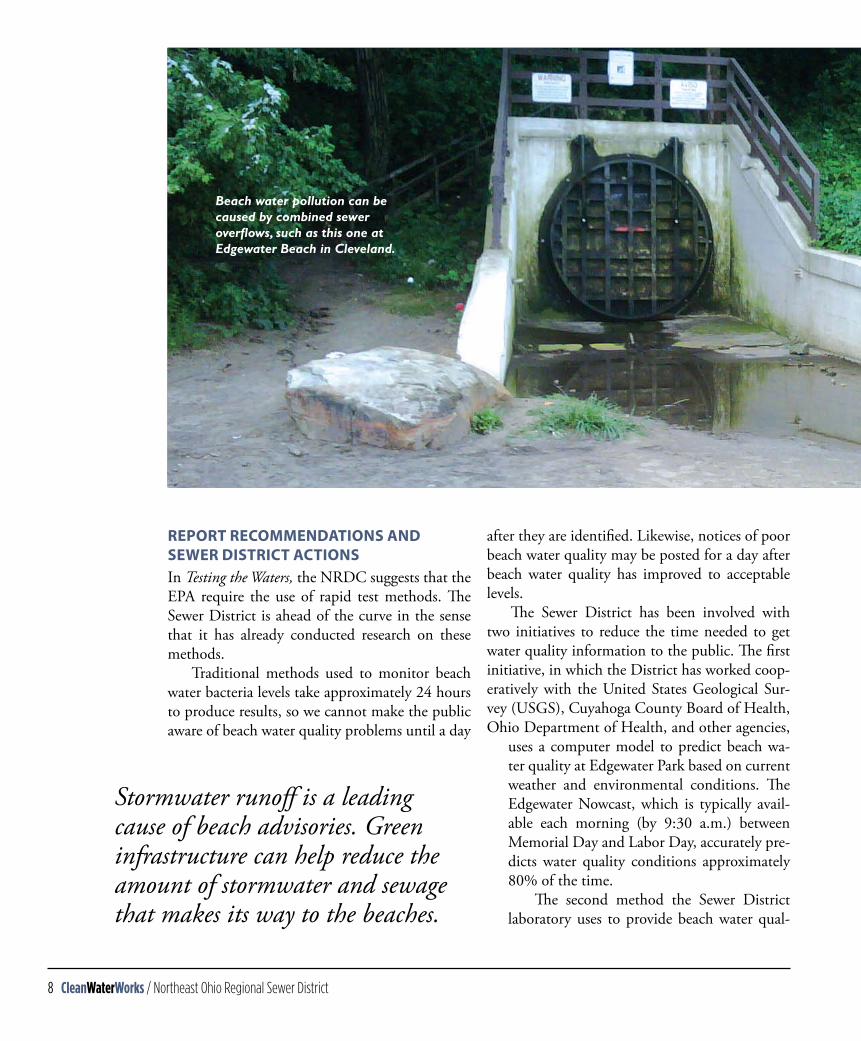
souRces of Beach WateR PollutionSources of beach water pollution include com-bined sewer overflows (CSOs), stormwater runoff, sanitary sewer overflows, cross connections, septic systems, agricultural discharges, wildlife and pet waste, and bather shedding.
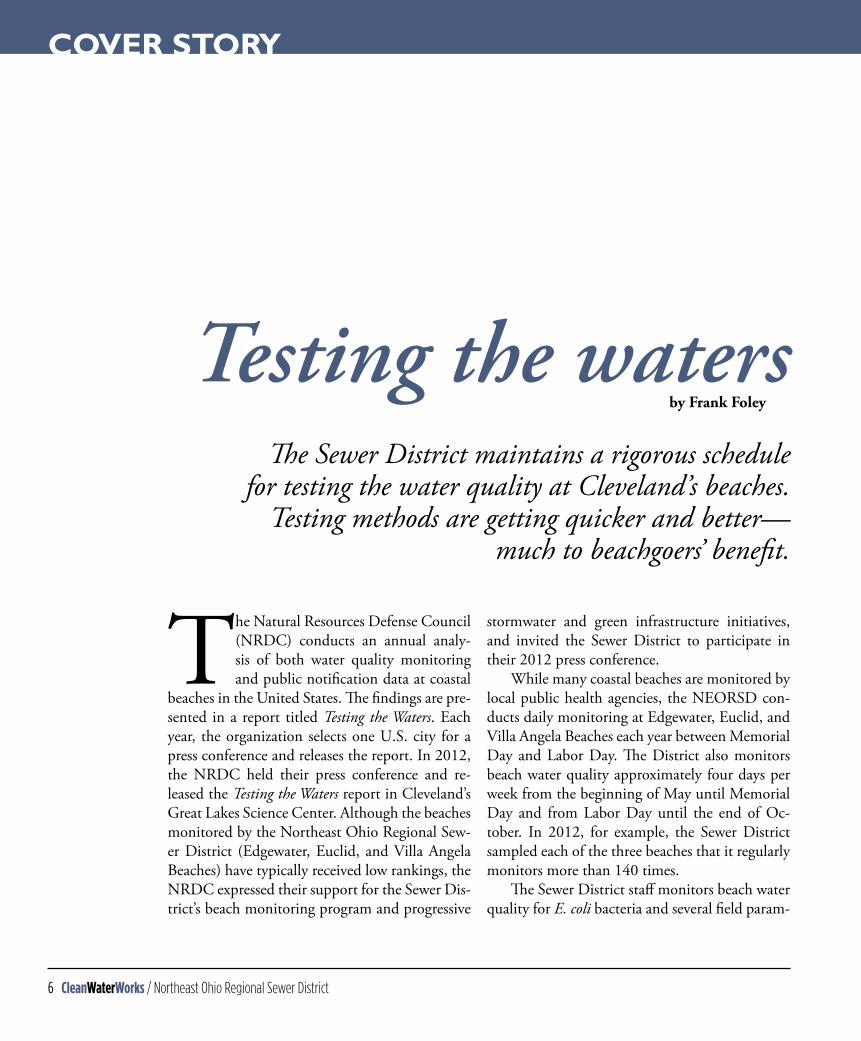
The NRDC’s 2012 report included Euclid Beach and Villa Angela Beach on its “Repeat Offenders” list of beaches with high E. coli counts.
� CleanWaterWorks / Northeast Ohio Regional Sewer District
RePoRt Recommendations and seWeR distRict actionsIn Testing the Waters, the NRDC suggests that the EPA require the use of rapid test methods. The Sewer District is ahead of the curve in the sense that it has already conducted research on these methods. Traditional methods used to monitor beach water bacteria levels take approximately 24 hours to produce results, so we cannot make the public aware of beach water quality problems until a day
after they are identified. Likewise, notices of poor beach water quality may be posted for a day after beach water quality has improved to acceptable levels. The Sewer District has been involved with two initiatives to reduce the time needed to get water quality information to the public. The first initiative, in which the District has worked coop-eratively with the United States Geological Sur-vey (USGS), Cuyahoga County Board of Health, Ohio Department of Health, and other agencies,
uses a computer model to predict beach wa-ter quality at Edgewater Park based on current weather and environmental conditions. The Edgewater Nowcast, which is typically avail-able each morning (by 9:30 a.m.) between Memorial Day and Labor Day, accurately pre-dicts water quality conditions approximately 80% of the time. The second method the Sewer District laboratory uses to provide beach water qual-
Stormwater runoff is a leading cause of beach advisories. Green infrastructure can help reduce the amount of stormwater and sewage that makes its way to the beaches.
Beach water pollution can be caused by combined sewer overflows, such as this one at Edgewater Beach in Cleveland.

Northeast Ohio Regional Sewer District / CleanWaterWorks �
ity information more quickly is quantitative poly-merase chain reaction, or qPCR, technology, which uses genetic material to quantify E. coli bacteria in water. In 2012, the District’s laboratory used qPCR to predict water quality at Villa Angela Beach. The qPCR results were generally available by 10 a.m., and accurately predicted water qual-ity conditions approximately 82% of the time. For 2013, the Sewer District’s laboratory staff is working with the USGS to possibly combine the Nowcast and qPCR to improve the accuracy of beach water quality predictions. The NRDC identifies stormwater runoff as the leading cause of beach advisories and recom-mends green infrastructure as a method for reduc-ing the amount of stormwater and combined sew-age that eventually make their way to recreational waters. Stormwater can contribute to beach water quality problems by carrying pollutants directly to the water body over land, via storm sewers, or by increasing the volume of water within com-
bined sewers and increasing the frequency and/or the severity of combined sewer overflows. The Sewer District is working to address both of these sources of pollution. As part of its Project Clean Lake, a federally-mandated investment in CSO-control measures, the District has committed to investing $3 billion in combined sewer improvements over the next 25 years, and at least $42 million in green infra-structure projects. Another of the NRDC report’s recommenda-tions for improving water quality was to “charge private properties a stormwater fee based on the amount of impervious surface area on the prop-erty, with the proceeds applied toward the capital and operating expenses associated with publicly owned stormwater infrastructure.” After years of preparation and legal proceedings, the Sewer Dis-trict implemented its Stormwater Management program, and in January 2013, began charging a stormwater fee based on impervious surface area, as the NRDC recommends in Testing the Waters.
looking aheadThe Northeast Ohio Regional Sewer District will continue to monitor beach water quality at local beaches within its service area, communicate re-sults to the public, and research rapid methods to improve the timeliness of reporting. While beach monitoring efforts to date have focused primarily on quantifying densities of in-dicator bacteria, such as E. coli or fecal coliform, phosphorous pollution is becoming a greater con-cern in Lake Erie. The presence of this nutrient encourages algae growth, including harmful algal blooms (HABs), which can foul beaches and pro-duce harmful toxins. Future Sewer District beach monitoring efforts may include methods to test for microcystin, a harmful toxin produced by blue-green algae. CWW
Frank Foley is the Superintendent of Environmental Services at the Northeast Ohio Regional Sewer District. He can be reached at [email protected].
10 CleanWaterWorks / Northeast Ohio Regional Sewer District
By now, the way the Northeast Ohio Regional Sewer District monitors the beaches is considered Standard Operat-ing Procedure.
We can generally discuss the procedure in two phases—sampling and analysis. The District samples and tests for E. coli, since it has been identified as one of the best indicator organisms at freshwater bathing beaches and its presence has been correlated to other pathogenic microor-ganisms that can cause illness. The data obtained from this sampling and analysis is reported to the Ohio Department of Health (ODH) and used for public notification of water quality advisories. The driving force in both sampling and analy-sis is quality. District personnel strive to provide the highest quality beach data. From the moment the sample is collected to when data is report-ed, many quality-control measures are put into place.
samPlingDuring the recreation season (typically Memorial Day to Labor Day), the District samples and tests seven days a week to monitor the water quality of Lake Erie at Edgewater, Euclid, and Villa Angela Beaches, for communicating beach conditions to the public and evaluating water quality standards attainment. Outside of the recreation season, the District continues to monitor each of these beaches, but on a more limited schedule: four days a week (Monday through Thursday) from May 1 through Memorial Day and from Labor Day through October 31. The District has several Level 3 Qualified Data Collectors, Level 3 being the highest achiev-able level. This certification is given by the Ohio EPA. GPS and landmarks are used to guide the samplers in grabbing samples from clearly defined locations at each of the beaches.
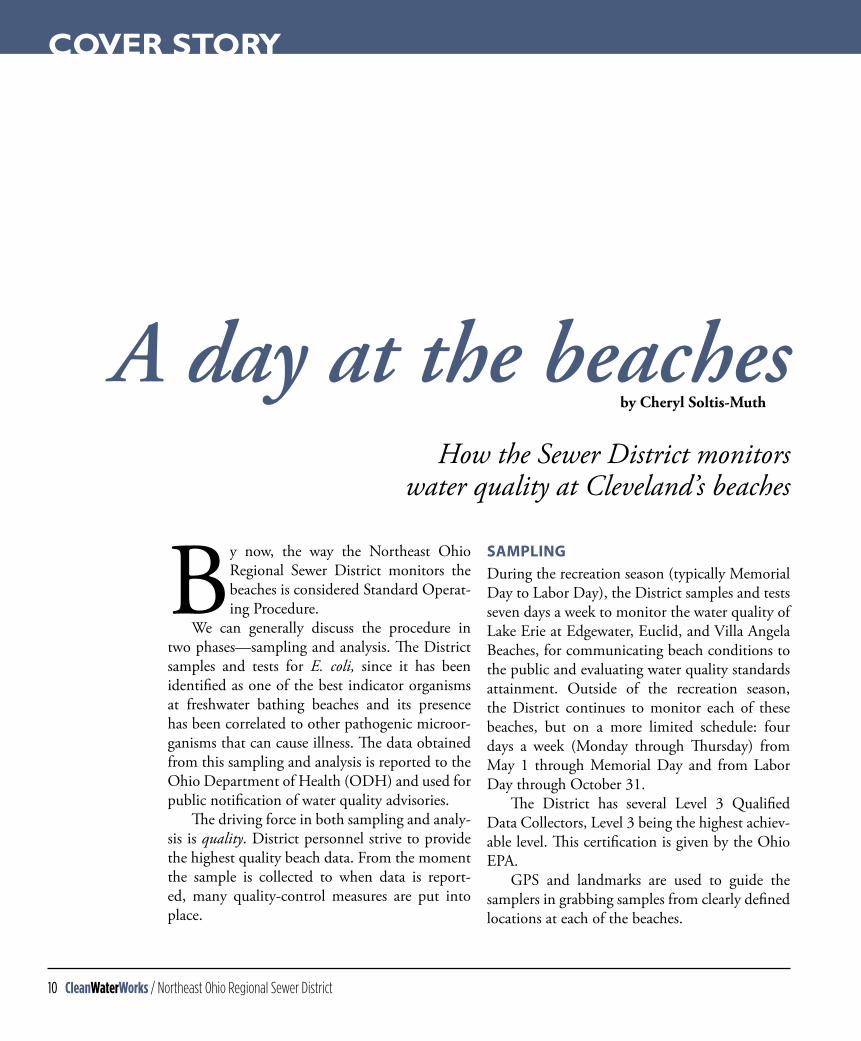
A day at the beachesby Cheryl Soltis-Muth
How the Sewer District monitors water quality at Cleveland’s beaches
COVER STORy
Northeast Ohio Regional Sewer District / CleanWaterWorks 11
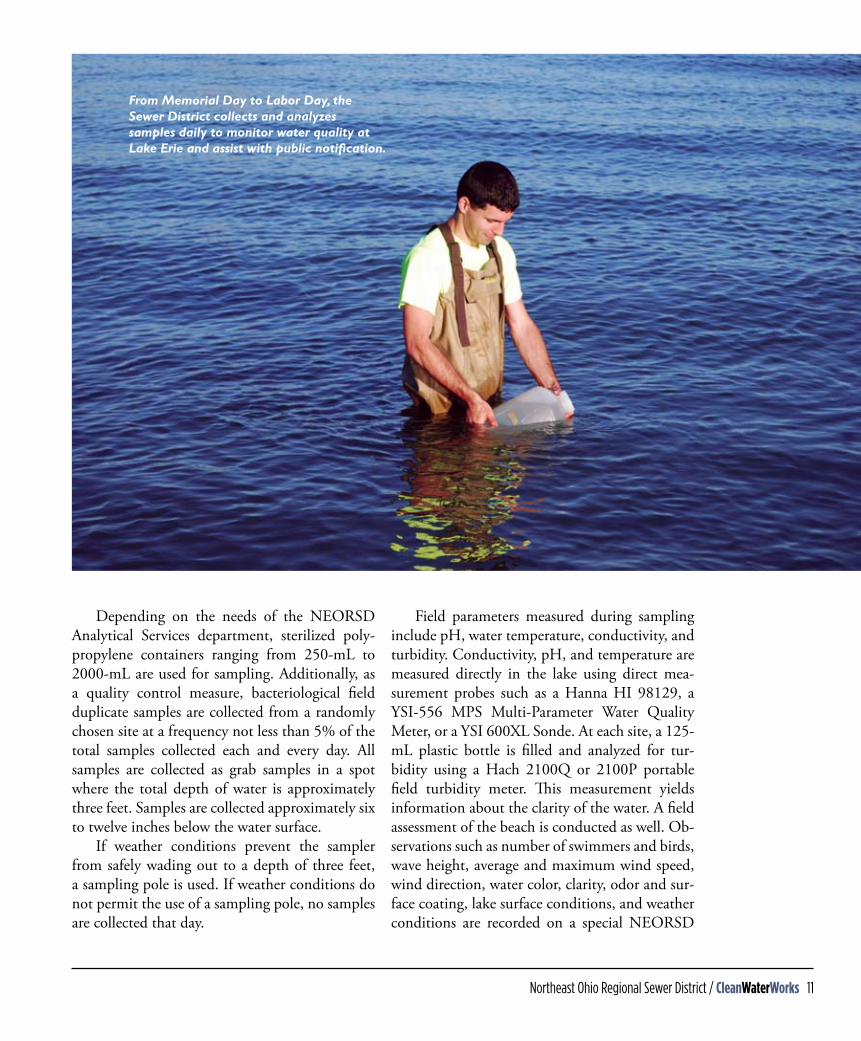
Depending on the needs of the NEORSD Analytical Services department, sterilized poly-propylene containers ranging from 250-mL to 2000-mL are used for sampling. Additionally, as a quality control measure, bacteriological field duplicate samples are collected from a randomly chosen site at a frequency not less than 5% of the total samples collected each and every day. All samples are collected as grab samples in a spot where the total depth of water is approximately three feet. Samples are collected approximately six to twelve inches below the water surface. If weather conditions prevent the sampler from safely wading out to a depth of three feet, a sampling pole is used. If weather conditions do not permit the use of a sampling pole, no samples are collected that day.
Field parameters measured during sampling include pH, water temperature, conductivity, and turbidity. Conductivity, pH, and temperature are measured directly in the lake using direct mea-surement probes such as a Hanna HI 98129, a YSI-556 MPS Multi-Parameter Water Quality Meter, or a YSI 600XL Sonde. At each site, a 125-mL plastic bottle is filled and analyzed for tur-bidity using a Hach 2100Q or 2100P portable field turbidity meter. This measurement yields information about the clarity of the water. A field assessment of the beach is conducted as well. Ob-servations such as number of swimmers and birds, wave height, average and maximum wind speed, wind direction, water color, clarity, odor and sur-face coating, lake surface conditions, and weather conditions are recorded on a special NEORSD
From Memorial Day to Labor Day, the Sewer District collects and analyzes samples daily to monitor water quality at Lake Erie and assist with public notification.
1� CleanWaterWorks / Northeast Ohio Regional Sewer District
Beach Sampling Field Data Form. These observa-tions are factors that influence beach water quality and are used by District personnel in models used to predict water quality at these beaches. Pictures are also taken during each sampling event by the samplers to document the conditions at each of the beaches. Additional guidelines for sampling include:
Ensure sampling bottles are sterile with custody seals intactEnsure all proper sampling and safety equipment is present and in good working orderUse proper sampling techniques:
Do not touch inside of bottle or cap as this may
•
•
•»
contaminate the sampleDo not sample too close to the shoreline as this may cause elevated bacteria countsDo not sample near sediment, bird feces, trash, or other floating debrisAvoid disturbing and kicking up bottom material at sampling location
Samples are collected, labeled, and immedi-ately placed on ice inside of a sample cooler. The cooler is stored inside the field truck, which re-mains locked at all times when not occupied or visible. Sampling activities, including the sample time and condition of surface water sampled, are entered in a log book and on the Beach Sampling
»
»
»
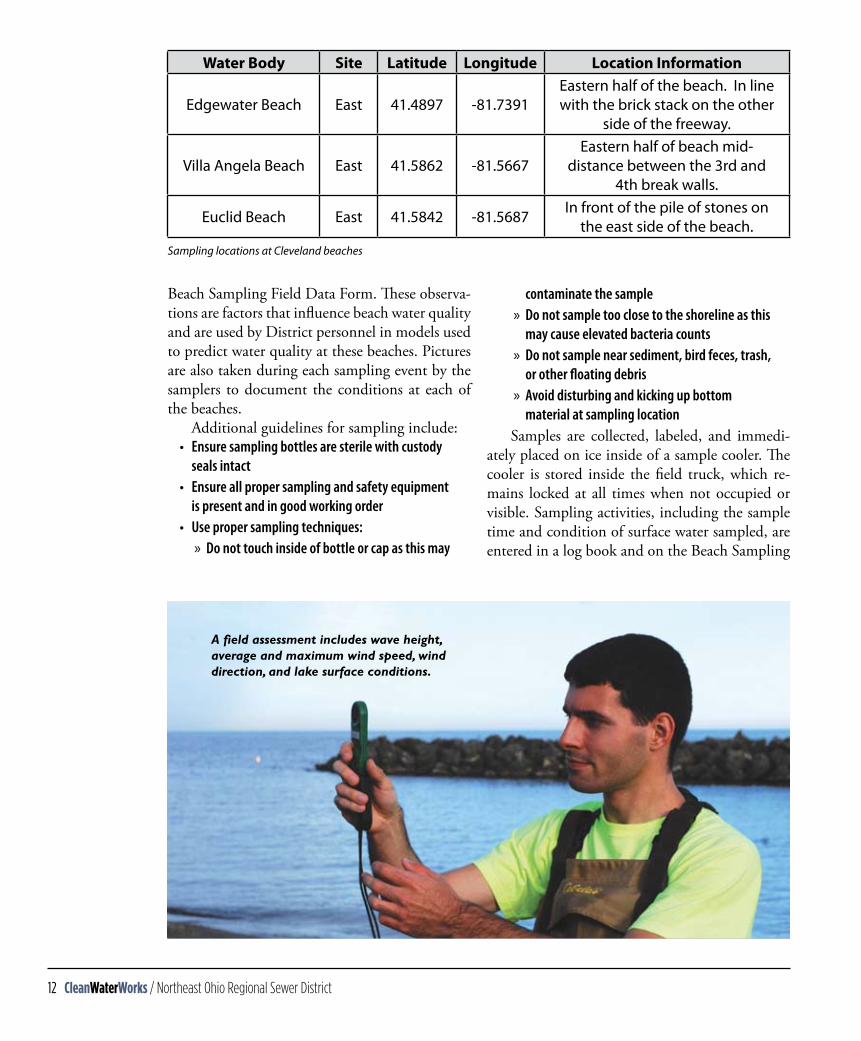
Water Body site latitude longitude location information
Edgewater Beach East 41.4897 -81.7391Eastern half of the beach. In line with the brick stack on the other
side of the freeway.
Villa Angela Beach East 41.5862 -81.5667Eastern half of beach mid-
distance between the 3rd and 4th break walls.
Euclid Beach East 41.5842 -81.5687 In front of the pile of stones on the east side of the beach.
Sampling locations at Cleveland beaches
A field assessment includes wave height, average and maximum wind speed, wind direction, and lake surface conditions.
Northeast Ohio Regional Sewer District / CleanWaterWorks 13
Field Data Form. A Chain of Custody form is also filled out, with collection times of each sam-ple noted. The samples are delivered immediately to the NEORSD Analytical Services department and custody is transferred to Analytical Services.
analYsisWhen it comes to bacteriological analysis, clean-liness and quality are key. The NEORSD’s Ana-lytical Services Quality Assurance Manual and as-sociated Standard Operating Procedures (SOPs) are on file with Ohio EPA. The Quality Assurance Officer at NEORSD sends updates, revisions, and any information on document control to Ohio EPA as needed. In order to collect samples that are free of any contamination and to perform analyses that are accurate, the NEORSD staff needs to have bot-tles, equipment, and reagents that are free from any kind of bacteria. Using an autoclave, a piece of equipment that uses high temperatures and high pressure to completely sterilize all equipment and reagents, the staff is able to ensure that all are contaminant-free. For autoclaving, the Analytical Services staff has in place SOPs that are required by NELAP (National Environmental Laboratory Accrediting
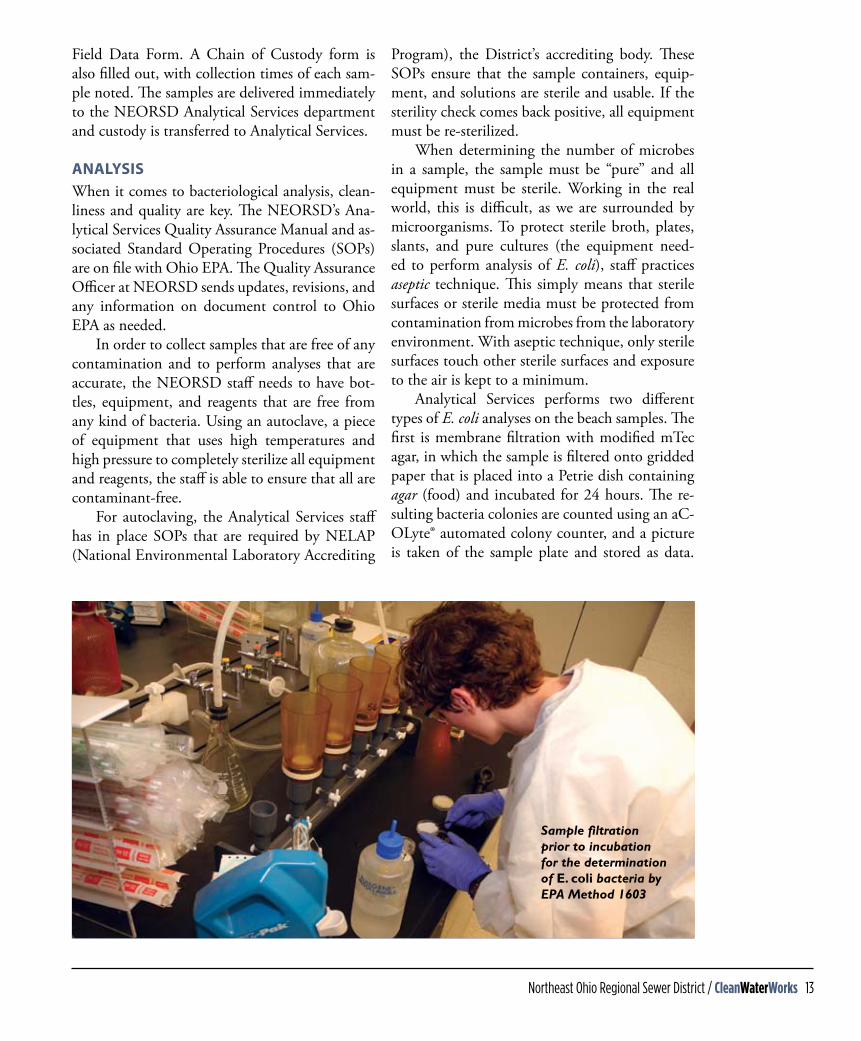
Program), the District’s accrediting body. These SOPs ensure that the sample containers, equip-ment, and solutions are sterile and usable. If the sterility check comes back positive, all equipment must be re-sterilized. When determining the number of microbes in a sample, the sample must be “pure” and all equipment must be sterile. Working in the real world, this is difficult, as we are surrounded by microorganisms. To protect sterile broth, plates, slants, and pure cultures (the equipment need-ed to perform analysis of E. coli), staff practices aseptic technique. This simply means that sterile surfaces or sterile media must be protected from contamination from microbes from the laboratory environment. With aseptic technique, only sterile surfaces touch other sterile surfaces and exposure to the air is kept to a minimum. Analytical Services performs two different types of E. coli analyses on the beach samples. The first is membrane filtration with modified mTec agar, in which the sample is filtered onto gridded paper that is placed into a Petrie dish containing agar (food) and incubated for 24 hours. The re-sulting bacteria colonies are counted using an aC-OLyte® automated colony counter, and a picture is taken of the sample plate and stored as data.
Sample filtration prior to incubation for the determination of E. coli bacteria by EPA Method 1603
14 CleanWaterWorks / Northeast Ohio Regional Sewer District
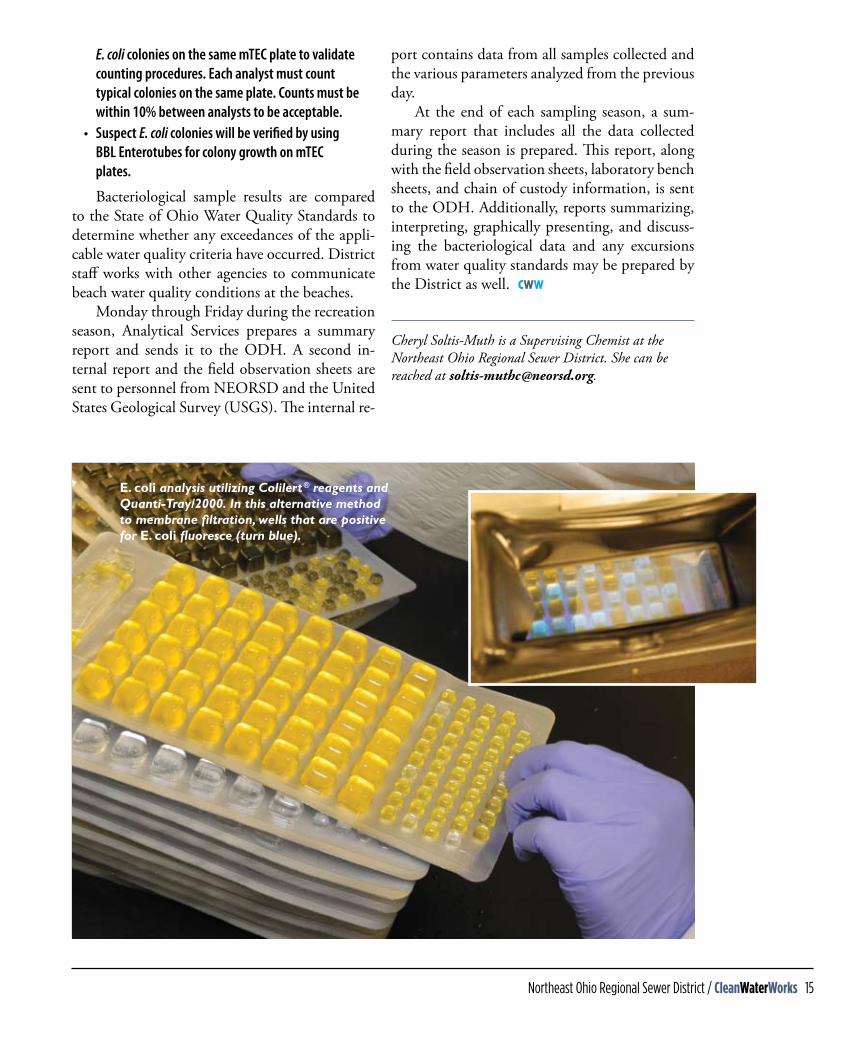
The laboratory uses procedures and quality con-trol defined in EPA Method 1603 for membrane filtration analyses. The second analysis is Colilert® Quanti-Tray. This method utilizes a special reagent that is added to the sample, then the sample is poured into a tray with wells and sealed, incubated for either 18 or 24 hours (depending on the type of reagent added) and placed under a black light to see which, if any, wells fluoresce. The fluorescence and color of the wells is then compared to a table and the concentration of E. coli is determined. Analytical Services staff uses the Coliert® Quanti-Tray method in conjuction with Method 9223 in Standard Methods for the Examination of Water and Wastewater (20th Edition). To ensure the most accurate data, many qual-ity control procedures are practiced. The QC for E. coli analysis includes:
Sterility checks Media verification—each batch of mTEC agar media prepared is verified using pure cultures of E. coli (positive control) and E. aerogenes (negative control) bacteria. Method blanks confirm the effectiveness of the sterilization
Analyze a method blank at the beginning, after 10 samples, and at the end of plating for each batch to ensure cleanliness of all equipment
Duplicate analysesAnalyze one duplicate per batch of samples to confirm precision of the method
Maintain all logbooks or forms: chemical receipt logbook, UV sterilization logbook, pH meter calibration logbook, and autoclave recordsColony Counting: Each month, all analysts performing membrane filtration must count the
••
•
»
•»
•
•
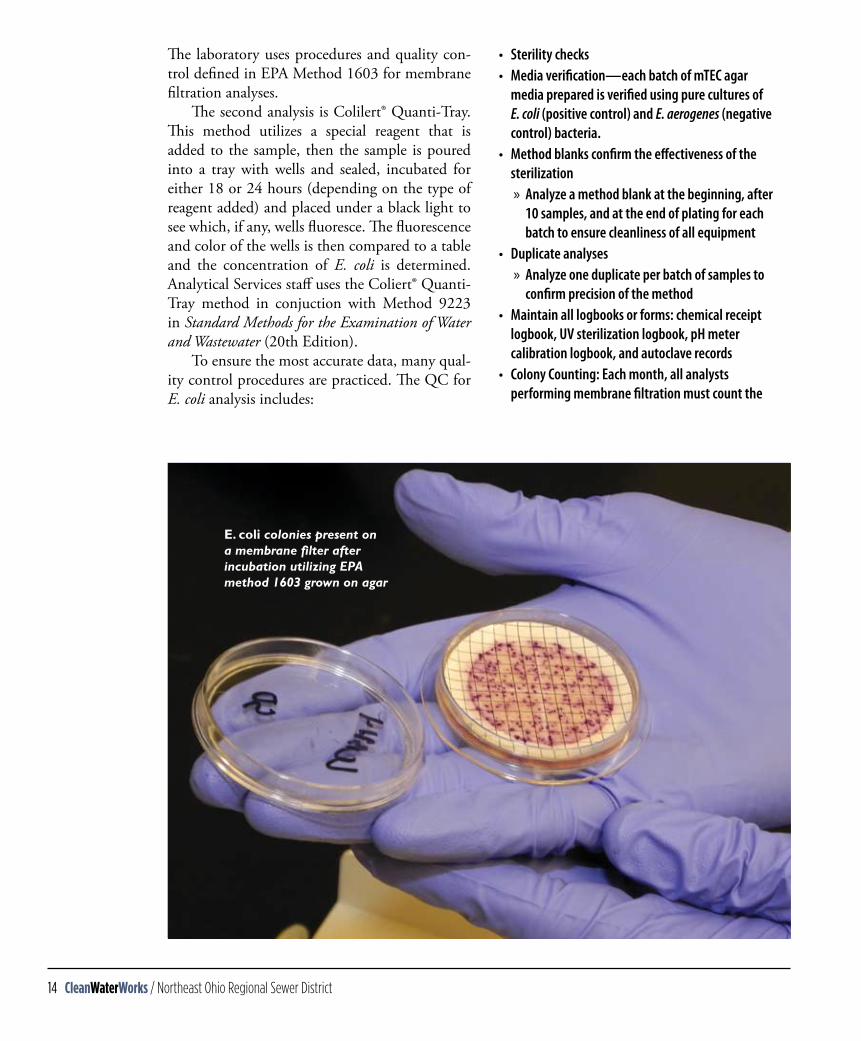
E. coli colonies present on a membrane filter after incubation utilizing EPA method 1603 grown on agar
Northeast Ohio Regional Sewer District / CleanWaterWorks 1�
E. coli colonies on the same mTEC plate to validate counting procedures. Each analyst must count typical colonies on the same plate. Counts must be within 10% between analysts to be acceptable.Suspect E. coli colonies will be verified by using BBL Enterotubes for colony growth on mTEC plates.
Bacteriological sample results are compared to the State of Ohio Water Quality Standards to determine whether any exceedances of the appli-cable water quality criteria have occurred. District staff works with other agencies to communicate beach water quality conditions at the beaches. Monday through Friday during the recreation season, Analytical Services prepares a summary report and sends it to the ODH. A second in-ternal report and the field observation sheets are sent to personnel from NEORSD and the United States Geological Survey (USGS). The internal re-
•
port contains data from all samples collected and the various parameters analyzed from the previous day. At the end of each sampling season, a sum-mary report that includes all the data collected during the season is prepared. This report, along with the field observation sheets, laboratory bench sheets, and chain of custody information, is sent to the ODH. Additionally, reports summarizing, interpreting, graphically presenting, and discuss-ing the bacteriological data and any excursions from water quality standards may be prepared by the District as well. CWW
Cheryl Soltis-Muth is a Supervising Chemist at the Northeast Ohio Regional Sewer District. She can be reached at [email protected].
E. coli analysis utilizing Colilert® reagents and Quanti-Tray/2000. In this alternative method to membrane filtration, wells that are positive for E. coli fluoresce (turn blue).

1� CleanWaterWorks / Northeast Ohio Regional Sewer District
Dirty birdsby Jennifer Elting
Lakeside waterfowl can make for a pretty picture—but they pollute, too
Picture yourself enjoying a relaxing day at the beach. You might imagine kids building sandcastles, a couple holding hands as they stroll along the shoreline,
or gulls at the water’s edge looking for a quick lunch. Unfortunately, those picturesque birds—and the bacteria they leave behind—contribute to high pollution levels at Northeast Ohio’s lake-front beaches. Bird droppings can contain bacteria such as E. coli and enterococci, both of which cause a variety of human illnesses and are among the top culprits for triggering beach warnings. Waterfowl waste is just one of many factors that can impact the beaches in a negative way. Others include combined (and sanitary) sewer overflows, treated wastewater effluent, effluent from private sources, fecal pollution from other wildlife, and stormwater runoff. Add in variable factors such as lake currents and weather condi-tions, and the study of these relationships be-comes very complex.
The Northeast Ohio Regional Sewer District has been researching the impact of waterfowl for many years, using new techniques such as spatial sampling at Edgewater Beach on Cleveland’s west side and Villa Angela Beach and Euclid Beach on the east side. During the peak of recreation season, the Sewer District samples these beaches daily. (Very few agencies test this often.) It is critical for Northeast Ohioans to know whether or not it is safe to swim at their favor-ite local beach. In 2013, the Sewer District is partnering with the Cuyahoga County Board of Health and local television station WKYC TV-3 to educate weekend viewers about conditions at all area beaches. Beach reports are also available via Twitter @NEORSDbeaches. CWW
Jennifer Elting is a Public Information Specialist at the Northeast Ohio Regional Sewer District. She can be reached at [email protected].
Northeast Ohio Regional Sewer District / CleanWaterWorks 1�
DATA PAGES
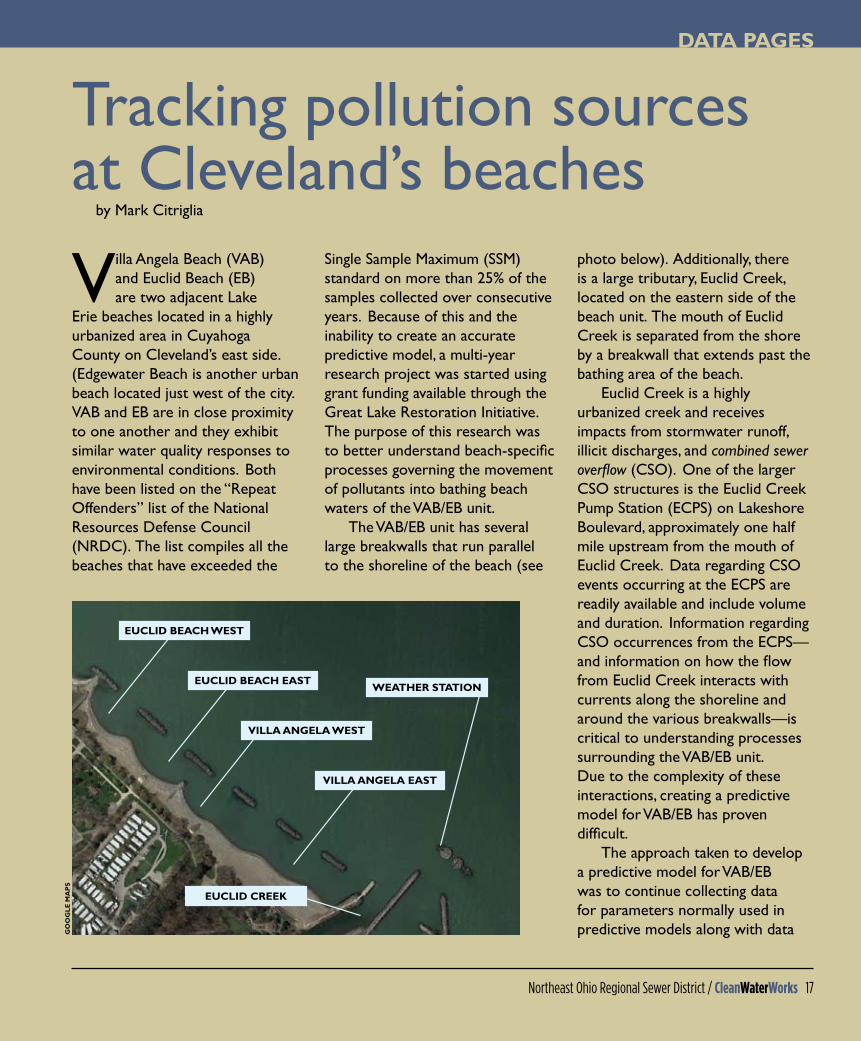
Villa Angela Beach (VAB) and Euclid Beach (EB) are two adjacent Lake
Erie beaches located in a highly urbanized area in Cuyahoga County on Cleveland’s east side. (Edgewater Beach is another urban beach located just west of the city. VAB and EB are in close proximity to one another and they exhibit similar water quality responses to environmental conditions. Both have been listed on the “Repeat Offenders” list of the National Resources Defense Council (NRDC). The list compiles all the beaches that have exceeded the
Single Sample Maximum (SSM) standard on more than 25% of the samples collected over consecutive years. Because of this and the inability to create an accurate predictive model, a multi-year research project was started using grant funding available through the Great Lake Restoration Initiative. The purpose of this research was to better understand beach-specific processes governing the movement of pollutants into bathing beach waters of the VAB/EB unit.
The VAB/EB unit has several large breakwalls that run parallel to the shoreline of the beach (see
photo below). Additionally, there is a large tributary, Euclid Creek, located on the eastern side of the beach unit. The mouth of Euclid Creek is separated from the shore by a breakwall that extends past the bathing area of the beach.
Euclid Creek is a highly urbanized creek and receives impacts from stormwater runoff, illicit discharges, and combined sewer overflow (CSO). One of the larger CSO structures is the Euclid Creek Pump Station (ECPS) on Lakeshore Boulevard, approximately one half mile upstream from the mouth of Euclid Creek. Data regarding CSO events occurring at the ECPS are readily available and include volume and duration. Information regarding CSO occurrences from the ECPS—and information on how the flow from Euclid Creek interacts with currents along the shoreline and around the various breakwalls—is critical to understanding processes surrounding the VAB/EB unit. Due to the complexity of these interactions, creating a predictive model for VAB/EB has proven difficult.
The approach taken to develop a predictive model for VAB/EB was to continue collecting data for parameters normally used in predictive models along with data
Tracking pollution sources at Cleveland’s beaches
by Mark Citriglia
EUCLID BEACH WEST
EUCLID BEACH EAST
VILLA ANGELA EAST
EUCLID CREEK
WEATHER STATION
VILLA ANGELA WEST
GO
OG
LE M
AP
S

1� CleanWaterWorks / Northeast Ohio Regional Sewer District
from the NEORSD collection system and rain gauges and operational data from its three wastewater treatment plants.
Additional on-shore data was collected to quantify the fecal matter and debris present on the beach sand, wave action, sand erosion, re-suspension of sediments, and flow interactions along the shore. Off-shore data collection included mapping the flow patterns parallel to the beach and breakwalls, along with the interaction of lake water with Euclid Creek flow.
The scope of work for this project at VAB/EB included the investigation of potential pollution sources, identifying how these pollution sources interact with various beach processes, and
understanding the impact of Euclid Creek on the bathing waters of VAB/EB. Understanding the sources and processes will help in developing a predictive model.
Fecal contamination at VAB/EB was determined to be the result of fecal matter from waterfowl on the beach sands and in the water, contaminated sands and sediments, shore debris or detritus, stormwater runoff, and CSO and illicit discharges from along Euclid Creek. Each of these sources of pollution interacts with the various beach processes to eventually contaminate the bathing beach water. The chart below shows the interaction of these different processes and pollution sources.
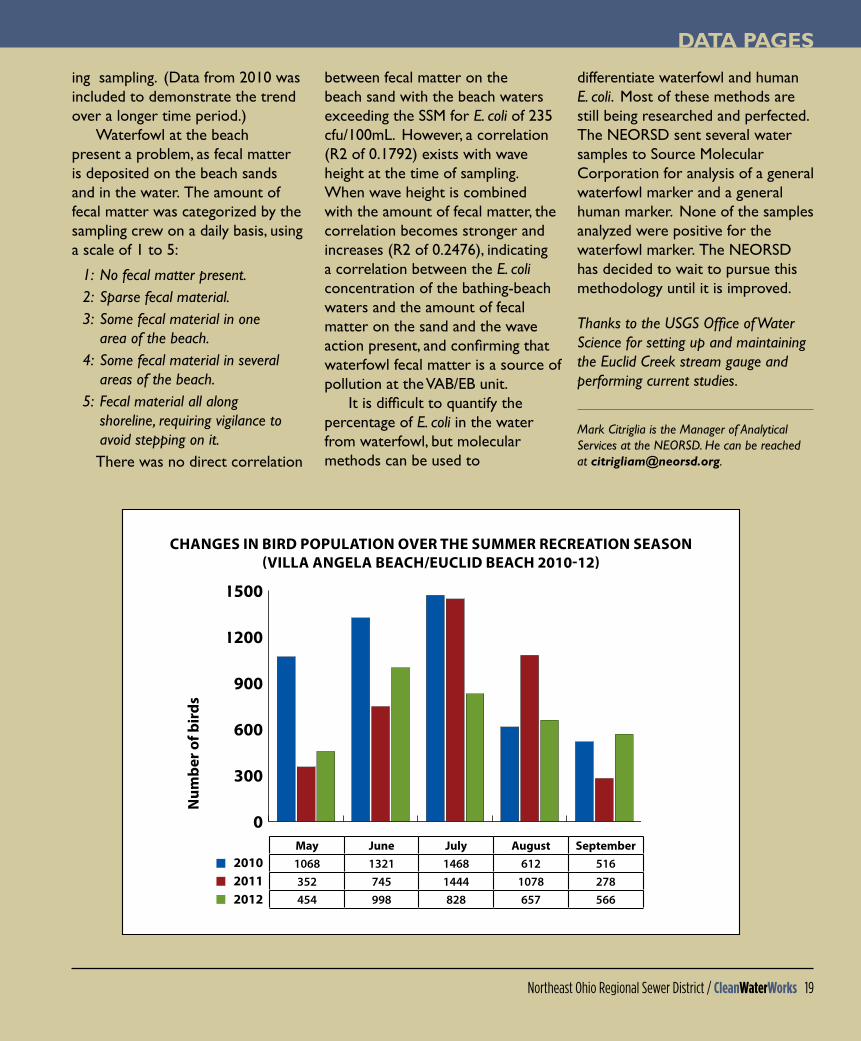
WateRfoWl at the BeachThe VAB/EB unit has a very large population of waterfowl that reside on the beach. The majority are gulls and Canada geese. The gulls are present at the beach throughout the year while geese are seen mainly during late spring and summer. The bird population tends to increase during the recreation season and peak in June and July. However, when looking at the total number of days exceeding the Single Sample Maximum (SSM) during each of these months, the numbers are consistent from month to month and do not follow the same pattern as the number of birds on the beach. The chart on page 19 summa-rizes the number of geese present on the beach or in the water dur-
souRces of E. coli contamination and PRocesses foR distRiBution to Beach WateRs
# E. coli available from a variety of
direct sources
# E. coli in bathing beach water
GROUPED FLOW PROCESSES
DIRECT
RAIN DRIVEN
WAVE ACTION
RE-SUSPENSION
# E. coli in submerged sediment in bathing area
# E. coli in contaminated
beach sand
Northeast Ohio Regional Sewer District / CleanWaterWorks 1�
DATA PAGES
ing sampling. (Data from 2010 was included to demonstrate the trend over a longer time period.)
Waterfowl at the beach present a problem, as fecal matter is deposited on the beach sands and in the water. The amount of fecal matter was categorized by the sampling crew on a daily basis, using a scale of 1 to 5:
1: no fecal matter present.2: sparse fecal material.3: some fecal material in one
area of the beach.4: some fecal material in several
areas of the beach.5: Fecal material all along
shoreline, requiring vigilance to avoid stepping on it.There was no direct correlation
between fecal matter on the beach sand with the beach waters exceeding the SSM for E. coli of 235 cfu/100mL. However, a correlation (R2 of 0.1792) exists with wave height at the time of sampling. When wave height is combined with the amount of fecal matter, the correlation becomes stronger and increases (R2 of 0.2476), indicating a correlation between the E. coli concentration of the bathing-beach waters and the amount of fecal matter on the sand and the wave action present, and confirming that waterfowl fecal matter is a source of pollution at the VAB/EB unit.
It is difficult to quantify the percentage of E. coli in the water from waterfowl, but molecular methods can be used to
differentiate waterfowl and human E. coli. Most of these methods are still being researched and perfected. The NEORSD sent several water samples to Source Molecular Corporation for analysis of a general waterfowl marker and a general human marker. None of the samples analyzed were positive for the waterfowl marker. The NEORSD has decided to wait to pursue this methodology until it is improved.
Thanks to the USGS Office of Water science for setting up and maintaining the Euclid Creek stream gauge and performing current studies.
mark Citriglia is the manager of Analytical services at the nEoRsD. He can be reached at [email protected].
0
300
600
900
1200
1500
changes in BiRd PoPulation oveR the summeR RecReation season (villa angela Beach/euclid Beach 2010-12)
num
ber o
f bir
ds
may June July august september1068 1321 1468 612 516352 745 1444 1078 278454 998 828 657 566
201020112012
�0 CleanWaterWorks / Northeast Ohio Regional Sewer District
Our beaches are more than just stretches of sand. They’re our doorways to the Great Lakes, the only chance some people have to connect to the waters that we all love and that bind us together as a region. This is why the 16 federal agencies coordinating the Great Lakes
Restoration Initiative (GLRI) have invested in the health of our coasts. Those projects, some of which are described in detail in this magazine, include:
Sanitary surveys, in which scientists and volunteers comb beaches to look for a different kind of treasure: tough-to-find sources of bacteria and other pollution that, once identified, can be addressed collaboratively with municipalities.Better forecasting so that you know which beaches are safe for swimming when you want to visit. This work has led to the growth of “beachcasting” apps for smartphones so that it’s easy to know whether your local beach is open for swimming at just about any time of day.Stronger beach hygiene practices, such as installing swales and other “green infrastructure” that filter out pollutants before they impact water quality.
The GLRI has had its successes—but it needs your help. This summer and fall, our federal agencies are looking for your input on how GLRI investments should be guided. For more information on this, visit glri.us/public.html. Great Lakes beaches are estimated to draw more than 80 million visits per year. Chicago alone is home to an estimated 65 million visits, with the Lake Erie shores and islands welcoming nearly 7 million visitors annually. Clearly, the Great Lakes are doing their part to support us through recreation, tourism, jobs, and drinking water. But for the Great Lakes to continue to support us, we need to continue to support them.
glri.us
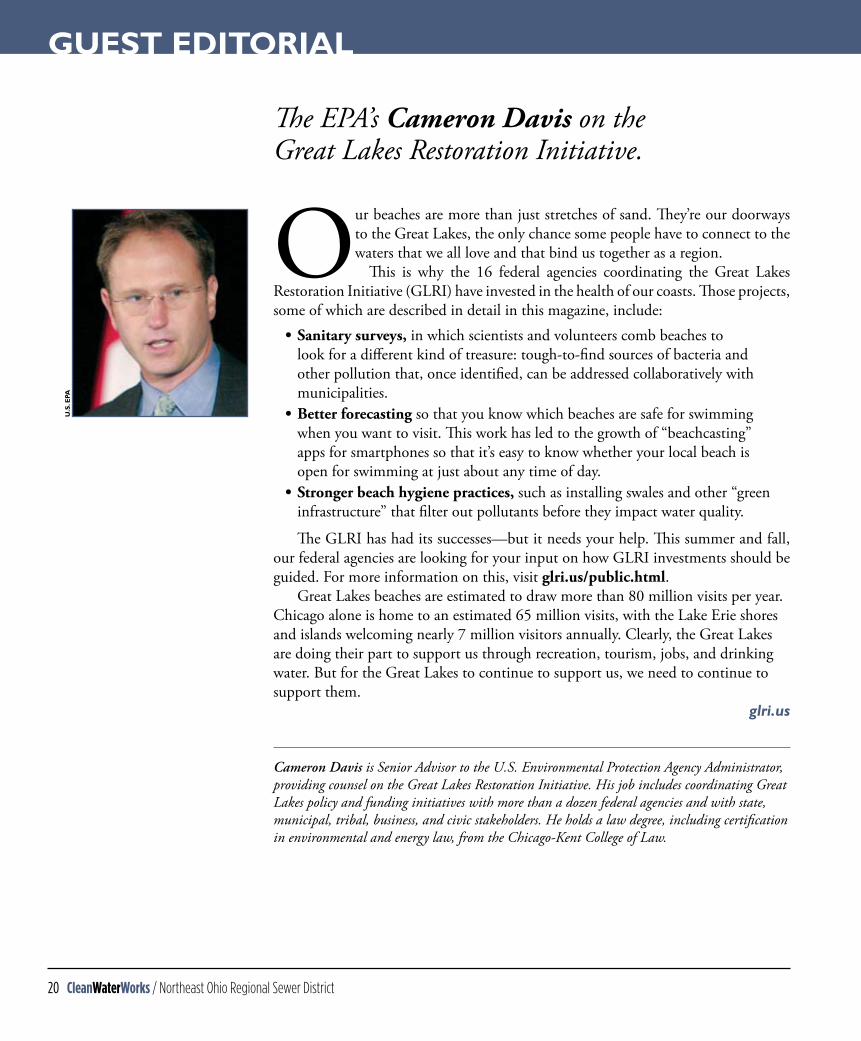
Cameron Davis is Senior Advisor to the U.S. Environmental Protection Agency Administrator, providing counsel on the Great Lakes Restoration Initiative. His job includes coordinating Great Lakes policy and funding initiatives with more than a dozen federal agencies and with state, municipal, tribal, business, and civic stakeholders. He holds a law degree, including certification in environmental and energy law, from the Chicago-Kent College of Law.
•
•
•
The EPA’s CameronDavis on the Great Lakes Restoration Initiative.
U.S
. EPA
GUEST EDITORIAL
Northeast Ohio Regional Sewer District / CleanWaterWorks �1
Swim advisories issued at local beaches are based on the concentration of specific bac-terial indicators. For fresh water beaches, the indicator bacteria are E. coli or entero-
cocci, while marine beaches use enterococci. The State of Ohio uses E. coli as the indicator bacteria to issue advisories at local beaches. The analytical methods used to quantify the density of bacteria in bathing waters takes at least 18 to 24 hours. Therefore, by the time the results are ready, the water quality at the beaches may have already changed. Because of this, agencies have turned to the development of Predictive Models to obtain near real-time predictions of water quality. There are two approaches to creating a pre-dictive model for recreational water. The first is to use a statistical-based model that uses a mul-tiple-linear regression (MLR) analysis to identify relationships between E. coli concentrations and known variables that affect their concentration. This type of model has been used by the Ohio Nowcast system for Huntington and Edgewater Beaches. The second approach to modeling is to make a deterministic, or mechanics-based, model
based on the mixing and transport of pollution sources through various processes. The use of a statistical approach for real-time forecasting resolves the delayed notification of fe-cal contamination in recreational waters. Predic-tive Modeling is an instrumental tool in predict-ing the water quality of several beaches within the United States. The United States Geological Survey (USGS) is one of the leading advocates for its success, and has continued to strive for its im-provements and accuracy. The USGS has developed real-time mathemat-ical models to predict the probability of a swim advisory or closing based on water-quality. Water-quality advisories are issued based on state stan-dards for concentrations of fecal-indicator bacteria such as E. coli. These models are developed using several environmental factors that have significant correlations to the increase in E. coli concentra-tion. The USGS has been using predictive models for several beaches for nearly a decade, including local beaches Edgewater and Villa Angela. Donna Francy, a USGS Water Quality Specialist, said, “We have worked at 42 Great Lakes beaches to
Nowcastsby Paul Skerl and Lindsey Koplow
Swim advisories let beachgoers know when it is safe to go in the water. How accurate are they?
�� CleanWaterWorks / Northeast Ohio Regional Sewer District
develop models with local agencies. We’re hoping to add more Ohio beaches to the Ohio Nowcast, working with Erie and Lake Counties.” Through the Great Lakes Restoration Initiative and the USGS Coastal and Marine Program, the USGS receives funding to help local agencies develop predictive models at their beaches. These calcu-lated predictions can be more accurate than the methods used in the past; such as using the results from the previous day’s data. The first Ohio beach—the first in the coun-try, in fact—to have a valid and accurate predic-tive model was Huntington Beach, and this led to the implementation of the Ohio Nowcast system in 2006. “It first happened in Ohio due to co-operative projects between the USGS, Cuyahoga County Board of Health, and the Northeast Ohio Regional Sewer District, with seed funding from the Ohio Water Development Authority in the late 1990s,” said Francy. In 2008, Edgewater Beach was added to the Ohio Nowcast site. Attempts were made to create a predictive model for Villa Angela Beach. How-
ever, due to the complex processes at this beach, these attempts failed to create an accurate model. In 2010, the Sewer District partnered with the USGS to develop a predictive model for Villa Angela Beach that incorporated the use of a new rapid-method technology, qPCR (see page 25). This model was very successful and was incor-porated into the Ohio Nowcast in 2012. Due to this cooperative working relationship, the Sewer District now has the knowledgeable and compe-tent staff to assume the responsibility of creating, maintaining, and managing the predictive model for both Villa Angela and Edgewater Beaches. In order to develop a predictive model for a beach, substantial environmental data (which may include turbidity, wind speed and direction, wave height, and rainfall) must be collected for several years. This data is used to develop multiple linear regression (MLR) models in a statistical program called Virtual Beach. These models calculate an expected E. coli concentration and also the ex-ceedance of the bathing-water standard based on selected environmental variables. Its accuracy will
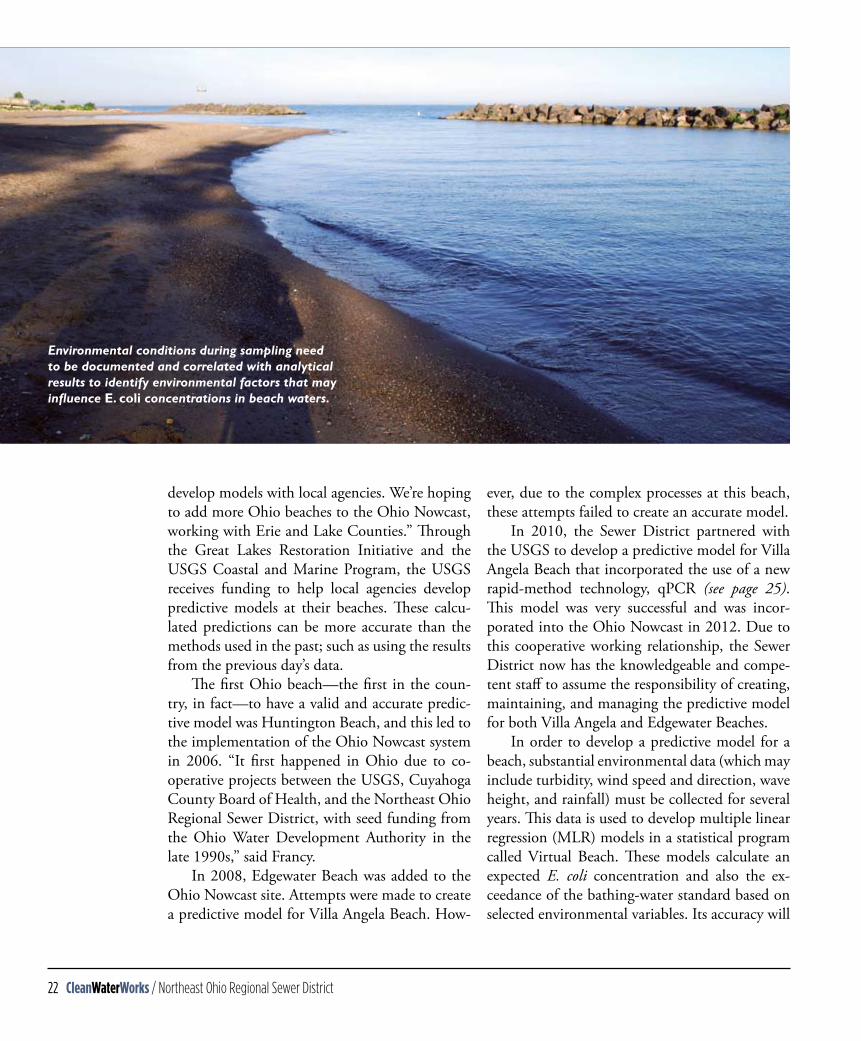
Environmental conditions during sampling need to be documented and correlated with analytical results to identify environmental factors that may influence E. coli concentrations in beach waters.
Northeast Ohio Regional Sewer District / CleanWaterWorks �3
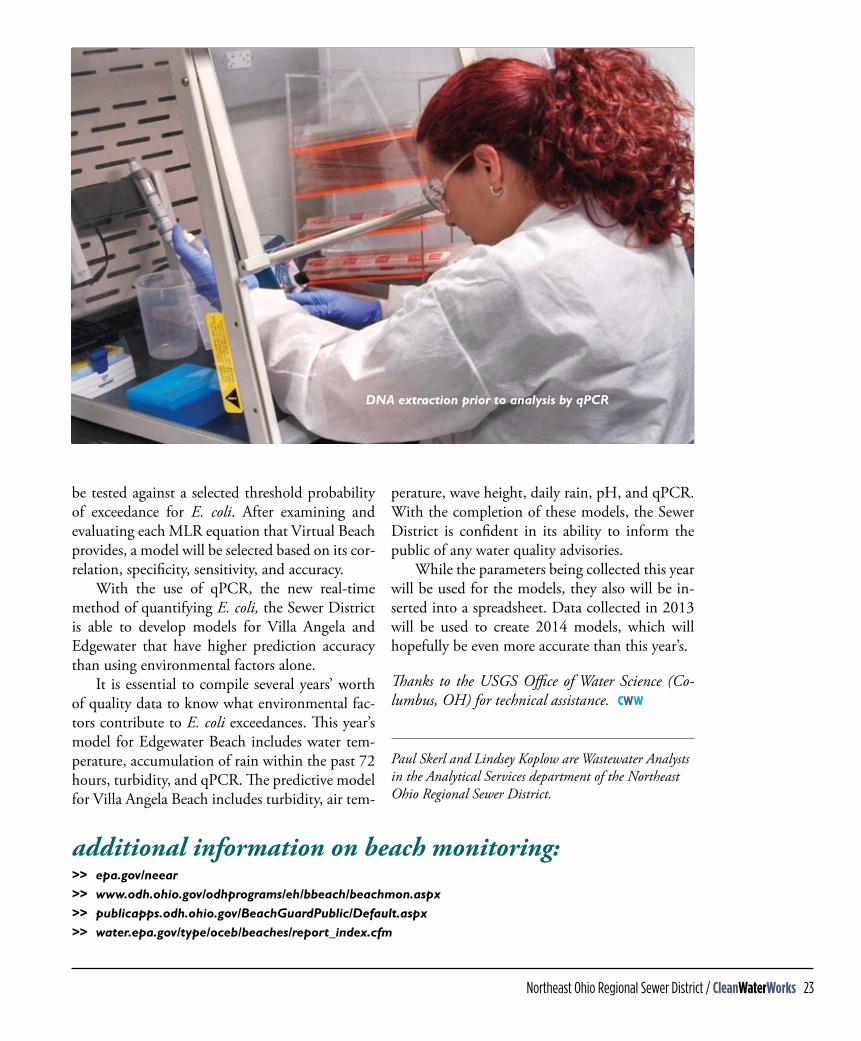
be tested against a selected threshold probability of exceedance for E. coli. After examining and evaluating each MLR equation that Virtual Beach provides, a model will be selected based on its cor-relation, specificity, sensitivity, and accuracy. With the use of qPCR, the new real-time method of quantifying E. coli, the Sewer District is able to develop models for Villa Angela and Edgewater that have higher prediction accuracy than using environmental factors alone. It is essential to compile several years’ worth of quality data to know what environmental fac-tors contribute to E. coli exceedances. This year’s model for Edgewater Beach includes water tem-perature, accumulation of rain within the past 72 hours, turbidity, and qPCR. The predictive model for Villa Angela Beach includes turbidity, air tem-
perature, wave height, daily rain, pH, and qPCR. With the completion of these models, the Sewer District is confident in its ability to inform the public of any water quality advisories. While the parameters being collected this year will be used for the models, they also will be in-serted into a spreadsheet. Data collected in 2013 will be used to create 2014 models, which will hopefully be even more accurate than this year’s.
Thanks to the USGS Office of Water Science (Co-lumbus, OH) for technical assistance. CWW
Paul Skerl and Lindsey Koplow are Wastewater Analysts in the Analytical Services department of the Northeast Ohio Regional Sewer District.
DNA extraction prior to analysis by qPCR
additionalinformationonbeachmonitoring:>> epa.gov/neear>> www.odh.ohio.gov/odhprograms/eh/bbeach/beachmon.aspx>> publicapps.odh.ohio.gov/BeachGuardPublic/Default.aspx>> water.epa.gov/type/oceb/beaches/report_index.cfm
�4 CleanWaterWorks / Northeast Ohio Regional Sewer District
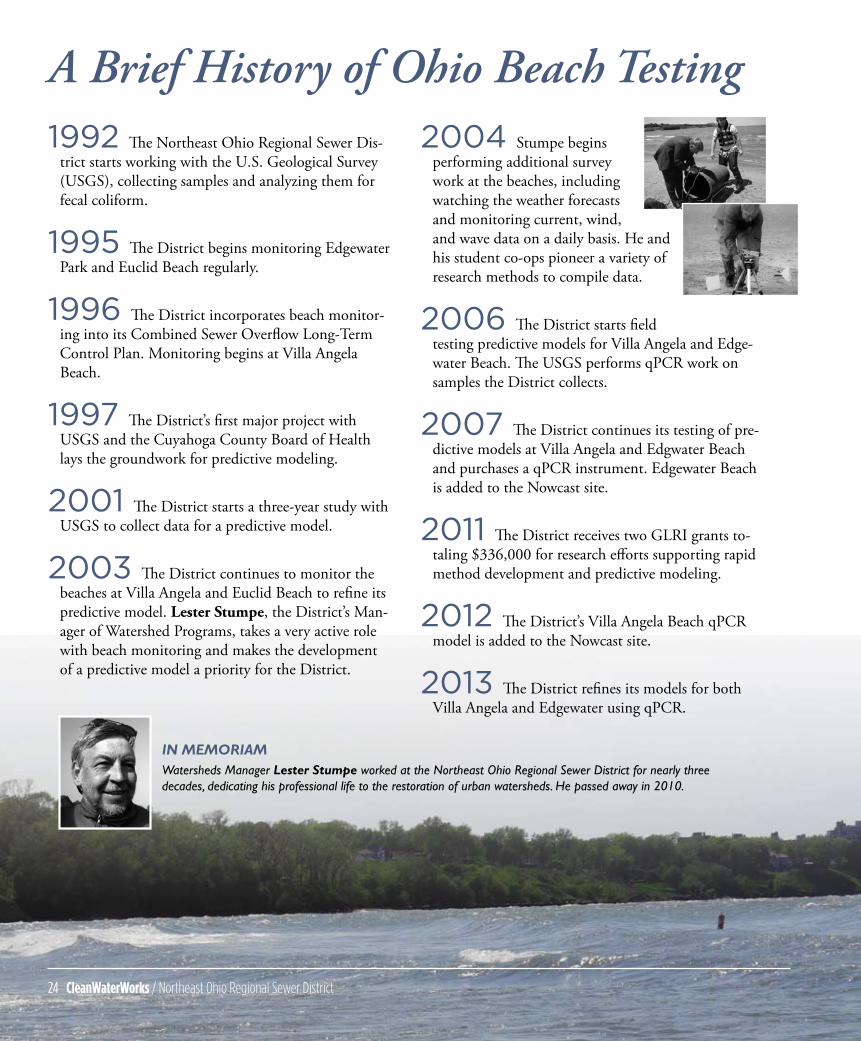
1992 The Northeast Ohio Regional Sewer Dis-trict starts working with the U.S. Geological Survey (USGS), collecting samples and analyzing them for fecal coliform.
1995 The District begins monitoring Edgewater Park and Euclid Beach regularly.
1996 The District incorporates beach monitor-ing into its Combined Sewer Overflow Long-Term Control Plan. Monitoring begins at Villa Angela Beach.
1997 The District’s first major project with USGS and the Cuyahoga County Board of Health lays the groundwork for predictive modeling.
2001 The District starts a three-year study with USGS to collect data for a predictive model.
2003 The District continues to monitor the beaches at Villa Angela and Euclid Beach to refine its predictive model. Lester Stumpe, the District’s Man-ager of Watershed Programs, takes a very active role with beach monitoring and makes the development of a predictive model a priority for the District.
2004 Stumpe begins performing additional survey work at the beaches, including watching the weather forecasts and monitoring current, wind, and wave data on a daily basis. He and his student co-ops pioneer a variety of research methods to compile data.
2006 The District starts field testing predictive models for Villa Angela and Edge-water Beach. The USGS performs qPCR work on samples the District collects.
2007 The District continues its testing of pre-dictive models at Villa Angela and Edgwater Beach and purchases a qPCR instrument. Edgewater Beach is added to the Nowcast site.
2011 The District receives two GLRI grants to-taling $336,000 for research efforts supporting rapid method development and predictive modeling.
2012 The District’s Villa Angela Beach qPCR model is added to the Nowcast site.
2013 The District refines its models for both Villa Angela and Edgewater using qPCR.
A Brief History of Ohio Beach Testing
IN MEMORIAMWatersheds manager Lester Stumpe worked at the northeast ohio Regional sewer District for nearly three decades, dedicating his professional life to the restoration of urban watersheds. He passed away in 2010.
�4 CleanWaterWorks / Northeast Ohio Regional Sewer District
Northeast Ohio Regional Sewer District / CleanWaterWorks ��
DATA PAGES
Deoxyribonucleic acid, or DNA, is the “building blocks” of life. It is a
molecule comprised of a double helix bound by proteins, and every living creature has specific gene sequences in their DNA unique to its species. (On April 25, 2013, DNA celebrated its 60th birthday since its first structural description in a 1953 scientific article written by James Watson and Francis Crick.)
Quantitative polymerase chain reaction, or qPCR, is a technique that copies (or amplifies) a specific region of DNA. The unique differences in DNA sequences are what make qPCR so precise and valuable.
The technique of polymerase chain reaction (PCR) was developed in the 1980s by Karry Mullis, and he earned a Nobel Prize for it. Since its discovery, PCR has been used exclusively in hospitals and research laboratories for work such as illness identification, gene presence/absence, DNA sequencing, forensics, and a plethora of other uses.
A general summary of the biochemistry behind qPCR starts with identifying a specific target DNA sequence. Next, a specialized reaction solution is created with the DNA protein building blocks, a fluorescent probe, and gene-specific primers. The solution is placed in a thermocycler equipped with a fluorescence detector, which cycles
through various heating and cooling cycles, creating copies of the DNA in real-time.
This whole process can be performed in within two to four hours which is what makes this technology such a valuable tool for real-time water quality monitoring and public notification.
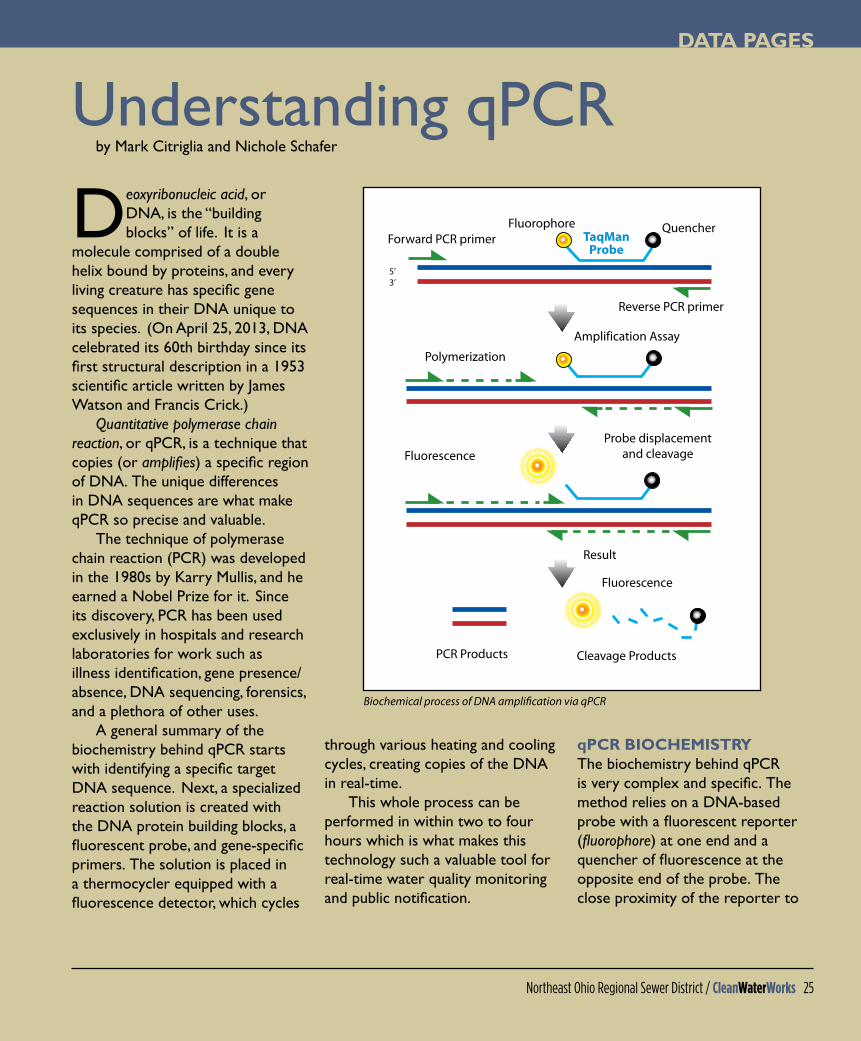
qPCR BIOCHEMISTRyThe biochemistry behind qPCR is very complex and specific. The method relies on a DNA-based probe with a fluorescent reporter (fluorophore) at one end and a quencher of fluorescence at the opposite end of the probe. The close proximity of the reporter to
Understanding qPCRby Mark Citriglia and Nichole Schafer
Forward PCR primerFluorophore Quencher
Reverse PCR primer
Polymerization
Amplification Assay
Fluorescence
Probe displacement and cleavage
Result
Fluorescence
PCR Products Cleavage Products
5’3’
TaqManProbe
Biochemical process of DNA amplification via qPCR
�� CleanWaterWorks / Northeast Ohio Regional Sewer District
the quencher prevents detection of its fluorescence. The temperature is increased and the double-stranded DNA is denatured into two single strands. The temperature is decreased, allowing the primers and probe to bind (or anneal) to the single-stranded DNA. As DNA synthesis (polymerization) occurs, the DNA polymerase replicates the DNA and, at the same time, displaces and degrades the probe, eliminating the close proximity of the reporter and quencher.
This process generates the emission of fluorescence, which can then be detected by the thermocycler platform. Temperature cycling occurs 40 to 45 times, allowing for exponential replication of the DNA. The fluorescence is reported as a value called the cycle threshold, or CT, value. The earlier the detection of the fluorescence, the lower CT value, indicating a greater initial concentration of the target of interest.
The concentration of bacteria or the number of cells present can be obtained by qPCR analysis using absolute or relative quantification. Absolute quantification is performed by calculating the unknown value of the sample from a standard curve. Relative quantification uses the change in gene expression in a given sample relative to another reference sample or control.
DEVELOPMENT OF RAPID METHODS (qPCR)The Beaches Environmental Assessment and Coastal Health Act, better known as the BEACH Act, was an amendment to the Clean Water Act (CWA) requiring uniform testing, monitoring, and public notification of bathing-beach water quality. The BEACH Act also provided funding for states and localities to perform research and improve monitoring and public notification. Much of the research performed because of this
amendment included developing rapid analytical methods for the detection of fecal indicating bacteria (FIB) and the implementation of predictive modeling.
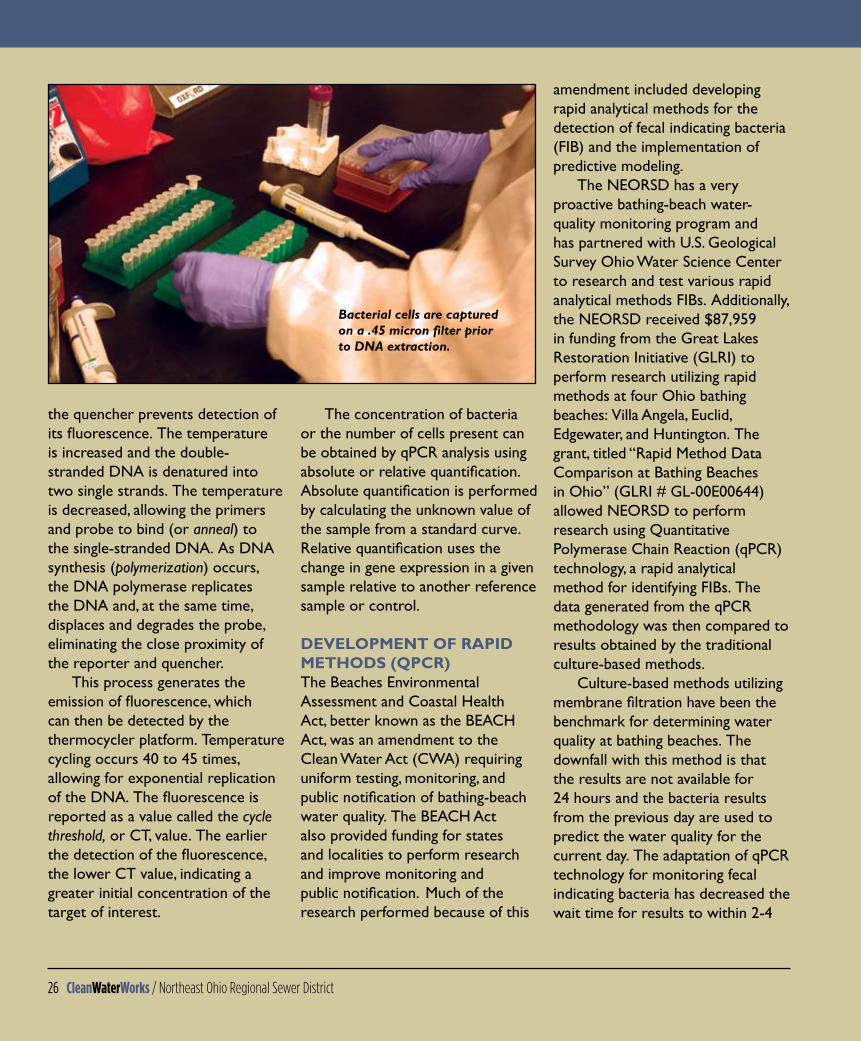
The NEORSD has a very proactive bathing-beach water-quality monitoring program and has partnered with U.S. Geological Survey Ohio Water Science Center to research and test various rapid analytical methods FIBs. Additionally, the NEORSD received $87,959 in funding from the Great Lakes Restoration Initiative (GLRI) to perform research utilizing rapid methods at four Ohio bathing beaches: Villa Angela, Euclid, Edgewater, and Huntington. The grant, titled “Rapid Method Data Comparison at Bathing Beaches in Ohio” (GLRI # GL-00E00644) allowed NEORSD to perform research using Quantitative Polymerase Chain Reaction (qPCR) technology, a rapid analytical method for identifying FIBs. The data generated from the qPCR methodology was then compared to results obtained by the traditional culture-based methods.
Culture-based methods utilizing membrane filtration have been the benchmark for determining water quality at bathing beaches. The downfall with this method is that the results are not available for 24 hours and the bacteria results from the previous day are used to predict the water quality for the current day. The adaptation of qPCR technology for monitoring fecal indicating bacteria has decreased the wait time for results to within 2-4
Bacterial cells are captured on a .45 micron filter prior to DNA extraction.
Northeast Ohio Regional Sewer District / CleanWaterWorks ��
DATA PAGES
hours, rather than 24 hours. Epidemiological studies
performed by the U.S. EPA under the BEACH Act have resulted in the change of the indicator organism from E. coli to Enterococci. The State of Ohio will be required to adopt this change in the near future. Until then the State of Ohio will continue to use E. coli as the indicator bacteria for beach advisories and water quality assessment. The single sample maximum (SSM) for E. coli is 235 cfu/100ml, and the SSM for Enterococci is 61 cfu/100ml. The NEORSD laboratory has been acquiring water quality data on both E. coli and Enterococci at Edgewater, Euclid, and Villa Angela beaches in preparation for changes to the water quality standards.
As part of the NEORSD GLRI grant, a total of 848 samples were collected at four Ohio beaches and analyzed for E. coli and Enterococci using qPCR technology and traditional methodology. The data acquired from the qPCR methods were compared to the data from the traditional methods to determine if there was a correlation between the data sets and to determine if qPCR technology proved to be a quicker and more accurate predictor of water quality at Villa Angela and Euclid beaches when compared to using the previous days E. coli as a predictor.
The data from the qPCR method and traditional method was compared by creating a scatter plot and analyzed using a Pearson Product-Moment Correlation Coefficient (PPMCC) to determine
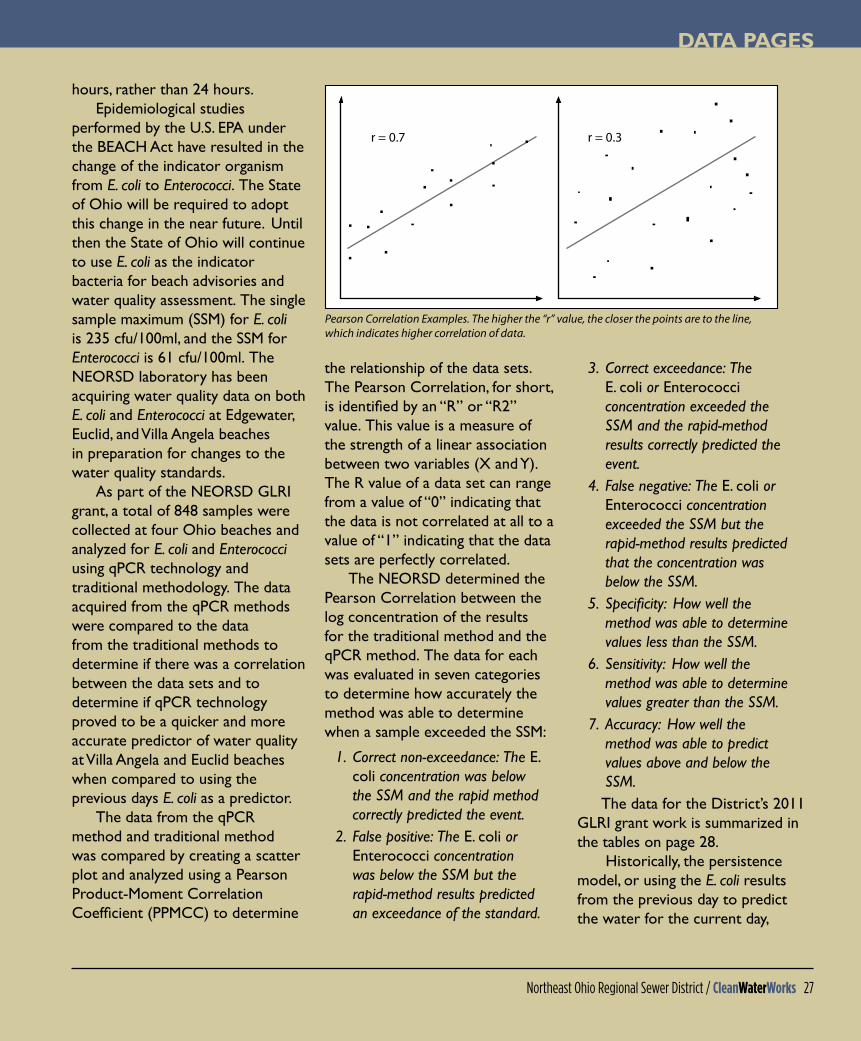
the relationship of the data sets. The Pearson Correlation, for short, is identified by an “R” or “R2” value. This value is a measure of the strength of a linear association between two variables (X and Y). The R value of a data set can range from a value of “0” indicating that the data is not correlated at all to a value of “1” indicating that the data sets are perfectly correlated.
The NEORSD determined the Pearson Correlation between the log concentration of the results for the traditional method and the qPCR method. The data for each was evaluated in seven categories to determine how accurately the method was able to determine when a sample exceeded the SSM:
1. Correct non-exceedance: The E. coli concentration was below the ssm and the rapid method correctly predicted the event.
2. False positive: The E. coli or Enterococci concentration was below the ssm but the rapid-method results predicted an exceedance of the standard.
3. Correct exceedance: The E. coli or Enterococci concentration exceeded the ssm and the rapid-method results correctly predicted the event.
4. False negative: The E. coli or Enterococci concentration exceeded the ssm but the rapid-method results predicted that the concentration was below the ssm.
5. Specificity: How well the method was able to determine values less than the ssm.
6. sensitivity: How well the method was able to determine values greater than the ssm.
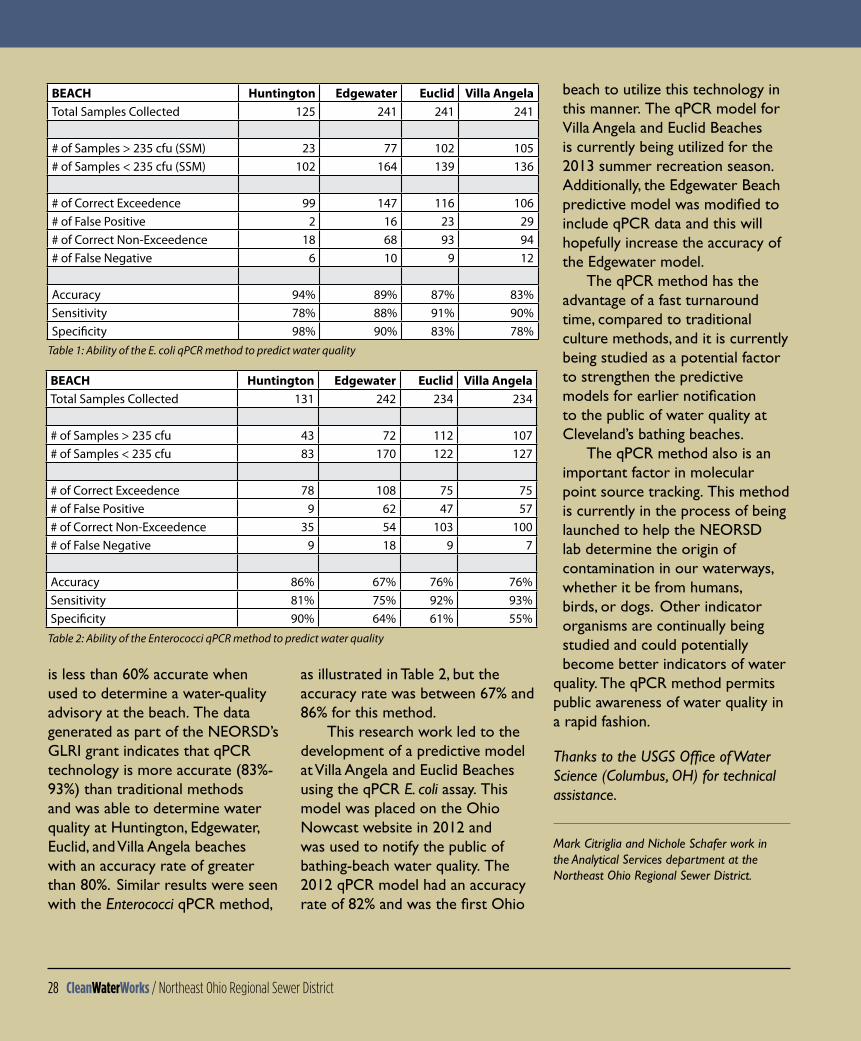
7. Accuracy: How well the method was able to predict values above and below the ssm.The data for the District’s 2011
GLRI grant work is summarized in the tables on page 28.
Historically, the persistence model, or using the E. coli results from the previous day to predict the water for the current day,
r = 0.7 r = 0.3
Pearson Correlation Examples. The higher the “r” value, the closer the points are to the line, which indicates higher correlation of data.
�� CleanWaterWorks / Northeast Ohio Regional Sewer District
is less than 60% accurate when used to determine a water-quality advisory at the beach. The data generated as part of the NEORSD’s GLRI grant indicates that qPCR technology is more accurate (83%-93%) than traditional methods and was able to determine water quality at Huntington, Edgewater, Euclid, and Villa Angela beaches with an accuracy rate of greater than 80%. Similar results were seen with the Enterococci qPCR method,
as illustrated in Table 2, but the accuracy rate was between 67% and 86% for this method.
This research work led to the development of a predictive model at Villa Angela and Euclid Beaches using the qPCR E. coli assay. This model was placed on the Ohio Nowcast website in 2012 and was used to notify the public of bathing-beach water quality. The 2012 qPCR model had an accuracy rate of 82% and was the first Ohio
beach to utilize this technology in this manner. The qPCR model for Villa Angela and Euclid Beaches is currently being utilized for the 2013 summer recreation season. Additionally, the Edgewater Beach predictive model was modified to include qPCR data and this will hopefully increase the accuracy of the Edgewater model.
The qPCR method has the advantage of a fast turnaround time, compared to traditional culture methods, and it is currently being studied as a potential factor to strengthen the predictive models for earlier notification to the public of water quality at Cleveland’s bathing beaches.
The qPCR method also is an important factor in molecular point source tracking. This method is currently in the process of being launched to help the NEORSD lab determine the origin of contamination in our waterways, whether it be from humans, birds, or dogs. Other indicator organisms are continually being studied and could potentially become better indicators of water
quality. The qPCR method permits public awareness of water quality in a rapid fashion.
Thanks to the USGS Office of Water science (Columbus, oH) for technical assistance.
mark Citriglia and nichole schafer work in the Analytical services department at the northeast ohio Regional sewer District.
Beach huntington edgewater euclid villa angelaTotal Samples Collected 125 241 241 241
# of Samples > 235 cfu (SSM) 23 77 102 105# of Samples < 235 cfu (SSM) 102 164 139 136
# of Correct Exceedence 99 147 116 106# of False Positive 2 16 23 29# of Correct Non-Exceedence 18 68 93 94# of False Negative 6 10 9 12
Accuracy 94% 89% 87% 83%Sensitivity 78% 88% 91% 90%Specificity 98% 90% 83% 78%
Beach huntington edgewater euclid villa angelaTotal Samples Collected 131 242 234 234
# of Samples > 235 cfu 43 72 112 107# of Samples < 235 cfu 83 170 122 127
# of Correct Exceedence 78 108 75 75# of False Positive 9 62 47 57# of Correct Non-Exceedence 35 54 103 100# of False Negative 9 18 9 7
Accuracy 86% 67% 76% 76%Sensitivity 81% 75% 92% 93%Specificity 90% 64% 61% 55%
Table 1: Ability of the E. coli qPCR method to predict water quality
Table 2: Ability of the Enterococci qPCR method to predict water quality

Your Sewer District ...Keeping our Great Lake great.
neorsd.org/cleanlake facebook.com/yoursewerdistrict
Project clean lake is the program that will enable the northeast
ohio regional Sewer District to meet clean Water act standards and address water quality issues caused
by raw sewage that overflows into the environment when it rains.
at the heart of Project clean lake is the construction of large-
scale storage tunnels (utilizing equipment like the 300,000-pound
cutting head pictured below) and enhancements to our three wastewater treatment plants.
Project clean lake will significantly mitigate pollution in lake erie and reduce basement flooding, sewer backups, and beach closings.

30 CleanWaterWorks / Northeast Ohio Regional Sewer District
How many beach cleanups did you hold in 2012?
Drink Local. Drink Tap. held seven beach clean-ups last year, and we are planning the same amount in 2013.
Do you know how much trash you’ve collected over the years?
Throughout the years, we have collected thousands of pounds of trash. At our most recent clean-up in April, we collected nearly 350 pounds.
What is the most common piece of trash your team collects?
Cigar tips are the most common piece trash we find. At one clean-up, we counted more than 3,000 of them.
What’s a typical reaction of a first-time volunteer?
They are excited to participate in the event and are really surprised by the number of plastic items they collect.
What is the strangest thing you’ve ever uncovered at a cleanup?
We find so many strange things at the beaches. I don’t know if it’s the strangest, but the most ironic item was a vacuum cleaner. Here we were cleaning a beach and a housecleaning item was the litter!
What does it mean to you to be involved with this work?
These activities remind me why I love living in Cleveland. The teamwork and people wanting to do something positive for their community always energizes me. Not only are the volunteers taking time out of their day to make an impact by cleaning up trash, they are also showing the rest of the community how important it is to think about how we impact or environment. We all can make a difference.
drinklocaldrinktap.org
In 2011, Babette Oestreicher was named Watershed Coordinator for Tinker’s Creek Watershed Partners, a non-profit organization created to protect and restore water quality and habitats of the Cuyahoga River’s largest tributary. She also volunteers as the Beach Clean-Up Manager for Drink Local. Drink Tap., an area non-profit that promotes local freshwater resources.
Q&Aby Jennifer Elting
An interview with BabetteOestreicher of DrinkLocal.DrinkTap.
GU
RU
PR
ASA
D G
AN
GA
IAH

If your company is a small construction or engineering firm or a provider of goods and services, we invite you to apply for our Business Opportunity Program.
Register at neorsd.org/opportunitytoday!
DOES OUR WORK MEANMORE OPPORTUNITYFOR YOUR BUSINESS?
CleanWaterWorks web extras:Euclid Creek and the Beaches It is difficult to say how the waters of Euclid Creek affect the bathing waters at Villa Angela and Euclid Beach. The interac-tion between creek flow, wind direction, and Lake Erie currents is hard to quantify and correlate. Historical data suggests that rainfall is highly correlated with the E. coli densities.
Velocity Vectors The Sewer District partnered with USGS to perform a flow-monitoring study that included mapping velocity vectors and water qual-ity parameters. The goal was to determine the spatial distributions of water quality and nearshore currents surrounding Euclid Creek and Villa Angela Beach.
Readthefullstoriesatneorsd.org/cleanwaterworks
Presorted StandardU.S. Postage
PaidCleveland, OHPermit # 3897
CleanWaterWorksNortheast Ohio Regional Sewer District3900 Euclid AvenueCleveland, Ohio 44115-2506
Learn more: wheredoesitgo.org | Watch: neorsd.org/videos | Tours: neorsd.org/request
Your Sewer District . . . Keeping our Great Lake great.