clean water fund performance report 2020
TRANSCRIPT

Clean Water Fund Performance ReportA report of Clean Water Funds invested, actions taken and outcomes achieved
2020lrp-f-1sy20

2020 Clean Water Fund Performance Report | www.legacy.leg.mn
February 2020
More information about the measures summarized in this publication can be found on the Minnesota’s Legacy Website at www.legacy.leg.mn/funds/clean-water-fund.
Project Team: Pam Anderson (MPCA), Matt Drewitz (BWSR), Bill Dunn (MPCA), Tannie Eshenaur (MDH), Suzanne Hanson (MPCA), David L. Miller (MPCA), Katie Nyquist (MDH), Paul Putzier (DNR), Emily Resseger (MCES), Lanya Ross (MCES), Margaret Wagner (MDA), Marcey Westrick (BWSR)
Clean Water Fund Interagency Coordination Team: Angie Becker Kudelka (BWSR), Chris Elvrum (MDH), Jeff Freeman (PFA), Katrina Kessler (MPCA), Sam Paske (Met Council), Whitney Place (MDA), Jess Richards (MDNR)
Editing: Doug Schultz (MDH)
Designers: Katie Nyquist (MDH), Frieda von Qualen (MDH)
This publication can be made available in other formats, including Braille, large type, computer disk or audio tape, upon request.
Minnesota Pollution Control Agency Minnesota Department of Natural Resources Minnesota Department of Agriculture Minnesota Department of Health Minnesota Board of Soil and Water Resources Minnesota Public Facilities Authority

2020 Clean Water Fund Performance Report | www.legacy.leg.mn
Table of contents
Protecting and restoring Minnesota’s waters for generations to come . . . . . . . . . . . . . . . . . . . . . . . . . . . . . . . 1
Minnesota’s Clean Water Mission and Goals . . . . . . . . . . 2
Report organization . . . . . . . . . . . . . . . . . . . . . . . . . . . . . . . . . 3
2020 Clean Water Fund Report Card . . . . . . . . . . . . . . . . . 4
Investment measures . . . . . . . . . . . . . . . . . . . . . . . . . . . . . . . 7
Total dollars appropriated . . . . . . . . . . . . . . . . . . . . . . . . . . . 8
Total dollars invested by watershed or statewide . . . . 10
Total dollars awarded . . . . . . . . . . . . . . . . . . . . . . . . . . . . . . 12
Dollars leveraged . . . . . . . . . . . . . . . . . . . . . . . . . . . . . . . . . . 13
Surface water quality measures . . . . . . . . . . . . . . . . . . . . 14
Major watersheds monitored . . . . . . . . . . . . . . . . . . . . . . . 15
Watersheds monitored by local partners . . . . . . . . . . . . 17
Nonpoint source BMP implementation . . . . . . . . . . . . . 19
Municipal infrastructure projects implementation . . . 21
Surface water health . . . . . . . . . . . . . . . . . . . . . . . . . . . . . . . 23
Lake and stream water quality . . . . . . . . . . . . . . . . . . . . . . 26
Waters restored . . . . . . . . . . . . . . . . . . . . . . . . . . . . . . . . . . . . 29
Mercury trends . . . . . . . . . . . . . . . . . . . . . . . . . . . . . . . . . . . . 31
Municipal wastewater phosphorus trend . . . . . . . . . . . 33
Drinking and groundwater measures . . . . . . . . . . . . . . . 35
Source water protection plans and implementation . 36
Source water protection grants . . . . . . . . . . . . . . . . . . . . . 38
Nitrate monitoring and reduction by local partners . 39
Contaminants of emerging concern . . . . . . . . . . . . . . . . 42
County atlases . . . . . . . . . . . . . . . . . . . . . . . . . . . . . . . . . . . . . 44
Long-term monitoring network wells . . . . . . . . . . . . . . . 46
Unused groundwater wells sealed . . . . . . . . . . . . . . . . . . 48
Land use in DWSMAs . . . . . . . . . . . . . . . . . . . . . . . . . . . . . . . 49
Groundwater quality . . . . . . . . . . . . . . . . . . . . . . . . . . . . . . . 51
Source water quality for community water systems . 55
Nitrate and arsenic concentrations in new wells . . . . . 57
Groundwater levels . . . . . . . . . . . . . . . . . . . . . . . . . . . . . . . . 59
Water efficiency . . . . . . . . . . . . . . . . . . . . . . . . . . . . . . . . . . . . 61
Social measures and external drivers . . . . . . . . . . . . . . . 63
Social measures . . . . . . . . . . . . . . . . . . . . . . . . . . . . . . . . . . . . 64
External drivers . . . . . . . . . . . . . . . . . . . . . . . . . . . . . . . . . . . . 68

2020 Clean Water Fund Performance Report | www.legacy.leg.mn 1
Protecting and restoring Minnesota’s waters for generations to come
Minnesotans value clean, safe, and abundant water. In 2008, Minnesota residents voted for the Clean Water Land and Legacy Amendment, increasing their own sales tax and making a strong commitment to clean water in Minnesota. Here are some accomplishments since the amendment passed:
• All major watersheds in Minnesota have been assessed. We now know the clean water challenges we face.
• We have restored water quality in 50 lakes and streams. We are beginning to turn the tide.
• Vulnerable municipal water systems are engaged in protecting their source water.
• Over 30,000 private wells in 50 counties have been tested for nitrate.
• 500,000 acres on almost 800 farms now meet agricultural water quality certification standards.
• The average use of water per person in Minnesota is down by 20% over the last eight years.
• Municipal wastewater treatment upgrades have reduced phosphorus discharges by over 139,000 pounds per year.
Protection and restoration of Minnesota’s waters requires a systematic approach. Minnesota is focusing on watersheds as the way to organize water work. This approach inspires and supports local and state partnerships and incorporates a wide range of issues, including water quality and quantity, groundwater, drinking water, habitat and recreation.
A foundational set of tools, reports and plans now support the systematic targeting of Clean Water Fund activities. Watershed Restoration and Protection Strategies (WRAPS) provide details on water quality issues and identify what needs to be done to clean up and protect our surface waters. Groundwater Restoration and Protection Strategies (GRAPS) outline groundwater issues and strategies to prevent overuse and contamination of groundwater and protect private and municipal wells that provide drinking water. Local comprehensive watershed plans, known as “One Watershed One Plan,” use the WRAPS and GRAPS reports to create an action plan that will make positive changes in local watersheds that will lead to a better clean water world.
As we enter the second decade of the amendment, we continue to innovate and enhance our efforts. A decade of experience is paying off as we put new science into practice and shift more dollars into implementation. We should remember that it took us 150 years of land and water alterations to get us into our present situation. It will take a concerted effort over many years to significantly improve our water resources across the state. The Clean Water Fund alone will not be sufficient to address all the water challenges in the state. We need to continue to innovate, collaborate and leverage other resources to make a significant difference. Along the way, we will also enhance economic opportunity, recreational enjoyment, wild habitats and the quality of life of all Minnesotans.

2 2020 Clean Water Fund Performance Report | www.legacy.leg.mn
Minnesota’s Clean Water Mission and Goals
The Clean Water Council has worked with stakeholders to develop a mission, goals and objectives (shown below) for the Clean Water Fund. This framework can help highlight the importance of the outcomes and actions profiled in this performance report. For example, the “source water quality for community water systems” outcome and the “land use in drinking water supply management areas” action both directly relate to the first goal: Drinking water is safe for everyone, everywhere in Minnesota.
Mission
Protect and restore Minnesota’s waters for generations to come.
Goals and Objectives
Drinking water is safe for everyone, everywhere in Minnesota
• Protect public water supplies
• Ensure private well users have safe water
Groundwater is clean and available
• Improve and protect groundwater quality
• Ensure sustainable long-term trends in aquifer levels
• Avoid adverse impacts to surface water features due to groundwater use
Surface waters are swimmable and fishable
• Prevent and reduce pollution of surface waters
• Maintain and improve the health of aquatic ecosystems
• Protect and restore hydrologic systems
Minnesotans value water and take actions to sustain and protect it
• Build capacity of local communities to protect and sustain water resources
• Encourage systems and approaches that support, protect, and improve water
• Provide education and outreach to inform Minnesotans’ water choices
• Encourage citizen and community engagement on water issues

2020 Clean Water Fund Performance Report | www.legacy.leg.mn 3
Report organization
This report provides a high-level overview of Minnesota’s performance so far in restoring and protecting the quality of the state’s surface water, groundwater and drinking water resources using Clean Water Fund dollars. Published every two years, the report highlights:
• Outcome measures to track progress on improving the quality of our surface and groundwater.
• Action measures to track where agency and partner activities are occurring with Clean Water Fund dollars to protect surface and groundwater, including how effectively agencies are completing the work to achieve Clean Water Goals.
• Investment measures to track where Clean Water Fund money is spent and how spending patterns are changing, including tracking where other funds are leveraged to extend the work done to meet Clean Water Goals.
This report presents a series of measure profiles that provide a snapshot of progress to date and how Clean Water Fund dollars are spent. These profiles are organized into three sections: surface water quality measures, drinking and groundwater protection measures and investment measures.
The measures used in this report are designed to remain constant over time to make it easy to identify where change is occurring. However, at times, measures may need to be modified as our knowledge and understanding expands and we develop new, more effective approaches. The procedures used to produce the measures in this report and how they have changed over time, are documented in a separate metadata document available at Clean Water Fund Performance Reports (www.legacy.mn.gov/funds/clean-water-fund/clean-water-fund-performance-reports).
Each measure profile includes the following:
Figure 1. Each measure profile includes measure type, measure narrative, a graphic and a qualitative score.

4 2020 Clean Water Fund Performance Report | www.legacy.leg.mn
Measure Status Trend DescriptionTotal Clean Water Fund dollars appropriated by activity
$1.2B has been appropriated to the Clean Water Fund from FY10-21, ranging from $157M in FY 10-11 to $261M in FY 20-21.
FY 14-15: $182.5M FY 16-17: $228.3M FY 18-19: 201.4M FY 20-21:$261.0M
Appropriation levels will vary by biennium and the strength of the economy. FY10-19 funds have been allocated, while FY20-21 allocations are in progress.
Total Clean Water Fund dollars per watershed or statewide by activity
Most watersheds in the state are benefiting from local and statewide projects.
For FY10-19, all 80 watersheds benefited from Clean Water Fund supported activities. Implementation activities comprise the largest portion of spending in watersheds statewide.
Total Clean Water Fund dollars awarded in grants and contracts to non-state agency partners
$491M was awarded in grants and contracts to non-state agency partners in FY10-19.
About 82% of grant and contract awards are for implementation activities; 50% of total FY10-19 appropriations were awarded to non-state agency partners.
Total dollars leveraged by Clean Water Fund
Required Clean Water match funds were met and exceeded. Leveraged funds trended up in FY18-19.
Required Clean Water match funds were met and exceeded.
2020 Clean Water Fund Report Card
Minnesotans care deeply about the state’s natural resources and cultural heritage. In 2008, we voted to increase our sales tax and pass the Clean Water, Land and Legacy Amendment, providing 25 years of constitutionally-dedicated funding for clean water, habitat, parks and trails, and the arts.
The following report card highlights work done using Clean Water Land and Legacy Amendment dollars for Minnesota’s many water resources. The Report Card tracks a suite of performance measures that are described in the full report that follows. It provides a qualitative assessment of how well actions are being implemented and what outcomes are being achieved.
The legend shows the symbols used to describe how measures were scored. Measures are scored according to their status as of the end of fiscal year 2019 (FY19) and for their trend over time. Scores were developed using data-informed professional judgment of agency technical staff and managers.
Action status legend
Investment Measures
Symbol MeaningWe are making good progress/meeting the target
We anticipate difficulty; it is too early to assess; or there is too much variability across regions to assess
Progress is slow/we are not meeting the target; or the activity or target is not commensurate with the scope of the problems
Symbol MeaningWater quality is high – we are on track to meet long-term water resource needs and citizen expectations
Water quality needs improvement or it is too early to assess – it is unclear if we will meet long-term water resource needs and citizen expectations; and/or water quality varies greatly between regions
Water quality is under intense pressure – long-term water resource needs and/or citizen expectations exceed current efforts to meet them
Symbol Meaning
Improving trend
No change
Declining trend
NEI Not enough information to determine trend at this time
Outcome status legend Trend legend
INVE
STM
ENTS

2020 Clean Water Fund Performance Report | www.legacy.leg.mn 5
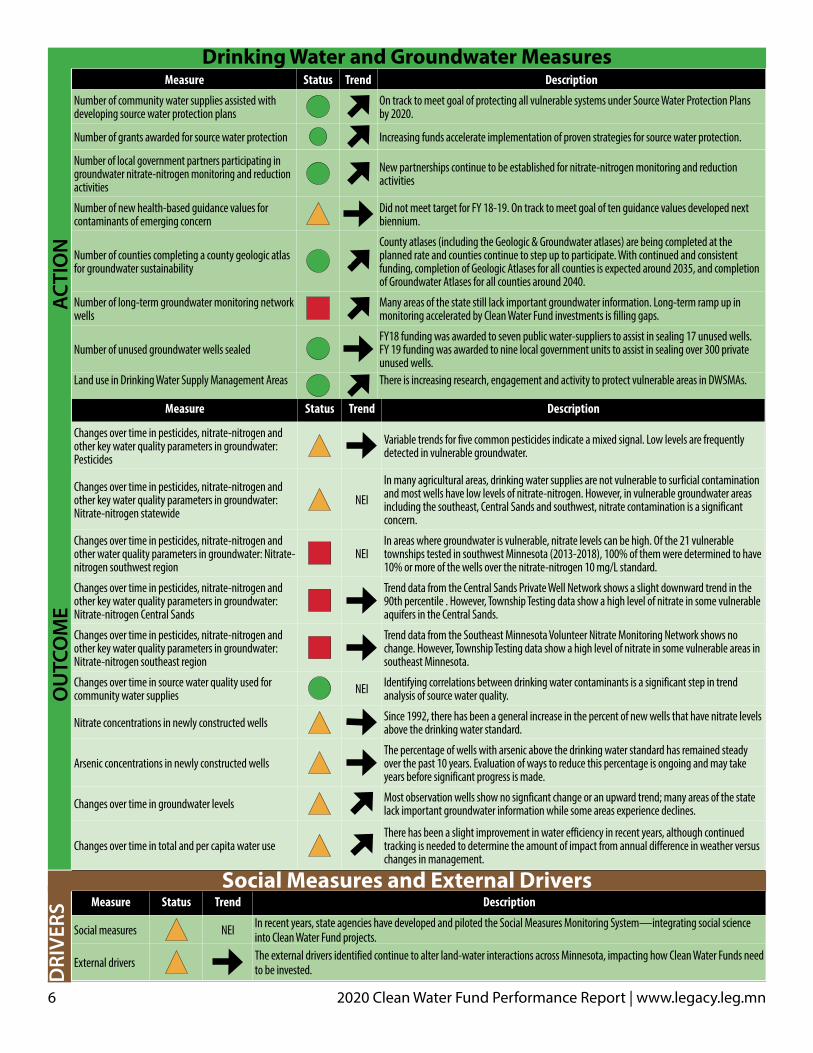
Measure Status Trend Description
Rate of impairment/unimpairment of surface water statewide and by watershed: Stream aquatic life
NEIWater quality varies greatly by region. In general, better quality is found in the north when land is less disturbed. It is unclear whether long-term goals will be met.
Rate of impairment/unimpairment of surface water statewide and by watershed: Stream swimming
NEIWater quality varies greatly by region. In general, better quality is found in the north when land is less disturbed. It is unclear whether long-term goals will be met.
Rate of impairment/unimpairment of surface water statewide and by watershed: Lake swimming
NEIWater quality varies greatly by region. In general, better quality is found in the north where land is less disturbed. It is unclear whether long-term goals will be met.
Changes over time in key water quality parameters for lakes and streams: Lake clarity
NEI There are improving trends in lake water clarity in more lakes than not.
Changes over time in key water quality parameters for lakes and streams: Nutrients and sediment in large rivers
NEIIn general, concentrations in phosphorus and sediment are improving while nitrates are getting worse in surface water.
Changes over time in key water quality parameters for lakes and streams: Pesticides in streams
NEIDetections in streams vary greatly as a result of hydrologic and agronomic conditions; exceedances of pesticide water quality standards are rare.
Changes over time in key water quality parameters for lakes and streams: Pesticides in lakes
NEI Detections in lakes vary by region; detections in lakes rarely exceed water quality standards.
Changes over time in key water quality parameters for lakes and streams: Chloride in large rivers
Chloride concentrations continue to increase along all major rivers in the Twin Cities metropolitan area. Trends for chloride are limited to the metropolitan area.
Number of previous impairments now meeting water quality standards due to corrective actions
Although many projects are making progress in improving water quality, more waterbodies are being listed as impaired relative to the slower rate of waterbodies being restored.
Mercury in fish
Mercury in game fish is not yet responding to decreases in local mercury emissions, although these reductions likely have prevented a steeper upward trend. Global emissions have increased. The time lag between emission reductions and response is likely several decades. It is too soon to see a measurable response in fish mercury levels. Long-term and consistent monitoring is necessary to track changes in fish tissue.
Mercury emissionsSignificant progress has been made reducing mercury emissions from power plants. To meet Minnesota’s 2025 emissions goal, significant reduction of mercury emission from the mining sector and further reduction of mercury use in various prodcuts will be necessary.
Municipal wastewater phosphorus discharge trendSignificant phosphorus load reductions have been achieved through regulatory policy, infrastructure investments, improved technology and optimization of operations.
Surface Water Measures
ACTI
ON
OU
TCO
ME
Measure Status Trend Description
Percent of monitoring addressing state and local needs
Nearly half of watersheds met goals for addressing state and local needs for monitoring. Ongoing program development is aimed to ensure local needs are identified for monitoring.
Local partner participation in monitoring efforts As of 2019, all programs are meeting participatory goals.
Number of nonpoint source best management practices implemented with Clean Water funding and estimated pollutant load reductions
Although funding has increased and there is a continued increase in projects, practices and activities being implemented, the total request for projects has remained three times greater than available funds.
Number of municipal point source construction projects implemented with Clean Water Funding and estimated pollutant load reductions
Pace of awards is linked to permit cycles, compliance schedules and available Clean Water Funds. Applications exceed currently available funds.
6 2020 Clean Water Fund Performance Report | www.legacy.leg.mn
Measure Status Trend Description
Changes over time in pesticides, nitrate-nitrogen and other key water quality parameters in groundwater: Pesticides
Variable trends for five common pesticides indicate a mixed signal. Low levels are frequently detected in vulnerable groundwater.
Changes over time in pesticides, nitrate-nitrogen and other key water quality parameters in groundwater: Nitrate-nitrogen statewide
NEI
In many agricultural areas, drinking water supplies are not vulnerable to surficial contamination and most wells have low levels of nitrate-nitrogen. However, in vulnerable groundwater areas including the southeast, Central Sands and southwest, nitrate contamination is a significant concern.
Changes over time in pesticides, nitrate-nitrogen and other water quality parameters in groundwater: Nitrate-nitrogen southwest region
NEIIn areas where groundwater is vulnerable, nitrate levels can be high. Of the 21 vulnerable townships tested in southwest Minnesota (2013-2018), 100% of them were determined to have 10% or more of the wells over the nitrate-nitrogen 10 mg/L standard.
Changes over time in pesticides, nitrate-nitrogen and other key water quality parameters in groundwater: Nitrate-nitrogen Central Sands
Trend data from the Central Sands Private Well Network shows a slight downward trend in the 90th percentile . However, Township Testing data show a high level of nitrate in some vulnerable aquifers in the Central Sands.
Changes over time in pesticides, nitrate-nitrogen and other key water quality parameters in groundwater: Nitrate-nitrogen southeast region
Trend data from the Southeast Minnesota Volunteer Nitrate Monitoring Network shows no change. However, Township Testing data show a high level of nitrate in some vulnerable areas in southeast Minnesota.
Changes over time in source water quality used for community water supplies NEI Identifying correlations between drinking water contaminants is a significant step in trend
analysis of source water quality.
Nitrate concentrations in newly constructed wells Since 1992, there has been a general increase in the percent of new wells that have nitrate levels above the drinking water standard.
Arsenic concentrations in newly constructed wellsThe percentage of wells with arsenic above the drinking water standard has remained steady over the past 10 years. Evaluation of ways to reduce this percentage is ongoing and may take years before significant progress is made.
Changes over time in groundwater levels Most observation wells show no signficant change or an upward trend; many areas of the state lack important groundwater information while some areas experience declines.
Changes over time in total and per capita water useThere has been a slight improvement in water efficiency in recent years, although continued tracking is needed to determine the amount of impact from annual difference in weather versus changes in management.
Measure Status Trend Description
Number of community water supplies assisted with developing source water protection plans
On track to meet goal of protecting all vulnerable systems under Source Water Protection Plans by 2020.
Number of grants awarded for source water protection Increasing funds accelerate implementation of proven strategies for source water protection.
Number of local government partners participating in groundwater nitrate-nitrogen monitoring and reduction activities
New partnerships continue to be established for nitrate-nitrogen monitoring and reduction activities
Number of new health-based guidance values for contaminants of emerging concern
Did not meet target for FY 18-19. On track to meet goal of ten guidance values developed next biennium.
Number of counties completing a county geologic atlas for groundwater sustainability
County atlases (including the Geologic & Groundwater atlases) are being completed at the planned rate and counties continue to step up to participate. With continued and consistent funding, completion of Geologic Atlases for all counties is expected around 2035, and completion of Groundwater Atlases for all counties around 2040.
Number of long-term groundwater monitoring network wells
Many areas of the state still lack important groundwater information. Long-term ramp up in monitoring accelerated by Clean Water Fund investments is filling gaps.
Number of unused groundwater wells sealedFY18 funding was awarded to seven public water-suppliers to assist in sealing 17 unused wells. FY 19 funding was awarded to nine local government units to assist in sealing over 300 private unused wells.
Land use in Drinking Water Supply Management Areas There is increasing research, engagement and activity to protect vulnerable areas in DWSMAs.
Drinking Water and Groundwater MeasuresAC
TIO
NO
UTC
OM
E
Social Measures and External Drivers
DRI
VERS
Measure Status Trend Description
Social measures NEI In recent years, state agencies have developed and piloted the Social Measures Monitoring System —integrating social science into Clean Water Fund projects.
External drivers The external drivers identified continue to alter land-water interactions across Minnesota, impacting how Clean Water Funds need to be invested.

2020 Clean Water Fund Performance Report | www.legacy.leg.mn 7
Investment measures
The following four measures illustrate FY 10-19 Clean Water Fund investments to restore and protect surface water and drinking water.
Investments
1. Total dollars appropriated
2. Total dollars invested by watershed or statewide
3. Total dollars awarded
4. Dollars leveraged
8 2020 Clean Water Fund Performance Report | www.legacy.leg.mn
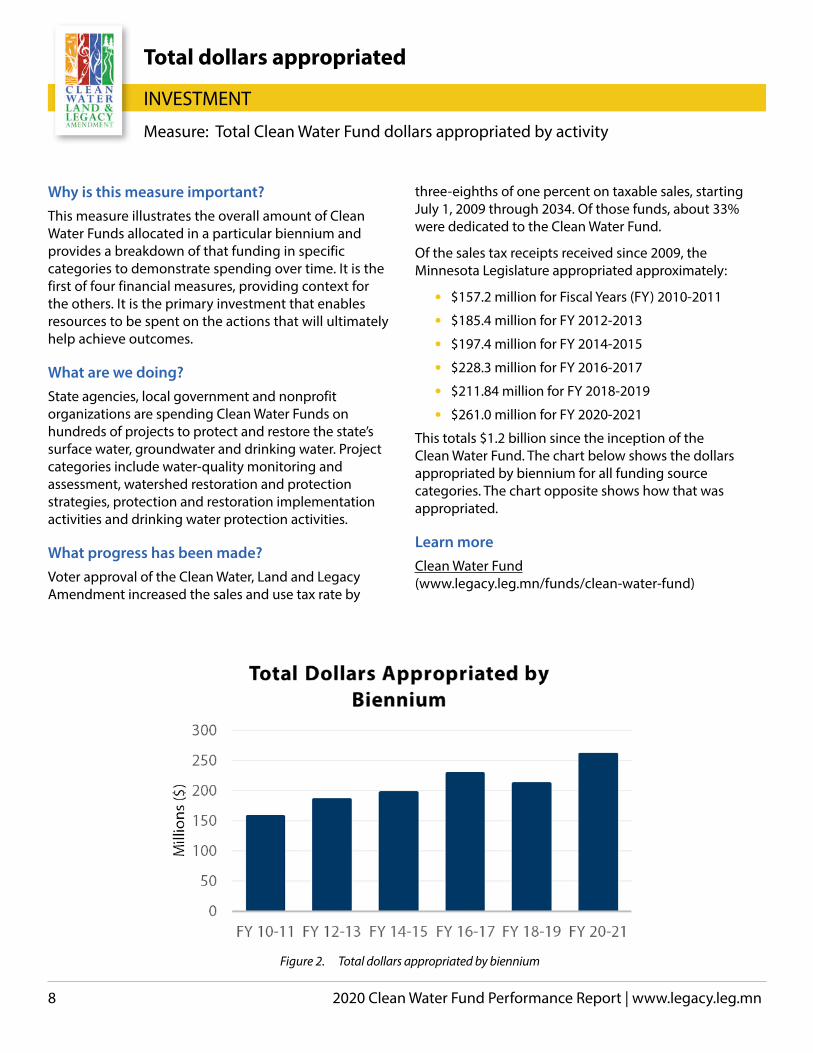
Figure 2. Total dollars appropriated by biennium
Total dollars appropriated
INVESTMENT
Measure: Total Clean Water Fund dollars appropriated by activity
Why is this measure important? This measure illustrates the overall amount of Clean Water Funds allocated in a particular biennium and provides a breakdown of that funding in specific categories to demonstrate spending over time. It is the first of four financial measures, providing context for the others. It is the primary investment that enables resources to be spent on the actions that will ultimately help achieve outcomes.
What are we doing? State agencies, local government and nonprofit organizations are spending Clean Water Funds on hundreds of projects to protect and restore the state’s surface water, groundwater and drinking water. Project categories include water-quality monitoring and assessment, watershed restoration and protection strategies, protection and restoration implementation activities and drinking water protection activities.
What progress has been made? Voter approval of the Clean Water, Land and Legacy Amendment increased the sales and use tax rate by
three-eighths of one percent on taxable sales, starting July 1, 2009 through 2034. Of those funds, about 33% were dedicated to the Clean Water Fund.
Of the sales tax receipts received since 2009, the Minnesota Legislature appropriated approximately:
• $157.2 million for Fiscal Years (FY) 2010-2011
• $185.4 million for FY 2012-2013
• $197.4 million for FY 2014-2015
• $228.3 million for FY 2016-2017
• $211.84 million for FY 2018-2019
• $261.0 million for FY 2020-2021
This totals $1.2 billion since the inception of the Clean Water Fund. The chart below shows the dollars appropriated by biennium for all funding source categories. The chart opposite shows how that was appropriated.
Learn more Clean Water Fund (www.legacy.leg.mn/funds/clean-water-fund)

2020 Clean Water Fund Performance Report | www.legacy.leg.mn 9
Figure 3. Clean Water Fund appropriations by category
Status Description
FY 10-11: $157.2M
FY 12-13: $185.4M
FY 14-15: $197.4M
FY 16-17: $228.3M
FY 18-19: $211.8M
FY 20-21:$261.0M
Appropriation levels will vary by biennium and the strength of the economy. FY 10-19 funds have been allocated, while FY 20-21 allocations are in progress.

10 2020 Clean Water Fund Performance Report | www.legacy.leg.mn
Total dollars invested by watershed or statewide
INVESTMENT
Measure: Total dollars invested per watershed or statewide for: 1) monitoring/ assessment, 2) watershed restoration/protection strategies, 3) protection/restoration implementation activities and 4) drinking water protection
Why is this measure important? Many Minnesotans want to know how much money from the Clean Water Fund is being invested in their backyard. There is also Clean Water Fund work that has a statewide benefit. This measure tracks Clean Water Fund investments in each major watershed in the state, as well as investments on statewide activities that benefit all watersheds. It shows how the funds are being allocated geographically to support specific activities in four major activity categories:
• Water quality monitoring/assessment
• Watershed restoration/protection strategy development
• Restoration/protection implementation activities
• Drinking water protection
What are we doing? Hundreds of Clean Water Fund supported projects led largely by local governments are underway across the state. Funded activities include:
• Implementation of practices to clean up wastewater, stormwater and agricultural runoff
• Regular testing of water quality in lakes and rivers to help gauge the effectiveness of clean water practices
• Strategy development to guide effective watershed restoration and protection, as well as protection of and drinking water and groundwater
State agencies provide technical assistance and administrative oversight for all these activities. They include: Board of Water and Soil Resources, Department of Natural Resources, Department of Agriculture, Department of Health, Metropolitan Council, Pollution Control Agency, and Public Facilities Authority.
What progress has been made? For Fiscal Years (FY) 2010-2019, Clean Water Fund allocations to surface water and drinking water projects are benefiting most of the watersheds of the state. As noted above, these activities are being performed by local partners as well as state agencies.
Of the four activity categories, funding for implementation activities comprised the largest portion of spending statewide. However, the costs of implementation can vary significantly by watershed, depending on the type of project and the problem being addressed.
Learn more Clean Water Fund (www.legacy.leg.mn/funds/clean-water-fund)
Status Description
Most watersheds in the state are benefiting from local and statewide projects.
For FY 10-19, all 80 watersheds benefited from Clean Water Fund supported activities. Implementation activities comprise the largest portion of spending in watersheds statewide.

2020 Clean Water Fund Performance Report | www.legacy.leg.mn 11
Total FY 10-19 Clean Water Fund Dollars by Watershed
Figure 4. Combined watershed-specific projects, statewide activities and technical assistance that benefit all watersheds
Figure 5. Monitoring and assessment
Figure 6. Watershed restoration/protection strategies
Figure 7. Protection/restoration implementation activities
Figure 8. Drinking water protection

12 2020 Clean Water Fund Performance Report | www.legacy.leg.mn
Total dollars awarded
INVESTMENT
Measure: Total Clean Water Fund dollars awarded in grants and contracts to non-state agency partners
Why is this measure important? This measure tracks the amount of Clean Water Funds awarded in grants and contracts to external, non-state-agency partners to conduct a wide range of clean water activities. The measure provides context on funding distribution between state, federal and local agencies to perform Clean Water Fund supported work.
What are we doing? Hundreds of Clean Water Fund-supported projects, led largely by local government units, are underway across the state. Non-state-agency partners include cities, counties, soil and water conservation districts, watershed management organizations, federal agencies, universities, nonprofit organizations and private consulting firms working with local and state agencies.
Funded activities include implementation of practices to clean up wastewater, stormwater and agricultural runoff. They also include testing water quality to determine the health of lakes and rivers, strategy development to guide effective watershed restoration and protection, and implementation of source water protection plans for drinking water. Groundwater monitoring is also funded through Clean Water Fund dollars and is used to ensure drinking water and groundwater protection.
For all actions taken by local government units and other partners, state agencies provide monitoring activities, development of watershed protection and restorations strategies, as well as technical assistance and administrative oversight. The agencies include: the Board of Water and Soil Resources, Department of Natural Resources, Department of Agriculture, Department of Health, Metropolitan Council, Pollution Control Agency, and Public Facilities Authority.
What progress has been made? As shown in the pie chart, a total of $491 million in Clean Water Funds were awarded to non-state-agency partners from Fiscal Year (FY) 2010-2019, with the largest share of that going to protection and restoration implementation activities. This represents 50% of the total $1.2 billion in Clean Water Fund appropriations for those years.
Figure 9. The percentage of total grant and contract awards ($491 million) in FY 10-19 for each major Clean Water Fund-supported activity. Allocations to implementation activities are expected to stay steady or grow in future years as more projects move from strategy development to implementation.
The balance of remaining appropriations is largely used by state agencies to provide statewide monitoring, watershed protection and restoration strategy development, technical assistance, and oversight on Clean Water Fund-supported projects.
Note: Due to law, some funds are allocated in phases, and thus, over time the information in this measure will change.
Learn moreClean Water Fund (www.legacy.leg.mn/funds/clean-water-fund)
Status Description
$491M was awarded in grants and contracts to non-state agency partners in FY10-19.
About 82% of grant and contract awards are for implementation activities; 50% of total FY 10-19 appropriations were awarded to non-state agency partners.

2020 Clean Water Fund Performance Report | www.legacy.leg.mn 13
Figure 10. Total dollars leveraged by Clean Water Fund
Dollars leveraged
INVESTMENT
Measure: Total dollars leveraged by Clean Water Fund implementation activities
Why is this measure important? This measure describes how many total dollars supplement the Clean Water Fund dollars invested in projects in a given year. Throughout Minnesota, the demand for funding to protect and restore the water resources far exceeds the available dollars. The ability to use Clean Water Fund dollars to leverage local and other funds means millions more dollars are available—increasing the number of projects that are implemented and making projects more cost effective for communities.
What are we doing? Clean Water Fund grant programs fund actions to prevent polluted runoff from fields, streets, lawns, roofs and other similar sources. They also fund improvements to municipal wastewater and stormwater treatment.Partnerships with state agencies and various local units of government are critical to implement these water quality improving activities.
What progress has been made? During Fiscal Years (FY) 2018-2019, more than $50 million in state grants and loans were awarded to local governments (watershed management organizations, soil and water conservation districts, counties, etc.) for projects to reduce runoff from agricultural fields, streets, lawns and other similar sources. Local match and leveraged federal funds increased the project dollars available by $47 million.
During FY 2018-2019, more than $24.9 million in Clean Water Fund grants were awarded to improve municipal treatment facilities and to help small communities invest in new infrastructure. Local match and other funds increased the project dollars by $80.5 million.
As a result, during FY 2010-2019, more than $334 million were leveraged by Clean Water Fund, or 95 cents for every implementation dollar invested.
As shown in the chart to the right, total dollars leveraged has remained relatively flat in FY 2010-2017 compared to the increase of Clean Water Fund implementation funds. This is in part because BWSR has provided additional clarification to grantees on match requirements and
tracking, which has resulted in more moderate amounts of leveraged funds being reported over time. During the first reporting cycle for this report (FY 2010-2011), the ratio of leveraged funds for BWSR grant programs was much higher than it is today. In addition, leverage funding was further reduced by the elimination of the Clean Water Fund grant portion of the Minnesota Pollution Control Agency’s Clean Water Partnership Program.
In FY 2018-2019 changes to the Public Facility Authority grant programs included additional state bond funds, which resulted in a significant increase in leveraged funds for the biennium.
Learn more Clean Water Fund (www.legacy.leg.mn/funds/clean-water-fund)
Status Description
$334 million were leveraged by Clean Water Funds in FY 10-19, or 95 cents for every implementation dollar invested.
Required Clean Water match funds were met and exceeded.

14 2020 Clean Water Fund Performance Report | www.legacy.leg.mn
Surface water quality measures
The following eight measures illustrate important Clean Water Fund-supported actions and outcomes undertaken to protect Minnesota’s surface water quality.
Actions
1. Major watersheds monitored2. Watersheds monitored by local partners3. Nonpoint source BMP implementation4. Municipal infrastructure project implementation
Outcomes
5. Surface water health6. Lake and stream water quality7. Waters restored8. Mercury trends9. Municipal wastewater phosphorus trend

2020 Clean Water Fund Performance Report | www.legacy.leg.mn 15
Major watersheds monitored
ACTION
Measure: Percent of monitoring addressing state and local needs
Why is this measure important? Minnesotans want to know that their investments in water quality are making a difference. With the Clean Water Fund, Minnesota now has a comprehensive baseline assessment of conditions across the state. Similar to an annual visit to the doctor, this monitoring shows where work to protect or return the watersheds to healthy conditions is required. In Minnesota, the monitoring has shown that more restoration is necessary in the south and west, and more protection of resources in the north and east.
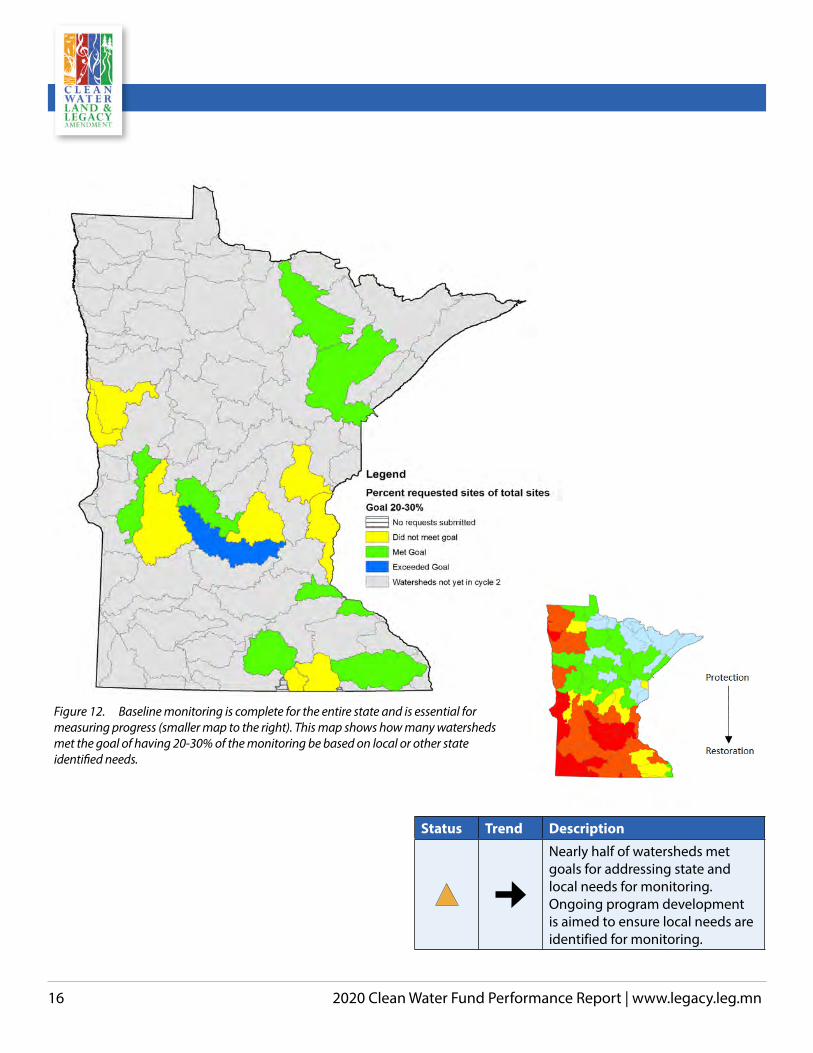
Figure 11. The MPCA and partner organizations evaluate water conditions, establish improvement goals and priorities and take actions designed to restore or protect water quality on a 10-year cycle.
This data is essential to help develop local plans for targeted implementation activities, and with time, will measure resulting changes in water quality. By returning to these watersheds to monitor after ten years, the Minnesota Pollution Control Agency (MPCA) can do a checkup and determine if the targeted implementation is resulting in changes in water quality. Without continued monitoring, there is no way to see if the rivers and lakes are meeting the goal of fishable and swimmable waters.
What are we doing?
The first round of watershed monitoring and assessment is complete. This provides the baseline for determining where waters need protection and restoration. The Watershed Restoration and Protection Strategy (WRAPS) document takes the monitoring data and turns it into the specific local strategies needed on the ground to protect and restore waters. This then feeds into local water planning and One Watershed One Plan (1W1P) to target local implementation activities in order to see improvement in water quality.
The MPCA is returning to watersheds to complete the second round of watershed-based lake and stream monitoring, which includes biological, fish contaminant, water quality, and pollutant load sampling. This monitoring is essential to measure progress in restoring and protecting lakes and streams. Additionally, the monitoring will fill gaps to guide local planning and implementation efforts and track long-term changes in water quality and biological communities over time.
As the MPCA returns to watersheds, the agency has reduced essential core monitoring to provide monitoring capacity for other state and local needs, such as to support permitting decisions, to address a local monitoring need, or address a gap identified in the WRAPS or 1W1P. MPCA has implemented this modified approach to planning and monitoring in watersheds for the next ten years of watershed monitoring around the state.
What progress has been made?MPCA has developed a process to solicit other state and local monitoring requests, and has worked with local and state partners to determine monitoring needs in these watersheds. The process is relatively new, with only three years to report, and adaptations are expected as the process matures. Requests vary across the state due to the unique aspects of each watershed and the needs of each watershed. For example, some watersheds are small or have few to no lakes and there are few additional local requests. Others are very large, with extensive stream and lake networks and there are many additional local requests. In some, agency-proposed sites meet the local needs, and there are no additional local requests.
Learn more• Clean Water Fund
(www.legacy.leg.mn/funds/clean-water-fund) • Find your watershed at Watersheds
(www.pca.state.mn.us/water/watersheds) • Learn when MPCA will be monitoring your
watershed at Watershed approach to restoring and protecting water quality (www.pca.state.mn.us/water/watershed-approach-restoring-and-protecting-water-quality)
16 2020 Clean Water Fund Performance Report | www.legacy.leg.mn
Status Trend Description
Nearly half of watersheds met goals for addressing state and local needs for monitoring. Ongoing program development is aimed to ensure local needs are identified for monitoring.
Figure 12. Baseline monitoring is complete for the entire state and is essential for measuring progress (smaller map to the right). This map shows how many watersheds met the goal of having 20-30% of the monitoring be based on local or other state identified needs.

2020 Clean Water Fund Performance Report | www.legacy.leg.mn 17
Watersheds monitored by local partners
ACTION
Measure: Local partner participation in monitoring efforts
Why is this measure important? Clean Water Fund dollars enable intensive sampling and assessment of lakes and streams in all 80 major watersheds. This allows for better protection of Minnesota’s clean waters and restoration of the polluted ones. As noted in statute, one of the purposes of the Clean Water Fund is to provide “…grants, loans, and technical assistance to public agencies and others testing waters…” This measure shows the participation of local partners, citizen volunteers and students across Minnesota.
The Minnesota Pollution Control Agency (MPCA) alone cannot complete all of the monitoring necessary to comprehensively assess the waters in the state. Local partner participation is crucial to meet water monitoring strategy goals and to build a base of engaged participants for restoration and protection activities that follow the monitoring and assessment of waters.
What are we doing? MPCA works with local organizations across the state to build capacity for monitoring efforts. Each year, MPCA prioritizes certain lake, river and stream sites and works with local partners to award contracts to cover the costs of staff, training, equipment and lab analysis of condition monitoring.
In this way, MPCA is ensuring that the most current and comprehensive dataset is available for assessment and for the development of protection and restoration strategies. By bolstering local capacity, expertise and equipment inventory, these partners become well suited to carry out future monitoring efforts, such as subwatershed pollutant load monitoring to aid in restoration and protection strategies.
In addition, MPCA supports two volunteer monitoring programs for stream and lake clarity. Over 1,300 volunteers participate annually. The data they gather supports assessment and trend development work, helping to foster an engaged citizenry for environmental protection and restoration.
Clean Water Fund dollars also support a large environmental education effort in the Red River Basin
through the Red River Watershed Management Board. This work exposes hundreds of students to local waterways, provides watershed training to teachers, curriculum development for elementary students and engages students in biological and continuous monitoring.
Figure 13. Local partners and volunteers play a crucial role in assessing the health of lakes and streams in Minnesota. Volunteer Bert Johnson and Sauk Watershed District intern Madi Greenwoldt on the Sauk River Chain of Lakes in central Minnesota.
Figure 14. Madi Greenwoldt on the Sauk River Chain of Lakes.

18 2020 Clean Water Fund Performance Report | www.legacy.leg.mn
Figure 15. Percent of watershed chemistry monitoring performed by local partners.
What progress has been made? Through advertising and expansion of the contract opportunities to include load monitoring, MPCA has been able to meet its goal of a minimum of 75% of the sites offered being picked up by local partners.
During 2018 and 2019, MPCA awarded 31 contracts for monitoring activities across the state. Those local partners awarded contracts with MPCA include 29 organizations comprised of three counties, three educational institutions, three joint powers, three watershed districts, one nonprofit and 16 soil and water conservation districts.
In the Red River Basin, programs like River of Dreams are connecting students to watershed education. Through funding, Red River Basin Watershed Management Board tailored events connecting over 550 students. In 2018, the Red River Explorers Paddling Program sponsored 10 paddle outings with 440 participants, including 390 students and 50 adults. A first ever River Watch Camp was held at the University of Minnesota Crookston in which 11 students participated in events ranging from leadership activities to continuous monitoring station deployment and maintenance. River Watch Fall Forum kickoff events introduced 136 students and 15 teachers to watershed problem solving and the development of a story map.
Volunteers through the Citizen Stream and Lake Monitoring Programs provide data on over 1,500 lake and stream locations across Minnesota. These long-term
networks have allowed the state to track trends and assess water quality.
Minnesotans benefit from many other local and volunteer monitoring efforts across the state. This interest in water resources has provided information to inform local action and engagement.
Learn more • Clean Water Fund
(www.legacy.leg.mn/funds/clean-water-fund)
• Learn when MPCA will be monitoring your watershed at Watershed approach to restoring and protecting water quality (www.pca.state.mn.us/water/watershed-approach-restoring-and-protecting-water-quality)
• Surface water assessment grants (www.pca.state.mn.us/water/surface-water-assessment-grants)
• Watershed pollutant load monitoring grants (www.pca.state.mn.us/wplmn/overview)
Status Trend Description
As of 2019; all programs are meeting participatory goals.

2020 Clean Water Fund Performance Report | www.legacy.leg.mn 19
Nonpoint source BMP implementation
ACTION
Measure: Number of nonpoint source best management practices implemented with Clean Water funding and estimated pollutant load reductions
Why is this measure important? Minnesotans want their water resources protected and restored. Unfortunately, it can take many years for pollution control practices to result in clean water, particularly at the scale outlined in the Clean Water Roadmap. This measure helps us monitor progress toward the long-term goal of clean water by tracking the actions of people and organizations to implement best management practices in cities and on the farm. This measure also tracks the estimated amount of pollution those management and conservation practices are expected to reduce.
What are we doing? The Board of Water and Soil Resources (BWSR) is the primary state agency responsible for nonpoint source implementation and operates in partnership with local governments. Local governments—cities, watershed districts, counties, and soil and water conservation districts—are leading both cleanup and protection efforts across the state. They are working directly with communities, individual landowners and various non-profit organizations to implement best management practices. These practices include reducing polluted runoff from city streets, agricultural fields and feedlots; stabilizing stream channels; and upgrading septic systems.
The Minnesota Agricultural Water Quality Certification Program (MAWQCP) is a statewide voluntary opportunity for farmers and agricultural landowners to take the lead in implementing conservation practices that protect our water. The MAWQCP brings together producers with local soil and water conservation district staff and agronomy professionals to address the risks to water quality based on a whole-farm assessment. Farmers and landowners who implement and maintain approved farm management practices are certified and in turn obtain regulatory certainty for a period of 10 years. Certified producers may use their status to promote their business as protective of water quality, and producers interested in becoming certified also receive priority status for technical and financial assistance. Estimating the environmental benefit of specific management practices can be done many ways. The most common ways are to develop computer models, use values from scientific literature or
base estimates on the best professional judgment of experts. Regardless of the method used, some uncertainty remains in every estimate. As a result, there are several ongoing research efforts to better quantify the environmental benefits of conservation practices.
Figure 16. Clean Water Fund Projects 2010-2019 (projects by major basin).

20 2020 Clean Water Fund Performance Report | www.legacy.leg.mn
What progress has been made? With funding from the Clean Water Fund, the implementation of practices to improve and protect Minnesota’s water resources has accelerated, as has the completion of Total Maximum Daily Load and Watershed Restoration and Protection Strategy assessments that outline water quality needs. As a result, funding is not keeping pace with demand.
From 2010 to 2019 the Clean Water Fund has:
• Funded more than 2,864 grants to protect andrestore Minnesota water resources.
• Issued more than 1,366 loans to prevent nonpointsource water pollution or solve existing waterquality problems.
• Secured more than 584 easements that willpermanently protect approximately 12,513 acresalong riparian corridors and within wellheadprotection areas.
• Repaired 727 subsurface sewage treatment systemsthat pose an imminent health threat.
• Certified over 530,000 acres on 790 farms acrossMinnesota through MAWQCP. These certificationsadded 1,650 new conservation practices tothe landscape in approximately three years ofstatewide operations.
• Awarded more than 200 supplemental grantsdirectly to producers to implement conservationpractices, totaling over $765,000. An additional $6million in federal funding has been leveraged forconservation implementation grants through theRegional Conservation Partnership Program.
In total, more than 11,556 best management and conservation practices have been installed, resulting in a reduction of about 189,279 pounds of phosphorus and 176,791 tons of sediment across the state.
Learn more • Clean Water Fund
(www.legacy.leg.mn/funds/clean-water-fund)
• BWSR Clean Water Fund Stories(https://bwsr.state.mn.us/clean-water-fund-stories)
• Agriculture Best Management Practices (BMP) LoanProgram (www.mda.state.mn.us/agbmploan)
• Minnesota Agricultural Water Quality CertificationProgram (www.MyLandMyLegacy.com)
Major Basin Number of BMPs
Sediment tons/year
Phosphorus pounds/year
Lake Superior 119 2,225 1,363
Lower Mississippi
3,585 30,935 28,029
Minnesota 3,154 40,021 54,562
St. Croix 571 3,291 4,688
Upper Mississippi
1,414 23,805 29,132
Red River 2,390 62,385 58,403
Rainy River 41 154 345
Missouri 282 13,976 12,757
Totals 11,556 176,791 189,279
FY 2010-2019 BWSR Grant Funded Project Outcomes
Status Trend Description
Although funding has increased and there is a continued increase in practices and projects being implemented, the total request for projects has remained three times greater than available funds.

2020 Clean Water Fund Performance Report | www.legacy.leg.mn 21
Municipal infrastructure projects implementation
ACTION
Measure: Number of municipal point source construction projects implemented with Clean Water funding and estimated pollutant load reductions
Why is this measure important? Municipalities across Minnesota are required to upgrade treatment facilities, increase treatment of stormwater runoff and replace failing septics in order to protect or restore our state’s waters. These construction projects help meet required wasteload reductions through implementation of total maximum daily loads, phosphorus discharge limits and Water Quality Based Effluent Limits (WQBEL). These reductions are in addition to the major water quality benefits already achieved by municipalities through ongoing investments to replace aging wastewater infrastructure.
Figure 17. Municipal infrastructure projects by major basin, 2010–2019
What are we doing? Cities are required to implement upgrades to their wastewater and stormwater infrastructure to meet tighter discharge standards and specific water quality protection and restoration goals. Small unsewered communities
are required to fix noncomplying individual sewage treatment systems or install community systems when new individual systems are not feasible.
The Minnesota Public Facilities Authority and the Minnesota Pollution Control Agency (MPCA) jointly administer programs that provide grants and loans from Clean Water Legacy Funds to help municipalities pay for these infrastructure improvements. These Clean Water Funds supplement existing state and federal funding so that municipalities can implement these important upgrades more quickly.
What progress has been made? Since 2010, Clean Water Fund dollars have helped 108 municipalities implement wastewater and stormwater projects, including:
• 48 wastewater construction projects to reduce phosphorus discharges to 1 milligram per liter or less, resulting in a total phosphorus reduction of more than 139,000 pounds per year.
• Six wastewater construction projects to reduce mercury discharges, resulting in a total reduction of 471 milligrams per year.
• Two wastewater construction project that will provide treatment to reduce subsurface nitrogen discharges, resulting in a total reduction of 4,356 pounds per year.
• Eight stormwater construction projects that will provide treatment to reduce phosphorus discharges by 1,374 pounds per year and also result in reducing total suspended solids of 39,349 pounds per year.
• 34 small community technical assistance projects to help small unsewered communities evaluate treatment alternatives to address serious water quality and public health problems from non- complying septic systems.
• 28 wastewater construction projects to help small unsewered communities solve their wastewater problems by connecting to existing municipal systems or building their own treatment systems,

22 2020 Clean Water Fund Performance Report | www.legacy.leg.mn
such as community cluster mound systems, resulting in annual reductions in phosphorus of over 4,300 pounds and nitrogen of almost 2,700 pounds.
• Three construction projects to reduce chloride discharge, resulting in a total chloride reduction of more than 27,751 pounds per year.
Figure 18. The City of Pipestone upgraded its waste treatment facility to meet a more stringent discharge for chloride based on a WQBEL for Lower Big Sioux River. This is one of three projects that has resulted in a reduction of 27,750 pounds per year.
Clean Water Funds are targeted to high priority projects based on the MPCA’s Project Priority List which ranks projects based on water quality impacts and public health factors. Projects are designed to achieve specific effluent limits and wasteload reductions, and discharges are monitored to verify compliance.
The majority of projects to date have focused on reducing phosphorus discharges from wastewater treatment facilities.
Phosphorus is a nutrient which, when present in excessive amounts, is responsible for water quality impairments due to excess algal growth. River nutrient standards are being implemented across the state and Clean Water Funds are vital in helping to finance the required treatment upgrades. Continued appropriations will be needed to meet the increasing municipal demand for funding to improve treatment facilities across Minnesota.
Learn more: • Clean Water Fund
(www.legacy.leg.mn/funds/clean-water-fund)
• Minnesota Public Facilities Authority (https://mn.gov/deed/pfa)
• Minnesota Pollution Control Agency (www.pca.state.mn.us)
Status Trend Description
Pace of awards is linked to permit cycles, compliance schedules and available Clean Water Funds. Applications exceed currently available funds.

2020 Clean Water Fund Performance Report | www.legacy.leg.mn 23
Figure 19. MPCA staff sample streams and lakes across Minnesota to determine if recreation and aquatic life are supported.
Surface water health
OUTCOME
Measure: Rate of impairment/unimpairment of surface water statewide and by watershed
Why is this measure important? Many Minnesotans want to know if they can swim and fish in their favorite lake or stream. Until recently, a relatively small percentage of lakes and streams had enough water quality information to determine if Minnesota’s water goals were being met. In order to determine a waterbody’s health, state agencies need basic water quality information that is obtained through monitoring. Without this basic information, work to develop strategies to reverse water pollution and to protect high quality lakes and streams has been delayed.
What are we doing? Clean Water Funding significantly increased water monitoring and assessment activities. In 2008, the Minnesota Pollution Control Agency (MPCA) implemented the Watershed Approach. This is a 10-year cycle where approximately eight of Minnesota’s 80 major watersheds are intensively monitored each year for stream and lake water chemistry and biology. These data from monitoring activities are then assessed
to determine if goals to safeguard fish and aquatic ecosystems and protect recreational activities (such as fishing and swimming) are being met. By considering all lake and stream data for a given watershed at one time, a complete picture of the watershed’s overall health develops. State agency and local partners are working together to conduct the intensive monitoring, assess the resulting monitoring information, develop restoration and protection plans and assess progress towards water quality goals.
What progress has been made? As of January 2020, all 80 watersheds have been assessed. As monitoring and assessment continues across the state, the focus is on measuring progress. Minnesota is working to increase the number of lakes meeting acceptable recreation values by 8% and the number of rivers and streams meeting their potential for a healthy fish community by 7%. These goals were developed as a part of the Clean Water Fund Roadmap. The Roadmap projects over the 25 years of the Clean Water Fund

24 2020 Clean Water Fund Performance Report | www.legacy.leg.mn
Status Trend Description
Stream aquatic life
NEI Water quality varies greatly by region. Watersheds yet to be assessed will influence the statewide impairment/unimpairment rate. Unclear whether long-term goals will be met.
Stream swimming
NEI Water quality varies greatly by region. Watersheds yet to be assessed will influence the statewide impairment/unimpairment rate. Unclear whether long-term goals will be met.
Lake swimming
NEI Water quality varies greatly by region. Watersheds yet to be assessed will influence the statewide impairment/unimpairment rate. Unclear whether long-term goals will be met.
Figure 21. Percent of fish stations that are healthy
Figure 20. Percent of lakes meeting goal for recreation activities
the improvement likely, given funding for targeted implementation.
While monitoring alone does not yield changes in environmental condition, it does provide the information necessary to target protection and restoration activities in the watershed. It also allows for progress to be measured, as practices are implemented (improvements) or as more land is developed (degradation).
Completion of the first cycle of monitoring resulted in healthy fish communities at 60% of the stations visited. As work is completed to improve conditions on the landscape, the goal is to have 67% healthy fish communities at the stations visited during the span of the Clean Water Fund.
Similarly, work to improve conditions in lakes across Minnesota is expected to yield 70% of lakes supporting recreation activities.
Learn more• Clean Water Fund
(www.legacy.leg.mn/funds/clean-water-fund)
• Find your watershed and assessment results at Watersheds (www.pca.state.mn.us/water/watersheds)
• Learn when MPCA will be monitoring your watershed at Watershed approach to restoring and protecting water quality (www.pca.state.mn.us/water/watershed-approach-restoring-and-protecting-water-quality)
• Search for water quality information on specific lakes at streams at Surface water data (www.pca.state.mn.us/surface-water-data)

2020 Clean Water Fund Performance Report | www.legacy.leg.mn 25
Figure 22. Streams are monitored for water chemistry, fish, and aquatic insects to determine if a stream has healthy aquatic ecosystems. Water monitoring information is also evaluated to determine if lakes and streams are suitable for swimming and other water recreation and to determine whether consumption of fish should be limited.

26 2020 Clean Water Fund Performance Report | www.legacy.leg.mn
Lake and stream water quality
OUTCOME
Measure: Changes over time in key water quality parameters for lakes and streams
Why is this measure important? Water quality in a lake or stream can change depending on a variety of factors ranging from rain quantity or temperature to runoff from agricultural areas, parking lots, roads and lawns. Because of factors like these, waters must be sampled for many years to detect water quality trends. Information gathered over the years is valuable because it gives insight into general water quality patterns and trends across the state. This insight helps determine where to target restoration and protection efforts. It also helps determine the effectiveness of current activities to restore polluted waters and protect those that have good water quality.
What are we doing? Federal, state and local organizations have been monitoring Minnesota’s lake and stream water quality for decades. Data were collected statewide, and the results of this work were widely reported to support various program goals. Taken together, Minnesota’s water quality data paint a picture of general condition and changes in Minnesota’s lakes and streams.
This measure tracks those water quality factors that tend to be the largest sources or indicators of pollution. Some of these parameters include:
Lakes • Total phosphorus
• Chlorophyll-a (algae pigment)
• Secchi (transparency)
• Pesticides
Phosphorus, chlorophyll-a and Secchi combined indicate whether lake water quality is good for recreation, such as swimming and wading. Pesticides can affect the survival rate of fish, insects and their food sources.
Figure 23. Trends in lake water clarity between 1973 and 2016. While water clarity, in general, is poorer in southern Minnesota, increasing and decreasing lake clarity trends are fairly evenly scattered through north and south central Minnesota.
Streams
• Total phosphorus
• Nitrate
• Total suspended solids (sediment)
• Fish and invertebrates (aquatic insects)
• Pesticides
Phosphorus, nitrate, suspended solids, and pesticides in high concentrations affect the survival rate of fish and their food source, aquatic insects. All of these parameters combined measure the ability of the stream to support healthy aquatic ecosystems.
Figure 24. Where long-term (more than 20 years) streamflow and water quality data are available, phosphorus and total suspended solids concentrations in Minnesota’s larger rivers are generally decreasing or staying the same, while nitrate concentrations are staying the same or increasing. Because flows have been increasing in some rivers, the total amount of phosphorus, total suspended solids, and nitrate may be increasing even when concentrations stay the same.
In addition to analyzing data from existing sites, state and local partners are expanding the monitoring network to provide information in new areas or places facing new threats.

2020 Clean Water Fund Performance Report | www.legacy.leg.mn 27
Figure 25. Chloride trends: most of the locations measured on the Mississippi, Minnesota and St. Croix rivers are seeing an increasing concentration in chloride, from 1985-2015.
What progress has been made? Expansion of the monitoring network is critical to evaluating water quality trends in the state of Minnesota. The following activities are key highlights:
• The Minnesota Pollution Control Agency’s (MPCA) Watershed Pollutant Load Monitoring Network began in 2008 and ramped up to 200 sites by 2015.
• Metropolitan Council monitors and analyzes water quality within the 7-county metropolitan area on lakes, river segments and area streams, including emerging pollutants of concern such as chlorides. This monitoring occurs for purposes of assessing compliance with state water quality standards, National Pollutant Discharge Elimination Systems (NPDES) permit requirements, pollutant source tracking, and documenting trends in water quality.
• The Minnesota Department of Agriculture (MDA) has been monitoring for the presence and concentration of pesticides in the state’s groundwater since 1985 and in surface water since 1991. In recent years, the MDA expanded its laboratory capability and has the ability to detect approximately 166 pesticide compounds at very low concentrations.
• Volunteers in the Citizen Lake and Stream Monitoring Programs have collected lake and stream water clarity information for over 19 years. These volunteer programs are vital in gathering data for long-term data analysis.
• All of the watersheds have been comprehensively monitored, providing baseline data for assessments and a starting point for future trends. The second 10-year rotation of intensive watershed monitoring began in 2018 and will provide information to measure progress.
• MPCA participated in the National Aquatic Resources Surveys for lakes, including a partnership with the MDA for pesticide work. MPCA also conducted state probabilistic surveys for streams, rivers and wetlands, providing baseline information.
Though it is tempting to make sweeping statements, most often the story is a complicated mix of seeing improvements in some aspects of water quality and declines in others. There can also be striking differences in water quality trends when comparing the long-term trend (more than 20 years) against the short-term trend (five to 15 years) for a given lake or stream.

28 2020 Clean Water Fund Performance Report | www.legacy.leg.mn
Figure 26. Long-term monitoring of pesticides has allowed the MDA to assess detection and concentration trends over time. Detections of certain herbicides are frequent, while other pesticides are rare, if ever, detected.
Figure 27. Long-term monitoring of pesticides is needed to assess concentrations relative to water quality standards due to variability in climate, pesticide use, and agronomic factors. Most detections are well below water quality standards.
Learn moreMPCA has a rich array of graphics that can be produced for multiple combinations of waterbody types, pollutants/parameters and monitoring approaches to provide a comprehensive picture of the state of Minnesota’s water resources. See Clean Water Fund (www.legacy.leg.mn/funds/clean-water-fund).
Status Trend Description
Lake clarity NEI There are improving trends in lake water clarity in more lakes than not.
Nutrients and sediment in large rivers
NEI in general, concentrations in phosphorus and sediment are declining while nitrates are increasing in surface water.
Pesticides in streams
NEI Detections in streams vary greatly as a result of hydrologic and agronomic conditions; exceedances of pesticide water quality standards are rare.
Pesticides in lakes NEI Detections in lakes vary by region; detections in lakes have been well below water quality standards.
Chloride in rivers In general, concentrations of chloride are increasing.

2020 Clean Water Fund Performance Report | www.legacy.leg.mn 29
Figure 28. Previous impairments now meeting water quality standards due to corrective actions
Waters restored
OUTCOME
Measure: Number of previous impairments now meeting water-quality standards due to corrective actions
Why is this measure important? This measure tracks how actions taken on the ground lead to successful restoration of impaired waters. Impaired waters are lakes, streams or rivers that fail to meet water quality standards due to one or more pollutants, such as nutrients, bacteria, mercury and sediment. High levels of pollution in impaired waters can be unsafe for public health, fish and other aquatic life, as well as damaging to recreational opportunities.
Although Minnesota’s impaired waters list is growing as the state monitors and assesses more watersheds, so too is the list of waters that are improving. Cleanup efforts can take several years to decades to complete, but there are many examples of impaired waters that have been restored.
What are we doing? Pollution problems are initially identified through water quality monitoring, followed by studies and plans to determine what corrective actions are needed. Local governments—cities, watershed management organizations, counties and soil and water conservation districts (SWCDs)—are leading these cleanup efforts, working closely with organizations, landowners and citizens. These actions include upgrading wastewater treatment plants and septic systems; reducing polluted runoff from city streets, agricultural fields and feedlots; and implementing other on-the-ground best management practices (BMPs).
What progress has been made? Ultimately, the target is to restore all impaired waters in Minnesota. The Minnesota Pollution Control Agency (MPCA) began listing impaired waters in 1998. Since that time, 50 previously impaired lakes and river segments are now meeting water quality standards due to corrective actions.

30 2020 Clean Water Fund Performance Report | www.legacy.leg.mn
Figure 29. Plum Creek in Stearns County was successfully restored and is proposed to be removed from the impaired waters list in 2020.
Plum Creek (reach 07010203-572) in Stearns County was determined to be impaired for excess levels of bacteria in 2012. Since the following year, a locally led citizen organization called Plum Creek Neighborhood Network (PCNN) has been working to resolve the bacteria impairment issue with Plum Creek. The PCNN has spent a significant amount of time and resources in follow-up monitoring of Plum Creek, educating and communicating with the citizens within the Plum Creek subwatershed area and working with local units of government, such as Stearns SWCD, and state agencies to pursue best management practices within the subwatershed. The PCNN has collected numerous water quality data since 2013 and the data suggest that this reach of Plum Creek is now meeting water quality standards for bacteria (E. coli). Due to local actions, the river is proposed to be removed from the impaired waters list in 2020.
Many other waters are improving In most cases, the 50 success stories depicted in Figure 28 are the result of several years of diligent efforts at the local level, both prior to and with Clean Water Funds. However, the map does not give a sense of the many lakes and streams making restoration progress. Statewide, many lakes and streams have realized considerable improvements in recent years from work ranging from restoring wetlands and stabilizing
streambanks to addressing septic system and feedlot issues. These actions result in improvements such as greater clarity and reduced algae.
Although full restoration of Minnesota’s waters will take time, Clean Water Fund investments are helping to accelerate the pace of these activities.
Learn more • Clean Water Fund
(www.legacy.leg.mn/funds/clean-water-fund)
• Find your watershed and restoration projects at Watersheds (www.pca.state.mn.us/water/watersheds)
• Mississippi River – St Cloud (www.pca.state.mn.us/water/watersheds/mississippi-river-st-cloud)
• Minnesota’s Impaired Waters List (www.pca.state.mn.us/water/minnesotas-impaired-waters-list)
Status Trend Description
Although many projects are making progress in improving water quality, more waterbodies are being listed as impaired relative to the slower rate of waterbodies being restored.
2020 Clean Water Fund Performance Report | www.legacy.leg.mn 31
Mercury trends
OUTCOME
Measure: Trends of mercury in fish and mercury emissions in Minnesota
Why is this measure important? Many Minnesota lakes and rivers contain contaminants, primarily mercury, which accumulate in fish and may pose a risk to humans as well as fish-eating wildlife.
Because air pollution is the primary source of mercury, reducing mercury in fish requires large reductions in mercury emissions from sources in Minnesota and throughout the world. To evaluate if Minnesota waters are getting cleaner, we can track mercury emission levels over time through periodic emissions inventories and then measure how fish mercury levels respond. Because of the large variation in mercury concentrations from year to year within and among lakes, long-term trends of mercury in fish are necessary to see if pollution control efforts are sufficient.
What are we doing? The Minnesota Department of Natural Resources (DNR) is leading efforts to track mercury levels in fish. The DNR collects fish from approximately 150 lake and river sites annually throughout Minnesota and prepares samples for testing. Each year, thousands of walleyes, northern pike, panfish and other species are tested; Clean Water funding has expanded the number of sites tested each year. The Minnesota Pollution Control Agency (MPCA), Minnesota Department of Health (MDH), and U.S. Forest Service provide input on where samples should be collected; the Department of Agriculture’s laboratory analyzes the samples.
Decades of monitoring have shown that:
• most fish contain some mercury,
• the average mercury level generally increases from south to north in Minnesota and
• panfish have lower mercury levels than top predator fish
This is the basis for MDH statewide guidelines for eating fish.
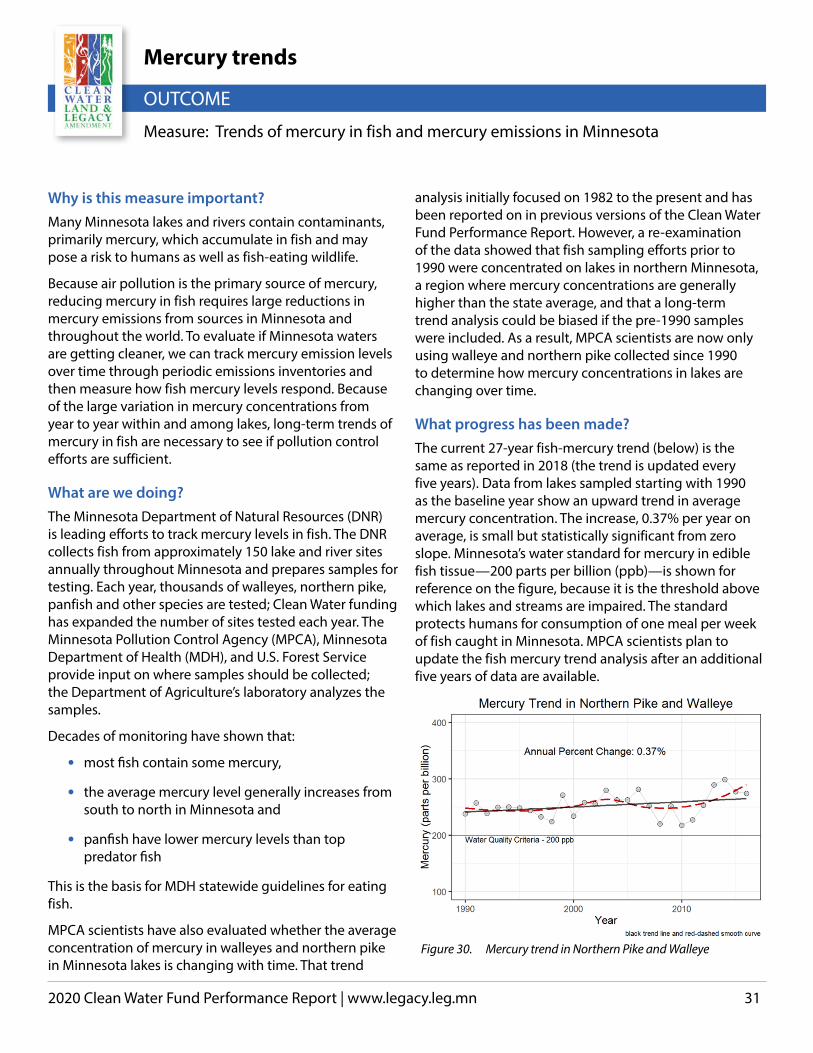
MPCA scientists have also evaluated whether the average concentration of mercury in walleyes and northern pike in Minnesota lakes is changing with time. That trend
analysis initially focused on 1982 to the present and has been reported on in previous versions of the Clean Water Fund Performance Report. However, a re-examination of the data showed that fish sampling efforts prior to 1990 were concentrated on lakes in northern Minnesota, a region where mercury concentrations are generally higher than the state average, and that a long-term trend analysis could be biased if the pre-1990 samples were included. As a result, MPCA scientists are now only using walleye and northern pike collected since 1990 to determine how mercury concentrations in lakes are changing over time.
What progress has been made? The current 27-year fish-mercury trend (below) is the same as reported in 2018 (the trend is updated every five years). Data from lakes sampled starting with 1990 as the baseline year show an upward trend in average mercury concentration. The increase, 0.37% per year on average, is small but statistically significant from zero slope. Minnesota’s water standard for mercury in edible fish tissue—200 parts per billion (ppb)—is shown for reference on the figure, because it is the threshold above which lakes and streams are impaired. The standard protects humans for consumption of one meal per week of fish caught in Minnesota. MPCA scientists plan to update the fish mercury trend analysis after an additional five years of data are available.
Figure 30. Mercury trend in Northern Pike and Walleye

32 2020 Clean Water Fund Performance Report | www.legacy.leg.mn
Why is the fish-mercury trend not tracking mercury emissions?
Although there have been substantial decreases in mercury emissions in Minnesota (see below), the U.S. and Europe, the overall global mercury emissions inventory has continued to increase. Between 2010 and 2015, estimated global mercury emissions increased 22%. In addition, many scientists have observed increasing mercury levels in fish and wildlife, which has been attributed to climatic changes in temperature and precipitation leading to increasing availability of mercury to food webs.
To achieve the necessary reductions of mercury in the fish, Minnesota’s Statewide Mercury Total Maximum Daily Load (TMDL) established a goal of a 93% reduction in mercury input from all human sources, both those inside and those outside Minnesota borders. Minnesota is implementing the TMDL to achieve the goal within the state by 2025. However, 90% of its mercury pollution is from outside the state.
The Minamata Convention, established in July 2017, provides the foundation for anticipating mercury emissions reductions globally. Rapid economic growth in Asia and India since 1990 has contributed to increased global emissions of mercury, despite mercury emissions in North America and Europe being cut in half since 1990. The United Nations Environment Program is negotiating reductions among all countries of the world through the Minamata Convention. Minnesota is doing its part and has taken significant steps towards achieving the identified mercury air emission reductions. Since 1990, removing mercury from latex paint, requiring mercury controls on municipal waste combustors and banning small onsite incinerators, mercury in batteries and disposal of mercury-containing products has reduced mercury emissions in Minnesota by more than 70%.
To reach the 93% reduction goal, air emissions of mercury from all sources in Minnesota must be reduced to 789 pounds per year.
Figure 31. Mercury emissions from Minnesota sources; 2025 emission projections are based on measured and calculated inventories in previous years and the emission estimates contained in the mercury reduction plans submitted by the ferrous mining/processing facilities in northern Minnesota.
Learn more• Clean Water Fund
(www.legacy.leg.mn/funds/clean-water-fund)
• Mercury Research (www.pca.state.mn.us/water/mercury-research)
• Choose Which Fish to Eat (www.health.state.mn.us/communities/environment/fish/eating/)
• LakeFinder (www.dnr.state.mn.us/lakefind/)
• Global Mercury Assessment 2018 (www.unenvironment.org/resources/publication/global-mercury-assessment-2018)
Status Trend Description
Mercury in fish
Mercury in game fish is not yet responding to decreases in local mercury emissions, although these reductions likely have prevented a steeper upward trend. Global emissions have increased. The time lag between emission reductions and response is likely several decades. It is too soon to see a measurable response in fish mercury levels. Long-term and consistent monitoring is necessary to track changes in fish tissue.
Mercury emissions
Significant progress has been made reducing mercury emissions from power plants and is expected from the mining sector. Emissions from mercury use in various products saw a decrease in emissions for the 2017 emission inventory, but it is too early to determine if this is a downward trend or simply variability between years. Conversely, emission from the mining sector have risen by roughly 270 pounds as a result of an overall production increase across the industry between 2016 and 2018. To meet Minnesota’s 2025 emissions goal, significant reduction of mercury emission from the mining sector and further reduction of mercury use in various products will be necessary.

2020 Clean Water Fund Performance Report | www.legacy.leg.mn 33
Figure 34. Reported and projected (2019) statewide effluent phosphorus loads from wastewater sources since the year 2005. The reductions in phosphorus discharged to Minnesota waters reflect the cumulative effect of permitting policies, implementation of Total Maximum Daily Loads (TMDLs), Clean Water Fund Investments, and local efforts and investments for the protection and restoration of Minnesota’s water resources.
Municipal wastewater phosphorus trend
OUTCOME
Measure: Municipal wastewater phosphorus discharge trend
Why is this measure important? Phosphorus continues to be a significant challenge for meeting Minnesota’s water quality goals. This measure shows trends in the amount of phosphorus being discharged from municipal wastewater treatment facilities. These regulated entities provide treatment for contaminated water from homes, businesses and industries. Wastewater treatment facilities are required to remove phosphorus and many other pollutants to levels that protect water quality.
What are we doing? Regulatory policies implemented over the past 15+ years have resulted in the reduction of phosphorus discharged by wastewater treatment facilities. The treatment plant improvements needed to achieve these reductions are expensive, particularly for smaller cities. Clean Water Funds have helped cities make the required infrastructure investments to meet phosphorus wasteload reductions mandated through the implementation of Total Maximum Daily Loads and Water Quality Based Effluent Limits.

34 2020 Clean Water Fund Performance Report | www.legacy.leg.mn
Status Trend Description
Significant phosphorus load reductions have been achieved through regulatory policy, infrastructure investments and improved technology.
Since 2010, over $49 million in Clean Water Fund grants have helped 48 municipalities finance wastewater treatment upgrades to meet required phosphorus reductions. These grants leveraged an additional $89 million in other funding for these infrastructure improvements. The availability of these Clean Water Fund grants help cities implement these treatment improvements on an expedited time schedule.
What progress has been made? Over the past eight years, municipal wastewater phosphorus discharges statewide have been reduced by 28%, compared to the projected effluent loads that would have resulted from previous permitting policies. Overall, these combined efforts have led to a steady decline of phosphorus pollution and major improvements in water quality. Implementation of newly adopted river nutrient standards is expected to result in further reductions in wastewater phosphorus loads in coming years. These Clean Water Fund investments and the expertise and dedication of Minnesota’s wastewater treatment facility operators have made historic progress in reducing phosphorus discharges.
Learn more For information on activities funded by the Clean Water Fund visit:
• Clean Water Fund (www.legacy.leg.mn/funds/clean-water-fund)
• Minnesota Public Facilities Authority (www.mn.gov/deed/pfa)
• Minnesota Pollution Control Agency (www.pca.state.mn.us)
Figure 32. Total phosphorous reductions for Fosston Waste Water Treatment Plant
Figure 33. Total phosphorous reductions for Saint James Waste Water Treatment Plant

2020 Clean Water Fund Performance Report | www.legacy.leg.mn 35
Drinking and groundwater measures
The 13 measures contained on pages 36-64 illustrate important Clean Water Fund-supported actions and outcomes undertaken to protect Minnesota’s drinking water supplies.
Actions
1. Source water protection plans and implementation
2. Source water protection grants3. Nitrate monitoring and reduction by local
partners 4. Contaminants of emerging concern 5. County geologic atlases6. Long-term monitoring network wells7. Unused groundwater wells sealed8. Land use in Drinking Water Supply
Management Areas
Outcomes
9. Groundwater quality 10. Source water quality for community water
supplies11. Nitrate and arsenic concentrations in new
wells12. Groundwater levels13. Water efficiency

36 2020 Clean Water Fund Performance Report | www.legacy.leg.mn
Figure 35. Number of Minnesota public water systems using groundwater.
Source water protection plans and implementation
ACTION
Measure: Number of community water supplies assisted with developing source water protection plans
Why is this measure important? People in Minnesota obtain drinking water from groundwater, lakes and rivers. The Minnesota Department of Health (MDH) works with public water systems and communities to protect the sources of their drinking water. Some examples of threats to drinking water sources include unused wells, urban pollutants, agricultural nutrients, storage tanks, lawn nutrients and chemicals, hazardous waste and uncontrolled land development. Source water protection is important because it:
• Protects human health.
• Keeps costs down (i.e., pollution prevention is often less expensive than remediation and treatment).
• Ensures sustainable water supplies for future generations.
What are we doing? MDH requires source water protection planning for all community and noncommunity water systems that use groundwater, although the level of engagement varies based on their population. Additionally, some systems that use surface water have voluntarily developed
source water protection plans. MDH is expanding the surface water program to provide more support to those systems.
Source water protection plans identify the land area that supplies water, assess the vulnerability of that area to contamination and identify actions to reduce the risk of threats. Protection areas, also known as drinking water supply management areas, cover approximately 1.2 million acres or two percent of the state’s total land area. Within the protection areas, 430,000 acres are vulnerable (i.e., at higher risk for contamination).
What progress has been made? MDH is working toward the goal of engaging all vulnerable community systems using groundwater in source water protection planning by 2020. Targeting these high-risk, high-population systems addresses the greatest public health need. There are approximately 920 community groundwater systems in the state, including approximately 500 vulnerable systems. MDH works with public water systems to develop source water protection plans.

2020 Clean Water Fund Performance Report | www.legacy.leg.mn 37
Figure 36. Community public water systems with approved wellhead protection plans; FY2001-2019.
The figure below shows the progress of community public water systems in Minnesota protected under source water protection plans. As of fiscal year 2019, 739 systems are protected by plans. MDH is on track to meet its goal of protecting all vulnerable systems under source water protection plans by 2020. MDH is also accelerating its progress in protecting nonvulnerable, nonmunicipal systems.
Learn more
• Clean Water Fund (www.legacy.leg.mn/funds/clean-water-fund)
• Source Water Protection (www.health.state.mn.us/communities/environment/water/swp/)
Status Trend Description
On track to meet goal of protecting all vulnerable systems under Source Water Protection Plans by 2020.

38 2020 Clean Water Fund Performance Report | www.legacy.leg.mn
Figure 38. Number of grants awarded by year
Figure 39. Number of activities funded by Source Water Protection Grants (2010-2019)
Source water protection grants
ACTION
Measure: Number of grants awarded for source water protection
Why is this measure important? People in Minnesota get their drinking water from groundwater, lakes and rivers. The Minnesota Department of Health (MDH) works with public water systems and communities to identify strategies to protect the source(s) of their drinking water. Grant dollars—often matched with other funds —can enable public water systems to take action. Prior to the Clean Water Fund, there was no financial assistance for public water systems to implement actions identified in their source water protection plans.
What are we doing? MDH administers three types of grants to public water systems: Competitive, Implementation and Transient Grants. Public water systems are eligible for different grants based on their customer base and whether they have a source water protection plan.
Figure 37. MDH recognized the organizations above in 2019 for source water protection efforts (from top, clockwise): Stearns County Soil and Water Conservation District; Elk River Municipal Utilities; and City of Georgetown.
What progress has been made?MDH is working towards the goal of increasing the cumulative number of grants awarded—which represents the reach of source water protection activities in Minnesota. The demand for these grants has grown over the past several years and often exceeds available funding. MDH anticipates the demand will continue to increase with the number of source water protection plans approved. Since
the grants program started in 2010, MDH has awarded 5.3 million dollars.
Learn more • Clean Water Fund
(www.legacy.leg.mn/funds/clean-water-fund)
• Source Water Protection Planning and Grants (www.health.state.mn.us/communities/environment/water/cwf/dwpcwf)
• Source Water Protection Grants (www.health.state.mn.us/communities/environment/water/swp/grants)
Status Trend Description
Increasing funds accelerate implementation of proven strategies for source water protection.

2020 Clean Water Fund Performance Report | www.legacy.leg.mn 39
Nitrate monitoring and reduction by local partners
ACTION
Measure: Number of local government partners participating in Clean Water Fund supported groundwater nitrate-nitrogen monitoring and reduction activities
Why is this measure important? Nitrate-nitrogen is one of the most common pollutants in Minnesota’s groundwater. In some areas of the state, a large number of private wells have elevated nitrate levels.
Nitrate comes from many sources, including fertilizers, manure, septic systems, landfills and natural decomposition of organic matter. Nitrate occurs naturally in groundwater at levels typically in the range of 0 to 3 milligrams per liter (mg/L). Human activities can raise the level of nitrate in groundwater. The drinking water standard for nitrate-nitrogen is 10 mg/L. Nitrate above this level can have negative effects on human health, specifically infants under the age of six months.
Groundwater is most vulnerable to nitrate contamination in the central and southeast regions of Minnesota. Areas in central Minnesota are vulnerable because of widespread sandy soil. Southeastern Minnesota is vulnerable because of shallow bedrock, sinkholes and underground caves (referred to as karst geology). Also, certain types of wells—shallow wells, hand-dug wells, tile wells and improperly grouted wells—are vulnerable to nitrate contamination.
Minnesota’s Clean Water Fund is being used for activities that help identify the severity and magnitude of nitrate contamination. Funds are also used to evaluate and implement practices at the local level to reduce nitrate in groundwater. State agencies work closely with many partners on nitrate monitoring and reduction activities. Building and maintaining these partnerships is essential to effectively address groundwater concerns.
What are we doing? The Minnesota Department of Agriculture (MDA) focuses its work in areas where there is nitrate contamination of groundwater from nitrogen fertilizer use. The MDA is working with 38 local partners on nitrate monitoring and reduction projects. In general, the MDA provides technical support, and the local partners provide coordination and contribute knowledge, skills and expertise about local conditions and issues.
The goal of our partnerships is to increase knowledge
and awareness about nitrate issues and foster a greater willingness by farmers to adopt and maintain best management practices.
Figure 40. Local partners the MDA worked with on groundwater monitoring in 2018-2019
This profile focuses on two current activities—private well testing and research at the Rosholt Farm.

40 2020 Clean Water Fund Performance Report | www.legacy.leg.mn
Township Testing ProgramThe MDA designed a Township Testing Program to determine current nitrate concentrations in private wells on a township scale. The MDA identified townships throughout the state where the groundwater is vulnerable to contamination and have significant row crop production (see map included with the Groundwater quality measure). These are the areas prioritized for private well testing.
More than 70,000 private well owners were offered nitrate testing in over 300 townships. This work was done in partnership with local governments across the state between 2014 and 2019. Results from all sampled wells in a participating township are summarized and help guide the type of response necessary to address nitrate in groundwater.
Rosholt FarmThe MDA partners with Pope Soil and Water Conservation District (SWCD) and the University of Minnesota (U of M) to support on-farm research, educational outreach, and increase adoption of nitrogen fertilizer best management practices (BMPs) in the Central Sands region of Minnesota.
The Herman Rosholt Farm is located near Westport, Minnesota in Pope County. The farm’s coarse-textured soils and need for supplemental irrigation typifies the challenges that many farmers face on the outwash sands of west-central and central Minnesota. The farm is approximately 40 acres in size.
The Rosholt Farm is dedicated to agricultural research and education that addresses regional issues and agricultural practices that are typical in the area. Researchers address challenges that farmers may face in the Central Sands region of Minnesota. Pope SWCD owns the farm and coordinates day-to-day activities, weekly sampling and analysis of water samples, crop and soil moisture monitoring and management of the irrigation system.
There are three main studies at the Rosholt Farm supported by Clean Water Funds:
• Nitrogen and Water Quality—led by Dr. Fabian Fernandez, U of M (recently completed)
• Evaluation of Four Irrigation Scheduling Methods—led by Dr. Vasu Sharma, U of M
• Nitrogen and Irrigation Management—led by Dr. Vasu Sharma, U of M
Figure 41. Dr. Fabian Fernandez and Natalie Ricks from the university of Minnesota assess the corn in a research trial at the Rosholt Farm. Clean Water Funds supports on-farm work that will provide a better understanding of nitrogen fertilizer management and water quality impacts on irrigated, sandy soils.
What progress has been made?Township Testing ProgramThrough 2018, the MDA has sampled private wells in 306 townships in 42 counties in cooperation with local partners. Counties that have participated include Becker, Benton, Blue Earth, Carver, Chippewa, Chisago, Clay, Cottonwood, Dakota , Dodge, Douglas, Faribault, Fillmore, Goodhue, Houston, Hubbard, Kandiyohi, Kanabec, Le Sueur, Lincoln, Lyon, Meeker, Morrison, Nicollet, Nobles, Olmsted, Otter Tail, Pipestone, Polk, Scott, Steel, Pope, Rice, Rock, Sherburne, Stearns, Todd, Wabasha, Wadena, Washington, Winona, and Wright.
While monitoring alone does not yield changes in environmental condition, it does provide the information necessary to target protection and restoration activities and inform homeowners about the water quality in their wells. Local data are essential when talking about groundwater contamination and promoting BMPs. It is the starting point for all implementation activities.
2020 Clean Water Fund Performance Report | www.legacy.leg.mn 41
Status Trend Description
New local partnerships continue to be established for nitrate- nitrogen monitoring and reduction activities.
Nitrogen and Water Quality Rosholt Farm is a local “educational hub” for providing technical information to area farmers, crop advisors and agronomists about nitrogen BMPs, new fertilizer recommendations, cover crop management, emerging crop production technologies and their water quality impacts. For example, information from previous Clean Water Fund supported work at Rosholt led to the development of new nitrogen rate guidelines for irrigated corn by U of M Extension (“Fertilizing Corn Grown on Irrigated Sandy Soils”).
In 2018 and 2019, Pope SWCD hosted four annual events (field days and workshops) reaching more than 325 participants including farmers, crop advisers and other local government partners.
Nitrogen, Cover Crops and Water Quality GOAL: To evaluate the management of nitrogen fertilizers and cover crops in irrigated crop production and their impacts to groundwater resources.
The study evaluates the impact of a living mulch (kura clover) and cover crop (winter rye) or no cover crop on nitrate leaching and nitrogen management on irrigated row crops.The study found that approximately 75% of the nitrate load and drainage through the bottom of the root zone occurs during the months of May and June. The rye cover crop reduced the nitrate load losses by 50% in corn in a corn-soybean rotation. There was no reduction in soybean or continuous corn because the rye had difficulty penetrating through the residue from the previous corn crop and nitrogen immobilization. Based on two years of research, kura clover reduced nitrate leaching by an average of 88%, but managing the kura clover to minimize its competition with the corn and soybeans remains a challenge. Research into managing kura clover as a living mulch is ongoing.
Evaluation of Four Irrigation Scheduling MethodsGOAL: To identify and develop irrigation strategies that increase crop water use efficiency and reduce nitrate leaching without impacting crop yield.
The objectives are:
• Develop an easy-to-use, simple and inexpensive tool for irrigation management based on soil matric potential;
• Evaluate four different strategies for agricultural water management;
• Promote the best irrigation management scheduler through outreach and education events.
The research project started in 2019 and will continue through 2021.
Nitrogen and Irrigation Management (started 2019)GOAL: To evaluate and quantify the interaction between nitrogen rate and irrigation management on nitrate leaching, grain yield, the economic optimum nitrogen rate and corn water use efficiency.
The 2019 field season was a calibration year to transition between research projects and establish monitoring equipment for work going forward. On-farm research is anticipated to begin in the spring of 2020.
Learn more• Clean Water Fund
(www.legacy.leg.mn/funds/clean-water-fund)
• Township Testing Program (www.mda.state.mn.us/townshiptesting)
• Water Quality and Irrigation Research at Rosholt Farm (www.mda.state.mn.us/rosholtfarm)

42 2020 Clean Water Fund Performance Report | www.legacy.leg.mn
Contaminants of emerging concern
ACTION
Measure: Number of new health-based guidance values for contaminants of emerging concern
Why is this measure important?Individuals and industry use tens of thousands of chemicals in a vast array of products and applications, including household products and cleaners, personal care products, medications, pesticides and manufacturing ingredients. Most contaminants of emerging concern do not enter our environment through purposeful or careless pollution—they enter our environment when we use products that contain these chemicals. Water quality studies and monitoring in Minnesota find contaminants from products or sources we never suspected in places we never expected, like our lakes, rivers and drinking water.
The science and technology required to detect and measure contaminants in the environment has improved, giving us new information about which chemicals are in the environment and at what levels. For many of these contaminants, it is unknown how much is safe to drink, raising questions and causing uncertainty among Minnesotans. The Minnesota Department of Health (MDH) seeks to answer these questions by evaluating the safety of contaminants of emerging concern in drinking water.
What are we doing?MDH investigates the likelihood of exposure to and potential health risks of contaminants of emerging concern in water and provides information needed to determine if contaminants in Minnesota waters pose a health risk. MDH develops health-based guidance for contaminants of emerging concern that tell Minnesotans the level of a contaminant that can be consumed in water with little or no health risk. Guidance is developed to protect people who are most vulnerable to the potentially harmful effects of a contaminant, such as pregnant women and infants.
For each contaminant reviewed, a plain language information sheet is published that describes the contaminant and the health-based guidance value, how Minnesotans might be exposed and action that can reduce exposure. MDH conducts special projects, or awards contracts and grants for special projects, intended to fill information gaps so that MDH can evaluate and communicate about chemicals even when the science and available data are still emerging.
Partnerships have been formed with other state agencies, including the Minnesota Pollution Control Agency (MPCA) and the Minnesota Department of Agriculture,
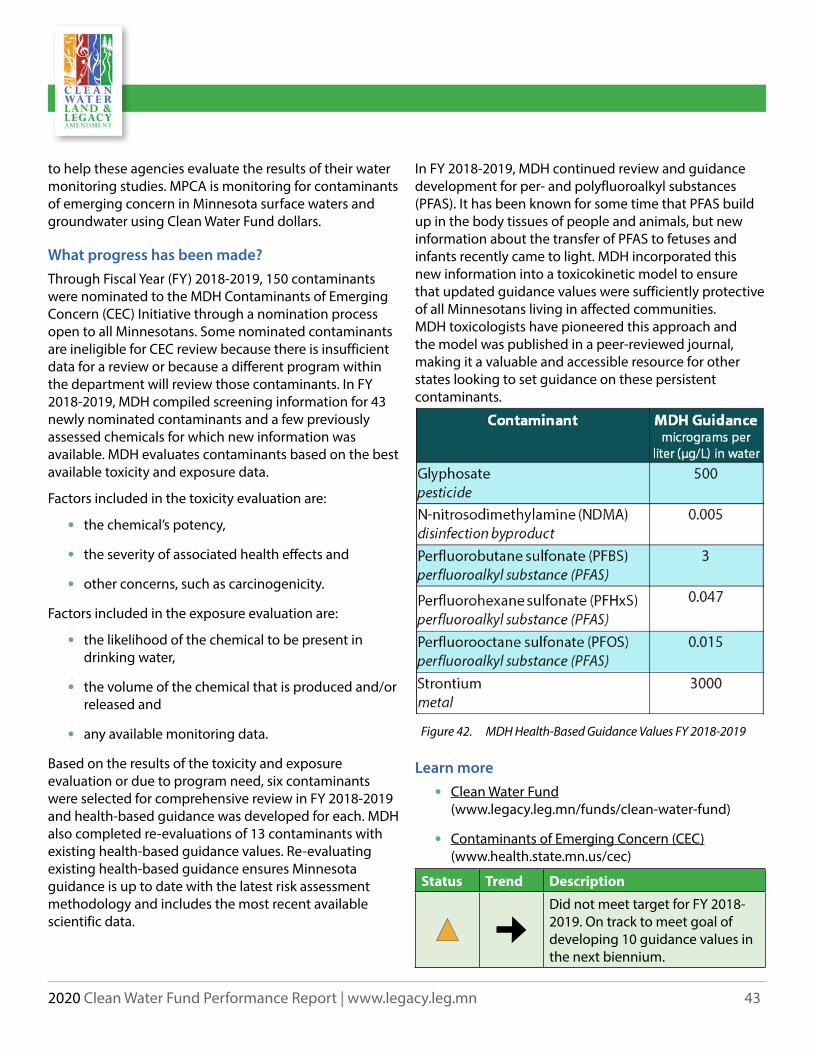
2020 Clean Water Fund Performance Report | www.legacy.leg.mn 43
to help these agencies evaluate the results of their water monitoring studies. MPCA is monitoring for contaminants of emerging concern in Minnesota surface waters and groundwater using Clean Water Fund dollars.
What progress has been made? Through Fiscal Year (FY) 2018-2019, 150 contaminants were nominated to the MDH Contaminants of Emerging Concern (CEC) Initiative through a nomination process open to all Minnesotans. Some nominated contaminants are ineligible for CEC review because there is insufficient data for a review or because a different program within the department will review those contaminants. In FY 2018-2019, MDH compiled screening information for 43 newly nominated contaminants and a few previously assessed chemicals for which new information was available. MDH evaluates contaminants based on the best available toxicity and exposure data.
Factors included in the toxicity evaluation are:
• the chemical’s potency,
• the severity of associated health effects and
• other concerns, such as carcinogenicity.
Factors included in the exposure evaluation are:
• the likelihood of the chemical to be present in drinking water,
• the volume of the chemical that is produced and/or released and
• any available monitoring data.
Based on the results of the toxicity and exposure evaluation or due to program need, six contaminants were selected for comprehensive review in FY 2018-2019 and health-based guidance was developed for each. MDH also completed re-evaluations of 13 contaminants with existing health-based guidance values. Re-evaluating existing health-based guidance ensures Minnesota guidance is up to date with the latest risk assessment methodology and includes the most recent available scientific data.
In FY 2018-2019, MDH continued review and guidance development for per- and polyfluoroalkyl substances (PFAS). It has been known for some time that PFAS build up in the body tissues of people and animals, but new information about the transfer of PFAS to fetuses and infants recently came to light. MDH incorporated this new information into a toxicokinetic model to ensure that updated guidance values were sufficiently protective of all Minnesotans living in affected communities. MDH toxicologists have pioneered this approach and the model was published in a peer-reviewed journal, making it a valuable and accessible resource for other states looking to set guidance on these persistent contaminants.
Figure 42. MDH Health-Based Guidance Values FY 2018-2019
Learn more• Clean Water Fund
(www.legacy.leg.mn/funds/clean-water-fund)
• Contaminants of Emerging Concern (CEC) (www.health.state.mn.us/cec)
Status Trend Description
Did not meet target for FY 2018-2019. On track to meet goal of developing 10 guidance values in the next biennium.
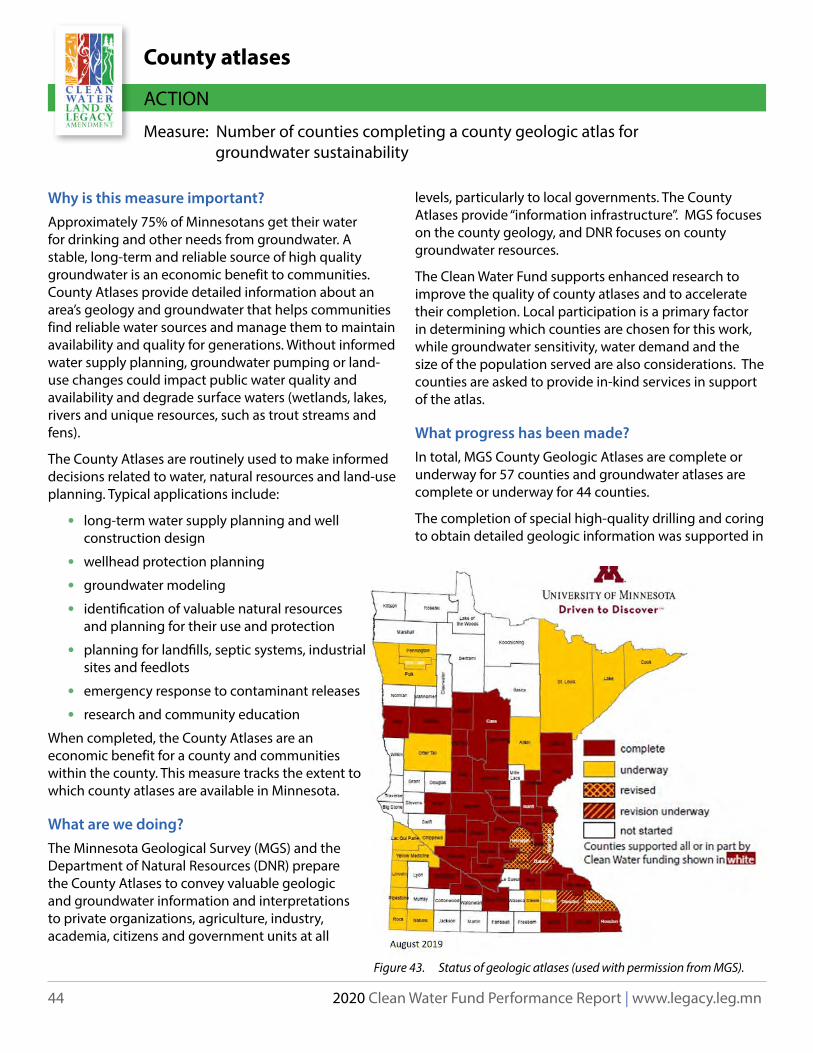
44 2020 Clean Water Fund Performance Report | www.legacy.leg.mn
Figure 43. Status of geologic atlases (used with permission from MGS).
County atlases
ACTION
Measure: Number of counties completing a county geologic atlas for groundwater sustainability
Why is this measure important?Approximately 75% of Minnesotans get their water for drinking and other needs from groundwater. A stable, long-term and reliable source of high quality groundwater is an economic benefit to communities. County Atlases provide detailed information about an area’s geology and groundwater that helps communities find reliable water sources and manage them to maintain availability and quality for generations. Without informed water supply planning, groundwater pumping or land-use changes could impact public water quality and availability and degrade surface waters (wetlands, lakes, rivers and unique resources, such as trout streams and fens).
The County Atlases are routinely used to make informed decisions related to water, natural resources and land-use planning. Typical applications include:
• long-term water supply planning and well construction design
• wellhead protection planning
• groundwater modeling
• identification of valuable natural resources and planning for their use and protection
• planning for landfills, septic systems, industrial sites and feedlots
• emergency response to contaminant releases
• research and community education
When completed, the County Atlases are an economic benefit for a county and communities within the county. This measure tracks the extent to which county atlases are available in Minnesota.
What are we doing?The Minnesota Geological Survey (MGS) and the Department of Natural Resources (DNR) prepare the County Atlases to convey valuable geologic and groundwater information and interpretations to private organizations, agriculture, industry, academia, citizens and government units at all
levels, particularly to local governments. The County Atlases provide “information infrastructure”. MGS focuses on the county geology, and DNR focuses on county groundwater resources.
The Clean Water Fund supports enhanced research to improve the quality of county atlases and to accelerate their completion. Local participation is a primary factor in determining which counties are chosen for this work, while groundwater sensitivity, water demand and the size of the population served are also considerations. The counties are asked to provide in-kind services in support of the atlas.
What progress has been made? In total, MGS County Geologic Atlases are complete or underway for 57 counties and groundwater atlases are complete or underway for 44 counties.
The completion of special high-quality drilling and coring to obtain detailed geologic information was supported in

2020 Clean Water Fund Performance Report | www.legacy.leg.mn 45
Figure 44. Status of groundwater atlases
Aitkin, Steele, St. Louis, Lake, Dakota, Pennington, Otter Tail, and Lac Qui Parle.
With Clean Water Fund support, DNR County Groundwater Atlas staff conducted specialty groundwater dye tracing work at McCarthy Beach State Park and YMCA Camp du Nord in support of a Minnesota Department of Health pathogen study to identify the source of contaminants in water supply wells. Clean Water Funds also supported specialized dye tracing at locations in southeastern Minnesota to understand the groundwater sources of trout streams, state fish hatcheries and other surface water bodies, and the impact of different land uses on the quality of those water bodies.
The long-term goal is to complete an atlas (both geologic and groundwater) for every county in Minnesota. Approximately four atlases are being completed each year. The Clean Water Fund supports expanded data collection for atlases, such as the use of sophisticated geological coring.
Learn more• Clean Water Fund
(www.legacy.leg.mn/funds/clean-water-fund)
• MGS County Geologic Atlas Mapping (https://www.mngs.umn.edu/county_atlas/countyatlas.htm)
• DNR Groundwater Mapping (www.dnr.state.mn.us/waters/groundwater_section/mapping)
Status Trend Description
Significant progress has been made completing county geologic atlases and the rate of completion has increased. Counties continue to step up to participate. Substantial work remains before all counties in Minnesota are done.

46 2020 Clean Water Fund Performance Report | www.legacy.leg.mn
Long-term monitoring network wells
ACTION
Measure: Number of long-term groundwater monitoring network wells in Minnesota
Why is this measure important? About 75% of Minnesota’s drinking water comes from groundwater, which is pumped from the state’s many and varied aquifers. Groundwater also supports agriculture, industry and natural resources that define Minnesota’s quality of life. Minnesota is relying more and more on groundwater to meet its growing needs, but many parts of the state lack basic information about the availability and quality of groundwater.
Since it is underground, people cannot see groundwater to observe its condition. Monitoring wells provide a “window” into aquifers, providing a way to see groundwater levels and measure water quality. This information is essential to better inform investments in water supply infrastructure and efforts to protect public health and natural resources.
To provide a safe and reliable drinking water supply at the lowest cost, well drillers and well owners should know the depth of the closest safe and quality groundwater. They should also know how much groundwater levels and quality fluctuate during wet and dry seasons, to ensure that pumps in wells don’t go dry and to understand potential health risks. Groundwater monitoring information is also important for protecting wetlands, developing total maximum daily loads for streams and for preventing the migration of contamination plumes.
This measure tracks the number of wells used for long-term monitoring of groundwater conditions. Well installation, water quality sampling and water level measurement are coordinated among state agencies. Wells are used for multiple purposes whenever feasible. Other monitoring wells exist, but they are used for short- term contamination or remediation events.
What are we doing? While Minnesota’s groundwater monitoring network is still inadequate for understanding groundwater conditions in portions of the state, it is improving. Clean Water Fund investments accelerate efforts to fill gaps in understanding aquifer conditions across the state and improve local capacity to improve private and public drinking water supply infrastructure.
The Minnesota Department of Natural Resources manages a statewide network of water level observation wells in partnership with soil and water conservation districts and various volunteers. Data from these wells are used to determine long-term trends, interpret impacts of pumping and climate, plan for water conservation and otherwise manage the water resource. Aquifer levels are being monitored in 1,105 wells, an increase of 70 wells since the last performance report.
The Minnesota Pollution Control Agency manages a statewide network of about 260 groundwater quality monitoring wells to determine whether non-agricultural pollutants are present and to track trends in pollutant concentrations. These wells are primarily installed in urban aquifers that are most susceptible to pollution from human activities. Water samples are collected annually to determine the concentrations of more than 100 regulated and unregulated chemicals, including nitrate, chloride and volatile organic compounds. The agency is still adding wells to the network, which will have about 275 wells when complete.
The Minnesota Department of Agriculture (MDA) manages a network of 201 groundwater quality monitoring wells across the state (including 13 springs and 12 domestic wells in southeasteastern Minnesota, not shown on the map). These wells are primarily in agricultural areas with the purpose of determining the impacts of pesticides and fertilizers on vulnerable groundwater. In addition to these wells, the MDA manages two private well monitoring networks.
Regional Private Well Networks• The Southeast Minnesota Volunteer Nitrate
Monitoring Network (VNMN) is distributed across nine counties in southeastern Minnesota and began in 2008 in cooperation with the Southeastern Minnesota Water Resources Board. The network is a set of private wells selected by location and owner willingness to participate. The same wells are sampled annually as long as the owner continues to participate. Approximately 300 to 400 wells have been sampled during each round (sampling event) in recent years. This network was established to track nitrate concentrations in
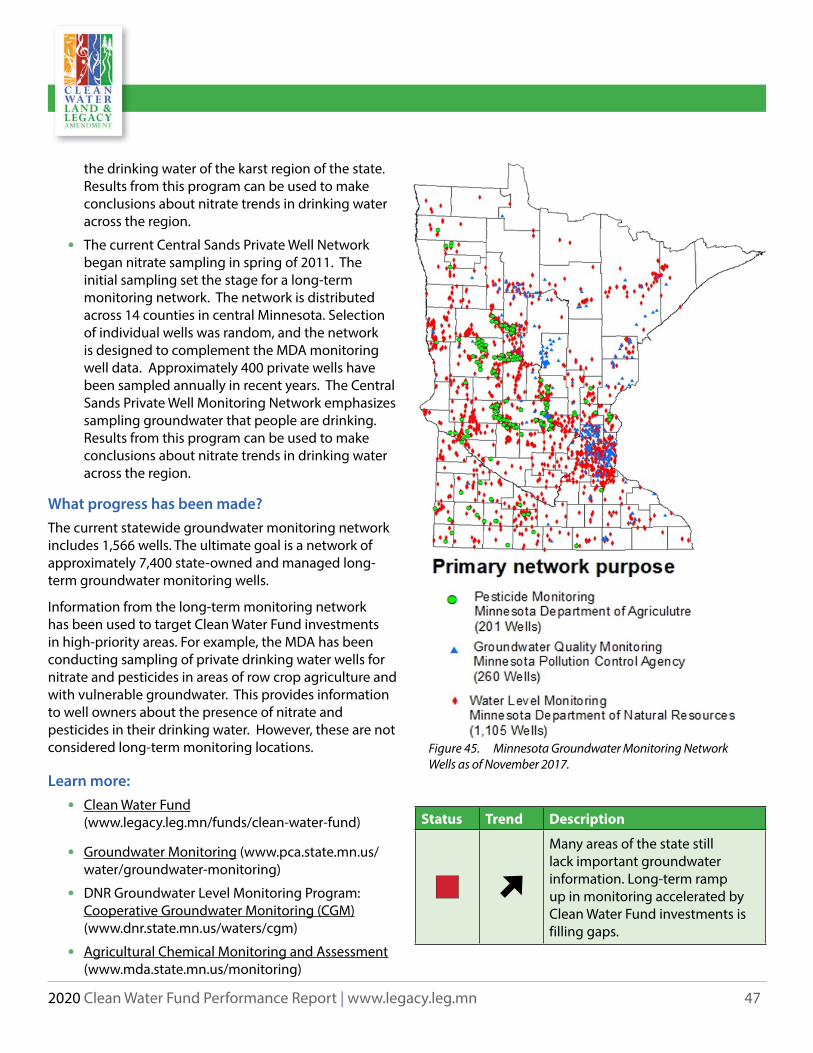
2020 Clean Water Fund Performance Report | www.legacy.leg.mn 47
Figure 45. Minnesota Groundwater Monitoring Network Wells as of November 2017.
the drinking water of the karst region of the state. Results from this program can be used to make conclusions about nitrate trends in drinking water across the region.
• The current Central Sands Private Well Network began nitrate sampling in spring of 2011. The initial sampling set the stage for a long-term monitoring network. The network is distributed across 14 counties in central Minnesota. Selection of individual wells was random, and the network is designed to complement the MDA monitoring well data. Approximately 400 private wells have been sampled annually in recent years. The Central Sands Private Well Monitoring Network emphasizes sampling groundwater that people are drinking. Results from this program can be used to make conclusions about nitrate trends in drinking water across the region.
What progress has been made?The current statewide groundwater monitoring network includes 1,566 wells. The ultimate goal is a network of approximately 7,400 state-owned and managed long- term groundwater monitoring wells.
Information from the long-term monitoring network has been used to target Clean Water Fund investments in high-priority areas. For example, the MDA has been conducting sampling of private drinking water wells for nitrate and pesticides in areas of row crop agriculture and with vulnerable groundwater. This provides information to well owners about the presence of nitrate and pesticides in their drinking water. However, these are not considered long-term monitoring locations.
Learn more:• Clean Water Fund
(www.legacy.leg.mn/funds/clean-water-fund)
• Groundwater Monitoring (www.pca.state.mn.us/water/groundwater-monitoring)
• DNR Groundwater Level Monitoring Program: Cooperative Groundwater Monitoring (CGM) (www.dnr.state.mn.us/waters/cgm)
• Agricultural Chemical Monitoring and Assessment (www.mda.state.mn.us/monitoring)
Status Trend Description
Many areas of the state still lack important groundwater information. Long-term ramp up in monitoring accelerated by Clean Water Fund investments is filling gaps.

48 2020 Clean Water Fund Performance Report | www.legacy.leg.mn
Figure 46. Number of wells and borindgs sealed in Minnesota.
Unused groundwater wells sealed
ACTION
Measure: Number of unused groundwater wells sealed
Why is this measure important?Unused wells that are not properly sealed can be a source of groundwater contamination, potentially affecting nearby drinking water wells. They may threaten water quality in municipal wells, private business wells, and residential wells. Groundwater is the main source of drinking water for three out of four Minnesotans.
A well may be taken out of service for a variety of reasons:• It no longer operates properly or provides enough
water,
• It became contaminated or
• It was replaced by extension of public water supplies
A well may be “lost” or abandoned when:• New buildings or additions are constructed;
• Property changes hands or
• When use of the land changes, such as from agricultural to industrial or residential.
The layers of rock and soil that lie between an aquifer and the land surface or between aquifers typically act as natural barriers against the spread of contamination. However, an unused, unsealed well can provide an open pathway between the surface and an aquifer or between a shallow aquifer and a deeper aquifer. This open pathway allows surface water runoff, contaminated water, and improperly disposed waste to reach an aquifer.
The Clean Water Funds provide financial assistance to help seal wells. This assistance increases the number and rate at which wells are sealed in the state.
What are we doing?Clean Water Funds provide an incentive for sealing unused wells. Funds for sealing private wells were made available as part of the Board of Water and Soil Resources Clean Water Fund Competitive Grant program in FY 2019. These funds were awarded to local governments so they can provide a one-to-one matching grant to well owners to seal their unused wells. Priority is given to sealing wells in areas near public water supply wells, large diameter multi-aquifer wells and wells in areas with known groundwater contamination.
FY 2018 Clean Water Funds were provided directly to well owners as a one-to-one match to seal unused public water supply wells. These wells tend to be larger and deeper than private wells and can be much more expensive to seal. They can also pose a significant threat to public water supplies because they are typically near active public water supply wells.
What progress has been made?Seventeen unused public water supply wells were sealed with FY 2018 funds. It is estimated that over 300 private wells will be sealed with FY 2019 funds. Ultimately, the goal is to seal all unused wells in Minnesota to protect public health and groundwater resources.
Unused wells continue to be identified on a regular basis through property transfers and other activities. While Minnesota has sealed over 300,000 wells since 1990, continued effort is needed to address the estimated 250,000 to 500,000 unused unsealed wells remaining.
Learn more:• Clean Water Fund
(www.legacy.leg.mn/funds/clean-water-fund) • Sealing of Wells and Borings
(www.health.state.mn.us/communities/environment/water/wells/sealing)
Status Trend Description
FY 2018 funding was awarded to seven public water-suppliers to assist in sealing 17 unused wells. FY 2019 funding was awarded to nine local government units to assist in sealing over 300 private unused wells.

2020 Clean Water Fund Performance Report | www.legacy.leg.mn 49
Land use in Drinking Water Supply Management Areas
ACTION
Measure: Land use changes over time in Drinking Water Supply Management Areas
Why is this measure important?In many parts of Minnesota, public water systems can pump and deliver water to households with minimal treatment. However, activities or features on the land can affect the quality of drinking water sources. Certain land uses are more protective of water quality than others, such as forested land or wetlands.
Protection is particularly important within Drinking Water Supply Management Areas (DWSMAs), areas that contribute groundwater used for drinking water. There are approximately 1.2 million acres of land in DWSMAs in Minnesota, and 36% (433,925 acres) is vulnerable to contamination. Minnesota Department of Health (MDH) and public water systems work with communities to identify and manage potential sources of drinking water contamination in DWSMAs. Yet MDH and public water systems have limited ability to influence land use in DWSMAs, since much of the land within DWSMAs is privately owned and outside of municipal jurisdiction.
MDH has a long-term goal to promote land use that is beneficial to water quality in DWSMAs. This measure reports on the amount of land in protective land use in DWSMAs.
What are we doing?MDH works with communities, public water systems, and partners to promote land use that is mutually beneficial to stakeholders. MDH helps communities identify vulnerable areas within their DWSMAs and plan and implement activities that prevent contamination. Strategic partnerships with other stakeholders in DWSMAs, such as private land owners, can also create opportunities to protect drinking water sources.
By encouraging protective land use in DWSMAs, MDH and public water systems can prevent or mitigate contamination of drinking water sources.
What progress has been made?As of 2016, approximately 30% of land in DWSMAs statewide have protective uses that benefit water quality. There are increasing efforts to target vulnerable areas in DWSMAs and protect them with conservation practices, easements or other measures. For example, researchers are developing innovative crops that reduce nutrient contamination of groundwater, and pilot projects have planted the crops in DWSMAs.
MDH is also initiating development of a statewide Source Water Protection Collaborative. This will serve as a platform for partners to plan and engage in activities that protect drinking water sources.

50 2020 Clean Water Fund Performance Report | www.legacy.leg.mn
Figure 47. Interseeding cover crops into corn. Photo courtesy of Pipestone Soil and Water Conservation District
This is the first year that MDH is reporting on land use in DWSMAs in this report. This measure is expected to change over time as partnerships are made and different sources of data become available.
What are the challenges and limitations? A challenge in tracking changes in land use over time is the availability of data. Statewide data on land use are available through the National Land Cover Database (NLCD). These data show land uses such as forestry, wetlands, agriculture and development. However, these land use categories are an insufficient indicator for drinking water protection. Land use categories do not account for best management practices (BMPs) that protect water quality. For example, conservation practices can mitigate contamination in agricultural areas, and stormwater BMPs can reduce contamination from runoff in developed areas. Additionally, updated NLCD data are only released every five years.
Source water protection provides one layer of protection to drinking water sources. Additional protection is gained through permanently protecting lands within a DWSMA through easements or conservation. While some lands
within DWSMAs are permanently protected by these measures, this data is not currently available. Having publicly available data on land in conservation would provide a more accurate representation of long-term protection of drinking water sources.
A recommendation is to support policy initiatives among Minnesota Executive Branch agencies and their partners to share data on land use protections in DWSMAs. Making these data available would help local implementers plan activities to protect Minnesota drinking water now and in the future.
Learn more• Clean Water Fund
(www.legacy.leg.mn/funds/clean-water-fund)
• Source Water Protection (www.health.state.mn.us/communities/environment/water/swp/)
Status Trend Description
There is increasing research, engagement, and activity to target and protect vulnerable areas in DWSMAs.

2020 Clean Water Fund Performance Report | www.legacy.leg.mn 51
Groundwater quality
OUTCOME
Measure: Changes over time in pesticides, nitrate-nitrogen and other key water quality parameters in groundwater
Why is this measure important? Chemicals are commonly used to control pests, support food production, manage lawns, protect human health and keep our roadways free of ice and snow. People also use many chemicals for cleaning clothes, maintaining cars and homes and improving lives.
Unfortunately, the benefits of pesticides, fertilizers and other chemicals are balanced against potential impacts to the state’s sensitive groundwater resources. It is only with highly detailed and sophisticated monitoring that the impacts of chemical use to groundwater resources can be understood and managed.
What are we doing? The Minnesota Department of Agriculture (MDA) samples groundwater wells in urban and agricultural settings. The MDA water samples are analyzed for many pesticides (155 in 2018) as well as nitrate. Results are used as feedback in the fertilizer and pesticide management process and are reported to farmers and the general public. The MDA and advisory committees use monitoring results to inform management decisions.
Figure 48. Statewide groundwater common detection pesticide detection frequency
The Minnesota Pollution Control Agency (MPCA) samples a network of wells primarily in urban settings
that measure ambient (or background) conditions for a large number of non-agricultural chemicals, including nitrate, chloride, volatile organic compounds and emerging contaminants. The network is focused on two aquifers that are especially vulnerable to man-made contamination—the sand and gravel and Prairie du Chien-Jordan aquifers.
The Minnesota Department of Health (MDH) has many roles in protecting groundwater from contamination. MDH’s primary roles include monitoring drinking water to ensure the state’s public water systems meet federal and state guidelines, evaluating contaminated sites to determine what chemicals are present and whether exposure to those chemicals may pose risks to human health.
What progress has been made?The MDA began its monitoring program in 1985 and currently samples more than 160 monitoring wells, naturally occurring springs and private drinking water wells throughout the state. Pesticide concentrations in groundwater rarely exceed drinking water standards in monitoring wells or private drinking water wells. Five pesticides have been detected frequently enough to be placed in the “common detection” category: acetochlor, alachlor, atrazine, metolachlor and metribuzin. These pesticides are being tracked and best management practices are promoted to minimize environmental impacts.
The MDA’s groundwater monitoring program was not designed to determine nitrate concentration status and trends. Nitrate concentrations in the very shallow, highly sensitive groundwater monitoring wells sampled in this program exceed health risk levels at many locations.
However, this is not the situation with every well or all the regions monitored. The MDA’s groundwater monitoring program is an early detection system. To more accurately determine nitrate trends across the state, the MDA relies on regional and township monitoring programs.
In 2008, the Southeast Minnesota Water Resources Board and the Minnesota Pollution Control Agency

52 2020 Clean Water Fund Performance Report | www.legacy.leg.mn
Figure 49. Statewide groundwater common detection pesticides degradates 90th percentile concentration
(MPCA), the MDA and MDH established the Southeast Minnesota Volunteer Nitrate Monitoring Network. This region was selected because of its sensitive and complex geology. This network of 675 private drinking water wells, representing nine counties and several aquifers, was designed to provide nitrate concentration data. Through 2018, 5,421 samples have been analyzed for nitrate, and an average of 10.1% of the wells exceeded the drinking water standard of 10 milligrams per liter (mg/L). The percentage of wells exceeding the drinking water standard for each sampling round ranged between 7.6% and 14.6%. This work continues as an ongoing effort.
In 2011, homeowners in 14 counties in central Minnesota (an area of the state with sandy soil that is vulnerable to nitrate contamination) participated in a monitoring project, and a subset of these wells have been sampled annually since that time. Through 2018, 3,463 samples
have been collected as part of the annual monitoring, and an average of 3.3% of wells have water with a nitrate concentration equal to or greater than the drinking water standard of 10 mg/L. There is a slight downward trend in the 90th percentile of this network.
In 2013, the MDA began sampling private wells on a township scale as part of the Township Testing Program. Through 2018, the MDA has sampled private wells in 306 townships in 42 counties in cooperation with local partners. The goal of the project is to sample wells throughout the state in areas where groundwater is most vulnerable to contamination. Through 2018, approximately 30,769 wells have been sampled, and 9.2% of the wells have nitrate exceeding the drinking water standard. Although this percentage can be much higher in some townships.

2020 Clean Water Fund Performance Report | www.legacy.leg.mn 53
Figure 50. Initial Township Testing results as of June 2019

54 2020 Clean Water Fund Performance Report | www.legacy.leg.mn
The Private Well Pesticide Sampling (PWPS) Project is a follow-up program to the Township Testing Program. The primary goal of the PWPS Project is to provide information to homeowners and the general public about the presence of pesticides in private drinking water wells. Homeowners who had nitrate detections in their well as part of the Township Testing Program have the opportunity to have their well sampled for nitrate and pesticides. The MDA has sampled approximately 5,700 wells in 24 counties from 2014 to 2018. Pesticides and/or pesticide degradates were detected in 84% of the wells sampled in 2018. The MDA anticipates sampling approximately 7,900 wells in 50 counties by the time the PWPS Project is complete in 2020.
MPCA continues to track chloride concentration trends in groundwater. The agency’s continued commitment to annual monitoring has increased its ability to determine whether groundwater quality has changed. The number of wells that have enough data to determine trends in the MPCA’s monitoring network increased from 35 in 2011 to 60 in 2018. Analysis of data from 2008-2018 continued to show that chloride contamination is seeping into the aquifers used for drinking water. Chloride concentrations increased in 38% of the sampled water supply wells, which primarily provided water to individual residences. Most of the water supply wells with upward trends were
located in the bedrock aquifers underlying the Twin Cities Metropolitan Area or southeastern Minnesota.
Learn more• Clean Water Fund
(www.legacy.leg.mn/funds/clean-water-fund)
• The MDA Pesticide Monitoring Programs (www.mda.state.mn.us/environment-sustainability/water-monitoring-programs)
• Southeast Minnesota Volunteer Nitrate Monitoring Network (www.mda.state.mn.us/southeast-minnesota-volunteer-nitate-monitoring-network)
• Central Sands Private Well Network (www.mda.state.mn.us/central-sands-private-well-network)
• Township Testing Program (www.mda.state.mn.us/township-testing-program)
• The MDA groundwater data through the Water Quality Portal (www.waterqualitydata.us)
• Private Well Pesticide Sampling Project (www.mda.state.mn.us/pesticide-fertilizer/private-well-pesticide-sampling-project)
Status Trend Description
PesticidesVariable trends for five common pesticides indicate a mixed signal. Low levels are frequently detected in vulnerable groundwater.
Nitrate-Nitrogen statewide
NEIIn many agricultural areas, drinking water supplies are not vulnerable to surficial contamination and most wells have low levels of nitrate–nitrogen. However, in vulnerable groundwater areas, nitrate contamination is a significant concern.
Nitrate-Nitrogen southwest region
NEI
In areas where groundwater is vulnerable, nitrate levels can be high. Of the 21 vulnerable townships tested in southwest Minnesota (2013-2018), 100% of them were determined to have 10% or more of the wells over the nitrate-N 10 mg/L standard.
Nitrate-Nitrogen Central Sands
Trend data from the Central Sands Private Well Network shows a slight downward trend in the 90th percentile. However, Township Testing data show a high level of nitrate in some vulnerable aquifers in the Central Sands.
Nitrate-Nitrogen southeast region
Trend data from the Southeast Minnesota Volunteer Nitrate Monitoring Network shows no change. However, Township Testing data show a high level of nitrate in some vulnerable areas in southeast Minnesota.

2020 Clean Water Fund Performance Report | www.legacy.leg.mn 55
Source water quality for community water systems
OUTCOME
Measure: Changes over time in source water quality used for community water systems
Why is this measure important? People in Minnesota use both surface water and groundwater as drinking water sources. When this untreated source water does not meet the standards of the Safe Drinking Water Act (SDWA), community water systems add treatment to make the water safe to drink.
Testing the source water before it goes through a treatment process is one measure of our efforts to protect drinking water at the source, whether it is surface water or groundwater. Understanding source water quality and chemistry also improves our understanding of groundwater aquifers, variables that might affect the treatment process and the potential for pollutants to contaminate source water.
What are we doing? On a regular basis, a community water system or a Minnesota Department of Health (MDH) engineer submits treated water to a certified laboratory to be tested for more than 100 regulated contaminants. Although there is no similar requirement for testing the source water, testing should be done on a regular basis to manage the source and determine what treatment may be necessary. It is important to test for compounds not regulated under federal law because this knowledge can help overcome compliance challenges and anticipate future needs.
In the 1980s, MDH conducted a baseline study to understand source water quality statewide. From 2010 to 2014, MDH conducted the General Water Chemistry Project (GWCP) to provide updated source water quality data. The project focused on the source water for 919 groundwater systems and 23 surface water systems. MDH engineers tested for more than 25 contaminants at nearly 2,300 community water system wells.
One result of this project was a better understanding of Minnesota’s source water quality and how it can affect levels of lead and copper. At community water systems with groundwater sources, elevated levels of ammonia, total organic carbon and lead/copper in the distribution system often occur at the same time. In addition, alkalinity can affect lead and copper levels.
AmmoniaThe GWCP was the first comprehensive assessment of naturally occurring ammonia in Minnesota’s groundwater.Ammonia is unregulated but can affect a community water system’s ability to meet standards for regulated contaminants. MDH tested for ammonia at approximately 1,700 groundwater sources of drinking water located within 814 community water systems.
In certain regions, naturally occurring ammonia is abundant, shown below . Through the GWCP, MDH found that exceedances of the federal action level for copper can be associated with naturally occurring ammonia in groundwater. This confirms past speculation that one factor contributing to Minnesota’s higher copper exceedance rate is ammonia in groundwater sources, unmanaged ammonia, and nitrification control in water distribution systems.
Figure 51. Ammonia nitrogen, total. Average source concentrations in groundwater sources for Minnesota community public water systems.
Nitrification can cause other problems in the distribution system. These include: bacterial growth, decreased chlorine residuals and therefore microbial regrowth, reduced pH, corrosion and distribution water quality issues (such as discoloration, taste and odor). The main factors contributing to nitrification include: excess ammonia in the distribution system, inadequate chlorine residuals (loss of protection from bacteria) and long

56 2020 Clean Water Fund Performance Report | www.legacy.leg.mn
retention times (i.e., excessive water age). This leads to compliance challenges for the Lead and Copper Rule, as well as the nitrite maximum contaminant level and Revised Total Coliform Rule.
Understanding and managing ammonia issues can help prevent copper exceedances and potentially help community water systems reduce the amount of corrosion control chemicals needed. Because these chemicals are phosphates, this in turn can have the benefit of reducing the amount of phosphates entering waste water streams.
Total Organic Carbon (TOC)TOC is a measure of organic materials. Surface waters are more likely to contain TOC. Groundwater TOC levels are generally lower and less variable. Although TOC by itself is not a health concern, high levels of TOC can create challenges for water systems in maintaining water quality and can affect lead and copper levels.
GWCP measured TOC at 23 surface water sources. Levels ranged from zero to 40 milligrams per liter (mg/L), with an average of 6.2 mg/L. In groundwater sources, average TOC levels were variable across the state. Average TOC concentrations by region were 2.3 mg/L in central, 2.2 mg/L in northwest, 2.1 mg/L in southwest, 1.9 mg/L in northeast, 0.69 mg/L in the metro and 0.48 mg/L in southeast Minnesota.
AlkalinityAlkalinity is the ability of water to neutralize acid. It is useful in assessing and optimizing corrosion control treatment. Carbon dioxide dissolved in water and bedrock containing carbonate can influence the alkalinity of groundwater. Lower alkalinity can be a factor in lead and/or copper increases if the community water systems changes disinfectants.
Through the GWCP, we found that alkalinity in groundwater varies across the state. Average concentrations by region were 349 mg/L in southwest, 319 mg/L in central, 308 mg/L in northwest, 285 mg/L in southeast, 275 mg/L in the metro, and 208 mg/L in northeast Minnesota.
This data will help state and federal agencies target limited resources in assisting community water systems with managing water sources and delivering drinking water that meets all standards. Future monitoring is essential to better understand trends in contaminants.
Although this study was not funded by the Clean Water Fund, it provides data about the condition of source waters and helps measure the effectiveness of other activities financed through the Clean Water Fund, such as wellhead protection planning and nitrogen reduction practices in agriculture.
What progress has been made? As a result of this study, MDH now has
• a snapshot of current source water quality;• a better understanding of water quality throughout
Minnesota’s aquifers, lakes and rivers;• increased knowledge of changes to water
chemistry during treatment and distribution;• an enhanced ability to determine proper treatment
options and best management practices for drinking water; and
• data that can be used to respond to potential contamination events.
Year after year, Minnesota has an outstanding record of ensuring safe drinking water through compliance with the SDWA. However, we cannot take safe drinking water for granted. We must protect our drinking water sources for future generations.
MDH has secured some funding for periodic source water monitoring. However, additional resources are needed for regular source water quality monitoring for regulated and unregulated contaminants. Opportunities include evaluating drinking water sources and entry points not measured in the GWCP and developing data systems for tracking trends at community water systems. This will help MDH identify opportunities to respond to and improve drinking water quality.
Learn more • Clean Water Fund
(www.legacy.leg.mn/funds/clean-water-fund) • Basics of Monitoring and Testing of Drinking
Water in Minnesota (www.health.state.mn.us/communities/environment/water/factsheet/sampling)
Status Trend Description
NEI
Identifying correlations between drinking water contaminants is a significant step in trend analysis of source water quality.

2020 Clean Water Fund Performance Report | www.legacy.leg.mn 57
Nitrate and arsenic concentrations in new wells
OUTCOME
Measure: Nitrate and arsenic concentrations in newly constructed wells
Why is this measure important? Groundwater is the main source of drinking water for three out of four Minnesotans. About one in five Minnesotans (1.2 million people) get their drinking water from a private well. Both arsenic and nitrate are found in Minnesota groundwater at levels that can cause short-term and long-term health effects.
Consuming water high in nitrate can affect how blood carries oxygen and can cause a condition called methemoglobinemia (also known as blue baby syndrome). This condition can result in serious illness or death. Bottle-fed babies under six months old are at the highest risk of getting methemoglobinemia. Drinking water with arsenic in it over many years can increase the risk of cancer and other serious health effects.
Nitrate is a naturally occurring compound made of nitrogen and oxygen. Natural levels of nitrate in Minnesota groundwater are usually below 3 milligrams per liter milligrams (mg/L). Levels of nitrate greater than 3 mg/L are associated with human-made sources of nitrate. Sources include fertilizers, animal wastes and human sewage. These sources can contaminate the groundwater. Shallow wells in areas with sandy soils or karst geology are more vulnerable to nitrate. Improper well construction or a damaged well can also allow nitrate to reach otherwise protected groundwater sources.
Arsenic occurs naturally in rocks and soil across Minnesota and can dissolve into groundwater. The way glaciers moved across Minnesota affects where arsenic is found in sediment and groundwater. Because of the complex nature of arsenic occurrence, it is very difficult, and in some cases impossible, to avoid arsenic when constructing a new well.
What are we doing?NitrateCurrent laws require that wells are located and constructed in a way that provides a sanitary source of drinking water and protects groundwater quality. In addition, the Minnesota Department of Health (MDH), the Minnesota Department of Agriculture (MDA), and other partner agencies help well owners and farmers properly manage nitrate sources (such as fertilizers and septic systems) to help reduce input of nitrate into
groundwater. Each time a new well is drilled, nitrate levels (along with arsenic and coliform bacteria) are measured to verify the water is safe to use. If nitrate is higher than the drinking water standard of 10 mg/L, MDH informs the well owner of options to reduce their risk. The MDA and local governments sometimes offer clinics for residents to have their well water tested for nitrate.
With Clean Water Funds, the MDA Township Testing Program is testing for nitrate in townships that have vulnerable geology and a large percentage of row crop agriculture. The results of this testing will guide efforts to reduce nitrate in groundwater through the Nitrogen Fertilizer Management Plan. Other activities funded by the Clean Water Fund, including the Agriculture Water Quality Certification Program, nutrient management assistance and funding for cover crops and other best management practices reduce input of nitrate to groundwater.
ArsenicIf arsenic is detected in the initial well sample after a well is constructed, MDH informs the well owner of options to reduce their risk. In cooperation with the U.S. Geological Survey (USGS), Clean Water Funds are being used to better understand the occurrence of arsenic in order to help well contractors avoid constructing wells with high levels of arsenic if possible. The work is also helping to understand if initial well water samples and sampling methods result in an accurate measure of long-term arsenic concentrations.
Education and OutreachMDH is also using Clean Water Funds to improve education and outreach to private well owners. The goal is to increase private well testing and help private well owners take action to reduce their exposure to unsafe levels of contaminants, such as arsenic and nitrate.
What progress has been made?NitrateThe goal is that all new wells have nitrate levels below 3 mg/L. About 3% of new wells in Minnesota have nitrate levels above 3 mg/L and below the drinking water standard of 10 mg/L. About 1% of new wells have a nitrate level above the drinking water standard. However,

58 2020 Clean Water Fund Performance Report | www.legacy.leg.mn
the MDA Township Testing Program found a much higher percentage of wells in the central and southeastern regions of the state that have elevated levels of nitrate. The townships tested had a high percentage of land in row crop agriculture, and the geology in these regions make it easier for nitrate to travel into groundwater.
The low statewide percentages of new wells with nitrate show that the well code is effective in reducing nitrate contamination risks for most wells. However, it is important that the owners of wells with elevated nitrate take actions to reduce their risk. Because concentrations of nitrate can change over time, well owners should periodically test their water, even if their water had a low level of nitrate initially. There are also many older wells that may have never been tested.
As shown below, there has been a general upward trend in the percent of new wells with nitrate levels higher than the drinking water standard over the past 16 years.It is not clear if there is a relationship between this trend and actual nitrate levels in groundwater since new well construction is not uniformly distributed across the state and the number of new wells is not consistent from year to year. This measure cannot tell us the specific causes of nitrate contamination. However, through Clean Water Fund activities that address and manage nitrate sources, nitrate concentrations in groundwater across the state should eventually decline. This measure should reflect that decline.
Figure 52. Nitrate concentrations in new drinking water wells
ArsenicThe goal for this measure is to reduce the percentage of new wells with arsenic. Forty-eight percent of new wells in Minnesota drilled since 2008 have arsenic. About 11%
of new wells have arsenic levels above 10 micrograms per liter (µg/L)—the drinking water standard for community water systems.
Figure 53. Arsenic concentrations in new drinking water wells
In 2014, MDH and USGS started collaborating to better understand the occurrence and distribution of arsenic in groundwater. No activities to date have had a direct influence on reducing the percentage of new wells with arsenic. As we learn more about arsenic in groundwater, MDH will develop guidance for well contractors to reduce the likelihood that arsenic is in a new well.
Learn more• Clean Water Fund
(www.legacy.leg.mn/funds/clean-water-fund)
• Nitrate in Drinking Water (www.health.state.mn.us/nitrate)
• Arsenic in Drinking Water (www.health.state.mn.us/communities/environment/water/contaminants/arsenic)
Status Trend Description
Nitrate
Since 1992, there has been a general increase in the percent of new wells that have nitrate levels above the drinking water standard.
Arsenic
The percentage of wells with arsenic above the drinking water standard has remained steady over the past 10 years. Evaluation of ways to reduce this percentage is ongoing and may take years before significant progress is made.

2020 Clean Water Fund Performance Report | www.legacy.leg.mn 59
Groundwater levels
OUTCOME
Measure: Changes over time in groundwater levels
Why is this measure important? About 75% of Minnesota’s drinking water comes from groundwater, which is pumped from the state’s many and varied aquifers. Groundwater also supports agriculture, industry and natural resources that define our quality of life. Minnesota is relying more and more on groundwater to meets its growing needs, but many parts of the state lack basic information about the availability of groundwater.
This information supports the evaluation of water supply planning efforts to protect natural resources, prevent well interference and sustain drinking water sources.
Groundwater levels are affected by several stresses including drought and floods, changes in land use and pumping by wells. Changes in groundwater levels cause changes in the streams, fens and wetlands, springs and lakes connected to them. Wells are also affected. When groundwater levels decline, pumps in wells may go dry, causing local water supply emergencies and costing private and public well owners money.
Decisions about water supply development and appropriation, watershed management and land use are made daily. The success of these decisions depends, in part, on knowledge about seasonal and long-term changes in groundwater levels.
What are we doing? Minnesota Department of Natural Resources (DNR) manages a statewide network of groundwater-level observation wells, in partnership with soil and water conservation districts and volunteers. The statewide network of groundwater-level observation wells provides information about seasonal water level fluctuations and long-term water level changes. Data from these wells are used to determine long-term trends, interpret impacts of pumping and climate, plan for water conservation and manage the water resource. Results are published in a variety of publications that can help water managers evaluate water supply questions at local and regional scales.
Data are insufficient to assess Minnesota’s groundwater conditions in portions of the state, but the number of monitoring wells is being expanded to enhance our ability to detect trends. Aquifer levels are being monitored in 1,105
wells, an increase of 70 wells since the 2018 Performance Report.
What progress has been made? To evaluate progress, an analysis is completed that uses the annual minimum water level, the lowest water level recorded for the year in an observation well, for determining trends. Statewide, 81% of 341 observation wells in the groundwater level monitoring network with sufficient data showed no significant change in water levels or an upward trend over the 20-year analysis period (through 2016). In contrast, 19% of the groundwater wells analyzed had a significant downward trend. It is important to note that some of the change observed may reflect the addition of new wells in the analysis. Downward trends can result from drier climate conditions in the later years of the analysis period or increased groundwater use. The next update of the groundwater levels will be for the 2022 report.
Figure 54. Diagram of how pumping wells can draw down the water table.
Groundwater-level information is becoming better integrated into water supply planning, which supports work to reduce the environmental, economic and public health risks that unsustainable aquifer decline creates. In the Twin Cities Metropolitan Area, regional planning policies are being revised to address declining aquifer levels. Statewide, the DNR is establishing Groundwater

60 2020 Clean Water Fund Performance Report | www.legacy.leg.mn
Figure 55. Annual minimum water-level trends in observation wells by groundwater province (1997-2016)
Management Areas (GMAs) where additional planning is needed to ensure that growing water demands do not cause unsustainable seasonal or long-term groundwater declines. Clear standards for sustainability of aquifers and the surface water features they support are being established.
The emerging GMA program is creating new partnerships between DNR, Pollution Control Agency, Department of Health, Department of Agriculture, Board of Water and Soil Resources, Metropolitan Council and many local stakeholders. Efforts are underway in the north and east metro, the Straight River and the Bonanza Valley area of west-central Minnesota.
As shifts in land use and related water use occur, groundwater-level monitoring networks will document how water levels respond. Where predictive groundwater models exist, such as in the Twin Cities Metropolitan Area, measured groundwater levels can be compared against predicted water levels to understand how management changes can shift the long-term outlook for our groundwater conditions. Groundwater models are in development or are planned for GMAs and other areas of groundwater-quantity concern.
Learn more:• Clean Water Fund
(www.legacy.leg.mn/funds/clean-water-fund)
• DNR Groundwater Level Monitoring Program: Cooperative Groundwater Monitoring (CGM) (www.dnr.state.mn.us/waters/cgm)
• Metropolitan Council’s Water Supply Planning (www.metrocouncil.org/Wastewater-Water/Planning/Water-Supply-Planning.aspx)
• Groundwater Provinces (www.dnr.state.mn.us/groundwater/provinces)
Status Trend Description
Most observation wells show no significant change or an upward trend (up 24% since 2014), but many areas of the state lack important groundwater information while some areas experienced groundwater level declines.

2020 Clean Water Fund Performance Report | www.legacy.leg.mn 61
Figure 56. Minnesota water use in billions of gallons, excluding power generation.
Water efficiency
OUTCOME
Measure: Changes in total and per capita water use
Why is this measure important? This measure describes how much water (groundwater and surface water) is used in Minnesota – as an annual statewide total and per person. As Minnesotans, we get much more from our water than drinking and washing. Water also helps to provide power, irrigate crops, run industrial processes, service health care facilities, and support our state’s rich natural environment. And every drop of water that people move from one place to another for a variety of uses comes with a cost—such as the energy to move it, the infrastructure to treat it, and the impact to the source from which it was taken. Being good stewards means getting the most value out of the water we use, taking care not to waste it, and putting it back into the environment sustainably.
What are we doing?The Minnesota Department of Natural Resources (DNR) is responsible for managing water withdrawal (appropriation) permits in Minnesota. Current laws require those who use large amounts of water to take practical actions to use water efficiently. Various water efficiency targets have been established since the Clean Water, Land and Legacy Amendment was passed. The following metrics and results are from the DNR Water Conservation Reporting System for public water suppliers statewide:
• Unaccounted water loss improved in 2018 and is down to 8.4%, below the goal of less than 10%.
• In 2018, 92% of reporting cities met the goal of residential water use less than 75 gallons/person/day.
• In 2018, 46% of utilities lowered their total per capita water use.

62 2020 Clean Water Fund Performance Report | www.legacy.leg.mn
• In 2018, 80% of utilities met the goal of maximum daily use being less than 2.6 times that of average daily use.
• Approximately 39% of the water distributed by water suppliers is to non-residential water users, but trends are not yet available to know if public water suppliers are achieving the goal of at least 1.5% reduction in commercial, industrial, and institutional water use over 10 years.
In the Twin Cities metropolitan area, the Metropolitan Council (Met Council) has identified a regional target for total per person water use of 90 gallons/day, on average, for community water systems. The DNR, the Minnesota Department of Agriculture (MDA), the University of Minnesota (U of M), and the Met Council are using the Clean Water Fund to accelerate the implementation of water efficiency measures and progress toward these goals. Examples:
• MDA Irrigation Workshops
• U of M Technical Assistance Program Water Conservation Program and Turfgrass Science Program
• Met Council Water Efficiency Grant Program
What progress has been made?Between 2010 and 2018, the water used for public supply has gone down about 5% and the average amount of total water used per person (for all purposes in the state) has gone down approximately 20%. This is likely due to a combination of factors like wet summers (less irrigation) and more efficient industrial processes and residential appliances. Water use for power generation has decreased by 24% since 2010 because of the rapid transition to renewable energy.
Year Total MN Water Use (gallons per day)
Total MN Population
Gallons per person
per day
2010 3,704,591,268 5,303,925 698
2012 3,682,228,800 5,368,972 685
2014 3,474,456,459 5,453,218 637
2016 3,372,221,158 5,528,630 609
2018 3,178,799,171 5,629,416 564
Learn more:• Clean Water Fund
(www.legacy.leg.mn/funds/clean-water-fund)
• Minnesota Water Use Data (www.dnr.state.mn.us/waters/watermgmt_section/appropriations/wateruse)
• Great Lakes Compact (www.dnr.state.mn.us/waters/watermgmt_section/great_lakes_compact/)
• Irrigation Outreach & On-Farm Nitrogen Management in Central Minnesota (www.mda.state.mn.us/irrigation-outreach-farm-nitrogen-management-central-minnesota)
• U of M Technical Assistance Program Water Conservation (www.mntap.umn.edu/focusareas/water/projects/)
• Met Council Water Efficiency Grant Program (https://metrocouncil.org/Wastewater-Water/Funding-Finance/Available-Funding-Grants.aspx)
Status Trend Description
There has been a slight improvement in water efficiency in recent years, although continued tracking is needed to determine the amount of impact from annual differences in weather versus changes in management.

2020 Clean Water Fund Performance Report | www.legacy.leg.mn 63
Social measures and external drivers
Social measures
Social measures track how Clean Water Fund investments affect people and communities, specifically their ability to support and engage in local projects. Tracking social measures provides valuable information about how well education, outreach and civic engagement strategies are working.
External drivers
External drivers are changing factors influencing the quality and quantity of water in Minnesota’s lakes, rivers, wetlands and aquifers that may impact our ability to achieve our Clean Water goals. External driver trends on pages 70-74 were selected to represent areas where major change is occurring in Minnesota.
1. Land-use changes2. Demographic changes3. Climatic changes

64 2020 Clean Water Fund Performance Report | www.legacy.leg.mn
Social measures
Building local capacity to support and engage in water restoration and protection
What are social measures? Social measures track how Clean Water Fund investments affect people and communities, specifically their ability to support and engage in local projects. Tracking social measures provides valuable information about how well education, outreach and public engagement strategies are working.
Social measures are a way of integrating social science into Clean Water activities. They can help answer questions about what motivates people and communities to take positive actions as well as the barriers and constraints that prevent or limit action. Understanding and measuring these factors helps state agencies be more strategic when engaging and partnering with the public to address water quality and quantity, and evaluating the success of those efforts.
Social measures have been described in previous Clean Water Fund Performance Reports (2016 and 2018). These previous reports provide a description of the Social Measures Monitoring System (SMMS) and how state agencies have worked together to pilot the application of this framework to Clean Water Fund projects. Below is a graphic that illustrates the four main components of social measures—individual, relational, programmatic and organizational capacity.
Figure 57. Four main components of social measures: individual, relational, programmatic and organizational capacity.
For more information and background on the approach, please refer to the “Learn More” section at the end of this profile.
What are we doing?In 2018-2019, state agency partners worked together to apply the SMMS as part of a larger evaluation for We Are Water MN. We Are Water MN is an initiative that uses the Minnesota Humanities Center’s (MHC’s) equity-based approach to community engagement, the Absent Narratives Approach™, that increases partnerships with communities and fosters equitable practices within systems.
The program is built upon the theory that building community capacity to protect water requires building relationships between community members, organizations and sectors. We Are Water MN does this through three key activities:
• building a network of partnerships,
• hosting a traveling exhibit and
• designing public events.
The state partners are MHC, Minnesota Pollution Control Agency, Minnesota Historical Society, and the Minnesota Departments of Agriculture, Health, and Natural Resources. During 2018-2019, the state partners worked with eight host communities:
• Austin
• Bemidji
• Crookston
• Fond du Lac/Duluth
• Grand Rapids
• Mille Lacs/Onamia
• Northfield
• University of Minnesota-Twin Cities
Practicing the Absent Narratives Approach™ as a framework for building relationships leads to the outcomes for water protection and restoration described in the SMMS, such as:
• Positive interpersonal relationships within

2020 Clean Water Fund Performance Report | www.legacy.leg.mn 65
communities that promote information exchange, build trust, foster shared identity and promote common awareness, concern and sense of responsibility for water.
• Networks that can promote positive social norms and share a vision for and participate in water stewardship.
• An increased and broadened community awareness of local water issues, because visitors to the exhibit and public programming come from more diverse backgrounds than one host organization could convene on its own.
What progress has been made? There are three main areas of evaluation using the SMMS for We Are Water MN. Data has been collected to evaluate:
• How have the relationships between the state partner agencies changed as a result of this project?
• How have (host-site) local networks changed as a result of this project?
• What do visitors to the exhibit learn, especially about their relationships or responsibilities to water?
State partners—Building Relational Capacity
The state partners are focused on developing shared language, vision and ways of working; connecting the host communities to resources, such as people, funding opportunities and knowledge; learning from host communities; and providing opportunities for host communities to learn from and with each other.
So far we have learned that we are increasing our ability to seek out input from communities that are often left out or marginalized. Over two years of working on this initiative, a greater percentage of state agency partners indicate that they actively work and plan with communities that are historically left out or not included. They also indicate that they are seeking input from these communities. This may be because the We Are Water Initiative has intentionally created opportunities for partners to build social networks to exchange information and knowledge and support positive
interactions. This can and has led to a stronger sense of community-based networks and respect for one another.
Figure 58. Partnership’s ability to seek input from communities historically left out or absent
Figure 59. Individual’s ability to learn from community/state partners
Host communities—Building Relational Capacity
The host communities are focused on developing their own local network, especially focusing on partnerships with organizations/people of color and indigenous people/organizations (though we want to call out that

66 2020 Clean Water Fund Performance Report | www.legacy.leg.mn
Figure 60. Number of partnerships and their type/strength reported from all eight host site organizations in the 2018-2019 tour, over the course of planning and hosting.
there is a slightly different focus for partnership building when hosting is led by people of color and/or indigenous people); planning public events in their community that help participants build their relationships with water and/or with each other; and assisting the state partners in identifying locally-relevant topics and content areas.
So far we’ve learned that host communities have built a cross-sector and interdisciplinary network of community organizations and other water stakeholders. Both the depth and the number of relationships increased over the course of the project.
Visitors—Building Individual Capacity
Visitors to the exhibit are asked to complete a survey describing how their personal responsibility to water was changed by the exhibit and how their awareness of water issues changed. For both of these questions, visitors could select all responses that applied to them.
Overall, the traveling exhibit provides a way to engage visitors and increase knowledge and awareness about local water resources. Survey results indicate that
approximately half of the visitors learned something new and feel a greater personal responsibility for water resources. Our hope is to support this initial learning and provide opportunities for these visitors to engage in local activities and work with others to protect water resources.
Responsibility to Water Response Options
% of Respondents
I now feel a greater personal responsibility for water resources and concerns than before I came to the exhibit.
51%
I am inspired to seek out others who also have a strong personal responsibility for water resources and concerns.
33%
I learned about information that has changed my personal responsibility for water resources and concerns.
29%
I feel some personal responsibility for water resources and concerns. 18%
I do not feel I have a personal responsibility for water resources and concerns. 1%

2020 Clean Water Fund Performance Report | www.legacy.leg.mn 67
Awareness of Water Issues Response Options
% of Respondents
I learned something new about water resources and concerns. 49%
The exhibit increased my personal awareness about water resources and concerns.
37%
I experienced a different perspective or story from my own about water resources and concerns.
35%
The information that I learned changed my personal views about water resources and concerns.
20%
I did not learn anything about water resources and concerns from the exhibits. 1%
ConclusionWe Are Water MN is built to focus on the social and relational aspects of water issues. By starting from relationships, we hope to be a part of building communities that are better equipped to solve problems collaboratively and be more resilient in the face of current and future water and environmental issues to meet the goals of the Clean Water Fund and the Legacy Amendment. We are also increasing state partners’ abilities to collaborate with each other and with local communities. Since 2016, We Are Water
MN has visited 16 communities, involved 379 community organizations, reached 44,000 visitors, and strengthened 6 state agencies’ relationships with each other and their ability to do meaningful community engagement.
Learn More• Davenport, M.A., & Seekamp, E. (2013). A multilevel
model of community capacity for sustainable watershed management. Society and Natural Resources: An International Journal, 26(9), 1101-1111
• Social Measure Metadata and a list of Social Outcomes Statements are located at Clean Water Fund (www.legacy.mn.gov/clean-water-fund)
• Margaret Wagner Minnesota Department of Agriculture [email protected] or 651-201-6488
Figure 61. The We Are Water exhibit engages visitors and provides an opportunity for learning and discussion
Status Trend Description
NEI
In recent years, state agencies have developed and piloted the Social Measures Monitoring System. This work integrates social science into Clean Water Fund projects.

68 2020 Clean Water Fund Performance Report | www.legacy.leg.mn
Figure 65. Expected relationships of external drivers to investments, actions and outcomes
External drivers
Important land use, population and climate trends
The trends outlined in this section represent important land use, population and climate-related changes that may influence the quality and quantity of water in Minnesota’s lakes, rivers, wetlands and aquifers. Because these factors are changing in ways that may impact our ability to achieve our Clean Water goals, they are referred to as external drivers. The external drivers highlighted in this report track changes occurring within Minnesota as a result of regional, national or even international activities. The broad scale at which these external drivers operate means that they cannot be solely managed through the Clean Water planning process, yet they can have a significant impact on the quality and quantity of Minnesota’s water resources.
External driver categoriesLand-use changes:
• Agricultural land use
• Impervious surface urban/suburban communities
• Wetland coverage
Demographic changes:
• Population size and proportion in urban/suburban counties
Climatic changes:
• Average Minnesota temperature
• Average Minnesota precipitation
Understanding how external drivers are changing over time provides important context for many of the Clean Water outcome measures highlighted in this report because those trends may increase or hamper Minnesota’s ability to achieve its Clean Water goals. Tracking external drivers can also provide important information to help enhance the effectiveness of protection and restoration actions that are implemented. By understanding how Minnesota’s landscape and climate are changing, Clean Water partners can fine-tune where money is invested and what actions are taken to enhance successful outcomes (see figure below). Tracking external drivers will help Clean Water partners adapt their actions over time, enhancing water quality and drinking water outcomes.
It is important to note that the relationship between the external driver and the water quality or drinking water outcome of interest is often complex and may vary from location to location. Just because one of the external driver categories highlighted in this section increases over time does not mean that water resource quality will decline. For example, increased adoption of best management practices or other actions by state and local governments may more than offset the change.
Of the many categories of external drivers that could be highlighted, this section focuses on a few selected land use, population and climate changes. The specific trends represented on the following pages were chosen because they represent major external driver categories and are reliably and routinely updated at a statewide scale.
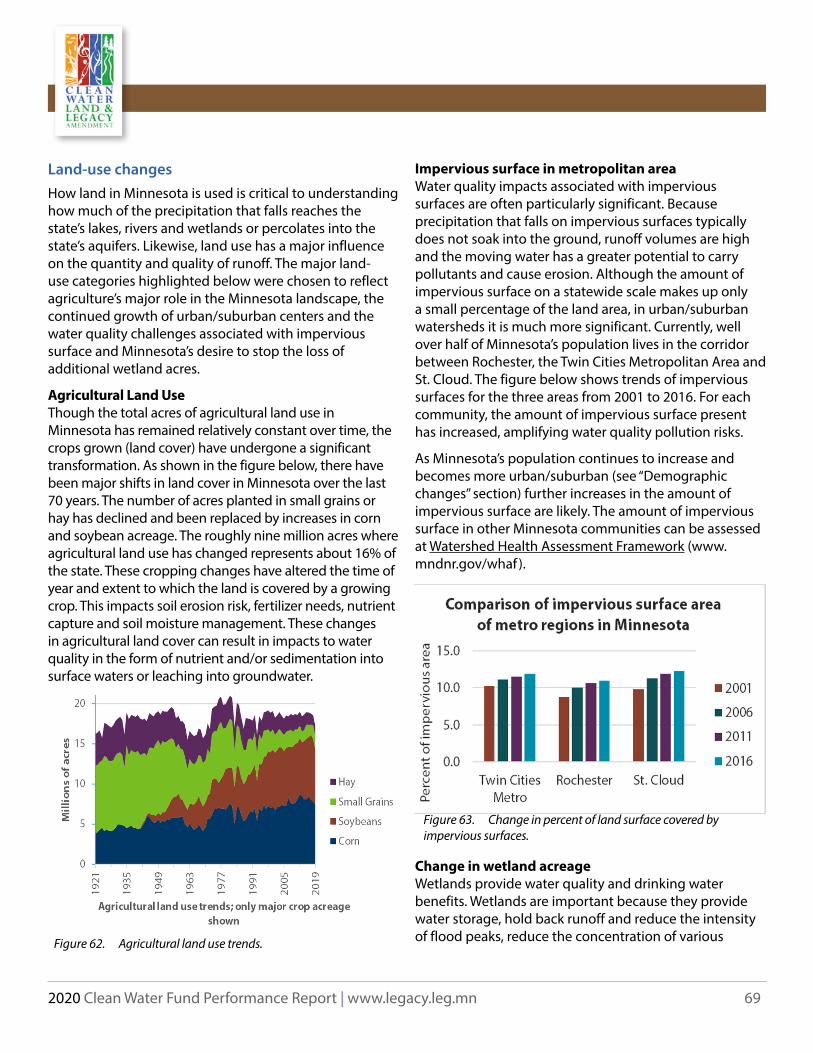
2020 Clean Water Fund Performance Report | www.legacy.leg.mn 69
Land-use changes How land in Minnesota is used is critical to understanding how much of the precipitation that falls reaches the state’s lakes, rivers and wetlands or percolates into the state’s aquifers. Likewise, land use has a major influence on the quantity and quality of runoff. The major land-use categories highlighted below were chosen to reflect agriculture’s major role in the Minnesota landscape, the continued growth of urban/suburban centers and the water quality challenges associated with impervious surface and Minnesota’s desire to stop the loss of additional wetland acres.
Agricultural Land UseThough the total acres of agricultural land use in Minnesota has remained relatively constant over time, the crops grown (land cover) have undergone a significant transformation. As shown in the figure below, there have been major shifts in land cover in Minnesota over the last 70 years. The number of acres planted in small grains or hay has declined and been replaced by increases in corn and soybean acreage. The roughly nine million acres where agricultural land use has changed represents about 16% of the state. These cropping changes have altered the time of year and extent to which the land is covered by a growing crop. This impacts soil erosion risk, fertilizer needs, nutrient capture and soil moisture management. These changes in agricultural land cover can result in impacts to water quality in the form of nutrient and/or sedimentation into surface waters or leaching into groundwater.
Figure 62. Agricultural land use trends.
Impervious surface in metropolitan area Water quality impacts associated with impervious surfaces are often particularly significant. Because precipitation that falls on impervious surfaces typically does not soak into the ground, runoff volumes are high and the moving water has a greater potential to carry pollutants and cause erosion. Although the amount of impervious surface on a statewide scale makes up only a small percentage of the land area, in urban/suburban watersheds it is much more significant. Currently, well over half of Minnesota’s population lives in the corridor between Rochester, the Twin Cities Metropolitan Area and St. Cloud. The figure below shows trends of impervious surfaces for the three areas from 2001 to 2016. For each community, the amount of impervious surface present has increased, amplifying water quality pollution risks.
As Minnesota’s population continues to increase and becomes more urban/suburban (see “Demographic changes” section) further increases in the amount of impervious surface are likely. The amount of impervious surface in other Minnesota communities can be assessed at Watershed Health Assessment Framework (www.mndnr.gov/whaf).
Figure 63. Change in percent of land surface covered by impervious surfaces.
Change in wetland acreage Wetlands provide water quality and drinking water benefits. Wetlands are important because they provide water storage, hold back runoff and reduce the intensity of flood peaks, reduce the concentration of various

70 2020 Clean Water Fund Performance Report | www.legacy.leg.mn
pollutants in runoff water and contribute to groundwater recharge. The abundance of wetlands has changed significantly in many parts of Minnesota. Since the 1800s, it has been estimated that about half of the state’s wetlands have been lost. In many parts of southern Minnesota, well over 90% of the original wetlands have been drained. Because of the benefits associated with wetlands, Minnesota adopted a “no net loss” of wetland policy in 1991, and in 2006 initiated a rigorous, long-term monitoring program to track changes in wetland quality and quantity over time. Between 2006 and 2008, the monitoring effort assessed wetland abundance in almost 5,000 plots across Minnesota to serve as a baseline. Those same sites are reassessed every three years to track the amount of change that is occurring.
Results through 2017 indicate that Minnesota had:
• A net gain of 2,430 acres (an increase of 0.023% of overall state wetland acreage) of wetland from 2006 to 2011,
• A net gain of 6,550 acres (an increase of 0.060%) from 2009 to 2014 and
• A net gain of 484 acres (0.0044%) from 2015 to 2017.
In spite of nominally achieving the state’s no-net loss goal with respect to wetland quantity, the data suggest important reasons to be concerned about the state of wetlands in Minnesota.
• Much of the observed gains were unconsolidated bottom type wetlands (ponds) that typically have limited wildlife habitat value.
• There are conversions between wetland types, such as emergent wetlands converted to cultivated wetlands or to unconsolidated bottom wetlands that, while not a loss of wetland area, undoubtedly represent a loss of wetland function.
Restoring wetlands may be an important practice in Minnesota to slow down runoff and trap pollutants before they reach downstream lakes and streams. Results from the wetland tracking effort described above suggest that historical patterns of outright wetland loss may be
leveling off, but there is a need to focus on restoring and maintaining wetland functional quality.
Demographic changesThe size and makeup of Minnesota’s population can stress water resource quality in terms of demand for water and how those uses impact the quality and quantity of water that is returned to the environment. As shown in the figure below, Minnesota’s population has increased steadily since 1950, and nearly all of that growth can be attributed to urban or suburban counties. This shift reflects more impervious surface that has the potential to impact surface water quality and quantity, increased water demand and associated impacts to groundwater and surface water supplies and an expanded volume of treated wastewater being discharged back into the environment. As Minnesota’s population continues to increase, so too will the demands placed on the state’s water resources. These changes may require modifications to current water quality actions and strategies.
Figure 64. Change in Minnesota’s population and urban/suburban versus rural distribution since 1950
Changing climate patterns Minnesota’s climate exhibits large season-to-season, and year-to-year variations that influence the condition of the state’s water resources, as well as the strategies that Minnesotans will need to employ to achieve restoration and protection goals. The amount and timing of precipitation influences how much water soaks into the ground —changing whether it can be taken up by plants, replenish soil and groundwater resources, or runs off directly into the nearby lakes, rivers and wetlands.

2020 Clean Water Fund Performance Report | www.legacy.leg.mn 71
Figure 66. Minnesota annual temperature, 1895-2018
Precipitation patterns also control water demand for outdoor uses such as agricultural and residential irrigation. Likewise, Minnesota’s temperature patterns affect the length of Minnesota’s winter - controlling the period when lakes and streams are covered by ice, the length of the summer growing season, how warm surface waters become, as well as many of the chemical, physical, and biological processes that shape how the state’s aquatic resources behave.
Minnesota’s historical climate record, covering 1895-2018, shows that the state is becoming both warmer and wetter. Minnesota’s average annual temperature has increased at a rate of + 0.24° F per decade or by a total of approximately 3° F during this period. Average annual precipitation has increased at a rate of 0.27 inches per decade or by a total of 3.3 inches since 1895.
The warming in Minnesota has become even faster
since 1970, increasing to a rate over 0.5° F per decade. This sharp uptick in warming has been driven by milder winters, fewer cold weather extremes and higher daily minimum temperatures. Winter is by far Minnesota’s fastest-warming season, followed by fall, spring and then summer. Minnesota has yet to see an increase in average summertime daily maximum (or “high”) temperatures. Instead, summer’s warming trend is from increasing overnight minimum temperatures. Warming rates have been faster in northern Minnesota than southern Minnesota.
As with temperature, precipitation in Minnesota has been increasing for many decades. Part of this increase was the natural rebound expected after the major drought episode of the 1920s and 1930s, when annual precipitation decreased to the lowest levels on record. However, in the past few decades, precipitation has
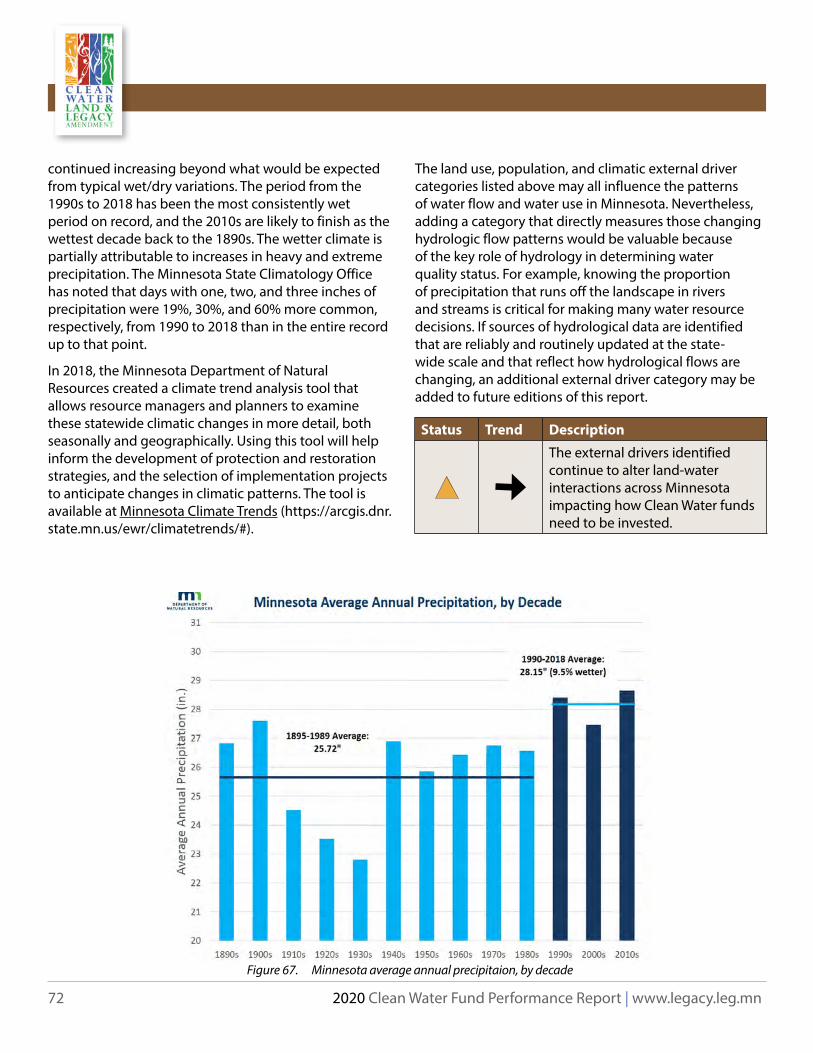
72 2020 Clean Water Fund Performance Report | www.legacy.leg.mn
Figure 67. Minnesota average annual precipitaion, by decade
continued increasing beyond what would be expected from typical wet/dry variations. The period from the 1990s to 2018 has been the most consistently wet period on record, and the 2010s are likely to finish as the wettest decade back to the 1890s. The wetter climate is partially attributable to increases in heavy and extreme precipitation. The Minnesota State Climatology Office has noted that days with one, two, and three inches of precipitation were 19%, 30%, and 60% more common, respectively, from 1990 to 2018 than in the entire record up to that point.
In 2018, the Minnesota Department of Natural Resources created a climate trend analysis tool that allows resource managers and planners to examine these statewide climatic changes in more detail, both seasonally and geographically. Using this tool will help inform the development of protection and restoration strategies, and the selection of implementation projects to anticipate changes in climatic patterns. The tool is available at Minnesota Climate Trends (https://arcgis.dnr.state.mn.us/ewr/climatetrends/#).
The land use, population, and climatic external driver categories listed above may all influence the patterns of water flow and water use in Minnesota. Nevertheless, adding a category that directly measures those changing hydrologic flow patterns would be valuable because of the key role of hydrology in determining water quality status. For example, knowing the proportion of precipitation that runs off the landscape in rivers and streams is critical for making many water resource decisions. If sources of hydrological data are identified that are reliably and routinely updated at the state-wide scale and that reflect how hydrological flows are changing, an additional external driver category may be added to future editions of this report.
Status Trend Description
The external drivers identified continue to alter land-water interactions across Minnesota impacting how Clean Water funds need to be invested.

This report and future updates can be found on the Minnesota’s Legacy website:
www .legacy .leg .mn/funds/clean-water-fund