classroom instruction that works - mcrel international · chapter 6: nonlinguistic ... strategies...
TRANSCRIPT

Classroom Instruction That Works
Second Edition
Research Report
November 2010
Edited by Andrea D. Beesley and Helen S. Apthorp

i
Acknowledgements The editors would gratefully like to acknowledge Jesse Rainey for report preparation; Maura McGrath for numerous, thorough, and rapid bibliographic searching and gathering of research articles; Jean Williams, Lou Cicchinelli, and Tim Waters for supporting the idea for and conduct of this research; John Hattie for reviewing and providing helpful comments and suggestions on both the technical aspects and the content; and the CITW 2nd Edition writing team (Ceri Dean, Elizabeth Hubbell, Howard Pitler, and BJ Stone) for asking insightful questions as researchers completed the report as designed.

i
Table of Contents Chapter 1: Methods ...................................................................................................................................... 1
Overview ................................................................................................................................................... 1
Literature Search ....................................................................................................................................... 2
Screening and Classification ...................................................................................................................... 3
Decision on Appropriate Analytic Method ........................................................................................... 4
Quantitative Methods of Meta-Analysis ................................................................................................... 5
Computation and Adjustments for Individual Effect Sizes ................................................................... 6
Computation of Overall Effect Sizes ..................................................................................................... 7
Reporting .................................................................................................................................................. 8
References ................................................................................................................................................ 9
Appendix 1.A: Coding Instrument ........................................................................................................... 10
Chapter 2: Identifying Similarities and Differences .................................................................................... 14
Background and Definitions .................................................................................................................... 14
Methods .................................................................................................................................................. 15
Literature Search – Keywords ............................................................................................................. 15
Article Sampling .................................................................................................................................. 15
Other Meta-Analyses .......................................................................................................................... 19
Other Methodological Notes .............................................................................................................. 19
Results ..................................................................................................................................................... 19
Meta-Analysis of Articles in Sample .................................................................................................... 19
Connecting New Research Information to Original CITW Findings ........................................................ 25
Main Points and Recommendations ....................................................................................................... 26
References .............................................................................................................................................. 27
Appendix 2.A: Summary of Intervention Characteristics by Article ....................................................... 29
Chapter 3: Summarizing and Note Taking .................................................................................................. 32
Background and Definitions .................................................................................................................... 32
Methods .................................................................................................................................................. 33
Literature Search ................................................................................................................................. 33
Article Sampling .................................................................................................................................. 33
Other Meta-Analyses .......................................................................................................................... 37
Results ..................................................................................................................................................... 38
Meta-Analysis of Articles in Sample .................................................................................................... 38
Connecting New Research Information to Original CITW Findings ........................................................ 42

ii
Main Points and Recommendations ....................................................................................................... 43
References .............................................................................................................................................. 44
Chapter 4: Reinforcing Effort and Providing Recognition ........................................................................... 46
Background and Definitions .................................................................................................................... 46
Reinforcing Effort ................................................................................................................................ 46
Providing Recognition ......................................................................................................................... 47
Methods .................................................................................................................................................. 48
Literature Search ................................................................................................................................. 48
Other Meta-Analyses .......................................................................................................................... 48
Results ..................................................................................................................................................... 50
Connecting New Research Information to Original CITW Findings ........................................................ 52
Main Points and Recommendations ....................................................................................................... 52
References .............................................................................................................................................. 54
Chapter 5: Homework and Practice ............................................................................................................ 56
Background and Definitions .................................................................................................................... 56
Practice ................................................................................................................................................ 56
Homework ........................................................................................................................................... 57
Methods .................................................................................................................................................. 58
Literature Search ................................................................................................................................. 58
Other Meta-Analyses .......................................................................................................................... 60
Results ..................................................................................................................................................... 61
Meta-Analysis of Articles in Sample .................................................................................................... 61
Connecting New Research Information to Original CITW Findings ........................................................ 66
Main Points and Recommendations ....................................................................................................... 67
References .............................................................................................................................................. 69
Chapter 6: Nonlinguistic Representations .................................................................................................. 72
Background and Definitions .................................................................................................................... 72
Methods .................................................................................................................................................. 73
Literature Search ................................................................................................................................. 73
Article Sampling .................................................................................................................................. 73
Other Meta-Analyses .......................................................................................................................... 77
Results ..................................................................................................................................................... 78
Meta-Analysis of Articles in Sample .................................................................................................... 78
Connecting New Research Information to Original CITW Findings ........................................................ 80
Main Points and Recommendations ....................................................................................................... 81

iii
References .............................................................................................................................................. 82
Chapter 7: Cooperative Learning ................................................................................................................ 84
Background and Definitions .................................................................................................................... 84
Methods .................................................................................................................................................. 88
Literature Search ................................................................................................................................. 88
Article Sampling .................................................................................................................................. 88
Other Meta-Analyses .......................................................................................................................... 93
Other Methodological Notes .............................................................................................................. 94
Results ..................................................................................................................................................... 95
Meta-Analysis of Articles in Sample .................................................................................................... 95
Results from the Primary Analysis for the Calculation of an Overall Effect Size ................................ 95
Connecting New Research Information to Original CITW Findings ........................................................ 99
Main Points and Recommendations ....................................................................................................... 99
References ............................................................................................................................................ 101
Chapter 8: Setting Objectives and Providing Feedback ............................................................................ 105
Background and Definitions .................................................................................................................. 105
Methods ................................................................................................................................................ 106
Literature Search ............................................................................................................................... 106
Article Sampling ................................................................................................................................ 106
Other Meta-Analyses ........................................................................................................................ 108
Results ................................................................................................................................................... 108
Meta-Analysis of Articles in Sample .................................................................................................. 108
Connecting New Research Information to Original CITW Findings ...................................................... 110
Main Points and Recommendations ..................................................................................................... 111
References ............................................................................................................................................ 112
Chapter 9: Generating and Testing Hypotheses ....................................................................................... 114
Background and Definitions .................................................................................................................. 114
Methods ................................................................................................................................................ 115
Literature Search ............................................................................................................................... 115
Article Sampling ................................................................................................................................ 115
Other Meta-Analyses ........................................................................................................................ 119
Other Methodological Notes ............................................................................................................ 120
Results ................................................................................................................................................... 120
Meta-Analysis of Articles in Sample .................................................................................................. 121
Connecting New Research Information to Original CITW Findings ...................................................... 124

iv
Main Points and Recommendations ..................................................................................................... 124
References ............................................................................................................................................ 126
Appendix 9.A: Summary of Achievement Lessons and Intervention Characteristics by Article ........... 128
Chapter 10: Cues, Questions, and Advance Organizers ........................................................................... 130
Background and Definitions .................................................................................................................. 130
Methods ................................................................................................................................................ 131
Literature Search ............................................................................................................................... 131
Article Sampling ................................................................................................................................ 131
Other Meta-Analyses ........................................................................................................................ 134
Results ................................................................................................................................................... 134
Meta-Analysis of Articles in Sample .................................................................................................. 134
Connecting New Research Information to Original CITW Findings ...................................................... 136
Main Points and Recommendations ..................................................................................................... 137
References ............................................................................................................................................ 138
List of Tables Table 2.1: Studies Included in the Meta-analysis of Identifying Similarities and Differences .................... 17Table 2.2: Independent Sample Effect Sizes for Identifying Similarities and Differences .......................... 20Table 2.3: Identifying Similarities and Differences Effect Size Moderator Analysis a ................................. 22Table 2.4: Independent Sample Effect Sizes Presented in Decreasing Magnitude with Type of Control Group Instruction ........................................................................................................................................ 23Table 3.1: Studies Included in the Note taking Meta-analysis .................................................................... 34Table 3.2: Studies Included in the Summarizing Meta-analysis ................................................................. 35Table 3.3: Kobayashi (2005) Effect Sizes by Moderator ............................................................................. 37Table 3.4: Individual & Composite Effect Sizes, Weights, and Confidence Intervals for Note Taking Studies
.................................................................................................................................................................... 39Table 3.5: Effect Size & Confidence Intervals for Secondary Analyses of Note Taking Studies by Moderator ................................................................................................................................................... 40Table 3.6: Individual & Composite Effect Sizes, Weights, and Confidence Intervals for Summarizing Studies ......................................................................................................................................................... 41Table 3.7: Effect Size & Confidence Intervals for Secondary Analyses of Summary Studies by Moderator
.................................................................................................................................................................... 42Table 4.1: Studies Included in the Effort & Recognition Meta-analysis ..................................................... 49Table 4.2: Correlations for Middle School Students among Latent Variables, Strategies Employed, and Achievement in Chan & Moore, 2006 ......................................................................................................... 50

v
Table 4.3: Correlations for High School Students among Latent Variables, Strategies Employed, and Achievement in Chan & Moore, 2006 ......................................................................................................... 51Table 5.1: Studies Included in the Homework Meta-analysis ..................................................................... 59Table 5.2: Studies Included in the Practice Meta-analysis ......................................................................... 59Table 5.3: Individual & Composite Effect Sizes, Weights, and Confidence Intervals for Homework Studies
.................................................................................................................................................................... 62Table 5.4: Individual & Composite Effect Sizes, Weights, and Confidence Intervals for Practice Studies . 65Table 6.1: Studies Included in the Nonlinguistic Representation Meta-analysis ........................................ 75Table 6.2: Range of Significant Effect Sizes Reported in Kim et al. (2004) ................................................. 77Figure 6.1: Boxplot of initial overall effect sizes ......................................................................................... 78Table 6.3: Individual & Composite Effect Sizes, Weights, and Confidence Intervals for Summarizing Studies ......................................................................................................................................................... 79Table 6.4: Effect Size & Confidence Intervals for Secondary Analyses of Nonlinguistic Representation Studies by Moderator ................................................................................................................................. 80Table 7.1: Elements of Cooperative Learning Models ................................................................................ 86Table 7.2: Studies Included in the Meta-analysis of Cooperative Learning ................................................ 90Table 7.3: Individual & Composite Effect Sizes, Weights, and Confidence Intervals for Included Studies 96Table 7.4: Effect Size & Confidence Intervals for Secondary Analyses by Moderator ................................ 98Table 8.1: Studies Included in the Objectives Meta-analysis .................................................................... 107Table 8.2: Studies Included in the Feedback Meta-analysis ..................................................................... 107Table 8.3: Individual & Composite Effect Sizes, Weights, and Confidence Intervals for Objectives Studies
.................................................................................................................................................................. 109Table 8.4: Individual & Composite Effect Sizes, Weights, and Confidence Intervals for Feedback Studies
.................................................................................................................................................................. 110Table 9.1: Studies Included in the Generating and Testing Hypotheses Review ...................................... 116Table 9.2: Effect Sizes from Schroeder et al. (2007) ................................................................................. 119Table 9.3: Individual Study Effect Sizes ..................................................................................................... 121Figure 9.1: Boxplot of initial overall effect sizes. ...................................................................................... 122Table 9.4: Random-effects Effect Sizes for Study Design, Grade Level and Location ............................... 123Table 10.1: Studies Included in the Cues and Questioning Meta-analysis ............................................... 133Table 10.2: Studies Included in the Advanced Organizers Meta-analysis ................................................ 133Table 10.3: Individual & Composite Effect Sizes, Weights, and Confidence Intervals for Cues & Questions Studies ....................................................................................................................................................... 135Table 10.4: Individual & Composite Effect Sizes, Weights, and Confidence Intervals for Advance Organizers ................................................................................................................................................. 136

1
Chapter 1: Methods
Overview
The current study updates and extends the original research synthesis of effective instructional strategies presented in Classroom Instruction that Works (CITW; Marzano, Pickering, & Pollock, 2001). That work identified nine instructional strategies for improving academic achievement and synthesized findings from previous meta-analyses around each. The present study extends and updates this original work. The each chapter in present review corresponds with the nine CITW instructional strategies:
1. Identifying similarities and differences 2. Summarizing and not taking 3. Reinforcing effort and providing recognition 4. Homework and practice 5. Nonlinguistic representations 6. Cooperative learning 7. Setting objectives and providing feedback 8. Generating and testing hypotheses 9. Cues, questions, and advance organizers
One rationale for an update is to take into account the work that has been done by educational researchers since 1998 on each of the nine strategies. As educational research methods have become more rigorous, partly in response to initiatives from the U.S. Department of Education, a larger body of experimental and quasi-experimental studies has been published. This has resulted in a change in how empirical research is conceptualized, conducted, and interpreted. Arguably, these advances in methodology provide a body of research with improved precision and more accurate impact estimates. The current study leverages these advancements to generate an updated effect estimate for each strategy. In addition, synthesizing more recent literature permits a close look at how the nine strategies are currently being operationalized and studied.
Charles Igel Helen Apthorp Andrea Beesley

2
Another rationale for a new edition lies in the advances in analytic techniques in the field of educational research within the past decade. The research synthesis supporting Classroom Instruction that Works ended in summer 1998. Since then, significant advancements have been made in the rigor of meta-analytic methods. Statistical programs such as Comprehensive Meta-Analysis (Biostat, Inc., 1999) now allow researchers to efficiently calculate and synthesize effect sizes from primary sources with much more efficiency and accuracy than previously was possible. The influence of individual studies can be weighted based on indicators of measurement precision. Advanced meta-analysis now includes statistical adjustments for sample clustering and weighting techniques that account for study variance. In writing CITW (2001), Marzano and colleagues synthesized the findings from meta-analyses around nine instructional strategies. Their process, essentially a meta-analysis of extant meta-analyses, identified nine instructional strategies with high probabilities of enhancing student achievement: identifying similarities and differences; summarizing and note taking; reinforcing effort and providing recognition; homework and practice; non-linguistic representations; cooperative learning; setting objectives and providing feedback; generating and testing hypotheses; and questions, cues, and advance organizers. The estimated overall effects on academic achievement from a total sample of approximately 4,000 unique effect sizes ranged from 1.61 to 0.59. The current study serves two primary functions: 1) to provide further conceptual clarity around each of the nine strategies and their uses, and 2) to generate an updated effect estimate for each strategy using literature published since the research ended for CITW. This work is an important departure from the original in that only primary studies in this synthesis were used, rather than findings from prior meta-analyses. This was done to enhance control over the data and ultimately provide a more accurate effect estimate for each strategy. Meta-analyses are particularly complicated endeavors and mistakes in the application of the methodology are always a concern (see Bailar, 1997). Synthesizing the finding from previously conducted meta-analyses compounds these risks as the potential errors across all studies are aggregated. By using only primary-source material and carefully specifying research protocols, the present study seeks to obviate these risks.
Literature Search
Literature search protocols were designed to identify relevant empirical literature and descriptive/theoretical literature around each of the nine strategies published between 1998 and 2008. The search focused on articles published in peer-reviewed journals in order to ensure quality standards were met. To identify study reports with direct relevance to student achievement, only those studies that included measures of academic content knowledge and skills were selected. While other recent reviews of instructional research (e.g., Seidel & Shavelson, 2007) have included studies using learning process outcome measures and motivational-affective outcome measures, the present report follows the lead of CITW and focuses solely on academic achievement. Search and selection protocols were used in multiple waves and were designed to identify studies of interventions relevant to the nine strategies contained in the original version of CITW and to screen the studies for methodological rigor. Initial literature searches of the Education Resource Information Center (ERIC) database were conducted by trained research staff using achievement and learning as the outcome keywords crossed with each instructional strategy. Follow-up searches were conducted for each strategy after the second screening to fill in gaps. Keywords used for searches

3
are given in each chapter. Informal weekly meetings were held to maintain screener reliability. Abstracts from identified articles were printed and reviewed to determine if the article met the five criteria for preliminary relevance. These criteria were:
• Published between 1998 and 2008 • Included students in grades PreK-12 • Examined a teaching/instructional approach or strategy • Used academic achievement as a measured outcome • Had one of the following designs: a) multi-group experimental, b) multi-group quasi
experimental, c) single group pre/post, d) correlational, e) single subject, f) qualitative, or g) used meta-analysis or a narrative approach to reviewing a body of research
• Was written in English Relevant meta-analyses, narrative reviews, qualitative and primary studies were selected. When synthesizing the research for each category, narrative reviews, qualitative research, and theoretical literature were used to improve and/or update conceptual clarity around each of the nine strategies. Primary empirical studies were used to estimate composite effects for those strategies and interpreted effects in relation to those originally estimated in CITW. Furthermore, contextual data from primary empirical studies were used to analyze moderator/mediator effects whenever sufficient data were available. By February 2008, nearly 2,000 potentially relevant articles were identified as a result of these initial searches. Relevance reviews of the study abstracts eliminated 1,488 articles based on non-relevant grade levels (e.g., college) or topic (e.g., school-wide systemic reform rather than instructional strategy), leaving 512 studies remaining for a second relevance review.
Screening and Classification
As previously stated, meta-analyses are complicated endeavors and an abundance of care should be taken to avoid methodological mistakes (Bailar, 1997). A common criticism leveled against meta-analyses is that of mixing apples and oranges (Slavin, 1986). This legitimate criticism is essentially a construct validity concern that studies differing in important ways are synthesized to generate a single effect estimate. To protect construct validity within each of our nine instructional strategies, studies that passed the initial review process received in-depth screening and coding with an enhanced set of criteria. A framework of threats to construct validity informed by Shadish, Cook, and Campbell (2002) and Briggs (2008) was used for further assessing candidate studies. This framework addressed three critical areas. First, a treatment condition must have been tested against a control that differed in type from the treatment. This ensured that across all studies, the treatment was tested against a counterfactual condition. The effect here was that studies testing different versions of the treatment against each other were excluded. Second, studies had to measure the treatment effect on some measure of academic performance. This ensured that different outcomes were not combined into a single effect. The effect here was that studies measuring alternative outcomes such as motivation, retention, or efficacy were excluded. Finally, studies that analyzed their outcome data in a manner consistent with their unit of assignment were sought out. Because most studies take place within intact classrooms, effect estimates may conflate intervention effects with other classroom influences. A mismatch between the level of assignment and analysis can lead

4
to misestimation of the impact. Despite analytic techniques for handling this clustering (e.g., hierarchical linear modeling) few studies accounted for this clustering effect. Whenever this occurred, impact estimates were recalculated by the research team using statistical adjustments to account for clustering. The procedures for this adjustment are described below. Each study was coded for information about the research design, study site and student sample, instructional strategy, and data analysis. Table 1.1 shows the types of coding for each variable. Total student sample size (N) was also recorded. A code for missing values was used when data were not available. A copy of the coding sheet is provided in Appendix 1.A of this chapter. Table 1.1: Coding Used in Current Meta-Analysis
Research Designs Study Site Characteristics Student Characteristics
1. Meta-analysis 2. Narrative research review 3. Randomized controlled trial
(RCT) 4. Quasi-experimental design
(QED) 5. Single-case design 6. Regression discontinuity
design 7. One group (within subjects)
pre- and post-test design 8. Descriptive (no
manipulation of variables) 9. Other
1. Studies conducted within the United States and studies conducted abroad
2. Urbanicity (urban, suburban, rural)
3. Socio-economic status (low, medium, high)
1. Grade 2. Subgroup (e.g., special
education, at-risk) 3. Average age 4. Composition by racial group
and gender
Instructional strategies were classified according to the nine CITW strategies as well as described and named using the study authors’ or developers’ language to define the intervention. Additionally, characteristics of the context in which the instructional strategy was studied were classified, including 1) the grouping arrangement (e.g., whole class, pairs), 2) content or subject area (English/language arts, social studies, science, and mathematics), and 3) duration (total hours). Each achievement measure used to examine the effects of the instructional strategy was identified and categorized either as standardized (requiring standard administration and producing norm-referenced scores or performance scores for state accountability) or other (researcher- or teacher-developed).
Decision on Appropriate Analytic Method Determination of the appropriate analytic method of synthesis was conducted on a case-by-case basis for each of the nine instructional strategies. Two methods were used—meta-analysis and literature review. Meta-analysis was used when the research team determined that sufficient quantitative data was available to estimate a robust effect size. Whenever a category contained fewer than four independent primary studies, a literature review was conducted. The literature review provides a narrative description of identified studies as well as a description of context and findings.

5
Unlike the meta-analysis, the literature review does not provide a composite effect for the strategy because there is no insurance against the possibility that findings from identified studies may be “outliers” from the theoretical true effect of the intervention. Because of this, a meta-analysis was conducted whenever a sufficient number of studies was available.
Quantitative Methods of Meta-Analysis
Findings from single studies were quantified into a standardized unit of measurement whenever sufficient information was made available in study reports. This standardized mean difference (effect size) compared the achievement of students who experienced one of the CITW-related interventions (treatment group) and the achievement of students who did not experience the intervention (control group).

6
Computation and Adjustments for Individual Effect Sizes One effect size for each independent sample in each study was identified or computed. When researcher-reported effect sizes were available in identified reports, the effect sizes were confirmed by re-computation. If necessary information was unavailable, but the procedures for computing the effect size were clearly reported by the researcher, the researcher-reported effect size was used. For those cases where our research team calculated the effect size from data available in the study, a standardized mean difference using the pooled standard deviation across treatment and control groups (Hedges’ g) was used. This effect size is calculated as
g = �Y�T − Y�C
SP� � �1 − �3
(4df− 1)� ��
where 𝑌𝑌�𝑇𝑇 = mean score of the treatment group, 𝑌𝑌�𝐶𝐶 = mean score of the control group, 𝑆𝑆𝑃𝑃 = pooled standard deviation across both groups, and df = 𝑛𝑛𝑇𝑇 + 𝑛𝑛𝐶𝐶 − 2 for independent groups. As the above formula demonstrates, Hedges’ g is similar to Cohen’s d (the first part of the formula) with a correction for small group samples (the second part of the formula), often referred to as J. Because J < 1.0, Hedges’ g will generate a more conservative estimate than Cohen’s d. However, as the overall sample size increases, J ≈ 1.0 and the difference between g and d becomes nominal. Most researcher-reported or research-team-calculated effect sizes were adjusted to account for a mismatch between study design and analytic method. Nearly all identified studies across the nine instructional categories (even those with random assignment to condition) assigned at the class level rather than the individual level. The process of randomly assigning an intact group to a condition is known as cluster randomization. Cluster randomized designs tend to produce overestimated effects (Hedges, 2007). To guard against bias, data from cluster randomized designs need to be treated differently during analysis than data from simple randomized designs that assign to condition at an individual level. When study participants are clustered together, as is often the case in educational research, participants’ scores are considered non-independent (Raudenbush & Bryk, 2002). Students within a classroom learn from each other; their behaviors and attitudes affect each other, and the knowledge that is shared during classroom discourse affects learning. If the shared variance created by this non-independence is not accounted for, estimates may conflate intervention effects with other classroom influences such as peer effects. A common approach to account for this clustering is the use of multilevel models that partition variance across the individual and group levels (Raudenbush & Bryk, 2002). For included cluster randomized studies that did not use multilevel analysis, the study team calculated effect sizes and variance (or adjusted them if they were already reported in the study) to account for clustering. The adjustments for cluster randomized data were derived from Hedges’ (2007) framework. The adjusted effect size (𝑑𝑑𝑇𝑇2) was calculated as
𝑑𝑑𝑇𝑇2 = �𝑌𝑌�𝑇𝑇 − 𝑌𝑌�𝐶𝐶
𝑆𝑆𝑇𝑇��1 −
2(𝑛𝑛 − 1)𝜌𝜌𝑁𝑁 − 2

7
where 𝑌𝑌�𝑇𝑇 = mean of the treatment group scores, 𝑌𝑌�𝐶𝐶 = mean of the control group scores, 𝑆𝑆�̅�𝑇 = the standard deviation of the treatment condition, n = average cluster sample size for both conditions, 𝜌𝜌 = intraclass correlation coefficient, and N = the total sample size for the study (Hedges, 2007, p. 349). Corresponding adjustments to the variance around 𝑑𝑑𝑇𝑇2 were also calculated following Hedges’ model. No study provided the necessary intraclass correlation (𝜌𝜌) or the raw data for calculating it; therefore an average value (𝜌𝜌 = .20) recommended by Hedges and Hedberg’s (2007) compendium of intraclass correlations for academic achievement was used for all effect size adjustments.
Computation of Overall Effect Sizes The purpose of a meta-analysis is to quantitatively synthesize effect estimates from multiple independent studies. A meta-analysis produces essentially an average effect size of identified studies. However, rather than a simple average, a meta-analysis produces a weighted average. Typically, the inverse of a study’s variance is used as its weight— studies with relatively lower variance having a greater impact on the calculation of the average effect. A meta-analysis is based on the assumption that the included studies share enough common elements to warrant synthesis (Lipsey & Wilson, 2001). However, there is no reason to believe that these elements are exactly the same. This is particularly true in social science research. A random effects model, one type of meta-analytic model, accounts for this by allowing for a distribution of true effect sizes for a given intervention rather than a single true effect. To do this, the composite effect among a set of studies is modeled as a combination of internal measurement error and within-study variation due to the differences among study characteristics. The conceptual model that follows from this assumption is
𝑇𝑇𝑖𝑖 = 𝜇𝜇 + 𝜑𝜑𝑖𝑖 + 𝜀𝜀𝑖𝑖
where 𝑇𝑇𝑖𝑖 = the observed effect size, 𝜇𝜇 = the mean of all calculated effect sizes, 𝜑𝜑𝑖𝑖 = between-study error, and 𝜀𝜀𝑖𝑖 = within-study error. As the formula illustrates, the estimated impact from any study (𝑇𝑇𝑖𝑖) is a function of the mean of the mean effect, between-study error, and within-study error (Borenstein, Hedges, Higgins, & Rothstein, 2009). Conceptually, the random effects-model assumes that the included studies are one of many possible samples from the universe of relevant studies, with the implication that an alternate set of selected studies would yield a different composite effect. An example from one of the CITW instructional strategies will help illustrate this point. Cooperative learning is a specific strategy that contains common elements of positive interdependence and individual accountability (Johnson & Johnson, 2009); therefore, it makes sense to synthesize effects across multiple studies. However, it strains credulity to believe that the interventions across all studies are perfectly identical. Individual teaching styles, student characteristics, prior experience with the strategy, and a litany of other covariates may differentially impact the outcome of the intervention. Knowing this, it is important to estimate a composite effect in a manner that accounts for study quality while including the effect of all studies because each may contribute something different to the estimation. The practical implication of this is reflected in the weight assigned to each individual study (wi) for the computation of the composite effect. To compute a composite effect size for each strategy,

8
individual effect sizes were weighted by a value inversely proportional to within-study variance moderated by total between-study variance (Lipsey & Wilson, 2001). The calculation of this composite effect is a function of individual effects from each study weighted by the inverse of their variance (error)
𝑇𝑇�𝑐𝑐 = ∑𝑤𝑤𝑖𝑖𝑇𝑇𝑖𝑖∑𝑤𝑤𝑖𝑖�
where 𝑇𝑇�𝑐𝑐 = the composite effect for the meta-analysis, 𝑤𝑤𝑖𝑖 = the inverse variance weight assigned to an individual study, and 𝑇𝑇𝑖𝑖 = the effect for study i. The inverse variance weight for the random effects model is calculated as show below.
𝑤𝑤𝑖𝑖∗ = 1 𝑣𝑣𝑖𝑖� 𝑣𝑣𝑖𝑖 = 𝑣𝑣𝑖𝑖 + 𝜏𝜏2
where 𝑤𝑤𝑖𝑖 = the variance weight assigned to an individual study, 𝑣𝑣𝑖𝑖 = within study variance and 𝜏𝜏2) = between-study variance. As demonstrated by the formulas, the random-effects model allows smaller studies (that typically contain more error) greater influence over the composite effect than if the between-study error term 𝜏𝜏2were not included (Borenstein, et al., 2009). Analyses were conducted using dedicated meta-analytic software, Comprehensive Meta-analysis V2.2 (Biostat, Inc., 1999). Data from primary source studies was entered separately for each instructional strategy for which a composite effect was to be calculated. Summary output was interpreted using the program-generated random effects model with Hedges’ g selected as the composite effect metric. Additional output such as study weight and the 95% confidence interval around the composite effect were selected and interpreted for each meta-analysis. Secondary analyses of mediating and/or moderating variables that appeared relevant to the instructional strategy (e.g., length of intervention, grade-level) were analyzed whenever enough studies were available to provide the necessary data. The availability of this data varied widely across studies; and some strategies simply had an insufficient number of studies to support a robust secondary analysis. For those strategies for which secondary analyses were conducted, a Q-value was calculated to assess the heterogeneity among results from the included studies. These data are reported within the chapter for each strategy.
Reporting
Each of the following chapters reports on one of the nine instructional strategies identified in CITW with the purpose of updating the research base and extending the conceptual explanation of the topic. Chapters begin with a review of background, key terminology, constructs, and connections around the topic, followed by a section on methods of the meta-analysis. Specific methods are described, such as keywords used to search for relevant literature and the nature of identified studies, as well as any additional methodological issues specific to that chapter, such as whether a literature review or meta-analysis was conducted. Results are reported and interpreted within the context of findings for CITW. Each chapter then concludes with interpretations of the findings and recommendations around the use of the strategy.

9
References Bailar, J.C. (1997). The promise and problems of meta-analysis. New England Journal of Medicine, 337,
559-561. Biostat, Inc. (1999). Comprehensive meta-analysis (Version 2). Englewood, NJ. Borenstein, M., Hedges, L. V., Higgins, J. P., & Rothstein, H. R. (2009). Introduction to meta-analysis.
West Sussex, UK: Wiley. Briggs, D. C. (2008) Comments on Slavin: Synthesizing causal inferences. Educational Researcher,
37(1), 15-22. Hedges, L. V. (2007). Effect sizes in cluster randomized designs. Journal of Educational and Behavioral
StatisticsHedges, L. V., & Hedberg, E. C. (2007). Intraclass correlation values for planning group randomized
experiments in education. Educational Evaluation and Policy Analysis, 29, 60-87.
, 32, 341-370.
Johnson, D. W., & Johnson, R. T. (2009). An educational psychology success story: Social interdependence theory and cooperative learning. Educational Researcher, 38(5), 365-379.
Lipsey, M. W. & Wilson, D. B. (2001). Practical meta-analysis. Thousand Oaks, CA: Sage. Marzano, R., Pickering, D., & Pollock, J. (2001).Classroom instruction that works: Research-based strategies
for increasing student achievement. Alexandria, VA: Association for Supervision and Curriculum Development.
Raudenbush, S. W., & Bryk, A. S. (2002). Hierarchical linear models: Applications and data analysis methods (2nd ed.). Thousand Oaks, CA: Sage.
Seidel, T. & Shavelson, R. J. (2007). Teaching effectiveness research in the past decade: The role of theory and research design in disentangling meta-analysis results. Review of Educational Research, 77(4), 454-499.
Shadish, W. R., Cook, Thomas D. & Campbell, D. T. (2002). Experimental and quasi-experimental designs for generalized causal inference. Boston: Houghton-Mifflin.
Slavin, R. E. (1986) Best-evidence synthesis: An alternative to meta-analysis and traditional reviews. Educational Researcher, 15(9), 5-11.

10
Appendix 1.A: Coding Instrument
INITIAL CODER name & date: FINAL CODER name and date:
RELEVANCE
1. Study Summary (cite page numbers where appropriate)
1.01 Reference Citation (Author and publication year):
1.02 Title (or first several words):
1.03 Purpose of study:
1.04 ID#:
2. Confirm/Disconfirm Relevance
Exclude if any of the questions below are answered “no”:
2.01 Published between 1998 and 2008?
2.02 Includes students in grades between PreK and Grade 12?
2.03 Examines a teaching or instructional approach or teaching or instructional strategy(ies) when defined as
“a named procedure or technique promoting learning objectives that staff implement in interacting with
children and materials in their classroom”
2.04 Achievement or one or more 21st
2.05 The design of the study is one of the following: a) multi-group experimental, b) multi-group quasi
experimental, c) single group pre/post, d) rigorous correlational, e) single subject, or f) qualitative?
century skills is/are measured as an outcome?
2.06 Written in English?
3. Research Design 3.01 Type of research design (check only one and describe the method or design to clarify choice if needed)
a. Meta-analysis:
b. Narrative research review:
c. Randomized control trial (RCT) (students, classrooms, schools, or treatment – are randomly
assigned to a condition randomly):
d. Quasi-experimental design (QED) (non-random assignment with two or more groups in
different conditions or levels of treatment):
e. Single-case design (involves one individual or group of individuals performing during baseline
and during and/or after one or more different conditions, AND in each phase, there is a
‘‘minimum of three data points across time):
f. Regression discontinuity design (participants assigned to intervention and control based on
either side of cutoff score on pre-intervention measure that has a linear relationship with
outcome and assesses need or merit):

11
g. One group (within subjects) pre-experimental pre and post-test design.
h. Descriptive (no manipulation of variables). Circle one of the following:
i. descriptive study using surveys, interviews, achievement tests etc. (comparison of groups)
ii. results of correlational analyses
iii. results of multivariate regression analyses.
iv. qualitative analyses with no manipulation of variable(s)):
v. Other. Specify:
i. Other. Specify:
4. Research Method
4.01 Was equivalence of groups tested at pretest?
a. Yes
b. No (skip 4.04)
4.02 If pretest equivalence tested, what were the differences?
a. Not statistically different
b. Statistically significant difference AND addressed in analysis
c. Statistically significant difference and NOT addressed in analysis
5. Study Sample (cite page numbers where appropriate)
5.01 Country and/or Region: ____________________________ Missing
5.02 School/district locale: Urban Suburban Rural Missing
5.03 Socioeconomic status: Low Middle High Missing
5.04 Students’ Grade Level (that apply): Elementary Middle High Missing
5.05 Students’ Grade(s) (circle all that apply): PreK K 1 2 3 4 5 6 7 8 9 10 11 12 Missing
5.06 Category of students (check all that apply): Missing Average At-risk SpEd ESL/ELL
Specify SpEd Focus (if needed): LD/ Rdg Disab Ment Ret Behav/Emot Dis Othr:
5.07 Age (mean in years): Missing
5.08 Predominant Race (circle one): a. >60% white b. > 60% Black c. > 60% Hispanic
d. > 60% other minority e. mixed, none > 60% f. mixed, cannot determine proportion g. cannot tell
5.09 Predominant Gender (circle one): a. <5% male b. 6-40% male c. 41-60% male d. 61-94% male
e. > 95% male f. cannot tell
5.10 Total sample size at start of study:
6. Independent Variable/Instructional Strategy
6.01 Developers name of instructional strategy:
6.02 Description of strategy:
6.03 Name and description of control condition:

12
6.04 Circle CITW (2001) categories into which the strategy fits:
2. Identifying similarities and differences 7. Cooperative learning
3. Summarizing and note taking 8. Setting objectives and providing feedback
4. Reinforcing effort and providing recognition 9. Generating and testing hypotheses
5. Homework and practice 10. Cues, questions, and advance
6. Nonlinguistic representations Other:
6.05 Grouping for intervention (circle one):
a. whole class or as a large group b. small group (3 – 8 students) c. in student pairs
d. individual with teacher (or other) e. independent (student alone) f. other
6.06 Subject area (check one): Eng/LA Soc. Studies Science Math Other
6.07 Duration of the use of the instructional strategy:
6.07a. Duration of subjects’ participation/exposure to the instructional strategy:
Total hours: Missing Total days: _______ Missing
Comments (if needed):
7. Analysis and Results (cite page numbers where appropriate)
7.01 Was there a match between unit of assignment and analysis (check one):
a. NA (no assignment)
b. Matched (check one): both students both teachers both schools HLM
c. Not matched (check one):
Not matched and not addressed in analyses
Not matched, but is addressed in analyses; explain:
8a. Measurement of Dependent Variable(s)/Outcome(s)
8.01 Name of outcome measure(s):
8.02 Type of dependent measures used (check one)
standardized (norm-referenced, standard administration, or state assessment)
other

13
9a. Results
Record all available data in this top section regardless of assignment/analysis match.
9.01 ES (researcher reported) (type )
9.02 Treatment Group 1: TX , SDT , nT
9.03 Treatment Group 2 (if needed):
TX , SDT , nT
9.04 Control Group:
CX , SDC , nC
9.05 Test Statistic: (type )
9.06 r(covariate, DV)
(Complete ONLY if ANCOVA was conducted.)
Only record data in this section if there is an assignment/analysis mismatch. (m = number of clusters)
9.07 Treatment Group: mT
9.08 Control Group: m
C
Only record data in this section if there are multiple unadjusted (statistically) comparisons. (>3)
9.09 No. of comparisons:
9.10 All p-values:
9.11 (If p-values not available record all t-values or ESs here.):

14
Chapter 2: Identifying Similarities and Differences
Background and Definitions Among the most fundamental mental operations in learning may be the operation of identifying similarities and differences. By observing and reasoning about similarities and differences, learners gain insight, draw inferences, abstract generalizations, and develop or refine schemas (Holyoak, 2005). In How People Learn, the authors extolled the benefits of contrasting cases to promote conceptual understanding, writing that “appropriately arranged contrasts can help people notice new features that previously escaped their attention and learn which features are relevant or irrelevant to a particular concept” (Bransford, Brown, & Cocking, 2000; p. 48). Because the operations of identifying similarities and differences help move students from old to new knowledge, and from concrete to more abstract ideas, many scholars consider them to be at the core of all learning (Chen, 1999; Duit, Roth, Konerek, & Wilbers, 2001; Gentner, Loewenstein, & Thompson, 2003; Marzano, Pickering, & Pollock, 2001; Vosniadou, 1988). There are four strategies that teachers can use to engage students in identifying similarities and differences: comparing, classifying, creating and/or using analogies, and creating and/or using metaphors. In their book, Classroom Instruction that Works, Marzano, Pickering, and Pollock (2001, p. 17) defined each of these as follows:
1. Comparing is the process of identifying similarities between or among things or ideas. The term contrasting refers to the process of identifying differences; most educators, however, use the term comparing to refer to both.
2. Classifying is the process of grouping things that are alike into categories on the basis of their characteristics.
3. Creating analogies is the process of identifying relationships between pairs of concepts—in other words, identifying relationships between relationships.
4. Creating metaphors is the process of identifying a general or basic pattern in a specific topic and then finding another topic that appears to be quite different but that has the same general pattern.
One interpretation of why identifying similarities and differences promotes learning and achievement is that the cognitive processes result in “a more abstract schema for a class of
Helen Apthorp

15
situations” (Holyoak, 2005; p. 118). Having such a schema adds richness and connectivity to a student’s knowledge, increasing the likelihood that a student will recognize when a new observation or experience fits the schema’s class of situations and be able to make sense of it. The process of developing a more abstract schema, or deeper, more connected understanding of a concept, was illustrated in the student’s reflection on a lesson about equilibrium in a chemistry class lesson, recorded by Harrison and De Jong (2005, p. 1152) and provided below:
Mal: “I remember him using that analogy…it sounds like a difficult analogy for an equilibrium situation because it’s just cars rushing past, and it doesn’t have a constant amount; oh, actually it does make a lot of sense now because it’s reached its saturation point because it’s got as many cars as the road’s going to be able to hold at one time or safely without people tailgating, and yeah there’s no room to come on unless someone comes off, which is an equilibrium situation of one particle dissolving so another particle can undissolve.” Interviewer: “An equilibrium.” Mal: “Yeah…. I picture what he’s talking about in his analogy and I apply that, and I learn it, but it’s not a thing I use to remember. I don’t, you know, sit in a test and go what was the story with the cars, because I’ve used the story to learn it.”
There is at least one estimated general effect for the influence of identifying similarities and differences on student achievement. By averaging 31 effect sizes provided in a previous synthesis (Marzano, 1998) of meta-analyses on instructional strategies, Marzano et al. (2001) reported an average effect size of 1.61 for the influence of identifying similarities and differences on student achievement. The authors concluded that identifying similarities and differences had a high probability of enhancing student achievement. The purpose of the present study was to update this estimate of the effect of using identifying similarities and differences to facilitate student learning and achievement with relevant, recently published research.
Methods
Literature Search Bibliographic databases in both education and psychology (e.g., Education Resources Information Center, Education: A SAGE Full Text Collection, Professional Development Collection, PsycInfo, and JSTOR) were searched using achievement and learning as the outcome keywords crossed with each strategy keyword: analogy, metaphor, compare and contrast, identifying similarities and differences, and classification. Follow-up searches were conducted by adding academic subject area keywords (mathematics, reading, writing, science, social studies) to the search terms, yielding additional study articles. Author searchers were then conducted based on citations in the included studies. Searches continued until results repeatedly contained duplicate hits.
Article Sampling To locate, analyze, and synthesize recent research on the effectiveness of analogies and related strategies, used specified search and study selection procedures were used and attended to both the methodological and substantive features of individual studies when preparing cases for the meta-

16
analysis. Only studies using multi- or two-group experimental designs to test an intervention involving comparing and contrasting, classification, analogical reasoning, and/or use of metaphors were included. Studies that passed the initial review process received more in-depth screening and coding with a set of classification criteria. The study interventions were classified according to type of strategy used by students and/or teachers to identify similarities and differences, including analogical reasoning, comparing and contrasting (also involving classification), and use of metaphors. Outcome measures were classified according to whether they were teacher- or researcher-developed or standardized (i.e., requiring standard administration and producing norm-referenced scores or performance scores for state accountability). The study design was classified as a randomized controlled trial (RCT) or as a two-group comparison (without random assignment). Context features were used to classify subject area (science, mathematics, social studies, and reading) and grade level and describe the instructional conditions of control groups. Summary statistics were identified and recorded as well (e.g., number of students per group). Based on these inclusion criteria, 12 studies were included in the analysis. Additional studies were located but excluded from the meta-analysis for the following reasons: involved only university students, used other research designs (e.g., qualitative), and lacked student achievement outcome measures (e.g., only teacher performance, not student performance, was measured or observed). The included studies examined a variety of interventions across different grade levels and subject areas. The strategies examined included analogies for conceptual change, generating analogies, analogous problems and examples, comparing and contrasting, and metaphorical priming (see Table 2.1). Classification, although absent from the list, was used by students in the analogous problems and comparing and contrasting interventions. In the Chen (1999) study, for example, the intervention engaged students in classification of problems into four different problem types. A summary of the selected articles (N = 12) is provided in Table 2.1.

17
Table 2.1: Studies Included in the Identifying Similarities and Differences Meta-analysis
Study Research Design† Grade Level Sample
Size Locale Content
Area Tested
Instructional Strategy Tested Outcome Measure
Baser & Geban (2007) RCT High 60 Turkey Science Analogies for conceptual change
Researcher-developed test of taught content
BouJaoude & Tamim (1998)
RCT Middle 49 Beirut Science Generating analogies Researcher-developed test of taught content
Chen (1999) Two-group comparison
Elementary 260 U.S. mid-size city
Math Analogous problems Researcher-developed test of taught content and solution schema
Fuchs, Fuchs, Finelli, Courey, Hamlett, Sones, & Hope (2006)
RCT Elementary 445 U.S. urban Math Analogous problems Researcher-developed test of taught content in familiar and novel contexts
Ling, Chik & Pang (2006)
Two-group comparison
Elementary 71 Hong Kong Science Comparing and contrasting
Researcher-developed test of taught content
Mbajiorgu, Ezechi & Idoko (2007)
Two-group comparison
High 282 Nigeria Science Comparing and contrasting
Researcher-developed test of taught content
Pang & Marton (2005) Two-group comparison
High 169 Hong Kong Social Studies
Comparing and contrasting
Researcher-developed test of taught content
Rittle-Johnson & Star (2007)
RCT Middle 70 U.S. urban Math Comparing and contrasting
Researcher-developed test of
18
Note: RCT – randomized controlled trial
taught content
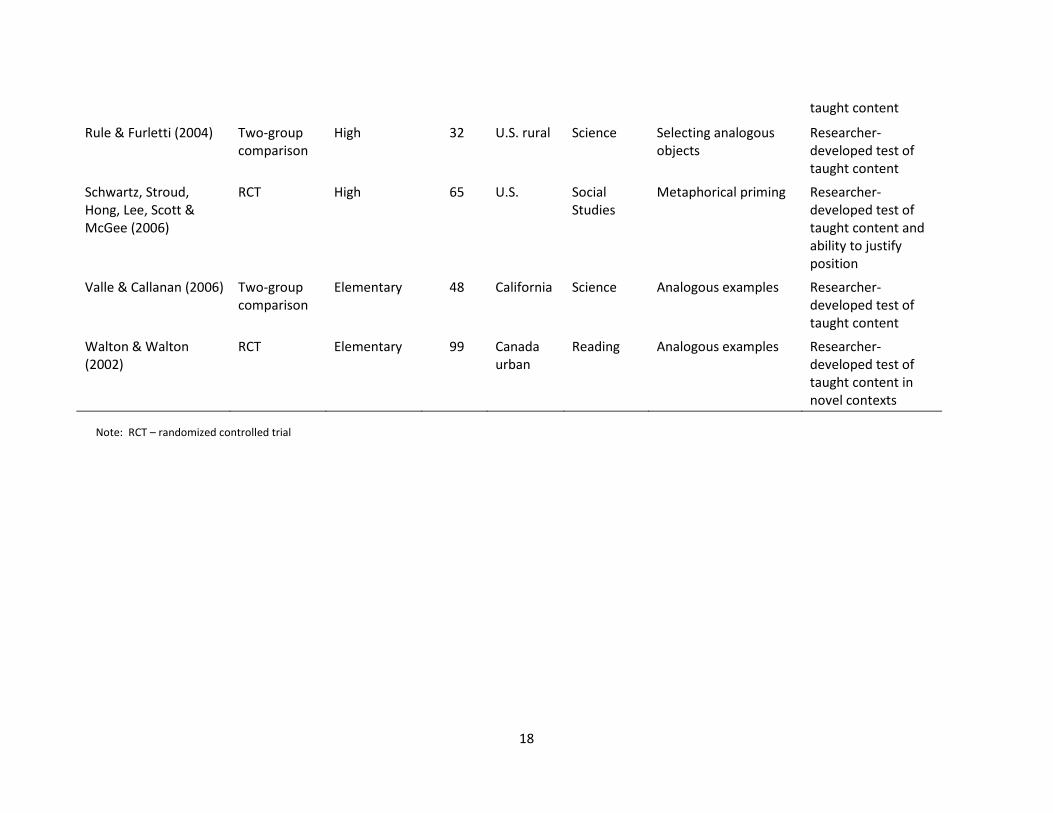
Rule & Furletti (2004) Two-group comparison
High 32 U.S. rural Science Selecting analogous objects
Researcher-developed test of taught content
Schwartz, Stroud, Hong, Lee, Scott & McGee (2006)
RCT High 65 U.S. Social Studies
Metaphorical priming Researcher-developed test of taught content and ability to justify position
Valle & Callanan (2006) Two-group comparison
Elementary 48 California Science Analogous examples Researcher-developed test of taught content
Walton & Walton (2002)
RCT Elementary 99 Canada urban
Reading Analogous examples Researcher-developed test of taught content in novel contexts

19
The 12 studies each examined the impact of identifying similarities and differences in lessons that addressed knowledge and skills in the subject areas of science, mathematics, reading, or social studies. Researchers varied the teaching approach across groups and compared group performance at posttest. All posttests were teacher- or researcher-developed and aligned with the material covered in the lessons. Thus the outcome measures primarily evaluated near effects as opposed to far effects. Near effects occur on measures designed to assess a narrow, targeted set of skills and knowledge, while far effects occur on commercial, standardized achievement tests designed to assess a broad domain, such as mathematics, or on measures designed to mirror real-life problems and formatted very differently from problems used during an intervention (Fuchs et al., 2006; Hill, Bloom, Black & Lipsey, 2008). Far effects were evaluated in only two studies. In these two studies (Fuchs et al., 2006; Walton & Walton, 2002), posttests required students to transfer taught skills and knowledge and apply them to novel contexts.
Other Meta-Analyses No other meta-analyses, including the work of Marzano (1998) as reported in Marzano, Pickering, and Pollack (2001), that focused on the effect of identifying similarities and differences were located. However, relevant findings were located in a previous synthesis of research on organizing instruction for student learning (Pashler et al., 2007) and a previous meta-analysis on teaching in general (Seidel & Shavelson, 2007). In their comprehensive review of rigorous efficacy research, Pashler et al. (2007) identified asking deep explanatory questions, including compare and contrast questions (e.g., “How does X compare to Y?”) as one of seven recommended effective strategies (p. 29). Seidel and Shavelson (2007) coded classroom practices into seven components (e.g., time for learning, basic information processing activities, domain-specific learning activities, goal setting and orientation). With an average effect size of 0.22, the domain-specific learning activities, including “mathematical problem solving, scientific inquiry, or specific reading and writing strategies” (p. 470), had the largest impact on student achievement. Seidel and Shavelson (2007) explained the finding as consistent with prior research demonstrating large and positive effects for “variables proximal to executive learning activities” (p. 473). The nature of such executive learning activities encourages students to attend to and process learning targets by “appealing to causal mechanisms, planning, well-reasoned arguments, and logic” (Pashler et al., 2007, p. 29).
Other Methodological Notes The learning targets in these interventions were often abstract, such as problem-types, parallel plate capacitors, and algebra solutions (Fuchs et al., 2006; Baser & Geban, 2007; & Rittle-Johnson & Starr, 2007). Additional features of the interventions that may have influenced the effectiveness of the different approaches for helping students develop their understanding were explored but were not included in the meta-analysis. How the instruction was structured over time was explored, and the roles of supportive cuing, and reflection and discussion. Findings are reported in the results section.
Results
Meta-Analysis of Articles in Sample One Hedges’ g effect size for each independent sample in a study was computed (meaning in most cases one effect size per study was computed). To compute an overall mean effect size, the individual effect sizes were weighted by a value inversely proportional to the variance reflected in the

20
sample from which the particular effect size and comparison were produced (Wilson & Lipsey, 2001). To examine dispersion of effect sizes, effect size homogeneity within the total sample by calculating a Q statistic was first evaluated. An alpha level of.05 was used to determine statistical significance. A statistically significant Q statistic would indicate that there was heterogeneity, and follow-up analyses were warranted to identify patterns of dispersion. Several post hoc analyses were conducted to explore potential patterns of dispersion. Both study methodology and intervention characteristics were evaluated as potential moderators based on the finding that both methodological and substantive features explain substantial portions of the effect size variance in treatment effectiveness research (Wilson & Lipsey, 2001). Effect sizes were computed for 14 independent samples of students. The majority of effect sizes (11) were in science and mathematics. Twelve effect sizes involved students in elementary (7) and high school (5). All but one of the effect sizes were positive; the effect sizes ranged from -0.03 to 2.14 (see Table 2.2). Table 2.2 also presents the inverse variance weights for each independent sample effect size, representing the relative influence of each effect on the overall mean. Table 2.2: Independent Sample Effect Sizes for Identifying Similarities and Differences
Citation Subgroup Student Count
Average Effect Size
Standard Error
Inverse variance weight
Baser & Geban (2007) N/A 60 1.51 0.29 7.48
BouJaoude & Tamim (1998) N/A 49 -0.03 0.34 6.55
Chen (1999) Younger children
133 0.48 0.30 7.49
Chen (1999) Older children
127 0.85 0.32 7.00
Fuchs, Fuchs, Finelli, Courey, Hamlett, Sones, & Hope (2006)
N/A 445 2.05 0.59 3.46
Ling, Chik & Pang (2006) N/A 71 0.11 0.12 10.67
Mbajiorgu, Ezechi & Idoko (2007) N/A 282 0.42 0.09 11.05
Pang & Marton (2005) N/A 169 0.34 0.16 10.75
Rittle-Johnson & Star (2007) N/A 70 0.23 0.32 6.93
Rule & Furletti (2004) N/A 32 2.09 0.44 5.12
Schwartz, Stroud, Hong, Lee, Scott & McGee (2006)
N/A 65 0.47 0.30 7.27
Valle & Callanan (2006) 1st 24 graders 1.47 0.48 4.55
Valle & Callanan (2006) 3rd 24 graders 0.07 0.40 5.63
Walton & Walton (2002) N/A 92 0.86 0.37 6.05 a Random-effects model used to compute average effect size.

21
The overall mean effect size was 0.65 (with lower and upper limits of 0.39 and 0.91 for a 95% confidence interval). Dispersion of Effect Sizes
With regard to the dispersion of effect sizes, the homogeneity analysis yielded a statistically significant result, Q (13) = 54.11, p < .001, indicating that in the present sample, the magnitude of the effect for identifying similarities and differences was not the same under all conditions. To explore factors related to the dispersion of effects, two context variables (subject area and grade level), two methodological features (study design and type of control group), and one intervention feature (duration)were examined as potential moderators. Type of outcome measure (specialized topic tests versus standardized tests) also had been found to be a significant moderator (Hill, Bloom, Black & Lipsey, 2008; Schroeder, Scott, Tolson, Huang, & Lee, 2007; Wilson & Lipsey, 2001), but in the present set of studies, type of outcome measure was essentially invariant with no standardized tests (see Table 2.1). Table 2.3 presents the mean effect size and confidence interval for each level of the different moderators. Neither of the context variables were significant moderators, indicating that there were no dependable differences among mean effect sizes when categorized by subject area (science, mathematics, reading, and social studies) or grade level (elementary, middle, and high school). Study design (RCT versus 2-group comparison) also was not a significant moderator.

22
Table 2.3: Identifying Similarities and Differences Effect Size Moderator Analysisa
Moderator Category No. of Studies
Average Effect Size
95% Confidence Interval
Lower Upper
Subject area Science 7 0.72 0.27 1.17
Mathematics 4 0.75 0.18 1.32
Reading 1 0.86 0.13 1.59
Social Studies 2 0.36 0.15 0.57
Grade level Elementary b 7 0.71 0.25 1.17
Middle 2 0.11 -0.35 0.56
High 5 0.83 0.39 0.56
Study design RCT 6 0.80 0.21 1.35
2-Group Comparison
8 0.57 0.27 1.35
Control group type of instruction
Traditional
c
6 1.14 0.55 1.72
Interactive 6 0.26 0.01 0.51
Both 2 c 0.65 0.23 1.06
Intervention duration
Long 7 0.93 0.53 1.34
Short 7 0.37 0.06 0.69 a Random-effects model used to compute average effect size and conduct moderator analyses. b Elementary = grades PreK/K–5; Middle = grades 6–8; High = grades 9–12 c
The Chen (1999) treatment group was compared with both types of control groups.
Control Type Type of control group instruction was the most reliable moderator: Q (2) = 8.26, p = .016. Its potential as a moderator was identified when displaying independent sample effect sizes in decreasing magnitude and separating the data according to the nature of the experimental comparison created by the control group’s type of instruction (see Table 2.4). Traditional instruction was defined as “business-as-usual” instruction, primarily teacher- or textbook-guided. Control groups that were given instruction that engaged students’ active processing and manipulation of subject material were categorized as interactive. Interactive instruction involved students in asking and answering questions about subject material, making observations and judgments about subject material, and/or reflecting on and discussing problem solutions.

23
Table 2.4: Independent Sample Effect Sizes Presented in Decreasing Magnitude with Type of Control Group Instruction
Study Effect Size (Hedges’ g)
Type of Control Group
Instruction
Description of Control Group Instruction
Fuchs, Fuchs, Finelli, Courey, Hamlett, Sones, & Hope (2006)
2.05 Traditional Textbook-guided lessons on problem-solution rules
Rule & Furletti (2004) 2.09 Traditional Textbook-guided lectures and analysis/synthesis question & answer worksheets
Baser & Geban (2007) 1.51 Traditional Textbook-guided lectures and assignments
Valle & Callanan (2006) – 1st 1.47 grade
Interactive Parent-child conversations
Walton & Walton (2002) 0.86 Traditional Stories read aloud
Chen (1999) – Older Students 0.85 Both Both irrelevant activities and Problem solving
Chen (1999) – Younger Students 0.48 Both
Schwartz, Stroud, Hong, Lee, Scott, & McGee (2006)
0.47 Traditional Both irrelevant priming and no priming
Mbajiorgu, Ezechi, & Idoko (2007)
0.42 Traditional Textbook-guided lessons
Pang & Marton (2005) 0.34 Interactive Few examples of key features of the learning targets
Rittle-Johnson & Star (2007) 0.23 Interactive Student discussion of single problem solutions
Ling, Chik & Pang (2006) 0.11 Interactive Discussion of one analogy
Valle & Callanan (2006) – 3rd 0.07 grade
Interactive Parent-child conversations
BouJaoude & Tamin (1998) -0.03 Interactive Students generated summaries and answered questions; teacher provided corrective feedback
As seen in Table 2.4, when the control group was given Traditional instruction, the mean effect size for identifying similarities and differences was 1.14 (with lower and upper limits of 0.55 and 1.72, respectively, for a 95% confidence interval). When the control group was given Interactive instruction, the mean effect size for identifying similarities and differences was 0.26 (with lower and upper limits of 0.01 and 0.51, respectively, for a 95% confidence interval). The most reliable moderator, therefore, was an artifact of the experimental conditions.
24
Duration Intervention duration was the second most reliable moderator, Q (1) = 4.52, p = .034. Intervention duration was measured by the number of lessons an intervention spanned, with lesson defined as one class period or one 45-minute session. The duration of the interventions ranged from one lesson to 30 lessons. The median number of lessons was 3.5. Using a median split, interventions were categorized as long (above the median) or short (below the median). Long interventions had a mean effect size of 0.93 (with lower and upper limits of 0.53 and 1.34, respectively, for a 95% confidence interval) and short interventions had a mean effect size of 0.37 (with lower and upper limits of 0.06 and 0.69, respectively, for a 95% confidence interval). As the duration of the intervention increased, generally, so did the effect size. Additional analyses revealed potential patterns of influential factors in instruction designed to facilitate student use of identifying similarities and differences. These include the structure of the instruction, the supportive cuing, and opportunities for reflection and discussion. Structure Several of the interventions associated with the largest effect sizes progressed systematically in qualitatively different phases over time. Consider, for example, the six-step Teaching with Analogies (TWA) approach used by Rule and Furletti (2004) to structure the design of their object box intervention (see Appendix 2.A). The TWA approach, developed by Shawn Glynn (1989), provides the following sequence of steps: 1) introduce learning target, 2) cue retrieval of or provide analog (a familiar concept or source of knowledge), 3) identify relevant features of the target and analog concepts, 4) map similarities (e.g., list in a chart the ways in which the target and analog are similar), 5) indicate where the analogy breaks down, and 6) draw conclusions. In the first step of the object box intervention, students read the description of the target concept, selected a matching analog object, and explained the analogy (e.g., “The meninges are membranes that surround the brain and spinal cord protecting them from infection;” “Similarly, a plastic bag is a thin membrane that surrounds stored food protecting it from infectious bacteria”) (Rule & Furletti, 2004, p. 160). According to Rule and Furletti (2004), the next two steps (identifying relevant features and mapping similarities) allowed learners to make connections between the new knowledge and previous learning. Step five (indicate where the analogy breaks down) may have helped students deepen understanding by illuminating “which features are most important or defining” (Rule & Furletti, 2004, p. 156). As an additional step, students generated analogies to apply and check their understanding. Similarly, in the Mbajiorgu, Exechi, & Idoko (2007) five-part intervention (see Appendix 2.A), a lesson on genetics instruction progressed from activating prior knowledge, introducing new and alternative ways of knowing, comparing alternative ways of knowing, and finally to applying new ways of knowing to novel cases. Students were asked to interpret the novel case examples and recommend courses of action. The additional case application exercise was vital for achieving the learning goal; it allowed the instructor to “see if the views stated earlier had progressed from only seeking spiritual help to more fruitful actions such as seeking genetic counseling or doing both” (Mbajiorgu et al., 2007, p. 428). Likewise, in the later phases of the object box intervention, application exercises were used (Rule & Furletti, 2004). Students generated additional analogies and used them in peer- and self-assessment activities (see Appendix 2.A).

25
In each of these examples, there was a progression beginning with activation of prior knowledge, moving onto an introduction to new knowledge, to guiding students in making connections between new and prior knowledge, to application and assessment of the new understanding. In the present set of studies, activation of prior knowledge alone without addressing connections between new and prior knowledge was associated with mid-range and lower effect sizes (i.e., Schwartz et al., 2006; Ling, Chik & Pang, 2006). Also, asking students to generate analogies without providing guidance or teacher-generated analogies was associated with a near-zero effect size (BouJaoude & Tamin, 1998) (see Appendix 2.A). Supportive Cuing In five of the nine interventions with the highest effect sizes, supportive cuing was used. Teacher prompting and posters listing problem features that change without modifying problem type (Fuchs et al., 2006), pointing to and noting the similar spelling pattern or rhyme (Walton & Walton, 2002), and providing the set of guiding questions in the metaphor priming intervention (Schwartz et al., 2006) may have helped students attend to the most important features in the target concepts and relational analogies. Additional examples of supportive cuing were use of everyday objects as analogs, labeled diagrams, and combined diagrams (Baser & Geban, 2007; Pang & Marton, 2005; Rule & Furletti, 2004). Use of supplemental content instruction also was associated with effect size magnitude. Even though there were two different comparisons in the Walton and Walton (2002) study, one overall effect size was computed for this study because the two comparisons used the same control group and thus were not independent. One of the Walton and Walton (2002) treatments was Analogy_RIL which taught students word family categories (e.g., the at family, including hat and mat), how to use known rhymes (at) to read new words, and about rhyming (R), initial phoneme identity (I), and letter-sound correspondences (L). The second treatment was Analogy alone which taught students only about word families and how to use known rhymes. The effect size for Analogy_RIL was 1.33 compared with the effect size for Analogy alone which was 0.13, indicating that teaching students relevant content skills (rhyming) and knowledge (initial phoneme identity and letter-sound correspondences) in combination with instruction in word family categories is more effective than instruction in word family categories alone. Reflection and Discussion There was an emergent pattern relating effect size and use of student reflection and discussion. The interventions with larger effect sizes had students reflect on what they were learning and/or discuss explanations for analogies with each other and the teacher (Baser & Geban, 2007; Chen, 1999; Mbajiorgu et al., 2006; Rule & Furletti, 2004). Only one of the interventions with lower effect sizes (Rittle-Johnson & Starr, 2007) had students reflect on and explain similarities and differences with peers verbally and in writing (see Appendix 2.A).
Connecting New Research Information to Original CITW Findings
Findings from a previous synthesis of instructional research, based on publications prior to 1998, suggested that identifying similarities and differences was effective for enhancing student

26
achievement. The present set of studies published since 1998 also supports the claim that identifying similarities and differences is effective for enhancing student learning and achievement. Across multiple subject areas (science, mathematics, reading and social studies), the 12 relevant and eligible studies published since 1998 produced a mean Hedges’ g effect size of 0.66. Although smaller than the 1.61 effect size reported by Marzano et al. (2001), it is equivalent to a 25-point percentile gain in student scores—an effect that has potentially great practical significance.
Main Points and Recommendations
The current evidence is consistent with the view that identifying and reasoning about similarities and differences is an effective way to help students develop conceptual understanding. The overall mean effect size of 0.66 is a helpful summary of the magnitude of the studied interventions. Based on a meta-analysis of a number of relevant studies, this overall mean effect is more robust than any one single effect size. While the overall effect size is important, it is still necessary to recognize the potential influence of different contexts, participant samples, and outcome measures on student outcomes. In the present study, the effect sizes were not the same under all conditions; the condition with the most reliable association to effect size was the type of instruction received by the control group; higher effect sizes were found only when compared interventions were compared with textbook-guided instruction. Under other conditions, the effect of identifying similarities and differences was no greater than that of other intellectually engaging, interactive conditions of instruction. Nevertheless, the components of the more effective interventions can guide teachers in implementing lessons incorporating similarities and differences.
The schema-building teachers helped students build problem type-schemas by making important problem features explicit on posters, modeling thinking, arranging collaborative practice so students could self-assess, monitor their progress and learned through success. The genetics teachers progressed systematically from activating student presuppositions, to having students compare and contrast different explanations for cases of chromosomal mutation, to checking students’ understanding of scientific principles by asking them to interpret novel cases. In the most effective interventions, teachers orchestrated student self-assessment or peer assessment, and formative assessment through reflection, discussion and application exercises. This multi-day instructional routine that began with activating prior knowledge, followed by introducing new knowledge, followed by helping students connect new and previous learning, and asking students to apply and demonstrate their understanding may have been the most critical factor in the strategy’s effectiveness. The little things that teachers do to direct students’ attention to important and defining features may have facilitated learning in ways that were not measured in the present study. Teachers in the more effective interventions provided supporting cues (e.g., posters of important problem features; prompts to reflect; labeled diagrams), prompted students to reflect, and provided corrective feedback until students demonstrated understanding and proficiency.

27
References Bolded references are included in the research review.
Baser, M. & Geban, O. (2007). Effect of instruction based on conceptual change activities on students’ understanding of static electricity concepts. Research in Science & Technological Education, 25(2), 243-267.
BouJaoude, S., & Tamim, R. (1998). Analogies, summaries, and question answering in middle school life science: Effect on achievement and perceptions of instructional value (ED420503). Retrieved from ERIC database: www.eric.ed.gov
Bransford, J. D., Brown, A. L. & Cocking, R. R. (Eds.) (2000). How People Learn. Washington, D.C.: National Academy Press.
Chen, Z. (1999). Schema induction in children’s analogical problem solving. Journal of Educational Psychology, 91(4), 703-715.
Duit, R., Roth, W.-M., Komerk, M., & Wilbers, J. (2001). Fostering conceptual change by analogies–between Scylla and Charybdis. Learning and Instruction, 11, 283-303.
Fuchs, L., Fuchs, D., Finelli, R., Courey, S., Hamlett, C., Sones, E., & Hope, S. (2006). Teaching third graders about real-life mathematical problem solving: A randomized controlled study. The Elementary School Journal, 106(4), 293-310.
Gentner, D., Loewenstein, & Thompson, L. (2003). Learning and transfer: A general role for analogical encoding. Journal of Educational Psychology, 95(2), 393-408.
Glynn, S. M. (1989). Explaining science concepts: A teaching-with-analogies model. In S. M. Glenn, R.H. Yeany, and B. K. Britton (Eds.), The psychology of learning science (pp. 219-240). Hillsdale, NJ: Erlbaum.
Harrison, A. G. & De Jong, O. (2005). Exploring the use of multiple analogical models when teaching and learning chemical equilibrium. Journal of Research in Science Teaching 42(10), 1135-1159.
Hill, C. J., Bloom, H. S., Black, A. R., & Lipsey, M. W. (2008). Empirical benchmarks for interpreting effect size in research. Child Development Perspectives, 2(3), 172-177.
Holyoak, K. J. (2005). Analogy. In Keith J. Holyoak and Robert G. Morrison (Eds.), The Cambridge handbook of thinking and reasoning (pp. 117-142). Cambridge, MA: Cambridge University Press.
Ling, L. M., Chik, P., & Pang, M. F. (2006). Patterns of variation in teaching the colour of light to Primary 3 students. Instructional Science: An International Journal of Learning and Cognition 34(1), 1-19.
Marzano, R. (1998). A Theory-Based Meta-Analysis of Research on Instruction. Aurora, CO: Mid-continent Research for Education and Learning.
Marzano, R., Pickering, D., & Pollock, J. (2001). Classroom instruction that works: Research-based strategies for increasing student achievement. Alexandria, VA: Association for Supervision and Curriculum Development.
Mbajiorgu, N. M., Ezechi, N. G., & Idoko, E. C. (2007). Addressing nonscientific presuppositions in genetics using a conceptual change strategy. Science Education 91(3), 419-438.

28
Pang, M.-f. & Marton, F. (2005). Learning theory as teaching resource: Enhancing students’ understanding of economic concepts. Instructional Science: An International Journal of Learning and Cognition, 33(2), 159-191.
Pashler, H., Bain, P., Bottge, B., Graesser, A., Koedinger, K., McDaniel, M., and Metcalfe, J. (2007). Organizing instruction and study to improve student learning (NCER 2007-2004). Washington, DC: National Center for Education Research, Institute of Education Sciences, U.S. Department of Education. Retrieved from http://ncer.ed.gov.
Rittle-Johnson, B. & Star, J. R. (2007). Does comparing solution methods facilitate conceptual and procedural knowledge? An experimental study on learning to solve equations. Journal of Educational Psychology, 99(3), 561–574.
Rule, A. C. & Furletti, C. (2004). Using form and function analogy object boxes to teach human body systems. School Science and Mathematics 104(4), 155-169.
Schroeder, C. M., Scott, T. P., Tolson, H., Huang, T.-Y., & Lee, Y.-H. (2007). A meta-analysis of national research: Effects of teaching strategies on student achievement in science in the United States. Journal of Research in Science Teaching, 44(10), 1436-1460.
Schwartz, N., Stroud, M., Hong, N., Lee, T., Scott, B. & McGee, S. (2006). Summoning prior knowledge: The influence of metaphorical priming on learning in a hypermedia environment. Journal of Educational Computing Research, 35(1), 1-30.
Seidel, T. & Shavelson, R. J. (2007). Teaching effectiveness research in the past decade: The role of theory and research design in disentangling meta-analysis results. Review of Educational Research, 77(4), 454-499.
Valle, A. & Callanan, M. A. (2006) Similarity comparisons and relational analogies in parent-child conversations about science topics. Merrill-Palmer Quarterly, 52(1), 96-124.
Vosniadou, S. (1988). Analogical reasoning as a mechanism in knowledge acquisition: A developmental perspective (Tech. Rep. No. 438). Champaign, IL: University of Illinois at Urbana-Champaign, Center for the Study of Reading.
Walton, P. D. & Walton, L. M. (2002). Beginning reading by teaching in rime analogy: Effects on phonological skills, letter-sound knowledge, working memory, and word-reading strategies. Scientific Studies of Reading, 6(1), 79-115.
Wilson, D.B., & Lipsey, M.W. (2001). The role of method in treatment effectiveness research: Evidence from meta-analysis. Psychological Methods, 6(4), 413-429.

29
Appendix 2.A: Summary of Intervention Characteristics by Article
Source ES Intervention Duration Comment
Fuchs, Fuchs, Finelli, Courey, Hamlett, Sones, & Hope (2006)
2.05 Teachers in the treatment group used analogous problems to help students construct four problem-type schemas, one problem type at a time. A schema was defined as a “description of two or more problems, which individuals use to sort problems into groups requiring similar solutions” (Fuchs et al., 2006, p. 294). The instruction combined explicit instruction (i.e., explanation and demonstration of how some problem features vary without modifying the problem type), structured practice (i.e., moving from worked to partially worked examples and from teacher modeling solution steps to practicing solution steps in dyads), student self-assessment and monitoring of progress (checking work against an answer key and graphing scores), and prompting (i.e., students were reminded to search for features in order to identify familiar problem types and solution steps).
30 lessons Systematic progression
Rule & Furletti (2004)
2.09 Use of Teaching with Analogies (TWA) (Glynn, 1989). Teachers identified and presented potential analogous objects and corresponding target concept cards in object boxes to students. Target concepts were the form and function of body system parts. Students, working in small groups, read the concept description and selected an analog match for the target concept (e.g., vacuum bags were matched with white blood cells because they are large and encapsulate and ingest foreign matter). Students assessed their analogies, mapped similarities between the target concept and analog, and identified limits of the analogies. Students also generated additional analogies for body parts, tried matching student-generated analogous objects to the body parts, and gave each other feedback on the analogies. Students struggled at first identifying the objects and mapping the analogies, “but after additional direction from the instructor, they were able to work independently” (Rule & Furletti, 2004, p. 164)
4 lessons Systematic progression
Baser & Geban (2007)
1.51 Students completed activity sheets which provided labeled diagrams of a target concept (parallel plate capacitors) and source (water tank) and asked questions about key features in the analogy. Students discussed their answers with peers and the teacher. “The teacher through discussion directed students to construct scientifically accepted answers” (Baser & Geban, 2007, p. 257).
25 lessons Supportive cuing
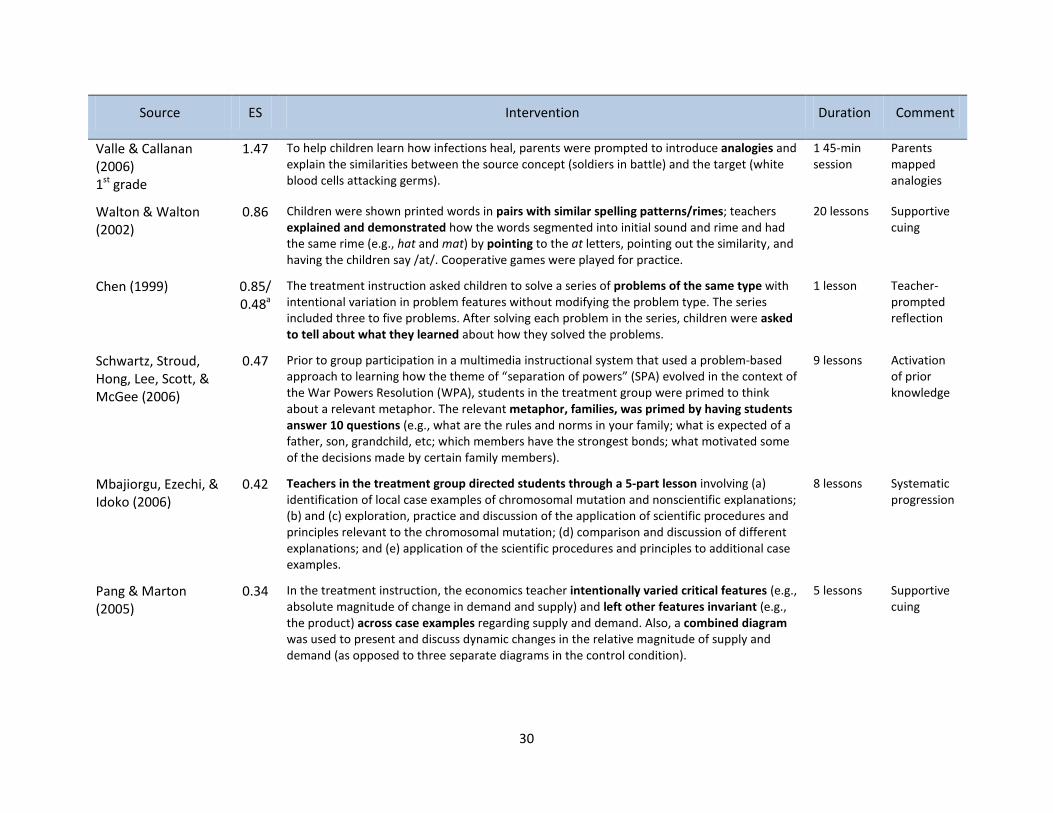
30
Source ES Intervention Duration Comment
Valle & Callanan (2006) 1st
1.47
grade
To help children learn how infections heal, parents were prompted to introduce analogies and explain the similarities between the source concept (soldiers in battle) and the target (white blood cells attacking germs).
1 45-min session
Parents mapped analogies
Walton & Walton (2002)
0.86 Children were shown printed words in pairs with similar spelling patterns/rimes; teachers explained and demonstrated how the words segmented into initial sound and rime and had the same rime (e.g., hat and mat) by pointing to the at letters, pointing out the similarity, and having the children say /at/. Cooperative games were played for practice.
20 lessons Supportive cuing
Chen (1999) 0.85/ 0.48
The treatment instruction asked children to solve a series of problems of the same type with intentional variation in problem features without modifying the problem type. The series included three to five problems. After solving each problem in the series, children were asked to tell about what they learned about how they solved the problems.
a 1 lesson Teacher-
prompted reflection
Schwartz, Stroud, Hong, Lee, Scott, & McGee (2006)
0.47 Prior to group participation in a multimedia instructional system that used a problem-based approach to learning how the theme of “separation of powers” (SPA) evolved in the context of the War Powers Resolution (WPA), students in the treatment group were primed to think about a relevant metaphor. The relevant metaphor, families, was primed by having students answer 10 questions (e.g., what are the rules and norms in your family; what is expected of a father, son, grandchild, etc; which members have the strongest bonds; what motivated some of the decisions made by certain family members).
9 lessons Activation of prior knowledge
Mbajiorgu, Ezechi, & Idoko (2006)
0.42 Teachers in the treatment group directed students through a 5-part lesson involving (a) identification of local case examples of chromosomal mutation and nonscientific explanations; (b) and (c) exploration, practice and discussion of the application of scientific procedures and principles relevant to the chromosomal mutation; (d) comparison and discussion of different explanations; and (e) application of the scientific procedures and principles to additional case examples.
8 lessons Systematic progression
Pang & Marton (2005)
0.34 In the treatment instruction, the economics teacher intentionally varied critical features (e.g., absolute magnitude of change in demand and supply) and left other features invariant (e.g., the product) across case examples regarding supply and demand. Also, a combined diagram was used to present and discuss dynamic changes in the relative magnitude of supply and demand (as opposed to three separate diagrams in the control condition).
5 lessons Supportive cuing

31
Source ES Intervention Duration Comment
Rittle-Johnson & Star (2007)
0.23 Students in the treatment group worked in pairs studying two worked examples in algebra. Activity sheets asked students to compare and contrast two worked examples (e.g., “These two solutions are different, but they resulted in the same answer. Why?”) In this manner, students studied 12 pairs of worked examples and solved a practice problem with each pair of worked examples. Students were instructed to “describe each solution to their partner and answer the accompanying questions first verbally and then in writing” (Rittle-Johnson & Star, 2007, p. 567)
2 lessons Prompted reflection
Ling, Chik & Pang (2006)
0.11 In the treatment instruction, the teacher used two analogies (marathon runners at the start and middle of a race; a Robot made of five planes) to explain critical features of the target concept (light refraction), including both the whole to part and the part to whole relationships.
2 lessons Activation of prior knowledge
Valle & Callanan (2006) 3rd
0.07
grade
To help children learn how infections heal, parents were prompted to introduce analogies and explain the similarities between the source concept (soldiers in battle) and target (white blood cells attacking germs).
1 45-min session
Parents mapped analogies
BouJaoude & Tamin (1998)
-0.03 After each of a series of 4 or 5 lessons, students were asked to generate and explain an analogy for target science concepts (e.g., students wrote that car window cleaners were like eyelids because they both wipe and clean). Teachers provided corrective feedback on the analogies and students were asked to read and use the feedback before generating subsequent analogies.
3 lessons Student-generated analogies
a
Effect size of 0.87 was for older elementary student subgroup and effect size of 0.49 was for younger elementary student subgroup

32
Chapter 3: Summarizing and Note Taking
Background and Definitions Summarizing and note taking are identified in the literature as cognitive strategies that can facilitate learning by allowing students to record and reflect on information (Faber, Morris & Lieberman, 2000). Note taking requires more focus on accessing, sorting, and coding information than just listening or reading (Piolat, Olive, & Kellogg, 2004), and can aid in memorization of the information being presented (Kiewra, 1987). Similarly, summarizing requires sorting, selecting and combining information, which can lead to greater comprehension of the information (Boch & Piolat, 2005; Friend, 2001). Although researchers often examine note taking apart from summarizing, the authors of CITW (Marzano, Pickering, & Pollack, 2001) grouped summarizing and note taking together because they both require students to distill information into a parsimonious and synthesized form. Summarizing is the process of identifying essential information and restating it in a condensed form. A common approach to teaching students how to summarize is through reciprocal teaching. In broad terms, reciprocal teaching is a structured way for teachers to systematically model strategies, gradually release the implementation of strategies to student control, and orchestrate strategy practice with peer support (Rosenshine & Meister, 1994). In particular, reciprocal teaching aims to teach four comprehension strategies: summarizing, questioning, clarifying, and predicting. Students participate in reciprocal teaching in small groups. Together, the students observe models and practice the analysis necessary to distill important information and formulate a deep level of understanding of text (Marzano et al., 2001). Note taking is defined as the process of capturing key ideas and concepts. The research literature on note taking describes both linear and non-linear note taking (Boch & Piolat, 2005; Makany, Kemp, & Dror, 2009). Linear note taking, such as outlining, may be more typical, while non-linear methods such as webbing or mapping may be less common (Robinson, Katayama, Dubois & DeVaney, 1998). Note-taking can be formal or informal, structured by the instructor, or supported through the use of computers. Through the use of guided notes, educators may try to find a balance between requiring students to distinguish essential information on their own and providing students with preprinted notes that outline important details from the lesson. Guided notes are teacher-
Charles Igel Trudy Clemons Helen Apthorp Susie Bachler

33
prepared outlines with space provided for students to record key concepts and examples from the lesson (Konrad, Joseph, & Eveleigh, 2009). Summarizing and note taking are functionally complex processes that can take on many forms, making it difficult to study. However, research has suggested that there is some overall benefit of summarizing and note taking, and that some types of note taking may be more beneficial than others. Marzano et al. (2001) reported an average effect size of 1.00 when combining studies on note taking and summarizing.
Methods
Literature Search Bibliographic databases in both education and psychology (e.g., Education Resources Information Center, Education: A SAGE Full Text Collection, Professional Development Collection, PsycInfo, and JSTOR) were searched using achievement and learning as the outcome keywords crossed with each strategy keyword: note taking, summarizing, outlining, webbing, and mapping. Author searchers were then conducted based on citations in the included studies. Searches continued until results repeatedly contained duplicate hits.
Article Sampling A search was conducted among the located articles for primary research literature that tested the effect of summarizing or note taking on student achievement, and met relevance criteria including inclusion of a student sample that was in grades K-12, inclusion of an achievement measure as an outcome, and publication in 1998-2008. A complete description of methodological criteria is available in Chapter 1: Methods. Ten studies met these criteria for the topic of summarizing, and seven met the criteria for note taking. The majority of excluded studies did not include K-12 students or inextricably conflated multiple interventions. The research design, samples of students, intervention and outcome measures of the included studies are described in Table 3.1 for note taking and Table 3.2 for summarizing. Publication years for all selected studies across note taking and summarizing range from 1998 to 2008, with a relatively even distribution across the time period. Approximately half of the studies were conducted within the U.S. Four of the seven note taking studies tested populations with emotional and/or learning disorders. The majority of included studies used an experimental or quasi-experimental design (QED), with only two using a single-subject design. All studies except one tested a single sample. The study that did not (Arslan, 2006) tested two independent samples on note taking. Because they are independent, these two samples contributed separately to the meta-analysis and are reported separately in this report. Grade ranges across the sample are well represented, with six elementary, six middle school, and five high school independent samples. All subject areas except math are represented, with four science, eight language arts, and five social studies independent samples. A variety of strategies with the domains of note taking and summarizing were tested and are provided in Tables 3.1 and 3.2 respectively.

34
Table 3.1: Studies Included in the Note taking Meta-analysis
Study Research Design Grade Level Number of
Students Content Area Location Instructional Strategy Outcome Measure(s)
Akinoglu & Yasar (2007)
QED Middle 81 Science Turkey Note taking: Mind-mapping
1) Academic achievement test
Arslan (2006) RCT Elementary a 135 Science Turkey Note taking: Concept mapping and generic note taking
1) Achievement test
Boyle & Weishaar (2006)
RCT High a 26 Language arts (reading)
b U.S. Note taking: Strategic note taking
1) Immediate free recall 2) Comprehension test
Faber, Morris, & Lieberman (2000)
RCT Middle a 115 Social studies U.S. Note taking: Cornell note taking method
1) Passage comprehension
Hamilton, Siebert, Gardner, & Talbert-Johnson (2000)
One group – pre/post design
Middle 7 Social studies b U.S. Note taking: Guided notes
1) Daily quiz
Lee, Lan, Hamman, & Hendricks, (2008)
RCT Elementary a 103 Science Taiwan Note taking: Generic 1) Comprehension test 2) Concept test
Patterson (2005) Single subject reversal design
Elementary 8 Science b U.S. Note taking: Guided notes
1) Accuracy of recorded comments 2) Combined weekly quiz
a RCT with assignment at classroom level b Participants classified as having learning and emotional/behavioral disorders. Note: RCT – randomized controlled trial; QED – quasi-experimental design

35
Table 3.2: Studies Included in the Summarizing Meta-analysis
Study Research Design Grade Level
Number of
Students Content Area Location Instructional
Strategy Outcome
Measure(s)
Alfassi (1998) QED High 75 Language arts U.S. Summarizing: Reciprocal teaching
1) Reading comprehension test
Alfassi (2004) RCT High a 49 Language arts U.S. Summarizing: Reciprocal teaching
1) Reading comprehension test
Broer, Aarnoutse, Kieviet, & van Leeuwe, (2002)
QED Middle 354 Language arts Netherlands Summarizing: Classification and causation
1) Reading comprehension test
Jitendra, Hoppes & Xin (2000)
RCT Middle a 33 Language arts U.S. Summarizing: Identify and generate main idea statements
1) Reading comprehension test
Johnson-Glenberg (2000)
QED Elementary 59 Language arts U.S. Summarizing: Reciprocal teaching
1) Reading comprehension test
Lederer (2000) QED Elementary 126 Social studies U.S. Summarizing: Reciprocal teaching
1) Unit tests of content knowledge
Mastropieri, Scruggs, Spencer & Fontana (2003)
QED High 16 Social studies U.S. Summarizing: Peer-assisted summarizing strategy
1) Unit tests of content knowledge
Meyer, Middlemiss, Theordorou, Brezinski & McDougall (2002)
RCT Elementary a 60 Language arts U.S. Summarizing: The Plan Strategy
1) Reading comprehension 2) Use of text structures
Olsen & Land (2007) QED High 2000 Language arts U.S. Summarizing: 1) Reading and

36
Cognitive strategies intervention
writing tests
Takala (2006) RCT Middle a 154 Social studies Finland Summarizing: Reciprocal teaching
1) Reading comprehension tests
a
RCT with assignment at classroom level Note: RCT – randomized controlled trial; QED – quasi-experimental design

37
Other Meta-Analyses Note taking
After the publication of CITW (Marzano et al., 2001), Kobayashi (2005, 2006) conducted meta-analyses on note taking. In 2005, Kobayashi conducted a meta-analysis of 57 note taking versus no note taking comparison studies. The sample consisted of 131 independent samples from studies that were published from 1934 to 2003, with publication year and schooling level serving as moderator variables. The study found a modest overall effect of note taking versus no note taking (ES = .22). In the analyses of moderators, effect sizes varied slightly by publication year, and significantly by schooling year (see Table 3.3). Table 3.3: Kobayashi (2005) Effect Sizes by Moderator
Moderator Average ES
Publication year: 1970s 0.36
Publication year: 1980s 0.33
Publication year: 1990 to 2003 0.27
Schooling Level: 6th to 12th 0.43 grade
Schooling Level: Undergraduate 0.14
In a follow-up meta-analysis of 33 studies, Kobayashi (2006) examined the effects of note taking in three types of studies distinguished primarily by the control condition. In the first set of studies, the mean achievement of a group engaged in note taking and reviewing was compared to the mean achievement of a group in which participants were not allowed to take notes. In the second set of studies, the mean achievement of a group engaged in note taking and reviewing was compared to the mean achievement of a group in which participants were allowed to mentally review material before a test. In the third set of studies, the mean achievement of a group engaged in note taking and/or training or assistance in how to review material during and after a lecture was compared to the mean achievement of a group in which participants attended the same lecture but then went about their “business-as-usual” approach to learning the material. Kobayashi’s (2006) meta-analysis included studies that involved both college students and 11th and 12th grade students. The composite effect sizes for each of the three groups of studies were 0.75, 0.77, and 0.36, favoring note taking and note reviewing over no note taking at all or “business-as-usual.” The composite effect sizes for 11th and 12th
grade students (N = 212) were 0.33 favoring note-taking and reviewing, and 0.45 favoring note-reviewing only. The pattern of effects from both the 2005 and 2006 study suggest that students benefit from note taking.
Summarizing
Previous researchers documented strong, positive effects of reciprocal teaching on student ability to read and comprehend. Rosenshine and Meister (1994) reported a mean effect size of 0.88 for reciprocal teaching, and Crismore (1985) reported a mean effect size of 1.04 for summarizing strategies. In both meta-analyses, however, the impact was moderated by type of outcome measure,

38
with effects on standardized reading comprehension tests at least one-half the magnitude of the effects on non-standardized reading comprehension tests. Rosenshine and Meister (2004) reported a mean effect size of 0.32 for reciprocal teaching when the outcome measure was a standardized reading comprehension test. In another meta-analysis, involving 51 studies on the effects of self-regulated, deliberative strategies such as identifying main ideas, researchers documented a mean effect size of 0.77 when assessments were closely aligned with the lesson content (e.g., subject-based tests) and mean effect size of 0.29 when assessments were unrelated to the lesson content (Hattie, Biggs, & Purdie, 1996). Students were much more successful with the strategies when they were able to apply them to content similar to or the same as that addressed during instruction. The implication is that strategies such as finding the main idea in a text passage “ought to take place in the teaching of content rather than in a counseling or remedial center as a general or all-purpose package of portable skills (Hattie et al., 1996, p. 130). These recent meta-analytic findings are consistent with the strong effects (ES = 1.00) reported for summarizing and note taking by Marzano et al. (2001); however, these effects in the recent literature are specific to either a subgroup of students, students characterized as struggling readers, or college students. The purpose of the present study is to add to the recent reviews to include research involving general education students or other subgroups of students in kindergarten through grade 12.
Results
Meta-Analysis of Articles in Sample As reviewed in Chapter 1, a random effects model was used to estimate a composite effect size for the twenty studies identified for the primary analysis. To maintain consistency of measurement across all studies, Hedges’ g was calculated for each study separately. Results were adjusted from studies exhibiting a mismatch between study design and analysis using a statistical adjustment where necessary. Results were then synthesized using an inverse variance weight �𝟏𝟏 𝒘𝒘𝒊𝒊� � that assigned relatively more influence to those studies containing less variance. The results from these calculations and final analysis are presented in Tables 3.4 for note taking and 3.6 for summarizing interventions. Study numbers within this table are those assigned to specific studies and correspond with those in Tables 3.1 and 3.2 respectively. They are presented alphabetically. When individual studies presented multiple outcomes measures within the same sample, these measures were combined into a single effect size for that study, a commonly accepted meta-analytic practice for non-independent measures (Borenstein, Hedges, Higgins, & Rothstein, 2009). When a study presented multiple outcome measures with different, independent samples, these measures are reported separately. This was the case with only one of the included studies and is noted by sub-setting the study’s name (Arslan, 2006). In addition to the individual effects, the relative weight and 95% confidence interval around each study is also presented. Note Taking
All studies except one (Faber et al., 2000) produced positive effects for note taking (see Table 3.4) with a large overall effect of g = 0.90. Careful examination of Farber et al. (2000) showed that

39
approximately 50% of students took notes as instructed, 10% used their own note-taking method, and 40% recorded details but did not address or represent any hierarchical organization of ideas. Faber et al. (2000) suggested that a longer practice period and clearer expectations that students use the Cornell method may be necessary for more students to internalize the note taking technique. The Hamilton, Seibert, Gardner, and Talbert-Johnson (2000) study produced a large positive effect for note taking. When provided guided notes, students’ quiz performance increased, and when guided notes were not provided, students’ quiz performance decreased, demonstrating a probable functional relationship between use of guided notes and achievement.
Table 3.4: Individual & Composite Effect Sizes, Weights, and Confidence Intervals for Note Taking Studies
Study Effect Size (Hedges’ g)
Relative Weight
95 % Confidence Interval
Lower Upper
Akinoglu & Yasar (2007) 1.05 13.32 0.59 1.51
Arslan (2006) 0.33 13.53 -0.85 0.75
Arslan (2006) 1.67 13.21 1.18 2.15
Boyle & Weishaar (2006) 0.82 11.58 0.04 1.60
Faber, Morris, & Lieberman (2000)
-0.21 13.75 -0.57 0.16
Hamilton, Seibert, Gardner, & Talbert-Johnson (2000)
1.87 9.04 0.67 3.07
Lee, Lan, Hamman, & Hendricks (2000)
0.08 13.21 -0.41 0.56
Patterson (2005) 1.99 12.35 1.34 2.63
OVERALL 0.90 n.a. 0.31 1.48
A Q-value was calculated to assess heterogeneity among results from the included studies on note taking. Calculations yielded Q = 69.20, p < 0.001, indicating statistically significant differences among study results. Subsequent analyses of study subgroups based on available data (subject, grade, and level of cognitive guidance) were conducted to determine the potential causes of this heterogeneity. As Table 3.5 indicates, findings among subject and grade subgroups are remarkably consistent, with the exception of studies of science content which had a somewhat higher effect than other subjects (g = 1.01), and elementary studies which had a somewhat higher effect than other grade levels (g = 1.00) However, larger differences were found between interventions that offered low cognitive guidance (e.g., generic note taking) and those that offered higher cognitive guidance (e.g., strategic note taking and concept mapping) with effects of g = 0.87 and g = 1.41 respectively.

40
Table 3.5: Effect Size & Confidence Intervals for Secondary Analyses of Note Taking Studies by Moderator
Moderator Category No. of Studies
Effect Size (Hedges’ g)
95% Confidence Interval
Lower Upper
Subject Language Arts 1 0.81 0.04 1.59
History/S. Studies 2 0.75 -1.28 2.77
Science 5 1.01 0.32 1.69
Grade Elementary 4 1.00 0.11 1.89
Middle 3 0.80 -0.32 1.92
High 1 0.82 0.04 1.59
Cognitive Guidance
Low 2 0.87 1.18 2.15
High 5 1.41 0.50 1.78
Summarizing
Similarly, all studies except one (Olson & Land, 2007) produced positive effects for summarizing (see Table 3.6) with an overall effect of g = 0.32. Olson and Land’s longitudinal study examined the effects of the Pathway Project, a professional development program focusing on cognitive strategies, on the achievement of secondary school English language learners. The cognitive strategies intervention was a repertoire-building approach in which students were taught and provided scaffolding in a host of active reading comprehension and writing strategies, including goal setting and summarizing. The study compared the achievement of students taught by teachers who participated in the Pathway Project with that of students taught by teachers who did not participate in the Pathway Project. In the Pathway Project, teachers learned to teach not through transmission but through transaction, which involves modeling (think-alouds), discussion and reflection, and student practice with peers in a series of workshop-type classes (Olson & Land, 2007). Teachers modeled self-monitoring and self-regulation while reading for comprehension, taught students a color-coding system for distinguishing different types of assertions in an analytical essay, and provided students cognitive strategy sentence starters. A few of the cognitive strategy sentence starters prompted students to set goals and objectives (e.g., “My top priority is ….;” “To accomplish my goal, I plan to …..”). Other sentence starters included prompts to guide students in summarizing reading passages (e.g., “The basic gist is….” “In a nutshell, this says that …”). The effectiveness of the Pathway Project was examined by identifying control groups for the Pathway teachers. Pathway teachers were paired with non-Pathway teachers in their respective schools, and student outcomes from each group were compared on a variety of outcomes (e.g., literary analysis, analytic writing, California High School Exit Exam scores). Although the overall effect size for the Pathway Project was negative, its impact on student writing was 0.20 (with a lower and upper limit of 0.16 and 0.25, respectively). Unfortunately, interpretation of the results from the

41
Pathway Project is limited in internal validity. Without having randomly assigned teachers to participate in Pathways or not, the teachers’ volunteerism or other related factors (e.g., intelligence, experience, prior knowledge)—factors that may not have been present among control teachers—could be the primary explanatory factors for the differences in student achievement.
Table 3.6: Individual & Composite Effect Sizes, Weights, and Confidence Intervals for Summarizing Studies
Study Effect Size (Hedges’ g)
Relative Weight
95 % Confidence Interval
Lower Upper
Alfassi (1998) 0.66 2.89 -0.62 1.95
Alfassi (2004) 0.40 9.53 -0.17 0.97
Broer, Aarnoutse, Kieviet, & van Leeuwe, (2002)
0.26 18.23 -0.05 0.47
Jitendra, Hoppes & Xin (2000)
0.30 7.77 -0.37 0.98
Johnson-Glenberg (2000) 0.66 9.09 0.07 1.26
Lederer (2000) 0.10 14.61 -0.24 0.45
Mastropieri, Scruggs, Spencer & Fontana (2003)
1.20 4.24 0.17 2.22
Meyer, Middlemiss, Theordorou, Brezinski & McDougall (2002)
0.78 8.40 0.15 1.41
Olsen & Land (2007) -0.07 20.59 -0.17 0.02
Takala (2006) 0.38 4.65 -0.58 1.35
OVERALL 0.32 n.a. 0.09 0.56
A Q-value was calculated to assess heterogeneity among results from the included studies on summarizing. The calculations yielded Q = 19.53, p = 0.007, indicating statistically significant differences among study results. Subsequent analyses of study subgroups based on available data (subject and grade) were conducted to determine the potential causes of this heterogeneity. As Table 3.7 indicates, findings among the subgroups are remarkably consistent, with the exception of the two language arts studies among which summarizing had a slightly larger impact (g = 0.54). Unfortunately, the heterogeneity found among the identified effect sizes was not explained by the available data from the studies.

42
Table 3.7: Effect Size & Confidence Intervals for Secondary Analyses of Summary Studies by Moderator
Moderator Category No. of Studies
Effect Size (Hedges’ g)
95% Confidence Interval
Lower Upper
Subject Language Arts 2 0.54 -0.51 1.59
History/S. Studies 6 0.33 -0.07 0.71
Grade Elementary 2 0.35 -0.25 0.95
Middle 2 0.39 -0.34 1.12
High 4 0.37 -0.17 0.92
Connecting New Research Information to Original CITW Findings All but one of the articles included in the current analysis reported positive effects for note taking. Similarly, all but one of the articles included in the current analysis reported positive effects for summarizing. This indicates that the current literature still supports the original claim that the two strategies are effective instructional techniques. Marzano et al. (2001) reported an overall effect size of 1.00, combining both techniques into a single effect. For this current revision, the two strategies were separated because they contain enough distinctive characteristics to warrant separate analyses and discussion. The overall effect size of the meta-analysis conducted for this study was similar for note taking (g = 0.90) and considerably smaller for summarizing (g = 0.32) than the effect reported by Marzano et al (2001). This smaller effect may be the result of more conservative methodology. The current meta-analysis used a very specific definition to operationalize the two strategies. Studies that did not fit into this definition were excluded. The smaller effect size may also be the result of the more stringent study selection criteria. Only studies with an ability to control for alternative hypotheses were included, resulting in relatively small sample sizes. Where appropriate the effect sizes for included articles were adjusted for the nested nature of students within a classroom. This adjustment addressed issues of subject non-independence, and resulted in a smaller effect size than when this adjustment is not made. Marzano et al. (2001) did not report making this adjustment. These topics are described more fully in Chapter 1.
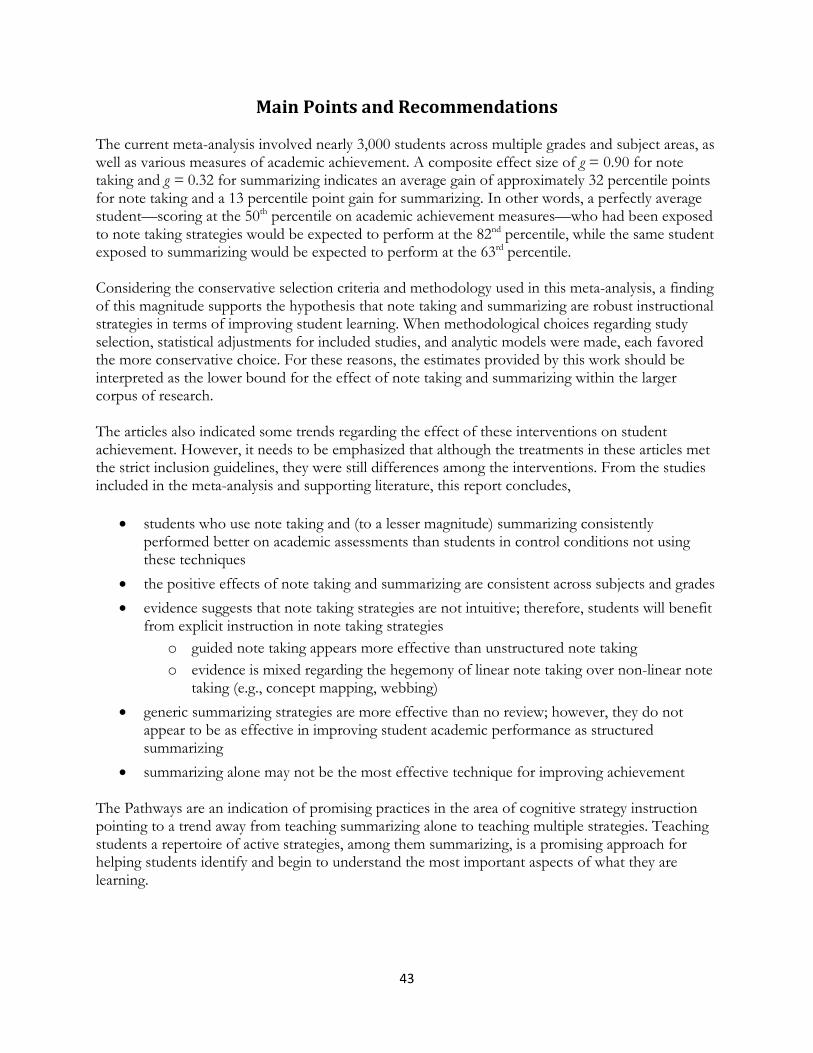
43
Main Points and Recommendations The current meta-analysis involved nearly 3,000 students across multiple grades and subject areas, as well as various measures of academic achievement. A composite effect size of g = 0.90 for note taking and g = 0.32 for summarizing indicates an average gain of approximately 32 percentile points for note taking and a 13 percentile point gain for summarizing. In other words, a perfectly average student—scoring at the 50th percentile on academic achievement measures—who had been exposed to note taking strategies would be expected to perform at the 82nd percentile, while the same student exposed to summarizing would be expected to perform at the 63rd
percentile.
Considering the conservative selection criteria and methodology used in this meta-analysis, a finding of this magnitude supports the hypothesis that note taking and summarizing are robust instructional strategies in terms of improving student learning. When methodological choices regarding study selection, statistical adjustments for included studies, and analytic models were made, each favored the more conservative choice. For these reasons, the estimates provided by this work should be interpreted as the lower bound for the effect of note taking and summarizing within the larger corpus of research. The articles also indicated some trends regarding the effect of these interventions on student achievement. However, it needs to be emphasized that although the treatments in these articles met the strict inclusion guidelines, they were still differences among the interventions. From the studies included in the meta-analysis and supporting literature, this report concludes,
• students who use note taking and (to a lesser magnitude) summarizing consistently performed better on academic assessments than students in control conditions not using these techniques
• the positive effects of note taking and summarizing are consistent across subjects and grades • evidence suggests that note taking strategies are not intuitive; therefore, students will benefit
from explicit instruction in note taking strategies o guided note taking appears more effective than unstructured note taking o evidence is mixed regarding the hegemony of linear note taking over non-linear note
taking (e.g., concept mapping, webbing) • generic summarizing strategies are more effective than no review; however, they do not
appear to be as effective in improving student academic performance as structured summarizing
• summarizing alone may not be the most effective technique for improving achievement The Pathways are an indication of promising practices in the area of cognitive strategy instruction pointing to a trend away from teaching summarizing alone to teaching multiple strategies. Teaching students a repertoire of active strategies, among them summarizing, is a promising approach for helping students identify and begin to understand the most important aspects of what they are learning.

44
References Bolded references are included in the research review.
Akinoglu, O., & Yasar, Z. (2007). The effects of note taking in science education through the mind mapping technique on students’ attitudes, academic achievement and concept learning. Journal of Baltic Science Education, 6(3), 34-42.
Alfassi, M. (1998). Reading for meaning: The efficacy of reciprocal teaching in fostering reading comprehension in high school students in remedial reading classes. American Educational Research Journal, 35(2), 309-332.
Alfassi, M. (2004). Reading to learn: Effects of combined strategy instruction on high school students. The Journal of Educational Research, 97(4), 171-184.
Arslan, M. (2006). The influence of teaching note-taking and information mapping on learning and recalling in science. The Turkish Online Journal of Educational Technology, 5(2), 56-63.
Boch, F., & Piolat, A. (2005). Note taking and Learning: A summary of research. The WAC Journal, 16, 101-113.
Borenstein, M., Hedges, L. V., Higgins, J. P. T., & Rothstein, H. (2009). Introduction to meta-analysis. West Sussex, UK: John Wiley and Sons, Ltd.
Boyle, J. R., & Weishaar, M. (2001). The effects of strategic notetaking on the recall and comprehension of lecture information for high school students with learning disabilities. Learning Disabilities Research, 16(3), 133-141.
Broer, N.A., Aarnoutse, C. A. J., Kieviet, F. K., & van Leeuwe, J. F. J. (2002). The effect of instructing the structural aspects of texts. Educational Studies, 3, 213-221.
Crismore, A. (1985). Landscapes: A state-of-the-art assessment of reading comprehension research 1974-1984. Washington, DC: U.S. Department of Education.
Faber, J. E., Morris, J. D., & Lieberman, M. G. (2000). The effect of note taking on ninth grade students’ comprehension. Reading Psychology, 21, 257-270.
Friend, R. (2001). Teaching summarization as a content area reading strategy. Journal of Adolescent & Adult Literacy 44(4), 320-329.
Hamilton, S. L., Seibert, M. A., Gardner, R., & Talbert-Johnson, C. (2000). Using guided notes to improve the academic achievement of incarcerated adolescents with learning and behavior problems. Remedial and Special Education, 21(3), 133-140.
Hattie, J., Biggs, J., & Purdie, N. (1996). Effects of learning skills interventions on student learning: A meta analysis. Review of Educational Research, 66, 99-136.
Jitendra, A. K., Hoppes, M. K., & Xin, Y. P. (2000). Enhancing main idea comprehension for students with learning problems: The role of a summarizing strategy and self-monitoring instruction. The Journal of Special Education, 34(3), 127-139.
Johnson-Glenberg, M. C. (2000). Training reading comprehension in adequate decoders/poor comprehenders: Verbal versus visual strategies. Journal of Emotional Psychology, 92(4), 772-782.
Kiewra, K. A. (1987). Note taking and review. The research and its implications. Journal of Instructional Science, 16, 233-249.

45
Kobayashi, K. (2005). What limits the encoding effect of note-taking? A meta-analytic examination. Contemporary Educational Psychology, 30, 242-262.
Kobayashi, K. (2006). Combined effects of note-taking/reviewing on learning and the enhancement through interventions: A meta-analytic review. Educational Psychology, 26, 459-477.
Konrad, M. , Jospeh, L. M., Eveleigh, E. (2009). A meta-analytic review of guided notes. Education and the Treatment of Children, 32(3), 421-444.
Lederer, J. M. (2000). Reciprocal teaching of social studies in inclusive elementary classrooms. Journal of Learning Disabilities, 33(1), 91-106.
Lee, P.-L., Lan, W., Hamman, D., & Hendricks, B. (2008). The effects of teaching notetaking strategies on elementary students' science learning. Instructional Science, 36, 191-201.
Makany, T., Kemp, J., & Dror, I. E. (2009). Optimising the use of note-taking as an external cognitive aid for increased learning. British Journal of Educational Technology, 40, 619-635.
Marzano, R., Pickering, D., & Pollock, J. (2001). Classroom instruction that works: Research-based strategies for increasing student achievement. Alexandria, VA: Association for Supervision and Curriculum Development.
Mastropieri, M. A., Scruggs, T. E., Spencer, V., & Fontana, J. (2003). Promoting success in high school world history: Peer tutoring verses guided notes. Learning Disabilities Research & Practice, 18(1), 52-65.
Meyer, B. J. F., Middlemiss, W., Theodorou, E., Brezinski, K. L., & McDougall, J. (2002). Effects of structure strategy instruction delivered to fifth-grade children using the internet with and without the aid of older adult tutors. Journal of Educational Psychology, 94(3), 486-519.
Olson, C. B., & Land, R. (2007). A cognitive strategies approach to reading and writing instruction for English Language Learners in secondary school. Research in the Teaching of English, 41(3), 269-303.
Patterson, K. B. (2005). Increasing positive outcomes for African American males in special education with the use of guided notes. The Journal of Negro Education, 74(4), 311-320.
Piolat, A., Olive, T., & Kellog, R. T. (2004). Cognitive effort of note taking. Applied Cognitive Psychology, 18, 1-22.
Robinson, D. H., Katayama, A. D., DuBois, N. F., & DeVaney, T. (1998). Interactive effects of graphic organizers and delayed review in concept acquisition. The Journal of Experimental Education, 67, 17-31.
Rosenshine, B., & Meister, C. (1994). Reciprocal teaching: A review of the research. Review of Educational Research, 64(4), 479-530.
Takala, M. (2006). The effects of reciprocal teaching on reading comprehension in mainstream and special (SLI) education. Scandinavian Journal of Educational Research, 50(5), 559-576.

46
Chapter 4: Reinforcing Effort and Providing Recognition
Background and Definitions The strategies in this current chapter focus on student motivation, rather than cognitive skills. Student motivation is an important area for teachers to consider, as many studies have indicated a link between motivation and achievement (Eccles, Wigfield, & Schiefele, 1998; Greene, Miller, Crowson, Duke, & Akey, 2004; Phan, 2009). Specifically, a student’s level of academic success is influenced by the amount of effort and persistence a student expends (Bouffard, Boisvert, Vezeau, & Larouche, 1995; Elliot, McGregor, & Gable, 1999). Several theories of motivation are currently found in the literature, suggesting that motivation is complex and can be influenced by many variables such as cultural beliefs, teachers’ beliefs, parents’ beliefs, and student variables (Wigfield & Eccles, 2000). Theories of motivation suggest that students may be more or less motivated to engage and persist in activities depending on their beliefs about their competence (self-efficacy), their interest in the task and the reason why they are interested (intrinsic motivation and task value), and their beliefs about whether or not they have any control over the outcome (control or attribution beliefs; Atkinson, 1964, Bandura, 1986; Covington, 1992, Pintrich & Schrauben, 1992; Pintrich & Schunk, 2002). These variables are interrelated and are also influenced by many other variables (Phan, 2010; Walker, Greene, & Mansell, 2006). Certain classroom settings and teaching strategies can lead to increased self efficacy, intrinsic motivation, task value, and control beliefs.
Reinforcing Effort One strategy identified in the literature to increase motivation is to reinforce effort. The theory behind this strategy is that the reinforcement should support a student’s effort rather than only recognizing ability (Wigfield, Eccles, & Rodriguez, 1998). This allows a chance for all students to receive recognition, because all students are able to put forth effort. Students’ success should be determined based on their own progress and mastery of the task, rather than in their performance in comparison to others. A classroom with a mastery-oriented goal structure would emphasize understanding and improvement, while one with a performance goal structure would emphasize competition and comparisons of ability. Mastery-oriented classroom settings can also lead to an
Trudy Clemons Charles Igel
Andrea Beesley
47
adoption of personal mastery goals by students (Greene et al., 2004; Murayama & Elliot, 2009; Urdan, 2004). By developing a mastery-oriented environment, teachers can increase students’ self-efficacy, intrinsic motivation, and task value, which can lead to increased achievement (Greene et al., 2004; Walker et al., 2006). The use of mastery-oriented environments may lead to deeper learning also, because intrinsic motivation (motivation derived from the task itself, rather than from an external reward) is associated with engagement, challenge-seeking, confidence, and persistence, and thus motivates the kind of engagement associated with deep learning (Deci & Ryan, 1985; Ryan & Deci, 2000). Specific strategies are suggested for working with struggling learners’ motivation, as they may have lower self-efficacy from exposure to repeated academic difficulties and failures and are therefore less likely to engage and persist in tasks that they perceive as difficult (Diperna, 2006; Schunk, 1999; Walker, 2003; Zimmerman, 2000). A student in this situation may have the belief that they do not have control over the outcome, because no matter how hard they try, they are not successful. Also, student’s beliefs about their ability are most strongly related to their past performance (Ryan & Deci, 2000). When working with struggling learners, teachers may need to create opportunities to provide reinforcement for success. Students should be provided with some initial tasks that are challenging but not beyond their capabilities. Success on these tasks will allow teachers to gradually present more challenging tasks and link new work to past successes (Margolis & McCabe, 2004).
Providing Recognition As described above, providing recognition of effort with a focus on mastery orientation can be a successful strategy to increase motivation related to achievement. In reviewing the literature on the relationship between praise and intrinsic motivation, Henderlong and Lepper (2002) determined that praise can influence intrinsic motivation if students perceive the praise to be sincere, and if the praise promotes self-determination, encourages students to attribute their performance to causes that they can control, and establishes attainable goals and standards. Praise that is more person-oriented or ability-oriented (rather than task- or process-oriented) can have unintentional negative effects on intrinsic motivation: when students have setbacks in the domain that was praised, students may think they have lost their ability and may react afterwards with helplessness. Teachers therefore must use praise with caution. Recognition or praise has also been discussed in the literature as a classroom management technique for promoting engagement to decrease inappropriate behavior (Moore-Partin, Robertson, Maggin, Oliver, & Wehby, 2010; Simonson, Fairbanks, Briesch, Myers, & Sugai, 2008). While cautioning that all forms of praise are not appropriate in all situations, these authors presented specific praise strategies that may be effective. For example, praise techniques that involve clearly identifying and teaching students the expectations, and providing recognition of the behaviors that are consistent with those expectations, may be effective for classroom management. This strategy can lead to an increase in student engagement including on-task behavior and conflict resolution (Lane, Wehby, & Menzies, 2003; Lo, Loe, & Cartledge, 2002). While motivation is a complex construct influenced by many variables, findings from research suggest that teachers may be able to influence achievement motivation by using a mastery-oriented approach to provide recognition and praise, and that praise can also be used to promote student engagement to decrease behavioral problems. Marzano, Pickering, and Pollock (2001) reported a

48
composite effect size of 0.80 when combining studies on reinforcing effort and providing recognition.
Methods
Literature Search
Bibliographic databases in both education and psychology (e.g., Education Resources Information Center, Education: A SAGE Full Text Collection, Professional Development Collection, PsycInfo, and JSTOR) were searched using achievement and learning as the outcome keywords crossed with each strategy keyword: effort, recognition, reinforcement, goal orientation, mastery orientation. Author searches were then conducted based on citations in the included studies. Searches continued until results repeatedly contained duplicate hits. Initial search procedures identified only one study that addressed either of the two strategies using academic performance as a criterion. Follow-up searches of the ERIC database were then conducted with the terms achievement and learning removed. The follow-up search resulted in two additional studies. These used alternative criterion measures such as motivation or self-reported causal attributions to performance. A complete description of selection criteria is available in Chapter 1. Article Sampling
Only one study (Chan & Moore, 2006) met the original search criteria for the strategies of reinforcing effort and providing recognition. Two additional studies met the criteria once academic achievement/learning was removed as a requirement. Several studies did not test K-12 samples or used small-sample case studies that did not provide sufficient data for meta-analysis and thus were excluded. Another problem was one of definition. Studies testing dissimilar interventions cannot be combined to produce a single effect. Within the literature, reinforcing effort and providing recognition are defined rather broadly; therefore, combining them into a single analysis would be inappropriate. Because of this, meta-analysis of individual study results was not possible. Instead of reporting an overall effect size as done in other chapters of the full report, the Results section of this chapter provides descriptive analyses of individual studies. Table 4.1 provides information about those studies that are included in the descriptive analyses.
Other Meta-Analyses No other meta-analyses were found related to reinforcing effort and providing recognition since the publication of the Marzano et al. (2001) report.

49
Table 4.1: Studies Included in the Effort & Recognition Meta-analysis
Study Research Design Grade Level
Number of
Students Content Area Location Learning
Strategy Outcome
Measure(s)
Chan & Moore (2006)
QED a
Middle & high school
1,194 English, math & science
Australia Shifting attributional beliefs toward effort
1) Self-regulated Learning Strategies Scale 2) Causal Attribution Scale
Garcia & de Caso (2004)
QED b
Elementary 127 Writing Spain Increasing motivation & effort
1) Writing assessment
Horner & Gaither (2004)
QED Elementary 29 Math U.S. Modeling effort & feedback on effort
1) Researcher-developed assessment
a This is the sole study for which an effect size of an academic outcome measure could be calculated b
Note: QED – quasi-experimental design Used an academic outcome measure but provided insufficient data for meta-analysis

50
Results Although the strategies of reinforcing effort and providing recognition have been previously separated, they are described together here because the actions used to carry out each strategy, and the underlying theories described earlier, are similar across both. As mentioned, calculation of an overall effect size was not possible with the identified literature. This section will report descriptively the outcomes of the identified studies. The first study (Chan & Moore, 2006) followed cohorts of middle and high school students for three years. The study compared the academic achievement of students who were taught learning strategies in combination with attempts to change students’ attributional beliefs against students in a control condition who did not receive this instruction. Findings indicated a small but positive association between participation in the strategy/attribution intervention and achievement. McREL calculated a small overall effect size (g = 0.16) for academic achievement when averaged across grade and subject area, with no significant differences across comparisons. Chan and Moore reported correlations for identified latent variables from self-report data, strategy use, and combined achievement scores. The three latent variables include 1) a belief in personal control over success (PC); 2) a tendency to attribute failure to one’s self rather than outside forces (SB); and learned helplessness seen as the tendency to attribute success/failure of luck or external forces (LH). Only the first two, PC and SB, are measured for the primary cohort, while all three are assessed in the secondary. Results are reported in Tables 4.2 and 4.3 for middle and high school cohorts, respectively. Table 4.2: Correlations for Middle School Students among Latent Variables, Strategies Employed, and Achievement in Chan & Moore, 2006
Note: Correlations for the intervention group are reported below the diagonal and those for the control group are reported above the diagonal in italics. Table found in Chan and Moore (2006, p. 172).

51
Table 4.3: Correlations for High School Students among Latent Variables, Strategies Employed, and Achievement in Chan & Moore, 2006
Correlations for the intervention group are reported below the diagonal and those for the control group are reported above the diagonal in italics. Table found in Chan and Moore (2006, p. 172). Among both cohorts, correlations among the reported variables increased during the three years for the intervention group, but remain relatively stable for the control. Among both cohorts, correlations among the positive attributional belief (PC) and achievement remained positive and fluctuated from moderate to low across years, yet surprisingly this association was generally stronger among students in the control condition. The negative correlation between maladaptive beliefs (SB, LH) and achievement attenuated across years for both cohorts, showing no difference between treatment conditions among either cohort by the final year of the study. In the second study, Garcia and de Caso (2004) used an intervention designed to help encourage low-performing 5th and 6th grade students with learning disabilities to believe that personal effort was an important part of academic success. Their study randomly assigned 127 students to either a treatment or a control condition. The treatment condition consisted of 25 sessions that included both motivational and instructional techniques, including relevant assignments connected to real-life experiences, token reinforcement, teamwork, discussions that attributed success to effort, and graphic organizers, plan sheets, prompt cards, step-by-step guidelines, and checklists. A standardized battery of tests measuring writing skills and processes was given to both control and treatment groups before and after the intervention. Of particular importance to the present study are the measures of narrative quality. Among these, negligible to small effects were found for paragraph structure (η2 =0.175), overall coherence (η2 = 0.161), and plot thread (0.065). No effects were found for relevance nor for the use of links.

52
The third study, Horner and Gaither (2004), evaluated the effect of a teacher modeling effort by comparing student performance in two different second-grade mathematics classrooms. Both classrooms focused on problem solving in mathematics. In one classroom, the teacher modeled problem solving with effort and used self-talk both as a self-monitoring tool and as a way to make the strategies more explicit to students. In addition, the teacher provided feedback on effort when the students practiced applying what the teacher had modeled. In the control classroom, students did not experience teacher modeling application of effort or feedback on their effort. Students in both conditions were given a unit-specific pretest and the same posttest. Although students in the modeling condition decreased attributing outcomes to uncontrollable factors (e.g., luck), they did not significantly increase their attributions to effort. Importantly, performance between treatment and control conditions on the mathematics achievement assessment was statistically indistinguishable. One possible explanation for the null findings may have been the type of feedback that the teacher provided. The feedback pointed out inaccurate answers followed by personal non-instructive feedback (e.g., “No, you didn’t get that correct. If you try harder you will be able to get the right answer.”).
Connecting New Research Information to Original CITW Findings The results of these three recent studies provide little additional empirical support for the effectiveness of reinforcing effort and providing recognition as an instructional strategy to improve student outcomes. For the single study that used achievement as an outcome variable, the effect size (0.16) was small in comparison to alternative instructional interventions. Similarly, negligible associations were found among writing performance and attributional measures. There were simply few experimental studies of this strategy. It may be that in a contemporary research climate in which experimental studies are primarily focused on the effects of curriculum interventions, there are few researchers developing and testing studies of interventions based on motivational contexts for learning. Based on the synthesis of 21 effect sizes, Marzano et al. (2001) reported a moderate/large combined effect (0.80) for the interventions, but did not publish much detail about the interventions that led to these effect sizes, so it is not possible to know how similar they were to the studies reviewed here. Based on the lack of identified studies in the present review, interpretations regarding the update of this effect should be made with caution.
Main Points and Recommendations Unlike other chapters in the full report, the current chapter does not meta-analyze recent studies. Rather, it summarized the empirical literature on the effects of effort and recognition. No overall effect size has been calculated and the number of available studies to review descriptively is small. Furthermore, each used a different outcome measure. Across outcomes, the effect of reinforcing effort and providing recognition (at least as operationalized in these studies) was small and frequently indistinguishable from control conditions. The following recommendations are made from synthesizing the conceptual literature with the few available studies reviewed herein:
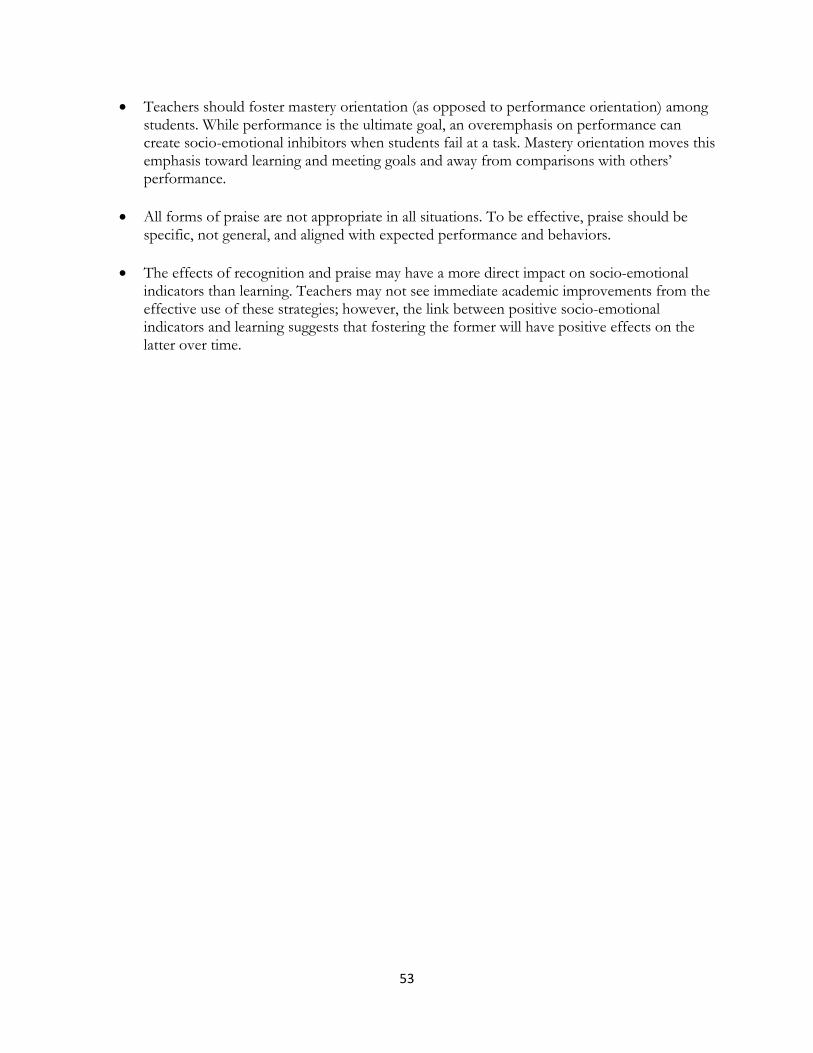
53
• Teachers should foster mastery orientation (as opposed to performance orientation) among students. While performance is the ultimate goal, an overemphasis on performance can create socio-emotional inhibitors when students fail at a task. Mastery orientation moves this emphasis toward learning and meeting goals and away from comparisons with others’ performance.
• All forms of praise are not appropriate in all situations. To be effective, praise should be specific, not general, and aligned with expected performance and behaviors.
• The effects of recognition and praise may have a more direct impact on socio-emotional indicators than learning. Teachers may not see immediate academic improvements from the effective use of these strategies; however, the link between positive socio-emotional indicators and learning suggests that fostering the former will have positive effects on the latter over time.

54
References Bolded references are included in the research review.
Atkinson, J. W. (1964). An introduction to motivation. Princeton, NJ: Van Nostrand. Bandura, A. (1986). Social foundations of thought and action: A social cognitive theory. Englewood Cliffs, NJ:
Prentice-Hall. Bouffard, T., Boisvert, J., Vezeau, C., & Larouche, C. (1995). The impact of goal orientation on self-
regulation and performance among college students. British Journal of Educational Psychology, 65, 317-329.
Chan, L. K., Moore, P. J. (2006). Development of attributional beliefs and strategic knowledge in years 5-9: A longitudinal analysis. Educational Psychology, 26(2), 161-185
Chouinard, R., Karsenti, T. & Roy, N. (2007). Relations among competence beliefs, utility value, achievement goals, and effort in mathematics. British Journal of Educational Psychology, 77, 501-517.
Covington, M. V. (1992). Making the grade: A self-worth perspective on motivation and school reform. New York: Cambridge University Press.
Deci, E. L., & Ryan, R. M. (1985). Intrinsic motivation and self determination in human behavior. New York: Plenum Press.
Diperna, J. C. (2006). Academic enablers and student achievement: Implications for assessment and intervention services in the schools. Psychology in the Schools, 43(1), 7-17.
Eccles, J. S., Wigfield, A, & Schiefele, U. (1998). Motivation to succeed. In W. Damon & N. Eisenberg (Eds.), Handbook of Child Psychology (5th
Elliot, A. J., McGregor, H. A., & Gable, S. (1999). Achievement goals, study strategies, and exam performance: A mediational analysis. Journal of Educational Psychology, 91(3), 549-563.
ed., Vol. 3). New York: Wiley.
Garcia, J. N., de Caso, A. M. (2004). Effects of a motivational intervention for improving the writing of children with learning disabilities. Learning Disability Quarterly, 27, 141-159.
Greene, B. A., Miller, R. B., Crowson, H. M., Duke, B., & Akey, K. (2004). Predicting high school students’ cognitive engagement and achievement: Contributions of classroom perceptions and motivation. Contemporary Educational Psychology, 29(4), 462-482
Henderlong, J., & Lepper, M. R. (2002). The effects of praise on children’s intrinsic motivation: A review and synthesis. Psychological Bulletin, 128(5), 774–795.
Horner, S.L., Gaither, S.M. (2004). Attributional retraining instruction with a second-grade class. Early Childhood Education Journal, 31(3), 165-170.
Lane, K. L., Wehby, J., & Menzies, H. M. (2003). Social skills instruction for students at risk for antisocial behavior: The effects of small group instruction. Behavioral Disorders, 28, 229-248.
Lo, Y., Loe, S. A., & Cartledge, G. (2002). The effects of social skills instruction on the social behaviors of students at risk for emotional or behavioral disorders. Behavioral Disorders, 27, 371-385.
Margolis, H. & McCabe, P. P. (2004). Self-efficacy: A key to improving the motivation of struggling learners. Clearing House, 77(6), 241-249.

55
Marzano, R., Pickering, D., & Pollock, J. (2001). Classroom instruction that works: Research-based strategies for increasing student achievement. Alexandria, VA: Association for Supervision and Curriculum Development.
Moore-Partin, T. C., Robertson, R. E., Maggin, D. M., Oliver, R. M., & Wehby, J. H. (2010). Using teacher praise and opportunities to respond to appropriate student behavior. Preventing School Failure, 54(3), 172-178.
Murayama, K., & Elliot, A. J. (2009). The joint influence of personal achievement goals and classroom goal structures on achievement-relevant outcomes. Journal of Educational Psychology, 101(2), 432-447.
Phan, H. P. (2009). Reflective thinking, effort, persistence, disorganization, and academic performance: A mediational approach. Education and Psychology, 7(3), 927-952.
Phan, H. P. (2010). Exploring students’ reflective thinking practice, deep processing strategies, effort, and achievement goal orientations. Educational Psychology, 29(3), 297-313.
Pintrich, P. R., & Schrauben, B. (1992). Students’ motivational beliefs and their cognitive engagement in classroom tasks. In D. Schunk & J. Meece (Eds.), Students perceptions in the classroom: Causes and consequences (pp. 149-183).Hillsdale, NJ: Lawrence Erlbaum.
Pintrich, P. R., & Schunk, D. H. (Eds.). (2002). Motivation in education: Theory, research, and applications (2nd ed.). Columbus, OH: Merrill.
Ryan, R. M., & Deci, E. L. (2000). Self-Determination Theory and the facilitation of intrinsic motivation, social development, and well-being. American Psychologist, 55(1), 68-78.
Schunk, D. H. (1999). Social-self interaction and achievement behavior. Educational Psychologist, 34(4), 219-227.
Simonson, B., Fairbanks, S., Briesch, A., Myers, D., & Sugai, G. (2008). Evidence-based practices in classroom management: Considerations for research to practice. Education and Treatment of Children, 31(3), 351-380.
Urdan, T. (2004). Using multiple methods to assess students’ perceptions of classroom goal structures. European Psychologist, 9(4), 222-231.
Walker, B. (2003). The cultivation of student self-efficacy in reading and writing. Reading and Writing Quarterly: Overcoming Learning Difficulties, 19(2), 173-187.
Walker, C. O., Greene, B. A., & Mansell, R. A. (2006). Identification with academics, intrinsic/extrinsic motivation, and self-efficacy as predictors of cognitive engagement. Learning and Individual Differences, 16, 1-12.
Wigfield, A., & Eccles, J. (2000). Expectancy-value theory of achievement motivation. Contemporary Educational Psychology, 25, 68-81.
Wigfield, A., Eccles, J., & Rodriguez, D. (1998). The development of children’s motivation in school contexts. Review of Research in Education, 23, 73-118.
Zimmerman, B. J. (2000). Self-efficacy: An essential motive to learn. Contemporary Educational Psychology, 25, 82-91.

56
Chapter 5: Homework and Practice
Background and Definitions Research on the effects of practice related to mastery of a skill has been around since the late 1800’s when Hermann Ebbinghaus, a pioneer in cognitive psychology, first conducted experiments on memory. Ebbinghaus found that people learn fast at first, followed by a slower rate with repeated practice trials needed to reach mastery. Therefore, he was the first to describe the learning curve in relation to learning and practice. Since this research, educators have used practice in classrooms and in the form of homework to help students obtain new knowledge and skills and retain this information for later retrieval. Many more recent studies on homework and practice have also shown that these strategies can positively influence student achievement; however, certain conditions may be necessary for creating this impact. While homework serves as one way that students can practice material presented in class, practice may also occur in class or be self directed by the learner rather than as a homework assignment. Since homework involves practice under a distinct set of conditions (i.e., assigned to be completed out of school), this chapter will review homework separate from practice.
Practice Research in cognitive psychology has demonstrated that learning takes active retrieval of material, not just review. When students study, they often re-read notes or texts without actively retrieving the material that they think they have learned (McDaniel, Roediger & McDermott, 2007). Repeated study alone does not result in learning (Karpicke & Roediger, 2008). In order to impact learning, practice must be overt, be ordered appropriately, and include adjustment to feedback. Overt practice means that students are actively recalling material through testing, via teacher-directed quizzes, student-directed rehearsal, or self-assessment (e.g., flash cards, labeling blank maps). This type of testing in practice can lead to increases in student achievement (Carpenter, Pashler, Wixted & Vul, 2008; Pashler, Bain, et al., 2007; Roediger & Karpicke, 2006). More frequent practice testing (e.g., two or three times during the time period between acquisition or presentation of material and final assessment of knowledge) produces greater effects on achievement than does less frequent practice testing (Karpicke & Roediger, 2008). Students who are involved in testing as practice outperform those who only review materials—not only on tests of the same materials, but
Charles Igel Trudy Clemons
Tedra Clark

57
also on tests that require transfer of knowledge (Johnson & Mayer, 2009; Rohrer, Taylor, & Sholar, 2010). The order in which the materials are practiced can also impact the level of retention. Students who practice multiple types of skills within one session, versus repeatedly practicing one skill, tend to perform better on later tests of skills (Hall, Domingues & Cavazos, 1994; Rohrer & Taylor, 2007). For example, mathematics students who completed a set of practice problems all using the Pythagorean theorem may not be able to identify the appropriate technique on a later test when a problem requiring the Pythagorean theorem is presented, whereas students who practiced problems requiring the Pythagorean theorem with other problems requiring additional mathematics techniques would be better able to identify which technique to apply. Practice is also more successful when learners access and use feedback about their performance to shape their practice. This means that teachers must provide ongoing feedback on student practice for students to respond to and develop new strategies. This type of corrective feedback used to shape practice promotes retention and improves achievement (Pashler, Rohrer, Cepeda, & Carpenter, 2007).
Homework Although homework can serve a variety of instructional and non-instructional purposes, some of the primary purposes of homework are to involve students in opportunities to practice and review materials that were presented in class, introduce new materials, encourage the transfer of previously learned skills to new situations, and integrate separately learned skills (Cooper, Robinson, & Patall, 2006; Gill & Schlossman, 2003). Homework can also be used for non-instructional purposes such as fostering communication with parents regarding objectives of the class. While all of the principles related to practice also should be addressed in homework, homework is a distinct form of practice in which teachers have less control over whether or not students will complete the homework, how much time and effort they will put into the homework, and the environment in which the student will complete the homework. The effects of homework can be influenced by student’s learning preferences, how teachers structure and monitor assignments and home environments and parent support (Hong, Milgram, Rowell, 2004; Minotti, 2005). Students may be more successful on their homework if the conditions in which they have to complete homework match their preferred conditions (Hong, 2001). Teachers can share strategies with parents for helping to create conditions at home to match a child’s preference. Providing parents with information on different structures and monitoring techniques appropriate for different types of learners can be beneficial (Hong & Lee, 2003). Although parents should be involved with helping to create appropriate environments, their involvement in the actual content of the homework has not been seen as beneficial (Balli, 1998; Balli, Demo, & Wedman, 1998; Balli, Wedman, & Demo, 1997; Perkins & Milgram, 1996). Students in disadvantaged situations may have parents who are less involved, and homes with environments that are not conducive to their learning preferences, thus limiting their chances of success on homework. Additional parent outreach and provision of before- or after-school programming may be necessary to afford all students opportunities for completing homework. The number of students enrolled in before- and after-school programs has increased (Capizzano, Tout,

58
& Adams, 2000) and preliminary research has suggested that these programs are an effective means for providing additional time for students to practice and learn (Cosden, Morrison, Albanese, & Macias, 2001; Mahoney, Lord, & Carryl, 2005). Findings from the studies presented above suggest that, when implemented appropriately, practice in school or out of school as homework can have a positive impact on student achievement. Marzano, Pickering and Pollack (2001) reported an average effect size of 0.77 when combining studies on homework and practice.
Methods
Literature Search
Bibliographic databases in both education and psychology (e.g., Education Resources Information Center, Education: A SAGE Full Text Collection, Professional Development Collection, PsycInfo, and JSTOR) were searched using achievement and learning as the outcome keywords crossed with each strategy keyword: homework, practice, distributed practice, testing, testing effect, formative testing, or formative assessment. Author searches were then conducted based on citations in the included studies. Searches continued until results repeatedly contained duplicate hits. Initial search procedures identified only two candidate studies for homework and three for practice. Therefore, a follow-up search of the ERIC database was conducted with the terms achievement and learning removed. The follow-up search resulted in twenty-four additional candidate studies. Beyond the initial search, the references sections of located articles were checked for primary research literature that met the search criteria. A complete description of methodological criteria is available in the Methods chapter of this report. Article Sampling
Only three studies were identified that met these criteria for the topic of homework. None met the criteria for practice within the targeted publication years (1998-2008). Two recent empirical studies on practice were published after 2008; they are included in the meta-analysis for discussion purposes. The majority of excluded studies did not test K-12 samples. This was particularly true for practice, where the majority of recent research has been conducted on postsecondary populations or was published after 2008. Other studies failed to report sufficient data to meta-analyze. Another problem was one of definition. Studies testing dissimilar interventions cannot be combined to produce a single effect. Within the literature, practice is defined rather broadly; therefore combining them into a single analysis would be inappropriate. All of the included homework studies were non-experimental, involving correlational analyses of the relationship between time spent on homework and achievement. Additional studies tested other aspects of homework (e.g., parental involvement, perceived quality). These studies are not included in the meta-analysis; however, they are described in the accompanying text. The research design, samples of students, intervention and outcome measures of the included studies are summarized in Table 5.1 for homework and Table 5.2 for practice.
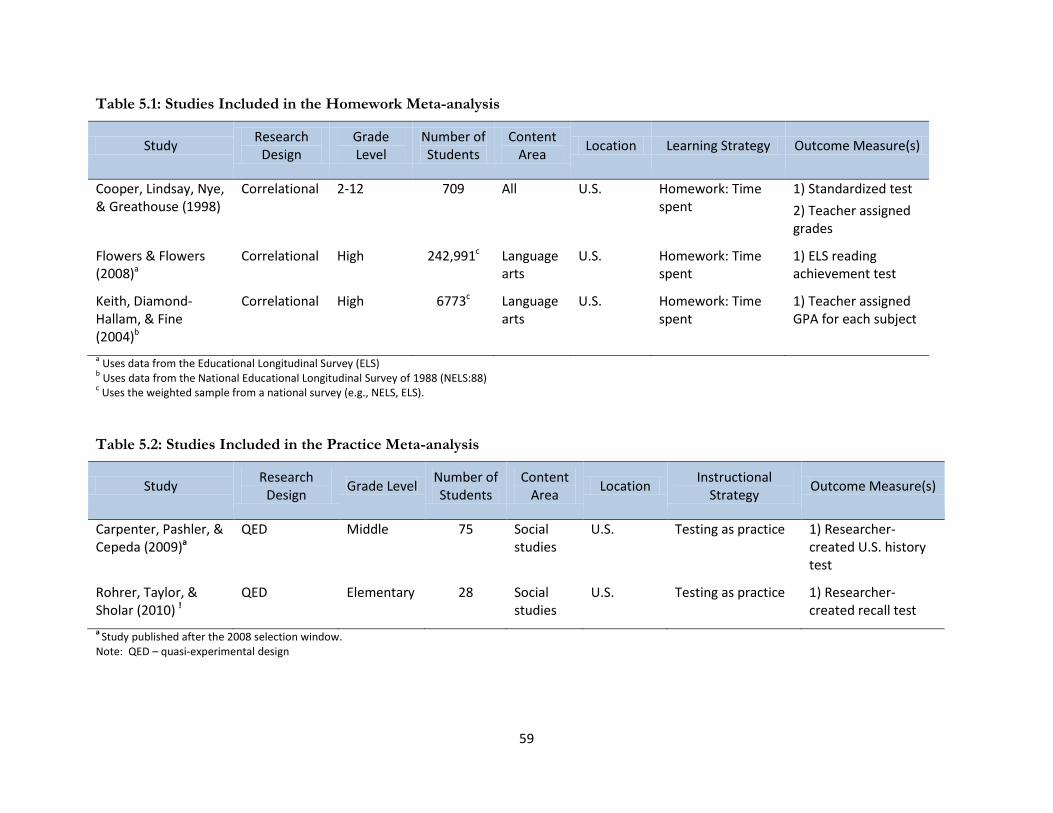
59
Table 5.1: Studies Included in the Homework Meta-analysis
Study Research Design
Grade Level
Number of Students
Content Area Location Learning Strategy Outcome Measure(s)
Cooper, Lindsay, Nye, & Greathouse (1998)
Correlational 2-12 709 All U.S. Homework: Time spent
1) Standardized test 2) Teacher assigned grades
Flowers & Flowers (2008)
Correlational a
High 242,991 Language arts
c U.S. Homework: Time spent
1) ELS reading achievement test
Keith, Diamond-Hallam, & Fine (2004)
Correlational
b
High 6773 Language arts
c U.S. Homework: Time spent
1) Teacher assigned GPA for each subject
a Uses data from the Educational Longitudinal Survey (ELS) b Uses data from the National Educational Longitudinal Survey of 1988 (NELS:88) c
Uses the weighted sample from a national survey (e.g., NELS, ELS).
Table 5.2: Studies Included in the Practice Meta-analysis
Study Research Design Grade Level Number of
Students Content
Area Location Instructional Strategy Outcome Measure(s)
Carpenter, Pashler, & Cepeda (2009)
QED a
Middle 75 Social studies
U.S. Testing as practice 1) Researcher-created U.S. history test
Rohrer, Taylor, & Sholar (2010)
QED !
Elementary 28 Social studies
U.S. Testing as practice 1) Researcher-created recall test
a
Note: QED – quasi-experimental design Study published after the 2008 selection window.

60
Other Meta-Analyses Homework
Cooper et al. (2006) conducted a more recent synthesis of research on homework practice. Using narrative and quantitative techniques, the synthesis integrates the results of research on homework from 1987 through 2003. The researchers categorized the relevant research into three types of studies: 1) studies that employed exogenous manipulations of homework (i.e., the presence or absence of homework was manipulated expressly for the purpose of the study); 2) studies that took naturalistic, cross-sectional measures of the amount of time the students spent on homework without intervention while statistically controlling for background characteristics; 3) studies that calculated simple bivariate correlations between the time spent on homework and achievement. Cooper et al.’s (2006) findings from manipulated-homework study designs were consistent and encouraging, revealing a positive relationship between homework and achievement that was robust against conservative re-analyses, including adjusting sample sizes and imputing missing data. The effect size was 0.60 under both fixed and random-error assumptions and was statistically significant when the student was used as the level of analysis. The estimated regression coefficients derived from studies using multiple regression, path analysis, or structural equation modeling (SEM), controlling for student background variables, were nearly all positive and significant. Among studies that conducted simple bivariate correlations, Cooper et al. (2006) identified 50 correlations between homework and achievement in the positive direction and 19 in the negative direction. The mean weighted correlation was r = .24 using a fixed-error model, which was significantly different from zero. In assessing moderating variables, they found that time spent on homework was a significant and positive predictor of various outcome measures and in various content areas. Lastly, they found that student reports about homework were significantly and positively related to achievement, while parent reports were not related to achievement. The purpose of the current analysis of the effectiveness of homework and practice is to gain a more current understanding of the relationship between homework and practice and achievement, as well as the potential moderating variables (e.g., gender, grade level, cognitive ability, parent involvement) of that relationship. Practice
Cepeda, Pashler, Vul, Wixted, and Rohrer (2006) set out to conduct a meta-analysis and discovered that the research on practice effects rarely evaluated retention over periods of time longer than a day. They embarked on a line of research varying both the retention period (from 1 to 50 weeks when the learner may be in a situation where he or she needs to use the material learned) and the interval between practices. They found that the optimal interval between practices is proportional to the duration of the retention period. For example, in order to remember material for use weeks later, you must study it every couple of weeks; to remember material for use years later, you must study it every few months. In this case “study” meant test or self-assess until mastery was achieved.
Pashler et al. (2007) published an Institute of Education Sciences (IES) practice guide that provides a research review on principles of learning and memory. This practice guide includes an analysis of research on using quizzing to re-expose information to students. Based on a review of nine experimental studies of the effects of quizzing or frequent testing on achievement of K-12 students,

61
the authors found quizzing to have strong evidence of effectiveness. The quizzing can be formal or informal (such as the use of Jeopardy-like games).
Results
Meta-Analysis of Articles in Sample Due to the paucity of identified studies around homework and practice, this section will present the estimated effect sizes followed by a descriptive overview of relevant studies that did not meet the inclusion criteria for the meta-analysis. The reader is cautioned that the reported effect sizes may not be representative of the true effect for each intervention as the strength of meta-analyses are reduced when so few studies are available.
As reviewed in Chapter 1, a random effects model was used to estimate a composite effect size for the five studies identified for the primary analysis across the two interventions. To maintain consistency of measurement across all studies, Hedges’ g was calculated for each study separately. Results were adjusted from studies exhibiting a mismatch between study design and analysis using a statistical adjustment where necessary. Results were then synthesized using an inverse variance weight �1 𝑤𝑤𝑖𝑖� � that assigned relatively more influence to those studies containing less variance.
The results from these calculations and final analysis are presented in Tables 5.3 for homework and 5.4 for practice interventions. When individual studies presented multiple outcomes measures within the same sample, these measures were combined into a single effect size for that study; a commonly accepted meta-analytic practice for non-independent measures (Borenstein, Hedges, Higgins, & Rothstein, 2009). When a study presented multiple outcome measures with different, independent samples, these measures are reported separately. This was the case with only one of the included studies and is noted by sub-setting the study’s name (Cooper, Lindsay, Nye, & Greathouse, 1998). In addition to the individual effects, the relative weight and 95% confidence interval around each study are also presented.
Homework Meta-Analysis
Results from the meta-analysis of the few studies (see Table 5.3) present a mixed picture of the association between homework time and academic performance resulting in a small overall effect (g = 0.13).

62
Table 5.3: Individual & Composite Effect Sizes, Weights, and Confidence Intervals for Homework Studies
Study Effect Size (Hedges’ g)
Relative Weight
95 % Confidence Interval
Lower Upper
Cooper, Lindsay, Nye, & Greathouse (1998) – gr. 2 & 4
-0.23 27.44 -0.47 0.00
Cooper, Lindsay, Nye, & Greathouse (1998) – secondary
0.17 28.51 -0.02 0.36
Flowers & Flowers (2008) 0.04 13.28 -0.72 0.80
Keith, Diamond-Hallam, & Fine (2004)
0.47 30.77 0.42 0.52
OVERALL 0.13 n.a. -0.23 0.50
Cooper et al. (1998) investigated the relationship between achievement and homework behaviors as reported by teachers, students, and parents on a newly developed questionnaire called the Homework Process Inventory. The teachers estimated the amount of homework they assigned, while the students and parents estimated the amount of teacher-assigned homework, the portion of homework completed by the student, and the time spent on homework. Achievement measures were standardized test scores from the Tennessee Comprehensive Assessment Program (TCAP) as well as teacher-assigned grades (the combined effect of which is reported here). For teacher reports in the lower grades (2 and 4) and upper grades (6-12), no significant relationships were found between the amount of homework assigned and achievement on either TCAP scores or grades. For student reports in lower grades, there were significant negative relationships between grades and both amount of homework assigned and time spent on homework; however, no significant relationships were found for TCAP scores. For student reports in upper grades, there were significant positive correlations between grades and both portion of homework completed and time spent on homework and a significant positive correlation between TCAP scores and portion completed.
Flowers and Flowers (2008) analyzed data from the Educational Longitudinal Study to examine factors related to reading achievement in African American high school students in urban environments. They found that reading achievement was significantly related to the amount of time spent on homework; however this effect of this relationship was quite small (0.04). Any statistical relationships identified may be the result of a large sample size. A study by Keith, Diamond-Hallam, and Fine (2004) involved a secondary analysis of longitudinal data from the National Education Longitudinal Study. Results of structural equation modeling techniques with both student grades and achievement test scores as outcome measures showed that out-of-school homework was substantially associated with academic performance (0.47).
Descriptive Review of Additional Empirical Literature on Homework
Additional studies on the relationships between homework and achievement not included in the meta-analysis can be broken down into three categories: 1) studies examining time spent on
63
homework, 2) studies comparing different homework practices, and 3) studies examining the influence of parent involvement on the homework-achievement relationship.
Time Spent on Homework Gill and Schlossman (2003) used several national surveys (Purdue Opinion Panel from 1948-67, National Longitudinal Survey from 1972, and National Assessment of Education Progress [NAEP] from 1976-1999) to provide a 50-year perspective on time spent on homework (1948-1999). In general, the researchers noted that there has been historical continuity, with relatively small variations in time spent on homework since World War II. On average, American children at all grade levels in 1999 spent less than one hour studying on a typical day—an amount that had not changed substantially in the past 20 years. High school students in the late 1940s and early 1950s studied no more than their counterparts in the 1970s, 1980s, and 1990s. It seems that changes in the educational opinion on homework have had little effect on actual student behavior, with only two exceptions noted: 1) a temporary increase in time spent on homework in the decade following the 1957 launch of Sputnik, a period of educational enthusiasm when practice changed considerably, and 2) a newer willingness in the 1980s and 1990s to assign smaller amounts of homework to primary grade students.
Wagner, Schober, and Spiel (2008a) investigated the amount and regulation of time students spent on homework as well as the relationship between the duration of homework time units and scholastic success. According to student diaries, students worked an average of approximately 12 hours per week at home for school. The majority of their time was used to prepare for exams and complete homework assignments. Entering gender as a factor, the analysis revealed that girls spend more time working at home for school than boys. An investigation of relationships between homework and academic success showed no significant correlations between scholastic achievement and time spent preparing for exams (r = -0.12), completing homework activities (r = -0.04), or preparing for class projects (r = 0.05). Furthermore, there were two significant negative correlations between homework time and scholastic performance, for repeating (r = -0.19) and total time (r = 0.16). Thus, lower performing students spent more time on homework than higher performing students. The results also showed that students most often worked in one-half and one-hour doses; work doses of longer than one hour were far less common. Lastly, the results suggested that students who primarily worked in half-hour doses had the best scholastic performance, experienced the lowest levels of scholastic pressure to perform, had the lowest levels of test anxiety, and had the highest levels of scholastic self-concept.
In a similar study utilizing student diaries as the sole measure of homework time, Wagner, Schober, and Spiel (2008b) examined how much time students spent on homework per week, how students distributed their time spent on homework over the course of a calendar week, whether a relationship existed between homework time and school grades, and lastly, whether systematic gender and grade differences existed in the aforementioned measures. In regard to the amount of time spent working at home for school, the findings from 824 randomly selected Austrian secondary students showed that students spent a mean of 11.7 hours per week doing homework and that girls spent more time on homework than did boys. It was also found that the amount of time spent on homework at the beginning of the week is relatively high, diminishing toward the middle of the week with an upsurge of homework time on Sunday. It was also found that student grade level (grades 7/8 vs. grades 9/10) had no relationship to either the total time spent on homework or the distribution of homework over the calendar week. Concerning the relationship between time investment on homework and scholastic achievement, the findings show little or no correlation across three

64
studies, with poor achievers spending more time on homework than high achievers. It is also apparent that gender was a significant moderating variable in the relationship between time investment and achievement, with more girls than boys showing high scholastic achievement combined with more time spent on homework, and more boys than girls showing low scholastic achievement combined with small amounts of time spent on homework.
A study by Trautwein (2007) assessed the relationship between time spent on homework, frequency of homework assignments, and homework effort (e.g., completing homework assignments carefully and not copying from others). A multilevel regression analyses was conducted in order to control for the clustering effects that occur when student characteristics are influenced by classroom and school characteristics. Results indicate that frequency of homework assignments was positively associated with achievement (class-level effect). An increase of one homework unit was associated with a gain of one standard deviation in achievement; however, this effect was dramatically reduced when variables such as school type and cognitive ability were controlled.
A study by House (2004) examined relationships between homework practices and student achievement in Japan. House (2004) conducted multiple regression analyses using student questionnaire and achievement data collected from over 4,000 13-year old Japanese students in the Third International Mathematics Study (TIMSS). In the questionnaire, students reported how frequently they did each the following activities in their mathematics classes: (a) teacher gives us homework, (b) we check each other’s homework, (c) teachers checks homework, (d) we begin homework in class, and (e) we discuss completed homework. A statistically significant and positive relationship was found between the frequency with which the teacher gave homework and student achievement.
Of the remaining four activities examined in the House (2004) study, only two were significantly related to achievement. In each case, however, the relationship was negative. The results indicated, and as House (2004) reported: “more frequent use of mathematics class time for students to check each other’s homework or for teachers to check homework were associated with lower mathematics test scores” (p. 204).
Homework Practices When assessing the relationship between any instructional practice and academic achievement, it is important to understand potential mediating variables. Zimmerman and Kitsantas (2005) conducted a path analysis to determine whether students’ self efficacy for learning and perceived responsibility beliefs served as mediators between the reports of homework practices and their academic grades. The researchers assessed the quality of homework practices via a student-completed survey composed of the following items dealing with advantageous homework practices: 1) “Do you have a regular time to study?”, 2) “Do you have a regular place to study”, 3) “Do you estimate the time needed to complete your assignments before you begin studying”, 4) “How often do you set task priorities when you do homework?”, and 5) “How often do you complete your daily assignments?” Results of the analysis showed that paths from the quality of homework to self efficacy for learning, from self efficacy to perceived responsibility, and from perceived responsibility to GPA were statistically significant. The path between homework quality and perceived responsibility and between self efficacy and GPA were also significant. Interestingly, the effect of homework quality on GPA was mediated entirely through self-efficacy and perceived responsibility, and the reverse hypothesis that homework mediated the effects of self-beliefs on GPA was not-supported by the results of a second path analysis. These results suggest that while quality homework practices may be
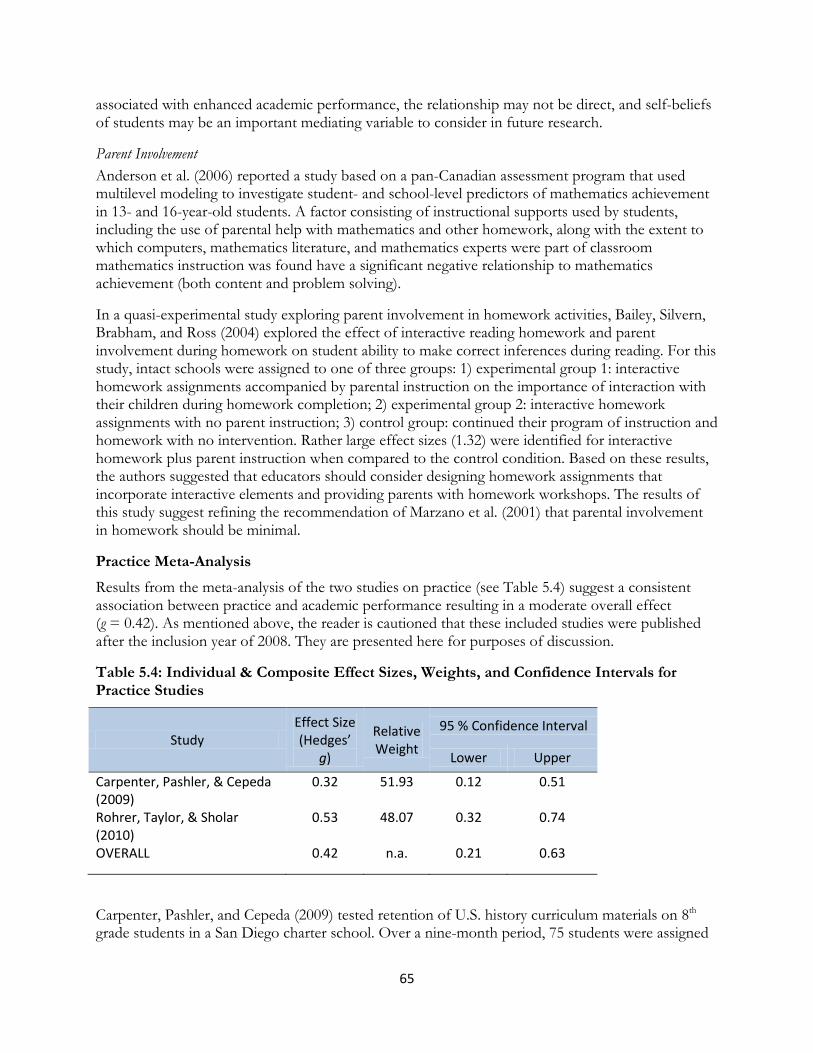
65
associated with enhanced academic performance, the relationship may not be direct, and self-beliefs of students may be an important mediating variable to consider in future research.
Parent Involvement Anderson et al. (2006) reported a study based on a pan-Canadian assessment program that used multilevel modeling to investigate student- and school-level predictors of mathematics achievement in 13- and 16-year-old students. A factor consisting of instructional supports used by students, including the use of parental help with mathematics and other homework, along with the extent to which computers, mathematics literature, and mathematics experts were part of classroom mathematics instruction was found have a significant negative relationship to mathematics achievement (both content and problem solving).
In a quasi-experimental study exploring parent involvement in homework activities, Bailey, Silvern, Brabham, and Ross (2004) explored the effect of interactive reading homework and parent involvement during homework on student ability to make correct inferences during reading. For this study, intact schools were assigned to one of three groups: 1) experimental group 1: interactive homework assignments accompanied by parental instruction on the importance of interaction with their children during homework completion; 2) experimental group 2: interactive homework assignments with no parent instruction; 3) control group: continued their program of instruction and homework with no intervention. Rather large effect sizes (1.32) were identified for interactive homework plus parent instruction when compared to the control condition. Based on these results, the authors suggested that educators should consider designing homework assignments that incorporate interactive elements and providing parents with homework workshops. The results of this study suggest refining the recommendation of Marzano et al. (2001) that parental involvement in homework should be minimal.
Practice Meta-Analysis
Results from the meta-analysis of the two studies on practice (see Table 5.4) suggest a consistent association between practice and academic performance resulting in a moderate overall effect (g = 0.42). As mentioned above, the reader is cautioned that these included studies were published after the inclusion year of 2008. They are presented here for purposes of discussion.
Table 5.4: Individual & Composite Effect Sizes, Weights, and Confidence Intervals for Practice Studies
Study Effect Size (Hedges’
g)
Relative Weight
95 % Confidence Interval
Lower Upper
Carpenter, Pashler, & Cepeda (2009)
0.32 51.93 0.12 0.51
Rohrer, Taylor, & Sholar (2010)
0.53 48.07 0.32 0.74
OVERALL 0.42 n.a. 0.21 0.63
Carpenter, Pashler, and Cepeda (2009) tested retention of U.S. history curriculum materials on 8th grade students in a San Diego charter school. Over a nine-month period, 75 students were assigned

66
to one of two learning conditions: a control condition of study through re-reading notes or a treatment condition of study plus periodic testing. Performance on the researcher-developed assessment favored the study/test group over the study only group (d = 0.32). Rohrer, Taylor, and Sholar (2010) tested the performance of intermediate grade students. Students were tasked in two separate experiments with learning names of fictional places on a map. Similar to the previous study, students were assigned to a study-only control condition or a study plus periodic testing treatment condition. Here again, student performance favored the study/test group over the study group across both experiments (d = 0.54, 0.57).
Descriptive Review of Additional Empirical Literature on Practice
Carpenter, et al. (2008) examined the effect of periodic testing on memory and retention. Participants from an unspecified pool of 55 online research subjects were asked to study a set of obscure facts in one experiment, and then learn Swahili-English word pairs in another experiment. Groups were divided into a control learning condition of materials review and a treatment condition of review with periodic testing. Improved performance was not noticeable on immediate assessments (five minutes after learning); however, in subsequent assessments ranging from 1–42 days after learning took place, the treatment group consistently outperformed the control group on both recall of obscure facts and Swahili-English word pairs.
Rohrer and Taylor (2007) studied the effect of distributed learning time on the academic performance of college undergraduates. Two separate experiments were conducted in which participants were randomly assigned to one of two conditions—practicing mathematics concepts using either massed practice or practice spaced over several sessions. Among the 66 participants, significant differences in performance on mathematics assessments were found between those that massed instruction into a single time period and those that spaced learning over time in favor of the latter, F(2,57) = 3.59, p < 0.05. The number of practice problems for the massed learning group had no effect on academic performance. The authors concluded, “While an increase in the number of massed practice problems did not reliably affect test scores (Experiment 1), large gains in test performance were achieved by the use of spacing or mixing, even though neither of these strategies required additional practice problems” (p. 494).
Connecting New Research Information to Original CITW Findings Due to the paucity of available research that met our search criteria, interpretations of the effect for homework and practice should be made with caution. All but one of the articles included in the current analysis reported positive effects for homework, while both studies included in the current analysis reported positive effects for practice, specifically the effect of periodic testing as a form of practice. This indicates that the current literature still supports the original claim that the two strategies are effective instructional techniques. The overall effect size of the meta-analysis conducted for this study was smaller for both homework (g = 0.13) and practice (g = 0.42) than the effect reported by Marzano and colleagues. This smaller effect may be the result of more conservative methodology. The current meta-analysis used a very specific definition to operationalize the two strategies. Studies that did not fit into this definition were excluded. The smaller effect size may also be the result of the more stringent study selection criteria. Only studies with an ability to control for alternative hypotheses were included, resulting in very small sample sizes. Where appropriate the effect sizes for included articles were

67
adjusted for the nested nature of students within a classroom. This adjustment addressed issues of subject non-independence, and resulted in a smaller effect size than when this adjustment is not made. Marzano et al. (2001) did not report making this adjustment. These topics are described more fully in the Methods chapter of the full report.
Main Points and Recommendations The current meta-analyses contain a small number of studies; therefore, interpretations should be made with caution. From the available evidence a composite effect size of g = 0.13 for homework and g = 0.42 for practice was estimated. This suggests that practice, particularly in the form of test-enhanced practice, may be a stronger driver of academic performance than homework. The studies included in the meta-analysis and those in the descriptive analysis paint a complex picture of homework that suggests a small but positive relationship between the portion of homework that students complete and their achievement. However, the effect of additional factors such as the degree of parental involvement and homework quality may moderate this relationship. The majority of teachers, parents, and students believe that homework increases student achievement (Cooper, 1989; Cooper et al., 2006). Those who view homework as a positive instructional strategy have claimed that homework can promote academic achievement (Cooper, 1989), especially in the current era of standards-based reform and high-stakes accountability (Gill & Schlossman, 2003). The current evidence suggests that this relationship may be stronger as students progress through the grades and the nature of schoolwork becomes more complex. The relationship between practice and academic achievement is also somewhat mixed. Traditional conceptualizations of practice—reviewing notes, reading texts—generally prove better than no practice at all; however, their effectiveness is considerably less than techniques such as regularly testing students throughout the learning period. Unfortunately, the use of regular testing as a learning strategy is infrequent. From the studies included in the meta-analysis and supporting literature, this report concludes,
• The relationship between time spent on homework and academic achievement is stronger for secondary students than primary and intermediate students.
• The amount of time spent on homework may be less important than the perceived quality of
homework assignments and the level of student effort on those assignments.
• Using class time to check homework is not necessarily associated with higher achievement. However, providing feedback on homework is helpful.
• Although CITW (Marzano, Pickering, & Pollock, 2001) suggested that parent involvement should be kept to a minimum, the present analysis suggests that a specific type of parental support in homework may in fact be beneficial. Homework assignments that involve parent-child interaction may help to improve performance.

68
• Practice appears to be more effective when distributed over time rather than massed into a single session, and when more than one skill is practiced at a time.
• The effects of massing practice into a single session are not improved by adding additional practice problems. This technique, sometimes known as overlearning, has been proven ineffective across a wide body of literature.
• Testing is often considered a summative activity to assess the accumulation of knowledge of skills. However, evidence is quite strong that testing students at regular intervals throughout the learning period has a positive impact on learning. While the exact causes of this testing effect are unclear, the practice is well supported empirically.

69
References Bolded references are included in the research review.
Anderson, J. O., Rogers, W. T., Klinger, D. A., Ungerleider, C., Glickman, V., & Anderson, B. (2006). Student and school correlates of mathematics achievement: Models of school performance based on Pan-Canadian Student Assessment. Canadian Journal of Education, 29, 706-730.
Bailey, L. B., Silvern, S. B., Brabham, E., & Ross, M. (2004). The effects of interactive reading homework and parent involvement on children’s inference responses. Early Childhood Education Journal, 32(3), 173-178.
Balli, S.J. (1998). When mom and dad help: Student reflections on parent involvement with homework. Journal of Research and Development in Education, 31(3), 142-148.
Balli, S. J., Demo, D. H., & Wedman, J. F. (1998). Family involvement with children’s homework: An intervention in the middle grades. Family Relations, 47, 149-57.
Balli, S. J., Wedman, J. F., & Demo, D. H. (1997). Family involvement with middle-grades homework: Effects of differential prompting. Journal of Experimental Education, 66, 31-48.
Borenstein, M., Hedges, L. V., Higgins, J. P. T., & Rothstein, H. (2009). Introduction to meta-analysis. West Sussex, UK: John Wiley and Sons, Ltd.
Capizzano, J., Tout, K., & Adams, G. (2000). Child care patterns of school-age children with employed mothers. Washington, DC: Urban Institute.
Carpenter, S.K., Pashler, H., & Cepeda, J. (2009). Using tests to enhance 8th
Carpenter, S. K., Pashler, H., Wixted, J. T., & Vul, E. (2008). The effects of tests on learning and forgetting. Memory & Cognition, 36(2), 438-448.
grade students’ retention of U.S. history facts. Applied Cognitive Psychology, 23, 760-771.
Cepeda, N. J., Pashler, H., Vul, E., & Wixted, J. T., & Rohrer, D. (2006). Distributed practice in verbal recall tasks: A review and qualitative synthesis. Psychological Bulletin, 132(3), 354-380.
Cooper, H. M. (1989). Synthesis of research on homework. Educational Leadership, 47(3), 85-91. Cooper, H., Lindsay, J. J., Nye, B., & Greathouse, S. (1998). Relationships between attitudes
about homework, the amount of homework assigned and completed, and student achievement. Journal of Educational Psychology, 90, 70-83.
Cooper, H., Robinson, J. C. & Patall, E.A. (2006). Does homework improve academic achievement?: A synthesis of research, 1987-2003. Review of Educational Research, 76, 1-62.
Cosden, M. , Morrison, G., Albanese, A. L., Macias, S. (2001). When homework is not home work: After-school programs for homework assistance. Educational Psychologist, 36(3), 211-221.
Flowers, T. A. & Flowers, L. A. (2008). Factors Affecting Urban African American High School Students’ Achievement in Reading. Urban Education, 43, 154-171.
Gill B. P. & Schlossman, S. L (2003). A nation at rest: The American way of homework. Educational Evaluation and Policy Analysis, 25(3), 319-37.
Hall, K. G., Domingues, D. A., & Cavazos, R. (1994). Contextual interference effects with skilled baseball players. Perceptual and Motor Skills, 78, 835-841.
Hong, E. (2001). Homework style, homework environment, and academic achievement. Learning Environments Research, 4, 7-23.

70
Hong, E., & Lee, K. (2003). Parental awareness of their children’s homework motivation and preference and its relationship to achievement. International Journal of Adolescence and Youth, 11, 231–249.
Hong, E., Milgram, R., & Rowell, L. (2004). Homework motivation and preference: A learner-centered homework approach. Theory into Practice, 43(3), 197-204.
House, J. Daniel (2004). The effects of homework activities and teaching strategies for new mathematics topics on achievement of adolescent students in Japan: Results from the TIMSS 1999 Assessment. International Journal of Instruction Media, 31(2), 199-210.
Johnson, C. I., & Mayer, R. E. (2009). A testing effect with multimedia learning. Journal of Educational Psychology, 101(3), 621-629.
Karpicke, J. D., & Roediger, H. L., III. (2008). The effects of tests on learning and forgetting. Memory & Cognition, 36(2), 438-448.
Keith, T. Z., Diamond-Hallam, C., & Fine, J. G. (2004). Longitudinal effects of in-school and out-of-school homework on high school grades. School Psychology Quarterly, 19, 187-211.
Mahoney, J. L., Lord, H., & Carryl, E. (2005). An ecological analysis of after-school program participation and the development of academic performance and motivational attributes for disadvantaged children. Child development, 76(4), 811-825.
Marzano, R., Pickering, D., & Pollock, J. (2001). Classroom instruction that works: Research-based strategies for increasing student achievement. Alexandria, VA: Association for Supervision and Curriculum Development.
McDaniel, M. A., Roediger, H. L., III, & McDermott, K. B. (2007). Generalizing test-enhanced learning from the laboratory to the classroom. Psychonomic Bulletin & Review, 14(2), 200-206.
Minotti, J. L. (2005). Effects of learning-style-based homework prescriptions on the achievement and attitudes of middle school students. NASSP Bulletin, 89, 67-89.
Pashler, H., Bain, P., Bottge, B., Graesser, A., Koedinger, K., McDaniel, M., and Metcalfe, J. (2007). Organizing Instruction and Study to Improve Student Learning (NCER 2007-2004). Washington, DC: National Center for Education Research, Institute of Education Sciences, U.S. Department of Education. Retrieved from http://ncer.ed.gov.
Pashler, H., Rohrer, D., Cepeda, N. J., & Carpenter, S. K. (2007). Enhancing learning and retarding forgetting: Choices and consequences. Psychonomic Bulletin and Review, 14(2), 187-193.
Perkins, P. G., & Milgram, R. M. (1996). Parent involvement in homework: A double- edged sword. International Journal of Adolescence and Youth, 6, 195-203.
Roediger, H. L., III, Karpicke, J. D. (2006). Test-enhanced learning: Taking memory tests improves long-term retention. Psychological Science, 17(3), 249-255.
Rohrer, D., & Taylor, K.(2007). The shuffling of mathematics practice problems boosts learning. Instructional Science, 35, 481-498.
Rohrer, D., Taylor, K., Sholar, B. (2010). Tests enhance the transfer of learning. Journal of Experimental Psychology, 36(1), 233-239.
Trautwein, U. (2007). The homework-achievement relation reconsidered: Differentiating homework time, homework frequency, and homework effort. Learning and Instruction, 17, 372-388.

71
Wagner, P., Schober, B. & Spiel, C. (2008a). Time investment and time management: An analysis of time students spend working at home for school. Educational Research and Evaluation, 14(2), 139-153.
Wagner, P., Schober, B. & Spiel, C. (2008b). Time students spend working at home for school. Learning and Instruction, 18, 309-320.
Zimmerman, B. J. & Kitsantas, A. (2005). Homework practices and academic achievement: The mediating role of self-efficacy and perceived responsibility beliefs. Contemporary Educational Psychology, 30, 397-417.
72
Chapter 6: Nonlinguistic Representations
Background and Definitions Students make meaning from knowledge that is presented to them in multiple modes. The way in which information is presented can impact knowledge construction, with visual or nonlinguistic representations mediating how students experience classroom content (Jewitt, 2008; Kress, 1997). Presented in this chapter, are strategies that teachers can use to encourage students to create, store and manipulate nonlinguistic representations either in their minds or with concrete tools and displays. Explicitly engaging students in creating nonlinguistic representation stimulates and increases attention to and interpretation of new knowledge. The emphasis clearly is on student creation and manipulation of nonlinguistic representations rather than teacher presentation or use of nonlinguistic representations. The goal is to “produce non-linguistic representations of knowledge in the minds of students” (Marzano, Pickering, & Pollock, 2001, p. 73) and to do so by having students create graphic organizers, make physical models, generate mental pictures, draw pictures and pictographs, and engage in kinesthetic activity (physical movement associated with specific knowledge). Descriptions of some activities that can be categorized as nonlinguistic representations are given below.
• Creating Graphic Organizers: Combining words and phrases with symbols, arrows, and shapes to represent relationships in the knowledge being learned. Graphic organizers include descriptive pattern organizers, time-sequence patterns, process patterns, episode patterns, generalization patterns, and concept patterns.
• Making Physical Models/Manipulatives: Making concrete representations of the knowledge that is being learned.
• Generating Mental Pictures: Visualizing the knowledge being learned. • Drawing Pictures/Illustrations and Pictographs: Students are involved in hands-on
tasks such as drawing, painting and figure completion to create symbolic pictures to represent knowledge.
• Engaging in Kinesthetic activity: Physical movement associated with specific knowledge generating a mental image in the mind of the learner in the process.
Trudy Clemons Charles Igel
Sarah Gopalani

73
The strategy of nonlinguistic representation may be intertwined with some of the other strategies presented in this report, since non-linguistic representations are often a tool to process and represent knowledge. For example, graphic organizers can be used as a tool for both summarizing and identifying similarities and differences. Additionally, graphic organizers can be effectively used as advance organizers. Nonlinguistic representations may be most crucial in science and mathematics where symbols and models are necessary to represent mathematical statements and scientific ideas. For example, since students cannot see the arrangement of atoms in a molecule and how that arrangement changes during an interaction, diagrams and models are used to represent these phenomena (Michalchik, Rosenquist, Kozma, Kreikemeier, & Schank, 2008). In the areas of mathematics and science, students need to develop representational competence that allows them to explain concepts, using a variety of representations, in order to support a claim, solve a problem or make a prediction (Dunbar, 1997; Kozma, 2000; Kozma & Russell, 1997). The use of nonlinguistic representations is an important strategy in other subject areas as well, where students can use representations to organize information. Students show greater transfer of knowledge when they have organized information into a conceptual framework which allows them to see how the information connects in new situations (Bransford, Brown, Cocking, 1999). Students can use nonlinguistic representations to help them organize their knowledge in meaningful ways by identifying how related topics connect and finding patterns and key concepts (Lehrer & Chazen, 1998; National Council of Teachers of Mathematics (NCTM), 2000). The use of nonlinguistic representations is an important strategy to help students process, organize and retrieve information and may lead to increased learning. Marzano et al. (2001) reported an average effect size of 0.75 for the influence of the use of nonlinguistic representations on student achievement.
Methods
Literature Search Bibliographic databases in both education and psychology (e.g., Education Resources Information Center, Education: A SAGE Full Text Collection, Professional Development Collection, PsycInfo, and JSTOR) were searched using as the outcome keywords: achievement and learning, crossed with the key words: graphic and non-linguistic. Author searchers were then conducted based on citations in the included studies. Searches continued until results repeatedly contained duplicate hits.
Article Sampling In addition to the generic inclusion/exclusion criteria presented in the overall method section of the introduction chapter, studies were excluded when the intervention utilized technology that did not involve students in visualization. Utilizing the inclusion/exclusion criteria, a total of 11 quantitative studies were included as relevant to evaluating the effectiveness of Nonlinguistic Representation strategies. Each of these 11 studies is described in Table 6.1.

74
Student sample sizes for the quantitative studies ranged from N = 41 to N = 2,134, with a total sample size (including all studies) of N = 4,946. All studies used two-group designs (either experimental or quasi-experimental) except one (Suh & Moyer, 2007), which had a one-group pre-post design. Most of the included studies (64%) were conducted in the United States. All content areas were represented, with science comprising the majority (45%) followed by mathematics (36%) and English / language arts (18%). All grade levels were represented, with high school comprising the largest proportion of studies (45%) followed by elementary school (27%) and middle school (27%). All of the articles included student achievement as an outcome as identified in Table 6.1.

75
Table 6.1: Studies Included in the Nonlinguistic Representation Meta-analysis
Study Research Design Grade Level Number of
Students Content
Area Location Instructional Strategy
Outcome Measure(s)
Bos (2007) QED High 95 Math USA Texas Instruments Interactive Instructional Environment
State assessment of mathematical achievement
Boster, Meyer, Roberto, Lindsey, Smith, Inge, & Strom (2007)
RCT Middle a 3019 Math USA Video streaming Sixth and eighth grade mathematics exams
Chambers, Cheung, Madden, Slavin, & Gifford (2006)
RCT Elementary a 394 Language arts
USA Embedded multimedia
1) Dynamic Indicators of Basic Early Literacy Skills (DIBELS) 2) Woodcock Reading Mastery Test (WRMT)
Cifuentes (2004) QED Middle 88 Science USA Visualizing Test of science concepts
De Romero & Dwyer (2005)
RCT High a 449 Science Panama Visualized instruction complemented with 3 different types of rehearsal strategies
Assessment of biology
Hendricks, Trueblood, & Pasnak (2006)
RCT Elementary a 62 Math USA Patterning Diagnostic Achievement Battery (DAB)
Marbach-Ad, QED High 248 Biology Israel Illustrations and Assessment of

76
Rotbain, & Stavy (2008)
computer animations
biology
Roberts & Joiner (2007)
QED Middle 10 Science UK Concept mapping—visual learning strategy
Assessment of concept mapping and topic knowledge in human biology
Rotbain, Marbach-Ad, & Stavy (2006)
RCT High a 258 Science Israel Bead models and illustrations models
Assessment of genetics
Sildus (2006) QED High 272 Language arts
USA Video projects Assessment of vocabulary
Suh & Moyer (2007) One group pre-posttest
Elem. 36 Math USA Virtual and physical manipulatives
Assessment of algebra
a
Note: RCT – randomized controlled trial; QED – quasi-experimental design RCT with assignment at classroom level

77
Other Meta-Analyses One relevant research synthesis and one meta-analysis were identified in the recent research literature. The research synthesis (Kim, Vaughn, Wanzek, & Wei, 2004) examined the effects of graphic organizers on reading comprehension of students with learning disabilities. The meta-analysis compared the effects two types of nonlinguistic representations, dynamic (animated) and static pictures, on various learning outcomes (Hoffler & Leutner, 2007). The research synthesis by Kim et al. (2004) included 21 intervention studies, published between 1963 and 2001, that focused on the impact of graphic organizers on reading comprehension for students with learning disabilities in grades K-12. Overall the study found that the use of graphic organizers promoted greater comprehension in students with learning disabilities. The authors reported on studies using various graphic organizers, finding that the use of various organizers generally yielded large effect sizes as presented in Table 6.2. Kim et al. (2004) further examined the effects based on grade levels, study design, persons implementing the intervention, and persons generating graphic organizers. No additional differences were found based on these further analyses. Table 6.2: Range of Significant Effect Sizes Reported in Kim et al. (2004)
Moderator (Organizer) ES Range
Semantic Organizer 0.81 – 1.69
Cognitive maps with mnemonic 0.81 – 0.91
Cognitive map without mnemonic 0.96 – 5.07
Framed outline 0.80 – 1.78
Using 26 studies published between 1973 and 2003, Hoffler and Leutner (2007) reported an overall advantage for instructional animation over static pictures, with a mean weighted effect size of 0.37. Follow-up analysis revealed that certain moderator variables were present. The results suggested that in general animations had a greater impact on learning than did static pictures. Specifically, animations worked better if the topic to be learned was explicitly depicted in the animation. Also, the use of animations had greater benefits related to procedural-motor knowledge versus problem solving or declarative knowledge. These recent findings are consistent with the strong effects (ES = 0.75) reported for nonlinguistic representation by Marzano et al. (2001); however, these effects in the recent literature were either specific to a particular group of students (e.g., those with learning disabilities) or to comparing specific nonlinguistic strategies (animated vs. static pictures). The purpose of the present study is to add to the recent reviews by including research involving general education students or other subgroups of students in kindergarten through grade 12 to determine the effects of various types of nonlinguistic representations.

78
Results
Meta-Analysis of Articles in Sample As reviewed in Chapter 1, a random effects model was used to estimate a composite effect size for the 11 studies identified for the primary analysis. To maintain consistency of measurement across all studies, Hedges’ g was calculated for each study separately. Results were adjusted from studies exhibiting a mismatch between study design and analysis using a statistical adjustment where necessary. Results were then synthesized using an inverse variance weight �𝟏𝟏 𝒘𝒘𝒊𝒊� � that assigned relatively more influence to those studies containing less variance. The results from these calculations and final analysis are presented in Table 6.3. When individual studies used multiple outcomes measures within the same sample, these measures were combined into a single effect size for that study, a commonly accepted meta-analytic practice for non-independent measures (Borenstein et al., 2009). In addition to the individual effects, the relative weight and 95% confidence interval around each study are also presented.
Figure 6.1: Boxplot of initial overall effect sizes In a boxplot the “box” represents the range of the middle distribution of 50% of the scores and the “whiskers” are the extreme ends of the distribution. Any points that lie outside of the box and whiskers are considered outliers and candidates for removal from the study because they are outside of what would be considered a normal distribution for that sample. The dark line in the box indicates the median score. One of the 11 identified studies produced an outlier effect size (Figure 6.1). This study (Suh & Moyer, 2007) used a one group pre-posttest design and produced an effect size of 2.788 with a 95%
Hed
ges'
g
3.000
2.000
1.000
0.000
2.788

79
confidence interval of 1.77 to 3.80. This estimate and range are much larger than any of the other effect sizes and beyond the expected effect of a short-term intervention. For this reason, the study was removed from the calculation of an overall effect. With this exclusion, the resulting overall average effect for nonlinguistic representations based on the remaining 10 studies was 0.49 (p < 0.001) with a 95% confidence interval of 0.24 to 0.74. Individual study effect size estimates ranged from 0.09 (De Romero & Dwyer, 2006) to 0.81 (Roberts & Joiner, 2007).
Table 6.3: Individual & Composite Effect Sizes, Weights, and Confidence Intervals for Summarizing Studies
Study Effect Size (Hedges’ g)
Relative Weight
95 % Confidence Interval
Lower Upper
Bos (2007) 0.78 20.29 0.23 1.34
Boster, Meyer, Roberto, Lindsey, Smith, Inge, & Strom (2007)
0.10 7.83 -0.78 0.10
Chambers, Cheung, Madden, Slavin, & Gifford (2006)
0.30 3.96 -1.14 1.37
Cifuentes (2004) 0.32 3.38 -1.03 1.68
Hendricks, Trueblood, & Pasnak (2006)
0.16 17.82 0.04 1.22
Marbach-Ad, Rotbain, & Stavy (2008)
0.63 4.35 -0.57 1.82
Roberts & Joiner (2007) 0.81 4.46 -0.90 1.46
De Romero & Dwyer (2005) 0.09 3.90 -1.17 1.35
Rotbain, Marbach-Ad, & Stavy (2006)
0.31 4.44 -0.87 1.50
Sildus (2006) 0.47 29.59 0.01 0.93
OVERALL 0.49 n.a 0.24 0.74
A Q-value was calculated to assess heterogeneity among results from the included studies on nonlinguistic representation. The calculations yielded Q = 3.04, p = 0.96, indicating consistency among study results. This is supported by subsequent analysis of available subgroups. As reported in Table 6.4, findings among the subgroups of subject, grade, and population tested are remarkably consistent with moderate effect estimates across most categories.

80
Table 6.4: Effect Size & Confidence Intervals for Secondary Analyses of Nonlinguistic Representation Studies by Moderator
Moderator Category No. of Studies
Effect Size (Hedges’ g)
95% Confidence Interval
Lower Upper
Subject Language Arts 2 0.43 -0.00 0.86
Math 3 0.62 0.25 0.99
Science 5 0.33 -0.22 0.88
Elementary 2 0.53 0.00 1.07
Grade Middle 3 0.20 -0.43 0.83
High 5 0.55 0.23 0.86
Population
Regular Education 6 0.45 0.15 0.75
At-risk/SPED 2 0.69 0.17 1.19
Connecting New Research Information to Original CITW Findings All of the articles included in the current analysis reported positive effects for nonlinguistic representation. In Marzano et al.’s report (2001), a moderate to large effect size for nonlinguistic representations (0.75) was reported. The overall effect size for nonlinguistic representation strategies in the present meta-analysis (0.49) is somewhat smaller; nonetheless, the relevant recent research produced a positive and consistent effect size overall for the use of nonlinguistic representations for student achievement. The recent research continues to support the recommendation that teachers should encourage student use of nonlinguistic representations to enhance student learning and achievement. This smaller effect may be the result of more conservative methodology. The current meta-analysis used a very specific definition to operationalize nonlinguistic representations. Studies that did not fit into this definition were excluded. The smaller effect size may also be the result of the more stringent study selection criteria. Only studies with an ability to control for alternative hypotheses were included, resulting in relatively small sample sizes. Where appropriate the effect sizes for included articles were adjusted for the nested nature of students within a classroom. This adjustment addressed issues of subject non-independence, and resulted in a smaller effect size than when this adjustment is not made. Marzano et al. (2001) did not report making this adjustment. These topics are described more fully in Chapter 1.

81
Main Points and Recommendations The current meta-analysis involved nearly 5,000 students across multiple grades and subject areas, as well as various measures of academic achievement. A composite effect size of g = 0.49 for nonlinguistic representations indicates an average gain of approximately 19 percentile points. In other words, a perfectly average student—scoring at the 50th percentile on academic achievement measures—who had been exposed to nonlinguistic representation strategies would be expected to perform at the 69th
percentile.
Considering the conservative selection criteria and methodology used in this meta-analysis, a finding of this magnitude supports the hypothesis that nonlinguistic representations are a robust instructional strategy for improving student learning. When methodological choices regarding study selection, statistical adjustments for included studies, and analytic models were made, each favored the more conservative choice. For these reasons, the estimates provided by this work should be interpreted as the lower bound for the effect within the larger corpus of research. The articles also indicated some trends regarding the effect of these interventions on student achievement. However, it needs to be emphasized that although the treatments in these articles met the strict inclusion guidelines, they were still differences among the interventions. From the studies included in the meta-analysis and supporting literature, this report concludes:
• students exposed to nonlinguistic instructional strategies consistently performed better on academic assessments than those in control conditions
• the positive effects of nonlinguistic representations are consistent across tested subjects, grades, and student populations
• when pictures are used as nonlinguistic representations, animations appear to have an improved impact over static images
• nonlinguistic representations incorporate a broad range of effective instructional strategies that may be employed within other strategies such as note-taking and summarizing (see Chapter 3).

82
References
Bolded references are included in the research review.
Borenstein, M., Hedges, L. V., Higgins, J. P. T., & Rothstein, H. (2009). Introduction to meta-analysis. West Sussex, UK: John Wiley and Sons, Ltd.
Bos, B. (2007). The effect of the Texas Instrument interactive instructional environment on the mathematical achievement of eleventh grade low achieving students. Journal of Educational Computing Research, 37(4), 351-368.
Boster, F. J., Meyer, G. S., Roberto, A. J., Lindsey, L., Smith, R., Inge, C., & Strom, R. (2007). The impact of video streaming on mathematics performance. Communication Education, 56(2), 134-144.
Bransford, J., Brown, A., & Cocking, R. (1999). How people learn: Brain, mind, experience, and school. Washington, DC: National Academy Press.
Chambers, B., Cheung, A. C. K., Madden, N. A., Slavin, R. E., & Gifford, R. (2006). Achievement effects of embedded multimedia in a Success for All reading program. Journal of Educational Psychology, 98(1), 232-237.
Cifuentes, L., & Hsieh, Y.-C. J. (2004). Visualization for middle school students’ engagement in science learning. Journal of Computers in Mathematics and Science Teaching, 23(2), 109-137.
De Romero, L. L. P., & Dwyer, F. (2005). The effect of varied rehearsal strategies used to complement visualized instruction in facilitating achievement of different learning objectives. International Journal of Instructional Media, 32(3), 259.
Dunbar, K. (1997). How scientists really reason: Scientific reasoning in real-world laboratories. In R. Sternberg & J. Davidson (Eds.), The nature of insight (pp. 365-396). Cambridge, MA: MIT Press.
Hendricks, C., Trueblood, L., & Pasnak, R. (2006). Effects of teaching patterning to 1st-graders. Journal of Research in Childhood Education, 21(1), 79.
Hoffler, T. & Leutner, D. (2007). Instructional animation versus static pictures: A meta-analysis. Learning and Instruction, 17, 722 – 738.
Jewitt, C. (2008). Multimodality and literacy in school classrooms. Review of research in education, 32(1), 241-267.
Kim, A., Vaughn, S., Wanzek, J. & Wei, S. (2004). Graphic organizers and their effects on reading comprehension of students with learning disabilities. Journal of Learning Disabilities, 37(2), 105-118.
Kozma, R. (2000). The use of multiple representations and the social construction of understanding in chemistry. In M. Jacobson & R. Kozma (Eds.), Innovations in science and mathematics education: Advanced designs for technologies of learning (pp. 11-45). Mahwah, NJ: Erlbaum.
Kozma, R. B., & Russell, J. (1997). Multimedia and understanding: Expert and novice responses to different representations of chemical phenomena. Journal of Research in Science Teaching, 34(9), 949-968.
Kress, G. (1997). Before writing: Rethinking the paths to literacy. London: Routledge.

83
Lehrer, R., & Chazen, D. (1998). Designing learning environments for developing understanding of geometry and space. Mahwah, NJ: Erlbaum.
Marbach-Ad, G., Rotbain, Y., & Stavy, R. (2008). Using computer animation and illustration activities to improve high school students’ achievement in molecular genetics. Journal of Research in Science Teaching, 45(3), 273-292.
Marzano, R., Pickering, D., & Pollock, J. (2001). Classroom instruction that works: Research-based strategies for increasing student achievement. Alexandria, VA: Association for Supervision and Curriculum Development.
Michalchik, V., Rosenquist, A., Kozma, R., Kreikemeier, P., & Schank, P. (2008). Representational competence and chemical understanding in the high school chemistry classroom. In J. K. Gilbert, M. Reiner, & M. Nakhleh (Eds.), Theory and practice in science education (pp. 233-282). New York: Springer.
National Council of Teachers of Mathematics. (2000). Principles and standards for school mathematics. Reston, VA: Author.
Roberts, V., & Joiner, R. (2007). Investigating the efficacy of concept mapping with pupils with autistic spectrum disorder. British Journal of Special Education, 34(3), 127-135.
Rotbain, Y., Marbach-Ad, G., & Stavy, R. (2006). Effect of bead and illustrations models on high school students’ achievement in molecular genetics. Journal of Research in Science Teaching, 43(5), 500-529.
Sildus, T. I. (2006). The effect of a student video project on vocabulary retention of first-year secondary school German students. Foreign Language Annals, 39(1), 54-70.
Suh, J., & Moyer, P. S. (2007). Developing students’ representational fluency using virtual and physical algebra balances. Journal of Computers in Mathematics and Science Teaching, 26(2), 155-173.

84
Chapter 7: Cooperative Learning
Background and Definitions Cooperative learning is a group-based instructional strategy in which students work together under a particular set of conditions. Generally speaking, these conditions are established to assuage the negative aspects of group behavior while maintaining the benefits. Because of these required elements, cooperative learning can be viewed as a subset group-based learning (also referred to as collaborative learning). Cooperative learning is one of the most the theoretically grounded instructional strategies (Johnson & Johnson, 2009). Cooperative learning is the operationalization of Social Interdependence Theory (SIT) as an instructional tool. SIT is a Social Constructivist theory that posits learning can be maximized through well-designed, intentional social interaction with other learners (Gerlach, 1994; Vygotsky, 1978). Despite its rich theoretical background, cooperative learning is frequently misunderstood and misused (Antil, Jenking, Wayne, & Vadasy, 1998; Koutselini, 2009). Teachers often believe that putting students into groups constitutes cooperative learning when, in fact, they are using collaborative learning. This confusion has even spread into scholarly work. Many prior meta-analyses made no effort to differentiate between cooperative and collaborative interventions. The present study corrects this through careful review of the elements required for cooperative learning, and the application of those elements to inform study selection. Numerous versions of cooperative learning have been developed over the years. Among them are: the Jigsaw technique (Aronson, Stephan, Stikes, Blaney, & Snapp, 1978); Jigsaw II (Slavin, 1983); Student Teams Achievement Divisions (STAD) (Slavin, 1978); Student Team Learning (Slavin, 1990); Teams-games Tournaments (DeVries & Edwards, 1973); Group Investigation (Sharan & Sharan, 1992); Cooperative Structures (Kagan, 1985); Numbered Heads Together (Kagan, 1989-1990); Learning Together (Johnson & Johnson, 1999); Cognitive Engagement in Cooperative Learning (CECL) (Howard, 1996), and Complex Instruction (Cohen, 1994). In addition to these specific versions, some teachers practice generic versions of cooperative learning that contain combined elements of these aforementioned approaches.
Charles Igel

85
As cooperative learning has evolved, these different versions have incorporated both shared and unique features. Two features that are shared by all major versions of cooperative learning are: 1) positive interdependence, and 2) individual accountability (e.g., Aronson et al., 1978; DeVries & Edwards, 1973; Earley, 1989; Johnson & Johnson, 1974; Kagan, 1989-1990; Sharan, 1980; Slavin, 1977). Interdependence occurs when the outcomes of any individual are reciprocally intertwined with the outcomes of other individuals, a relationship that can be cooperative or competitive. Positive interdependence describes a cooperative goal structure wherein success on the part of one promotes success among others within the group (Kagan, 1989-1990; Lew, Mesch, Johnson, & Johnson, 1986; Slavin, 1983). Positive interdependence is the sine qua non of any cooperative learning strategy. The requirement of positive interdependence has implications across a various aspects of the lesson. Primarily, it implies a goal structure that encourages cooperation among group members. Additionally, positive interdependence requires that lessons be structured to equitably distribute resources across members. To achieve interdependence, the means to carry out tasks cannot be consolidated within an individual or individuals; all members must have resources to actively contribute. Finally, interdependence necessitates the assignment of roles and boundaries so the contributions members make are non-redundant. The second shared feature, individual accountability, establishes that to receive individual credit for the group’s efforts, that person must contribute to achievement of the goal (Johnson & Johnson, 1974; Kagan, 1989-1990; Slavin, 1983). This focus on individual effort may initially seem contradictory to the notion of a promotive goal structure, but is critical for addressing the concern that a few individuals may carry out the work while remaining group members coast on their efforts—a deleterious situation for both the worker and the loafer (Earley, 1989). Individual accountability can be promoted by formally and informally assessing group members separately (Johnson, Johnson, & Holubec, 1994). This may take the form of a traditional end-of-unit test, mini quiz, or a quick orally fact-check that requires an individually generated response without assistance from other members (Kagan, 1989-1990). The requirement for individual accountability also has implications across aspects of the lesson, particularly the notion of group size. As the size of a group increases, both extrinsic and intrinsic motivators decline. Externally, group social pressures that promote individual performance decrease as individual efforts become more difficult for members to identify (Earley, 1989; Kerr & Bruun, 1981; Latane, Williams, & Harkins, 1979). Put plainly, any one member can easily become lost in the crowd. Intrinsically, the ability of individuals to realize the unique effect of their individual performance diminishes (Harkins & Petty, 1982). Individuals may come to believe their contribution adds little value, and may not see a link between their efforts and the group’s goal (McWhaw, Schnackenberg, Sclater, & Abrami, 2003; Sheppard & Taylor, 1999). There is surprisingly little research on the ideal size for cooperative groups; however, most versions of cooperative learning recommend three to five member groups to achieve the proper balance between individual effort and interpersonal interaction. In addition to these two shared features, the model developed by Johnson and Johnson (1974) includes three additional features: 3) promotive interaction, 4) direct instruction in group learning skills, and 5) ongoing group processing. To achieve promotive interaction, group members actively engage with and encourage others in their group. This does not suggest a simplistic cheering session; rather, members are required to actively engage in dialogue as a means for questioning others’ ideas.

86
Through this process, cognitive conflicts are brought to the surface and untenable schema re-formed. This iterative process of cognitive disequilibrium as a means for developing a robust knowledge base is a standard of Piagetian-influenced learning theory and remains active in contemporary educational thought (Piaget, 1932). Effective promotive interactions often do not occur naturally and must be taught. Because of this, the expanded cooperative learning model also requires explicit instruction in group learning skills. Albert Bandura (1986) laid the early foundation for this need within cooperative structures.
Group problems require group solutions. The basic components of collective problem solving are similar to those operating at the individual level. However, collective determination of priorities, selection of action strategies, and implementation of solutions entail additional processes peculiar to group functioning (p. 465).
The expanded cooperative learning model operationalizes Bandura’s position through the inclusion of specific training in group skills such as collective development of an action plan, distribution of roles and responsibilities, and methods for providing effective peer feedback (Johnson et al., 1994). Table 7.1: Elements of Cooperative Learning Models
Feature Purpose Instructional Implication Model
1) Positive Interdependence
Ensure that success on the part of one promotes success among others within the group
Establish a cooperative goal structure & equally distribute resources
Jigsaw I & II STAD Student Teams learning Group Investigation Cooperative Structures Heads Together Complex Instruction Learning Together
2) Individual Accountability
Ensure that all members contribute to achievement of the goal
Establish optimal group size & include individual assessments
Jigsaw I & II STAD Student Teams learning Group Investigation Cooperative Structures Heads Together Complex Instruction Learning Together
3) Promotive Interaction
Uncover cognitive disequilibrium for the
Encourage discussion among group members
Learning Together

87
development of robust & tenable schema
4) Instruction in Group Skills
Ensure that all members understand effective group skills
Provide initial and ongoing instruction on effective group skills
Learning Together
5) Group Processing
Promote group and individual metacognition for maintenance of group efficacy
Establish dedicated time for group reflection
Learning Together Complex Instruction
The final feature of the expanded cooperative learning model is group processing. Broadly speaking, group processing is group-level metacognition. When incorporated into a cooperative learning model, time is set aside for members to collectively take stock of how effectively the group is performing. Group processing may enhance efficacy through metacognitive feedback at the individual, group, and class level (Johnson et al., 1994). This feedback can be provided by peers, the teacher, or the individual student through self-reflection. A fundamental goal of group processing is the enhancement of collective agency, a groups identity, goal, and ability to move toward those goals (Bandura, 2000), and is accomplished through continual refinement of the collaborative process (Lew et al., 1986). From this perspective, effective long-term cooperative instruction will set aside time for groups to critique and refine their collaborative processes. Group learning structures lacking certain elements can actually impede instruction (Guerin, 1999; Ingham, Levinger, Graves, & Peckham, 1974; Latane et al., 1979). There is disagreement among cooperative learning researchers over the necessity of all five articulated features but there is general agreement regarding the first two—positive interdependence and individual accountability. For purposes of this report, properly structured group instruction refers to that which includes, at a minimum, the elements of positive interdependence and individual accountability. Research on group efficacy suggests that group activities lacking these elements frequently suffer in effectiveness due to a breakdown in social cohesion and trust. A common example is social loafing, sometimes referred to as the Ringelmann effect (Latane et al., 1979). In the 1920’s German psychologist Maximilian Ringelmann conducted a simple experiment on group effectiveness. Participants were asked to pull on a rope as hard as possible; the force of their individual effort was measured and the rope pull exercise repeated in groups of two, four, and eight members. The anticipated outcome was a linear or upward curvilinear increase as more members were added to the group; however, the results were quite different. The addition of more members to the group increased the difference between expected and actual force (negatively) with groups pulling at 93%, 85%, and 49% of individual total efforts respectively. In other words, participants did not pull their fair share within a group, a phenomena that increased with the size of the group. Instead of synergy, Ringelmann found loafing. Later extensions of Ringelmann’s study found similar results (Ingham et al., 1974). Informed by research such as this, developers have sought structural elements that assuage the negative aspects of group learning while retaining the positive. The presence of these elements distinguished cooperative from collaborative learning.

88
Together, these elements are believed to create learning experiences that foster a cycle of strengthened relationships, engagement, and ultimately achievement. Cooperative goal structures (i.e., positive interdependence) afford students opportunities to work together toward a shared goal. Over time, students build relationships from the shared experiences gained while working together (Hinde, 1976). Students begin to feel a sense of belonging with their group, which in turn leads to greater engagement and achievement (Roseth, Johnson, & Johnson, 2008). By allowing opportunity for learners to interact in pursuit of shared goals, cooperative learning structures can improve emotional factors such as engagement with the learning process, motivation, self-esteem, attitudes toward school, and development of resistance to social isolation (Johnson, 1981; Johnson & Johnson, 2003; Johnson & Johnson, 2005; Morgan, Whorton, & Gunsalus, 2000). A meta-analysis of goal structures by Johnson and Johnson (1989) found that positive interactions occur more often in cooperative rather than competitive or individualistic learning conditions. Over time, positive interactions foster social attachments which can lead to improved engagement with school and motivation to achieve academically (Farmer, Vispoel, & Maehr, 1991). Estimates suggest that positive peer relations explain approximately thirty-three percent of variation seen in academic achievement (Johnson & Johnson, 2008; Roseth, Johnson, & Johnson, 2008).
Methods
Literature Search The previously described background guided the identification of search terms for location of primary studies into the meta-analysis. The following article databases were searched: Education Resource Information Center (ERIC), Education Full Text, PsychInfo, JSTOR, and Education Research Complete using keywords: group learning, collaborative learning, cooperative learning, collaboration, cooperation, Jigsaw, Jigsaw II, Student Teams Achievement Divisions (STAD), Teams-games Tournaments, Group Investigation, Heads Together, and Learning Together.
Article Sampling Only primary studies that tested properly specified cooperative interventions demonstrating 1) positive interdependence and 2) individual accountability were included. Each study that passed preliminary screening (N = 80) was screened again to ensure these two minimum elements were present. A study could meet these criteria by a) testing an established version of cooperative instruction that contained those features, or b) testing a generic version of cooperative instruction while specifying the two features in the description of the intervention. Primary studies that tested interventions containing additional features such as instruction in small-group skills were also included if those features did not inseparably conflate the cooperative intervention with an additional intervention. Because so many versions of cooperative learning exist, the purpose of the present meta-analysis was to test the effect of the two required elements (the minimum structural threshold between cooperative and collaborative learning), rather than the effect of one particular version by itself. Of the 80 studies that passed preliminary screening, only twenty were selected for inclusion in the meta-analysis. Sixty were excluded in the second round of screening. Of these, 18 were excluded because they did not contain the necessary features of cooperative instruction, five were excluded

89
because they conflated multiple interventions, 22 failed to report necessary statistics for calculation of an effect size, seven did not show evidence that the treatment facilitator was familiar with cooperative instruction, and eight contained unacceptable measurement issues such as the use of affective (rather than academic) dependent variables or failure to report basic psychometric properties of the assessment instrument. A summary of the selected articles (N = 20) is provided in Table 7.2.

90
Table 7.2: Studies Included in the Cooperative Learning Meta-analysis
Study Research Design
Grade Level
Sample Size Locale
Content Area
Tested
Instructional Strategy Tested Outcome Measurea
Acar & Tarhan (2008) RCT High 57 Turkey Science Cooperative learning (general)
1) Metallic bonding concept test
Akinoglu & Tandogan (2007)
QED Middle 50 Turkey Science PBL 1) Science test
Almaguer (2005) QED Elementary 80 South Texas “colonias”
Language Arts
Dyad reading groups 1) Reading comprehension test 2) Reading fluency test
Araz & Sungur (2007) RCT Middle 217 Turkey Science PBL 1) Genetics test
Bilgin & Geban (2006) RCT High 87 Turkey Science CLA 1) Chemical equilibrium (conceptual) test 2) Chemical equilibrium (content) test
Calhoon (2005) RCT Middle 38 Southwest USA
Language arts
PALS 1) WJ-3 letter/word identification 2) WJ-3 passage comprehension 3) WJ-3 word attack 4) WJ-3 reading fluency
Del Favero, Boscolo, Vidotto & Vicentini (2007)
QED Middle 100 Italy Social studies
Cooperative learning (general)
1) WW I content knowledge test 2) Italy’s economy

91
content knowledge test
Ghaith & Yaghi (1998) RCT Elementary 318 Lebanon Language arts
STAD 1) Language arts test
Gillies & Ashman (2000)
RCT Elementary 22 Australia Language arts
Cooperative learning (general)
1) Comp. test 2) Word reading test
Hanze & Berger (2007)
RCT High 137 Germany Science Jigsaw 1) Physics test
Harskamp & Ding (2006)
RCT High 99 Shanghai Science Cooperative learning (general)
1) Physics exam
Kramarski & Mevarech (2003)
RCT Middle 384 Israel Math Cooperative learning (general)
1) Graph interpretation test 2) Graph construction test
Ozsoy & Yildiz (2004) QED Middle 70 Turkey Math Learning Together 1) Math exam
Shaaban (2006) RCT Elementary 22 Lebanon Language arts
Jigsaw II 1) Gates-McGinitie reading test (vocabulary)
Shachar & Fischer (2004)
QED High 168 Israel Science Group investigation (GI) – low, middle, high achievers
1) Chemistry exam
Souvignier & Kronenberger (2007)
RCT Elementary 137 Germany Math Jigsaw 1) Geometry test 2) Symmetry test 3) Topology test 4) Astronomy test
Stamovlasis, Dimos, Tsaparlis (2006)
RCT High 64 Greece Science Cooperative learning (general)
1) Physics test
Tarhan & Acar (2007) RCT High 40 Turkey Science PBL 1) Science exam
Tarim & Akdeniz QED Elementary 248 Turkey Math STAD 1) Math exam

92
a All outcome measures were based on academic achievement b
Note: RCT – randomized controlled trial; QED – quasi-experimental design; PBL – problem-based learning; STAD – student teams achievement division; CLA – cooperative learning approach; PALS – Peer assisted learning
Randomization at individual level
(2008)
Weiss, Kramarski & Talis (2006)
RCT b
Elementary 74 Israel Math Cooperative learning (general)
1) Math skills test

93
Publication years for the selected studies range from 1998 to 2007, with the majority of studies published during the latter half of that time period. Only two studies were conducted within the U.S., while 18 were conducted internationally. Within this international group, Turkey and Israel were well represented with seven and three studies respectively from different authors. Despite the allowance for a variety of study designs, all included studies used an experimental or quasi-experimental design. Grade ranges across the sample were well represented with eight elementary, four middle school, and eight high school studies. All subject areas are represented, with nine science, five mathematics, five language arts, and one social studies study. The majority of studies (17) used researcher- or teacher-developed assessments of individual student learning, while three used established measures such as the Woodcock-Johnson Word Attack or the Gates-McGinitie Reading Test for Vocabulary. All included studies that used study-specific assessment were required to demonstrate minimum psychometric testing of their instrument(s). Typically, this was in the form of reliability coefficient such as the KR-20, test-retest correlations, or Cronbach’s alpha. No lower bound was established for the reported reliability coefficients. The logic behind this decision was that the meta-analytic model accounts for the variance within a study that may arise from an unreliable instrument. That said, no included studies reported reliability coefficients below 0.75. A variety of established cooperative interventions were tested, including Learning Together, Cooperative Learning Approach (CLA), Jigsaw I, and Jigsaw II. However, the majority of studies tested generic cooperative interventions. Sample sizes across studies range from N = 22 to N = 384. The majority of studies (18) report dosage for the intervention. Among those studies that report dosage, the times range from 1.75 hours to 80 hours.
Other Meta-Analyses One purpose of the current meta-analysis is to determine if studies published since completion of the research for Classroom Instruction That Works (Marzano, Pickering, & Pollack, 2001) support the original findings that students instructed under cooperative learning techniques performed better than those under control conditions on measures of academic achievement. Marzano and colleagues reported a composite effect size of 0.73 for cooperative learning. Several additional meta-analyses have been published during the review period. Each dealt with a specialized population or content area. Kunsch, Jitendra and Sood (2007) analyzed 17 studies on the effects of cooperative learning—described by the authors as “peer mediated learning”—on mathematics achievement among students with learning disabilities and those at risk for mathematics disabilities. Of this number, 82% of included studies involved elementary students, 18% involved high school students, and a single study involved middle school students. The overall effect size across studies was 0.47 with a range of -0.02 to 1.77. Secondary analysis revealed that students already identified with a mathematics learning disability demonstrated less benefit from cooperative learning instruction than those simply at-risk for a disability, with effect sizes of 0.21 and 0.66 respectively. Larger effects were also found among elementary (0.57) over secondary (0.18) students and general education classrooms (0.56) over self-contained resource classrooms (0.32). A meta-analysis by Ryan, Reid and Epstein (2004) analyzed 14 studies of students with emotional and behavioral disorders (EBD). Here again, the primary selection criteria was that the research must focus on “peer mediated” instructional strategies, and included all content areas. Thirty-six

94
percent of the studies were conducted on students from 6 to 12 years of age, and 64% were conducted on students over the age of twelve. The overall effect size across studies was large (1.88); effect sizes were not reported individually for each study; therefore, an individual study range was not available. Secondary analysis revealed a wide range of effects across content areas: history (3.00), math (2.08), science (1.15), and reading (0.81). However, the authors cautioned that the effects for history and science were based on single studies. Larger effects were also found among high school (2.55) over elementary and middle school (0.83) students. The final paper was considerably broader in instructional scope. Schroeder, Scott, Tolson, Huang and Lee (2007) synthesized 61 studies that examined effects from a range of teaching strategies with the criteria that the research took place in the United States and focused on science achievement as the outcome. Of the studies, only three dealt with cooperative learning strategies. From these the authors reported an effect size of 0.95. Each of these meta-analyses provided an important contribution to the field; however, their scope was limited due to the focus on specific populations, geographic locations and content areas. For the subgroups of students and content areas described above, cooperative learning techniques were found to be effective at improving academic achievement.
Other Methodological Notes Beyond containing the elements of positive interdependence and individual accountability, additional content criteria were used to screen potential studies. A solid understanding of cooperative learning is essential before it can be implemented with fidelity. For a study to be included, evidence that the facilitator had experience with cooperative instruction or was adequately trained in the intervention was required. Some studies reported this explicitly while others were more ambiguous in their description, and there was considerable variation in the extent and manner in which this was reported. To maintain consistency throughout the selection process, studies that were unclear on this matter were excluded. An equally important criterion was the counterfactual learning condition against which the cooperative condition was tested. To determine the effect properly specified cooperative instruction had on student learning, an alternative learning condition that was not a version of cooperative learning must have been used as a control condition. Studies that tested one properly specified version of cooperative learning against another (e.g., Learning Together vs. STAD) or those in which conditions differed only in dosage were excluded from the primary analysis that calculated the overall effect. The final content criterion in the secondary screening process required individual testing on achievement measures. A critical feature of the cooperative model is individual accountability. While individual accountability ensures that all participants contribute to the group’s effort, knowing that one will be tested without aid from other members also provides an external learning incentive. To maintain fidelity to the cooperative model, studies were required to individually test study participants. Beyond the required criteria, relevant covariates from the studies were coded for use in secondary analysis of moderators/mediators. These variables were not reported across all included studies, but were coded and included in this meta-analysis whenever available.

95
Results
Meta-Analysis of Articles in Sample As reviewed in Chapter 1, a random effects model was used to estimate a composite effect size for the twenty studies identified for the primary analysis. To maintain consistency of measurement across all studies, Hedges’ g was calculated (or identified) for each study separately. Results were adjusted from studies exhibiting a mismatch between study design and analysis using a statistical adjustment where necessary. Results were then synthesized using an inverse variance weight �𝟏𝟏 𝒘𝒘𝒊𝒊� � that assigned relatively more influence to those studies containing less variance. The results from these calculations and final analysis are presented in Table 7.3. When individual studies presented multiple outcomes measures within the same sample, these measures were combined into a single effect size for that study, a commonly accepted meta-analytic practice for non-independent measures (Borenstein, Hedges, Higgins, & Rothstein, 2009). This combined effect was used with eight of the twenty primary studies; these are indicated with a darkened circle. When a study presented multiple outcome measures with different, independent samples, these measures are reported separately. This was the case with only one of the included studies and is noted by sub-setting the study’s name (e.g., Shachar & Fischer, 2004). In addition to the individual effects, the relative weight and 95% confidence interval around each study is also presented. The following paragraphs present the overall effect size that was calculated from the twenty studies followed by subsequent analyses by length of the intervention (dosage), categorical grade level (elementary, middle, or high school), and subject (language arts, science, mathematics, or history/social studies).
Results from the Primary Analysis for the Calculation of an Overall Effect Size The overall effect size across all twenty studies was g = 0.44, with a 95% confidence interval between the range of 0.22 and 0.66 and was statistically different than the null effect (p < .001). Effect sizes from individual studies ranged from a low of -0.08 to a high of 2.45. Weights assigned to each study are a function of variance—those with smaller variance receive relatively more weight as indicated by a larger number, while those with larger variance receive relatively less weight as indicated by a smaller number. The study receiving the largest overall influence was Stamovlasis, Dimos and Tsaparlis (2006) which yielded an effect size of 0.52. The study receiving the smallest overall influence was Acar and Tarhan (2008) which yielded an effect size of 2.45. It is important to note that these numbers are relative and only interpretable in relation to others within the same meta-analysis. Scrutiny of the studies at the extreme upper end of the effect range reveals that they received relatively low weighting.

96
Table 7.3: Individual & Composite Effect Sizes, Weights, and Confidence Intervals for Included Studies
Study Effect Size (Hedges’ g)
Relative Weight
95 % Confidence Interval
Lower Upper
Acar & Tarhan (2008) 2.45 2.15 1.06 3.83
Akinoglu & Tandogan (2007) 0.56 2.28 -0.78 1.90
Almaguer (2005) 0.41 a 2.39 -0.90 1.71
Araz & Sungur (2007) 0.14 2.47 -1.14 1.42
Bilgin & Geban (2006) a 1.92 2.33 0.60 3.25
Calhoon (2005) a 0.66 2.18 -0.71 2.04
Del Favero, Boscolo, Vidotto & Vicentini (2007) a
0.04
6.01 -0.67 0.75
Ghaith & Yaghi (1998) 0.06 8.23 -0.48 0.61
Gillies & Ashman (2000) a 0.68 4.50 -0.20 1.56
Hanze & Berger (2007) 0.00 12.02 -0.34 0.34
Harskamp & Ding (2006) 0.61 5.92 -0.11 1.33
Kramarski & Mevarech (2003) a 0.03 2.51 -1.24 1.29
Ozsoy & Yildiz (2004) 0.56 2.36 -0.75 1.87
Shaaban (2006) a 0.21 2.25 -1.14 1.56
Shachar & Fischer (2004) – high 0.27 2.28 -1.07 1.61
Shachar & Fischer (2004) – low 1.17 2.16 -0.21 2.55
Shachar & Fischer (2004) – middle 0.86 2.30 -0.47 2.20
Souvignier & Kronenberger (2007) a -0.08 5.36 -0.85 0.70
Stamovlasis, Dimos & Tsaparlis (2006)
0.52 13.58 0.26 0.78
Tarhan & Acar (2007) 2.06 2.06 0.64 3.48
Tarim & Akdeniz (2007) 0.39 4.75 -0.46 1.23
Weiss, Kramarski & Talis (2006) 0.26 9.84 -0.19 0.71
Composite Effect (N=20) 0.44 n/a b 0.22 0.66 a
Composite effect size from multiple, non-independent outcomes

97
Results from the Analysis of Moderating Variables
A Q-value was calculated to assess heterogeneity among results from the included studies. The calculations yielded Q = 32.27, p = 0.055, a borderline level of significance by standard interpretations. A decision was made to continue with subsequent analyses for substantive reasons, principally the original hypothesis that the effect of cooperative interventions would vary across dosage, content, and grade level. Meta-analysis is predicated on having enough studies within a category to synthesize in a meaningful way. To facilitate this, the dosage moderator was divided into four categories based on the reported length of the intervention. The interventions in six studies ranged in length from 1-10 hours, the first dosage category. The overall effect for this dosage was 0.39 with a 95% confidence interval of -0.01 to 0.76. Five studies contained interventions lasting from 11-20 hours. This second dosage category produced an overall effect of 0.65 with a confidence interval of 0.13 to 1.18. The next category tested cooperative interventions lasting from 21-50 hours. The four studies in this category produced an overall effect estimate of 0.41 with a confidence interval of 0.05 to 0.78. The final dosage category synthesized two studies that tested interventions ranging in length from 51-80 hours. These produced an effect estimate of 0.43 with a rather wide confidence interval from -0.55 to 1.40. Four comparisons were made by subject; these were language arts, science, mathematics, and history/social studies. Five studies tested the effect of cooperative instruction on academic achievement in language arts. The overall effect for language arts was 0.28 with a rather wide 95% confidence interval of -0.11 to 0.68. The impact of cooperative instruction on science achievement was tested by ten studies which yielded an effect of 0.66 with a confidence interval of 0.28 to 1.05. Five studies tested the effects on mathematics achievement, yielding an effect size of 0.23 with a confidence interval from -0.10 to 0.55. A single study tested the impact of cooperative instruction on social studies/history achievement at 0.04 with a wide confidence interval of -0.67 to 0.75. Because the social studies/history estimate is the result of a single study, it should be interpreted with caution. Three comparisons were made by grade; these were elementary, middle, and high schools. Seven studies tested the effect of cooperative instruction on elementary samples. The overall effect for elementary students was 0.23 with a 95% confidence interval from -0.04 to 0.50. Six studies tested middle school samples. These yielded an overall effect of 0.24 with a confidence interval of -0.21 to 0.69. The effect of cooperative learning on a high school population was tested among seven studies. The overall effect was the highest among the grade comparisons at 0.85 with a confidence interval of 0.36 to 1.32.

98
Table 7.4: Effect Size & Confidence Intervals for Secondary Analyses by Moderator
Moderator Category No. of Studies
Effect Size (Hedges’ g)
95% Confidence Interval
Lower Upper
Dosage 1-10 Hours a 6 0.39 -0.01 0.76
11-20 Hours 5 0.65 0.13 1.18
21-50 Hours 4 0.41 0.05 0.78
51-80 Hours 2 0.43 -0.55 1.40
Subject Language Arts b 5 0.28 -0.11 0.68
Science 10 0.66 0.28 1.05
Mathematics 5 0.23 -0.10 0.55
History/S. Studies 1 0.04 -0.67 0.75
Grade Elementary 7 0.23 -0.04 0.50
Middle 6 0.24 -0.21 0.69
High 7 0.85 0.36 1.32 a Includes only those studies that reported the length of the intervention b
Number of studies > 20 because some studies tested across multiple subjects
Analysis for Publication Bias
One criticism of the meta-analysis is that of publication bias. Put simply, the concern is that results from a meta-analysis, or any research synthesis for that matter, will suffer an upward bias because the publication outlets from which the meta-analyst draws have a propensity toward publishing studies that show positive results (Hunter & Schmidt, 1990). As reported, the present meta-analysis estimated an overall effect as g = 0.44 for properly specified cooperative interventions. Orwin’s Fail-safe N was calculated to determine the number of unidentified studies with small effects necessary to bring this estimate to a trivial level. The criterion for this trivial level was set at 0.20. This is generally considered a threshold between small and moderate effects among educational interventions and corresponds to a percentile gain of only eight percentile points—not exactly substantively unimportant, but somewhat low. The mean effect for these hypothetical missing studies was set at 0.10. This figure is at the lower quartile of the identified studies and represents a small effect. Using these criteria, Orwin’s Fail-safe N was calculated to be 39. In other words, it would take 39 studies with an effect at 0.10 to bring the overall estimated effect of the present meta-analysis to 0.20. This is nearly twice the number of identified studies and provides reasonable assurance that the present estimated effect (0.44) is robust to publication bias.

99
Connecting New Research Information to Original CITW Findings All but one of the articles included in the current analysis reported positive effects. This indicates that the current literature still supports the original claim that cooperative learning is an effective instructional technique. Marzano et al. (2001) reported an overall effect size of 0.73. The overall effect size of the meta-analysis conducted for this study is smaller (Hedges’ g = 0.44 for random effects) than the one reported by Marzano and colleagues, but is still an overall positive effect. This smaller effect may be the result of more conservative methodology. The current meta-analysis used a very specific definition to operationalize cooperative learning. Studies that did not fit into this definition were excluded. The smaller effect size may also be the result of the more stringent study selection criteria. Only studies with an ability to control for alternative hypotheses were included. Where appropriate the effect sizes for included articles were adjusted for the nested nature of students within a classroom. This adjustment addressed issues of subject non-independence, and resulted in a smaller effect size than when this adjustment is not made. Marzano et al. (2001) did not report making this adjustment. These topics are described more fully in Chapter 1.
Main Points and Recommendations The present meta-analysis involved over 2,000 students across multiple grades and subject areas, as well as various measures of academic achievement (the majority of which were in science and mathematics). A composite effect size of 0.44 indicates an average gain of approximately 17 percentile points. In other words, a perfectly average student—scoring at the 50th percentile on academic achievement measures—who receives instruction through a cooperative learning strategy, would be expected to perform at the 67th
Considering the conservative selection criteria and methodology used in this meta-analysis, a finding of this magnitude supports the hypothesis that cooperative learning is a robust instructional strategy in terms of improving student learning. When methodological choices regarding study selection, statistical adjustments for included studies, and analytic models were made, each favored the more conservative choice. For these reasons, the estimates provided by this work should be interpreted as the lower bound for the effect of cooperative instruction within the larger corpus of research.
percentile.
The articles also indicated some trends regarding the effect of these interventions on student achievement. However, it needs to be emphasized that although the treatments in these articles met the strict inclusion guidelines and were versions of cooperative learning, they were still different interventions. From the studies included in this meta-analysis and supporting literature, this report concludes:
• students in well-specified cooperative conditions consistently performed better on academic assessments than those in individual conditions
• to be effective, cooperative instruction must contain (at a minimum) the elements of o positive interdependence o individual accountability
• in addition to these elements, cooperative lessons may be enhanced through specific instruction in small-group skills
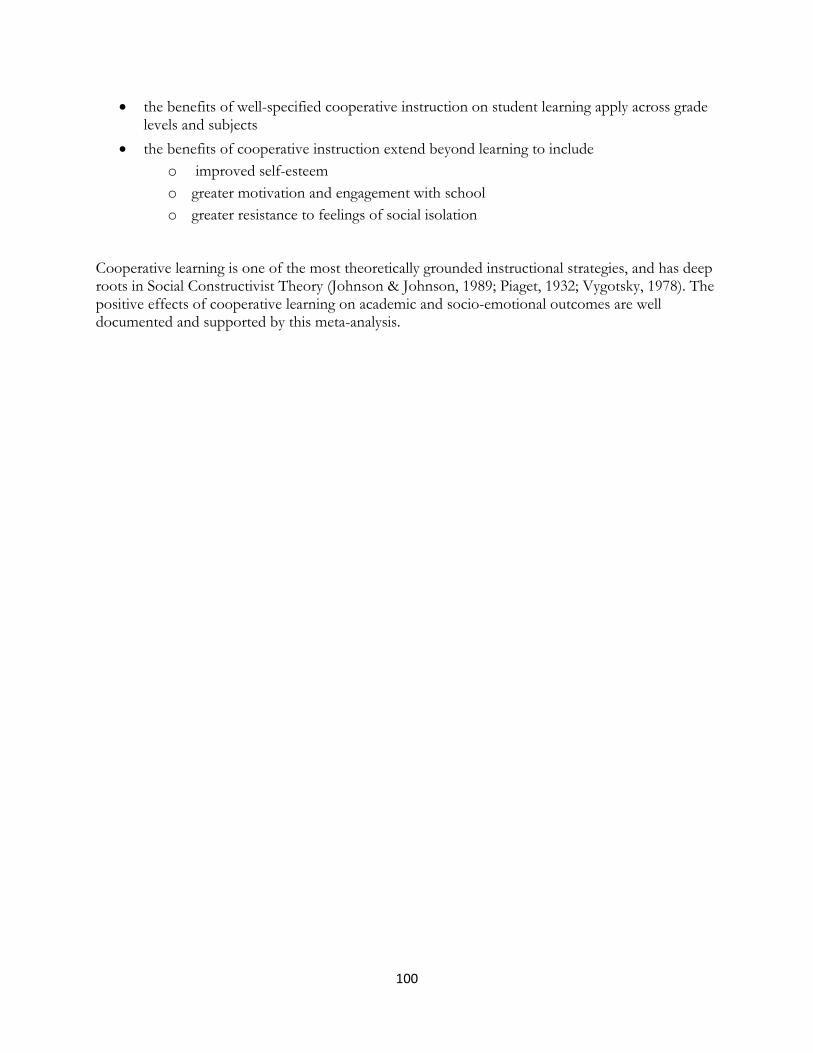
100
• the benefits of well-specified cooperative instruction on student learning apply across grade levels and subjects
• the benefits of cooperative instruction extend beyond learning to include o improved self-esteem o greater motivation and engagement with school o greater resistance to feelings of social isolation
Cooperative learning is one of the most theoretically grounded instructional strategies, and has deep roots in Social Constructivist Theory (Johnson & Johnson, 1989; Piaget, 1932; Vygotsky, 1978). The positive effects of cooperative learning on academic and socio-emotional outcomes are well documented and supported by this meta-analysis.

101
References Bolded references are included in the research review.
Acar, B., & Tarhan, L. (2008). Effects of cooperative learning on students’ understanding of metallic bonding. Research in Science Education, 38(4), 401-420.
Akinoglu, O., & Tandogan, R. O. (2007). The effects of problem-based active learning in science education on students’ academic achievement, attitude and concept learning. Eurasia Journal of Mathematics, 3(1), 71-81.
Almaguer, I. (2005). Effects of dyad reading instruction on the reading achievement of Hispanic third-grade English Language Learners. Bilingual Research Journal, 29(3), 509-727.
Antil, L. R., Jenking, J. R., Wayne, S. K., & Vadasy, P. F. (1998). Cooperative learning: Prevalence, conceptualizations, and the relation between research and practice. American Educational Research Journal, 35(3), 419 - 454.
Araz, G., & Sungur, S. (2007). Effectiveness of problem-based learning on academic performance in genetics. Biochemistry and Molecular Biology Education, 35(6), 448-451.
Aronson, E., Stephan, C., Stikes, J., Blaney, N., & Snapp, M. (1978). The jigsaw classroom. Beverly Hills, CA: Sage Publications.
Bandura, A. (1986). Social foundations of thought and action: A social cognitive theory. Englewood Cliffs, NJ: Prentice-Hall, Inc.
Bandura, A. (2000). Exercise of human agency through collective efficacy. Current Directions in Psychological Science, 9(3), 75-78.
Bilgin, I., & Geban, O. (2006). The effect of cooperative learning approach based on conceptual change condition on students' understanding of chemical equilibrium concepts. Journal of Science Education and Technology, 15(1), 31-46.
Borenstein, M., Hedges, L. V., Higgins, J. P. T., & Rothstein, H. (2009). Introduction to meta-analysis. West Sussex, UK: John Wiley and Sons, Ltd.
Calhoon, M. B. (2005). Effects of a peer-mediated phonological skill and reading comprehension program on reading skill acquisition for middle school students with reading disabilities. Journal of Learning Disabilities, 38(5), 424-433.
Cohen, E. (1994). Designing groupwork: Strategies for the heterogeneous classroom. New York: Teachers College Press.
Del Favero, L., Boscolo, P., Vidotto, G., & Vicentini, M. (2007). Classroom discussion and individual problem-solving in the teaching of history: Do different instructional approaches affect interest in different ways? Learning and Instruction, 17, 635-657.
DeVries, D. L., & Edwards, K. J. (1973). Learning games and student teams: Their effects on classroom process. American Educational Research Journal, 10(4), 307-318.
Earley, P. C. (1989). Social Loafing and Collectivism: A Comparison of the United States and the People's Republic of China. Administrative Science Quarterly, 34(4), 565-581.
Farmer, H., Vispoel, W., & Maehr, M. (1991). Achievement contexts: Effect on achievement values and causal attributions. Journal of Educational Research, 85, 26-38.

102
Gerlach, J. M. (1994). Is this collaboration? In K. Bosworth & H. S.J. (Eds.), Collaborative learning: Underlying processes and effective technniques, New directions in teaching and learning. San Francisco, CA: Jossey-Bass.
Ghaith, G. M., & Yaghi, H. M. (1998). Effect of cooperative learning on the acquisition of second language rules and mechanics. Systems, 26, 223-234.
Gillies, R. M., & Ashman, A. F. (2000). The effects of cooperative learning on students with learning difficulties in the lower elementary school. The Journal of Special Education, 34(1), 19-27.
Guerin, B. (1999). Social behaviors as determined by different arrangements of social consequences: Social loafing, social facilitation, deindividuation, and a modified social loafing. The Psychological Record, 49, 565-578.
Hanze, M., & Berger, R. (2007). Cooperative learning, motivational effects, and student characteristics: An experimental study comparing cooperative learning and direct instruction in 12th grade physics classes. Learning and Instruction, 17, 29-41.
Harkins, S. G., & Petty, R. (1982). Effects of task difficulty and task uniqueness on social loafing. Journal of Personality and Social Psychology, 43(6), 1214-1229.
Harskamp, E., & Ding, N. (2006). Structured collaboration verses individual learning in solving physics problems. International Journal of Science Education, 28(14), 1669-1688.
Hinde, R. A. (1976). Interactions, relationships and social structure. Man, 11(1), 1-17. Howard, B. C. (1996, February). A meta-analysis of scripted cooperative learning. Paper presented at the
Annual Meeting of the Eastern Educational Research Association, Boston, MA. Hunter, J. E., & Schmidt, F. L. (1990). Methods of meta-analysis: Correcting error and bias in research findings.
Newbery Park, CA: Sage Publications. Ingham, A. G., Levinger, G., Graves, J., & Peckham, V. (1974). The Ringelmann effect: Studies of
group size and group performance. Journal of Experimental Social Psychology, 10(4), 371-384. Johnson, D. W. (1981). Student-Student Interaction: The Neglected Variable in Education.
Educational Researcher, 10(1), 5-10. Johnson, D. W., & Johnson, R. T. (1974). Instructional goal structure: cooperative, competitive, or
individualistic. Review of Educational Research, 44(2), 213-240. Johnson, D. W., & Johnson, R., T. (1989). Cooperation and competition: Theory and research. Edina, MN:
Interaction Book Company. Johnson, D. W., & Johnson, R. T. (1999). Learning together and alone (5th ed.). Boston, MA: Allyn and
Bacon. Johnson, D. W., & Johnson, R., T. (2003). Student motivation in co-operative groups. In R. M.
Gillies & A. F. Ashman (Eds.), Co-operative learning: The social and intellectual outcomes of learning in groups (pp. 136-176). New York: RoutledgeFalmer.
Johnson, D. W., & Johnson, R. T. (2005). New developments in Social Interdependence Theory. Genetic, Social, and General Psychological Monographs, 131(4), 285-358.
Johnson, D. W., & Johnson, R. T. (2009). An educational psychology success story: Social interdependence theory and cooperative learning. Educational Researcher, 38(5), 365-379.

103
Johnson, D. W., Johnson, R. T., & Holubec, E. J. (1994). The new circles of learning: Cooperation in the classroom and school. Alexandria, VA: ASCD.
Kagan, S. (1985). Cooperative learning resources for teachers. Riverside, CA: University of California at Riverside.
Kagan, S. (1989-1990). The structural approach to cooperative learning. Educational Leadership, 47(4), 12-15.
Kerr, N. L., & Bruun, S. E. (1981). Ringelmann revisited: Alternative explanations for the social loafing effect. Personality and Social Psychology Bulletin, 7(2), 224-231.
Koutselini, M. (2009). Teacher misconceptions and understanding of cooperative learning: An intervention study. Journal of Classroom Interaction, 43(2), 34-44.
Kramarski, B., & Mevarech, Z. (2003). Enhancing mathematical reasoning in the classroom: The effects of cooperative learning and metacognitive training. American Educational Research Journal, 40(1), 281-310.
Kunsch, C., Jitendra, A., & Sood, S. (2007). The effects of peer-mediated instruction in mathematics for students with learning problems: A research synthesis. Learning Disabilities Research & Practice, 22(1), 1-12.
Latane, B., Williams, K., & Harkins, S. G. (1979). Many hands make light work: The causes and consequences of social loafing. Journal of Personality and Social Psychology, 37(6), 822-832.
Lew, M., Mesch, D., Johnson, D. W., & Johnson, R. (1986). Positive interdependence, academic and collaborative-skills group contingencies, and isolated students. American Educational Research Journal, 23(3), 476-488.
Marzano, R., Pickering, D., & Pollock, J. (2001). Classroom instruction that works: Research-based strategies for increasing student achievement. Alexandria, VA: Association for Supervision and Curriculum Development.
McWhaw, K., Schnackenberg, H., Sclater, J., & Abrami, P. C. (2003). From co-operation to collaboration: Helping students become collaborative learners. In R. M. Gillies & A. F. Ashman (Eds.), Co-operative learning: The social and intellectual outcomes of learning in groups (pp. 69-86). New York: Routledge Falmer.
Morgan, R. L., Whorton, J. E., & Gunsalus, C. (2000). A comparison of short-term and long-term retention: Lecture combined with discussion verses cooperative learning. Journal of Instructional Psychology, 27, 53-58.
Ozsoy, N., & Yildiz, N. (2004). The effect of Learning Together technique of cooperative learning method on student achievement in mathematics teaching 7th grade class of primary school. The Turkish Online Journal of Educational Technology, 3(3), 49-54.
Piaget, J. (1932). The language and thought of the child (2nd ed.). London: Routledge & Kegan Paul. Ryan, J. B., Reid, R., & Epstein, M. H. (2004). Peer-mediated intervention studies on academic
achievement for students with EBD: A review. Remedial and Special Education, 25, 330-341. Roseth, C. J., Johnson, D. W., & Johnson, R. T. (2008). Promoting early adolescents' achievement
and peer relationships: The effects of cooperative, competitive, and individualistic goal structures. Psychological Bulletin, 134(2), 223-246.
Schroeder, C.M., Scott, T.P., Tolson, H., Huang, T. & Lee, Y. (2007). A meta-analysis of national research: Effects of teaching strategies on student achievement in science in the United States. Journal of Research in Science Teaching, 44(10), 1436-1460.

104
Shaaban, K. (2006). An initial study of the effects of cooperative learning on reading comprehension, vocabulary acquisition, and motivation to read. Reading Psychology, 27, 377-403.
Shachar, H., & Fischer, S. (2004). Cooperative learning and the achievement of motivation and perceptions of students in 11th grade chemistry class. Learning and Instruction, 14, 69-87.
Sharan, S. (1980). Cooperative learning in small groups: Recent methods and effects on achievement, attitudes, and ethnic relations. Review of Educational Research, 50, 241-271.
Sharan, Y., & Sharan, S. (1992). Expanding cooperative learning through group investigation. New York, NY: Teachers College Press.
Sheppard, J. A., & Taylor, K. M. (1999). Social loafing and expectancy-value theory. Personality and Social Psychology Bulletin, 25, 1147-1158.
Slavin, R. E. (1977). Classroom reward structure: An analytical and practical review. Review of Educational Research, 47, 633-650.
Slavin, R. E. (1978). Student teams and achievement divisions. Journal of Research and Development in Education, 12, 39-49.
Slavin, R. E. (1983). Cooperative Learning. New York: Longman Inc. Slavin, R. E. (1990). Cooperative learning: Theory, research, and practice. Boston: Allyn and Bacon. Souvignier, E., & Kronenberger, J. (2007). Cooperative learning in third graders' jigsaw
groups for mathematics and science with and without questioning training. The British Psychological Society, 77, 755-771.
Stamovlasis, D., Dimos, A., & Tsaparlis, G. (2006). A study of group interaction processing in learning lower secondary physics. Journal of Research in Science Teaching, 43(6), 556-576.
Tarhan, L., & Acar, B. (2007). Problem-based learning in an eleventh grade chemistry class: 'Factors affecting cell potential.' Research in Science and Technology Education, 25(3), 351-369.
Tarim, K., & Akdeniz, F. (2008). The effects of cooperative learning on Turkish elementary students' mathematics achievement and attitude towards mathematics using TAI and STAD methods. Educational Studies in Mathematics, 67, 77-91.
Weiss, I., Kramarski, B., & Talis, S. (2006). Effects of multimedia environments on kindergarten children's mathematical achievements and style of learning. Educational Media International, 43(1), 3-17.
Vygotsky, L. S. (1978). Mind in society: The development of higher psychological processes. Cambridge, MA: Harvard University Press.

105
Chapter 8: Setting Objectives and
Providing Feedback
Background and Definitions Teachers and students in academically successful schools are clear about the goals for learning (McREL, 2005; Taylor, Pearson, Clark, & Walpole, 2000). Lessons and classrooms are well-structured, with clear goals and expectations for students. Closely aligned with setting clear goals for learning is providing feedback to learners on how they are doing in relation to the achievement of the goals. In order to enhance learning, students should be involved in the process of setting objectives and provided with feedback on their success in attaining these objectives (Hattie & Timperley, 2007). Setting objectives is the process of establishing a standard to guide learning (Marzano, Pickering, & Pollack, 2001, Pintrich & Schunk, 2002). Setting objectives is a component of self-regulation in which students establish goals and monitor their own progress towards achieving these goals (Bransford, Brown, & Cocking, 2000). Teachers must build a shared commitment to learning goals, and develop students’ strategies to monitor their progress (Hattie & Timperley, 2007). Providing feedback is an ongoing process in which teachers communicate information to students that helps them understand necessary changes to improve their learning (Hattie & Timperley, 2007; Shute, 2008). In the teaching and learning context, the most effective feedback is related to a specific objective, timely, and includes both verification in the form of information about correctness, and elaboration in the form of information about what to do next (Hattie & Timperley, 2007; Shute, 2008). Feedback related to specific objectives reduces uncertainty about how well or how poorly a student is performing or understanding. Goals without “success criteria or clarity as to when and how students know they are successful are often too vague to serve the purpose of enhancing learning” (Hattie and Timperley, 2007, p. 88). Additionally, in classroom practice, it is easy (but avoidable) to misalign feedback or performance criteria with a learning goal. Teachers need to avoid, for example, providing feedback solely on spelling and quantity of writing when the goal is creating mood in a
Charles Igel Trudy Clemons Helen Apthorp

106
written story (Hattie and Timperley, 2007). Once clarified, goals may be modified based on feedback to increase the challenge if they are not challenging enough, or to decrease the challenge if the distance between current performance and the standard is too great. Findings from previous research suggest that the process of assisting students in monitoring their learning through setting objectives and providing feedback can increase both student motivation and student learning. Marzano et al. (2001) report a composite effect size of 0.61 for the category of instructional strategies referred to as setting objectives and providing feedback.
Methods
Literature Search Bibliographic databases in both education and psychology (e.g., Education Resources Information Center, Education: A SAGE Full Text Collection, Professional Development Collection, PsycInfo, and JSTOR) were searched using achievement and learning as the outcome keywords crossed with each strategy key word: objectives, self-regulation, goal-setting, feedback, and formative assessment. Author searches were then conducted based on citations in the located studies. Searches continued until results repeatedly contained duplicate hits.
Article Sampling A search was conducted among the located articles for primary research literature that tested the effect of objectives or feedback on student achievement, and met relevance criteria including inclusion of a student sample that was in grades K-12, an achievement measure as an outcome, and publication in 1998-2009. A complete description of methodological criteria is available in Chapter 1. Four studies met these criteria for the topic of objectives, and five met the criteria for feedback. A single study (Dresel & Haugwitz, 2008) tested independent samples using both interventions. It is included in meta-analyses for both objectives and feedback. The majority of excluded studies did not include K-12 students or inextricably conflated multiple interventions. The research design, samples of students, and intervention and outcome measures of the included studies are described in Table 8.1 for objectives and Table 8.2 for feedback. Publication years for all selected studies across both interventions range from 2001 to 2009, with a relatively even distribution across the time period. Other analyses in the full report limit study years to 2008—the year that literature collection originally began. However, due to the dearth of qualified studies, the upper bound of the search year was extended to 2009. Three of the included studies were conducted within the U.S. All included studies used an experimental or quasi-experimental design, and all tested a single sample of K-12 students. Grade ranges across the sample were well represented, with four elementary, three middle school, and two high school samples. It should be noted, however, that both studies that tested high school samples were in the feedback meta-analysis. All subject areas except social studies were represented, with two language arts, five math, and a single science study. A variety of strategies with the domains of objectives and feedback were tested and are provided in Tables 8.1 and 8.2 respectively.
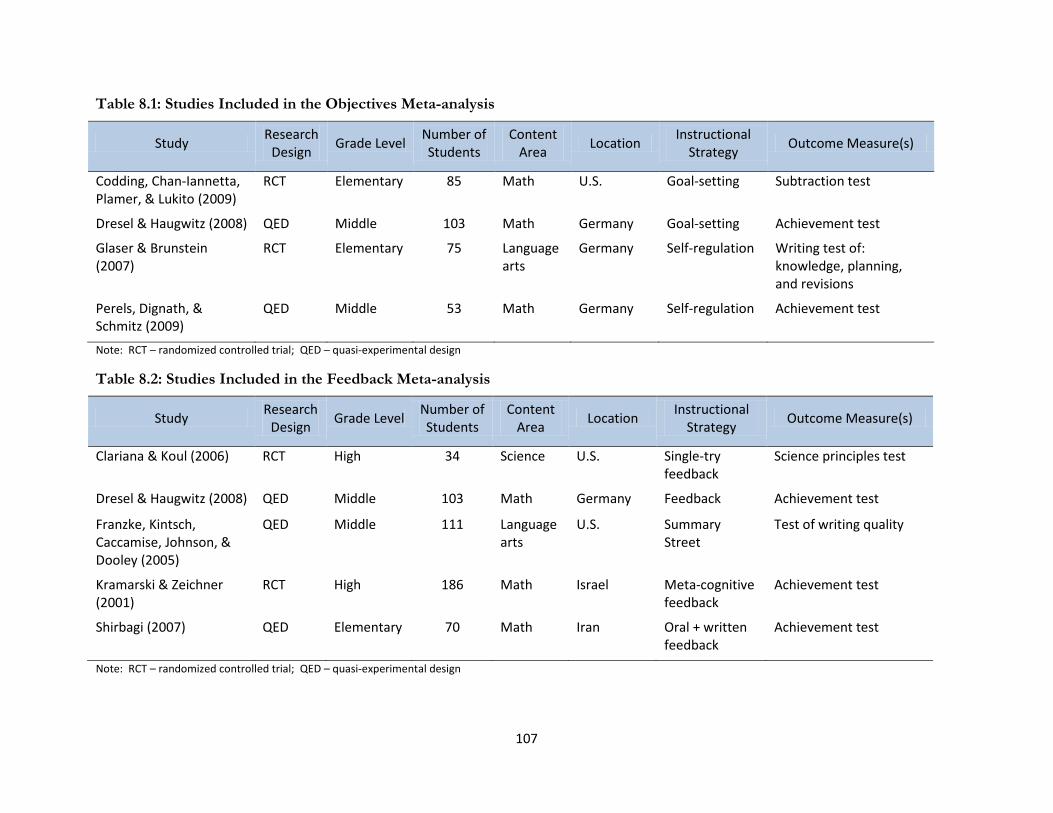
107
Table 8.1: Studies Included in the Objectives Meta-analysis
Study Research Design Grade Level Number of
Students Content
Area Location Instructional Strategy Outcome Measure(s)
Codding, Chan-Iannetta, Plamer, & Lukito (2009)
RCT Elementary 85 Math U.S. Goal-setting Subtraction test
Dresel & Haugwitz (2008) QED Middle 103 Math Germany Goal-setting Achievement test
Glaser & Brunstein (2007)
RCT Elementary 75 Language arts
Germany Self-regulation Writing test of: knowledge, planning, and revisions
Perels, Dignath, & Schmitz (2009)
QED Middle 53 Math Germany Self-regulation Achievement test
Note: RCT – randomized controlled trial; QED – quasi-experimental design Table 8.2: Studies Included in the Feedback Meta-analysis
Study Research Design Grade Level Number of
Students Content
Area Location Instructional Strategy Outcome Measure(s)
Clariana & Koul (2006) RCT High 34 Science U.S. Single-try feedback
Science principles test
Dresel & Haugwitz (2008) QED Middle 103 Math Germany Feedback Achievement test
Franzke, Kintsch, Caccamise, Johnson, & Dooley (2005)
QED Middle 111 Language arts
U.S. Summary Street
Test of writing quality
Kramarski & Zeichner (2001)
RCT High 186 Math Israel Meta-cognitive feedback
Achievement test
Shirbagi (2007) QED Elementary 70 Math Iran Oral + written feedback
Achievement test
Note: RCT – randomized controlled trial; QED – quasi-experimental design

108
Other Meta-Analyses Recent meta-analytic reviews of instructional research in both mathematics and reading also showed a positive association between higher student achievement and explicit goal setting and/or guidance and feedback (Baker, Gersten, & Lee, 2002; Mooney, Ryan, Uhing, Reid, & Epstein, 2005; National Institute of Child Health and Human Development, 2000). In 2002, Baker, Gersten, and Lee conducted a meta-analysis of 15 math intervention studies. The studies were focused on interventions for students who were low in mathematics achievement. Within the 15 studies, four focused specifically on providing data and ongoing feedback about mathematics performance. A small effect size of 0.29 was found for studies where teachers monitored the progress of students and shared this information with their students. In this study, students were not provided with specific guidance based on the progress monitoring data. The National Reading Panel conducted meta-analytic studies on topics of high interest in reading education, fluency, comprehension, teacher education and reading instruction, and computer technology and reading instruction (National Institute of Child Health and Human Development, 2000). In the topic areas of fluency and comprehension, providing explicit guidance and immediate feedback were found to have a positive association with reading achievement. Sixteen studies on the topic of fluency (guided oral reading), and 205 studies on the topic of comprehension were included in the meta-analyses. In a related meta-analysis of self-management effects for a student subgroup (i.e., students with emotional and behavioral disorders), Mooney et al. (2005) reported an overall average effect size of 1.80 for goal setting and progress monitoring. Outcomes in the Mooney et al. (2005) meta-analysis were measured across content areas, including both mathematics and reading; the strongest impacts, however, were on math computation and writing skills. The self-management interventions studied were multi-component interventions that included self-selected goals, a system of progress monitoring, and provision or access to feedback in the form of charted progress toward a goal. The results from these meta-analyses suggest that the strategies of goal setting and providing feedback can have positive impacts on student achievement. Stronger impacts may be seen if teachers provide explicit guidance to help students adjust learning rather than just providing data that monitors progress. These findings are consistent with findings on previously mentioned research describing the most effective techniques for setting objectives and providing feedback.
Results
Meta-Analysis of Articles in Sample As reviewed in the Methods chapter, a random effects model was used to estimate a composite effect size for the studies identified for the primary analysis. To maintain consistency of measurement across all studies, Hedges’ g was calculated for each study separately. Results were adjusted from studies exhibiting a mismatch between study design and analysis using a statistical adjustment where necessary. Results were then synthesized using an inverse variance weight �𝟏𝟏 𝒘𝒘𝒊𝒊� � that assigned relatively more influence to those studies containing less variance.

109
The results from these calculations and final analysis are presented in Tables 8.3 for objectives and 8.4 for feedback interventions. When individual studies presented multiple outcomes measures within the same sample, these measures were combined into a single effect size for that study, a commonly accepted meta-analytic practice for non-independent measures (Borenstein, Hedges, Higgins, & Rothstein, 2009). In addition to the individual effects, the relative weight and 95% confidence interval around each study are also presented. Setting Objectives
All studies produced positive effects for objective setting with an overall effect of g = 0.31 (see Table 8.3). The form of objective setting included the establishment of goals, metacognitive skills, and self-regulation. There was mixed evidence that setting objectives had lasting effects on material retention. Codding, Chan-Iannetta, Palmer, and Lukito (2009) studied the effects of a learning intervention—“Cover-Copy-Compare”—with and without the pre-establishment of objectives. Assessment of student retention was taken one week after the intervention and again one month after the intervention. While the methodological criteria for this meta-analysis allow the proximal assessment to be included, Codding and colleagues also found higher mean scores among the “objectives” group (36.14) over the “Cover-Copy-Compare” group (31.10) in the distal assessment. Their finding suggests a long-term effect. Dresel and Haugwitz (2008) tested students in three successive conditions:a placebo (control) group, a feedback-only group, and a feedback plus metacognitive goal-setting group. As indicated in Table 8.3, the group receiving metacognitive treatment did outperform other groups in the one-week assessment of math skills. However, no improvements were noted with either comparison on the five-month assessment. This suggests no long-term effect. Due to the small number of identified studies, subsequent moderator analysis was not conducted. Table 8.3: Individual & Composite Effect Sizes, Weights, and Confidence Intervals for Objectives Studies
Study Effect Size (Hedges’ g)
Relative Weight
95 % Confidence Interval
Lower Upper
Codding, Chan-Iannetta, Palmer, & Lukito (2009)
0.24 27.39 -0.18 0.66
Dresel & Haugwitz (2008) 0.21 32.06 -0.18 0.60
Glaser & Brunstein (2007) 0.45 23.55 -0.01 0.90
Perels, Dignath, & Schmitz (2009) 0.44 17.00 -0.10 0.97
OVERALL 0.31 n.a. 0.09 0.53
Providing Feedback
All studies produced positive effects for feedback (see Table 8.4) with an overall effect of g = 0.76. Across studies, feedback was operationalized in written form as formative assessments and orally by the teacher or researcher. Positive effects were estimated for all versions of feedback when compared to a control condition that did not involve feedback. One study (Franzke, Kintsch, Caccamise, Johnson, & Dooley, 2005) tested the effect of a software tutoring program called

110
Summary Street. A central feature of the program is immediate corrective feedback that allows the user to correct his response. Franzke and colleagues found a low to moderate effect (0.24) on a test of writing quality that assessed elements such as content, organization, mechanics, detail, and style. The remainder of included studies tested generic versions of feedback. Similar to the meta-analysis on objectives, there is some evidence that feedback had lasting effects on performance. Dresel and Haugwitz (2008) tested students one week after the intervention, then again five months afterward with a software-based program. As mentioned above, the methodological criteria of temporally proximal outcomes prohibited inclusion of the five-month assessment in the meta-analysis. However, the study found that students receiving feedback from the program (0.27) outperformed non-feedback students (-0.34) on a math achievement test. No additional studies tested this long-term effect. In a study of Iranian upper elementary students, Shirbagi (2007) found larger, statistically significant effects for feedback presented in written form (15.65) when compared to feedback presented orally (13.45). No immediate explanation was available for the larger effects found by Kramarski and Zeichner (2001) and Shirbagi (2007). Due to the small number of identified studies, subsequent moderator analysis was not conducted. Table 8.4: Individual & Composite Effect Sizes, Weights, and Confidence Intervals for Feedback Studies
Study Effect Size (Hedges’ g)
Relative Weight
95 % Confidence Interval
Lower Upper
Clariana & Koul (2006) 0.57 17.09 -0.10 1.24
Dresel & Haugwitz (2008) 0.28 20.66 -0.13 0.70
Franzke, Franzke, Kintsch, Caccamise, Johnson, & Dooley (2005)
0.24 21.17 -0.13 0.62
Kramarski & Zeichner (2001) 1.31 21.80 0.99 1.62
Shirbagi (2007) 1.37 19.28 -0.86 1.89
OVERALL 0.76 n.a. 0.23 1.28
Connecting New Research Information to Original CITW Findings All studies included in the current analysis reported positive effects for objective setting and feedback. This indicates that the current literature still supports the original claim that the two strategies are effective instructional techniques. Marzano et al. (2001) reported an overall effect size of 0.61, combining both techniques into a single effect. For this revision, the two strategies were separated because they contain enough distinctive characteristics to warrant separate analyses and discussion. The overall effect size of the meta-analysis conducted for this study was somewhat smaller for objectives (g = 0.31) and consistent (while somewhat higher) for feedback (g = 0.76) when compared with the effect reported by Marzano and colleagues. Differences in effects may be the result different methodology and smaller study sample size. The current meta-analysis used a very specific definition to operationalize the two strategies. Studies that did not fit into this

111
definition were excluded, as were those with no ability to control for alternative hypotheses. Where appropriate the effect sizes for included articles were adjusted for the nested nature of students within a classroom.
Main Points and Recommendations The current meta-analysis involved 717 students across multiple grades and subject areas, as well as various measures of academic achievement. A composite effect size of g = 0.31 for objectives and g = 0.76 for feedback indicates an average gain of approximately 12 percentile points for objectives and a 28 percentile point gain for feedback. In other words, a perfectly average student—scoring at the 50th percentile on academic achievement measures—who had been exposed to objective setting strategies would be expected to perform at the 62nd percentile, while the same student exposed to feedback would be expected to perform at the 78th
percentile.
Considering the conservative selection criteria and methodology used in this meta-analysis, a finding of this magnitude supports the hypothesis that the two interventions are robust instructional strategies in terms of improving student learning. When methodological choices regarding study selection, statistical adjustments for included studies, and analytic models were made, each favored the more conservative choice. For these reasons, the estimates provided by this work should be interpreted as the lower bound for the effect of note taking and summarizing within the larger body of research. With regard to recent research on providing feedback, the research both supports and suggests refinements to the generalizations about feedback provided in CITW (2001). Four generalizations about the use of feedback were provided in CITW (2001): Feedback should be corrective, feedback should be timely, feedback should be criterion-referenced, and students can effectively provide their own feedback. Refinements to these generalizations based on recent research and thinking follow:
• Feedback should be instructive but not a substitute for instruction (Hattie & Timperley, 2007). Effective feedback is about faulty interpretations and hypotheses, not lack of information. After instruction, effective feedback includes both verification about correctness and the distance to criterion and elaboration on what to do next (Shute, 2008). Elaboration can be in the form of questions or prompts, such as “What’s this problem/task all about?” (Kramarski & Zeichner, 2001).
• Feedback should be provided appropriately in time to meet student needs. When students are engrossed in figuring out a difficult task themselves, feedback should be delayed; but when students can use feedback to complete a task, immediacy helps.
• Feedback should be referenced to the actual task (descriptive) and avoid being personal or evaluative.
• Support students in self-selecting learning targets, self-monitoring progress, and self-assessment (Glaser & Brunstein, 2007; Mooney et al., 2005).

112
References Bolded references are included in the research review.
Baker, S., Gersten, R., & Lee, D. (2002). A synthesis of empirical research on teaching mathematics to low-achieving students. The Elementary School Journal, 103(1), 51-73.
Borenstein, M., Hedges, L. V., Higgins, J. P. T., & Rothstein, H. (2009). Introduction to meta-analysis. West Sussex, UK: John Wiley and Sons, Ltd.
Bransford, J., Brown, A., & Cocking, R. (2000). How people learn: Brain, mind, experience, and school (Expanded ed.). Washington, DC: National Academy Press.
Clariana, R. B., & Koul, R. (2006). The effects of different forms of feedback on fuzzy and verbatim memory of science principles. British Journal of Educational Psychology, 76, 259-270.
Codding, R.S., Chan-Iannetta, L., Palmer, M., & Lukito, G. (2009). Examining a classwide application of Cover-Copy-Compare with and without goal setting to enhance mathematics fluency. School Psychology Quarterly, 24(3), 173-185.
Dresel, M., & Haugwitz, M. (2008). A computer-based approach to fostering motivation and self-regulated learning. The Journal of Experimental Education, 77(1), 3-18.
Franzke, M., Kintsch, E., Caccamise, D., Johnson, N. & Dooley, S. (2005). Summary Street®: Computer support for comprehension and writing. Journal of Educational Computing Research, 33(1), 53 – 80.
Glaser, C. & Burnstein, J. C. (2007). Improving fourth-grade students’ composition skills: Effects of strategy instruction and self-regulation procedures. Journal of Educational Psychology, 99(2), 297-310.
Hattie, J. & Timperley, H. (2007). The power of feedback. Review of Educational Research, 77(1), 81-112.
Kramarski, B & Zeichner, O. (2001). Using technology to enhance mathematical reasoning. Effects of feedback and self-regulation learning. Education Media International, 38(2/3), 77-82.
Marzano, R., Pickering, D., & Pollock, J. (2001). Classroom instruction that works: Research-based strategies for increasing student achievement. Alexandria, VA: Association for Supervision and Curriculum Development.
Mid-continent Research for Education and Learning. (2005). Final report: High-needs schools - what does it take to beat the odds? (Technical Report). Aurora, CO: Author.
Mooney, P., Ryan, J. B., Uhing, B. M., Reid, R., and Epstein, M. H. (2005). A review of self-management interventions targeting academic outcomes for students with emotional and behavioral disorders. Journal of Behavioral Education, 14(3), 203-221.
National Institute of Child Health and Human Development. (2000). Report of the National Reading Panel. Teaching children to read: An evidence-based assessment of the scientific research literature on reading and its implications for reading instruction (NIH Publication No. 00-4769). Washington, DC: U.S. Government Printing Office.
Perels, F., Dignath, C., & Schmitz, B. (2009). Is it possible to improve mathematical achievement by means of self-regulation strategies? Evaluation of an intervention in regular math classes. European Journal of Psychology of Education, 24(1), 17-31.

113
Pintrich, P. R., & Schunk, D. H. (2002). Motivation in education: Theory, research and applications (2nd
Shirbagi, N. (2007). Feedback in formative evaluation and its effects on a sample of Iranian primary students’ achievement in science. Pedagogika, 88, 99-105.
ed.). Upper Saddle River, NJ: Merrill Prentice Hall.
Shute, V. J. (2008). Focus on formative feedback. Review of Educational Research, 78(1), 153-189. Taylor, B. M., Pearson, P. D., Clark, K., & Walpole, S. (2000). Effective schools and accomplished
teachers: Lessons about primary-grade reading instruction in low-income schools. The Elementary School Journal, 101(2), 121-165.

114
Chapter 9: Generating and Testing Hypotheses
Background and Definitions In Classroom Instruction that Works, Marzano, Pickering, and Pollock (2001) define “generating and testing hypotheses” as a technique that requires students to apply previous or developing knowledge to novel situations. This process involved two types of thinking: deductive and inductive. In deductive thinking, students use prior knowledge to create general rules to make predictions about future events or novel situations (for example, using knowledge of past historical events to predict the outcome of future international policies). In inductive thinking, students gather information and then generate principles that help explain events or phenomena (for example, gathering data on freezing points of salt solutions to form a general rule about how salt affects water’s freezing point). However, these types of thinking are not mutually exclusive, and many problems are solved by using a combination of these processes. CITW categorized these broad problem solving processes into six separate classroom activities.
1. System analyses: Students make predictions about what would happen if something in a larger system changes.
2. Problem solving: Students generate hypotheses and solutions to answer specific questions that could either be novel situations or variations of previous problems.
3. Historical investigation: Students produce plausible scenarios for events based on their analyses of relevant past historical events.
4. Invention: Students generate and test hypotheses in a new or novel way. This differs from problem solving in that it is an iterative process of hypotheses generation and testing the results of an invention.
5. Experimental inquiry: Students use the scientific method as the problem solving framework; it is restricted to science inquiry. Students generate hypotheses, collect and analyze data, and draw conclusions based on the steps of the scientific method.
6. Decision making: Students use hypothetical situations as problems and select solutions that are either the best or most relevant to solve the problem.
Marzano et al. (2001) reported an average effect size of 0.61 for the impact of these activities on student achievement.
Jessica Allen

115
Methods
Literature Search The six types of classroom activities guided the literature search for this chapter. In the article database searches (using Education Resources Information Center, Education: A SAGE Full Text Collection, Professional Development Collection, PsycInfo, and JSTOR), researchers used combinations of the following keywords: hypothesis, testing, instruct* (which, with the asterisk, searched for any word, such as instructor or instruction), achievement, learning outcome, system, analy*, solv*, problem, histor*, investigat*, invention, and decision making.
Article Sampling Articles initially identified in the literature search were screened to ensure that their instructional techniques involved students in generating and testing hypotheses, and that they fit into one or more of the six types of instructional activities listed above. Specifically, articles that examined inquiry learning, problem based learning (PBL), constructivist techniques, and learner-oriented instruction were selected as potential candidates. This subset was then examined more strictly, requiring that the explanation of the instructional technique be explicit, stating that students were engaged in activities in which they generated and tested hypotheses. The description of the instructional technique must have included the following words or phrases (or closely related words and phrases): generating hypotheses, questioning, collecting/analyzing data, drawing conclusions, inferring solutions, applying knowledge, and solving problems. Based on these criteria, 19 articles were selected for inclusion in the full study. One article (Akkus, Kadayifçi, Atasoy, & Geban, 2003) was excluded because of methodological inconsistencies found throughout the article. A qualitative case study (Tal, Krajcik, & Blummenfeld, 2006) was also identified during the literature search and could not be included in the quantitative analyses. The final sample included 17 articles (see Table 9.1Error! Reference source not found.) about studies using quantitative methods. The 17 articles containing quantitative methods varied across subject, location, student age, number of students, and length of time (see Table 9.1). The majority of the studies focused on science instruction; only one article in the sample looked at math instruction and none were focused on the humanities. Nine of the studies were conducted with schools outside of the United States. Ten of the studies involved high school students, five studies involved middle schools students, and two studies examined elementary school students. The smallest study (Bottge, Rueda, & Skivington, 2006) involved 17 students in one classroom, while the largest study (Marx et al., 2004) had 4677 post-assessment student scores spanning three years of data collection. Fifteen of the studies involved one instructional unit and took place during a single school year. Marx et al. (2004) and Rivet and Krajcik (2004) were multi-year studies that examined the same curriculum intervention taking place at the same schools with the same teachers and students.

116
Table 9.1: Studies Included in the Generating and Testing Hypotheses Review
Study Research Design Grade Level
Number of Students Locale Content
Area
Instructional Strategy (Authors
Characterization)
Outcome Measure(s)
Bottge, Rueda, & Skivington (2006)
One group – pre-/post-design
High 17 U.S. Math Enhanced Anchored Instruction
Computation Problem Solving
Chang, Sung, & Lin (2006)
RCT Elementary b 49 Taiwan Math PBL – computer based
Achievement
Fortus, Dershimer, Krajcik, Marx, & Mamlok-Naaman (2004)
One group – pre-/post-design
High 70 U.S. Science Design Based Science
Achievement (Three units) Environmentally Safe Extreme Structure Safer Cellular Phones
Fund (2007) RCT Middle a 473 Israel Science PBL – computer based
Surface knowledge Deep Understanding
Hsu (2008) QED (classroom assignment not discussed)
High 87 Taiwan Science Technology Enhanced Learning model
Conceptual Knowledge
Marx, Blumenfeld, Krajcik, Fishman, Soloway, Geier, & Revital (2004)
One group – pre-/post-design
Middle 4677 U.S. Science Inquiry – technology assisted
Achievement (3 units) Air Helmets Water
Nwagbo (2006) QED High 147 (8 classes)
Nigeria Science Guided Inquiry Achievement

117
Rivet & Krajcik (2004) One group – pre-/post-design
Middle 256 U.S Science Inquiry – technology assisted
Achievement
Roehrig & Garrow (2007)
QED (purposeful sampling)
High 288 U.S. Science PBL Achievement
Scharfenberg, Bogner, & Klautke (2007)
QED (selection and assignment not discussed)
High 337 Germany Science Inquiry Decrease / increase in knowledge Learning success Retention Actual Learning
Simons & Klein (2007)
RCT Middle b 111 U.S. Science PBL Achievement test (separated by high/low performers) Unit Project
So & Kong (2007) QED Elementary 70 Hong Kong Science Learner Orientated
Achievement
Swaak, de Jong, & van Joolingen (2004)
RCT High b 112 Netherlands Science Simulation Definitional knowledge “What if” “What-if-why” (explanation and prediction)
Tarhan & Acar (2007) RCT High b 40 Turkey Science PBL Achievement
Tarhan, Ayar-Kayali, Urek, & Acar (2008)
RCT High b 78 Turkey Science PBL Achievement

118
Ward & Lee (2004) RCT High a 79 U.S. Vocational PBL Achievement
Wolf & Fraser (2007) RCT Middle a 165 (8 classes)
U.S. Science Inquiry Achievement
a RCT with assignment at classroom level b
Note: RCT – randomized controlled trial; QED – quasi-experimental design; PBL – problem based learning RCT with assignment at student level

119
All of the articles included a measure of student achievement as at least one of the outcomes. Fourteen studies used researcher-developed and unit-specific assessments. Bottge et al. (2006), Nwagbo (2006) and Ward and Lee (2004) adapted their assessments from published standardized tests. The majority of the studies (13) used a general definition of achievement as their main outcome. Bottge et al. (2006) adapted the Iowa Test of Basic Skills to separately measure students’ computational and problem-solving knowledge. Fund (2007) assessed achievement in both surface knowledge and deep understanding and provided individual measures for each. Hsu (2008) used concept maps to chart student conceptual knowledge. Scharfenberg, Bogner, and Klautke (2007) measured student knowledge before, immediately after, and six weeks after the study to measure knowledge gain and retention. Simons and Klein (2007) used scores from both a written achievement test and a project-based checklist to gauge achievement. Swaak, de Jong, and van Joolingen (2004) examined three aspects of achievement independently (definitional, relational, and predictive knowledge) as well as the time it took for students to make the relational connections.
Other Meta-Analyses After the publication of CITW (Marzano et al., 2001), Schroeder, Scott, Tolson, Huang, & Lee,. (2007) conducted a meta-analysis of 390 articles relevant to generating and testing hypotheses as an instructional strategy in science. The final sample consisted of 61 studies of U.S. schools or programs that were published between 1980 and 2004. Two out of the total eight of the individual instructional strategies, inquiry and enhanced context, had relevance to students generating and testing hypotheses. In the inquiry strategy “teachers use student-centered instruction that is less step-by step and teacher directed then traditional instruction; students answer scientific research questions by analyzing data (e.g., using guided or facilitated inquiry activities, laboratory inquiries)” (p. 1446). In the enhanced context strategy “teachers relate learning to students’ previous experiences or knowledge or engage students’ interest through relating learning to the students’/school’s environment or setting (e.g., using problem-based learning, taking field trips, using the schoolyard for lessons, encouraging reflection)” (p. 1446). Error! Reference source not found.Table 9.2 shows the effect size, number of studies, and number of students as reported by Schroeder et al. (2007) in their meta-analysis. The enhanced context strategy showed the largest effect among all eight strategies, while inquiry ranked fourth in effect size among the strategies. Table 9.2: Effect Sizes from Schroeder et al. (2007)
Strategy Effect Size Number of studies N (students)
Overall 0.67 61 159,695
Inquiry 0.65 12 145,722
Enhanced Context 1.48 6 7,235
Source: Schroeder et al. (2007)

120
Other Methodological Notes The present synthesis of these 17 study reports adopted methods recommended by Briggs (2008). Briggs (2008) identified three aspects of construct validity that must be addressed when drawing inferences and generalizations from a meta-analysis. The first aspect is the unit of sample assignment and analysis must match or effect sizes may be overestimated. This meta-analysis chapter included three main types of study design that were candidates for these adjustments. Both the quasi-experimental and the RCT included the use of at least one treatment and control group. In this study, when information about clustering was available the effect sizes were adjusted according to guidelines provided by Hedges (2007). The third research design in this chapter was one-group pre-/post-test design, for which no adjustment method could be found. The second construct validity issue (Briggs, 2008) concerned the distinction between the treatment and control groups. In order to keep treatment and control comparisons consistent across studies, studies in which the control condition was not just “business as usual” (but was instead some other version of the treatment condition) were excluded. On this basis two articles were excluded from the meta-analysis, leaving a total of 15. Fund’s (2007) study varied in the amount of instructional support provided in PBL classroom, by providing different levels of scaffolding support to students. In this study all students received some level of scaffolding so there was no contrasting control group representing “business as usual.” Roehrig and Garrow (2007) examined how two different teaching styles impacted student learning in a PBL environment. Again, this study did not examine the effectiveness of generating and testing hypotheses, because all students were doing PBL. The final construct validity issue (Briggs, 2008) concerned the outcome measures, and was the most difficult to hold constant across studies. As discussed earlier, all of the studies used a measure of achievement as one of their outcome measures. In this chapter achievement is used broadly to refer to measures of academic knowledge. Consequently, the inference that these outcomes are all measuring the same knowledge domain cannot be made. Since the main concern is the broad effectiveness of the instructional technique on student learning—not what specific content knowledge was taught—it was deemed it acceptable to include different achievement outcome measures. Nonetheless, the content area focus of each outcome was identified to allow examination of patterns associated with different outcomes when a composite effect size was not homogeneous with respect to the set of effect sizes contributing to the overall composite. Furthermore, for studies that used more than one achievement measure, spanned multiple years, or included more than one unit of instruction, all measures and groups were included in the meta-analysis when samples of students producing the effects were independent of each other. To further ensure the cohesiveness of the meta-analysis and increase overall sample validity, not all measures were included for all studies. For Hsu (2008), only the assessment immediately after the treatment was included. For Swaak et al. (2004), the time measure was excluded. Rivet and Krajcik’s article (2004) was a more detailed account of one instructional unit that was involved in the Marx et al. (2004) study. Therefore, to avoid duplication, the information about that particular unit was entered only for the Rivet and Krajcik (2004) article, and not for the Marx et al. article.
Results

121
In the following meta-analysis, Schroeder’s 2007 work was extended by applying inverse variance weights to individual effect sizes prior to determining composite effect sizes, and examined type of research design as a possible moderator. The use of the inverse variance weights reduces the influence of effect sizes from studies that have greater variance.
Meta-Analysis of Articles in Sample The individual Hedges’ g effect sizes for the 15 articles included in the meta-analysis sample are shown in Table 9.3. In general the studies showed a positive effect for the treatments. Swaak et al. (2004) was the only study producing an overall negative effect size (g = -0.38), which was the result of combining four outcomes to determine the overall effect. The authors noted that their control group had larger gains on three tests and that there was no difference between groups on the fourth test included in their study. Their explanation for this result was that there was no real difference between treatment and control conditions. The intent was for the control to represent traditional instruction, but after reviewing its implementation, Swaak et al. (2004) determined it was just another form of PBL. The meta-analysis resulted in an overall Hedges’ g of 0.46, p < 0.001 for the random effects model. This overall effect size was lower than the overall effect reported in CITW (Marzano et al., 2001) (ES = 0.61). Swaak et al. (2004) was the only article with an overall negative effect size (g = -0.38). This was the study in which the authors, after reviewing control implementation, concluded that it was actually a different form of PBL from the treatment. However, unlike Fund (2007) and Roehrig and Garrow (2007) which were removed before the meta-analysis, it was intended from the start to have a business-as-usual control group (the problem with the control group arose during the actual implementation). Therefore, it remained in the present meta-analysis. Table 9.3: Individual Study Effect Sizes
Name Hedges’ g
Bottge, Rueda, & Skivington (2006) 0.04
Chang, Sung, & Lin (2006) 0.77
Fund (2007) 0.58
Hsu (2008) 0.41
Marx, Blumenfeld, Krajcik, Fishman, Soloway, Geier, & Revital (2004)
0.14
Nwagbo (2006) 0.30
Rivet & Krajcik (2004) 0.11
Scharfenberg, Bogner, & Klautke (2006)
a
0.68
Simons & Klein (2007) 0.50
So & Kong (2007) 0.77
Swaak, de Jong, & van Joolingen (2004) -0.38
Tarhan & Acar (2007) 0.90

122
Tarhan, Ayar-Kayali, Urek, & Acar (2008) 0.90
Ward & Lee (2004) 0.04
Wolf & Fraser (2007) 0.25 a
Average effect size across all four years of the study.
Further statistical analysis indicated that Fortus et al. (2004) was an outlier (see Figure 9.1). Fortus et al. (2004) had the largest individual effect size (g = 1.93). The meta-analysis was run again, removing the outlier effect size from the Fortus et al. (2004) study. The new overall meta-analysis resulted in an overall Hedges’ g of 0.25, p < 0.001 for the random effects model.
Figure 9.1: Boxplot of initial overall effect sizes. In a boxplot the “box” represents the range of the middle distribution of 50% of the scores and the “whiskers” are the extreme ends of the distribution. Any points that lay outside of the box and whiskers are considered outliers and candidates for removal from the study because they are outside of what would be considered a normal distribution for that sample. The dark line in the box indicates the median score. The meta-analysis calculation indicated a high degree of heterogeneity around the overall average effect size for this CITW category (Q-value = 33.58, p < 0.001). Therefore, secondary analyses based on moderator variables were run to try to determine the source of variance. The Fortus et al. (2004) study was excluded from the secondary analyses. The results of these sub-analyses are summarized in Table 9.4. The first moderator variable was the design of the study. The studies included in the meta-analysis were either one-group pre-/post-designs or some form of two-group (treatment/control) pre-/post-design. The one-group design studies (0.12) produced a lower average effect size than did the two-group treatment/control studies (0.58). The type of assessment was also examined. The meta-analysis also included two general types of assessments. The first type of assessment, which was

123
specifically designed by the researchers to match the instruction, was present in 11 of the studies. Overall, these studies had an effect size of g = 0.1, p < 0.01. The second type of assessment, which was present in three studies, consisted of tests researchers adapted from widely available standardized tests. In these three studies, researchers did not administer the full tests. Instead, items directly related to content covered in the intervention were selected from the larger tests. The overall effect (g = 0.25, p < 0.05) found in these two studies was larger than the effect found in the unit-specific tests. This result was somewhat counterintuitive, as larger effects would normally be expected on assessments that align more closely with the instruction; however, the quality of these specially developed assessments was unknown.
Table 9.4: Random-effects Effect Sizes for Study Design, Grade Level and Location
Number of Studies Hedges’ g
Study Design
One Group 3 0.12
Treat/Control 11 0.58
Assessment Type
Unit test (researcher created) 11 0.1
Standardized test (researcher adapted) 3 0.25
Grade Level
Elementary 2 0.77
Middle 4 0.12
High 8 0.38
Location
Non-U.S. 8 0.62
U.S. 7 0.12
For grade level, the results for both elementary and middle schools remained constant across model type. The two elementary school studies had the largest combined effect and the three middle school studies the smallest combined effect size. For location, the non-U.S. studies produced a larger combined effect size than did studies conducted in the U.S. The results of these analyses indicated that study design, grade level, and location all had some influence on the overall effect sizes. A final analysis examined the possibility of publication bias in the meta-analysis sample. Publication bias means that studies that do not show statistical significance and large effect sizes are never published thus could not be included in a meta-analysis sample. A classical fail-safe N analysis showed that in order for the overall effect size in this chapter to be non-significant (p > 0.05), there would have to be 168 studies showing no effects. In other words, with the significance level set at p > 0.05 it would require an additional 168 studies with no measureable effect to make the results

124
non-significant. In this context significance can be interpreted as the likelihood that the reported effect size happened by chance; it would take these 168 articles to nullify the idea that the effect size reported was not due to chance. Therefore it can be inferred that the effects in this meta-analysis are a result of the interventions reported in the study and not due to chance alone.
Connecting New Research Information to Original CITW Findings All but one of the articles included in the current analysis reported positive effects. This indicates that the current literature still supports the 2001 claim that generating and testing hypotheses is an effective instructional technique, even though this meta-analysis produced smaller effect sizes. Marzano et al. (2001) reported an overall effect size of 0.61, which was close to what Schroeder et al. (2007) reported for inquiry (ES = 0.65) but smaller than what Schroeder et al. reported for enhanced context (ES = 1.48). The overall effect size of the meta-analysis conducted for this study was smaller (Hedges’ g = 0.25 for random effects) than the one reported by Marzano and colleagues, but was still an overall positive effect. This smaller effect size is most likely due to a much smaller sample size and a somewhat different approach to meta-analysis. In this study, a very specific definition to operationalize generating and testing hypotheses was used. Studies that did not fit into this definition were excluded—which, along with a narrower time frame (1998-2008) for the published studies, resulted in a relatively small sample of studies. Also, where appropriate (e.g., in two-group studies), the effect sizes for included articles were adjusted for the nested nature of students within a classroom. This adjustment addresses issues of subject non-independence, and results in a smaller effect size than when this adjustment is not made. Marzano et al. (2001) did not report making this adjustment.
Main Points and Recommendations Although this current meta-analysis found a smaller overall effect size, inferences can be made about the effect. Ten of the studies involved an experimental design in which the results of at least one treatment group were compared to the results of one control group. When looked at as a whole, the overall effect size for these 11 studies (g = 0.58) was similar to the effect size reported by Marzano et al. (2001). Experimental design has strong internal validity, which means that a strong argument can be made that the increased student achievement had a causal relationship to the treatments. The other two studies used a one-group design, for which is it not possible to make as strong a causal inference (for example, any effect could have been caused by maturation rather than the treatment). The articles also indicated some trends regarding the effect of these interventions on student achievement. However, it needs to be emphasized that although the treatments in these articles met the strict inclusion guidelines and were versions of generating and testing hypotheses, they were still different interventions (Appendix 9.A briefly outlines the characteristics of the interventions and their relationships to student achievement). Overall, when compared to the students in the control group, students exposed to an intervention based on generating and testing hypotheses
• were better able to transfer knowledge to new situations (Marx et al., 2004; Rivet & Krajcik, 2004; Ward & Lee, 2004),

125
• had a clearer understanding of lesson concepts (Hsu, 2008; Tarhan & Acar, 2007; Tarhan et al., 2008), and
• were better able to make connections between content and other situations (Marx et al., 2004; Rivet & Krajcik, 2004; Ward & Lee, 2004).
In sum, the overall effect sizes found in this update was not as large as the effect size found in Marzano et al. (2001). However, in the recent studies, instructional activities involving generating and testing hypotheses were found to have a greater effect on achievement than did traditional instructional activities. Furthermore, in the most rigorous experimental studies the overall effect was similar to the overall effect reported in CITW. The results of this updated review indicate that generating and testing hypotheses is an effective teaching activity for increasing student achievement.

126
References Bolded references are included in the research review.
Akkus, H., Kadayifçi, H., Atasoy, B., & Geban, Ö. (2003). Effectiveness of instruction based on the constructivist approach on understanding chemical equilibrium concepts. Research in Science and Technological Education, 21, 209-227.
Bottge, B., Rueda, E., & Skivington, M. (2006). Situating math instruction in rich problem-solving contexts: Effects on adolescents with challenging behaviors. Behavioral Disorders, 31(4), 394-407.
Briggs, D. C. (2008) Comments on Slavin: Synthesizing causal inferences. Educational Researcher, 37(1), 15-22.
Chang, K.-E., Sung, Y.-T., & Lin, S.-F. (2006). Computer-assisted learning for mathematical problem solving. Computers and Education, 46(2), 140-151.
Fortus, D., Dershimer, R. C., Krajcik, J., Marx, R. W., & Mamlok-Naaman, R. (2004). Design-based science and student learning. Journal of Research in Science Teaching, 41(10), 1081-1110.
Fund, Z. (2007). The effects of scaffolded computerized science problem-solving on achievement outcomes: A comparative study of support programs. Journal of Computer Assisted Learning, 23(5), 410-424.
Hedges, L. V. (2007). Effect sizes in cluster randomized designs. Journal of Educational and Behavioral Statistics, 32, 341-370.
Hsu, Y.-S. (2008). Learning about seasons in a technologically enhanced environment: The impact of teacher-guided and student-centered instructional approaches on the process of students’ conceptual change. Science Education, 92(2), 320-344.
Marx, R. W., Blumenfeld, P. C., Krajcik, J. S., Fishman, B., Soloway, E., Geier, R., & Revital, T. (2004). Inquiry-based science in the middle grades: Assessment of learning in urban systemic reform. Journal of Research in Science Teaching, 41(10), 1063-1080.
Marzano, R., Pickering, D., & Pollock, J. (2001). Classroom instruction that works: Research-based strategies for increasing student achievement. Alexandria, VA: Association for Supervision and Curriculum Development.
Nwagbo, C. (2006). Effects of two teaching methods on the achievement in and attitude to biology of students of different levels of scientific literacy. International Journal of Educational Research, 45(3), 216-229.
Rivet, A. E., & Krajcik, J. S. (2004). Achieving standards in urban systemic reform: An example of a sixth grade project-based science curriculum. Journal of Research in Science Teaching, 41(7), 669-692.
Roehrig, G., & Garrow, S. (2007). The impact of teacher classroom practices on student achievement during the implementation of a reform-based chemistry curriculum. International Journal of Science Education, 29(14), 1789-1811.

127
Scharfenberg, F.-J., Bogner, F. X., & Klautke, S. (2007). Learning in a gene technology laboratory with educational focus: Results of a teaching unit with authentic experiments. Biochemistry and Molecular Biology Education, 35(1), 28-39.
Schroeder, C. M., Scott, T. P., Tolson, H., Huang, T.-Y., & Lee, Y.-H. (2007). A meta-analysis of national research: Effects of teaching strategies on student achievement in science in the United States. Journal of Research in Science Teaching, 44(10), 1436-1460.
Simons, K. D., & Klein, J. D. (2007). The impact of scaffolding and student achievement levels in a problem-based learning environment. Instructional Science: An International Journal of the Learning Sciences, 35(1), 41-72.
So, W.-M. W., & Kong, S.-C. (2007). Approaches of inquiry learning with multimedia resources in primary classrooms. Journal of Computers in Mathematics and Science Teaching, 26(4), 329-354.
Swaak, J., de Jong, T., & van Joolingen, W. R. (2004). The effects of discovery learning and expository instruction on the acquisition of definitional and intuitive knowledge. Journal of Computer Assisted Learning, 20(4), 225-234.
Tal, T., Krajcik, J.S., Blummenfeld, P.C. (2006) Urban schools’ teaching enacting project-based science. Journal of Research in Science Teaching, 43(7), 722-745.
Tarhan, L., & Acar, B. (2007). Problem-based learning in an eleventh grade chemistry class: Factors affecting cell potential. Research in Science & Technological Education, 25(3), 351-369.
Tarhan, L., Ayar-Kayali, H., Urek, R. O., & Acar, B. (2008). Problem-based learning in 9th grade chemistry class: “Intermolecular forces.” Research in Science Education, 38(3), 285-300.
Ward, J. D., & Lee, C. L. (2004). Teaching strategies for FCS: Student achievement in problem-based learning versus lecture-based instruction. Journal of Family and Consumer Sciences, 96(1), 73-76.
Wolf, S. J., & Fraser, B. J. (2007). Learning environment, attitudes and achievement among middle-school science students using inquiry-based laboratory activities. Research in Science Education, 38(3), 321-341.
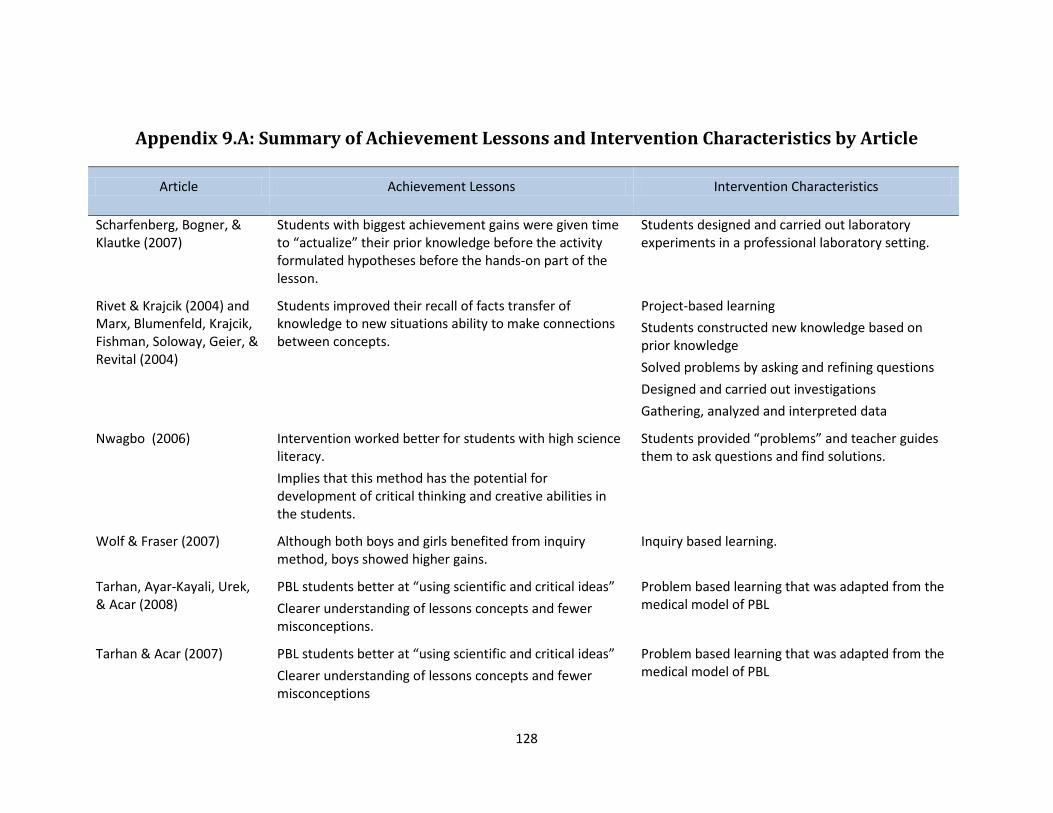
128
Appendix 9.A: Summary of Achievement Lessons and Intervention Characteristics by Article
Article Achievement Lessons Intervention Characteristics
Scharfenberg, Bogner, & Klautke (2007)
Students with biggest achievement gains were given time to “actualize” their prior knowledge before the activity formulated hypotheses before the hands-on part of the lesson.
Students designed and carried out laboratory experiments in a professional laboratory setting.
Rivet & Krajcik (2004) and Marx, Blumenfeld, Krajcik, Fishman, Soloway, Geier, & Revital (2004)
Students improved their recall of facts transfer of knowledge to new situations ability to make connections between concepts.
Project-based learning Students constructed new knowledge based on prior knowledge Solved problems by asking and refining questions Designed and carried out investigations Gathering, analyzed and interpreted data
Nwagbo (2006) Intervention worked better for students with high science literacy. Implies that this method has the potential for development of critical thinking and creative abilities in the students.
Students provided “problems” and teacher guides them to ask questions and find solutions.
Wolf & Fraser (2007) Although both boys and girls benefited from inquiry method, boys showed higher gains.
Inquiry based learning.
Tarhan, Ayar-Kayali, Urek, & Acar (2008)
PBL students better at “using scientific and critical ideas” Clearer understanding of lessons concepts and fewer misconceptions.
Problem based learning that was adapted from the medical model of PBL
Tarhan & Acar (2007) PBL students better at “using scientific and critical ideas” Clearer understanding of lessons concepts and fewer misconceptions
Problem based learning that was adapted from the medical model of PBL

129
Article Achievement Lessons Intervention Characteristics
Hsu (2008) Students taught using TEL approach Clearer understanding of lessons concepts and fewer misconceptions
Technology-enhanced learning (TEL) that includesmodeling – forming hypotheses to explain findings
Fortus, Dershimer, Krajcik, Marx, & Mamlok-Naaman (2004)
Low and high performing student achievement improved. Design Based Science made up of the following steps Identify and define context Background research Develop personal and group ideas Construct 2d and 3d artifacts Feedback
Swaak, de Jong, & van Joolingen (2004)
Traditionally taught students did better with definition based test. Discovery learning students did better on tests examining relational and predictive knowledge.
Discovery Learning that involved Stating hypotheses Making predictions Interpreting data Making inferences
Bottge, Rueda, & Skivington (2006)
Students were able to retain the knowledge directly related to the videoed situations longer than the control group. Students in EAI scored the same on the standardized assessment at the control group.
Enchanted Anchored instruction Uses videos of situations to have students solve problems.
Ward & Lee (2004) Students in PBL were better able to make connections of knowledge to other situations. Students in PBL had better critical thinking skills.
Problem based learning

130
Chapter 10: Cues, Questions, and Advance Organizers
Background and Definitions Student learning is enhanced when teachers understand and capitalize on students’ prior knowledge and preconceptions about the topic (Bransford, Brown, & Cocking, 2000; Mestre, 1994). The strategy of using cues, questions, and advance organizers guides students from the known to the unknown by activating and, as appropriate, re-creating a cognitive framework of familiar concepts in which to incorporate new information. Asking questions and prompting students with cues is a common practice among teachers. One research study indicates that approximately 80% of student-teacher interactions involve cues and questions (Filippone, 1998). However, the type of questioning teachers use may not be the most beneficial to student learning. Student learning may increase when questions are at a higher level and focus on the most important content (Alexander, Kulikowich, & Schulze, 1994; Risner, Nicholson, & Webb, 1994). Thus, research-based recommendations for fine tuning cueing and questioning strategies may have a strong influence on teachers’ ability to effectively guide student learning. Marzano, Pickering, & Pollock (2001) identified three types of cues/questions that, when used together, can provide a rich learning experience for the student:
• Explicit cues are a simple way of activating prior knowledge by providing a preview of to-be-learned information. Often, explicit cues bring to mind a highly relevant personal experience of the student or situations encountered on a regular basis.
• Questions that elicit inferences are important for guiding students in the process of identifying and “filling in” missing information in presented material. Inferences can be about things, people, actions, events, or states of being.
• Analytic questions help students analyze and critique information, thus facilitating a deeper understanding of the content. Examples of some of the processes guided by analytic questions are analyzing errors in reasoning or arguments, constructing support for claims, and analyzing perspectives taken by authors.
Like cues and questions, a common strategy for helping students use their background knowledge to learn new information is to incorporate advance organizers into lessons. Advance organizers are
Trudy Clemons Charles Igel Jessica Allen

131
introduced before a lesson to draw attention to important points, identify relationships within the material, and relate material to students’ prior knowledge (Lefrancois, 1997; Woolfolk, 2004). The most effective advance organizers provide an organized conceptual framework that is meaningful to the learner and that allows the learner to relate concepts in the instructional material to elements of that framework (Martorella, 1991; White & Tisher, 1986). Marzano et al. (2001) identified four types advance organizers:
• Expository advance organizers present new content • Narrative advance organizers present information in a story format • Skimming can be used as an advance organizer when students scan material before reading. • Graphic/illustrative advance organizers use non-linguistic representations to introduce
students to new material. One format may be more powerful than others depending on the material to be learned and the method of presentation. Across all content areas of outcome measures, Marzano et al. (2001) found that expository advance organizers showed the strongest overall effect size. Cues and questioning strategies and the use of advance organizers can have positive impacts on student achievement when used to help students identify the important materials and make connections to prior knowledge. Marzano et al. (2001) reported an average effect size of 0.59 when combining studies on cues, questions, and advance organizers.
Methods
Literature Search Bibliographic databases in both education and psychology (e.g., Education Resources Information Center, Education: A SAGE Full Text Collection, Professional Development Collection, PsycInfo, and JSTOR) were searched using achievement and learning as the outcome keywords crossed with each strategy key words: questioning, analytic questioning, elaborative interrogation, cues, cueing, and advance organizer. Author searchers were then conducted based on citations in the included studies. Searches continued until results repeatedly contained duplicate hits.
Article Sampling A search was conducted for primary research literature that tested the effect of questioning/cueing strategies or advance organizers on student achievement, and met relevance criteria including inclusion of a K-12 student sample, inclusion of an achievement measure as an outcome, and publication from 1998–2008. A complete description of methodological criteria is available in Chapter 1. Two studies met these criteria for the topic of questioning/cueing, and four met the criteria for advance organizers. The majority of excluded studies did not include K-12 students or did not provide sufficient data to include in meta-analysis. The research design, samples of students, and intervention and outcome measures of the included studies are described in Table 10.1 for questioning/cueing and Table 10.2 for advance organizers. Publication years for all selected studies across the topics range from 2004 to 2007. Two of the studies were conducted within the U.S.; the remaining four studies conducted with student samples

132
in Australia, China, England, and Germany. All but one study used experimental or quasi-experimental designs; the remaining article used a one-group pre-/post-design in two separate studies. Because they are independent, these two samples contributed separately to the meta-analysis and are reported separately in the results. The six studies tested only elementary and middle school samples; therefore, generalizations to high school populations should not be made. Similarly, identified studies used only language arts and mathematics classrooms. A variety of instructional strategies with the domains of cues/questions and advance organizers were tested and are provided in Tables 10.1 and 10.2 respectively. As can be seen in Table 10.1, two studies examining cues or questions met the criteria for inclusion in the analysis. Cues and questions are grouped together because the two instructional strategies function in a similar manner. Cues are essentially “hints” to students about the content of the lesson and provide information on what the students already know as well as some new information on the topic (Marzano et al., 2001). Thus, providing a cue activates the students’ prior knowledge and gives them an idea of what to expect during the learning experience. Questions perform the same function; specifically, they allow students to access previously learned information on the topic and assess what they do not already know. As can be seen in Table 10.2, four studies on advance organizers met the inclusion criteria for the current study. Advance organizers are closely related to cues and questions. However, in accordance with Marzano et al., (2001), they are analyzed separately because they are associated with slightly different generalizations. Of these five studies, three of the studies used schematic diagrams/maps (Jitendra et al., 2004; Nash & Snowling, 2006), one used pictorial advance organizers (Wilbersched & Berman, 2004), and one used worked examples (Chung & Tam, 2005). The use of worked examples (an example of showing students what success looks like) involved teacher demonstration, prompts to visualize, and steps to problem solving, which provided students with a new schema for the new types of problems.

133
Table 10.1: Studies Included in the Cues and Questioning Meta-analysis
Study Research Design
Grade Level
Number of Students
Content Area Location Instructional
Strategy Outcome
Measure(s)
Hay, Gordon, Fielding-Barnsley, Homel, & Freiberg (2007)
QED Elementary 116 Language arts (Reading)
Australia Teacher questioning 1) Burt Word Reading Test
Souvignier & Kronenberger (2007)
RCT Elementary 141 Math Germany Student question training
1) Achievement test
Note: RCT – randomized controlled trial; QED – quasi-experimental design Table 10.2: Studies Included in the Advance Organizers Meta-analysis
Study Research Design
Grade Level
No of Students
Content Area Location Instructional
Strategy Outcome
Measure(s)
Chung & Tam (2005) RCT Elementary & Middle
30 Language arts
China Worked examples 1) Word Problems
Jitendra, Griffin, Deatline-Buchman, & Sczesniak (2007)
One-group pre- and post-test a
Elementary 38 Math U.S. Schema-based instruction
1) Problem Solving 2) Computation
Nash & Snowling (2006)
RCT Elementary 71 Language arts
England Context vocabulary program
1) Vocabulary and passage comprehension
Wilbersched & Berman (2004)
RCT
b
Elementary 35 Language arts
a U.S. Pictorial representation of concepts
1) Foreign Language Comprehension
a The Jitendra et al. (2007) article included 2 studies on two independent samples in different parts of the U.S. Therefore, the two studies were analyzed separately due to the assumption of independence. b
Note: RCT – randomized controlled trial
The sample size for Wilbershed & Berman (2004) was not directly reported in the article. Therefore, the sample size was inferred from the degrees of freedom for independent sample t-tests.

134
Other Meta-Analyses After the publication of CITW (2001), two meta-analyses focusing on questioning strategies were published, specifically in science instruction (Schroeder, Scott, Tolson, Huang, & Lee, 2007) and in reading comprehension (Sencibaugh, 2007). Schroeder et al. (2007) examined 61 studies, published between 1980 and 2004, that used science teaching strategies in K-12 as an independent variable. For all of these studies, student achievement was used as the dependent variable. Several instructional strategies were analyzed, including questioning strategies, defined by Schroeder et al. as “Teachers vary timing, positioning, or cognitive levels of questions (e.g., increasing wait time, adding pauses at key student-response points, including more high-cognitive-level questions, stopping visual media at key points and asking questions, posing comprehension questions to students at the start of a lesson or assignment)” (p.1445). An effect size of 0.74 was reported for questioning strategies. In a review of 15 studies, Sencibaugh (2007), examined the effect of visually dependent strategies and auditory/language dependent strategies. Auditory/language dependent strategies were defined as strategies that involved “language usage in either pre-reading activities or post-reading exercises to assist in comprehension” (p. 12). Included in the auditory/language dependent strategies were questioning strategies. An overall effect size of 1.18 was reported for auditory/language dependent strategies. Effect sizes for studies that focused on questioning strategies in particular ranged from 1.16 to 1.72. Consistent with the findings from Marzano et al. (2001), both of these studies reported strong effect effects for questioning strategies.
Results
Meta-Analysis of Articles in Sample As reviewed in Chapter 1, a random effects model was used to estimate a composite effect size for the studies identified for the primary analysis. To maintain consistency of measurement across all studies, Hedges’ g was calculated for each study separately. Results were adjusted for studies exhibiting a mismatch between study design and analysis using a statistical adjustment where necessary. Results were then synthesized using an inverse variance weight �𝟏𝟏 𝒘𝒘𝒊𝒊� � that assigned relatively more influence to those studies containing less variance. The results from these calculations and final analysis are presented in Table 10.3 for cues and questioning and Table 10.4 for advance organizers. When individual studies presented multiple outcomes measures within the same sample, these measures were combined into a single effect size for that study—a commonly accepted meta-analytic practice for non-independent measures (Borenstein, Hedges, Higgins, & Rothstein, 2009). When a study presented multiple outcome measures with different, independent samples, these measures are reported separately. This was the case with only one of the included studies and is noted by sub-setting the study’s name (Jitendra et al., 2007). In addition to the individual effects, the relative weight and 95% confidence interval around each study are also presented. Due to the small number of studies identified across cues/questioning and advance organizers, results from these meta-analyses should be interpreted with caution. Cues & Questioning
Of the two studies identified for cues and questioning, one estimated a positive effect and one estimated a small but negative effect. It is worth noting that this negative effect was statistically
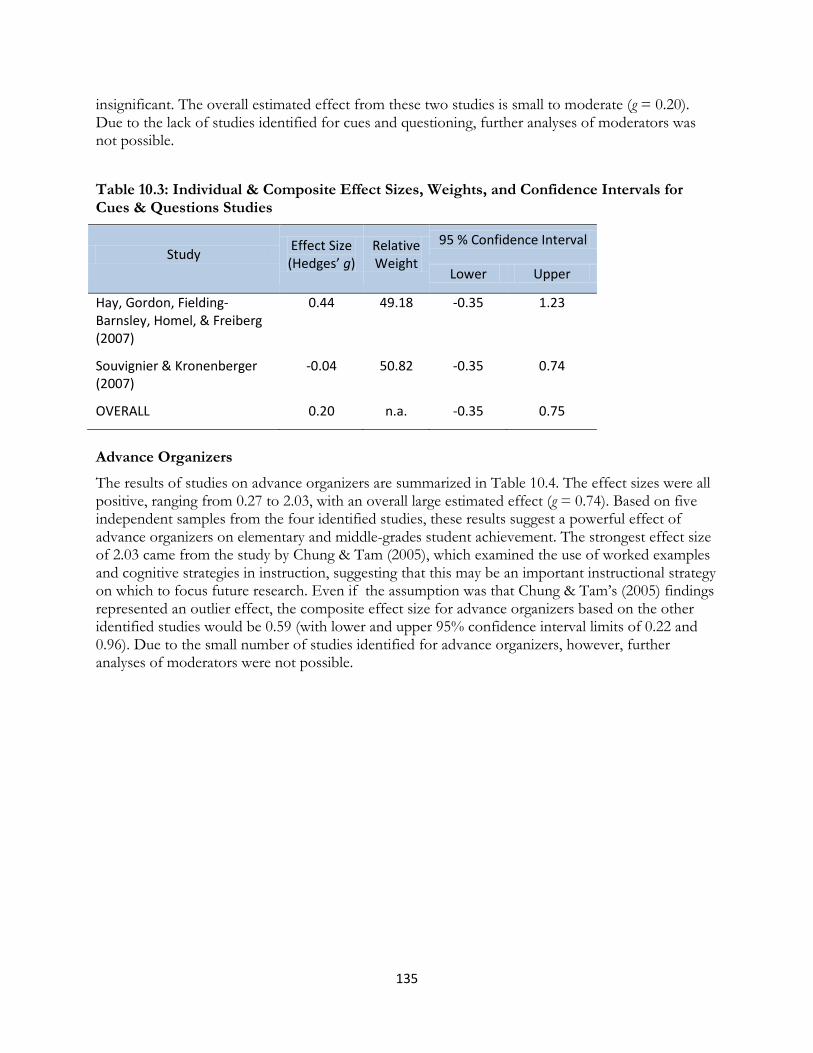
135
insignificant. The overall estimated effect from these two studies is small to moderate (g = 0.20). Due to the lack of studies identified for cues and questioning, further analyses of moderators was not possible.
Table 10.3: Individual & Composite Effect Sizes, Weights, and Confidence Intervals for Cues & Questions Studies
Study Effect Size (Hedges’ g)
Relative Weight
95 % Confidence Interval
Lower Upper
Hay, Gordon, Fielding-Barnsley, Homel, & Freiberg (2007)
0.44 49.18 -0.35 1.23
Souvignier & Kronenberger (2007)
-0.04 50.82 -0.35 0.74
OVERALL 0.20 n.a. -0.35 0.75
Advance Organizers
The results of studies on advance organizers are summarized in Table 10.4. The effect sizes were all positive, ranging from 0.27 to 2.03, with an overall large estimated effect (g = 0.74). Based on five independent samples from the four identified studies, these results suggest a powerful effect of advance organizers on elementary and middle-grades student achievement. The strongest effect size of 2.03 came from the study by Chung & Tam (2005), which examined the use of worked examples and cognitive strategies in instruction, suggesting that this may be an important instructional strategy on which to focus future research. Even if the assumption was that Chung & Tam’s (2005) findings represented an outlier effect, the composite effect size for advance organizers based on the other identified studies would be 0.59 (with lower and upper 95% confidence interval limits of 0.22 and 0.96). Due to the small number of studies identified for advance organizers, however, further analyses of moderators were not possible.

136
Table 10.4: Individual & Composite Effect Sizes, Weights, and Confidence Intervals for Advance Organizers
Study Effect Size (Hedges’ g)
Relative Weight
95 % Confidence Interval
Lower Upper
Chung & Tam (2005) 2.03 9.29 0.96 3.10
Jitendra (2007) – Study 1 1.49 15.40 0.85 2.14
Jitendra (2007) – Study 2 0.40 22.62 0.13 0.66
Nash & Snowling (2006) 0.27 13.14 -0.51 1.05
Wilbersched & Berman (2004)
1.01 14.65 0.96 1.70
OVERALL 0.74 n.a. 0.33 1.16
Connecting New Research Information to Original CITW Findings All of the articles included in the current analysis reported positive effects for advance organizers. However, there were only two articles found on cues and questioning, and only one showed positive effects. This indicates that the current literature still supports the original claim that the use of advance organizers is an effective instructional technique; however, with the limited number of recent studies found on cues and questioning, it is difficult to make claims as to the effectiveness of these strategies. Marzano et al. (2001) reported an overall effect size of 0.59, combining both techniques into a single effect. For this revision, the two strategies were separated because they contain enough distinctive characteristics to warrant separate analyses and discussion. The overall effect size of the meta-analysis conducted for this study was similar for advance organizers (g = 0.74) and considerably smaller for cues and questioning strategies (g = 0.20) than the effect reported by Marzano et al. (2001). This smaller effect for the cues and questioning strategy may be the result of more conservative methodology, resulting in fewer studies to be analyzed. The current meta-analysis used a very specific definition to operationalize the two strategies. Studies that did not fit into this definition were excluded. Also, only studies with an ability to control for alternative hypotheses were included, resulting in relatively small sample sizes. Where appropriate the effect sizes for included articles were adjusted for the nested nature of students within a classroom. This adjustment addressed issues of subject non-independence, and resulted in a smaller effect size than when this adjustment is not made. Marzano et al. (2001) did not report making this adjustment. These topics are described more fully in Chapter 1.

137
Main Points and Recommendations Marzano et al. (2001) provided evidence for the efficacy of cues, questions, and advance organizers for improving student achievement. In general, the results of the present analysis showed support for maintaining that assertion. However, while the strongest effect reported in CITW (2001) for this category of strategies was for explicit cueing, the present analysis supports advance organizers as the more promising instructional strategy—and certainly as the strategy that has been studied more in recent years. In general, it seems that strategies that help students activate existing knowledge and prepare a cognitive framework for new information increases their ability to assimilate new knowledge in a variety of academic content areas. While advance organizers showed a powerful effect on learning, this strategy can take several different forms. It may be useful to conduct more fine-grained studies on the different types of advance organizers to understand which processes are more effective than others. It should also be noted that all of the reported studies in the current analysis involve elementary and/or middle school students. Thus, future research efforts should focus on the efficacy of these instructional strategies for improving achievement in high school.
138
References Bolded references are included in the research review.
Alexander, P. A., Kulikowich, J. M., & Schulze, S. K. (1994). How subject-matter knowledge affects recall and interest. American Educational Research Journal, 31(2), 313-337.
Borenstein, M., Hedges, L. V., Higgins, J. P. T., & Rothstein, H. (2009). Introduction to meta-analysis. West Sussex, UK: John Wiley and Sons, Ltd.
Bransford, J., Brown, A., & Cocking, R. (2000). How people learn: Brain, mind, experience, and school. Washington, DC: National Academy Press.
Brookbank, D., Grover, S., Kullberg, K., & Strawser, C. (1999). Improving student achievement through organization of student learning. Chicago: Master’s Action Research Project, Saint Xavier University and IRI/Skylight.
Chung, K. K. H. & Tam, Y. H. (2005). Effects of cognitive-based instruction on mathematical problem solving by learners with mild disabilities. Journal of Intellectual and Developmental Disability, 30, 207-216.
Filippone, M.(1998). Questioning at the elementary level (ED417431). (Master’s thesis, Kean University). Retreived from ERIC database: www.eric.ed.gov
Hay, I., Gordon, E., Fielding-Barnsley, R. Homel, R., & Freiberg, K. (2007). Language delays, reading delays, and learning difficulties. Journal of Learning Disabilities, 40, 400-409.
Jitendra, A. K., Griffin, C., Deatline-Buchman, A., & Sczesniak, E. (2007). Mathematical word problem solving in third grade classrooms. Journal of Educational Research, 100(5), 283-302.
Lefancios, G. R. (1997). Psychology for Teaching (9th
Martorella, P. H. (1991). Knowledge and concept development in social studies. In J. P. Shaver (Ed.), Handbook of research on social studies teaching and learning (pp. 370-399). New York: McMillan.
ed.). Belmont: CA: Wadsworth.
Marzano, R., Pickering, D., & Pollock, J. (2001). Classroom instruction that works: Research-based strategies for increasing student achievement. Alexandria, VA: Association for Supervision and Curriculum Development.
Mestre, J. P. (1994). Cognitive aspects of learning and teaching science. In S. J. Fitzimmons & L. C. Kerpelman (Eds.), Teacher enhancements for elementary and secondary science and mathematics status, issues, and problems (pp. 3.1-3.53). Arlington, VA: National Science Foundation.
Nash, H. M., & Snowling, M. J. (2006). Teaching new words to children with poor existing vocabulary knowledge: A controlled evaluation of the definition and context methods. International Journal of Language and Communication Disorders, 41(3), 335-354.
Risner, G. P., Nicholson, J. I. & Webb, B. (1994). Levels of comprehension promoted by the Cooperative Integrated Reading and Composition (CIRC) Program. Florence, AL: University of North Alabama.

139
Schroeder, C. M., Scott, T. P., Tolson, H., Haung, T., & Lee, Y. (2007). A meta-analysis of national research: Effects of teaching strategies on student achievement in science in the United States. Journal of Research in Science Teaching, 44(10), 1436-1460.
Sencibaugh, J. M. (2007). Meta-analysis of reading comprehension for students with learning disabilities: Strategies and implications. Reading Improvement, 44(1), 6-22.
Souvignier, E. & Kronenberger, J. (2007). Cooperative learning in third graders’ jigsaw groups for mathematics and science with and without questioning training. British Journal of Educational Psychology, 77, 755-771.
White, R. T. & Tisher, R. P. (1986). Research on natural sciences. In M. C. Wittrock (Ed.), Handbook of research on teaching (pp. 874-905). New York: McMillan.
Wilbersched, L. & Berman, P. M. (2004). Effect of using photos from authentic video as advance organizers on listening comprehension in an FLES Chinese class. Foreign Language Annals, 34, 534-542.
Woolfolk, A. (2004). Educational psychology. Boston: Pearson.