classifying acute food insecurity using the household
TRANSCRIPT

Classifying Acute Food Insecurity Using the Household Hunger Scale: Evidence from Three Countries 1
A FEINSTEIN INTERNATIONAL CENTER PUBLICATION
Classifying Acute Food Insecurity Using the Household Hunger ScaleEvidence from Three CountriesDaniel Maxwell, Peter Hailey, Matthew Day, Guhad Adan, Joyce Maxwell, Stephen B.J. Odhiambo, Aishwarya Venkat, Lilian Kaindi, and James Njiru
JUNE 2020

fic.tufts.edu2
Copyright 2020 Tufts University, all rights reserved. “Tufts University” is a registered trademark and may not be reproduced apart from its inclusion in this work without permission from its owner.
Feinstein International Center, Friedman School of Nutrition Science and PolicyTufts University75 Kneeland Street, 8th FloorBoston, MA 02111 USATel: +1 617.627.3423Twitter: @FeinsteinIntCenfic.tufts.edu
Cover photo: Joyce Maxwell
Citation: Maxwell, Daniel, Peter Hailey, Matthew Day, Guhad Adan, Joyce Maxwell, Stephen B.J. Odhiam-bo, Aishwarya Venkat, Lilian Kaindi, and James Njiru. “Classifying Acute Food Insecurity Using the House-hold Hunger Scale: Evidence from Three Countries.” Boston: Feinstein International Center, Tufts University, 2020.
Corresponding author: Daniel Maxwell
Corresponding author email: [email protected]
Photographs: Joyce Maxwell

Classifying Acute Food Insecurity Using the Household Hunger Scale: Evidence from Three Countries 3
Disclaimer and AcknowledgementsThis study was undertaken under the auspices of the Centre for Humanitari-an Change (CHC), in collaboration with several other agencies, including the REACH Initiative and Action Against Hunger. The study was undertaken when one of the lead authors (Maxwell) was on sabbatical leave with CHC (Hailey). Many other members of staff from all the collaborating agencies were helpful in enabling the study, including Katie Rickard, Nadia Lehmann, William Yak, Dut Akuei, and Khemis Moses (REACH); Ellyn Yakowenko and Imelda Awino (Action Against Hunger); and Erin McCloskey and Leah Mugo (CHC).
Funding for the study came from Action Against Hunger, REACH, and the Glob-al Support Unit of the Integrated Food Security Phase Classification (hosted by FAO). The team is grateful for both financial and logistical support on the ground.
The team is grateful for feedback on an earlier draft from (in alphabetical order) Oleg Bilukha, Sophie Chotard, Merry Fitzpatrick, Laura Glaeser, Jose Lo-pez, Chris Newton, Vanessa Roy, Peter Thomas, Kamau Wanjohi, and Ellyn Ya-kowenko. We are grateful to Anastasia Marshak for consultation on the quanti-tative analysis and to Joyce Maxwell for copy editing the final draft report.
The views expressed here do not necessarily reflect the views of any of the supporting agencies, Tufts University, or the Centre for Humanitarian Change. The views expressed here are solely those of the authors, who are responsible for all errors and omissions.
The Authors June 2020

fic.tufts.edu4
Classifying Acute Food Insecurity Using the Household Hunger Scale: Evidence from Three Countries 5
ContentsDisclaimer and Acknowledgements 3
Problem statement 6
Methods 7Definitions for household classification (IPC) 7
Results 9
Statistical analysis 11Chi-square test 11
Regression analysis 11
Sensitivity and specificity analysis 12
Addressing the P4/P5 divide 13
Qualitative re-classification of borderline P4/P5 households 14
Quantitative re-classification of borderline P4/P5 households 16
Revised sensitivity and specificity analysis 16
Discussion: Improving the classification of households in P4 and P5 18Suggested improvements 18
Reducing over-classification errors 18
Reducing under-classification errors 19
Reducing errors more generally: Enhanced training 20
Other suggested improvements 22
Conclusion 24
References 25
Annex 1. Results tables by case study 26
Annex 2: Interview guide (field household interviews) 30
Annex 3: The Household Hunger Scale (HHS) 33
Annex 4: Qualitative analysis coding tree 34
Annex 5: Quantitative and qualitative reclassification results 35

fic.tufts.edu6
Problem statementThe currently accepted means of categorizing house-hold food insecurity and identifying famine or famine risk is the Integrated Food Security Phase Classifica-tion (IPC) tool. IPC has been instituted in one form or another in nearly forty countries, including its ad-aptation as Cadre Harmonisé in West Africa. While it has helped the humanitarian community make great strides in assessing food security crises and in allocating resources impartially, recent IPC analyses in countries at risk of famine have had difficulty in particular areas. One of these is the classification of households in Phase 5 (i.e., households in catastro-phe or “famine” conditions, but not in sufficient numbers to make an area determination of famine).1 How such households are characterized or identified is frequently problematic. Currently, while corrob-orating indicators help classify households in the lower phases of IPC analysis, the only means of iden-tifying households in Phase 5 (differentiating them from Phase 4, or “emergency”) in the IPC Acute Food Insecurity (AFI) Reference Table, is the Household Hunger Scale (HHS). This has led to the inadvertent politicization of the use of HHS and the frequent questioning of its validity (Maxwell et al. 2018).
HHS was not suggested for Phase 5 classification as a stand-alone indicator, nor was there any pre-con-
1 The definitions of households in IPC Phase 4 or 5 include malnutrition and mortality, but not in a clearly defined way. In terms of actual data, malnutrition is only expressed in terms of population prevalence and mor-tality is only expressed in rate per 10,000 population per day—measures of malnutrition and mortality can’t be applied at the household level.
ceived assumption that HHS was all that was needed to differentiate between Phases 4 and 5. Instead, a study of how the food consumption outcome indi-cators included in the AFI Reference Table align with one another and with the various phase descriptions concluded that HHS was the “anchor” indicator for other household food consumption indicators used in IPC analysis (Vaitla et al. 2015). HHS appeared to be relatively more sensitive in more severe contexts than were the other indicators included to represent the outcome of food consumption—and thus the most likely of being able to distinguish P4 and P5 households. It should be noted that the indicator has never been field tested to be able to do this—that was the purpose of this study.
The HHS has not been field tested against any “gold standard”—simply because there is no gold standard for these indicators. The study on household food consumption indicators (Vaitla et al. 2015) examined empirically how various indicators aligned with each other, but there was (and remains) no gold standard against which to test these. In order to field-check the validity of the HHS, this study was designed as a collaborative effort with surveys that would include the HHS—and then follow up with in-depth inter-views of households identified by HHS as being in IPC Phase 4 or Phase 5. This study was designed to do this field-checking and suggest additional mea-sures needed to help cross check the household classification.

Classifying Acute Food Insecurity Using the Household Hunger Scale: Evidence from Three Countries 7
The objectives of the research were to identify households in IPC Phases 4 and 5 and to determine how well the Household Hunger Scale (HHS) is able to differentiate households in these two phases. To do this, the team needed to find households that might fall within these two phases. This was intend-ed to be done in two different ways. One was to work with existing surveys (SMART surveys in this case). The survey could identify the households because HHS is included in the questionnaire. When such households were identified, the research team would be immediately notified and would follow up with an in-depth interview (interview guide is in Annex 2). However this turned out to be a very inefficient means of identifying households in Phases 4 and 5 and, in the end, it was only possible to collabo-rate with a SMART survey in one out of seven field locations. So a second method, the “active case identification” method, was also followed—and was used for all of the cases identified in the study (the SMART survey only identified a small handful of cases in locations that the team could reach in good time).
In the active case identification method, areas for the assessment were identified by early warning information, mass screening data, or other informa-tion as available (REACH Area of Knowledge data in South Sudan for example, NDMA surveillance site data in Kenya, FSNAU assessment data in Somalia). This allowed the team to identify settlements in the study area that appeared to be the hardest hit by current shocks or seasonal trends. Permission was sought from the appropriate local authorities in those areas to conduct the assessment. Local guides were identified to help the team identify the hard-est-hit households within those communities. These guides were community health volunteers in Kenya and knowledgeable local elders or other community representatives in Somalia and South Sudan.
All household respondents were read a voluntary consent statement to which they agreed before the interview proceeded. The voluntary consent and the research protocol were reviewed by the Ethics and Scientific Review Committee of AMREF and ethi-
Methodscal clearance granted for Kenya. For South Sudan, clearance was granted to REACH by the South Sudan Relief and Rehabilitation Commission (SSRRC). And for Somalia clearance was granted by local authori-ties in Somaliland and South Central State.
Households were interviewed according to the inter-view guide in Annex 2. The categories for discussion with the households included household demo-graphics, livelihoods, food access, water access, coping, malnutrition, mortality, health, and resilience. Children under the age of five years and pregnant and lactating mothers were measured for nutritional status by MUAC (mid-upper arm circumference). The HHS module (as it would appear in a SMART survey or a Food Security and Nutrition Monitoring Survey) was inserted into the end of the food-access questions.
At the end of each day of field work, the full team met to review the results of the interviews conduct-ed that day, analyzing each household in detail to classify the household by phase according to the definitions in the IPC Technical Manual Version 3.0 (IPC Partners 2019). Household Hunger Scale ques-tions were also reviewed, and an HHS score for each household was calculated. (The HHS module is in Annex 3.) The comparison between the assessed IPC phase classification (as judged by the research team according to the definitions in the IPC guidelines) and the HHS score for each household is the central analysis of this study.
Definitions for household classification (IPC)
The IPC Manual, Version 3.0 (IPC Partners 2019) defines IPC Phases 3, 4, and 5 as follows:
Phase 3: Households either “have food consump-tion gaps which are reflected by high or above usual acute malnutrition” or “are marginally able to meet minimum food needs but only by depleting essential livelihood assets or through crisis coping strategies.”
fic.tufts.edu8
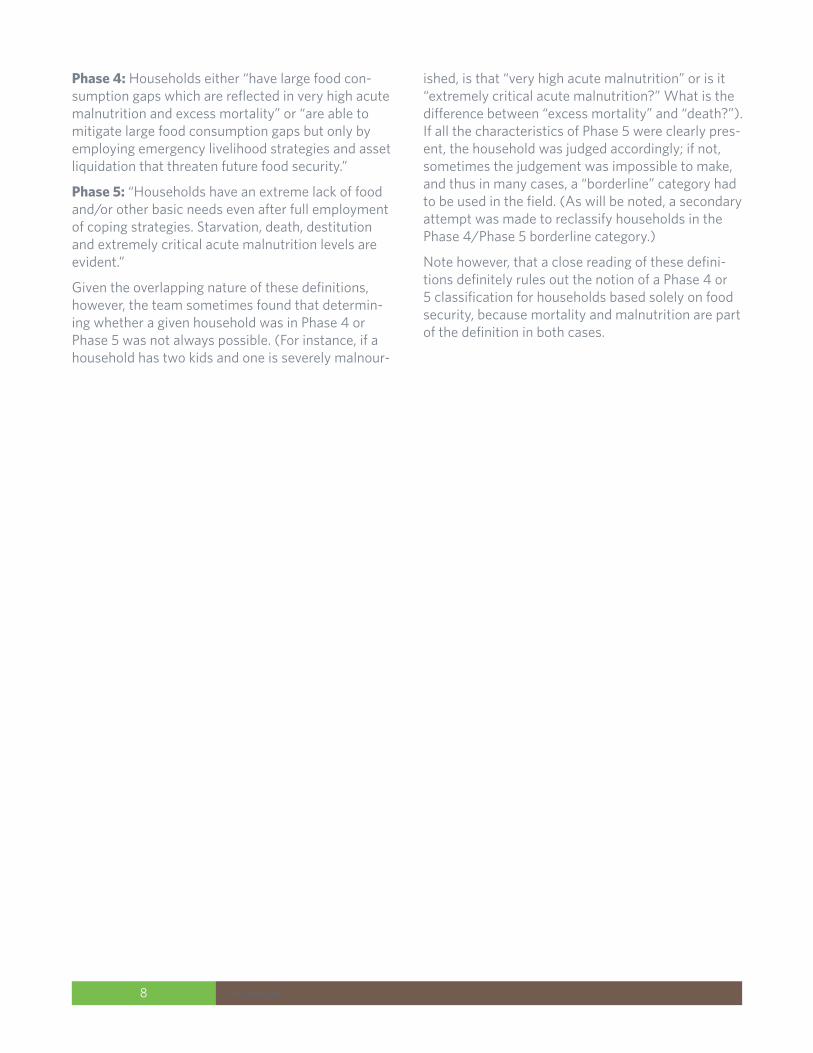
Phase 4: Households either “have large food con-sumption gaps which are reflected in very high acute malnutrition and excess mortality” or “are able to mitigate large food consumption gaps but only by employing emergency livelihood strategies and asset liquidation that threaten future food security.”
Phase 5: “Households have an extreme lack of food and/or other basic needs even after full employment of coping strategies. Starvation, death, destitution and extremely critical acute malnutrition levels are evident.”
Given the overlapping nature of these definitions, however, the team sometimes found that determin-ing whether a given household was in Phase 4 or Phase 5 was not always possible. (For instance, if a household has two kids and one is severely malnour-
ished, is that “very high acute malnutrition” or is it “extremely critical acute malnutrition?” What is the difference between “excess mortality” and “death?”). If all the characteristics of Phase 5 were clearly pres-ent, the household was judged accordingly; if not, sometimes the judgement was impossible to make, and thus in many cases, a “borderline” category had to be used in the field. (As will be noted, a secondary attempt was made to reclassify households in the Phase 4/Phase 5 borderline category.)
Note however, that a close reading of these defini-tions definitely rules out the notion of a Phase 4 or 5 classification for households based solely on food security, because mortality and malnutrition are part of the definition in both cases.
Classifying Acute Food Insecurity Using the Household Hunger Scale: Evidence from Three Countries 9
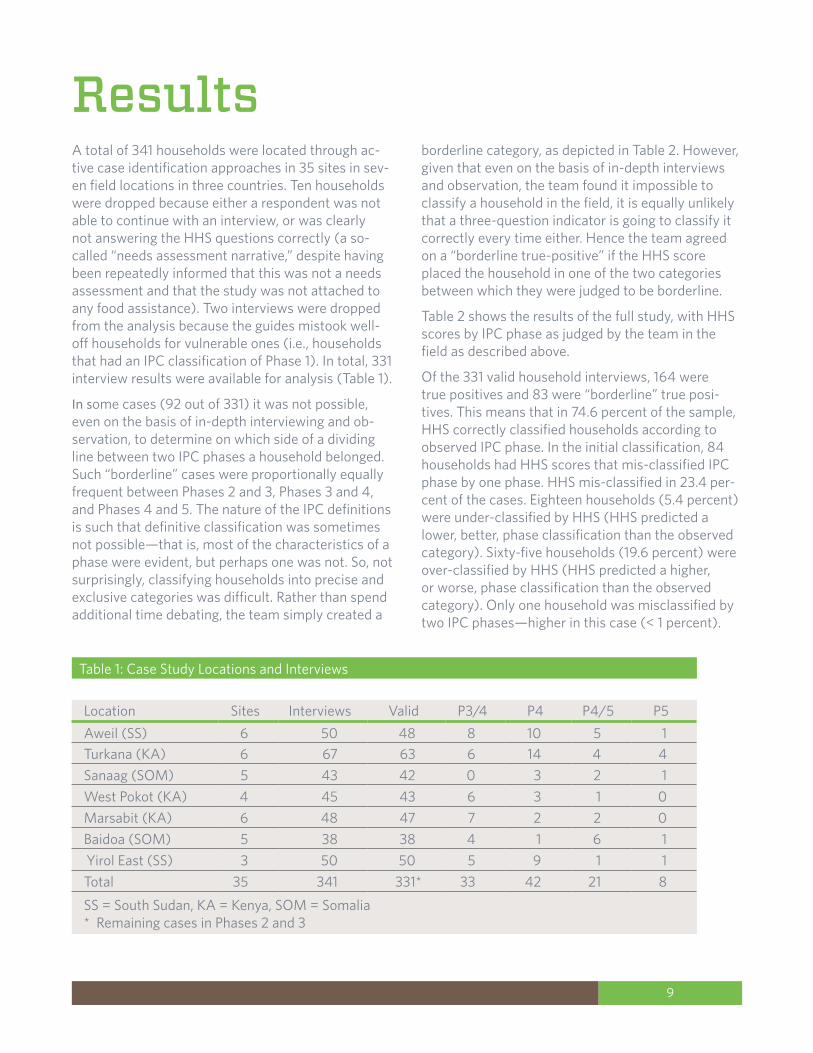
borderline category, as depicted in Table 2. However, given that even on the basis of in-depth interviews and observation, the team found it impossible to classify a household in the field, it is equally unlikely that a three-question indicator is going to classify it correctly every time either. Hence the team agreed on a “borderline true-positive” if the HHS score placed the household in one of the two categories between which they were judged to be borderline.
Table 2 shows the results of the full study, with HHS scores by IPC phase as judged by the team in the field as described above.
Of the 331 valid household interviews, 164 were true positives and 83 were “borderline” true posi-tives. This means that in 74.6 percent of the sample, HHS correctly classified households according to observed IPC phase. In the initial classification, 84 households had HHS scores that mis-classified IPC phase by one phase. HHS mis-classified in 23.4 per-cent of the cases. Eighteen households (5.4 percent) were under-classified by HHS (HHS predicted a lower, better, phase classification than the observed category). Sixty-five households (19.6 percent) were over-classified by HHS (HHS predicted a higher, or worse, phase classification than the observed category). Only one household was misclassified by two IPC phases—higher in this case (< 1 percent).
A total of 341 households were located through ac-tive case identification approaches in 35 sites in sev-en field locations in three countries. Ten households were dropped because either a respondent was not able to continue with an interview, or was clearly not answering the HHS questions correctly (a so-called “needs assessment narrative,” despite having been repeatedly informed that this was not a needs assessment and that the study was not attached to any food assistance). Two interviews were dropped from the analysis because the guides mistook well-off households for vulnerable ones (i.e., households that had an IPC classification of Phase 1). In total, 331 interview results were available for analysis (Table 1).
In some cases (92 out of 331) it was not possible, even on the basis of in-depth interviewing and ob-servation, to determine on which side of a dividing line between two IPC phases a household belonged. Such “borderline” cases were proportionally equally frequent between Phases 2 and 3, Phases 3 and 4, and Phases 4 and 5. The nature of the IPC definitions is such that definitive classification was sometimes not possible—that is, most of the characteristics of a phase were evident, but perhaps one was not. So, not surprisingly, classifying households into precise and exclusive categories was difficult. Rather than spend additional time debating, the team simply created a
Results
Table 1: Case Study Locations and Interviews
Location Sites Interviews Valid P3/4 P4 P4/5 P5Aweil (SS) 6 50 48 8 10 5 1Turkana (KA) 6 67 63 6 14 4 4Sanaag (SOM) 5 43 42 0 3 2 1West Pokot (KA) 4 45 43 6 3 1 0Marsabit (KA) 6 48 47 7 2 2 0Baidoa (SOM) 5 38 38 4 1 6 1 Yirol East (SS) 3 50 50 5 9 1 1Total 35 341 331* 33 42 21 8
SS = South Sudan, KA = Kenya, SOM = Somalia * Remaining cases in Phases 2 and 3
fic.tufts.edu10
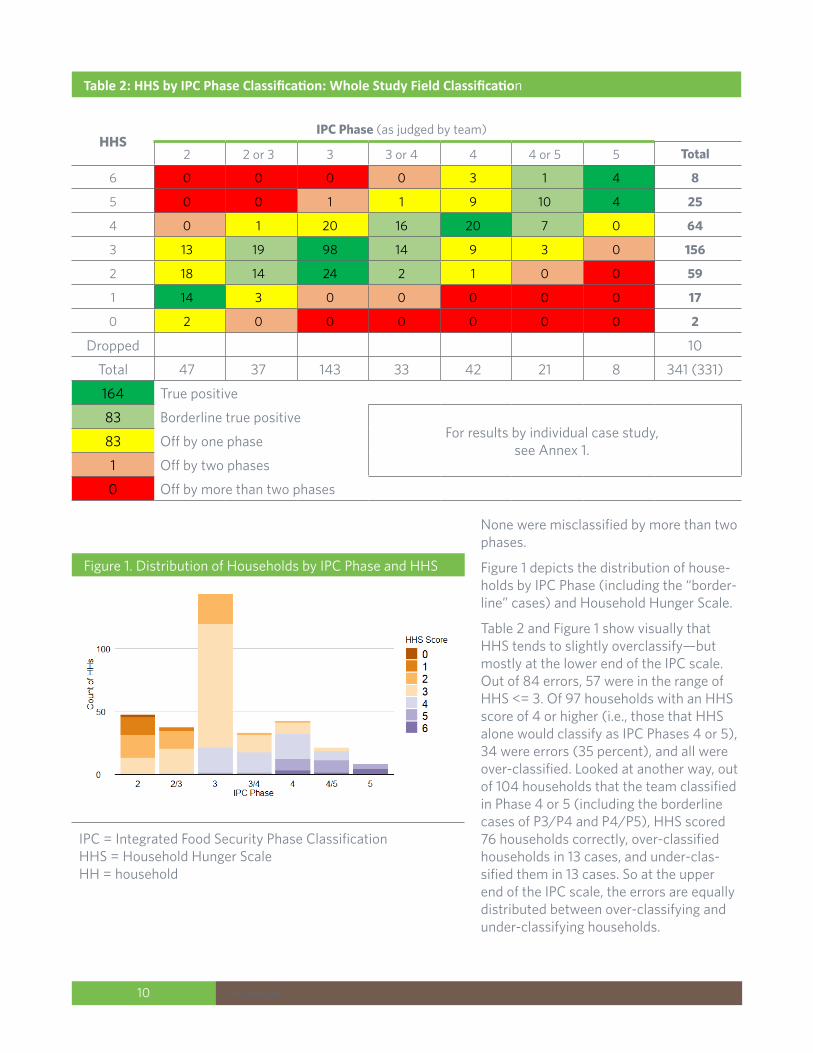
None were misclassified by more than two phases.
Figure 1 depicts the distribution of house-holds by IPC Phase (including the “border-line” cases) and Household Hunger Scale.
Table 2 and Figure 1 show visually that HHS tends to slightly overclassify—but mostly at the lower end of the IPC scale. Out of 84 errors, 57 were in the range of HHS <= 3. Of 97 households with an HHS score of 4 or higher (i.e., those that HHS alone would classify as IPC Phases 4 or 5), 34 were errors (35 percent), and all were over-classified. Looked at another way, out of 104 households that the team classified in Phase 4 or 5 (including the borderline cases of P3/P4 and P4/P5), HHS scored 76 households correctly, over-classified households in 13 cases, and under-clas-sified them in 13 cases. So at the upper end of the IPC scale, the errors are equally distributed between over-classifying and under-classifying households.
Table 2: HHS by IPC Phase Classification: Whole Study Field Classification
HHSIPC Phase (as judged by team)
2 2 or 3 3 3 or 4 4 4 or 5 5 Total
6 0 0 0 0 3 1 4 8
5 0 0 1 1 9 10 4 25
4 0 1 20 16 20 7 0 64
3 13 19 98 14 9 3 0 156
2 18 14 24 2 1 0 0 59
1 14 3 0 0 0 0 0 17
0 2 0 0 0 0 0 0 2
Dropped 10
Total 47 37 143 33 42 21 8 341 (331)
164 True positive
83 Borderline true positiveFor results by individual case study,
see Annex 1.83 Off by one phase
1 Off by two phases
0 Off by more than two phases
Figure 1. Distribution of Households by IPC Phase and HHS
IPC = Integrated Food Security Phase Classification HHS = Household Hunger Scale HH = household

Classifying Acute Food Insecurity Using the Household Hunger Scale: Evidence from Three Countries 11
X2 = 379.85 Df = 42 p < 0.001
Regression analysis
A simple Ordinary Least Squares (OLS) regression of IPC as the dependent variable and HHS as the inde-pendent variable was conducted for all households (Table 3 Model 1). This regression has an adjusted R2 of 0.56, indicating that approximately 56 percent of the overall variance in IPC phase is explained by HHS scores.
The distribution of residuals from this regression is shown in Figure 2. Residuals for IPC 3 and IPC 3/4 are close to zero, indicating that HHS is a strong pre-dictor of IPC phase for these categories. The conclu-sion from this analysis is that HHS and IPC follow the same direction and trend generally, but HHS by itself is not a perfect predictor of IPC phase, particularly at the extreme ends of the IPC scale. Given that the objective here was to differentiate between Phase 4
Statistical tests were applied, including a Chi-square test, regression analyses, and sensitivity/specificity analysis. The sensitivity/specificity tests were com-plicated by the “borderline” category between P4 and P5, necessitating a second attempt to classify those borderline households. Regressions conducted on the two highest “whole” IPC categories (Phase 4 and Phase 5) were used to predict values for the “border-line” category to inform reclassification. Reclassifi-cation was also done by qualitative analysis, coding for Phases 4 and 5, and then recoding the borderline category according to the most salient characteristics identified in Phases 4 and 5 (see below).
Chi-square test
A simple Chi-square test clearly rejects the null hypothesis of no association between HHS and IPC categories (i.e., indicating a statistically significant association)—a statistical test that confirms the relationship visually evident in Table 1.
Statistical analysis
Table 3. Regression Analysis Results
Note: Numbers in the top row in parentheses refer to the regression models run

fic.tufts.edu12
analysis, all P4/P5 borderline cases were all either rounded up or rounded down to assess the effects on IPC classification. This analysis was conducted for the whole dataset (n = 331 households) and for a restricted sample of households with HHS of 4 or greater (n = 97 households).
Rounding up borderline cases. Rounding borderline cases up to the next higher category (borderline 2/3 3; borderline 3/4 4; borderline 4/5 5) would mean that if many, but not all, characteristics of a phase classification are present, that should be the classification (consistent with a “no regrets” approach—i.e., minimizing the likelihood of false
and Phase 5, this suggests the need to include other factors to make a determination of households in Phases 4 and 5.
Sensitivity and specificity analysis
Sensitivity and specificity metrics can help assess the accuracy of a test. In this analysis, the field team’s IPC classification is used as the “gold stan-dard” and the HHS score is used as the test. Given the borderline category, standard sensitivity/spec-ificity analysis was not possible. So in the initial
Figure 2. Distribution of Residuals from Simple OLS Regression
Figure 3. Sensitivity and Specificity Analysis
Source: Wikipedia Free Encyclopedia

Classifying Acute Food Insecurity Using the Household Hunger Scale: Evidence from Three Countries 13
Table 6: Contingency Table (rounding down, whole sample)
IPC = 5 IPC < 5 Total
HHS = 5 or 6 8 25 33
HHS < 5 0 298 298
Total 8 323 331
Sensitivity = 100.00 Specificity = 92.26 Precision = 24.24
Table 7: Contingency Table (rounding down, restricted sample)
IPC = 5 IPC < 5 Total
HHS = 5 or 6 8 25 33
HHS = 4 0 64 64
Total 8 89 97
Sensitivity = 100.00 Specificity = 71.91 Precision = 24.24
These results indicate that rounding to the next low-er IPC phase for borderline households (the “conser-vative” estimate) improves sensitivity but reduces specificity compared to the “no regrets” estimate of IPC phase (rounding up). Note that the precision (predictive value positive) is much lower with the rounded down (conservative) estimates, meaning that this approach is less likely to prevent false positive errors. Higher specificity (associated with rounding up) means the analysis will likely result in more false positives, but less likely to result in the error of false negatives. Sorting these differences out may require contextual knowledge.
Addressing the P4/P5 divide
The real range of interest to this study however is in classifying households in Phase 4 or Phase 5. To fur-
negatives). Table 4 depicts this for the whole sample. Table 5 depicts this for those households scoring HHS 4 or higher.
Table 4: Contingency Table (rounding up, whole sample)
IPC = 5 IPC < 5 Total
HHS = 5 or 6 19 14 33
HHS < 5 10 288 298
Total 29 302 331
Sensitivity = 65.52 Specificity = 95.36 Precision = 57.58
Table 5: Contingency Table (rounding up, restricted sample)
IPC = 5 IPC < 5 Total
HHS = 5 or 6 19 14 33
HHS = 4 7 57 64
Total 26 71 97
Sensitivity = 73.08 Specificity = 80.28 Precision = 57.58
Rounding down borderline cases. Rounding border-line cases down to the next lower category (border-line 2/3 2; borderline 3/4 3; borderline 4/5 4) would suggest that if not all characteristics of a phase classification are present, the next lowest classification should be used (consistent with a more “conservative” approach, i.e., minimizing the like-lihood of a false positive). This is arguably more in line with current IPC practices—at least in terms of distinguishing between Phase 4 and Phase 5, which was the objective here. Table 6 depicts this approach for the whole sample. Table 7 depicts this for those households scoring HHS 4 or higher.

fic.tufts.edu14
4. Zero-sum coping. Whatever choice a caregiver/income earner makes means that something else equally urgent and critical to survival gets ignored. For example, the caregiver is constantly forced to choose between core survival activities on a daily basis because there is not the time or resources to do them all.3 This could include
• having to choose between an income pro-ducing activity like collecting firewood or burning charcoal, and selling stock s/he has already collected (can’t do both on the same day); and/or
• having to choose between fetching water and caring for children, or taking a sick child to the clinic or a malnourished child to the clinic and/or
• livelihood activities that take a mother away from home for many hours and where she must leave a baby in another’s care.
This could also include
• any combination of the above that pits the urgency of livelihood activities against the necessity for caregiving activities.
Having to make these choices also often coin-cides with #1 and #2 above and can occur with or without a specific shock, but when associated with shocks, they are often idiosyncratic—hence a standard “shock module” may have to be altered to capture these.**
5. Literal hand-to-mouth existence or no liveli-hoods/assistance. People are relying on daily activity to obtain food for the current day (i.e., if member doesn’t collect sell tea that day, the household doesn’t eat) or are relying entirely on begging and receive no other assistance (includ-ing kinship support). In this case, “livelihood” would include social connections that enable people to receive some food or other help (or even to beg). So the combination of the lack of an active livelihood, no formal assistance, and poor or limited social connections would be an additional marker.**
6. Signs of extreme weakness or hunger. Beyond the experiences of hunger and food insecurity
3 For more on the notion of “zero-sum coping” see REACH 2019.
ther clarify this problem, rather than simply rounding up or down, the team attempted to reclassify all the cases in the “borderline” Phase 4/Phase 5 catego-ry by both qualitative and quantitative means. The results of reclassification are depicted in Annex 5.
Qualitative re-classification of borderline P4/P5 householdsBy qualitative means, all households that were clas-sified as Phase 4, 4/5, or 5 were selected and coded according to a coding tree developed inductively both from the interview guide and from the contents of the interviews. This coding tree is found in Annex 4. Coded interviews for Phase 4 and Phase 5 were used to determine all the characteristics that differ-entiated these two phases. Then the interviews that were classified Phase 4/5 in the field were re-an-alyzed according to the criteria resulting from the coding of the interviews from households that were clearly classified as Phase 4 or Phase 5.
The following factors were identified as classifying households in Phases 4 and 5, and some combina-tion of these were the confusing factor in the border-line classification of P4/P5. So, in addition to an HHS score of 4–6, these factors were used to re-classify households. The same factors could be used in an actual survey, but would require some slight modifi-cations.2
1. High dependency ratio. Less than or equal to 1 household member with some kind of an ac-tive livelihood activity for every 5 members of a household appeared to be the cut-off.*
2. Woman-headed household that was recently widowed or abandoned. This often coincides with high dependency ratio.**
3. Household split up. Members leave the house-hold or are sent away in search of food or in-come, or children are sent to relatives so they can eat, etc.**
2 One asterisk here identifies the factors that would already be available from other data in a SMART or FSNMS survey. Two asterisks identify factors that may have to be included in an additional module in surveys for households that score 4–6 in a survey. See discus-sion below on a proposed “pop-up” window.

Classifying Acute Food Insecurity Using the Household Hunger Scale: Evidence from Three Countries 15
tion, and in the recent past (past three months), would be a confirmation of Phase 5.*
The resulting “algorithm” for qualitative reclassifi-cation of households that were initially classified as borderline Phase 4/Phase 5 is as follows:
1. If HHS >= 4, and #1 or #2 or #3 above were observed, and at least one of any of #5–8 was observed, household was reclassified P5.
2. If HHS >= 4, and both #7 and #8 were observed, household was reclassified P5.
3. If HHS >= 4, and #4 or #5 or #6, and #7 or #8 were observed, household was reclassified P5.
4. Otherwise households were reclassified Phase 4 (even if HHS was 5 or 6).
The resulting qualitative reclassification of house-holds appears in Table 8. Note that by reclassifying by these means, of households judged by the research team to be in Phase 4 or 5, 15 are over classified (HHS puts these households in a higher classifica-tion than they were classified by field observation); 18 households were under-classified (HHS puts them in a lower classification than field observation).
captured by HHS, if the caregiver is physical-ly weak (lying down and isn’t getting up or is unable to stand), or is clearly exhibiting some other means of coping with extreme hunger, this would be confirmation of Phase 5. (Other means include things like tying a rope or piece of cloth around her waist to stop hunger pangs, extreme reliance on wild foods, or extreme reliance on social networks that are being stretched to ex-tremes. These may be context-specific).**
7. Malnutrition. The presence or absence of acute malnutrition on its own is not a marker for any particular phase classification. Thus malnour-ished kids in the absence of a high HHS score is not necessarily a marker for a household classification of Phase 5 or even 4. Presence of severe acute malnutrition, combined with severe livelihood constraints (as outlined above) and/or food access constraints (i.e., a high HHS score) is confirmation of Phase 5, but in the absence of these factors is likely caused by something else. Multiple malnourished kids would be further confirmation. Multiple malnourished kids and a malnourished caregiver (combined with high HHS) is certainly a marker of Phase 5.*
8. Mortality. Mortality can be caused by lots of factors, but if resulting from hunger or malnutri-
Table 8: HHS by IPC Phase Classification: Reclassification by Qualitative Analysis
HHS
IPC Phase (as judged by team)
2 2 or 3 3 3 or 4 4 5 Total
6 0 0 0 0 3 5 8
5 0 0 1 1 12 11 25
4 0 1 20 16 22 5 64
3 13 19 98 14 11 1 156
2 18 14 24 2 1 0 59
1 14 3 0 0 0 0 17
0 2 0 0 0 0 0 2
Dropped 10
Total 47 37 143 33 49 22 341 (331)

fic.tufts.edu16
Revised sensitivity and specificity analysis The results of the reclassification were then used to retest sensitivity, specificity and precision.
Table 9: Contingency Table (qualitative reclassification, restricted sample)
IPC = 5 IPC < 5 Total
HHS = 5 or 6 15 16 31
HHS = 4 5 35 40
Total 20 51 71
Sensitivity = 75.00 Specificity = 68.63 Precision = 48.39
Table 10: Contingency Table (regression, restricted sample, without manual reclassification)
IPC = 5 IPC < 5 Total
HHS = 5 or 6 14 17 31
HHS < 5 3 37 40
Total 17 54 71
Sensitivity = 82.35 Specificity = 68.52 Precision = 45.16
Table 11: Contingency Table (regression, restricted sample, with manual reclassification)
IPC = 5 IPC < 5 Total
HHS = 5 or 6 16 15 31
HHS < 5 4 36 40
Total 20 51 71
Sensitivity = 80.00 Specificity = 70.59 Precision = 51.61
Quantitative re-classification of borderline P4/P5 householdsAll households classified as Phase 4, 4/5, or 5 were selected and coded according to a coding tree devel-oped both deductively from the interview guide and inductively from the contents of the interviews. This coding tree is found in Annex 4. This coding tree al-lowed the development of quantitative variables (e.g., household size, number of children under age five) and qualitative variables (e.g., binaries for reported coping strategies such as begging and borrowing).
Regression models were then used to predict IPC phase based on coded variables alone. The “training” data comprised households initially classified as Phase 4 or Phase 5, and the “testing” data comprised borderline households (borderline Phase 4/5). The complete regression specification and results are presented in Annex 6. The most statistically signif-icant determinants of IPC phase across all models were dependency ratio, history of malnutrition, and signs of extreme hunger. Absent husband and number of children under five years of age were also significant across different specifications.
Regression models based on “whole” IPC categories were then used to predict phase classifications for Phase 4/5 cases. Regression results were then com-pared to the qualitative reclassification results. Of the four tested specifications, one model correctly clas-sified 12 of 21 borderline cases (57 percent) with an Adjusted R2 of 0.62 and was selected to determine the final quantitative prediction.
The lack of IPC Phase 5 observations for Marsabit and West Pokot was observed to cause under-classi-fication of borderline cases in these regions. Addi-tionally, the imbalance between training and testing sample sizes in Baidoa caused significant variability in predicted values (n = 2 training data points, n = 6 borderline cases for reclassification). This rationale was used to manually reclassify all predicted values in these three regions to IPC Phase 5. After manual reclassification, only four discrepancies were noted (out of 22 households that were initially classified in the borderline Phase 4/5 category) for an overall qualitative-quantitative match of 81 percent. The re-sults of the reclassification of households is depicted in Annex 5.

Classifying Acute Food Insecurity Using the Household Hunger Scale: Evidence from Three Countries 17
hunger which are not fully captured in regression variables.
All these results imply that improvements can be made in the classification of households to differen-tiate between IPC Phase 4 and Phase 5. The amount of work involved in qualitative interviewing com-bined with the reclassification methods described here are far beyond what data collection teams in the field would be expected to do in the course of a “normal” survey. However, these results suggest that improvements in procedures could be made that would increase the accuracy of the classification of households in Phase 5, based on existing data collec-tion instruments and field procedures.
All post-reclassification contingency tables indicate that HHS is a reliable predictor of IPC phase (sen-sitivity = 75–82%). Specificity ranges from 68–71 percent, indicating that there is some variability in this relationship. Over 68 percent of households not in IPC Phase 5 are accurately classified as such, based on both qualitative and quantitative meth-ods. Manually reclassifying cases according to both quantitative and qualitative methods as suggested above provided minor improvements across all tested metrics. The low values of precision may be driven by observed variability in HHS scores. Of respondents in IPC Phase 4 or higher, 18 percent reported HHS scores of 2 or 3, indicating that there are likely differences in severity and experience of

fic.tufts.edu18
Suggested improvements
Several suggestions for improvement result from this study in terms of the design of the module, the train-ing of field teams, and how analysis is conducted.
Reducing over-classification errorsThe regression analysis and the sensitivity/specificity analysis (indeed just visual inspection of Table 2) indicates that one issue with HHS is that, on its own, it has a tendency to over-classify households by IPC category (that is to say, the possibility of classifying a household in the next higher IPC phase seems to be greater than the possibility of classifying a house-hold in the next lower phase).
Several means of reducing over-classification errors can be suggested. As already noted, for all house-holds up to IPC Phase 4, other indicators can be used in a “convergence of evidence” approach to help classify households. The FEWS NET Food Consump-tion Indicator Matrix extends this logic to include households in Phase 5. Using the FEWS NET matrix could help to reduce over-classification errors, be-cause it places tighter restrictions on classification, requiring that not only must HHS be 5 or 6, but also the household must have the worst classification for two other indicators—the Food Consumption Score (FCS) (WFP 2008) and the Reduced Coping Strate-gies Index (rCSI) (Maxwell and Caldwell 2008). The FEWS NET Matrix is depicted in Table 12.
In an analysis that classified households using the FEWS NET matrix, only those that fall in cells 30 and 45 in Table 12 would be classified in Phase 5. Data for
The main question of interest to this study is how well the Household Hunger Scale can differentiate between phases. But the particular issue of concern is the ability of the indicator to distinguish between households in IPC Phases 4 and 5. Up to and includ-ing IPC Phase 4, other corroborating food security indicators can be relied on to validate household classifications through the process of “convergence of evidence” (IPC Partners 2011, Vaitla et al. 2015). With regard to improving the classification of house-holds in Phase 5 (by defining clear indicator cut-offs between Phase 4 and Phase 5), two concerns arise and several means of addressing these concerns emerge out of this research. These two concerns are
• Over-classification errors. From both Table 3 and Table 8, the over-classification of house-holds is a major concern: of 97 households scor-ing HHS >= 4, only 54 are correctly classified by HHS. However of 42 households misclassified, 37 are over-classified, meaning HHS classifies them at least one phase higher than the team judged them to be on the basis of in-depth inter-viewing.
• Under-classification errors. Of the 42 house-holds on Table 8 with an HHS score of >= 4, five households were under-classified. That may seem like a relatively small error. Howev-er, of the 71 households found by the team to be in Phase 4 or 5, 18 were under-classified (HHS scored them in a lower IPC Phase than the team found) whereas 15 were over-classified. Most of the households that were under-classified had a HHS score of 3, so HHS would classify them in IPC Phase 3. This would imply that in order to reduce both over-and under-classification errors, households with HHS >=3 should be subjected to some further checks.
Discussion: Improving the classification of households in P4 and P5

Classifying Acute Food Insecurity Using the Household Hunger Scale: Evidence from Three Countries 19
higher5 on HHS, this screen would show additional questions. The set of “criteria for classification of borderline (P4/P5) households” would include those noted above, along with additional corroborating quantitative indicators already available elsewhere in a SMART or FSNMS surveys (such as presence or absence of a malnourished child, recent mortality, and dependency ratio). Additional suggested mea-sures would very likely be context-specific, but based on the findings from this study, might include
• women-headed households recently widowed or abandoned,
• households split up to deal with hunger,• signs or behaviors that suggest extreme hunger
(such as tying rope or piece of cloth around one’s waist to stop hunger pangs, or being unable to stand or walk),
• complete lack of livelihood/income and no exter-nal support, and
• “zero-sum” coping—any choice of livelihood or caregiving option means something else equally urgent goes unattended.
5 See above, given the number of households that had an HHS score of 3 but that should have been classified as IPC Phase 4 or even 5, including households with the score of 3 in this category is necessary.
the other indicators in the matrix (FCS and rCSI) were not collected in this study. Had they been, they would no doubt have reduced over-classification errors. (Note, however, that the FEWS NET matrix, on its own, would not prevent under-classification errors).4 Other means of combining a variety of indicators into a composite indicator—such as the WFP CARI index (Consolidated Approach to Reporting Indicators of Food Security)—achieve a similar effect, but are not indexed to the IPC scale like the FEWS NET matrix is. So the main recommendation for reducing over-clas-sification errors is, where possible (i.e., where FCS and rCSI are also collected), to use the FEWS NET matrix (not HHS alone) to classify households.
Reducing under-classification errorsReducing under-classification errors requires a measure that could obtain additional information. This could be incorporated into a SMART or FSNMS type of survey, as a “pop-up” screen to be embedded in the HHS module. For households that score a 3 or
4 Some observers have objected to this methodology be-cause it suggests “pre-designated” phase classifications rather than IPC’s “convergence of evidence” approach. Without commenting on the relative merits of that de-bate, the point here is that the use of the matrix would help to differentiate households in Phases 4 and 5.
Table 12: FEWS NET Food Consumption Indicator Matrix
rCSI <4 rCSI 4–18 rCSI >18
FCS > 35
FCS 21.5–35
FCS < 21.5
FCS > 35
FCS 21.5–35
FCS < 21.5
FCS > 35
FCS 21.5–35
FCS < 21.5
HHS = 0 1 6 11 16 21 26 31 36 41
HHS = 1 2 7 12 17 22 27 32 37 42
HHS = 2–3 3 8 13 18 23 28 33 38 43
HHS = 4 4 9 14 19 24 29 34 39 44
HHS = 5–6 5 10 15 20 25 30 35 40 45
Source: FEWS NET

fic.tufts.edu20
Box 1. HHS Question 1
• “Was there ever no food to eat of any kind in your house because of lack of resources to get food?” (Y/N)
• If yes: “How often did this happen in the past 30 days?” Rarely (1–2 times), Sometimes (3–10 times), Often (> 10 times).
Several issues were noted with the way Question 1 is asked:
• What constitutes “food”? For example, does having wild foods (fruits, seeds, or leaves—which are not equivalent in their own terms) nearby which can be gathered and brought into the house before being cooked constitute “hav-ing food in the house?” Does having a cup of milk from a milking goat that is immediately used in tea for six people, constitute “having food in the house?”
• What constitutes the “number of times?” Does having no food in the house in the morning—prompting a woman to borrow from her neigh-bors (and thus having something in the house later on in the day, even if it is consumed imme-diately) count as “not having food in the house” (or does the fact that she went out and borrowed something mean that actually she did have food in the house)? Does one have to go for an entire day with no food in the house to count as “not having food in the house?”
• What exactly does “lack of resources” mean? Is it just no food and no money to buy food, or are social connections that may enable you to access food also a resource?
• The answers to these questions may be some-what context specific, but clarifying them in advance for a given context is critical to being able to interpret the responses. Training on how to ask this question is critical.
• The key phrase here is “not having food.” The emphasis is on food.
These were the characteristics that indicated Phase 5-like conditions, in addition to high levels of malnutrition and/or recent experience of mortality in the household. As noted, some of these charac-teristics are likely to be context-specific, but their presence/absence in the generic sense would lend some comparability across contexts. These charac-teristics could be expensive to map out on a con-text-specific basis—but would not be necessary to do except in locations with some history of popula-tions in Phase 5.
Revising the livelihoods coping module as used in FSNMA-type surveys could incorporate some of these suggestions. That would enable the classifi-cation of households in Phases 4 or 5 to be based on both consumption and livelihood information, capturing the notions of the “collapse of livelihoods” or the “complete exhaustion of livelihood coping” as described in the reference table for Phase 5.
Reducing errors more generally: Enhanced trainingThe HHS indicator can easily be misunderstood. Much greater effort needs to go into training for its use in surveys. To date, the time allocated for HHS in standard training for a survey has been observed to be as short as 30 minutes, because the questions are few and perceived to be simple and straightforward. However, several clear examples of misunderstand-ing the questions emerged in the field research. Given the heavy reliance placed on HHS, adequate time should be allocated to training in surveys. Each of the questions from HHS are highlighted in Boxes 1–3. Below each box, a number of concerns are raised about the interpretation of the question, based on field notes from the case studies.

Classifying Acute Food Insecurity Using the Household Hunger Scale: Evidence from Three Countries 21
Box 3. HHS Question 3
• “Did you or any household member go a whole day and night without eating anything because there was not enough food?” (Y/N)
• If yes: “How often did this happen in the past 30 days?” Rarely (1–2 times), Sometimes (3–10 times), Often (> 10 times).
Likewise, a number of issues were observed in the way this question was asked:
• This should be the least subjective of the ques-tions asked, but many times “without eating anything” really had to be stressed. Again the role of things like wild foods or extremely small quantities of milk in a pastoral household make some of the responses ambiguous.
• Does drinking tea count as “eating”? (The field team’s answer was that if it was black tea (hot water and tea leaves only), it did not count; if it was milky tea, it did count—but that is a pretty fuzzy line because sometimes milk is stretched very far. Does boiling some wild leaves and consuming them count as eating? (The team’s answer was that just eating wild leaves and nothing else did not count, but eating wild fruits or seeds did count). These are ambiguous—and context-specific—interpretations of the question.
• Some people were offended by the question about whether they ate when they were asleep, as in “going a whole day and a whole night without eating” (indeed sleeping was a very frequently mentioned coping strategy for what to do when very hungry). So the question some-times had to be asked, “going without eating from the time you wake up in the morning until the time you go to sleep at night.” Once again, some pre-testing and contextualization of the understanding of possible answers is critical and these needs to be incorporated into training.
The key phrase here is “all day and night without eat-ing.” The emphasis is on eating.
Box 2. HHS Question 2
• “Did you or any household member go to sleep at night hungry because there was not enough food?” (Y/N)
• If yes: “How often did this happen in the past 30 days?” Rarely (1–2 times), Sometimes (3–10 times), Often (> 10 times).
Again, several issues arise:
• Although the most subjective question in terms of what constitutes “feeling hungry,” this ques-tion appears to be the most unambiguous, but only if asked correctly. Thus training how to ask this question is critical.
• Sometimes the translated questions was not about “going to bed hungry,” but about skipping an evening meal—which might possibly be the reason that people go to bed hungry, but is not the question being asked. The question has to be translated exactly, not “interpreted” and with no assumptions about why someone may be going to bed hungry.
• Sometimes a respondent would say they only had very little to eat before going to bed, leaving the translator confused as to whether this con-stituted a “yes” answer or not.
• This question may require an introductory question about what constitutes “feeling hungry” because it can be misinterpreted if there is not some agreement on what this means. “Feeling” can become confused with emotions about not having food (or a mother’s emotion when a child is hungry) rather than the physical sensation of hunger.
• Again, this question might mean different things in different places, but it is critical to understand what it means in the context of a given survey.
• The key phrase here is “go to sleep at night hun-gry.” The emphasis is on the sensation of hunger.

fic.tufts.edu22
from day to day and week to week. This likely contrib-uted to the difficulties aligning expert judgement on a phase classification with a single indicator.
A second concern is about the presumed relation-ship between assets and food consumption. The usual assumption is that assets are strongly correlat-ed with food consumption, but the Marsabit case study shows that our assumptions don’t always hold. The Gabbra (Marsabit case study) can have signif-icant household assets—particularly in the form of camels (or at least one camel) but still have very poor current food consumption. This is because of an extreme reluctance to sell assets, in part because a camel is a huge asset to sell and in part because it takes a long time to replace a camel. So it is better to go hungry. But this means that, under some circum-stances, attempting to corroborate food consump-tion outcomes by looking at household asset own-ership does not work. Local variation here is a major factor to take into consideration. Other assumptions about livelihood coping strategies and their relation-ship to food consumption are frequently wrong. They tend to be predicated on the assumption of pastoral livelihoods, or at least the ownership of livestock as the major household asset. In most of the house-holds interviewed for this study—even in “pastoral” areas (with the partial exception of Gabbra in the Marsabit case study)—households owned no live-stock and hadn’t for years. Likewise, the guidelines tend to assume that covariate shocks are the only drivers of household level outcomes, overlooking the role of idiosyncratic shocks. Case studies tended to suggest a combination of covariate and idiosyncratic shocks was likely to put a household in Phase 5.
A third concern is about livelihoods more generally. Much of the reclassification of the “borderline” cases hinged on the degree and severity of livelihoods cop-ing. If the standard livelihoods coping module could be improved to capture some of these more extreme categories of coping, the determination of Phase 4/5 wouldn’t rely solely on a consumption indicator. Results from this study strongly suggest the need for better—and more context-specific—livelihoods coping measurements.
A final set of concerns relates to the relationship of food insecurity to malnutrition. In numerous cases (but especially Aweil and Turkana), households were in a serious or even critical (high Phase 4) situation
Note that while “not having food,” “feeling hunger,” and “not eating” are closely related, they are different phenomena. These concepts may get lost in transla-tion, rendering some of the answers to HHS ques-tions incoherent.
These are not academic issues—the way these are interpreted can literally make the difference between a Phase 2 classification for a household or a Phase 4 or 5 classification. Ambiguities might matter less at the lower end of the IPC scale—as noted above, there are corroborating indicators at that range that help to triangulate HHS responses. These corrobo-rating indicators are much weaker or non-existent at the higher ranges (Phases 4 or 5). Thus training needs to consider all these issues and ensure that enumerators know exactly how to ask the questions, how to recognize if the question has been misunder-stood, and what answers mean in context so that s/he can answer questions of clarification from respon-dents.
Other suggested improvementsSeveral further concerns/recommendations grow out of this study. The first is that 30 days is an impossibly long time frame for someone to recall if they really are facing serious hunger. For example (as noted repeat-edly in field notes from the study), consider a house-hold that sold a small ruminant and thus were able to eat fairly well for several weeks, but then the money ran out a week ago. Since then, they have suffered a lot of hunger. But the hunger was in the last seven days—yet some of the answers to the HHS frequen-cy questions were “more than 10 times.” Answers were similarly biased if the household had recently received a cash transfer or come into some income from labor or sale of an asset—recently improved ac-cess to food overruled very poor access in the earlier part of the month. This strongly suggests that an-swers to HHS questions are framed in terms of very recent experiences, not experiences over the past full 30 days. This might suggest shortening the recall peri-od—the raw results would be the same, but shorter time periods would be required for the cut-offs in what constitutes “rarely,” “sometimes,” or “often.” The issue of recall periods also raises the long-ob-served fact that food security is not static; household food access and consumption changes somewhat
Classifying Acute Food Insecurity Using the Household Hunger Scale: Evidence from Three Countries 23
sumption, and especially care for a sick or mal-nourished child. The experience of “zero-sum” coping was common to very nearly all house-holds in Phase 5 that included small children.
• Consider incorporating a “pop-up” module with HHS on SMART or FSNMS surveys that would ask additional questions (outlined above) if a household scores 4 or higher on HHS.
Second, other elements of the definitions should be clarified. What constitutes “very high acute mal-nutrition” versus “extreme acute malnutrition”? What is the difference between “excess mortality” and “death”? What kind of time frame is implied for either, especially mortality? If a household has a severely malnourished child, recent mortality, and scores of 5–6 on HHS, agreeing that the household is in Phase 5 would be straightforward; if it scores 5–6 on HHS but has no child malnutrition and no recent deaths—and the reason for the lack of malnutrition is high levels of maternal (or other caregiver) buff-ering—then perhaps it fits the definition of Phase 4, despite the HHS score. But with the current defini-tions, the line between Phase 4 and Phase 5 is very blurred. The definitions should be tightened up in light of the experiences of populations in Phase 4 and Phase 5.
Finally, the “theory of famine mortality” that is im-plicit in the IPC guidelines Version 3.0 is also overly linear. This is implicit—it isn’t ever actually spelled out, but it could be summarized as something like the following:
livelihood breakdown food insecurity malnutrition compromised immune systems
killer diseases mortality
This is also no doubt oversimplified and over “linear-ized” and, while certainly plausible, the pathways to malnutrition and mortality are numerous. Experience indicates that, in itself, being in Phase 5 doesn’t necessarily imply malnutrition or death (even though both are mentioned in the definition—hence the problem with the definitions).
with regard to acute hunger, with a corresponding absence of assets, income, or social connections, but no acute malnutrition in the household. Of course, an equal or greater number of malnutrition cases were found in the absence of major serious food consump-tion gaps—these are easier to explain in terms of illness, poor hygiene practices, poor water quality, a heavy work burden on mothers and caregivers, and other known drivers of malnutrition. However, the stated assumption in the IPC definitions of phases specifies a direct relationship between increasingly se-vere food consumption gaps and increasing incidence of malnutrition in the household, but this is without doubt an overly linear assumption. Hence the longer list of possible criteria suggested above for classifying a household in Phase 4 or Phase 5 that include—but are not limited to—malnutrition and mortality.6
These observations suggest a couple of things. First, the livelihoods coping module should be revised away from the presumption of pastoral livelihoods and the presumption of asset ownership:
• Clarify what is understood by reliance on wild foods, borrowing food, borrowing assets, labor strategies, etc., and going hungry. All of these strategies may be context specific, but again un-derstanding how to interpret answers in context is fundamental to good analysis.
• Clarify what is understood by “exhaustion of coping capacity” or “inability to cope.” These terms can be used very loosely and without com-mon understanding.
• The notion of “zero-sum” coping has to be intro-duced and field tested. This is defined above as a situation in which “whatever choice a caregiver/income earner makes, something else equally urgent and critical to survival is ignored” with immediate consequences for income, food con-
6 Clearer differentiation between household and area level indicators may be required. Confusion between these can lead to a misunderstanding around Phase 5 (Ca-tastrophe) which is for household food insecurity and Phase 5 (Famine) which is the area level classification.

fic.tufts.edu24
capability of the HHS. It would also be useful to test the HHS at the lower end of the scale (there were ample observations here to test it in the mid-ranges).
To fully test the ideas suggested here, conducting one further field test would be necessary, preferably in conjunction with a SMART survey that included all the food security indicators, as well as health, WASH, and some livelihood indicators. It would have to be carried out in an area already identified to have a high prevalence of Phase 4 households and at least 10 percent of households in Phase 5, and would require a pre-trained team of interviewers to accom-pany the SMART team. While perhaps an expensive undertaking, not having accurate information about population in Phase 5 (famine conditions) is more costly in the long run.
Overall, HHS does a reasonably good job of classi-fying households by IPC phase. But the definitions are fuzzy: there is no clear dividing line in the defi-nitions—particularly between Phase 4 and Phase 5. Therefore, it is unlikely that a single, three-question indicator would be able to classify perfectly. How-ever, classification can be significantly improved, as the recommendations above show. The intent of the research was to test the validity of HHS at the high end, but it proved rather difficult to track down a suf-ficient number of households in Phase 5, even with an active case identification approach. Further test-ing—involving the recommendations from this study, and conducted in collaboration with a rigorously designed SMART survey incorporating food security indicators and carried out in an area known to have a high prevalence of Phase 4 and Phase 5 house-holds—will be necessary to fully understand the
Conclusion

Classifying Acute Food Insecurity Using the Household Hunger Scale: Evidence from Three Countries 25
IPC Partners. 2019. “The Integrated Food Security Phase Classification Technical Manual Version 3.0.” Rome: IPC Partners.
IPC Partners. 2011. “The Integrated Food Security Phase Classification Technical Manual Version 2.0.” Rome: IPC Partners.
Maxwell, Daniel, Peter Hailey, Jeeyon Janet Kim, Erin McCloskey, and Maria Wrabel. 2018. “The Constraints and Complexities of Information and Analysis in Humanitarian Emergencies. Evidence from South Sudan.” Medford MA and Nairobi: Feinstein International Center and Centre for Humanitarian Change.
Maxwell, Daniel, and Richard Caldwell. 2008. “The Coping Strategies Index. Field Methods Manual.” Boston and Rome: Tufts University and WFP.
REACH Initiative. 2019. “Western Lakes Population Movement, Food Security and Livelihoods Profile. South Sudan.” Juba: REACH. https://www.impact-repository.org/document/reach/398e4ef3/reach_ssd_pro-file_westernlakesstate_august2019.pdf
Vaitla, Bapu, Jennifer Coates, and Daniel Maxwell. 2015. “Comparing Household Food Consumption Indicators to Inform Acute Food Insecurity Phase Classification.” Washington, DC: FANTA/FEWS NET.
World Food Programme. 2008. “Food Consumption Analysis. Calculation and Use of the Food Consumption Score in Food Security Analysis.” Vulnerability Analysis and Mapping Unit. Rome: World Food Programme.
References

fic.tufts.edu26
1. Aweil (South Sudan)
Table A1.1: HHS by IPC Phase Classification—Aweil
HHSIPC Phase (as judged by team)
2 2 or 3 3 3 or 4 4 4 or 5 5 Total
6 0 0 0 0 0 0 1 1
5 0 0 1 0 4 1 0 6
4 0 1 3 3 4 2 0 13
3 0 0 18 5 2 2 0 27
2 0 1 0 0 0 0 0 1
No score 2
Total 0 2 22 8 10 5 1 50 (48)
2. Turkana (Kenya)
Table A1.2: HHS by IPC Phase Classification—Turkana
HHSIPC Phase (as judged by team)
2 2 or 3 3 3 or 4 4 4 or 5 5 Total
6 0 0 0 0 3 1 2 6
5 0 0 0 0 3 2 2 7
4 0 0 3 3 6 1 0 13
3 1 5 21 2 2 0 0 31
2 3 1 1 0 0 0 0 5
1 1 0 0 0 0 0 0 1
No score 4
Total 5 6 25 5 14 4 4 67 (63)
Annex 1. Results tables by case study

Classifying Acute Food Insecurity Using the Household Hunger Scale: Evidence from Three Countries 27
3. Sanaag (Somalia)
Table A1.3: HHS by IPC Phase Classification—Sanaag
HHSIPC Phase (as judged by team)
2 2 or 3 3 3 or 4 4 4 or 5 5 Total
6 0 0 0 0 0 0 0 0
5 0 0 0 0 0 2 1 3
4 0 0 4 0 3 0 0 7
3 3 1 14 0 0 0 0 18
2 6 0 6 0 0 0 0 12
1 2 0 0 0 0 0 0 2
0 0 0 0 0 0 0 0
No score 1
Total 11 1 24 0 3 2 1 43 (42)
4. West Pokot (Kenya)
Table A1.4: HHS by IPC Phase Classification—West Pokot
HHSIPC Phase (as judged by team)
2 2 or 3 3 3 or 4 4 4 or 5 5 Total
6 0 0 0 0 0 0 0 0
5 0 0 0 0 0 1 0 1
4 0 0 2 2 1 0 0 5
3 0 3 10 1 1 0 0 15
2 0 7 7 1 1 0 0 16
1 3 1 0 0 0 0 0 4
0 2 0 0 0 0 0 0 2
No score 2
Total 5 11 19 4 3 1 0 45 (43)

fic.tufts.edu28
5. Marsabit (Kenya)
Table A1.5: HHS by IPC Phase Classification—Marsabit
HHSIPC Phase (as judged by team)
2 2 or 3 3 3 or 4 4 4 or 5 5 Total
6 0 0 0 0 0 0 0
5 0 0 0 1 2 1 0 4
4 0 0 1 4 1 0 0 6
3 0 5 10 1 0 0 0 16
2 3 4 7 1 0 0 0 15
1 5 1 0 0 0 0 0 6
No score 1
Total 8 10 18 7 3 1 0 48 (47)
6. Baidoa (Somalia)
Table A1.6: HHS by IPC Phase Classification—Baidoa
HHSIPC Phase (as judged by team)
2 2 or 3 3 3 or 4 4 4 or 5 5 Total
6 0 0 0 0 0 0 0 0
5 0 0 0 0 0 3 1 4
4 0 0 3 2 1 3 0 9
3 7 0 11 2 0 0 0 20
2 5 0 0 0 0 0 0 5
1 0 0 0 0 0 0 0 0
No score 0
Total 12 0 14 4 1 6 1 38

Classifying Acute Food Insecurity Using the Household Hunger Scale: Evidence from Three Countries 29
7. Yirol (South Sudan)
Table A1.7: HHS by IPC Phase Classification—Yirol
HHSIPC Phase (as judged by team)
2 2 or 3 3 3 or 4 4 4 or 5 5 Total
6 0 0 1 1
5 0 0 0
4 0 0 4 2 4 1 11
3 2 5 14 3 4 1 29
2 1 1 3 5
1 3 1 4
No score 0
Total 6 7 21 5 8 2 1 50

fic.tufts.edu30
Annex 2: Interview guide (field household interviews)Questions
Household
1. Tell us about your household. Who lives here?
a. Get sex and age of members
2. How has membership in the household changed over the past year?
Livelihoods
3. What activities do you do to earn a living?
4. What constraints do you face in those activities?
5. Note which member of the household does what.
6. If only one working member (and especially if a woman), find out how much time she allocates to income earning activities and other requirements like getting water, child care, etc.
Food Access
7. What food are you able to eat with the income you earn? When was the last time you had enough to eat?
8. When was the last time you had “good” or preferred food to eat? What do you have to eat now?
9. Household Hunger Scale questions
a. Was there ever no food whatsoever to eat of any kind in your house because of lack of resources to get food? (Y/N) If yes, how often in past 30 days ? Rarely (1–2 times), Sometimes (3–10 times), Often (> 10 times) [Keep close track of these answers.]
b. Did you or any household member go to sleep at night hungry because there was not enough food? (Y/N) If yes, how often in past 30 days ? Rarely (1–2 times), Sometimes (3–10 times), Often (> 10 times) [Keep track of answers.]
c. Did you or any household member go a whole day and night without eating anything because there was not enough food? (Y/N) If yes, how often in past 30 days ? Rarely (1–2 times), Sometimes (3–10 times), Often (> 10 times) [Keep track of answers.]

Classifying Acute Food Insecurity Using the Household Hunger Scale: Evidence from Three Countries 31
10. Probe on these
a. Probe around “what having no food in the house” means? What does “going all day without eating” mean?
b. What actions did the household take in the face of increasing hunger? How were they aided or constrained?
c. Is everyone in the household affected equally? If not, who bears the brunt of the hunger? Who does the household try to protect? Why?
d. Probe here for gender, age, working and non-working members, able-bodied members, etc.
Coping
11. What has your household done to cope with extreme circumstances?
a. Probe for things like splitting up the household, increasing livelihood activities, selling valuable assets, distress migration, extreme food consumption indicators like going all day without eating. NOTE TRADE-OFFS MADE.
b. But probe for other things—things we might not be familiar with.
c. Do you have relatives who help you? Do you have to help relatives of other households?
d. Are there other sources of assistance (chief? HFA? Etc.)
e. Probe for who this person(s) is/are, what they do, how they help, how often, etc.
f. If no one, probe for other forms of social exclusion—why doesn’t anyone help?
Malnutrition
12. Is there a malnourished child in the household (use MUAC to measure)?
a. Ask about the circumstances of the child: How did s/he come to be malnourished? How long ago?
b. What were household members able to do for the child? Has s/he been referred for therapeutic or supplementary feeding?
c. Were there constraints to be able to reach this kind of assistance? Is this the first time this child has been malnourished this year?
d. Is this the first child to be malnourished in the family in the last year?
Mortality
13. Has there been a recent death in the household, who was the person? How did s/he die? What were his/her symptoms? Did the causes affect only that particular person or did those factors affect every-one in the household?
Water
14. What is the current status and history of your access to water for drinking, for other household uses, for animals?
Health
15. Is any member of the household sick? Have any members had a major illness or injury in the past year?

fic.tufts.edu32
16. If so, what were you able to do for that person?
Resilience
17. How does this year compare with previous years?
18. See if the household can narrate the story of how they came to be in these conditions: What caused this? Over what period of time? Who helped them? What went wrong? What are the consequences—for different members of the household? What are they doing now? (Get at the issue of agency, not just “affectedness.”)
Observations1. Are there any indications of food in the household? What are they (bags of grain, food aid, cooking
pots that have been recently used, other)?
2. What is the condition of the members of the household (just by observation, not by anthropometric measurement—that has already been done)?
a. What does their health status appear to be (clothing, cleanliness, symptoms of respiratory or other illness, etc.)?
b. What do the other members of the household who were not anthropometrically measured look like (very thin? Etc.)?
3. Are any members of the household included in programs?
a. OTP
b. SFP
c. School feeding
d. PLW
e. Pension (elderly only)
f. HSNP
g. County relief
4. What is the condition of their shelter and compound?
5. What is the water storage and access situation? What is the sanitation approach used?
6. Is there any indication of household assets (livestock, tools, anything salable)?
7. Were the questions in the HHS asked correctly? Did the household member interviewed by the SMART team understand the questions?
8. Other observations.

Classifying Acute Food Insecurity Using the Household Hunger Scale: Evidence from Three Countries 33
Household Hunger Scale
Question Response1. Was there ever no food to eat of any kind in your house because of lack of resources to get food? Yes/No
1a. How often did this happen in the past 30 days?
Rarely (1–2)
Sometimes (3–10)
Often (> 10) 2. Did you or any household member go to sleep at night hungry because there was not enough food? Yes/No
2a. How often did this happen in the past 30 days?
Rarely (1–2)
Sometimes (3–10)
Often (> 10) 3. Did you or any household member go a whole day and night without eating anything because there was not enough food? Yes/No
3a. How often did this happen in the past 30 days?
Rarely (1–2)
Sometimes (3–10)
Often (> 10)
Note that the answers are combined into categories so that “rarely” and “sometimes” are categorized together and given a score of 1; “often” is given a score of 2. Thus the range of answers is from zero (the answer of “no” to all questions) to six (the answer of “often” to all the questions).
The relationship specified of HHS to IPC phase is:
Phase 1 = HHS 0
Phase 2 = HHS 1
Phase 3 = HHS 2–3
Phase 4 = HHS 4
Phase 5 = HHS 5–6
Annex 3: The Household Hunger Scale (HHS)

fic.tufts.edu34
OTP
PLW Support
School Feeding Programs
SFP
Shocks
Absent Husband
Death of Family Member
Health Issues and Expenditures
Natural Disaster
Violence
Social Capital
Help from Chief
Kinship Ties
Neighbors
Time
Children’s Time
Women’s Time
Water and WASH
Assets
Coping Strategies
Diets
Animal Source Foods
Hunger Experience
Livelihood
Agriculture
Casual Labor
Food for Sale
Alcohol
Natural Resources
Brick-Making
Charcoal
Firewood
Grass
Poles
Sand
Other Reliable Job
Production of Ceramics, HH Items
Markets and Credit
Credit Access
Credit Availability
Market Access
Market Demand
Market Prices
Safety Nets
Health Facility or Hospital Nearby
National or Regional Program
NGO Aid
Annex 4: Qualitative analysis coding tree

Classifying Acute Food Insecurity Using the Household Hunger Scale: Evidence from Three Countries 35
Annex 5: Quantitative and qualitative reclassification results
Reclassification Results
Region HHNO IPC Qualitative reclassification
Quantitative prediction
Manual reclassification*
Aweil 19 4/5 4 4 4Aweil 20 4/5 4 4 4
Aweil 30 4/5 5 4 4
Aweil 31 4/5 4 4 4
Aweil 42 4/5 4 4 4
Turkana 14 4/5 5 5 5
Turkana 15 4/5 5 5 5
Turkana 23 4/5 5 4 4
Turkana 24 4/5 4 4 4
Sanaag 38 4/5 5 5 5
Sanaag 39 4/5 4 5 5
West Pokot 35 4/5 5 4 5
Marsabit 5 4/5 5 4 5
Baidoa 16 4/5 5 4 5
Baidoa 19 4/5 5 5 5
Baidoa 20 4/5 5 5 5
Baidoa 22 4/5 4 5 5
Baidoa 25 4/5 4 5 5
Baidoa 32 4/5 5 5 5
Yirol 25 4/5 5 4 4
Yirol 26 4/5 4 4 4
* Borderline cases in Marsabit, West Pokot, and Baidoa were manually reclassified as 5.

fic.tufts.edu36
The Feinstein International Center is a research and teaching center based at the Friedman School of Nutrition Science and Policy at Tufts University. Our mission is to promote the use of evidence and learning in operational and policy responses to protect and strengthen the lives, livelihoods, and dignity of people affected by or at risk of humanitarian crises.
Twitter: @FeinsteinIntCen
fic.tufts.edu

Classifying Acute Food Insecurity Using the Household Hunger Scale: Evidence from Three Countries 37